Abstract
Land use and land cover (LULC) datasets for Beijing in 1978, 1987, 1992, 2000 and 2010 were developed from Landsat images using the object-oriented classification approach. The relationships between social-economic, demographic and political factors and time-series LULC data were examined for the periods between 1978 and 2010. The results showed the effectiveness of using the object-oriented decision tree classification method for LULC classification with time series of Landsat images. Combined with anthropogenic driving forces, our research can effectively explain the detailed LULC change trajectories corresponding to different stages and give new insights for Beijing LULC change patterns. The results show a significant increase in forest and built-up areas, but a decrease in arable lands, due to urbanization and reforestation. Large ecological projects result in an increase of forest areas and population, and economic conditions result in urban expansion. The anthropogenic driving forces analysis results further prove that both population increase and economic development played important roles in the expansion of built-up areas. Both the qualitative and quantitative anthropogenic driving forces analysis methods were helpful for better understanding the mechanisms of LULC change.
1. Introduction
Land use and land cover (LULC) are regarded as important factors for environmental assessment and have close relationships to population migration and economic conditions [1]. Research on LULC change detection has attracted much attention since the 1970s [2,3,4,5,6]. Timely and accurate LULC change detection of Earth’s surfaces provided the foundation for better understanding human-nature relationships and interactions [7,8,9,10,11]. Since the Landsat satellite was launched in the early 1970s, multitemporal remote sensing data, especially time-series Multispectral Scanner (MSS), Thematic Mapper (TM), Enhanced Thematic Mapper Plus (ETM+) and Landsat Data Continuity Mission (LDCM) images, have been widely used for examining LULC change [6,12,13].
New techniques continue to be developed to effectively employ different features inherent in remote sensing and ancillary data for improving LULC classification and change detection results [14,15,16,17]. Compared to the pixel-based classification approaches, object-oriented classification methods can effectively improve classification results and better express spatial information [4,18]. Typically, object-oriented classification methods consist of two major steps: image segmentation and classification of the meaningful segmentation objects [19]. Previous studies have proved that incorporation of new remote sensing index bands (e.g., water bodies, vegetation and construction indexes), auxiliary data, such as digital elevation model (DEM) terrain factors, and decision trees based on expert knowledge can improve accuracy and solve image problems, such as “salt and pepper” problem in the classification [16,18,20].
From 1978 to 2010, Beijing was one of the fastest urbanization regions in China. Many previous LULC studies have been conducted in Beijing using medium spatial resolution images, such as the 30-m Landsat TM and ETM+ images. Because of a lack of historical remote sensing data, long-term LULC research in Beijing mainly focuses on the period after the reform and opening-up policy in 1978 [21,22,23]. With the rapid urbanization, socioeconomic, political and other anthropogenic driving forces played important roles in LULC change [24,25,26,27,28,29]. However, few studies have explained the LULC change process and policy-driven land use conversion with the combination of socioeconomic data and policy-driving forces. The objective of this paper is to improve our understanding of the LULC spatiotemporal change process in Beijing since the Chinese reform and opening up from the socioeconomic and policy points of view. This study also provides useful information and corrective policies for land resources management and landscape pattern optimization in Beijing.
2. Study Area
Beijing is located in the North China Plain between the Taihang Mountains and the Yanshan Mountains, covering 16 districts and counties (Figure 1). The mountainous and plain areas account for 62% and 38% of the administrative area, respectively. Beijing is dominated by a warm, temperate, continental monsoon climate, with an average annual temperature of 10–12 °C, an annual frost-free period of 180–200 days and an average annual rainfall of about 595 mm. The seasonal distribution of precipitation is very uneven, and the zonal vegetation is composed of temperate deciduous forest. The main types of land use are arable land and built-up areas in the plain area and forest and shrub vegetation cover in the mountain areas.
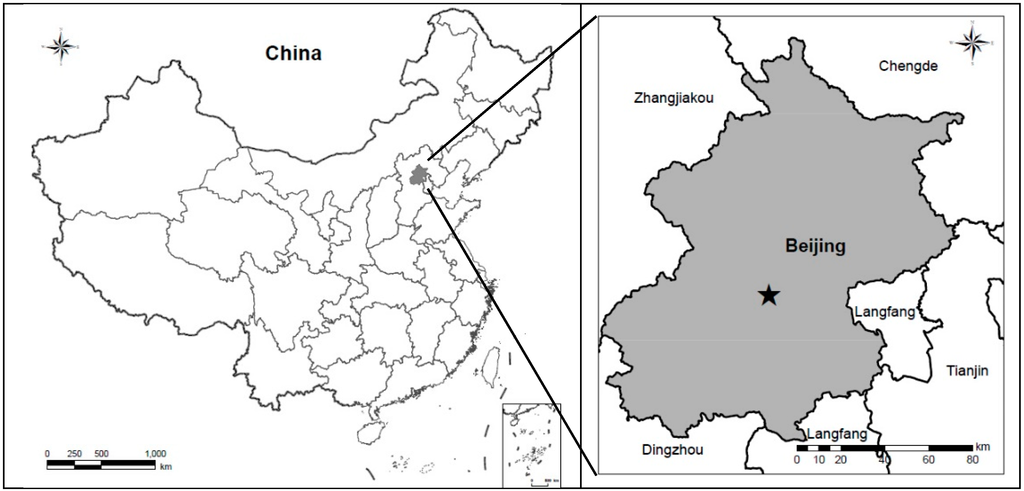
Figure 1.
Study area: Beijing, China.
Since the reform and opening up in 1978, Beijing has become the fastest-growing urbanization area in China. The total population increased from 8.5 million in 1978 to 12.58 million in 2010, and GDP increased from 1775 million dollars to 230,238 million dollars in the same period [30,31]. According to the census data acquired in 1978 and 2010, the urban population grew from 55% of the total population in the administrative area in 1978 to 79% in 2010.
3. Methods
The framework of this research is illustrated in Figure 2, including the following major steps: (1) multiscale image segmentation; (2) training sample library; (3) decision tree classification based on the object-oriented approach; (4) accuracy assessment; (5) change analysis using the post-classification comparison approach; and (6) anthropogenic driving forces analysis.
3.1. Data Collection and Preprocessing
The data sources used in this research include the following: (1) Landsat MSS and TM images of plant growth seasons in 1978, 1987, 1992, 2000 and 2010 (USGS download site http://landsat.usgs.gov/index.php), with cloud cover of less than 10% (Table 1). The spatial resolution of MSS image in 1978 was 79 m, and the TM images was 30 m. (2) The DEM data for Beijing from ASTER GDEM v2 with 30-m spatial resolution was downloaded from the website (http://reverb.echo.nasa.gov/reverb/); (3) the Beijing 1:10,000 topographic map; (4) the Beijing administrative border file; (5) socioeconomic statistics from the China city statistical yearbook and Beijing statistical yearbook (Table 2); (6) information of policies, laws and large-scale ecological projects collected from the official website of the National Development and Reform Commission (http://www.sdpc.gov.cn/), the State Forestry Administration of PRC (http://www.forestry.gov.cn/) and the Beijing Gardening and Greening Bureau (http://www.bjyl.gov.cn/).
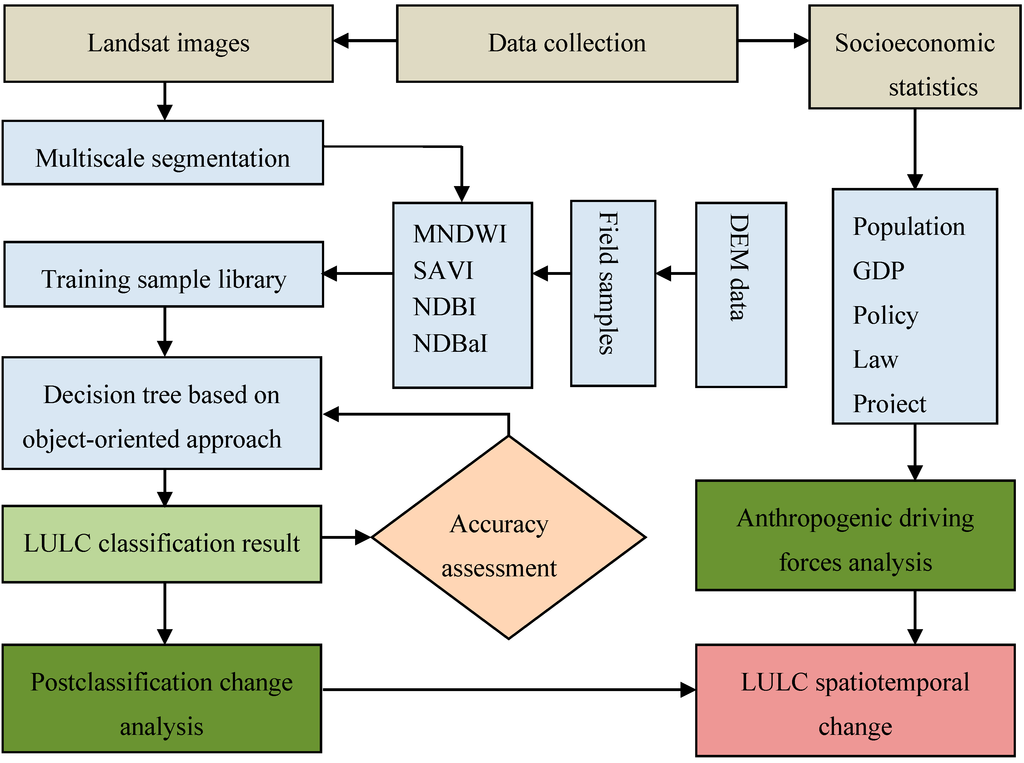
Figure 2.
Flow chart of the research.
The Landsat images from the USGS website had already been georeferenced into the Universal Transverse Mercator coordinate system based on the topographic maps with an accepted root mean squared error (RMSE), and their registration error was less than 0.5 pixel (USGS download site http://landsat.usgs.gov/index.php). All images were transferred into the unified Krasovsky_1940_Albers projected coordinate system, and the geographic coordinates of GCS_Krasovsky_1940 were used.
The digital numbers (DN) were first converted to top-of-atmosphere radiances (ToAR) and ToA radiances were then converted to top-of-canopy reflectance (ToCR) by removal of atmospheric effects.
Table 2 shows the main socioeconomic statistics for anthropogenic driving forces analysis collected from the China city statistical yearbook and Beijing statistical yearbook corresponding to the remote sensing images listed in Table 1.

Table 1.
List of Landsat images used for LULC classification in this study.
| Path | Row | Acquisition Date | ||||
|---|---|---|---|---|---|---|
| 1978 | 1987 | 1992 | 2000 | 2010 | ||
| 132 | 32 | September 28 | ||||
| 132 | 33 | September 28 | ||||
| 133 | 32 | September 280 | ||||
| 123 | 32 | July 24 | September 7 | September 13 | August 8 | |
| 123 | 33 | July 24 | September 7 | September 13 | August 23 | |
| 124 | 32 | September 17 | September 14 | July 2 | August 15 | |
Table 2.
1978–2010 main social and economic statistics for Beijing, China.
| Description | 1978 | 1987 | 1992 | 2000 | 2010 |
|---|---|---|---|---|---|
| Total population (million) | 8.50 | 9.71 | 10.45 | 11.08 | 12.58 |
| Urban population (million) | 4.67 | 5.87 | 6.56 | 7.61 | 9.90 |
| Urbanization rate (%) | 54.96 | 60.42 | 62.81 | 68.68 | 78.67 |
| Gross domestic product (million dollars) | 1,775 | 5,331 | 9,114 | 40,437 | 230,238 |
| Percent of primary industry (%) | 5.20 | 7.40 | 8.10 | 3.60 | 0.90 |
| Percent of secondary industry (%) | 71.10 | 55.90 | 52.20 | 38.10 | 24.00 |
| Percent of tertiary industry (%) | 23.70 | 36.70 | 39.70 | 58.30 | 75.10 |
Sources: China city statistical yearbook and Beijing statistical yearbook [30,31].
Field data were collected between July and September in 2010. Considering the accessibility of sampling, the selected sample points represented different landforms, vegetation differentiation and intensity of human activity types. With the car-based global positioning system (GPS), sampling along roadsides within one kilometer of visual range was marked on the images. The total sampling number was 539, and 270 of them were used for LULC classification and the remaining samples for accuracy assessment.
3.2. Land Use and Land Cover Classification
According to our research objectives and the field survey, the LULC system in this study area consists of six classes: arable land (AL), forest land (FL), grassland (GL), built-up areas (BU), water bodies (WB) and bare land (BL). The object-oriented approach [4,18,20] was used to classify each Landsat image into a thematic map. Multiscale image segmentation was first conducted using eCognition software based on Landsat TM and MSS images. Segmentation experiment at scales of 1, 5, 10, 15, 30, 40 and 50 were conducted, and the optimal segmentation scale of 10 was identified. The decision tree was generated to classify segmentation objects with training sample data. The training sample library was generated by importing the sampling points to eCognition.
Modified Normalized Difference Water Index (MNDWI) for enhancing the contrast between water and others [32], Soil Adjusted Vegetation Index (SAVI) for eliminating soil background noise from vegetation [33], Normalized Difference Built-Up Index (NDBI) for extracting built-up areas [34] and Normalized Difference Barren Index (NDBaI) [35] were used. With SAVI, MNDWI, NDBaI and NDBI, vegetation, water, bare land and built-up areas can be extracted using suitable threshold values, respectively. These variables can be expressed as follows:
where ρGreen, ρSWIR, ρNIR and ρRed represent reflectance of TM Bands 2, 5, 4 and 3, respectively, L is a soil adjustment factor, 0.5 was usually chosen to remove soil background [33] and dSWIR and dTIR represent Bands 5 and 6 of the original TM image without atmospheric correction.
The classification results were evaluated using the error matrix. The overall accuracy, Kappa coefficient, producer’s accuracy and user’s accuracy were calculated from the error matrix. A total of 539 test sample plots were collected in 2010, and half of them were used for accuracy assessment. Due to a lack of reference data for historical data, no accuracy assessment was conducted for other dates of classification results.
3.3. Land Use and Land Cover Change Analysis
3.3.1. Analysis of Land Use and Land Cover Change at Overall Scale
The proportion of each LULC type in a study area is calculated as:
Ai% = Ai/AT × 100%
The change for each LULC type in a study area is calculated as:
Aic = Ait2 − Ait1
The change rate per year for each LULC type in a certain period is calculated as:
where Ai and AT are the area of the i-th LULC type and the study area. Aic is the change area of the i-th type in a certain period; Ait1 and Ait2 represent the total area of the LULC type i at times t1 and t2 [36]; and Air is the change rate per year for each LULC type from time t1 to time t2.
Air = Aic/(t2 − t1)
3.3.2. Analysis of the Main Land Use and Land Cover Conversions
In a given transition matrix of LULC, the net change (i.e., ai) for LULC type j converting to type i in a certain period and its contribution rate (ai%) of type i are calculated as follows:
where Aji is the conversion area of type j to type i and Aij is the conversion area of type i to type j. Aic is the change area of type i in a certain period.
ai = Aji − Aij
ai% = (Aji − Aij)/Aic × 100%
3.4 Anthropogenic Driving Forces Analysis
Based on the information of policies, laws and large-scale ecological projects collected from 1978 to 2010, a qualitative analysis of their impacts on LULC change was carried out. Correlation among the built-up areas and the socioeconomic statistics was analyzed using Pearson’s correlation coefficient.
4. Results and Discussions
4.1. Analysis of LULC Classification Results
4.1.1. Accuracy Assessment of LULC Classification
The accuracy assessment result indicated an overall classification accuracy of 80.89%, providing the fundamental data sources for examining LULC changes (Table 3). The object-oriented method that combined automatic classification and manual editing proved valuable to provide reliable LULC classification [16]. Manual editing was then used to improve LULC classification. The minimum classification unit in this study was six pixels; therefore, the parcels less than six pixels were manually merged and classified to the corresponding reasonable LULC types. Although no samples are available for analyzing the other image classification results before 2010, a similar classification accuracy is believed to be obtained through visual evaluation.
Table 3.
Accuracy assessment for the 2010 classified images of Beijing, China.
| Type | FL | GL | WB | AL | BU | BL | RT | CT | PA | UA |
|---|---|---|---|---|---|---|---|---|---|---|
| FL | 171 | 7 | 0 | 9 | 3 | 0 | 190 | 229 | 90.00% | 74.67% |
| GL | 9 | 46 | 0 | 1 | 1 | 1 | 58 | 62 | 79.31% | 74.19% |
| WB | 0 | 1 | 42 | 1 | 0 | 44 | 42 | 95.45% | 100.00% | |
| AL | 25 | 5 | 0 | 32 | 8 | 2 | 72 | 44 | 44.44% | 72.73% |
| BU | 24 | 2 | 0 | 1 | 137 | 0 | 164 | 151 | 83.54% | 90.73% |
| BL | 0 | 1 | 0 | 1 | 1 | 8 | 11 | 11 | 72.73% | 72.73% |
Note: FL, forest land; GL, grassland; WB, water body; AL, arable land; BU, built-up areas; BL, bare land; RT, row total; CT, column total; PA, producer’s accuracy; UA, user’s accuracy.
4.1.2. LULC Result at Overall Scale
Figure 3 shows the LULC distributions in Beijing from 1978 to 2010, indicating that the dominant LULC types were forest and arable land. The composition of LULC classes varied considerably on different dates, as shown in Table 4.
From 1978 to 2010, the forest and built-up areas increased significantly, but the arable land showed a sharp decline. In 1978, the main LULC types in Beijing were forest and arable land, accounting for more than 80% of the total area. After 30 years, LULC in Beijing changed significantly, with a rapid urbanization at the cost of losing arable land. Arable land decreased from 40.99% of the total area in 1978 to 25.18% in 2010, while built-up areas increased significantly from 4.91% in 1978 to 15.79% in 2010 (Table 4). The forest area increased, but grass and water decreased. By 2010, the forest and arable land were still the dominant and subdominant LULC types.
The grassland area decreased sharply in 2010 compared to previous periods, because of the implementation of afforestation and ecological protection projects since 2000 and the need to produce more food for the increasing population. Water body area also decreased significantly in 2010, mainly due to the removal of dams at small reservoirs in Haihe Basin, persistent drought and global warming [37]. There was a sudden increase of bare land in 2010, which reflects the accelerated urban expansion with population and economy growth, opening up a large amount of bare land for pending construction (Table 4).
Table 4.
1978–2010 land use and land cover statistics in Beijing, China.
| Year | Percent of Area (%) | |||||
|---|---|---|---|---|---|---|
| Arable Land | Forest Land | Grassland | Built-Up Areas | Water Body | Bare Land | |
| 1978 | 40.96 | 42.35 | 8.20 | 4.91 | 3.58 | 0.00 |
| 1987 | 33.86 | 42.32 | 9.68 | 10.09 | 4.05 | 0.00 |
| 1992 | 32.71 | 43.09 | 9.04 | 10.99 | 4.15 | 0.01 |
| 2000 | 29.00 | 44.49 | 9.10 | 13.29 | 4.12 | 0.01 |
| 2010 | 25.18 | 51.66 | 5.29 | 15.79 | 1.63 | 0.44 |
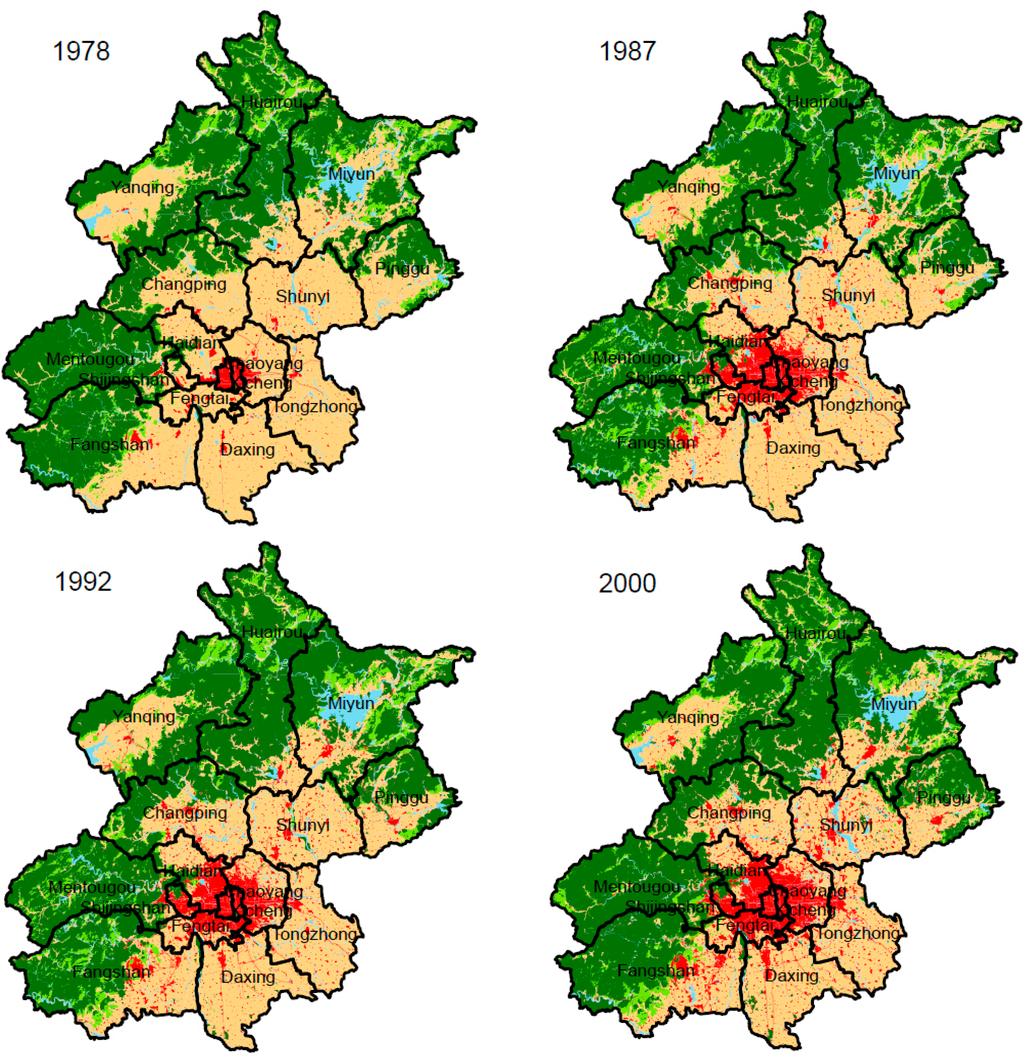
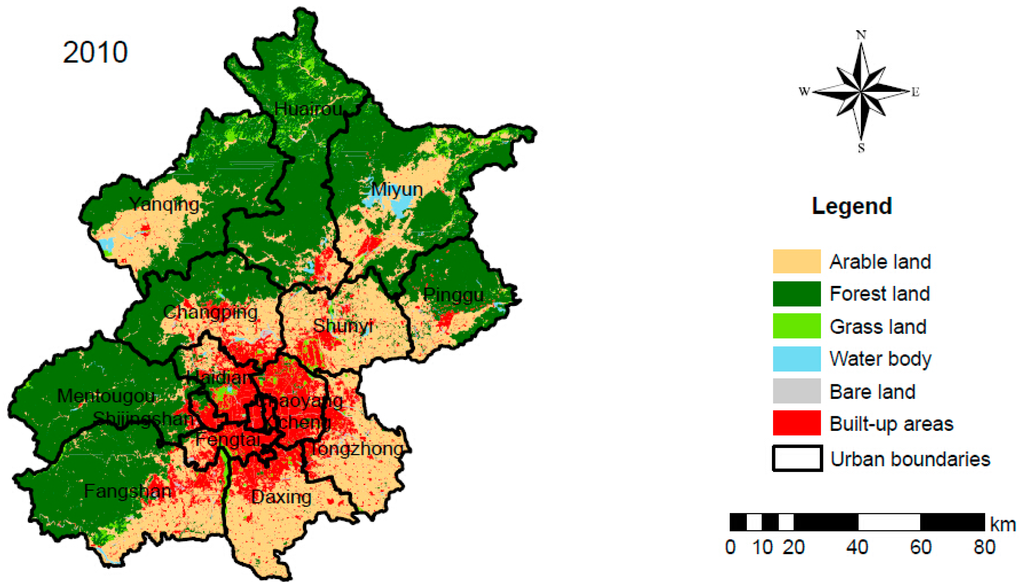
Figure 3.
1978–2010 LULC maps of Beijing.
4.2. LULC Spatial and Temporal Change Analysis
4.2.1. Analysis of LULC Change Trajectories
Figure 4 illustrates the spatial distribution of LULC change, indicating that obvious change trajectories happened around the downtown area and exurban built-up areas of Beijing. Due to the different LULC changes on detection dates, the change trajectories of the main individual classes (arable land, forest land and built-up areas) were analyzed at the census-sector scale.
The major spatial change in arable land was the conversion to forest land or grassland in mountain areas and the loss of arable land caused by the downtown expansion (Figure 4). With this trend of conversion, grassland was more obvious in the northern, eastern and southwestern areas of Beijing, such as Miyun, Huairou, Yanqing, Pinggu and Fangshan counties. This was due to the rapid development of tertiary and secondary industries after the reform and opening up, and agriculture played a minor role. Because of the poor natural conditions of arable land in mountain areas, much reforestation occurred; especially since 2000, the construction of a shelter-forest belt resulted in the conversion from mountainous farmland to forest land.
The forest land spatial change occurred mainly in the north, northwest and southwest mountains, and consisted of reforestation on sloping arable land and planting trees on barren mountains and in grasslands (Figure 4). Since 1987, the forest area has maintained a steady growth rate that benefited from the support of national and local forestry laws and policies. A huge shelter-forest belt for Beijing was formed in the counties of Miyun, Huairou, Yanqing, Changping, Pinggu, Mentougou and Fangshan, improving the capital city environment.
In 1978, the built-up areas of Beijing occurred mainly in Dongcheng and Xicheng counties as the core area and scattered areas in other counties. The period from the reform and opening to the 1990s was an important period for China, because of the country’s transition from a planned economy to a market economy. The comprehensive social and economic development laid a material foundation for urbanization, and the built-up areas of Beijing had expanded to Chaoyang, Haidian, Shijingshan and Fengtai counties until 1987. By 2010, the built-up area of downtown was connected to suburban Tongzhou, Daxing, Fangshan, Changping and Shunyi, and the buildup in the northern exurban area further increased (Figure 5). Recent research on the bidecadal development of urban agglomeration in the Jing-Jin-Tang area indicated that the construction and development of metropolitan Beijing and Tianjin started in the early 1980s, and Beijing has been aggregating to a more homogeneous urbanized region since the 2000s [15].
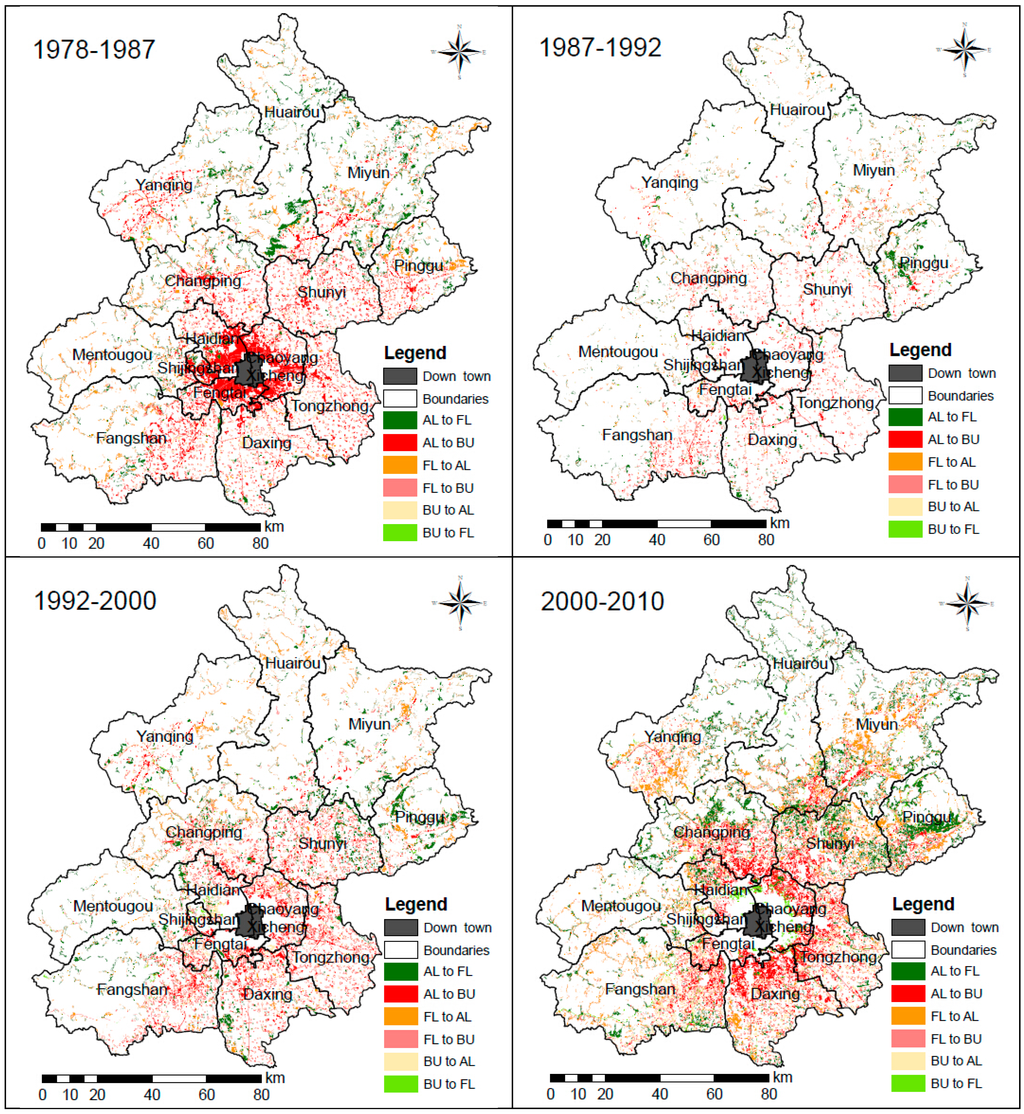
Figure 4.
Beijing land use and land cover change maps at the per-pixel scale for four periods.
4.2.2. Analysis of LULC Change at Different Stages
Based on the four periods of study, the change rate per year for each LULC type in a certain period in Beijing was analyzed as the LULC change rate (Table 5). It was found that the built-up area grew faster during the periods of 1978–1987, 1992–2000 and 2000–2010, and the overall growth rate reached 40 km2/year. During 1978–1987, the growth rate of the built-up area reached the highest value of 94.31 km2/year, twice the rates in 1992–2000 and 2000–2010. This rapid expansion at the beginning of the reform and opening up was the result of the urgent demand for urban and rural infrastructure, residential construction and secondary and tertiary industry development.
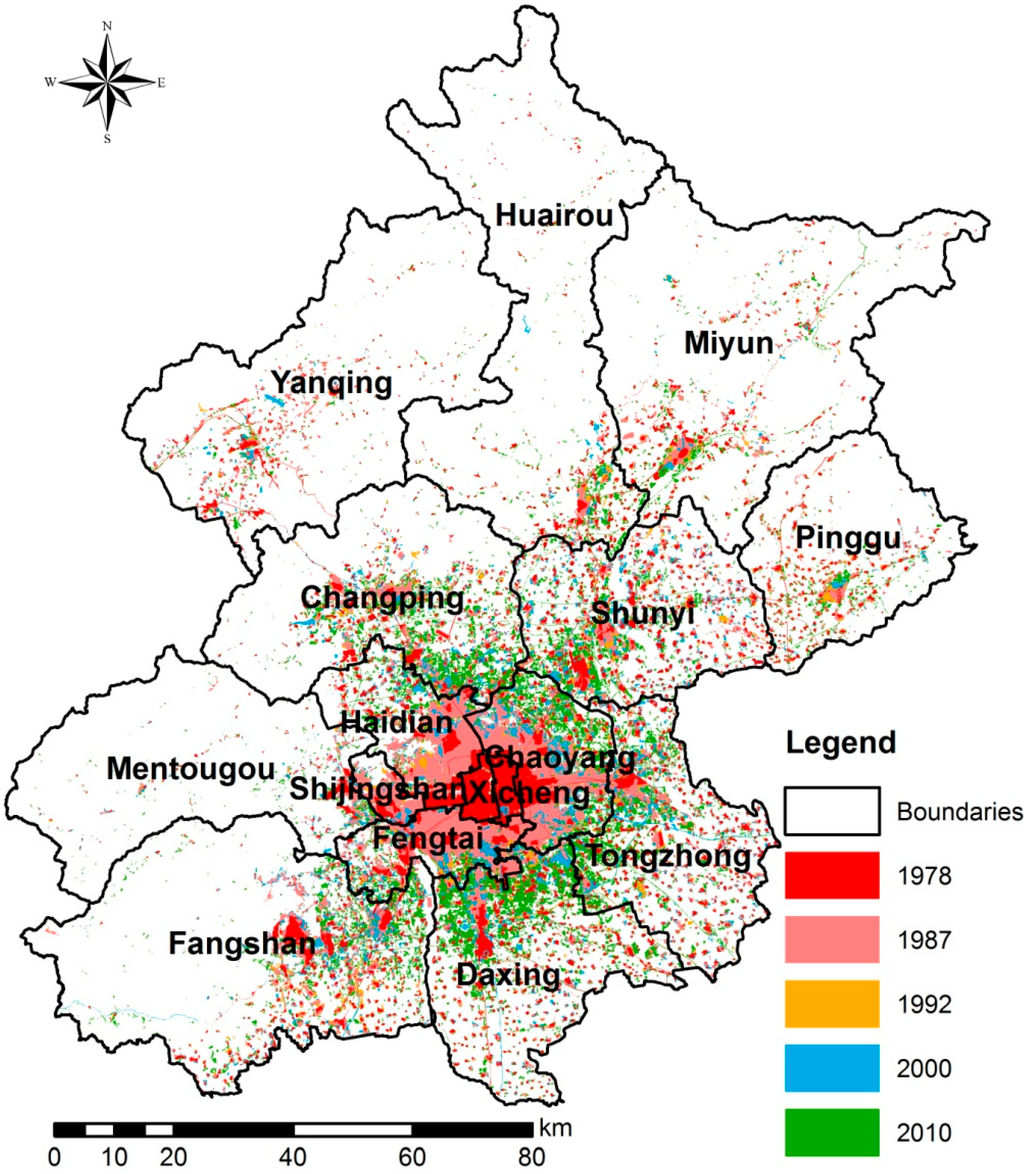
Figure 5.
Expansion of built-up areas in Beijing, 1978–2010.
Table 5.
The land use and land cover change rate during four periods (km2/year).
| Year | Arable Land | Forest Land | Grass Land | Built-Up Areas | Water Body | Bare Land |
|---|---|---|---|---|---|---|
| 1978–1987 | −129.24 | −0.50 | 26.95 | 94.31 | 8.53 | −0.05 |
| 1987–1992 | −37.77 | 25.44 | −20.74 | 29.34 | 3.28 | 0.44 |
| 1992–2000 | −76.15 | 28.63 | 1.08 | 47.21 | −0.69 | −0.08 |
| 2000–2010 | −62.47 | 117.50 | −62.36 | 41.07 | −40.78 | 7.04 |
The arable land decreased monotonically. During 1978–1987, 1992–2000 and 2000–2010, the decrease rate of arable land was more obvious, reaching more than 60 km2/year (Table 5). Particularly during 1978–1987, the decrease rate of arable land reached the highest value of 129.24 km2/year. During the other periods, a substantial decline in arable land was related to the “Land Management Law of the People’s Republic of China” first adopted in 1986 and revised in 1998 and 2004. The law stipulates the steady transfer of reclamation arable land that impacts the ecological environment into forest, grassland and lakes.
After the negative growth of forest area between 1978 and 1987, forest land increased steadily in the other three periods (Table 5). The forest growth rate reached over 20 km2/year as it benefited from the implementation of a voluntary tree-planting program in 1982 and the “Forest Law of the People’s Republic of China” in 1985. In 2000–2010, the forest growth rate reached the highest value of 117.5 km2/year because of the implementation of four large-scale ecological projects (begun in 2000–2002).
4.2.3. Analysis of the Main Land Use Type Conversion
Table 6 shows the Beijing LULC transition matrix for 1978–2010. Because arable land, forest land and built-up areas occupied the top three types in the overall change, they were chosen for further analysis.
Table 6.
Transition matrix of LULC in Beijing, China, from 1978 to 2010 (km2).
| 1978–2010 | Arable Land | Forest Land | Grassland | Built-Up Areas | Water Body | Bare Land | Change |
|---|---|---|---|---|---|---|---|
| Arable land | 3379.72 | 1056.73 | 312.61 | 1833.74 | 82.21 | 49.42 | −2585.95 |
| Forest land | 255.68 | 6360.96 | 264.92 | 44.68 | 6.49 | 8.92 | 1526.79 |
| Grassland | 178.95 | 912.10 | 211.23 | 32.47 | 4.85 | 3.92 | −476.12 |
| Built-up areas | 124.45 | 29.43 | 24.85 | 616.52 | 5.45 | 4.62 | 1783.88 |
| Water body | 189.63 | 108.82 | 53.77 | 61.79 | 168.21 | 5.10 | −320.11 |
| Bare land | 0.05 | 0.39 | 0.03 | 0.00 | 0.00 | 0.00 | 71.51 |
Because the change in the area of arable land was negative in all four periods, we focused on the land use types converted from arable land. Table 7 shows that arable land was mainly changed to built-up areas, accounting for 69.45% of the change from 1978 to 1987. Meanwhile, other land cover types, such as forest, grass and water, made up the rest of the conversion; the increase in grassland offset the arable land loss to some extent. Arable land continued to convert to built-up area and forest during the remainder of the study period, especially in 1992–2000, when both built-up area and forest accounted for more than 90% of the conversion. All results analyzed above showed that the national Grain for Green Program launched in 2002 and urbanization contributed greatly to the loss of arable land (Table 7).
Table 7 shows that arable land was the main source for the built-up area that had been monotonically increasing, and the other land use types accounted for a relatively small ratio. Except for 1987–1992, the contribution rates of arable land to built-up area were more than 90%. The main reason was that most of the arable land suitable for construction was located in the plain; however, most of the forest and grassland was located in the suburbs of the mountain area. Thus, arable land was the main land source for urbanization in Beijing.
In addition to 1978–1987, the forest area showed a growth trend in the other three periods (Table 7). Between 1978 and 1987, many changes occurred between forest and arable, grass types, and the change area far exceeded the total change area of forest land during this period. The contribution rate indicates that although there were many changes between forest and other land types, the forest area changed little during this period. During 1987–1992 and 1992–2000, the conversion of arable land to forest accounted for over 90% of the total forest change, indicating that the main reason for the forest increase was the Grain for Green Program. In 2000–2010, about 60% of grassland converted to forest, while only 30% came from grassland, which indicates that the Grain for Green Program had achieved great success. After 2000, the grassland being used for greening and tree planting on the barren hills was a major reason for the forest increase.
Table 7.
Conversion and its contribution rate for arable land, built-up area and forest land with other land use types in different periods.
| Type | 1978–1987 | 1987–1992 | 1992–2000 | 2000–2010 | ||||
|---|---|---|---|---|---|---|---|---|
| NC (km2) | CR (%) | NC (km2) | CR (%) | NC (km2) | CR (%) | NC (km2) | CR (%) | |
| AL-FL | −97.32 | 8.37 | −123.90 | 65.60 | −193.45 | 31.75 | −347.47 | 55.62 |
| AL-GL | −150.41 | 12.93 | 69.24 | −36.66 | −34.68 | 5.69 | 11.47 | −1.84 |
| AL-BU | −807.87 | 69.45 | −130.19 | 68.93 | −355.23 | 58.31 | −471.75 | 75.52 |
| AL-WB | −107.67 | 9.26 | −3.03 | 1.60 | −25.61 | 4.20 | 215.37 | −34.48 |
| AL-BL | 0.09 | −0.01 | −0.98 | 0.52 | −0.27 | 0.04 | −32.29 | 5.17 |
| BU-AL | 807.87 | 95.18 | 130.19 | 88.74 | 355.23 | 94.06 | 471.75 | 114.86 |
| BU-FL | −28.22 | −3.33 | 7.09 | 4.83 | 5.31 | 1.41 | −31.43 | −7.65 |
| BU-GL | 15.23 | 1.79 | 5.93 | 4.04 | 1.46 | 0.39 | −69.61 | −16.95 |
| BU-WB | 10.41 | 1.23 | 3.51 | 2.39 | 15.70 | 4.16 | 54.04 | 13.16 |
| BU-BL | -- | -- | −0.01 | -- | −0.04 | −0.01 | −14.05 | −3.42 |
| FL-AL | 97.32 | −2162.68 | 123.90 | 97.38 | 193.45 | 84.46 | 347.47 | 29.57 |
| FL-GL | −97.01 | 2155.72 | 5.57 | 4.38 | 35.18 | 15.36 | 736.70 | 62.70 |
| FL-BU | −15.29 | 339.74 | −7.09 | −5.57 | −5.31 | −2.32 | 31.43 | 2.67 |
| FL-WB | 10.47 | −232.58 | 4.95 | 3.89 | 6.25 | 2.73 | 71.14 | 6.05 |
| FL-BL | 0.01 | −0.18 | −0.09 | −0.07 | −0.52 | −0.23 | −11.71 | −1.00 |
Note: FL, forest land; GL, grassland; WB, Water body; AL, arable land; BU, built-up areas; BL, bare land; NC, net change in area; CR, contribution rate.
4.3. Anthropogenic Driving Forces Analysis on LULC Change
4.3.1. Qualitative Analysis
After the reform and opening up in 1978, the Chinese government entirely abandoned the basic principles of agricultural development—“Take grain as the key link”—and focused on industrial development. This shift had a far-reaching impact on the primary industry of agriculture, and the direct consequence was the rapid loss of arable land as the means of basic agriculture production. The largest reduction of arable land occurred during 1978–1987 of our study period. In 1998, the “Land Management Law of the People’s Republic of China” was revised, and the 39th article now stipulates, “Encroachment on forest, grassland, lake and river flood areas for arable land is strictly prohibited. According to the national land use plan, the arable land encroaching on forest, grassland, lake and river flood areas should revert to its original land cover steadily”. In October of that year, based on recollections of the Yangtze River and Songhua River flood disasters and new efforts in ecological protection, the Chinese government formulated the administrative regulation of “Opinions on reconstruction, improvement of irrigation, rivers and lakes”, and made “planting trees on fenced mountains and reforestation on sloping arable land” the guiding principle of reconstruction. In 1999, the government launched the Grain for Green Program (first phase), and after three years of the pilot project, the Grain for Green Program (second phase) was fully implemented from 2002 to 2010 (Table 8). All policies, laws, regulations and ecological projects mentioned above directly affected arable land loss in Beijing during 1978–2010.
Table 8.
The policies, laws, regulations and major ecological projects potentially impacting Beijing LULC change during 1978–2010.
| Year | Category | Content | Level |
|---|---|---|---|
| 1978 | Policy | The reform and opening up policy | National |
| 1978 | Administrative regulation | “The construction planning of a large shelter-forest in key areas of sand and soil erosion hazard in the northwest, northeast and north China” | Regional |
| 1978–1985 | Ecological project | Three-North Shelterbelt Project (first phase) | Regional |
| 1986–1995 | Ecological project | Three-North Shelterbelt Project (second phase) | Regional |
| 1982 | Administrative regulation | “The implementation measures on carrying out a nationwide voluntary tree-planting campaign” | National |
| 1985 | Law | “Forest Law of the People’s Republic of China” | National |
| 1986–2000 | Ecological project | Taihang Mountain greening project (first phase) | Regional |
| 1988 | Administrative regulation | “Beijing suburb afforestation regulation” | Local |
| 1990 | Administrative regulation | “Beijing urban greening regulation” | Local |
| 1996–2000 | Ecological project | Three-North Shelterbelt Project (third phase) | Regional |
| 1998 | Law | “Land Management Law of the People’s Republic of China” | National |
| 1998 | Administrative regulation | “Opinions on reconstruction, improvement of irrigation, rivers, and lakes” | Regional |
| 1999 | Administrative regulation | “Beijing forest resources protection regulation” | Local |
| 1999–2001 | Ecological project | Grain for Green Program (first phase) | Regional |
| 2000–2011 | Ecological project | Beijing-Tianjin sandstorm source control project (first phase) | Regional |
| 2001–2010 | Ecological project | Taihang Mountain greening project (second phase) | Regional |
| 2001–2010 | Ecological project | Three-North Shelterbelt Project (fourth phase) | Regional |
| 2002–2010 | Ecological project | Grain for Green Program (second phase) | Regional |
| 2010 | Administrative regulation | “Beijing region greening regulation” | Local |
Sources: Websites of the National Development and Reform Commission of the People’s Republic of China, State Forestry Administration of the People’s Republic of China and the Beijing Gardening and Greening Bureau.
Since 1987, the growth rate of forest area has been more than 20 km2/year. This encouraging result can be ascribed to the administrative regulation of “The implementation measures on carrying out a nationwide voluntary tree-planting campaign” and the “Forest Law of the People’s Republic of China” issued on 27 February 1982, and 1 January 1985, respectively (Table 8). The law stipulated, “Implement protection measures for forest resources on a national scale, including limited forest harvesting, planting trees on fenced mountains, forest conservation and expanding forest cover.”
At the same time, large ecological projects played direct roles in the forest area increase in Beijing. On 25 November 1978, China enacted “the construction planning of a large shelter-forest in key areas of sand and soil erosion hazard in the northwest, northeast and north China”, marking the official beginning of the Three-North Shelterbelt Project. It was the largest afforestation project in the world and aimed to establish 35 million hectares of forest between 1978 and 2050. By 2010, Phase IV of the project had been accomplished. During the implementation of the Three-North Shelterbelt Project, the State Forestry Administration completed the Taihang Mountain greening project (1986–2000 and 2001–2010) and the Grain for Green Program (1999–2001 and 2002–2010) (Table 8).
In particular, the growth rate of forest area between 2000 and 2010 was 117.50 km2/year, the highest value during our study period. This growth indicates that, in addition to the national-level continuous investment in forest protection and conservation, the local government of Beijing has made enormous efforts in ecological protection since 2000. In 1999, the local administration’s “Beijing forest resources protection regulation” was enacted. In spring of the next year, 12 large-scale dust and sand storms happened in north China, which caused serious environmental and health problems. To reduce dust hazards in the capital, the Beijing-Tianjin sandstorm source control project was carried out from 2000 to 2011. All in all, these laws, regulations and large-scale ecological projects were not only the driving factors to improve the ecological environment, but also the reasons for Beijing LULC change (Table 8).
With the rapid urbanization and economic development in Beijing, there was an urgent need to increase residential, commercial and industrial land for infrastructure construction. The GDP of Beijing increased from 10,880 million yuan in 1978 to 1,411,358 million yuan in 2010. Calculated from the urban population percentage of total population, the urbanization rate increased from 54.96% to 78.67% (Table 1), and the population increase and economic development played more direct roles in the expansion of built-up areas.
4.3.2. Quantitative Analysis
Using Pearson correlation, the high correlations between the built-up areas and the socioeconomic driving factors, as well as among the driving factors are shown in Table 9. The abbreviations used for the statistics factors are as follows: total population (TP), urban population (UP), urbanization rate (UR), gross domestic product (GDP), percent of primary industry (PPI), percent of secondary industry (PSI) and percent of tertiary industry (PTI). In detail, TP, UP, UR and PTI had positive correlations with the built-up areas, while PSI showed a negative correlation with the built-up areas. These correlations further prove that both population increase and economic development played important roles in the expansion of built-up areas. Similar results were observed by Du et al. in Jiangsu Province [38].
Table 9.
Correlations between the built-up areas and socioeconomic statistics.
| Factor | Correlation | BU | TP | UP | UR | GDP | PPI | PSI | PTI |
|---|---|---|---|---|---|---|---|---|---|
| BU | Pearson correlation | 1.000 | 0.977 ** | 0.949 * | 0.947 * | 0.739 | −0.554 | −0.979 ** | 0.953 * |
| Sig. (2-tailed) | 0.004 | 0.004 | 0.014 | 0.014 | 0.153 | 0.333 | 0.004 | ||
| TP | Pearson correlation | 0.977 ** | 1.000 | 0.991 ** | 0.987 ** | 0.846 | −0.661 | −0.990 ** | 0.979 ** |
| Sig. (2-tailed) | 0.004 | 0.001 | 0.002 | 0.071 | 0.225 | 0.001 | 0.004 | ||
| UP | Pearson correlation | 0.949 * | 0.991 ** | 1.000 | 0.999 ** | 0.905 * | −0.746 | −0.987 ** | 0.989 ** |
| Sig. (2-tailed) | 0.014 | 0.001 | 0.000 | 0.035 | 0.147 | 0.002 | 0.001 | ||
| UR | Pearson correlation | 0.947 * | 0.987 ** | 0.999 ** | 1.000 | 0.905 * | −0.766 | −0.990 ** | 0.994 ** |
| Sig. (2-tailed) | 0.014 | 0.002 | 0.000 | 0.035 | 0.131 | 0.001 | 0.001 | ||
| GDP | Pearson correlation | 0.739 | 0.846 | 0.905 * | 0.905 * | 1.000 | −0.848 | −0.837 | 0.870 |
| Sig. (2-tailed) | 0.153 | 0.071 | 0.035 | 0.035 | 0.069 | 0.077 | 0.055 | ||
| PPI | Pearson correlation | −0.554 | −0.661 | −0.746 | −0.766 | −0.848 | 1.000 | 0.709 | −0.778 |
| Sig. (2-tailed) | 0.333 | 0.225 | 0.147 | 0.131 | 0.069 | 0.180 | 0.121 | ||
| PSI | Pearson correlation | −0.979 ** | −0.990 ** | −0.987 ** | −0.990 ** | −0.837 | 0.709 | 1.000 | −0.995 ** |
| Sig. (2-tailed) | 0.004 | 0.001 | 0.002 | 0.001 | 0.077 | 0.180 | 0.000 | ||
| PTI | Pearson correlation | 0.953 * | 0.979 ** | 0.989 ** | 0.994 ** | 0.870 | −0.778 | −0.995 ** | 1.000 |
| Sig. (2-tailed) | 0.012 | 0.004 | 0.001 | 0.001 | 0.055 | 0.121 | 0.000 |
Note: BU, built-up area; TP, total population; UP, urban population; UR, urbanization rate; GDP, gross domestic product; PPI, percent of primary industry; PSI, percent of secondary industry; PTI, percent of tertiary industry; * correlation is significant at the 0.05 level (two-tailed); ** correlation is significant at the 0.01 level (two-tailed).
5. Conclusions
The results proved that the object-oriented decision tree classification was an effective method for LULC classification. Both the qualitative and quantitative anthropogenic driving forces analysis methods were helpful for better understanding the mechanisms of LULC change in Beijing. The concrete conclusions are shown as follows:
- (1)
- This research has indicated that the object-oriented decision tree classification method can successfully classify time series of Landsat satellite images into LULC thematic data. The overall classification accuracy of 81% indicates that this data is reliable and, thus, can be used for LULC change analysis. Combined with socioeconomic, demographic and political factors analysis, our research can effectively explain long-term change trends and different land use conversions. On the other hand, factors, such as laws and policies, may be important factors influencing LULC change, but they are difficult to be quantitatively examined.
- (2)
- With the rapid urbanization from 1978 to 2010, the built-up area of Beijing developed from one downtown area to interconnected CBDs and population centers at the core of Beijing and in suburban and exurban areas. As Beijing grew, reforestation on sloping arable land created more forest land, which helped improve the declining ecological environment around the capital.
- (3)
- The relevant laws, regulations, ecological projects, economy and population growth were closely related to the LULC change characteristics in Beijing. In 1978–1987, 1992–2000 and 2000–2010, the built-up area increased very fast, resulting in a significant reduction of arable land. After implementation of environmental programs and projects, increases in forest land peaked during 2000–2010.
- (4)
- The land use conversion source analysis results showed that the main reasons for arable land loss were urbanization and reforestation. Forest land increased mainly due to reforestation of arable land.
- (5)
- The spatial variation of LULC change in Beijing was affected by the terrain. Constrained by mountains to the north and west, the built-up area mainly expanded from downtown to the southeast plain. The major spatial change in arable land was the conversion to forest land or grassland in mountain areas and land loss caused by the downtown expansion. The forest land spatial change occurred mainly in the north, northwest and southwest mountains, which was composed of reforestation on sloping arable land, planting trees on barren mountains and establishing grassland.
Acknowledgments
This research is supported by the Natural Science Foundation of China (No. 41101501 and No. 41371540) and the Natural Science Foundation of Fujian Province of China (No. 2013J01165).
Author Contributions
Yichen Tian and Kai Yin made substantial contributions to the design, data processing and analysis. Yichen Tian and Kai Yin drafted the article, and Dengsheng Lu and Qianjun Zhao participated in a critical revision. Lizhong Hua and Meiping Wen were responsible for data cleaning. All authors have read and approved the final version of this manuscript.
Conflicts of Interest
The authors declare no conflicts of interest.
References
- DeFries, R. Why forest monitoring matters for people and the planet. Glob. For. Monit. Earth Obs. 2012, 15, 15–28. [Google Scholar]
- Kennedy, R.E.; Townsend, P.A.; Gross, J.E.; Cohen, W.B.; Bolstad, P.; Wang, Y.; Adams, P. Remote sensing change detection tools for natural resource managers: Understanding concepts and tradeoffs in the design of landscape monitoring projects. Remote Sens. Environ. 2009, 113, 1382–1396. [Google Scholar] [CrossRef]
- Singh, A. Review article digital change detection techniques using remotely-sensed data. Int. J. Remote Sens. 1989, 10, 989–1003. [Google Scholar] [CrossRef]
- Chen, G.; Hay, G.J.; Carvalho, L.M.T.; Wulder, M.A. Object-based change detection. Int. J. Remote Sens. 2012, 33, 4434–4457. [Google Scholar] [CrossRef]
- Altaweel, M.R.; Alessa, L.N.; Kliskey, A.D.; Bone, C.E. Monitoring land use: Capturing change through an information fusion approach. Sustainability 2010, 2, 1182–1203. [Google Scholar] [CrossRef]
- Hansen, M.C.; Loveland, T.R. A review of large area monitoring of land cover change using Landsat data. Remote Sens. Environ. 2012, 122, 66–74. [Google Scholar] [CrossRef]
- Gautam, N.C.; Chennaiah, G.C. Land use and land cover mapping and change detection in Tripura using satellite Landsat data. Int. J. Remote Sens. 1985, 6, 517–528. [Google Scholar] [CrossRef]
- Weng, Q. Land use change analysis in the Zhujiang Delta of China using satellite remote sensing, GIS and stochastic modelling. J. Environ. Manag. 2002, 64, 273–284. [Google Scholar] [CrossRef]
- König, H.J.; Schuler, J.; Suarma, U.; McNeill, D.; Imbernon, J.; Damayanti, F.; Dalimunthe, S.A.; Uthes, S.; Sartohadi, J.; Helming, K. Assessing the impact of land use policy on urban-rural sustainability using the fopia approach in Yogyakarta, Indonesia. Sustainability 2010, 2, 1991–2009. [Google Scholar] [CrossRef]
- Swangjang, K.; Iamaram, V. Change of land use patterns in the areas close to the airport development area and some implicating factors. Sustainability 2011, 3, 1517–1530. [Google Scholar] [CrossRef]
- Zhao, Y.; Zhang, K.; Fu, Y.; Zhang, H. Examining land use/land cover change in the lake Dianchi watershed of the Yunnan-Guizhou plateau of southwest China with remote sensing and GIS techniques: 1974–2008. Int. J. Environ. Res. Public Health 2012, 9, 3843–3865. [Google Scholar] [CrossRef] [PubMed]
- Masek, J.G.; Huang, C.; Wolfe, R.; Cohen, W.; Hall, F.; Kutler, J.; Nelson, P. North American forest disturbance mapped from a decadal Landsat record. Remote Sens. Environ. 2008, 112, 2914–2926. [Google Scholar] [CrossRef]
- Thomas, N.E.; Huang, C.; Goward, S.N.; Powell, S.; Rishmawi, K.; Schleeweis, K.; Hinds, A. Validation of north American forest disturbance dynamics derived from Landsat time series stacks. Remote Sens. Environ. 2011, 115, 19–32. [Google Scholar] [CrossRef]
- Kim, D.-Y.; Thomas, V.; Olson, J.; Williams, M.; Clements, N. Statistical trend and change-point analysis of land cover-change patterns in east Africa. Int. J. Remote Sens. 2013, 34, 6636–6650. [Google Scholar] [CrossRef]
- Lu, L.; Guo, H.; Wang, C.; Pesaresi, M.; Ehrlich, D. Monitoring bidecadal development of urban agglomeration with remote sensing images in the Jing-Jin-Tang area, china. J. Appl. Remote Sens. 2014, 8. [Google Scholar] [CrossRef]
- Lu, D.; Weng, Q. A survey of image classification methods and techniques for improving classification performance. Int. J. Remote Sens. 2007, 28, 823–870. [Google Scholar] [CrossRef]
- Lu, D.; Li, G.; Moran, E. Current situation and needs of change detection techniques. Int. J. Image. Data Fusion 2014, 5, 13–38. [Google Scholar] [CrossRef]
- D’Oleire-Oltmanns, S.; Coenradie, B.; Kleinschmit, B. An object-based classification approach for mapping migrant housing in the mega-urban area of the Pearl River Delta (China). Remote Sens. 2011, 3, 1710–1723. [Google Scholar] [CrossRef]
- Lu, D.; Hetrick, S.; Moran, E. Impervious surface mapping with Quickbird imagery. Int. J. Remote Sens. 2011, 32, 2519–2533. [Google Scholar] [CrossRef] [PubMed]
- Araya, Y.H.; Cabral, P. Analysis and modeling of urban land cover change in Setubal and Sesimbra, Portugal. Remote Sens. 2010, 2, 1549–1563. [Google Scholar] [CrossRef]
- Liu, J.; Liu, M.; Deng, X.; Zhuang, D.; Zhang, Z.; Luo, D. The land use and land cover change database and its relative studies in China. J. Geogr. Sci. 2002, 12, 275–282. [Google Scholar] [CrossRef]
- Sun, Z.; Li, X.; Fu, W.; Li, Y.; Tang, D. Long-term effects of land use/land cover change on surface runoff in urban areas of Beijing, China. J. Appl. Remote Sens. 2014, 8. [Google Scholar] [CrossRef]
- He, C.Y.; Shi, P.J.; Chen, J.; Zhou, Y.Y. A study on land use/cover change in Beijing area. Geogr. Res. 2001, 20, 679–687. [Google Scholar]
- Wang, S.-X.; Yao, Y.; Zhou, Y. Analysis of ecological quality of the environment and influencing factors in China during 2005–2010. Int. J. Environ. Res. Public Health 2014, 11, 1673–1693. [Google Scholar] [CrossRef] [PubMed]
- Long, H.; Wu, X.; Wang, W.; Dong, G. Analysis of urban-rural land use change during 1995–2006 and its policy dimensional driving forces in Chongqing, China. Sensors 2008, 8, 681–699. [Google Scholar]
- Merem, E.C.; Yerramilli, S.; Twumasi, Y.A.; Wesley, J.M.; Robinson, B.; Richardson, C. The applications of gis in the analysis of the impacts of human activities on south Texas watersheds. Int. J. Environ. Res. Public Health 2011, 8, 2418–2446. [Google Scholar] [CrossRef] [PubMed]
- Long, H.; Tang, G.; Li, X.; Heilig, G.K. Socio-economic driving forces of land use change in Kunshan, the Yangtze river delta economic area of China. J. Environ. Manag. 2007, 83, 351–364. [Google Scholar] [CrossRef]
- Liu, J.; Zhang, Z.; Xu, X.; Kuang, W.; Zhou, W.; Zhang, S.; Li, R.; Yan, C.; Yu, D.; Wu, S. Spatial patterns and driving forces of land use change in China during the early 21st century. J. Geogr. Sci. 2010, 20, 483–494. [Google Scholar] [CrossRef]
- Zhang, H.; Uwasu, M.; Hara, K.; Yabar, H. Sustainable urban development and land use change—A case study of the Yangtze river delta in China. Sustainability 2011, 3, 1074–1089. [Google Scholar] [CrossRef]
- National Bureau of Statistics of China. China Statistical Yearbook; China Statistics Press: Beijing, China, 1978–2010.
- Beijing Municipal Bureau of Statistics. Beijing Statistical Yearbook; China Statistical Publishing: Beijing, China, 1978–2010. (In Chinese)
- McFeeters, S.K. The use of the normalized difference water index (NDWI) in the delineation of open water features. Int. J. Remote Sens. 1996, 17, 1425–1432. [Google Scholar] [CrossRef]
- Huete, A.R. A soil-adjusted vegetation index (SAVI). Remote Sens. Environ. 1988, 25, 295–309. [Google Scholar] [CrossRef]
- Zha, Y.; Gao, J.; Ni, S. Use of normalized difference built-up index in automatically mapping urban areas from TM imagery. Int. J. Remote Sens. 2003, 24, 583–594. [Google Scholar] [CrossRef]
- Zhao, H.; Chen, X. Use of Normalized difference bareness index in quickly mapping bare areas from TM/ETM+. In Proceedings of the IEEE International Geoscience and Remote Sensing Symposium, Seoul, Korea, 25–29 July 2005; pp. 1666–1668.
- Lu, D.; Li, G.; Moran, E.; Hetrick, S. Spatiotemporal analysis of land use and land cover change in the Brazilian Amazon. Int. J. Remote Sens. 2013, 34, 5953–5978. [Google Scholar] [CrossRef] [PubMed]
- Yang, Y.; Tian, F. Abrupt change of runoff and its major driving factors in Haihe river catchment, China. J. Hydrol. 2009, 374, 373–383. [Google Scholar] [CrossRef]
- Du, X.; Jin, X.; Yang, X.; Yang, X.; Zhou, Y. Spatial pattern of land use change and its driving force in Jiangsu province. Int. J. Environ. Res. Public Health 2014, 11, 3215–3232. [Google Scholar] [CrossRef] [PubMed]
© 2014 by the authors; licensee MDPI, Basel, Switzerland. This article is an open access article distributed under the terms and conditions of the Creative Commons Attribution license (http://creativecommons.org/licenses/by/4.0/).