Evaluation of Coastline Changes under Human Intervention Using Multi-Temporal High-Resolution Images: A Case Study of the Zhoushan Islands, China

Abstract
: Continued sea-level rise and coastal development have led to considerable concerns on coastline changes along inhabited islands. Analysis of long-term coastline changes of islands is however limited due to unavailable data and the cost of field work. In this study, high-resolution images taken from 1970–2011 at an interval of about 10 years and topographic maps were collected to determine coastline changes and their drivers in the Zhoushan Islands, China. Results show that nearly all inhabited islands appeared to have noteworthy seaward expansion during the past four decades. Coastline change rates varied among islands, and the annual change rate of Zhoushan Island (the main island) reached 12.83 ± 0.17 m/year during the same period. Since 2003, the study area has been dominated by artificial coast. The proportion of harbor/port and urban/industrial coast has significantly increased, while rocky coasts and shelter-farm coasts have shrunk greatly. Preliminary analysis of drivers for these coastline changes across the Zhoushan Islands highlights the roles of human policies during different periods as well as location, which were the dominant factors controlling the great spatial and temporal complexity of coastline changes of the major islands. Sediment supply from the Yangtze River decreased after the completion of the Three Gorges Dam in 2003; however, the Zhoushan coast rapidly accreted seaward during the last decade and the artificial siltation, coastal engineering, and harbor dredging materials could be responsible for the observed coastline changes. Pressured by rapid development of the port industry, the Zhoushan coast may face unprecedented challenges in coastal use in the near future. This research provides the basic background information for future studies on coastal protection and management.1. Introduction
The coast is a difficult place to manage, involving a dynamic natural system that has been increasingly pressured by expanding socioeconomic systems [1]. To help guide coastal management and policy-and-decision making, baseline scientific information on rates and trends of regional coastal changes is urgently needed [2]. Studies on estimates of coastline changes and monitoring coastal environment based on remotely sensed data have been widely carried out in various deltas [3–5], wetlands [6–9], bays [10,11], and estuaries [12,13] as well as other continental coasts [14].
Threatened by rising sea level, using high-resolution images and geographic information system (GIS) technologies to quantify shoreline changes of islands and atolls over time becomes an important tool worldwide in coastal environmental monitoring. These islands include the Great Barrier Reef in Australia [15], the Seribu Islands in Indonesia [16], Wotje Atoll in the Marshall Islands [17], and Tarawa Atoll in Kiribati [18]. Collectively, these islands being investigated consist mostly of types of sandy mud, reef islands, and atolls. These islands and atolls are more prone to various erosions under natural conditions over time, relative to the rocky islands. Chronic erosion of shorelines is considered a likely outcome of continued and accelerating sea-level rise. In China, more than 90% of the islands along its continental coast are rocky islands. This is different from the environments of ocean reef and sandy islands in the studies mentioned above. Being close to the mainland, the majority of inhabited islands are seriously impacted by increasing coastal activities [19]. Island coastline resources are exploited to accommodate the increasing need for living space and other development, e.g., reclamation for ports, harbors, and industrial areas. Coastline erosion brought by sea-level rise and other natural events appears likely to be masked by rapid human development activities. In fact, these islands might, more than any other coastal areas, be exposed to natural hazards under sea-level rise, i.e., typhoons and storm surges [20]. It was reported that 223 typhoons occurred in the Zhoushan Islands during the past five decades, ranked at the forefront of China [21]. Pelling et al. [22] recently found that rapid coastline changes due to natural developments and large-scale anthropogenic land reclamation had caused sea-level rise during the tides in the Bohai Sea, China. This might aggravate disasters of storms and floods around the coast. Thus, for scientific use and management of island coastline resources under sea-level rise, these factors are central to an analysis: the velocity of coastline seaward movement, the pattern of coastal use, and the drivers of coastline changes.
The Zhoushan Islands, as the largest prefecture-level city of China, are becoming a hot spot of domestic and foreign concerns. During the past few decades, the Zhoushan coast has been subject to rapid changes under quickened urbanization process [23,24]. At the same time, the rate of sea-level rise along the Zhoushan coast had reached 2.8 mm/year during 1980 and 2010, and is projected to rise by 20–40 cm by the year 2050, considering that the elevation along the Zhoushan coast is only 1.5–5.0 m [25]. In this context, knowledge of coastline changes under human intervention in the Zhoushan Islands is important for future sea-use plan and coastal protection as well as management. However, research on coastline changes under human intervention over a long time period in the Zhoushan Islands is limited. One reason may be the numerous small islands distributed in this region, which require a huge workload. The object of this study is to gain some preliminary insight into coastline dynamics under anthropogenic influences in Zhoushan Island (the main island) and its surrounding islands using multi-temporal high-resolution images. We aim to evaluate the coastline changes using rates of coastline change and types of coastal use, and to discuss the drivers for these coastline changes during the past four decades.
2. Study Area
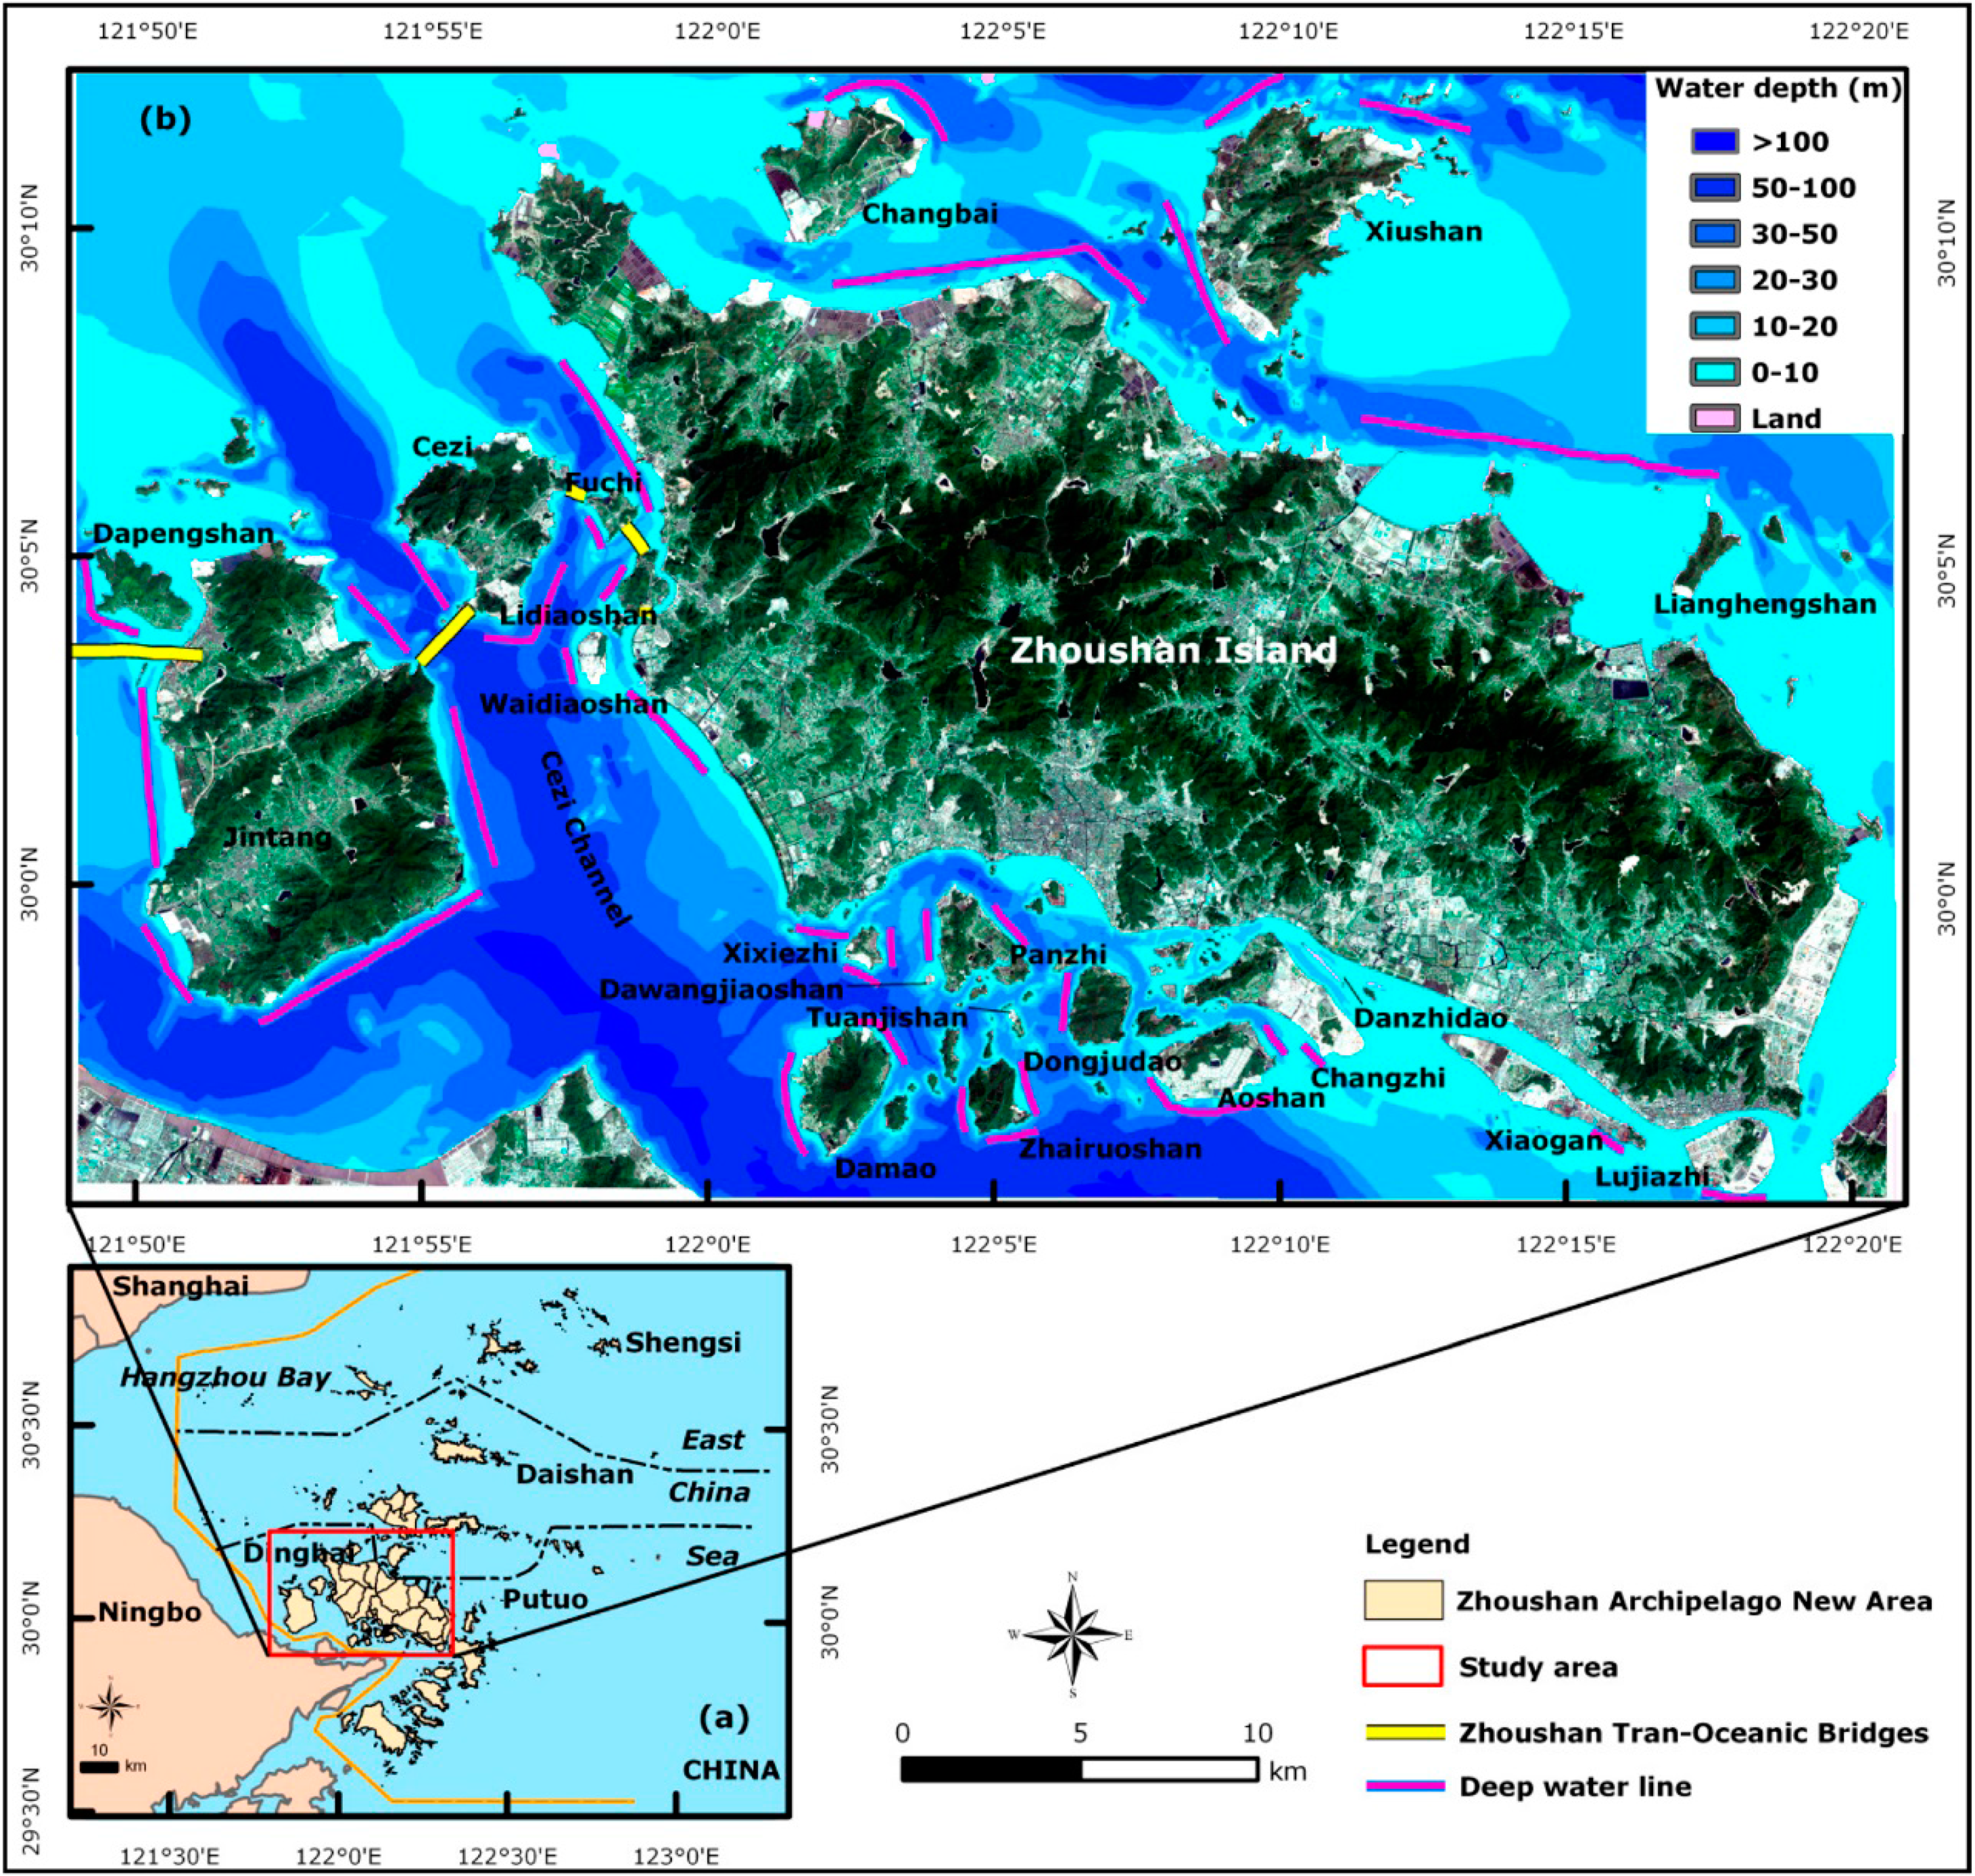
The Zhoushan Islands (i.e., Zhoushan Archipelago New Area) are located in the northeast of Zhejiang province, China, with a total area of 22,200 km2 and a landmass area of 1400 km2 (6.3%). It lies across the mouth of the Hangzhou Bay and is separated from the mainland by a narrow body of water. Zhoushan Island (the main island) and its surrounding islands, located in the middle of the Zhoushan Islands, were selected as the study area (29°55′–30°12′N, 121°48′–122°20′E; Figure 1). The basic information of the main islands is listed in Table 1. The resources of natural deep-water coastlines (>10 m) are very rich, as long as 246.7 km, and most of the channels and anchorages are distributed in this area. The climate is governed by monsoon-influenced subtropical marine weather systems. The annual mean temperature and precipitation are 17 °C and 1300 mm, respectively. The tide pattern belongs to an irregular semidiurnal tide, and the mean tidal range is ∼2 m along the Ningbo-Zhoushan Harbor [26]. The Zhoushan Islands frequently encounter tropical cyclone disasters in summer. Dinghai District is the economic and political center of Zhoushan City, comprising approximately 42% of the municipal population, and the population of urban areas has doubled during the past three decades. The Zhoushan Islands belong to a hilly landform, and the dominant coastline types are a rocky coast (75.8%) and an artificial coast (21.6%). There are widespread andesitic-granitic igneous rocks of the Mesozoic age, over which lie semi-consolidated to unconsolidated terrigenous sediments, up to several hundred meters thick, of the Cenozoic age [27]. With the completion of Zhoushan Trans-oceanic Bridges between Zhoushan and Ningbo City, the study area is subject to rapid changes in transportation, tourism, and especially the ports. Widespread reclamation and ocean engineering have brought significant changes to the Zhoushan coast during the past 40 years.
3. Data and Methods
3.1. Image Acquisition and Preparation
To evaluate coastline changes over time, the images need to be totally cloud-free, at least over the island coastlines of interest. Given that the landmass area for the majority of the surrounding islands is small and uneven (Table 1, 0.1–5 km2), and most importantly that the scale of coastal projects is not very large, generally ranging from several meters to hundreds of meters at different coastline locations, high-resolution images are needed to capture island coastline changes for improving the calculation of coastline change rate and for better determining coastal use types over time. The historical high-resolution images covering the Zhoushan Islands are very limited. The CORONA panchromatic data in 1970 was the earliest high-resolution image available for the region. The historical high-resolution images (spatial resolution < 3 m) in the 1980s and 1990s for the whole study were not available; thus, the KH-9 Hexagon image in 1980 (7 m) as well as the SPOT2 image (10 m) in 1992 were selected. Affected by clouds, high-resolution images derived after 2000 at a year-to-year interval and at the same time covering the major islands in the study area were limited. Fortunately, the high-resolution images in 2003 and 2011 covering the major islands are available from the SPOT5 images. The objective of this research is to provide the background information of the general trend of coastline changes for better coastal protection and management under rising sea level along the Zhoushan coast, so the changes of rates and types during different periods rather than the changes at annual intervals are emphasized. As a consequence, the available images at about 10-year intervals are used to analyze the coastline changes in the Zhoushan Islands. Table 2 lists the medium–high resolution images used in this study.
The earlier island images mostly have a paucity of anthropogenic features suitable for ground control points, rendering georeferencing of images problematic [17]. The study area encompasses inhabited islands, including distinct anthropogenic features (docks, roads, and buildings) and natural features, e.g., rocks, which can be used as control points in the absence of anthropogenic features. The SPOT5 panchromatic imagery of 2003 has a 2.5 m resolution with a common transverse Mercator projection and is taken as the reference image in this study. Georeferencing of other images was conducted in the Autosync Module of ERDAS IMAGING 9.2, with root mean square errors between 0.2–0.6 pixels. The Nearest-neighbor resampling was used to resample multi-spectral images of 2003 and 2011 in order to derive the fused high-resolution images. The auxiliary data used in this study area include the 2009 coastline vector map derived from real-time kinematic (RTK) global positioning system (GPS) technology (source: State Key Laboratory of Satellite Ocean Environment Dynamics, Second Institute of Oceanography, State Oceanic Administration, China) and the raster maps of a digital elevation model (DEM) in the 1980s (source: Zhejiang Administration of Surveying Mapping and Geoinformation, China).
3.2. Coastline Interpretation
Coastline is defined as the line between the mean high-water line and the shore [28]. To compare coastline changes, an appropriate shoreline proxy should be selected that can be identified on each image. Typically, coastline change studies utilize instantaneous coastline, at a uniformed vertical level, such as low- or high-water level as a proxy for coastline [14,17,29]. Boak and Turner [28] pointed out that the instantaneous coastline used by some investigators is problematic because it represents the position of the land-water interface at one instant in time rather than a “normal” or “average” condition. Recently, airborne light detection and ranging (LiDAR) data referenced to the statistically established tidal datum surface have been widely used to overcome the problems associated with the use of instantaneous coastline on images such as the shoreline proxy [30–35]. Unfortunately, the LiDAR-based data is not available for this study; therefore, the methods of coastline extraction from LiDAR are outside the scope of this research. Previous studies of coastline changes on atoll islands used the edge of vegetation as a proxy [18,36,37]. In China, the legal coastline is defined using the mean high water (MHW) as the reference tidal data [38], and this article adopts the MHW line as a proxy for island change analysis.
Currently, no classification of coast is widely accepted [39]. Most of the coastal classifications are designed for natural coasts, including rocky coasts, sandy/gravel coasts, and river coasts, while the classification of anthropogenic coast is limited. Walker [40] suggested artificial features, like dikes, seawalls, harbors, groins, jetties, and detached breakwaters that can be detected using high-resolution images. Rilo [41] considered several coastal classification categories using remotely sensed images, such as urbanized areas, industrial, port and airport facilities, and agriculture spaces. In this research, referring to previous research and the purpose of sea use, the island coastline is qualitatively further reclassified into nine types, namely, rocky coast, gravel coast, muddy coast, river coast, urban/industrial coast, harbor/port coast, shelter-farm coast, salt-field coast, and aquaculture coast. The coastline and coastal use types were mapped manually by the same person by combining GPS-derived coastline vector maps on high-resolution images according to the knowledge on the morphological features, vegetation, and coastal engineering characteristics (color, texture, and adjacency feature) [42]. Table 3 lists the definitions of coastline position of different types of coast. For the rocky and muddy coasts, the seaward edge of the vegetation was regarded as the coastline; for the gravel coast, a wave-deposited ridge was generally taken as the coastline; and for the river and artificial coasts, the road, bridge, dike, and seawall along the coast can be taken as the coastline.
3.3. Calculation of Rates
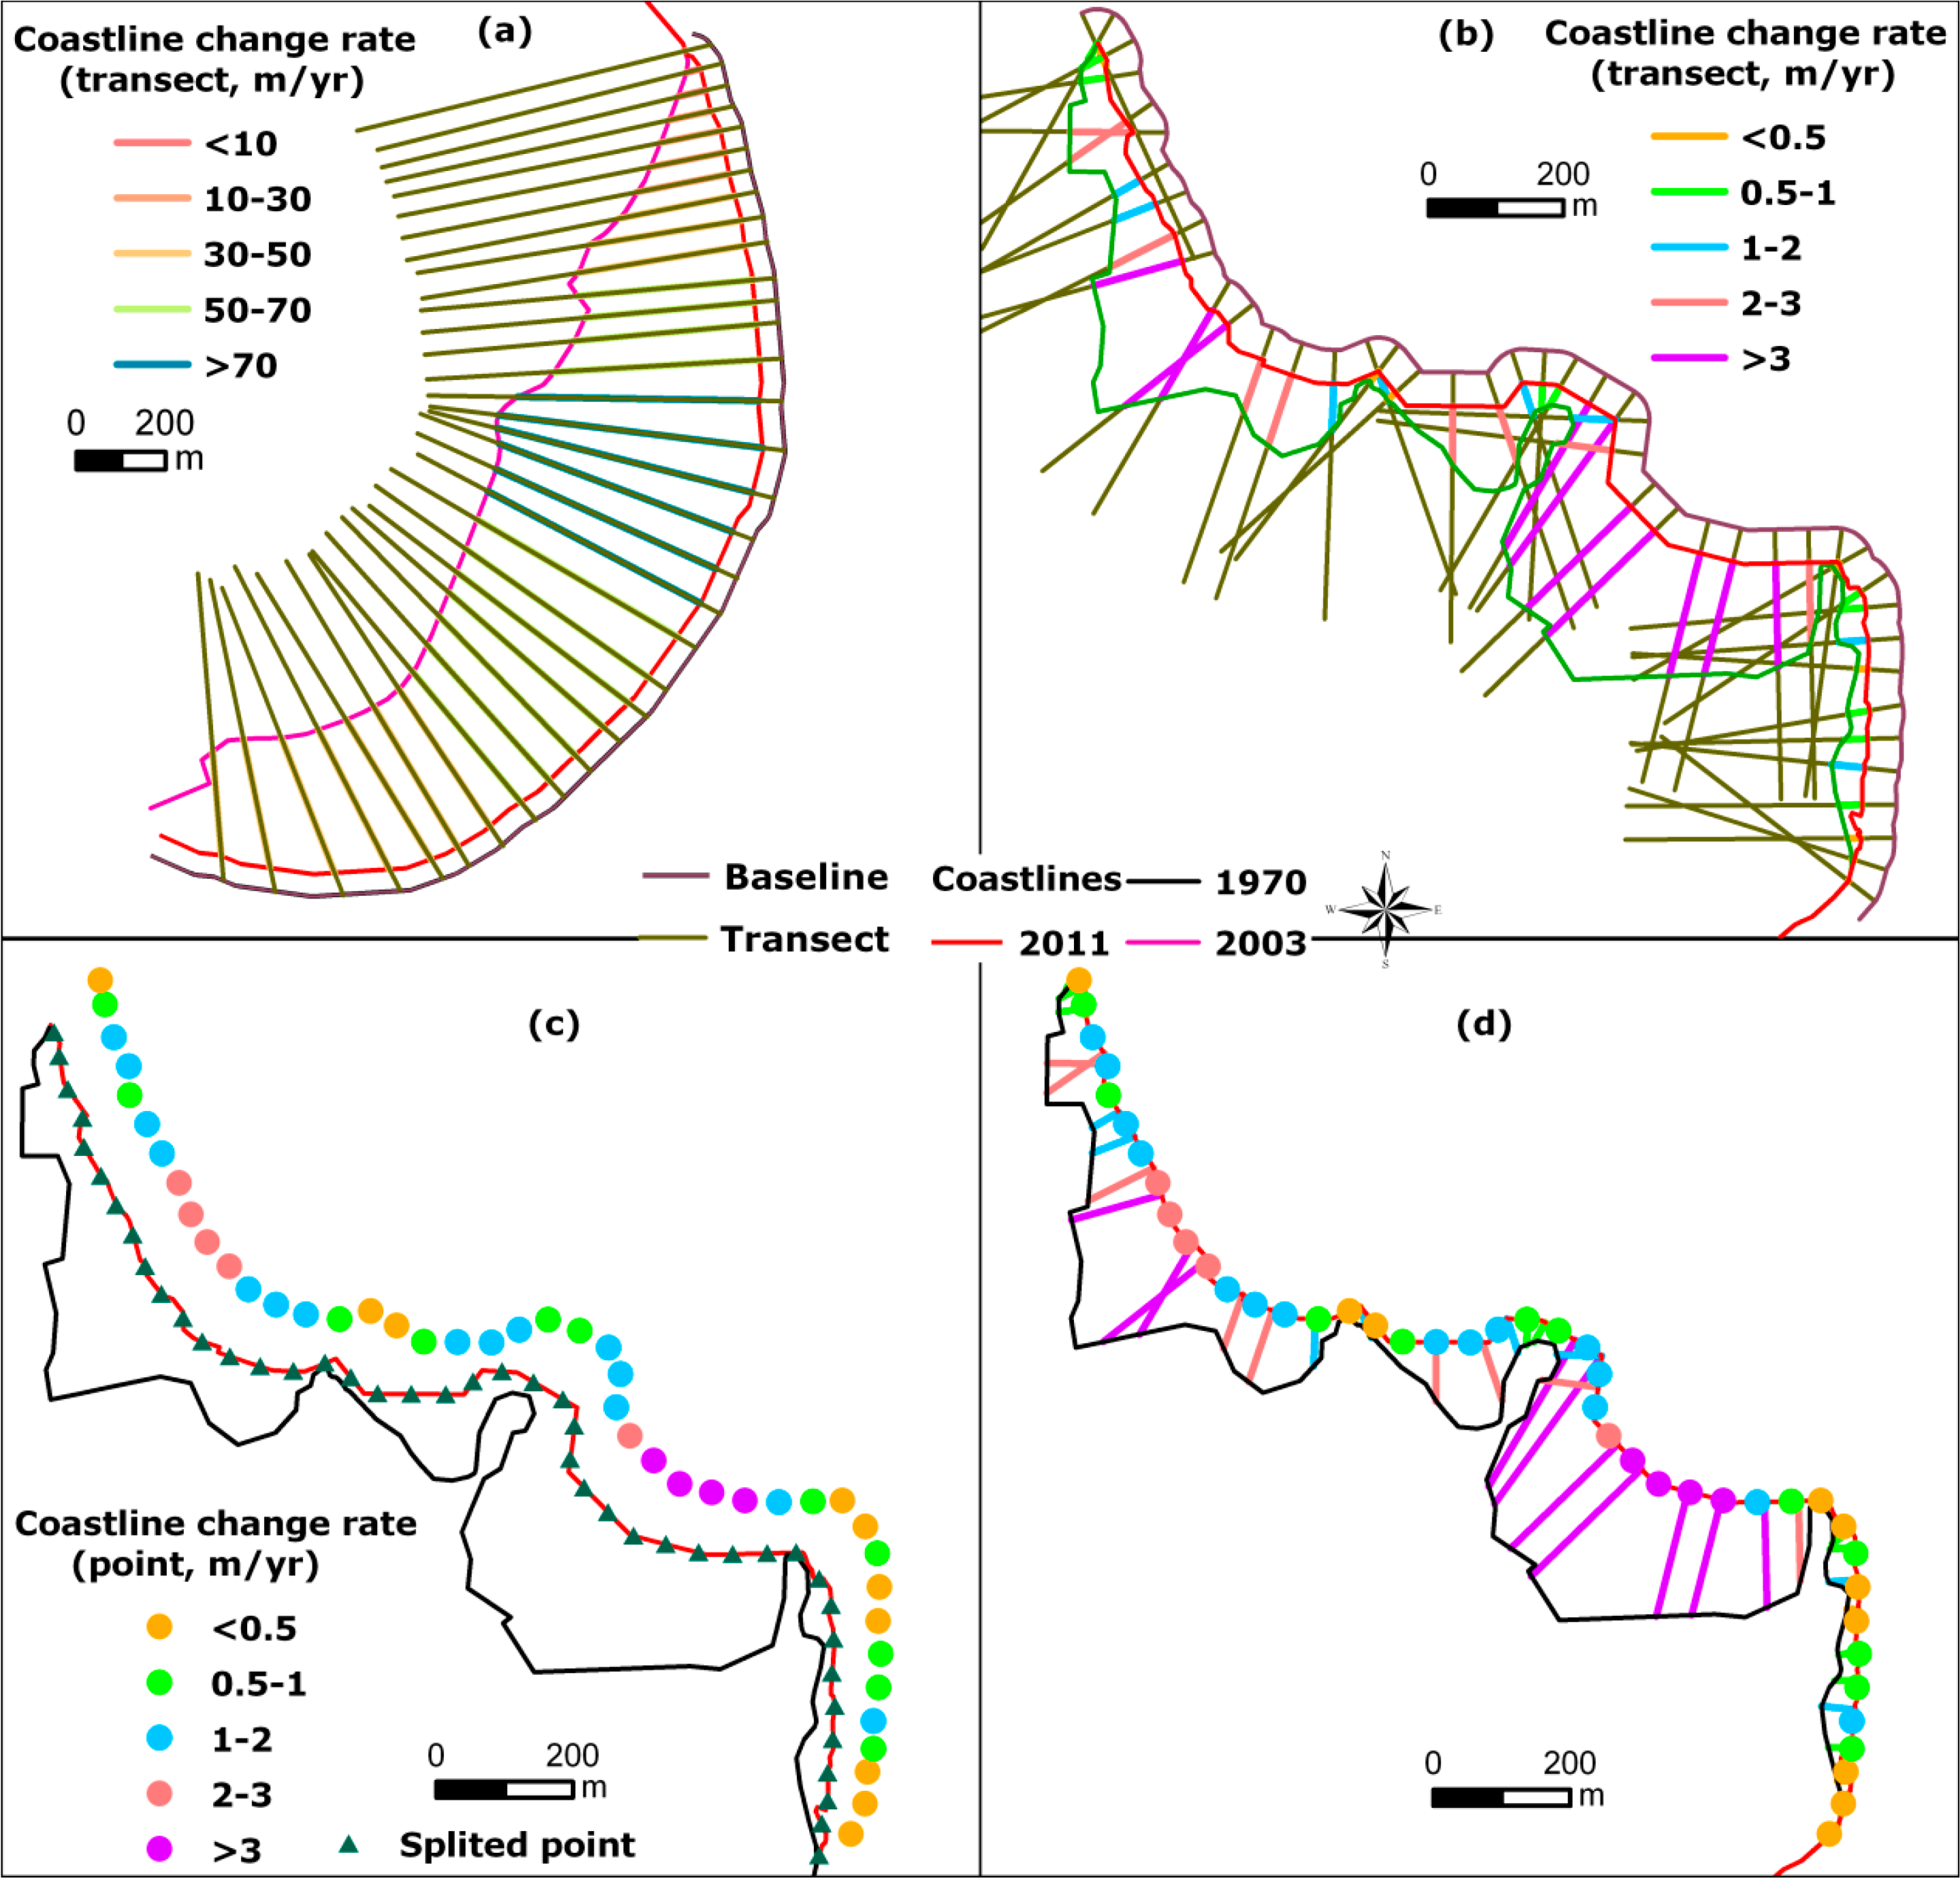
The rates of coastline change for different periods were calculated using the Digital Shoreline Analysis System (DSAS) 4.2 [43]. In the Zhoushan Islands, due to human intervention, the island coastline changed significantly over time, but the change was not spatially uniform. Thus, the coastlines mostly coincide with each other. This causes gaps in coverage alongshore, and most transects do not intersect any shorelines. Using the linear regression rate (LRR) for the rate calculation requires three or more shorelines; however, for the study area, the intersection threshold is two in most cases, which cannot satisfy the condition for using the LRR. Besides, the LRR is susceptible to outlier effects and tends to underestimate the change rate with respect to the end point rate (EPR). The EPR is calculated by dividing the distance of shoreline movement by the time elapsed between the oldest and the most recent shoreline [43]. In this study, the historical images acquired in 1980 and 1992 had higher coastline position errors compared to the other images of 1970, 2003, and 2011, and may not be suitable for using the LRR. The EPR has a minimal requirement of only two shoreline dates compared to the LRR [43] and is mainly chosen to compute the coastline change rate (Figure 2a) in this study. However, in the actual operation, the transects generated using the DSAS are also problematic when calculating the EPR along highly sinuous coastlines for the islands (Figure 2b). Figure 2c shows an example of the point-based method [13]. For the transects that are perpendicular to the sinuous coastline, there are dramatic angles, and the calculated EPR is larger than that calculated using the point-based method (Figure 2d). In this research, the point-based method was used to determine the change rate of complex shoreline shapes of the Zhoushan Islands. The confidence of EPR (ECI) [43] is calculated using Equation (1). The total coastline position error at each point in time (Et) was calculated using the errors of the georeferencing error (Eg) or the digitizing error (Ed) [29] plus the pixel size (Ep) using Equation (2). In the study area, the uncertainties of the EPR for the periods of 1970–1992, 1992–2003, 2003–2011, and 1970–2011 are ±1.06, ±2.04, ±1.02, and ±0.17 m/year, respectively.
4. Results
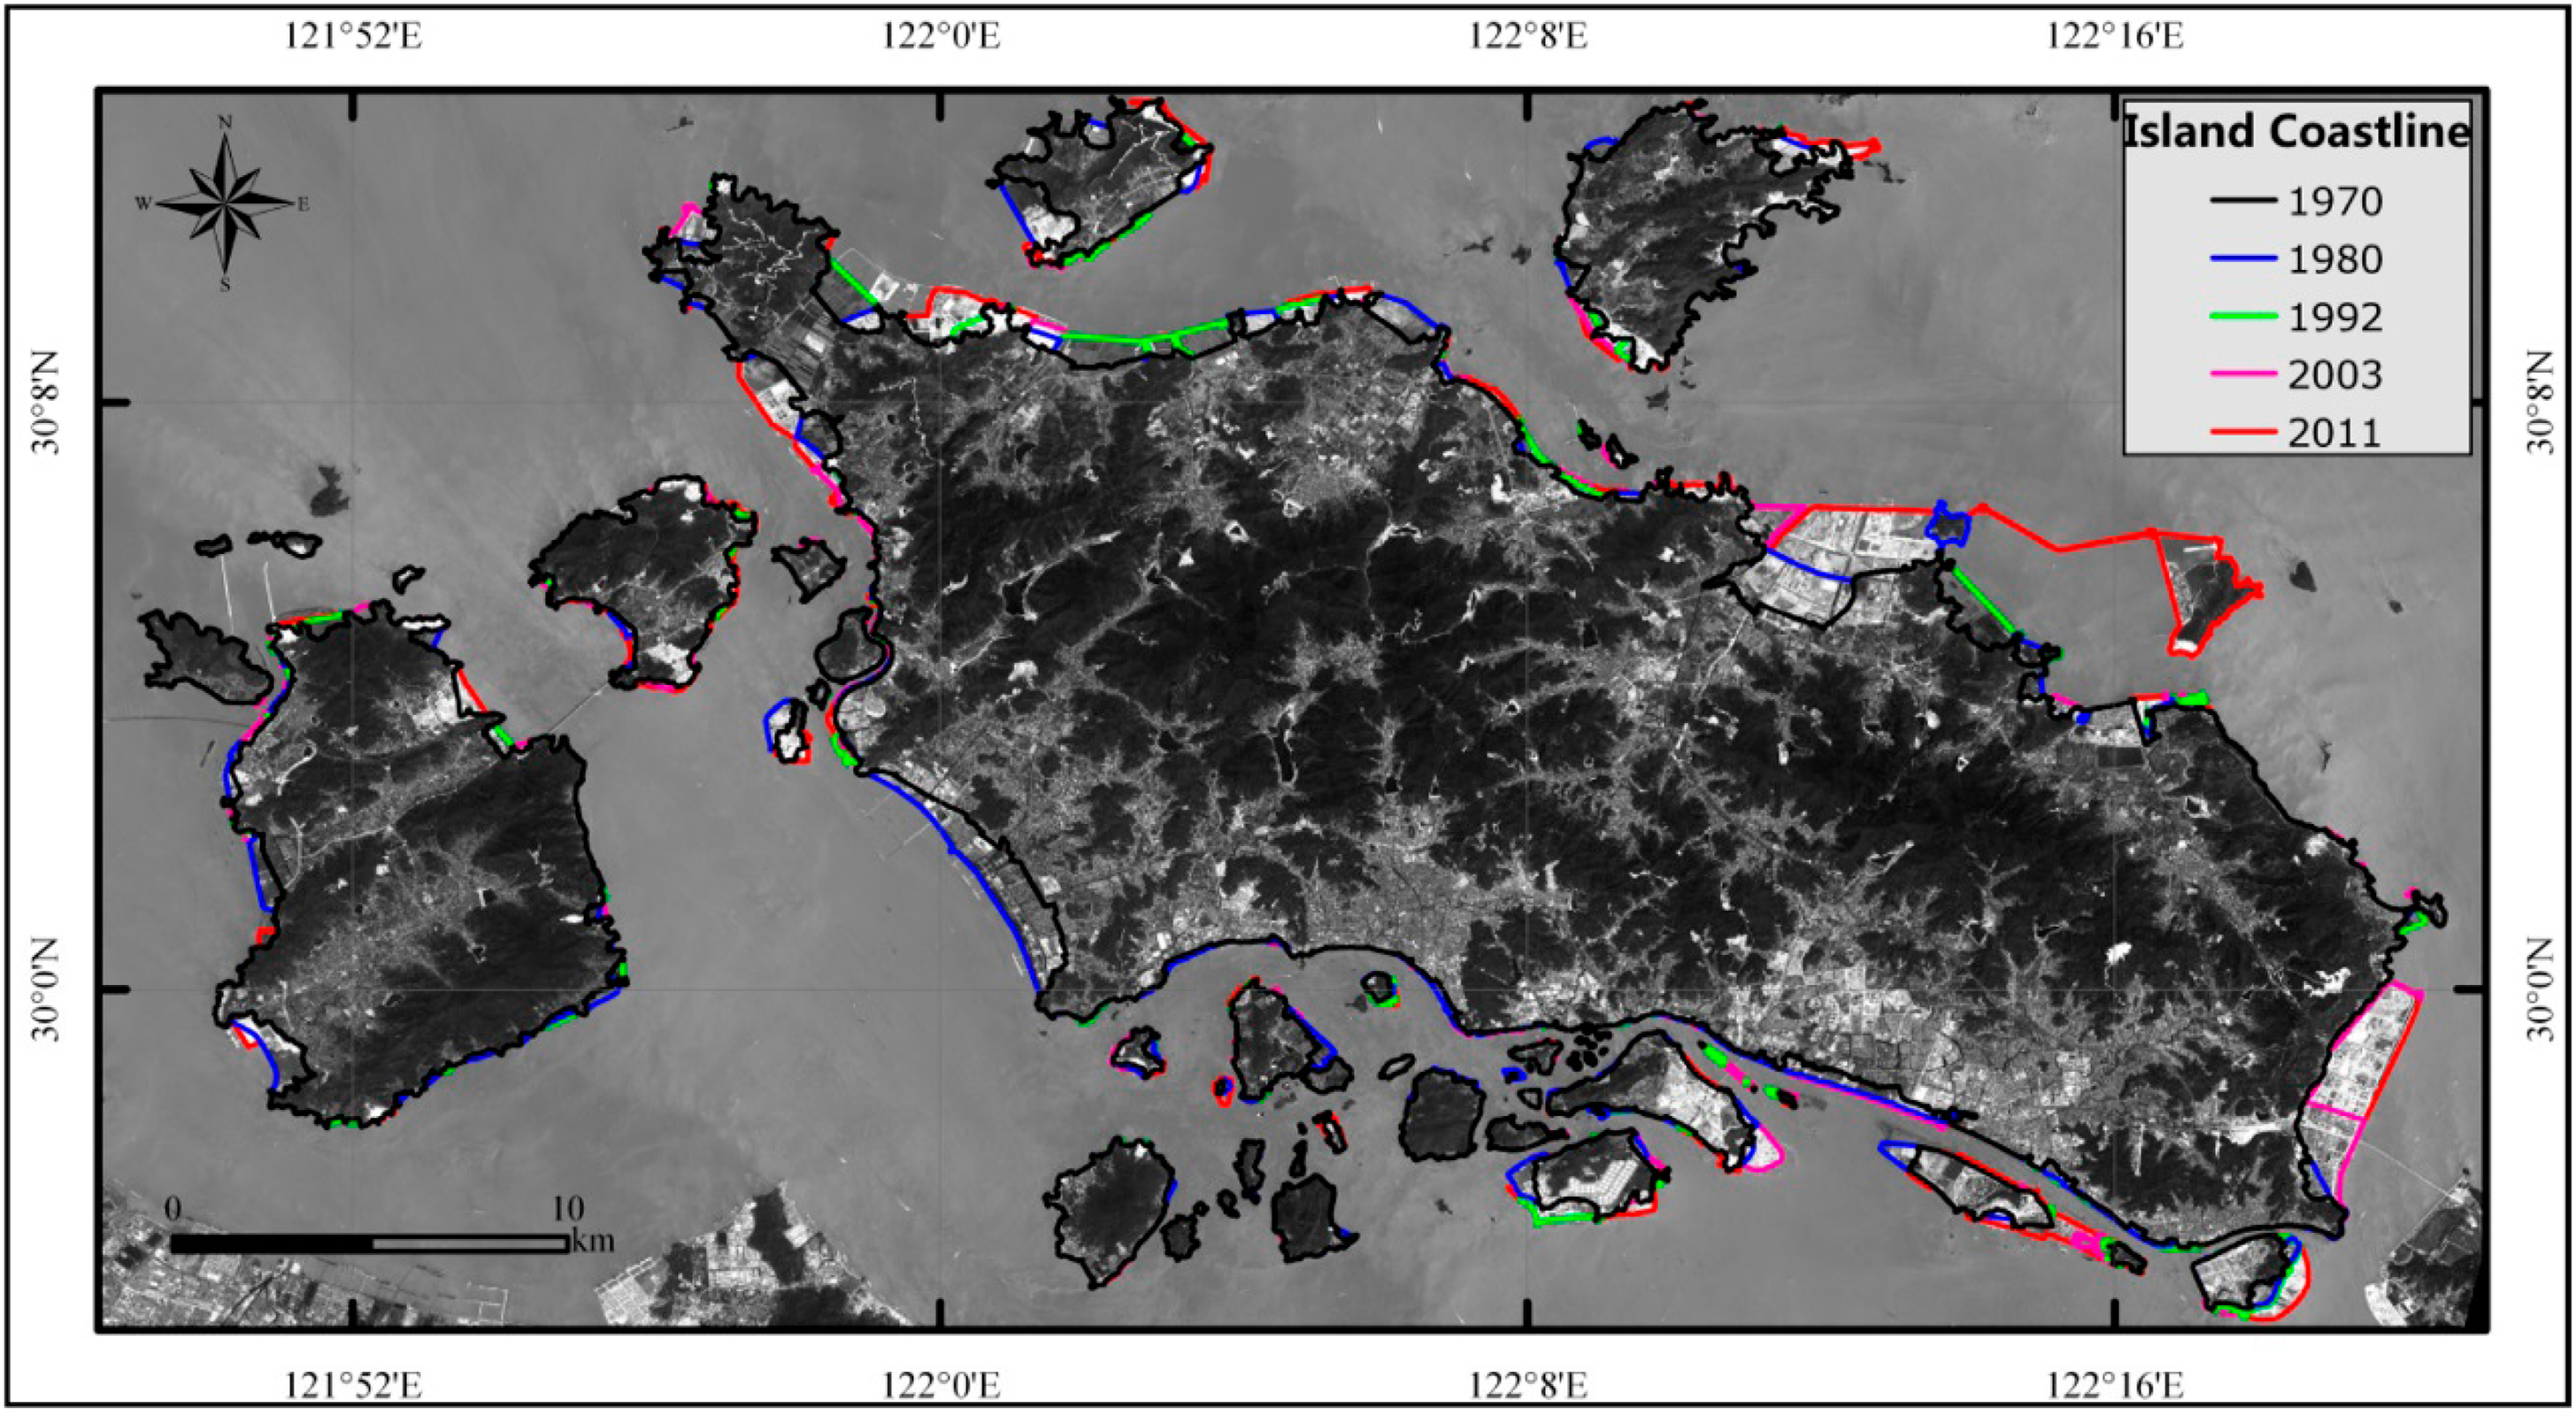
The coastline positions for the study area from 1970 to 2011 are shown in Figure 3. Generally, the changes of coastline position are distributed in island bays where rich tidal flats exist, e.g., Baiquan and Donggang New Area in Zhoushan Island, as well as Changbai Island and Aoshan Island. Also, the connection between two islands significantly changed the coastline morphology, as in the case of Xiaogan Island and Mazhi Island as well as of Lianghengshan Island and Zhoushan Island.
4.1. Rates of Coastline Change of Major Islands
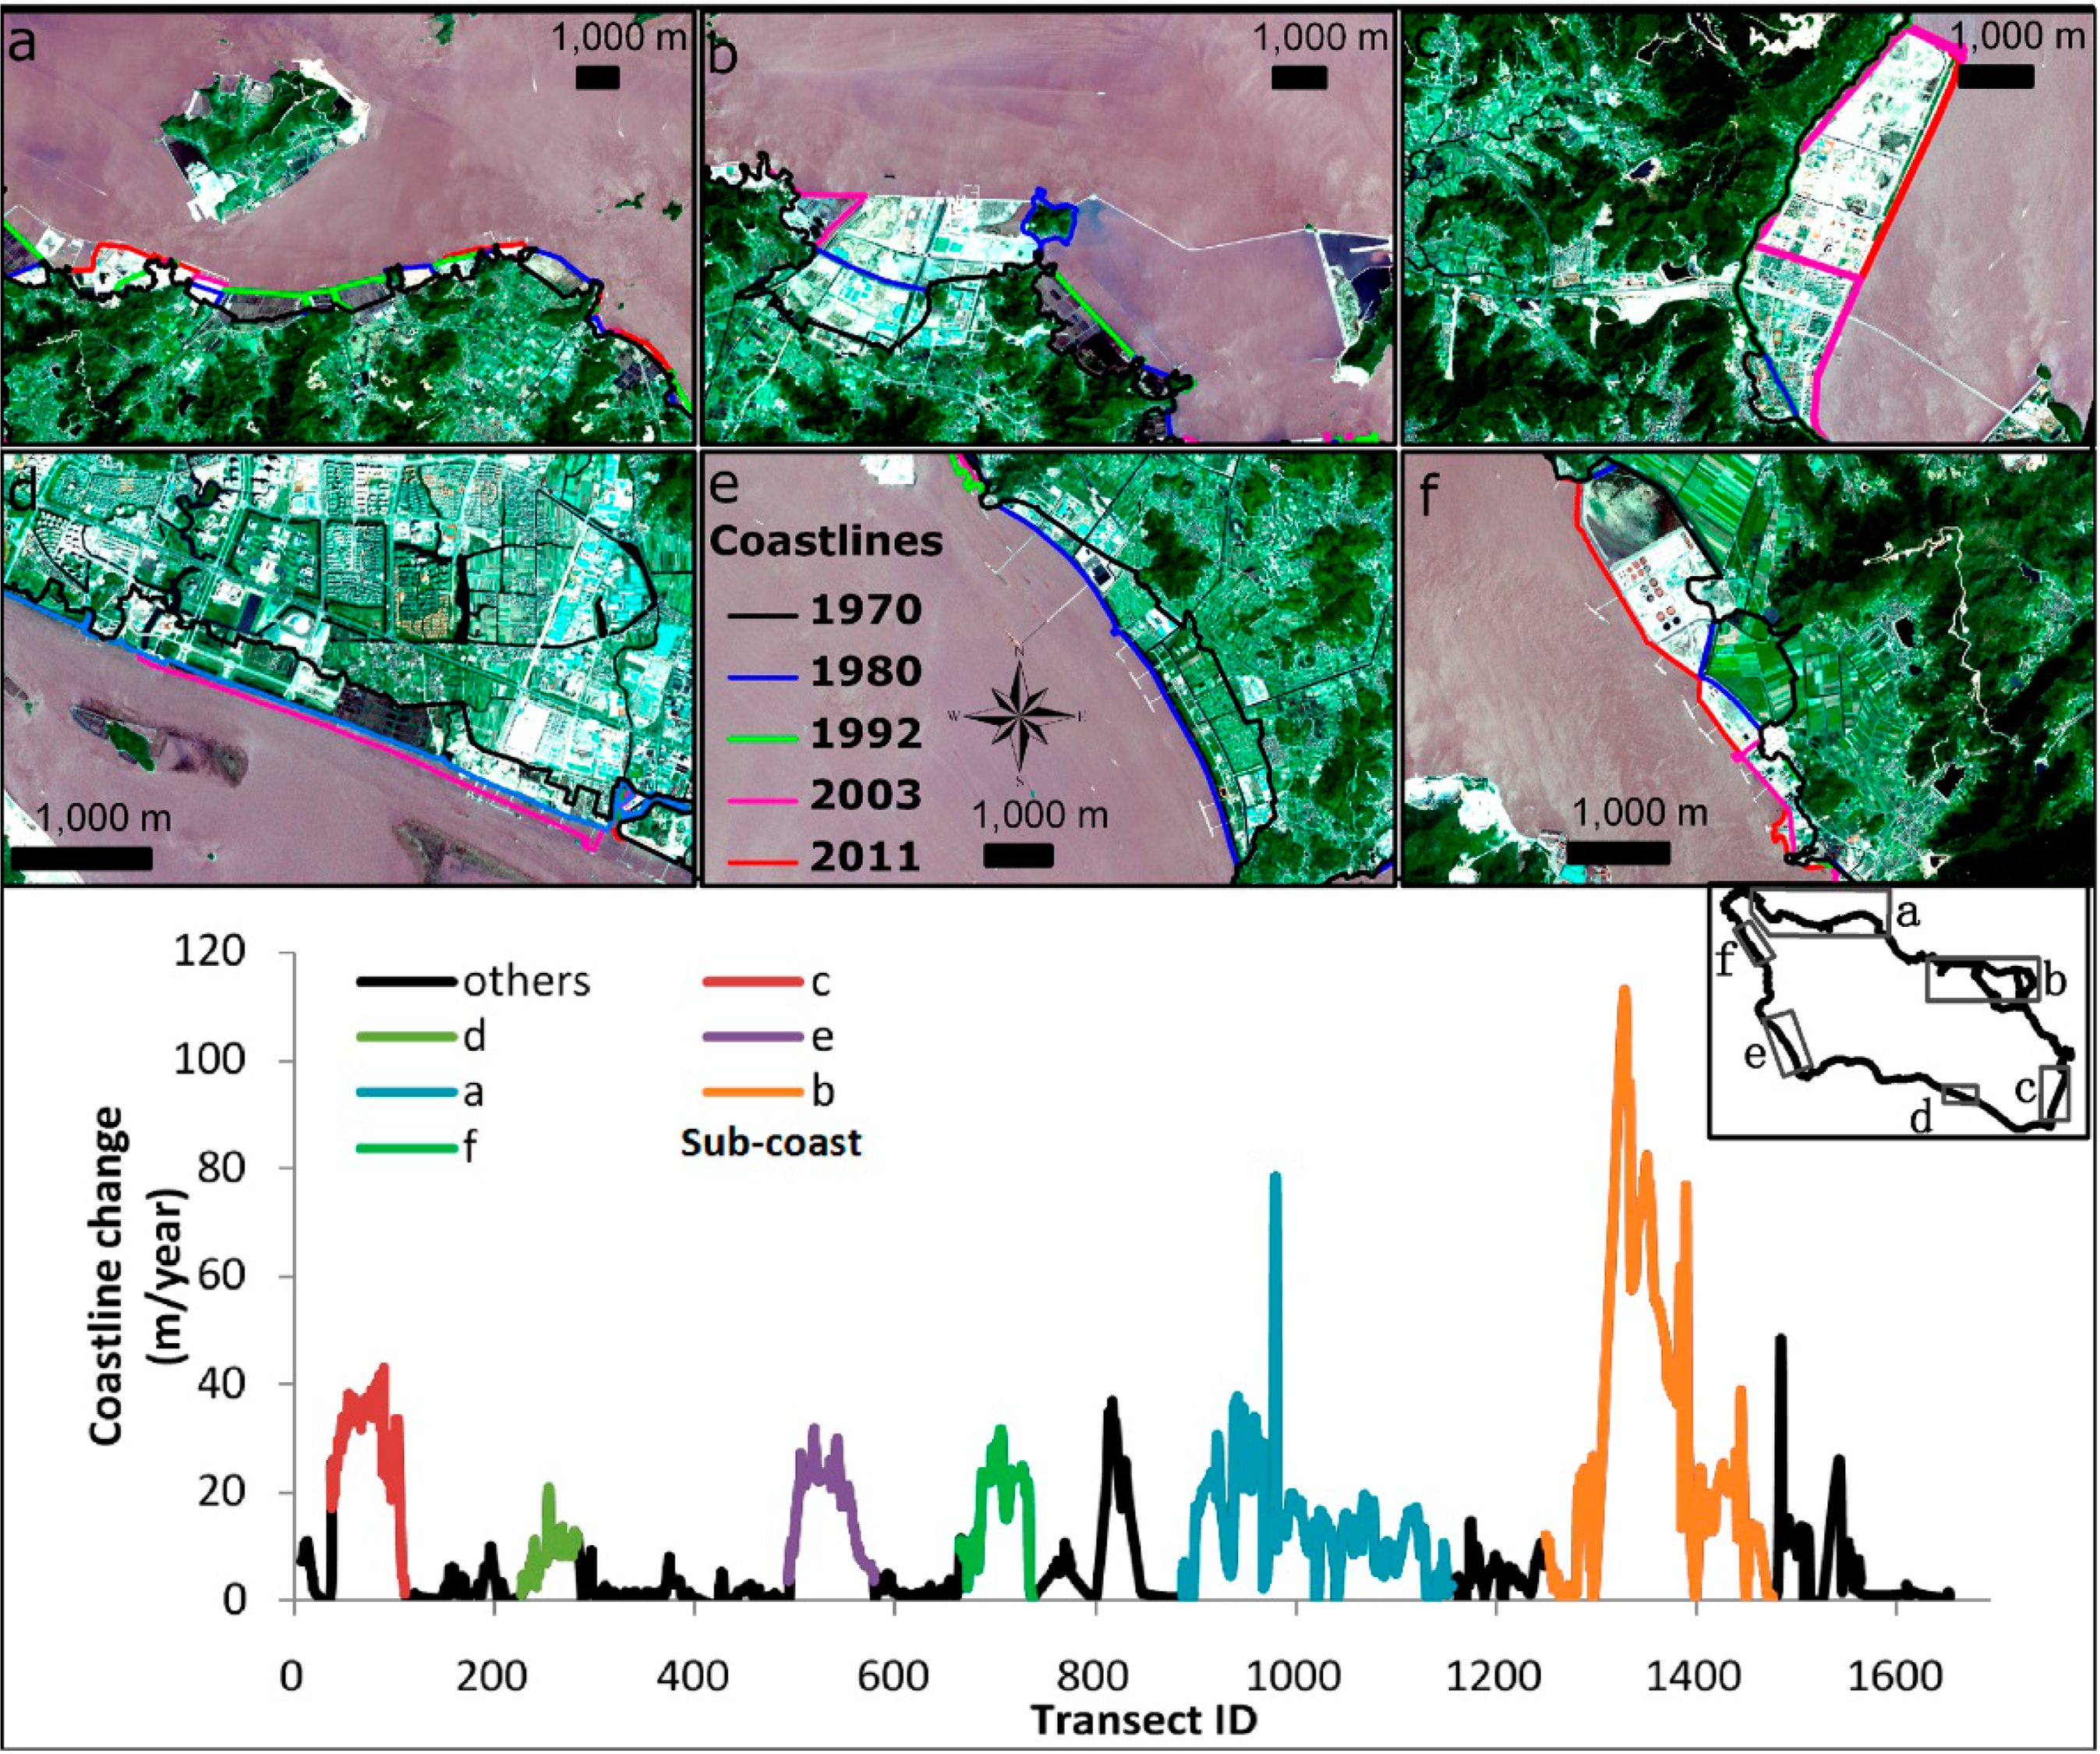
Figure 4 shows the coastline change rates from 1970 to 2011 in Zhoushan Island along different transect points. Among them, the Baiquan New Port Industry District (Figure 4b) has the maximum coastline change rate of 112.16 ± 0.17 m/year, followed by the North of Xiaosha Town (Figure 4a), with 78.25 ± 0.17 m/year for the maximum change of position. Donggang New Area (Figure 4c) has a mean coastline expansion rate of 30.00 ± 0.17 m/year. Shuangqiao Lingang New Area (Figure 4e) is a semi-sheltered sea area, facing the Cezi Channel, with the mean coastline change rate of 17.1 ± 0.17 m/year. To develop petroleum industry and ports, the coastline position of the Midwest of Cengang Town (Figure 4f) was greatly changed, with an average coastline change rate of 16.9 ± 0.17 m/year. Compared to other segments, the Lincheng New Town (Figure 4d) had the lowest coastline expansion rate of 9.50 ± 0.17 m/year.
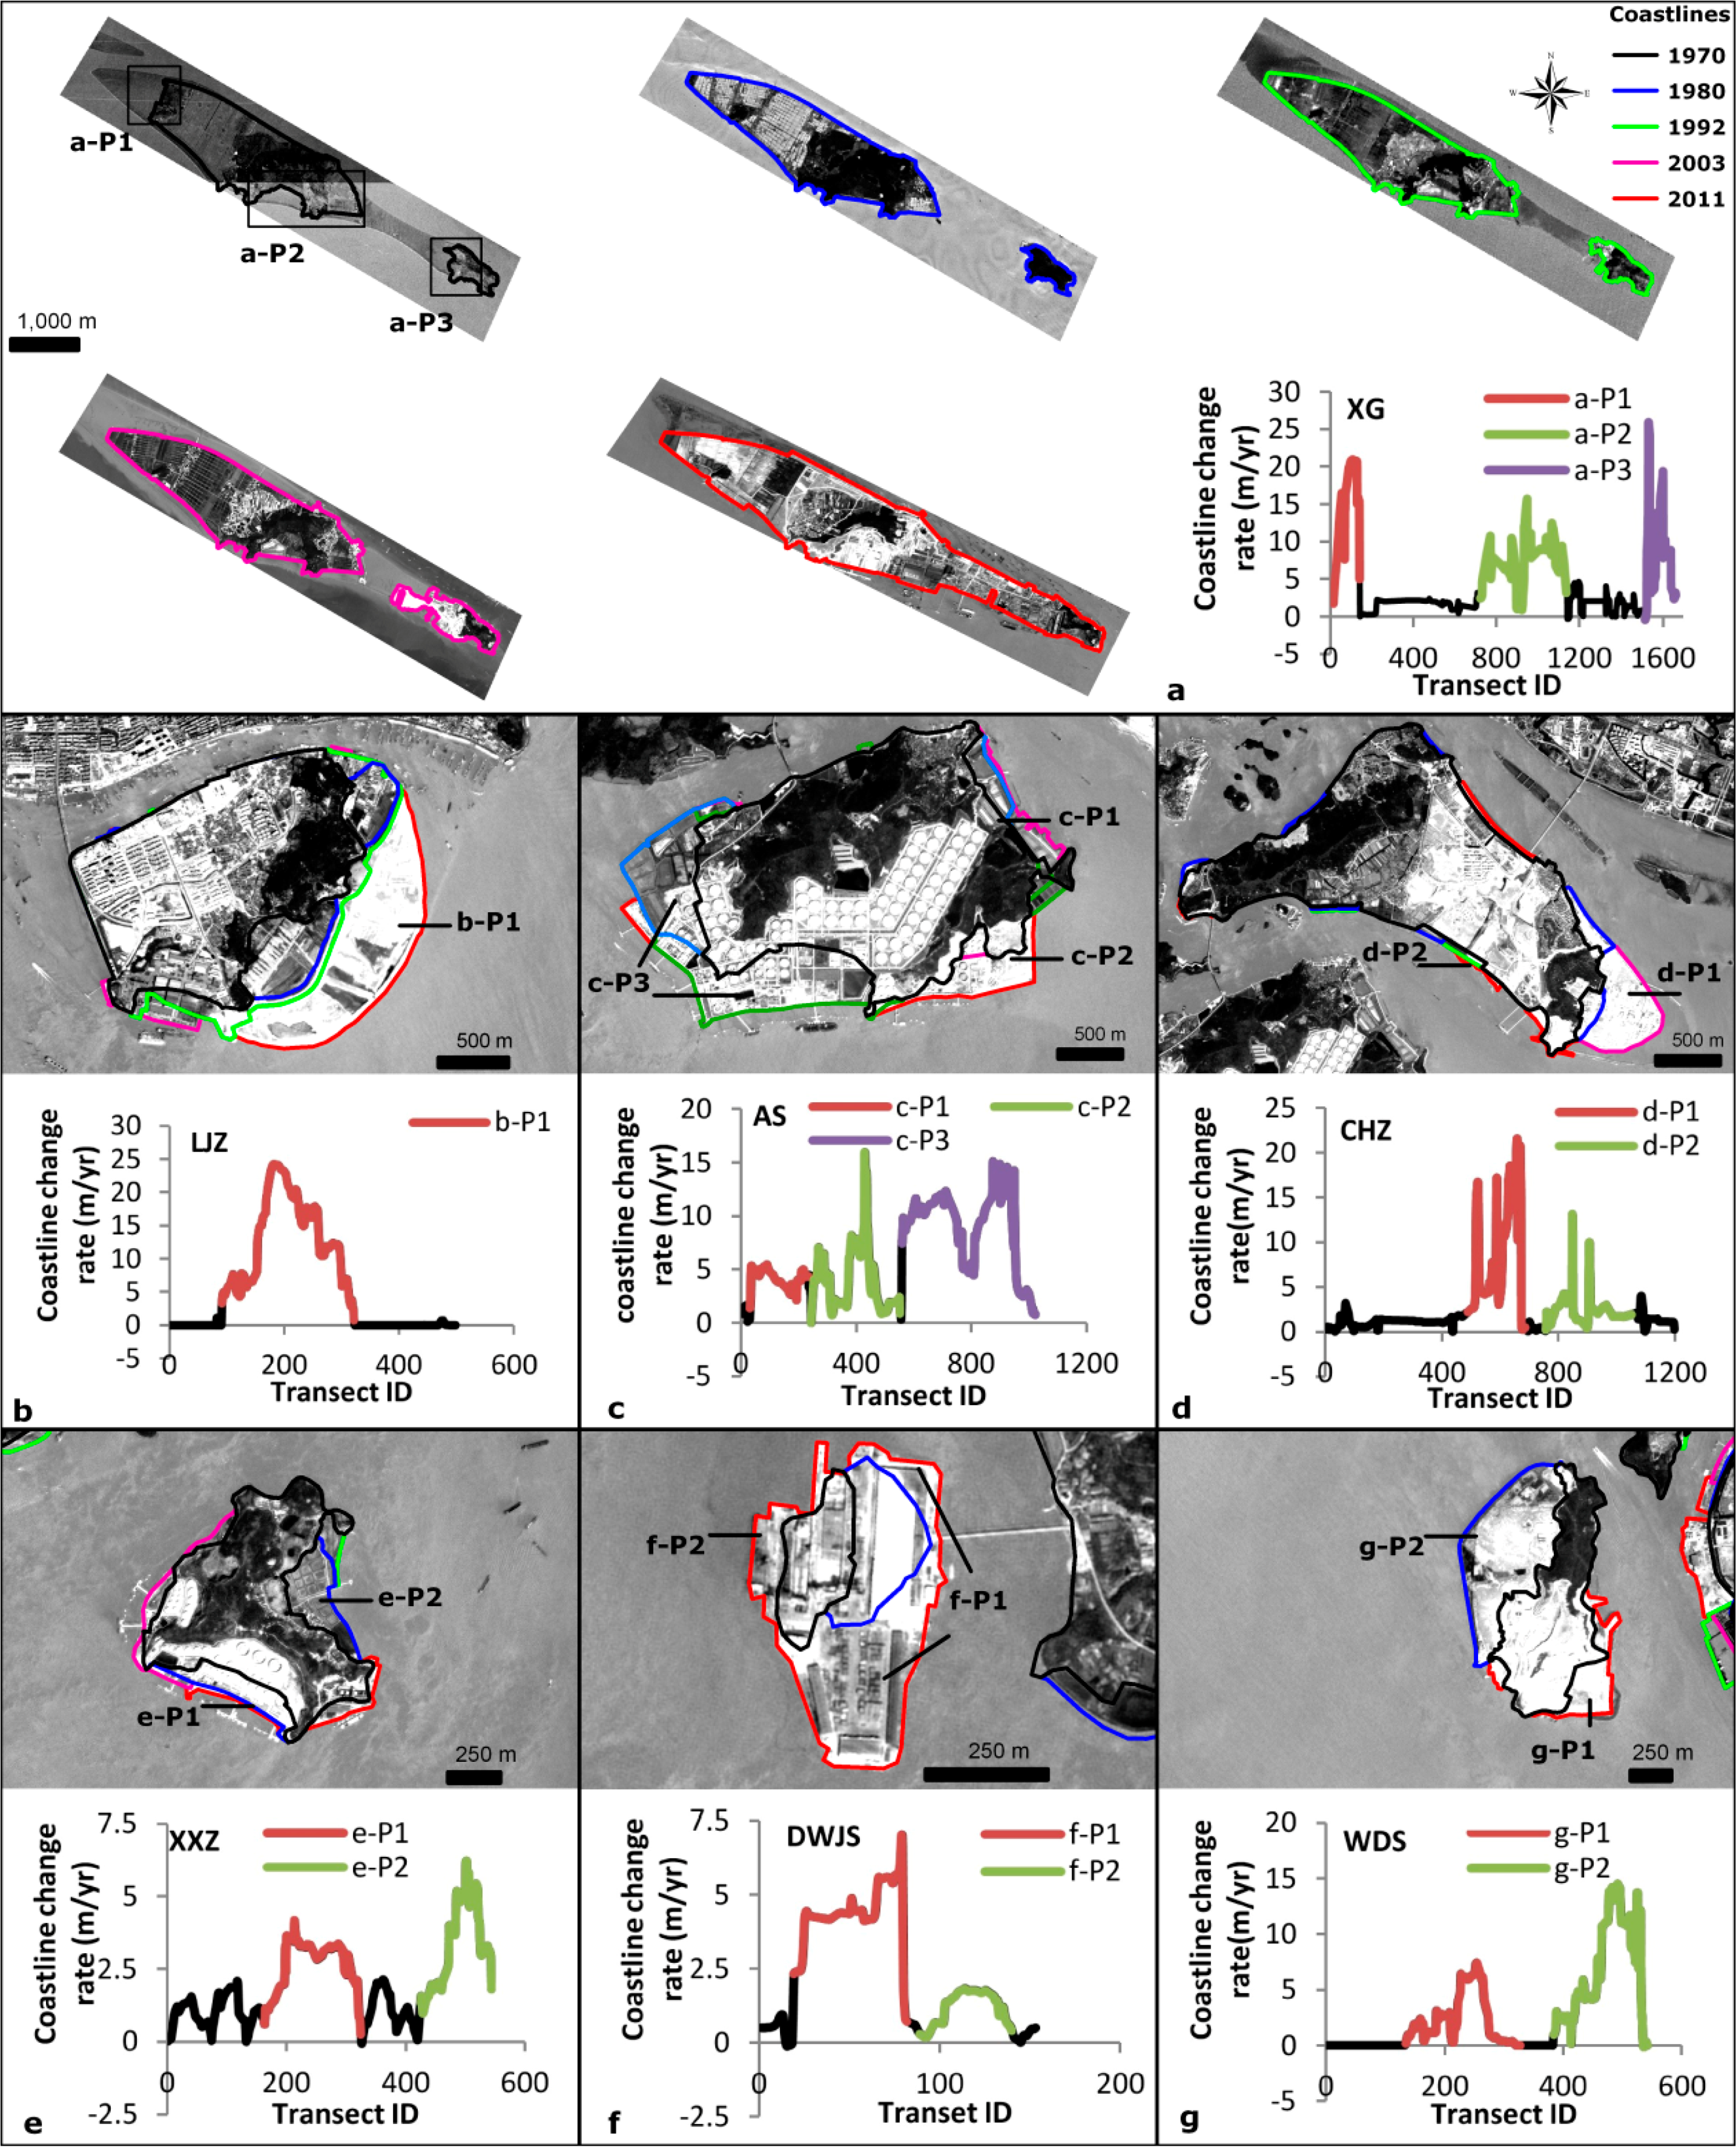
The surrounding islands also have experienced enormous change rates since 1970 (Figure 5). For Xiaogan-Mazhi Island (XG), the northwest coast of Mazhi Island had the largest change rate, reaching 25.90 ± 0.17 m/year. By 2011, the two islands merged into Xiaogan Island. Both of Lujiazhi Island (LJZ) and Changzhi Island (CHZ) expanded toward the southeast with the maximum change rate reaching 24.23 ± 0.17 and 21.59 ± 0.17 m/year, respectively. For Aoshan Island (AS), it extended in nearly all directions, with the maximum change rate reaching 15.88 ± 0.17 m/year. For Xixiezhi Island (XXZ), it mainly accreted toward the east, with the maximum change rate reaching 6.23 ± 0.17 m/year, while Waidiaoshan Island (WDS) accreted toward the west, with the maximum change rate reaching 14.52 ± 0.17 m/year. Waidiaoshan Island was originally a long and narrow north-south bedrock island, and has expanded into an oval-shaped island since 1980. Dawangjiaoshan Island (DWJS) mainly expanded toward the east and south, with a maximum change rate of 6.94 ± 0.17 m/year.
The coastline change rates of major islands during different periods are shown in Table 4. Nearly all inhabited islands show noteworthy seaward expansion of the coastline (percentage of increased area is between 0.43% and 386.49%). Compared to the surrounding islands, Zhoushan Island was listed as having the greatest annualized rate (12.83 ± 0.17 m/year) as well as the greatest seaward movement (513.23 m), followed by Lujiazhi Island (5.57 ± 0.17 m/year), Xiaogan-Mazhi Island (4.65 ± 0.17 m/year) and Aoshan Island (4.28 ± 0.17 m/year) from 1970 to 2011. The coastline change rates of the smaller islands of Dawangjiaoshan and Waidiaoshan were larger than those of the larger islands of Jintang, Xiushan and Cezi, while the coastline change rates of the larger islands of Damao, Dongjudao, and Zhairuoshan were smaller than those of the smaller islands of Dawangjiaoshan and Waidiaoshan during the same period. The coastline change rates for the islands of Lidiaoshan, Tuanjishan, and Fuchidao were smaller than 0.25 ± 0.17 m/year. Generally, the period of 2003–2011 experienced a larger coastline change rate compared to the periods of 1970–1992 and 1992–2003. However, for the islands of Aoshan, Panzhi and Dongjudao, the period of 1970–1992 had the largest coastline change rate, and for the islands of Changzhi, Zhairuoshan, Lidiaoshan, and Fuchaidao, the period of 1992–2003 had the largest coastline change rate.
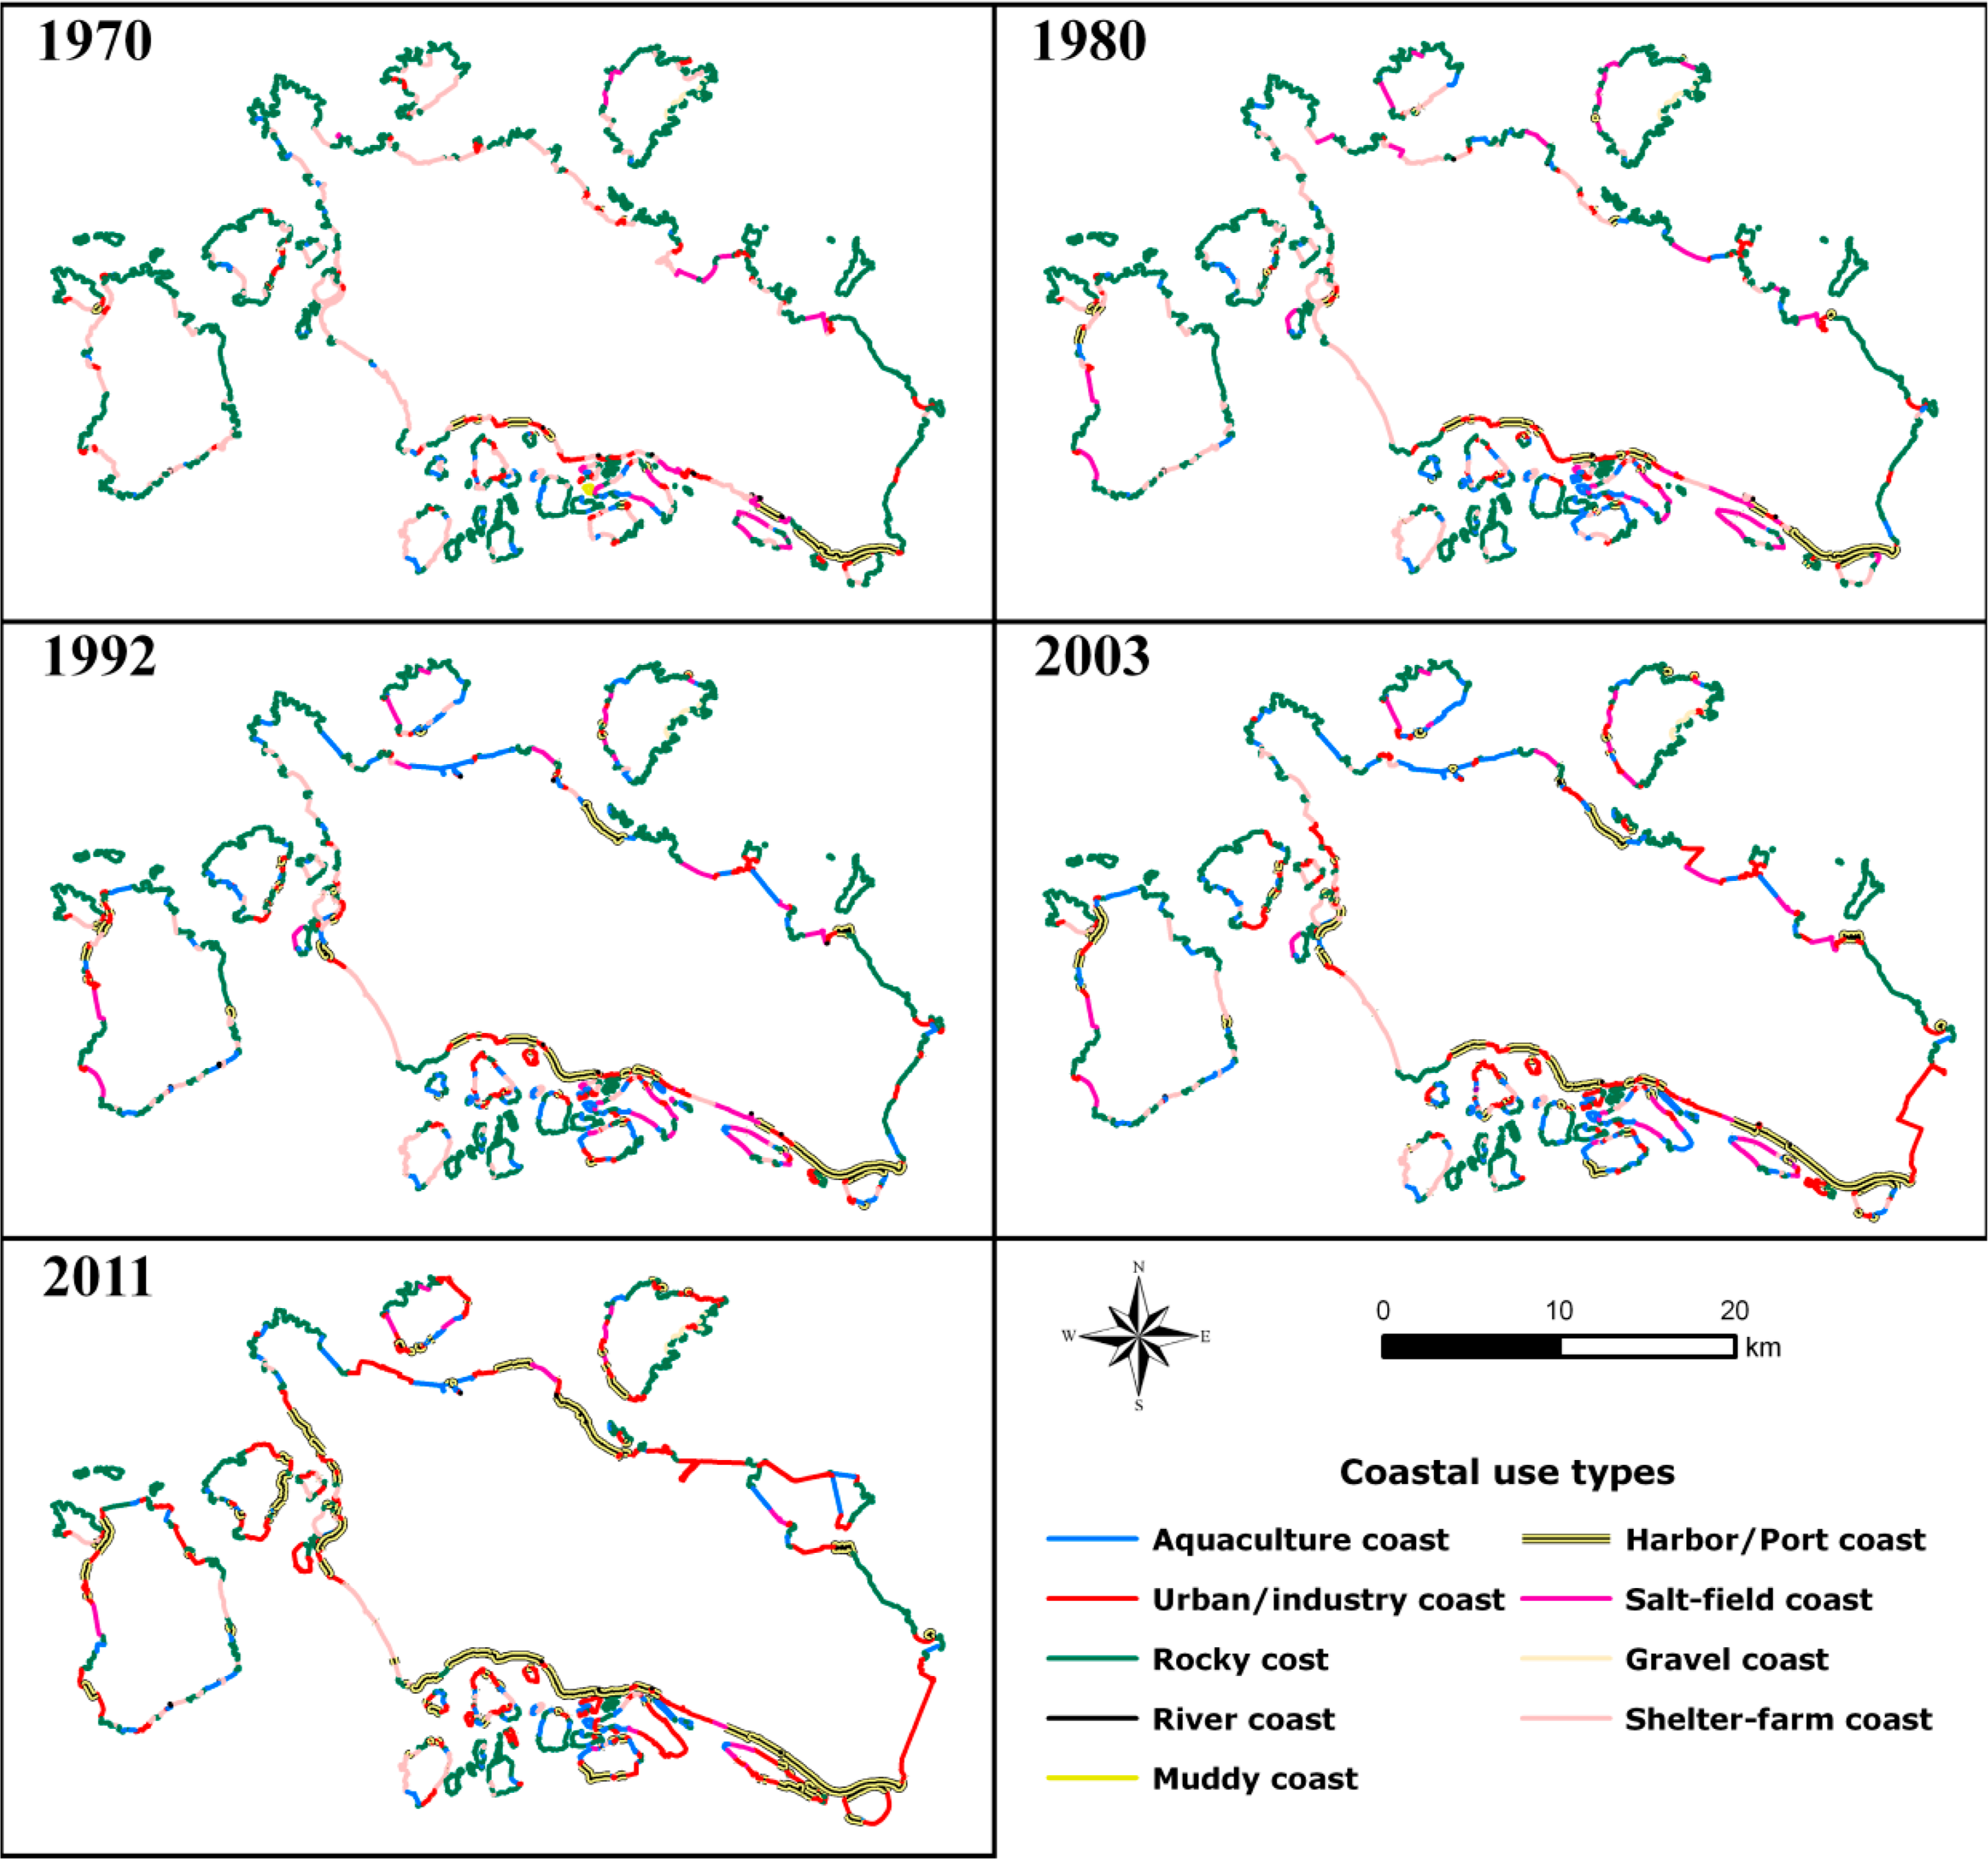
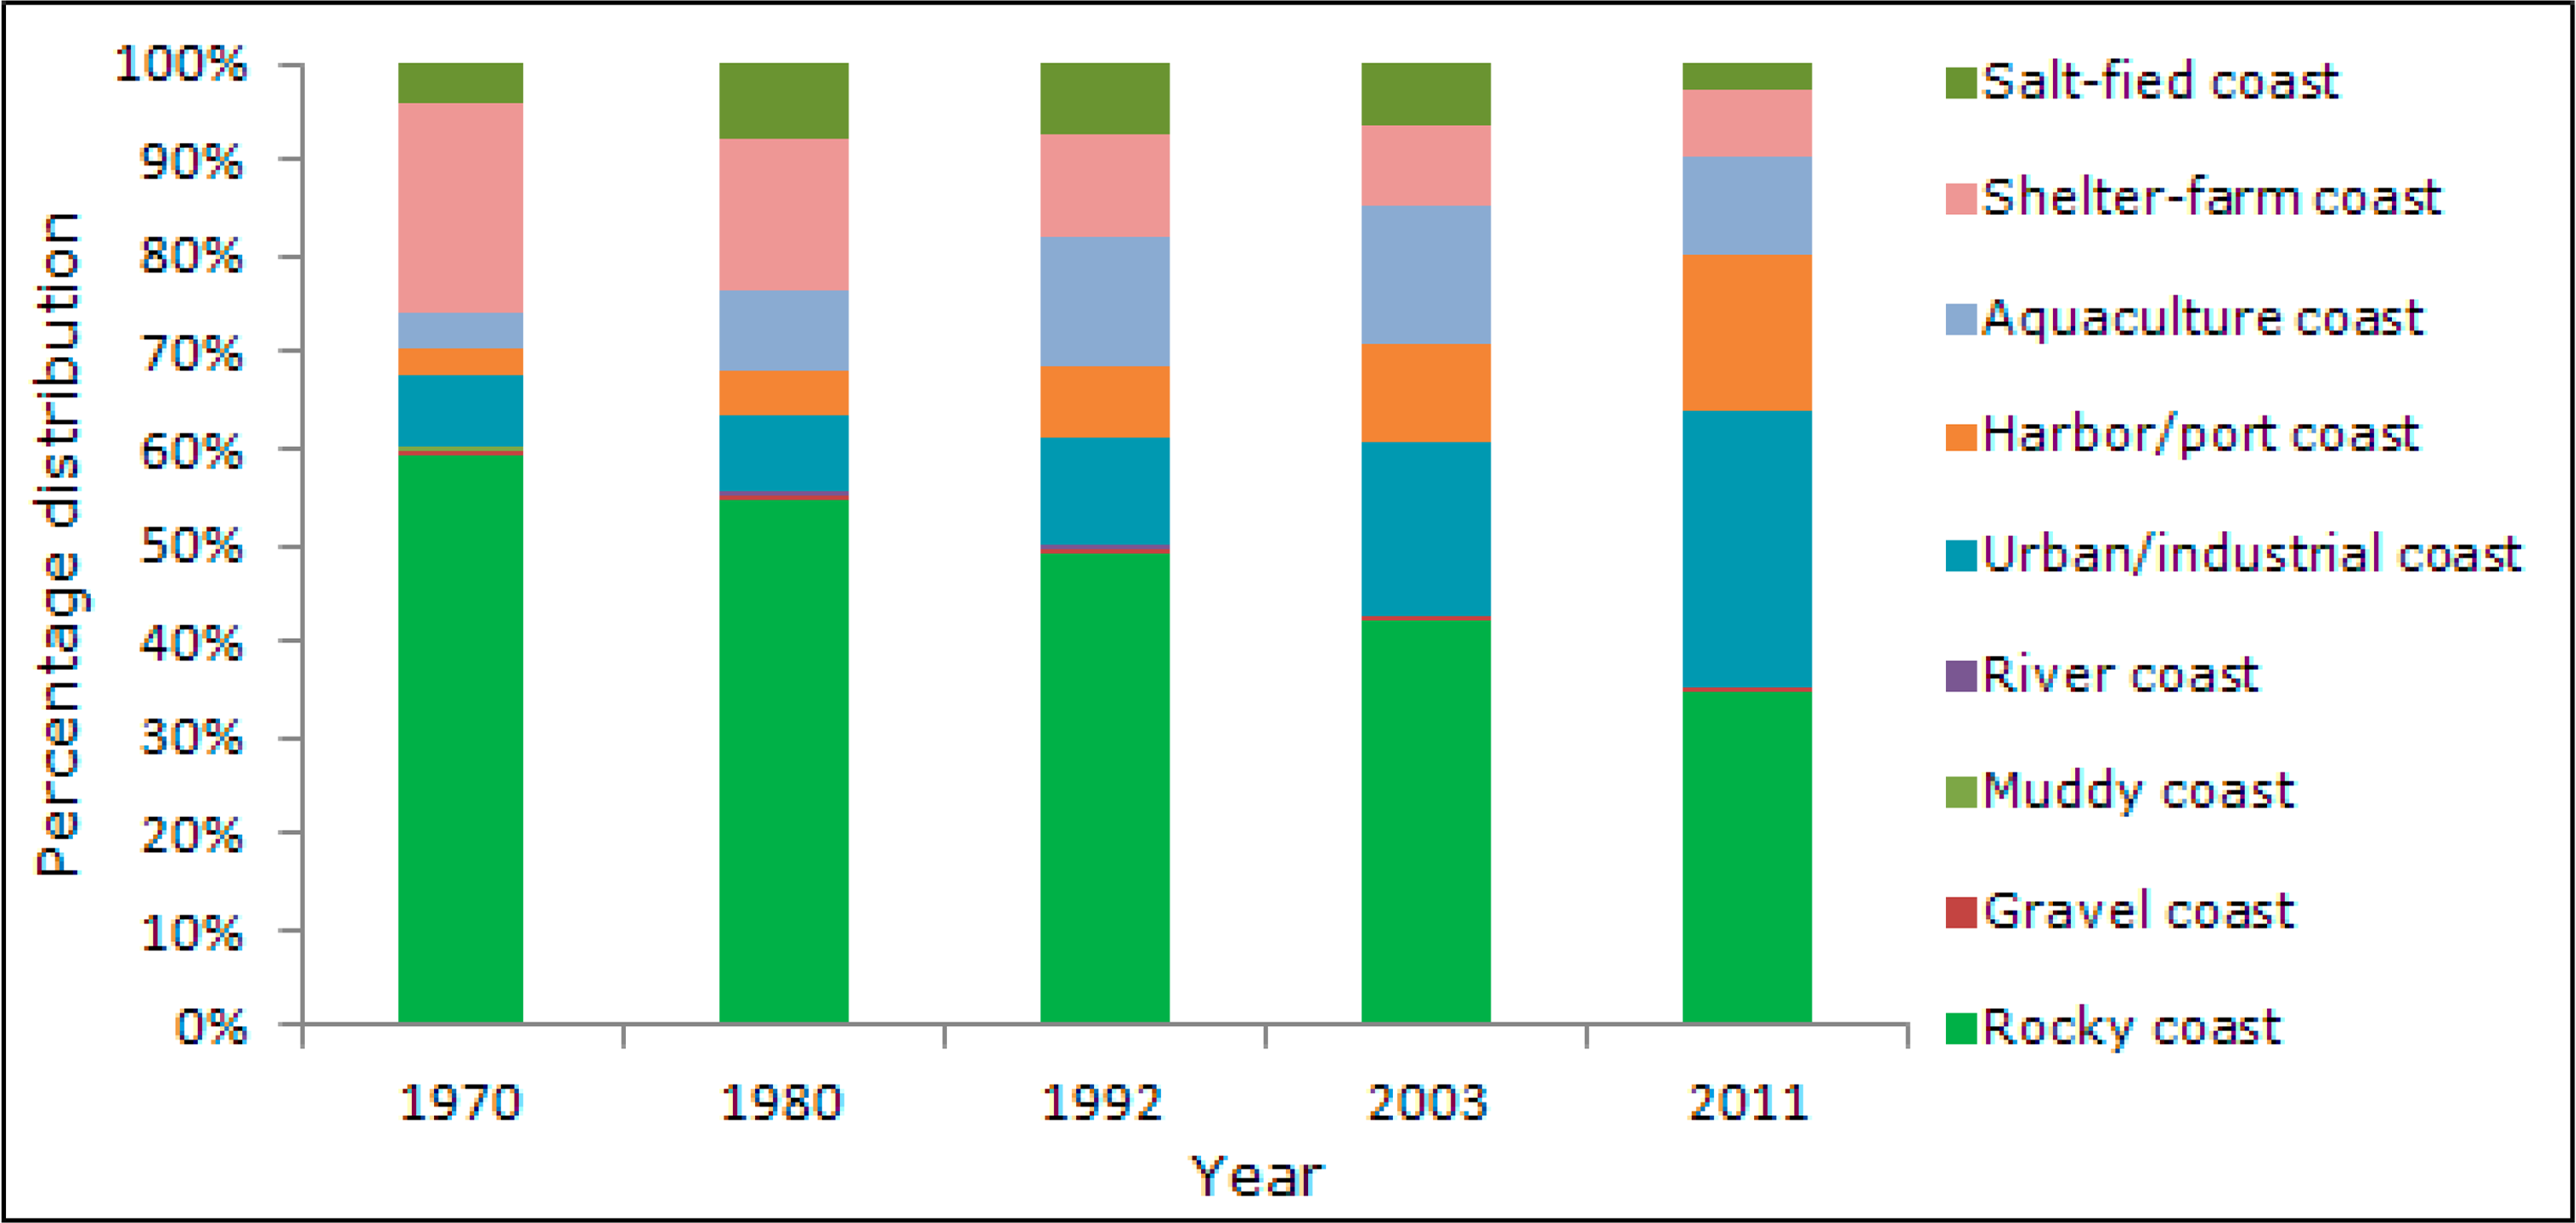
4.2. Observed Types of Coastal Use
The coastal use types from 1970 to 2011 are shown in Figure 6. Human intervention on the coast changed a sinuous rocky coastline to a straight artificial coastline, including the aquaculture coast, the urban/industrial coast, and the harbor/port coast. Overall, the natural coastline showed a pronounced reduction, while the artificial coastline had a rapid increase, especially after 1992 (Figure 7). A total of 46.85% of the natural coastline was changed to artificial coastline through constructions of causeways and roads, and through reclamation for residential, commercial, and industrial activities during 1970–2011. Since 2003, the study area has been dominated by the artificial coast (Figure 7). The proportion of artificial coastline accounts for 64.78% in the study area and is higher than the average in China of 57.55% in 2012 [44]. The most notable change was the harbor/port coast, increasing from 2.97% in 1970 to 16.22% in 2011 of the total coast, followed by the urban/industrial coast, increasing from 7.26% to 28.77%. The shelter-farm coast and rocky coast have shrunk by 68.49% and 41.85%, respectively, compared to those in 1970. The aquaculture coast showed a big increase from 3.42% in 1970 to 13.34% in 1992, and then experienced a slower increase from 1992 to 2003; however, the aquaculture coast had a decrease of 10.01% in 2011 due to increasing coastal industries. This is different for the salt-field coast, which had a fairly big increase from 1970 to 1980, and then showed a downward trend. In 2011, the salt-field coast decreased to 2.86%. The river coast generally showed a downward trend, while the gravel coast (mainly in Xiushan Island) showed no significant change over time. The gravel coast in the study area generally consists of rocky coast beaches, often protected by adjacent rock headlands and/or rock outcrops, or by rubble deposits nearshore [2].
5. Discussion
5.1. Drivers for Spatiotemporal Variability of Coastline Changes
As stated earlier, Zhoushan Island and its surrounding islands exhibited a great variety of coastline evolution trends in terms of spatial and temporal structures. Amongst these islands, Zhoushan Island (the main island) has shown the largest seaward movement (12.83 ± 0.17 m/year) during the past four decades (Figure 4, Table 4). Since 2000, the policy of “constructing the major island and emigrating from minor islands” has been proposed by the local government to prevent typhoon disasters and share infrastructure among islands, i.e., electricity, water, and transportation. This policy might have contributed to the rapid seaward movement of Zhoushan Island. Besides, the coastline accretion varied among surrounding islands (Figure 5, Table 4). Among the smallest islands, Dawangjiaoshan had a larger coastline change rate (3.06 ± 0.17 m/year) than the second largest island of Jintang (2.13 ± 0.17 m/year), while the larger island of Damao had a smaller coastline change rate (0.58 ± 0.17 m/year) than other smaller islands of Aoshan, Panzhi, Xiaogan-Mazhi, Lujiazhi, Xixiezhi, Dawangjiaoshan, Waidiaoshan, etc. Comparing Table 1 and Table 4, we found that the islands with larger rates of coastline change generally functioned as port logistics, urban extensions of Dinghai District and Putuo District, as well as harbor industry, while the islands with smaller rates of coastline change during the past four decades generally functioned as marine tourism and marine research. Relative to the islands that functioned as marine tourism and marine research, the islands functioning as port logistics or harbor industry might have suffered from faster development under human influence. Due to differences in location, geomorphology, and population among these islands, they had different urban expansions [24]. In the late 1980s, the Chinese government proposed and started to organize the National Marine Functional Zoning Plan. In this plan, the sea area and island are divided into different types of marine functional zones on the basis of their natural resources, environment, geographic location, and development and utilization status while taking into account the need of national or regional economic and social sustainable development [45]. This further indicates the spatial heterogeneity of coastline changes of different islands under human intervention in the Zhoushan Islands. Temporal distribution of coastline changes shows that among the different islands, the period of 2003–2011 generally showed larger coastline changes than the other periods of 1970–1992 and 1992–2003 (Table 4). The strategy of “making the city thrive by relying on the port” in 2005 boosted the exploitation of ports, piers, and industrial lands along the coastline, and brought increasing coastline accretion in this period.
5.2. Plausible Causes for Rapid Seaward Movement during 2003–2011
The rapid coastline changes in Zhoushan Island and its surrounding islands are generally distributed in the island bays (Figure 3). This is based on the fact that the Zhoushan Islands are located within the suspended sediment diffusion range of the Yangtze River Estuary. The Yangtze River carries 4.86 × 10⁸ tons of suspended sediments annually into the East China Sea [46], up to 120 million tons of which were transported to Hangzhou Bay and the Zhoushan coast each year. This provides abundant sediments to the study area, forming broad tidal flats around the bays in the Zhoushan Islands. However, sediment supply from the Yangtze River began to rapidly decrease after the completion of the Three Gorges Dam (TGD) in 2003 (Changjiang Water Resource Committee, 2000–2010). For the TGD’s impact on downstream delivery of sediment, it was found that 151 mt/year of sediment had been retained since the beginning of its operation [47]. Taking the Yangshan deep-water port sea area as an example, the suspended sediment concentration in yearly variation or a long time series is coincident with the sediment discharge change of the Yangtze Estuary [48]. However, from Table 4 we can see that the Zhoushan coast advanced seaward at a larger annual rate during 2003–2011 than during the other periods. Interestingly, the Yangtze River sediment supply has rapidly decreased since 2003, and therefore a natural question to ask is: What caused the rapid seaward movement after 2003 around the Zhoushan Islands?
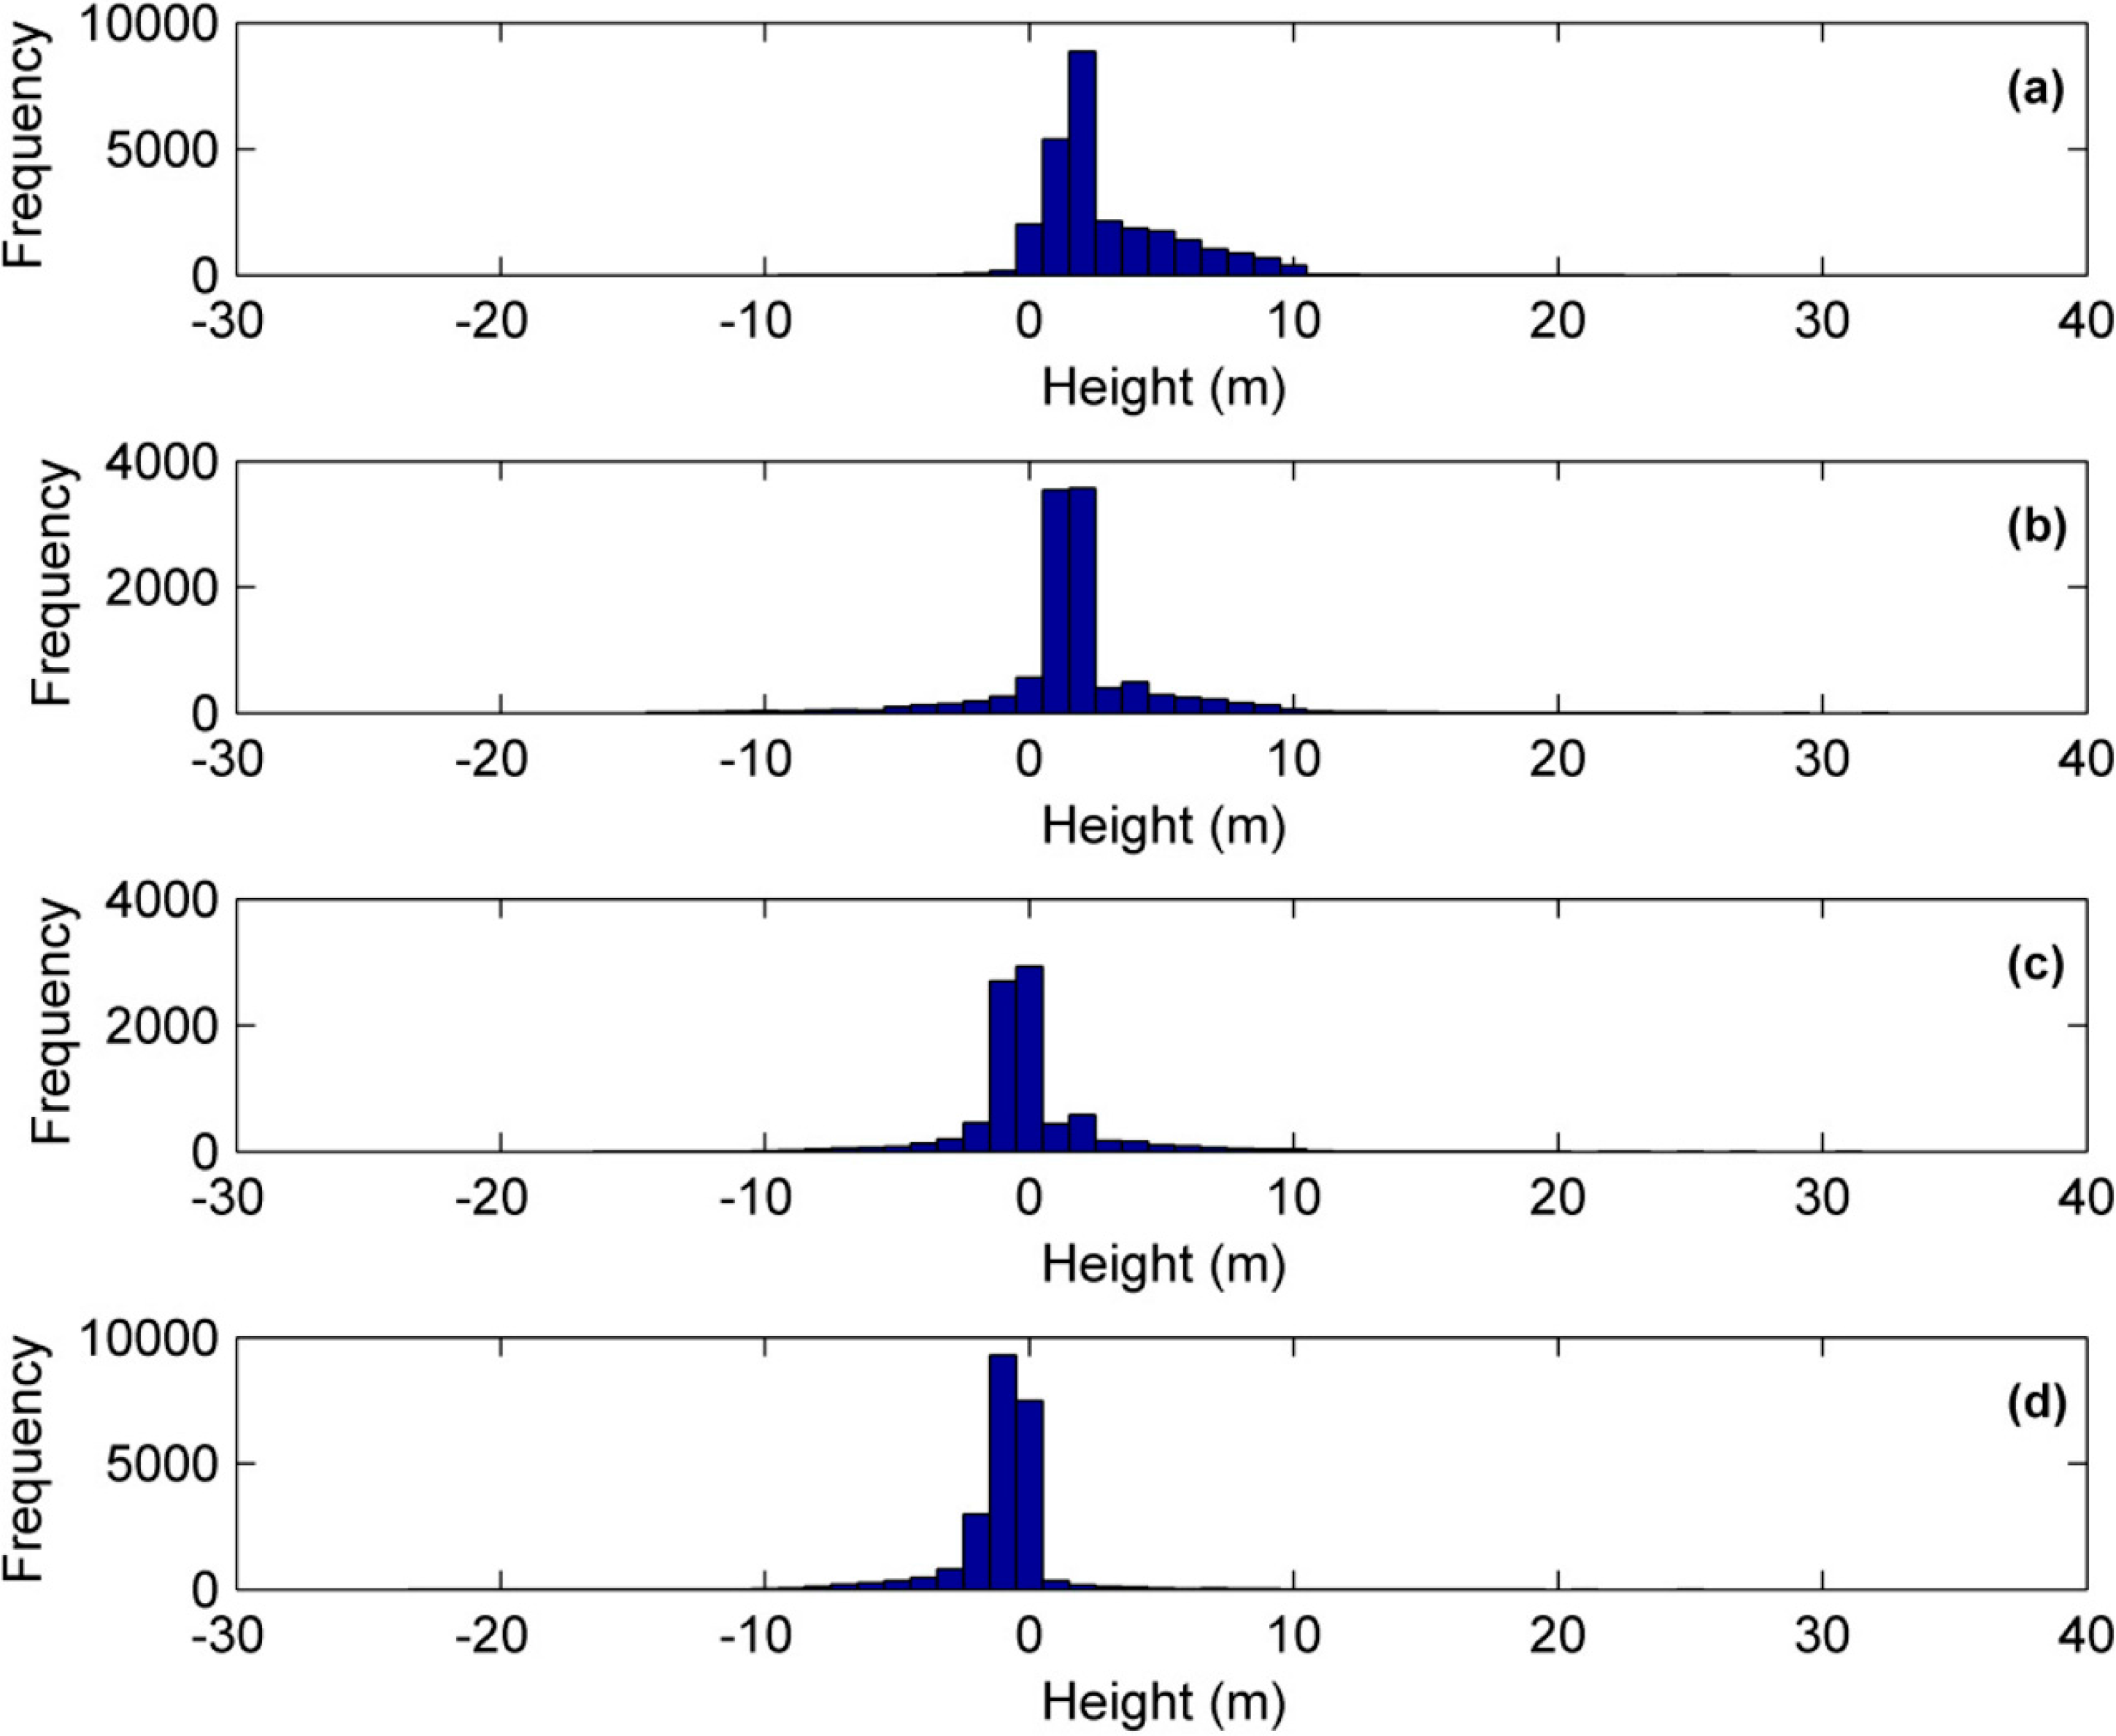
Overlaying the topographic map in the 1980s (Figure 1) on the polygon files of increased coastal areas converted from the multi-temporal coastline maps in ArcGIS 9.2, we can derive the change of reclamation height over time (Figure 8). Specifically, the connected islands are excluded in calculating the reclamation depth during different periods. It was observed that the reclamation heights had gradually changed to deeper depths during the previous four decades. Before 1992, the average reclamation height was positive, while the average height of added land area decreased to −0.06 m during the period of 1992–2003 and went down to −1.04 m from 2003 to 2011 (Table 5). This may indicate that the reclamation of the Zhoushan Islands mainly depended on historical sediment deposition before 2003, and then the rapidly growing artificial siltation began to surpass the natural substance accumulation. Pressured by urbanization, reclamation height in the study area went down to a deeper depth to increase space for living and development during the past decade. Shangyu Country of Zhejiang province has been realized artificially by dam construction, pumping suspended materials into the enclosed area and transporting drainage by artificial canals [49]. This means that the artificial siltation may also apply in the Zhoushan Islands for accelerated sediment accumulation after 2000. The reclamation of the artificial siltation as well as coastal engineering along the Zhoushan coast during this period might have contributed a lot to the rapid seaward movement of the coastline. Also, we found that the distribution of the deep-water coastline (Figure 1) matches well with the positions of the added coastal land during the different periods. To maintain normal waterway operation, the port-dredged materials were mainly used for land reclamation to construct storehouses, roads, and stevedoring lines. Thus, port-dredged materials may also have contributed to the rapid seaward movement during the period of 2003–2011.
5.3. Patterns of Coastal Use for Different Time Periods
From 1970–2011, 46.85% of natural coast was changed to artificial coast through increasing human coastal activities; amongst those with the highest increase was the harbor/port coast during the period of 2003–2011 (Figure 7). Based on the temporal and spatial distribution of coastal use along the Zhoushan coast (Figures 6 and 7), the pattern of the coastal use can be divided into three stages: in the 1970s and 1980s, reclamation projects were carried out for agriculture activities, and the shelter-farm coast dominated in the artificial coast; in the 1990s, tidal flats along the coast were mainly reclaimed for mariculture, and the aquaculture coast dominated in the artificial coast; and during the past 10 years, large-scale coastal reclamation was carried out to develop marine economy, especially for harbor/port industry along the Zhoushan coast, and the urban/industrial coast and harbor/port coast dominated in artificial coast. This pattern of coastal use affected by coastal activities during different time periods of the past four decades in Zhoushan Island and its surrounding islands generally agrees with the pattern of land reclamation in China since 1970 [50]. Specifically, for the Zhoushan coast, it has been an unprecedented challenge for the developing harbor/port industry. In 2011, the cargo-handling capacity of Zhoushan Port reached 260.54 million tons, which is an increase of over 700% during the past decade [21]. Since the merging with Ningbo Port in 2006, it has been reported that the cargo-handling capacity of the port of Ningbo-Zhoushan has reached 570 million tons in 2009, and has been ranked to be the biggest in the world [51]. Associated with the approval of the Zhoushan Islands as the first national demonstration area for the development of marine economy in 2011, there is no doubt that the marine economy in the Zhoushan Islands will boom in the next few years, which will bring further pressure on the coastal use in the near future.
6. Conclusions
In this study, we determined coastline changes in the Zhoushan Islands and the drivers of these changes, based on available multi-temporal high-resolution satellite images from 1970 to 2011 at an interval of about 10 years as well as a topographic map. Results show that the majority of inhabited islands have accreted seaward during the past 40 years. The direction and extent of coastline change rate varied among different islands, and amongst those studied, Zhoushan Island (the main island) had the largest annualized rate, reaching ∼12.83 ± 0.17 m/year, followed by the islands of Lujiazhi, Xiaogan-Mazhi, and Aoshan. Since 2003, the study area has been dominated by artificial coast. The most notable change was the harbor/port coast, which increased from 2.97% in 1970 to 16.22% in 2011, followed by the urban/industrial coast, which increased from 7.26% to 28.77%, while the shelter-farm coast and rocky coast shrank by 68.49% and 41.85%, respectively, compared to 1970. An analysis of the drivers of these changes indicated great spatial and temporal variability of coastline change across the Zhoushan Islands, because of differences in human policies during different time periods as well as other location and geomorphology factors. The Zhoushan coast accumulated rich sediments mainly from the Yangtze River, which contributed to continued seaward expansion of these islands. Regarding the change of reclamation depth over time, we found that the reclamation of the Zhoushan Islands was mainly based on historical sediment deposition before 2003, after which the velocity of artificial siltation began to rapidly grow and surpass the natural sediment accumulation. The reclamation of artificial siltation, coastal engineering, and harbor dredging materials could be responsible for the increasing coastline accretion during the recent decade, although the Three Gorges Dam (TGD) was completed in 2003. Associated with the rapid development of the marine economy, the Zhoushan coast may face an unprecedented challenge in coastal use in the near future. This research provides a preliminary analysis for coastline dynamics in the Zhoushan Islands, and the results can be used for island management and planning and to determine the effects of human intervention on natural coasts driven by urbanization.
Several issues are not covered in this study. One issue is the use of high-resolution data (<1 m). Although we have collected medium-resolution time series images in the Zhoushan Islands and have captured the general coastline dynamics, high-resolution data will improve the accuracy of the coastline position. Additionally, coastline erosion brought by sea-level rise and other natural events (i.e., tide, storm surge) appears likely to be masked by human development activities, and future research needs to consider these factors when evaluating coastline changes. Thirdly, coastal reclamation and modification are extensively carried out in the Zhoushan Islands, which may physically smother the coastal and sub-tidal habitats, resulting in changes to abundance and distribution of various species as well as hydrodynamic environment in the local scale. All these issues need to be considered in future research.
Acknowledgments
The authors thank the anonymous reviewers and the editor for their constructive comments and suggestions. The authors would like to thank Zuojun Yu for improving the presentation of the paper. The authors would also like to thank Yuxiang He, Engineer Shifeng Jia and Huaguo Zhang for their comments, which helped to improve the paper. This study was supported by the National Natural Science Foundation of China (Grant Nos. 41376184, 40976109) and the R&D Special Fund for Public Welfare Industry (Oceanography; Grant Nos. 201005011, 201305009).
Author Contributions
Pan and Chen outlined the research topic, assisted with manuscript writing and coordinated the revision. Xiaoping Zhang performed the satellite data preprocessing and data analysis and wrote the manuscript. Zhao was involved in data collection. Senior Engineer Zhu and Senior Engineer Huang performed the field investigations. All authors participated in editing and revising the paper.
Conflicts of Interest
The authors declare no conflict of interest.
References
- Turner, R.K. Integrating natural and socio-economic science in coastal management. J. Mar. Syst 2000, 25, 447–460. [Google Scholar]
- Hapke, C.J.; Kratzmann, M.G.; Himmelstoss, E.A. Geomorphic and human influence on large-scale coastal change. Geomorphology 2013, 199, 160–170. [Google Scholar]
- White, K.; El Asmar, H.M. Monitoring changing position of coastlines using Thematic Mapper imagery, an example from the Nile Delta. Geomorphology 1999, 29, 93–105. [Google Scholar]
- Ekercin, S. Coastline change assessment at the Aegean Sea coasts in Turkey using multitemporal Landsat imagery. J. Coast. Res 2007, 23, 691–698. [Google Scholar]
- Chu, Z.X.; Yang, X.H.; Feng, X.L.; Fan, D.J.; Li, Y.K.; Shen, X.; Miao, A.Y. Temporal and spatial changes in coastline movement of the Yangtze delta during 1974–2010. J. Asian Earth Sci 2013, 66, 166–174. [Google Scholar]
- Kuleli, T.; Guneroglu, A.; Karsli, F.; Dihkan, M. Automatic detection of shoreline change on coastal Ramsar wetlands of Turkey. Ocean. Eng 2011, 38, 1141–1149. [Google Scholar]
- Kuleli, T. Quantitative analysis of shoreline changes at the Mediterranean Coast in Turkey. Environ. Monit. Assess 2010, 167, 387–397. [Google Scholar]
- Rahman, A.F.; Dragoni, D.; Masri, B.E. Response of the Sundarbans coastlines to sea level and decreased sediment flow: A remote sensing assessment. Remote Sens. Environ 2011, 115, 3121–3128. [Google Scholar]
- Murray, N.J.; Phinn, S.R.; Clemens, R.S.; Roelfsema, C.M.; Fuller, R.A. Continental scale mapping of tidal flats across East Asia using the Landsat archive. Remote Sens 2012, 4, 3417–3426. [Google Scholar]
- Ryu, J.H.; Won, J.S.; Min, K.D. Waterline extraction from Landsat TM data in a tidal flat: A case study in Gomso Bay, Korea. Remote Sens. Environ 2002, 83, 442–456. [Google Scholar]
- Martínez, C.; Quezada, M.; Rubio, P. Historical changes in the shoreline and littoral processes on a headland bay beach in central Chile. Geomorphology 2011, 135, 80–96. [Google Scholar]
- Li, X.; Damen, M.C.J. Coastline change detection with satellite remote sensing for environmental management of the Pearl River Estuary, China. J. Marine Syst. 2010, 82, S54–S61. [Google Scholar]
- Cowart, L.; Corbett, D.R.; Walsh, J.P. Shoreline change along sheltered coastlines: Insights from the Neuse River Estuary, NC, USA. Remote Sens 2011, 3, 1516–1534. [Google Scholar]
- Wu, W.C. Coastline evolution monitoring and estimation—A case study in the region of Nouakchott, Mauritania. Int. J. Remote Sens 2007, 28, 5461–5484. [Google Scholar]
- Dawson, J.L.; Smithers, S.G. Shoreline and beach volume change between 1967 and 2007 at Raine Island, Great Barrier Reef, Australia. Glob. Planet. Chang. 2010, 72, 141–154. [Google Scholar]
- Farhan, A.R.; Lim, S. Resilience assessment on coastline changes and urban settlements: A case study in Seribu Islands, Indonesia. Ocean. Coast. Manag 2011, 54, 391–400. [Google Scholar]
- Ford, M. Shoreline changes interpreted from multi-temporal aerial photographs and high resolution satellite images: Wotje Atoll, Marshall Islands. Rem. Sens. Environ 2013, 135, 130–140. [Google Scholar]
- Woodroffe, C.D. Historical area and shoreline change of reef islands around Tarawa Atoll, Kiribati. Sustain. Sci. 2013, 8, 345–362. [Google Scholar]
- Li, X.H.; Lin, T.; Zhang, G.Q.; Xiao, L.S.; Zhao, Q.J.; Cui, S.H. Dynamic analysis of urban spatial expansion and its determinants in Xiamen Island. J. Geogr. Sci 2011, 21, 503–520. [Google Scholar]
- Qiang, W. Relative sea-level rising and its control strategy in coastal regions of China in the 21st century. Sci. China 2003, 1, 74–83. [Google Scholar]
- Zhoushan Bureau of Statistics. Zhoushan Statistical Yearbook (1989–2011), Available online: http://www.zsgj.gov.cn/class_nj.aspx (accessed on 4 September 2014).
- Pelling, H.E.; Uehara, K.; Green, J.A.M. The impact of rapid coastline changes and sea level rise on the tides in the Bohai Sea, China. J. Geophys. Res 2013, 118, 3462–3472. [Google Scholar]
- Chen, J.; Pan, D.; Mao, Z.; Chen, N.; Zhao, J.; Liu, M. Land-cover reconstruction and change analysis using multisource remotely sensed imageries in Zhoushan Islands since 1970. J. Coast. Res 2013, 30, 272–282. [Google Scholar]
- Zhang, X.P.; Pan, D.L.; Chen, J.Y.; Zhan, Y.Z.; Mao, Z.H. Using long time series of Landsat data to monitor impervious surface dynamics: A case study in the Zhoushan Islands. J. Appl. Remote Sens 2013, 7. [Google Scholar] [CrossRef]
- Jin, J.J.; Francisco, H. Sea-level rise adaptation measures in local communities of Zhejiang Province, China. Ocean. Coast. Manag 2013, 71, 187–194. [Google Scholar]
- Shi, J.Z. Tide-induced fine sediment resuspension in the well-mixed Hangzhou Bay, East China Sea, China. Earth Environ. Sci. Trans. RSE 2011, 10, 25–34. [Google Scholar]
- Chen, B.; Chen, Z.; Stephenson, W.; Finlayson, B. Morphodynamics of a boulder beach, Putuo Island, SE China coast: The role of storms and typhoon. Mar. Geol 2011, 283, 106–115. [Google Scholar]
- Boak, E.H.; Turner, I.L. Shoreline definition and detection: A review. J. Coast. Res 2005, 21, 688–703. [Google Scholar]
- Romine, B.M; Fletcher, C.H.; Frazer, L.N.; Genz, A.S.; Barbee, M.M.; Lim, S.C. Historical shoreline change, southeast Oahu, Hawaii; applying polynomial models to calculate shoreline changes rates. J. Coast. Res 2009, 25, 1236–1253. [Google Scholar]
- Lee, D.S. Combining lidar elevation data and IKONOS multispectral imagery for coastal classification mapping. Mar. Geod. 2003, 26, 117–127. [Google Scholar]
- Liu, H.; Jezek, K.C. Automated extraction of coastline from satellite imagery by integrating Canny edge detection and locally adaptive thresholding methods. Int. J. Rem. Sens 2004, 25, 937–958. [Google Scholar]
- Liu, H.X.; Sherman, D.; Gu, S.G. Automated extraction of shorelines from airborne light detection and ranging data and accuracy assessment based on Monte Carlo simulation. J. Coast. Res 2007, 23, 1359–1369. [Google Scholar]
- Elaksher, A.F. Fusion of hyperspectral images and LiDAR-based DEMs for coastal mapping. Opt. Laser Eng 2008, 46, 493–498. [Google Scholar]
- Zhou, G.; Xie, M. Coastal 3-D morphological change analysis using LiDAR series data: A case study of Assateague Island National Seashore. J. Coast. Res 2009, 25, 435–447. [Google Scholar]
- Bouchahma, M.; Yan, W.L.; Ouessar, M. Island coastline change detection based on image processing and remote sensing. Comput. Inf Sci 2012, 5, 27–36. [Google Scholar]
- Webb, A.P.; Kench, P.S. The dynamic response of reef islands to sea-level rise: Evidence from multi-decadal analysis of island change in the Central Pacific. Glob. Planet. Chang 2010, 72, 234–246. [Google Scholar]
- Ford, M. Shoreline changes on an urban atoll in the central Pacific Ocean: Majuro Atoll, Marshall Islands. J. Coast. Res 2012, 28, 11–22. [Google Scholar]
- The State Oceanic Administration (SOA). Terms and definitions. In Technical Specifications for Coast. Survey, Chinese Edition ed; China Ocean Press; Beijng, China, 2005; pp. 1–6. [Google Scholar]
- Finkl, C.W. Coastal classification: Systematic approaches to consider in the development of a comprehensive scheme. J. Coast. Res 2004, 20, 166–213. [Google Scholar]
- Walker, H.J.; Mossa, J. Human modification of the shoreline of Japan. Phys. Geogr 1986, 7, 116–139. [Google Scholar]
- Rilo, A.; Freire, P.; Ceia, R.; Mendes, R.N.; Catalão, J.; Taborda, R. Human effects on estuarine shoreline decadal evolution. Proceedings of the EGU General Assembly, Vienna, Austria, 22–27 April 2012; p. 10863.
- Xu, D.W.; Yang, Y.M.; Chen, B.Q. Coastline and thematic information interpretation of coastline changes. In High-Resolution Remote Sensing Survey of Practice in Fujian Coastal Islands, Chinese Edition ed; China Ocean Press: Beijng, China, 2011; pp. 85–105. [Google Scholar]
- Thieler, E.R.; Himmelstoss, E.A.; Zichichi, J.L.; Ergul, A. Digital Shoreline Analysis System (DSAS) Version 4.0-An. ArcGIS Extension for Calculating Shoreline Change; Open-File Report 2008–1278 (updated for version 4.3); U.S. Geological Survey: Woods Hole, MA, USA, 2009; pp. 1–81. [Google Scholar]
- Zhao, J.H. Remote Sensing for Sea Area Use Dynamic Monitoring System. Presented at the Mid-Term Meeting of Public Science and Technology Research Projects of Ocean, Dalian, China, 30 October 2013; p. 3. (In Chinese).
- Xu, W.; Li, F.; Xia, D. Review of China policy of OED sea use management. Ocean. Coast. Manag 2014, 88, 38–42. [Google Scholar]
- Yang, S.L.; Ding, P.; Chen, S. Changes in progradation rate of the tidal flats at the mouth of the Changjiang (Yangtze) River, China. Geomorphology 2001, 38, 167–180. [Google Scholar]
- Yang, S.L.; Zhang, J.; Xu, X.J. Influence of the Three Gor ges Dam on downstream delivery of sediment and its environmental implications, Yangtze River. Geophys. Res. Lett 2007, 34. [Google Scholar] [CrossRef]
- Zuo, S.H.; Zhang, N.; Li, B.; Chen, S.L. A study of suspended sediment concentration in Yangshan deep-water port in Shanghai, China. Int. J. Sediment. Res. 2012, 27, 50–60. [Google Scholar]
- Iost, S.; Landgraf, D.; Makeschin, F. Chemical soil properties of reclaimed marsh soil from Zhejiang Province PR China. Geoderma 2007, 142, 245–250. [Google Scholar]
- Wang, W.; Liu, H.; Li, Y.Q.; Su, J.L. Development and management of land reclamation in China. Ocean. Coast. Manag 2014. in press.. [Google Scholar]
- Zhejiang Province Port and Shipping Bureau. Port of Ningbo-Zhoushan Ranks No. 1 in the World for Cargo Handling. Available online: http://english.ningbo.gov.cn/art/2010/2/4/art_46_223941 (accessed on 4 September 2014).


| Island | Location | Area (km2) | Distance (km) | Main Function |
|---|---|---|---|---|
| Zhoushan | Dinghai/Putuo District | 488.30 | ∼ | Comprehensive development |
| Jintang | Dinghai District | 77.73 | 29.1 | Comprehensive development |
| Xiushan | Daishan Country | 22.84 | 2.50 | Marine tourism |
| Cezi | Dinghai District | 14.25 | 2.50 | Port Logistics (ship repairing) |
| Changbai | 10.97 | 1.10 | Urban extension | |
| Changzhi | 6.97 | 0.359 | Urban extension and Marine research | |
| Damao | 6.21 | 2.60 | Port Logistics | |
| Aoshan | 5.29 | 2.70 | Port Logistics | |
| Panzhi | 3.85 | 0.868 | Ship repairing and building base | |
| Xiaogan | Putuo District | 4.59 | 0.335 | Harbor Industry |
| Lujiazhi | 3.12 | 0.187 | Urban extension | |
| Dongjudao | Dinghai District | 3.12 | 1.00 | Marine tourism |
| Zhairuoshan | 2.35 | 4.80 | Marine research | |
| XixieZhi | 0.86 | 0.721 | Port Logistics | |
| Dawangjiaoshan | 0.079 | 2.70 | Harbor Industry | |
| Tuanjishan | 0.263 | ∼ | Special development | |
| Lidiaoshan | 1.66 | 0.133 | Marine tourism | |
| Waidiaoshan | 0.987 | ∼ | Port Logistics | |
| Fuchidao | 1.14 | 0.562 | Marine tourism |
*The information is from Zhoushan atlas in 2011.The distance represents the shortest distance from Zhoushan Island.
| Image | Acquired Date | Band Size | Resolution (m) |
|---|---|---|---|
| CORONA | 15 March 1970 | 1 | 1.83 |
| KH-9 Hexagon | 12 September 1980 | 1 | 7.00 |
| SPOT2 | 23 February 1992 | 1 | 10.00 |
| SPOT5 | 7 September 2003 | 1 + 4 | 2.50 + 10.00 |
| SPOT5 | 20 April 2011 | 1 + 4 | 2.50 + 10.00 |
| Coast Types | Interpretation Sign | Interpretation Feature | Description of the Position |
|---|---|---|---|
| Rocky coast | Cliffs | Rocky beaches. | Base of cliff. |
| Vegetation | The vegetation grows in mountains, and is adjacent to the coastline. | Seaward edge of the vegetation line. | |
| Breaking wave zone | Have shiny white color. | Landward edge of breaking wave zone. | |
| Reef/Rock | Scattered distribution, having gray color, uneven brightness, and rough texture. | Landward edge of reef/rock. | |
| Buildings | Have a white color, with high degree of brightness. | Seaward edge of buildings. | |
| Pond | Have a lump distribution. | Landward edge of the pond. | |
| Gravel coast | Beach ridge | Wave-deposited ridge running parallel to a shoreline. | Seaward edge of the beach ridge top. |
| Cliffs | The sea beach has direct contact with the rocky coast. | The dividing line between the cliff and beach. | |
| Muddy coast | Vegetation | Salt-tolerant plants grow on the beach. | Seaward edge of the vegetation. |
| River coast | Roads, bridges, tidal gates, etc. | The boundary of roads/bridges located in the estuary. | Seaward edge of bridges/roads. |
| Artificial coast | Dike, embankment | Seawater cannot reach the landward edge of dikes at the high-tide period. | Seaward edge of dike top. |
| Port/harbors | Have obvious elongated strips, with a white color. | The boundary of ports, except jetties * of cross-section smaller than 20 m. | |
| Aquaculture area | Seawater cannot reach the landward edge of the aquaculture at the high-tide period. | Seaward edge of the aquaculture area. | |
| Salt fields | Seawater cannot reach the landward edge of salt fields at the high-tide period. | Seaward side of salt fields. | |
*The position should be determined as the contact between the root of jetties and the land.
| Island | Time | ||||||||||
|---|---|---|---|---|---|---|---|---|---|---|---|
| 1970–1992 | 1992–2003 | 2003–2011 | 1970–2011 | 1970 | 2011 | 1970–2011 | |||||
| NSM | EPR | NSM | EPR | NSM | EPR | NSM | EPR | Area | % | ||
| Zhoushan | 120.39 | 5.46 | 54.56 | 4.73 | 328.6 | 42.63 | 513.23 | 12.83 | 453.38 | 498.65 | 9.99 |
| Jintang | 64.28 | 2.91 | 12.05 | 1.04 | 22.94 | 2.98 | 87.51 | 2.13 | 73.08 | 78.36 | 7.22 |
| Xiushan | 29.47 | 1.33 | 23.63 | 2.05 | 44.57 | 5.78 | 59.52 | 1.45 | 21.01 | 23.36 | 11.19 |
| Cezi | 20.23 | 0.92 | 20.71 | 1.80 | 22.78 | 2.96 | 46.13 | 1.12 | 13.77 | 14.75 | 7.12 |
| Changbai | 72.40 | 3.28 | 17.18 | 1.49 | 32.28 | 4.19 | 90.41 | 2.20 | 8.60 | 11.43 | 32.91 |
| Changzhi | 32.89 | 1.49 | 75.63 | 6.56 | 25.94 | 3.36 | 93.26 | 2.27 | 5.83 | 6.85 | 17.50 |
| Damao | 7.54 | 0.34 | 1.14 | 0.10 | 22.8 | 2.96 | 24.07 | 0.58 | 6.09 | 6.17 | 1.28 |
| Aoshan | 126.75 | 5.74 | 22.26 | 1.93 | 34.27 | 4.44 | 175.81 | 4.28 | 3.82 | 5.46 | 42.93 |
| Panzhi | 57.11 | 2.58 | 9.15 | 0.79 | 19.18 | 2.49 | 69.06 | 1.68 | 3.39 | 3.87 | 14.16 |
| Xiaogan | 80.51 | 3.65 | 73.00 | 6.33 | 70 | 8.82 | 191.14 | 4.65 | 3.04 | 4.81 | 58.22 |
| Lujiazhi | 101.85 | 4.61 | 11.22 | 0.97 | 128.69 | 16.69 | 229.06 | 5.57 | 2.36 | 4.01 | 69.92 |
| Dongjudao | 13.76 | 0.62 | 0 | 0 | 0 | 0 | 13.76 | 0.33 | 3.02 | 3.09 | 2.28 |
| Zhairuoshan | 6.60 | 0.57 | 12.73 | 1.10 | 0 | 0 | 12.03 | 0.29 | 2.30 | 2.35 | 2.17 |
| Xixiezhi | 42.60 | 1.93 | 19.37 | 1.68 | 18.54 | 2.41 | 56.06 | 1.36 | 0.64 | 0.88 | 37.72 |
| Dawangjiaoshan | 51.27 | 2.32 | 0 | 0 | 90.09 | 11.69 | 125.77 | 3.06 | 0.037 | 0.18 | 386.49 |
| Tuanjishan | 0 | 0 | 0 | 0 | 6.52 | 0.85 | 6.52 | 0.16 | 0.19 | 0.29 | 48.72 |
| Lidiaoshan | 0 | 0 | 0.79 | 0.07 | 0 | 0 | 0.79 | 0.019 | 1.61 | 1.62 | 0.43 |
| Waidiaoshan | 93.57 | 4.24 | 0 | 0 | 37.37 | 4.85 | 121.54 | 2.96 | 0.54 | 1.09 | 102.98 |
| Fuchidao | 0 | 0 | 9.88 | 0.85 | 0 | 0 | 9.88 | 0.24 | 1.11 | 1.14 | 2.33 |
*Uncertainties of EPR for the periods of 1970–1992, 1992–2003, 2003–2011, and 1970–2011 are ±1.06, ±2.04, ±1.02, and ±0.17 m/year, respectively. Tidal flat areas are not included in the calculation.
| Time | Minimum | Maximum | Mean | Standard Deviation |
|---|---|---|---|---|
| 1970–1980 | −8.69 | 26.37 | 2.98 | 2.58 |
| 1980–1992 | −14.26 | 31.88 | 1.76 | 3.22 |
| 1992–2003 | −15.66 | 31.49 | −0.06 | 2.74 |
| 2003–2011 | −22.71 | 24.57 | −1.04 | 2.08 |
© 2014 by the authors; licensee MDPI, Basel, Switzerland This article is an open access article distributed under the terms and conditions of the Creative Commons Attribution license (http://creativecommons.org/licenses/by/4.0/).
Share and Cite
Zhang, X.; Pan, D.; Chen, J.; Zhao, J.; Zhu, Q.; Huang, H. Evaluation of Coastline Changes under Human Intervention Using Multi-Temporal High-Resolution Images: A Case Study of the Zhoushan Islands, China. Remote Sens. 2014, 6, 9930-9950. https://doi.org/10.3390/rs6109930
Zhang X, Pan D, Chen J, Zhao J, Zhu Q, Huang H. Evaluation of Coastline Changes under Human Intervention Using Multi-Temporal High-Resolution Images: A Case Study of the Zhoushan Islands, China. Remote Sensing. 2014; 6(10):9930-9950. https://doi.org/10.3390/rs6109930
Chicago/Turabian StyleZhang, Xiaoping, Delu Pan, Jianyu Chen, Jianhua Zhao, Qiankun Zhu, and Haiqing Huang. 2014. "Evaluation of Coastline Changes under Human Intervention Using Multi-Temporal High-Resolution Images: A Case Study of the Zhoushan Islands, China" Remote Sensing 6, no. 10: 9930-9950. https://doi.org/10.3390/rs6109930
APA StyleZhang, X., Pan, D., Chen, J., Zhao, J., Zhu, Q., & Huang, H. (2014). Evaluation of Coastline Changes under Human Intervention Using Multi-Temporal High-Resolution Images: A Case Study of the Zhoushan Islands, China. Remote Sensing, 6(10), 9930-9950. https://doi.org/10.3390/rs6109930