Global Biogeographical Pattern of Ecosystem Functional Types Derived From Earth Observation Data

Abstract
:1. Introduction
2. Data and Methods
2.1. Data
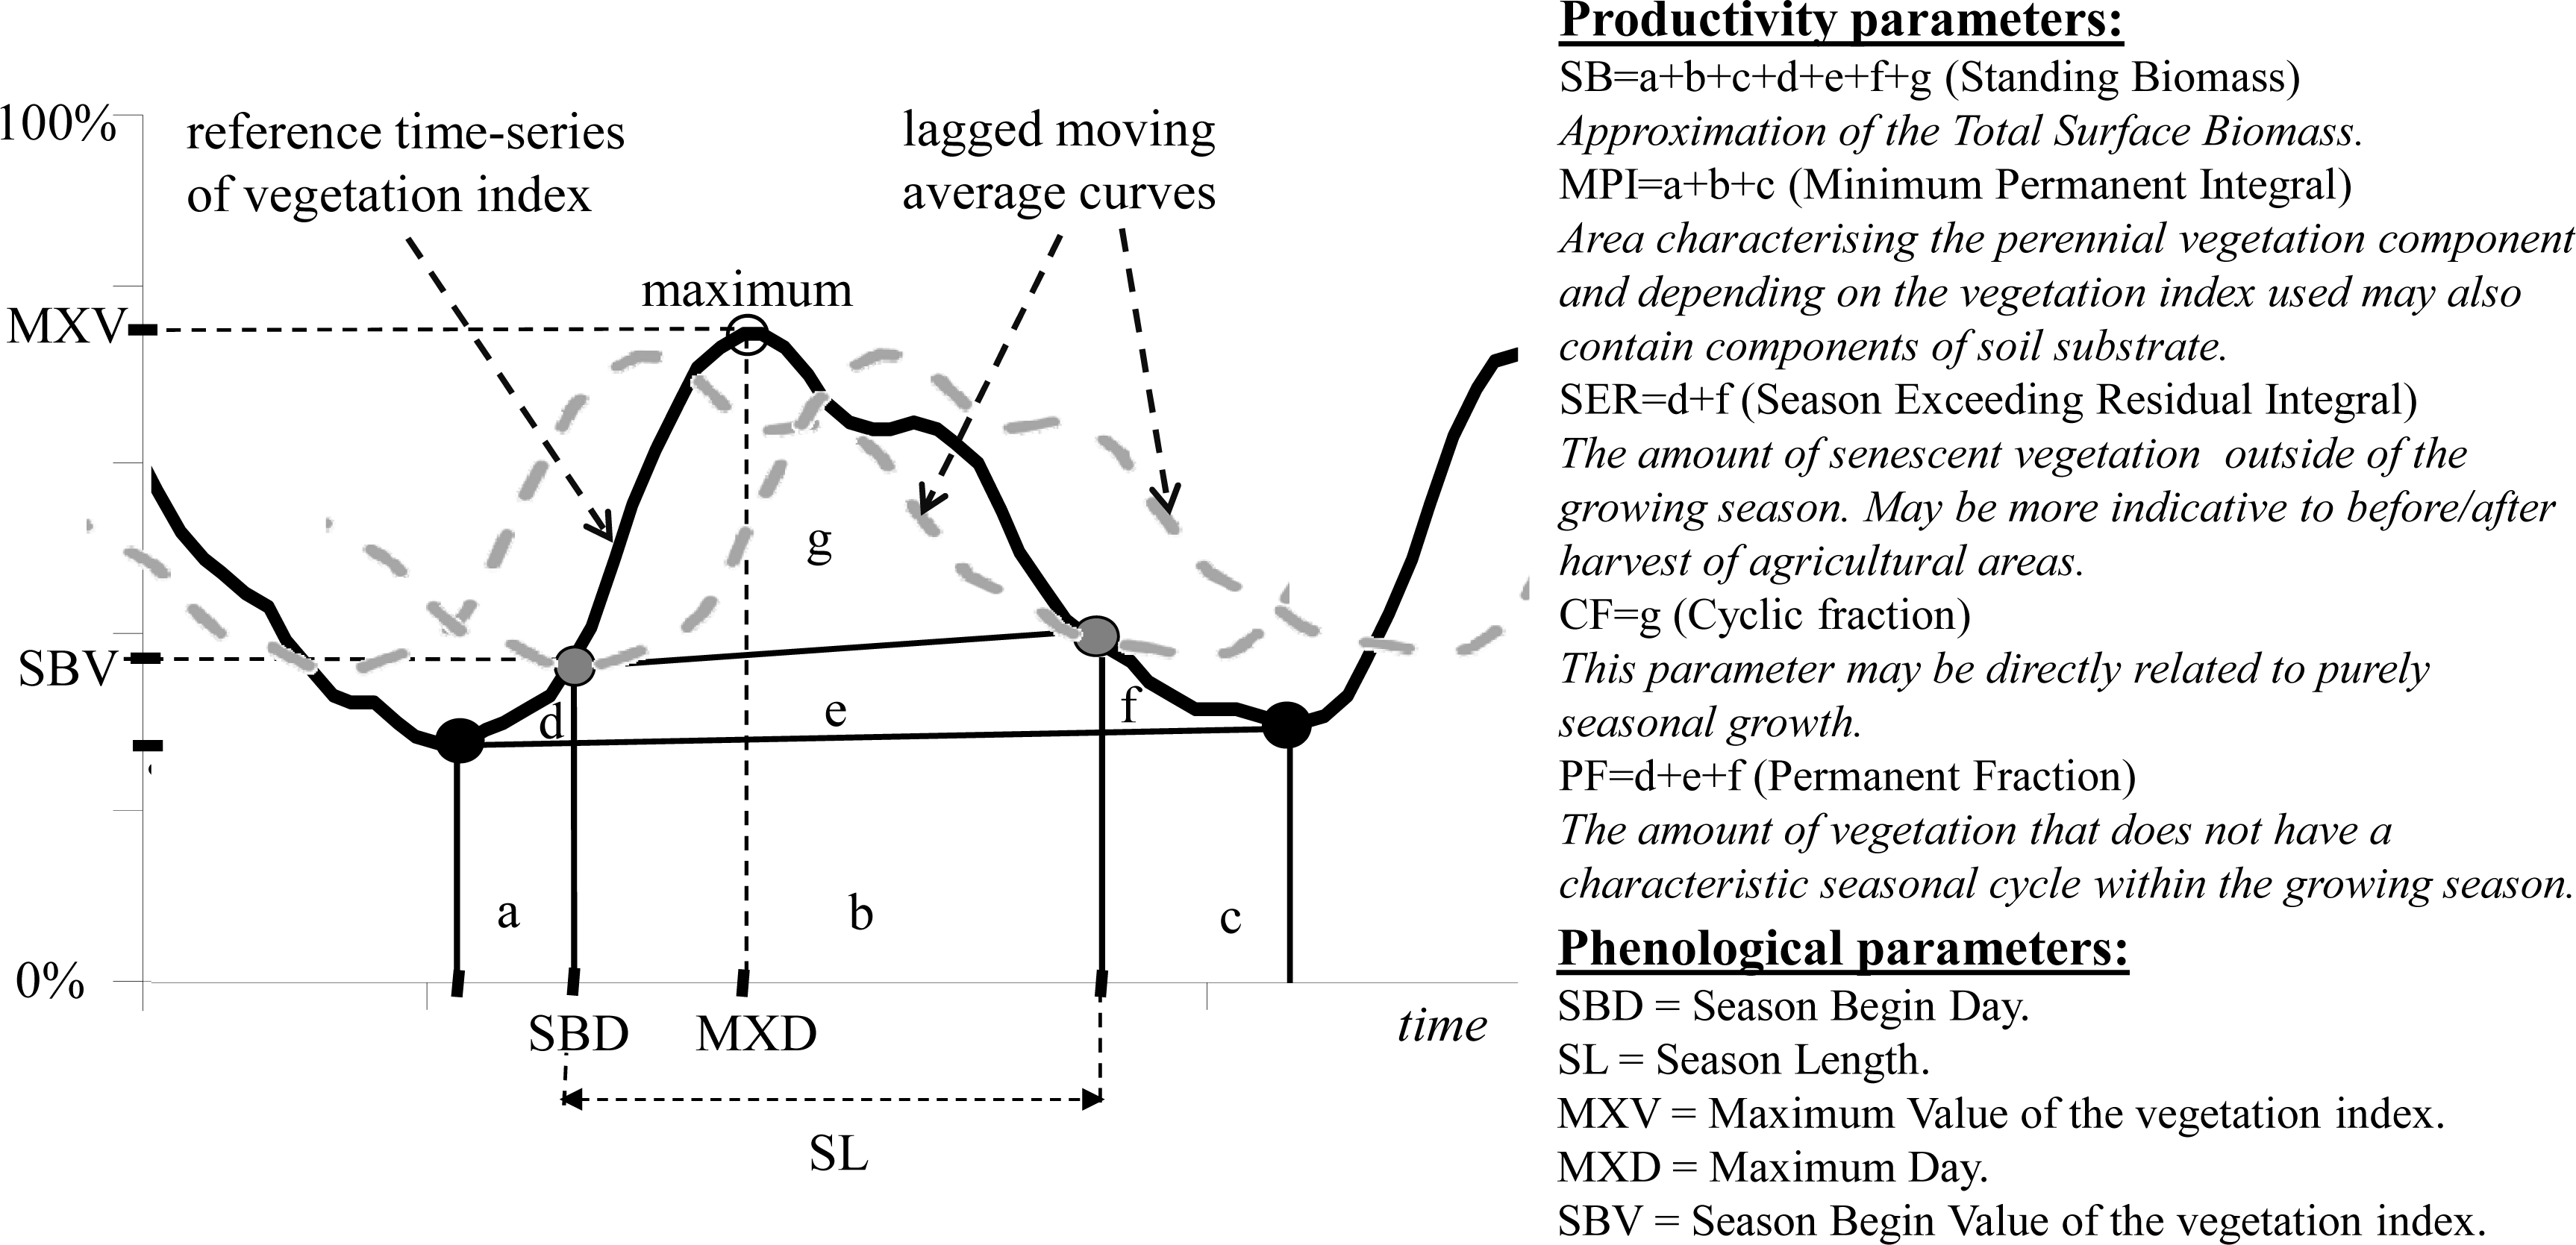
2.2. Derivation of Phenological and Productivity Parameters
2.3. Statistical Screening of the Phenological and Productivity Parameters
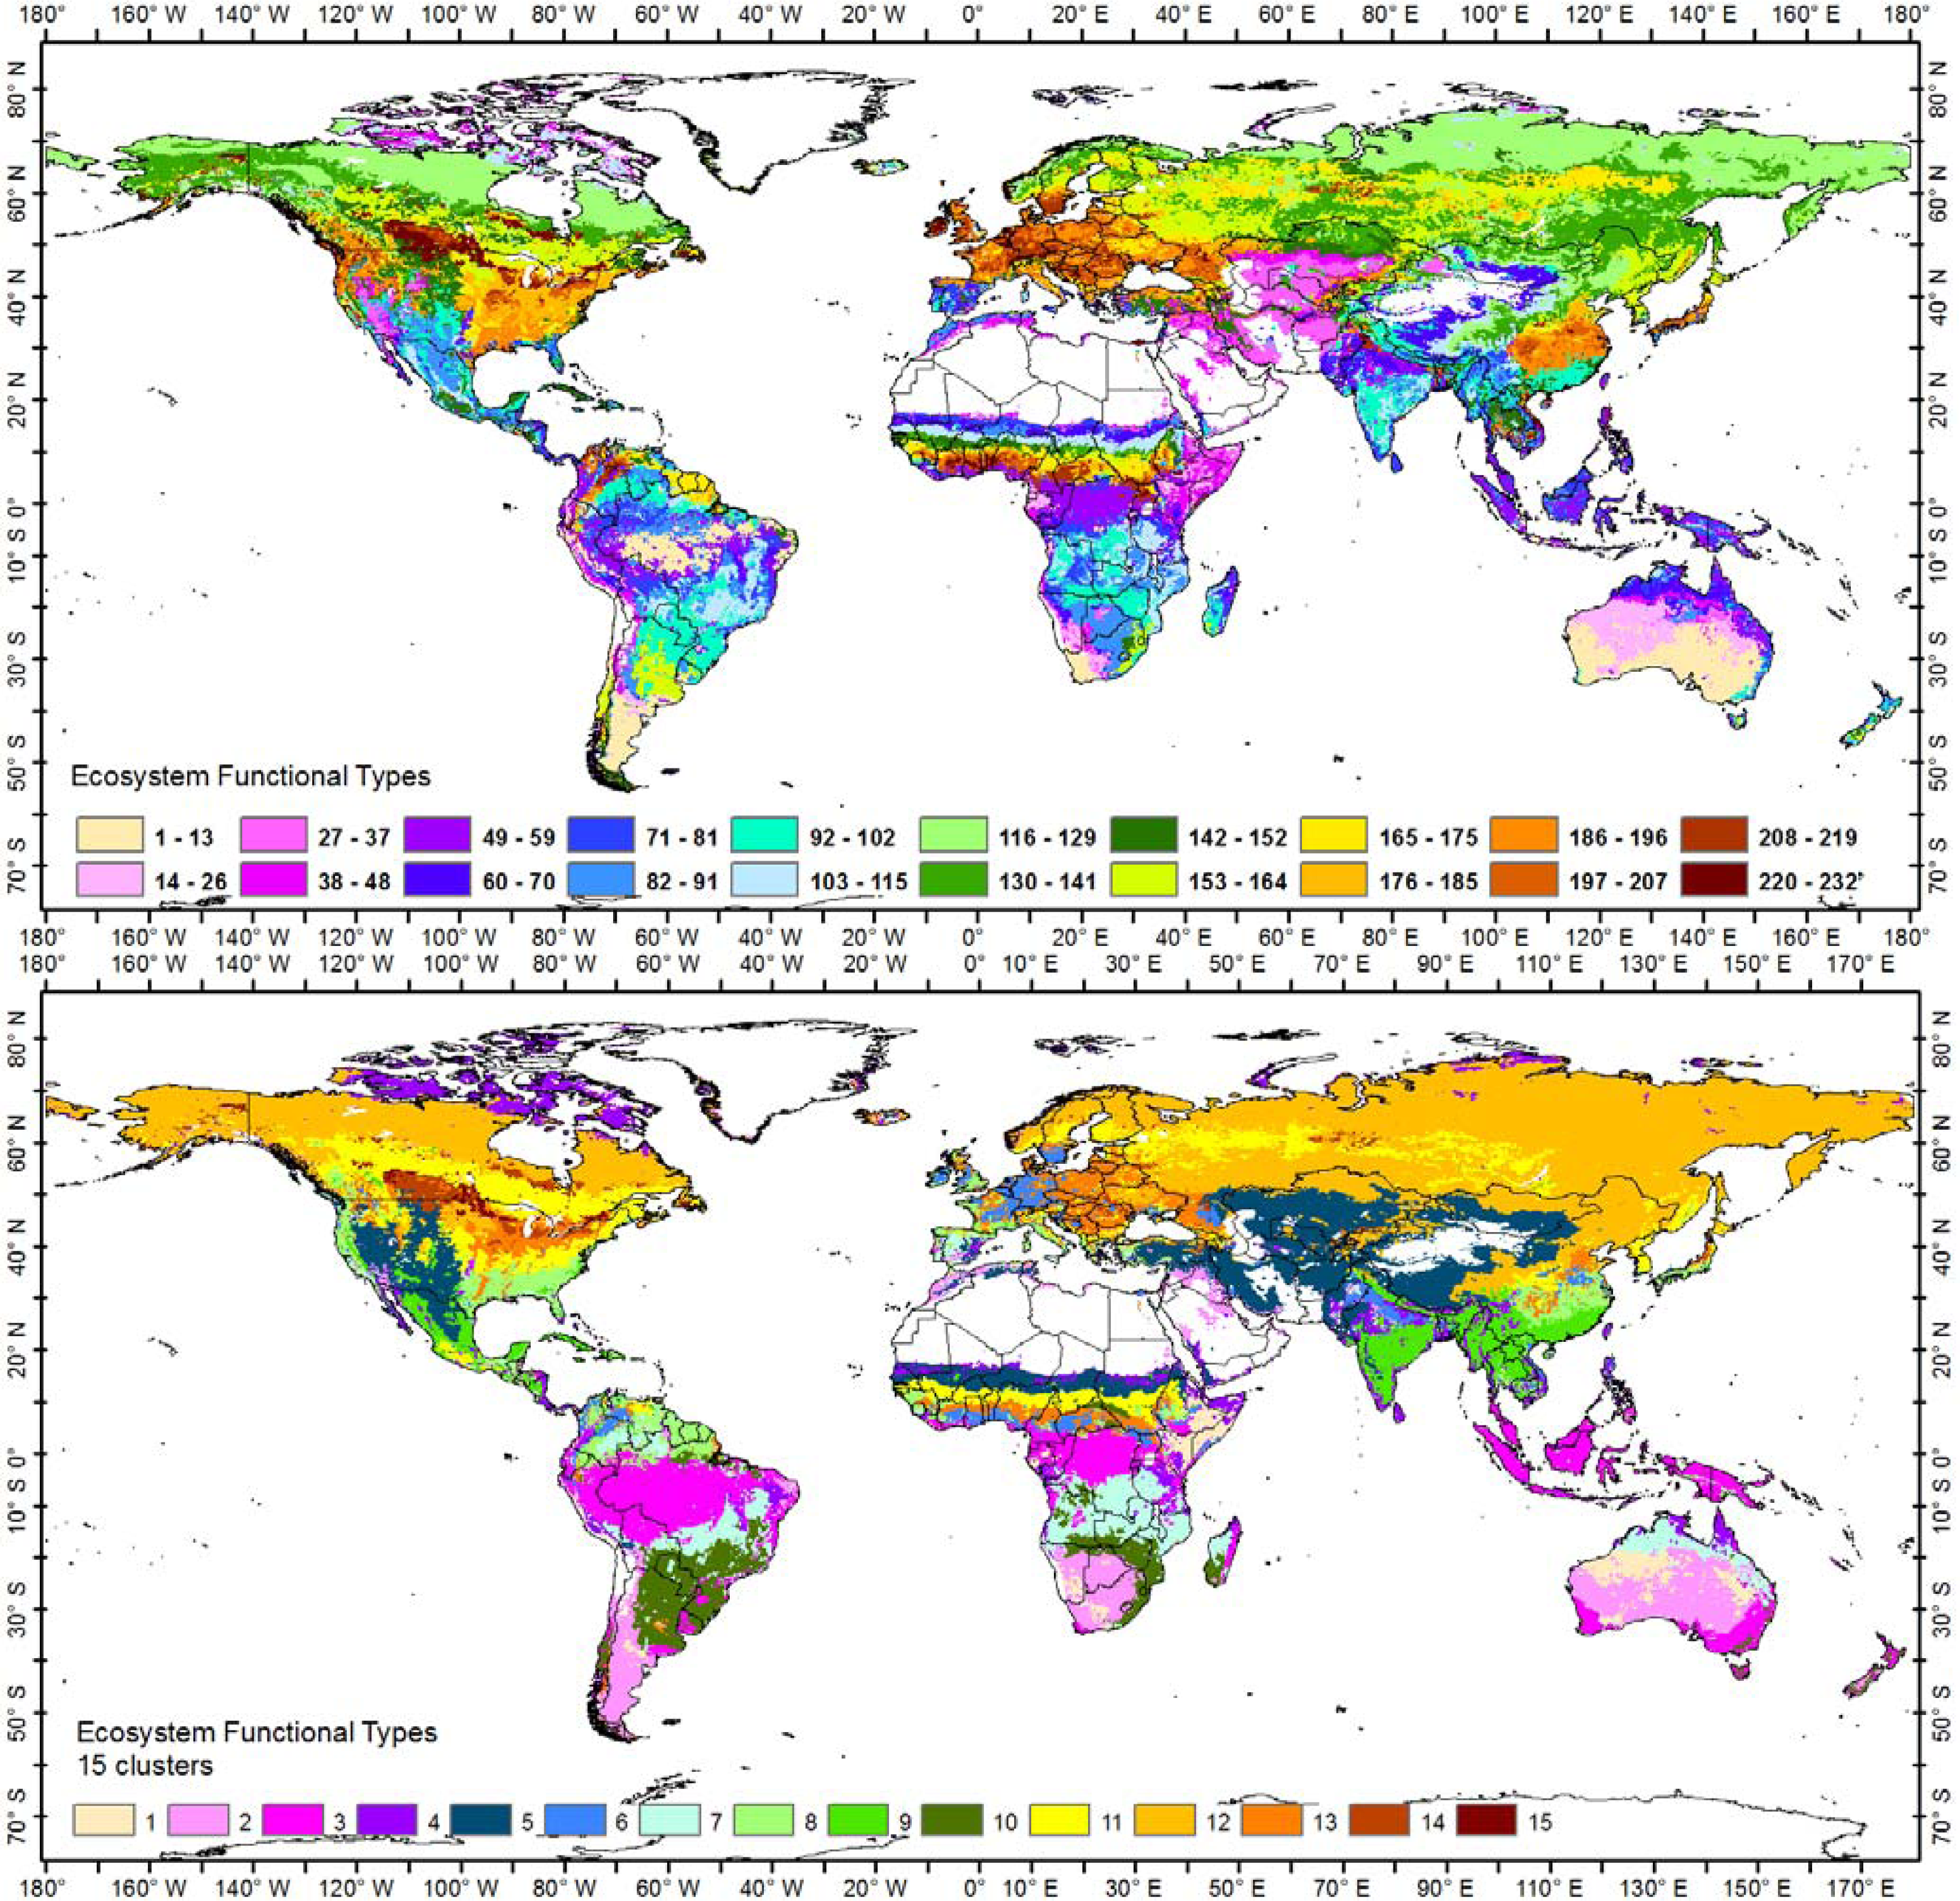
2.4. Classification of Global Ecosystem Functional Types Based on the Phenological and Productivity Parameters
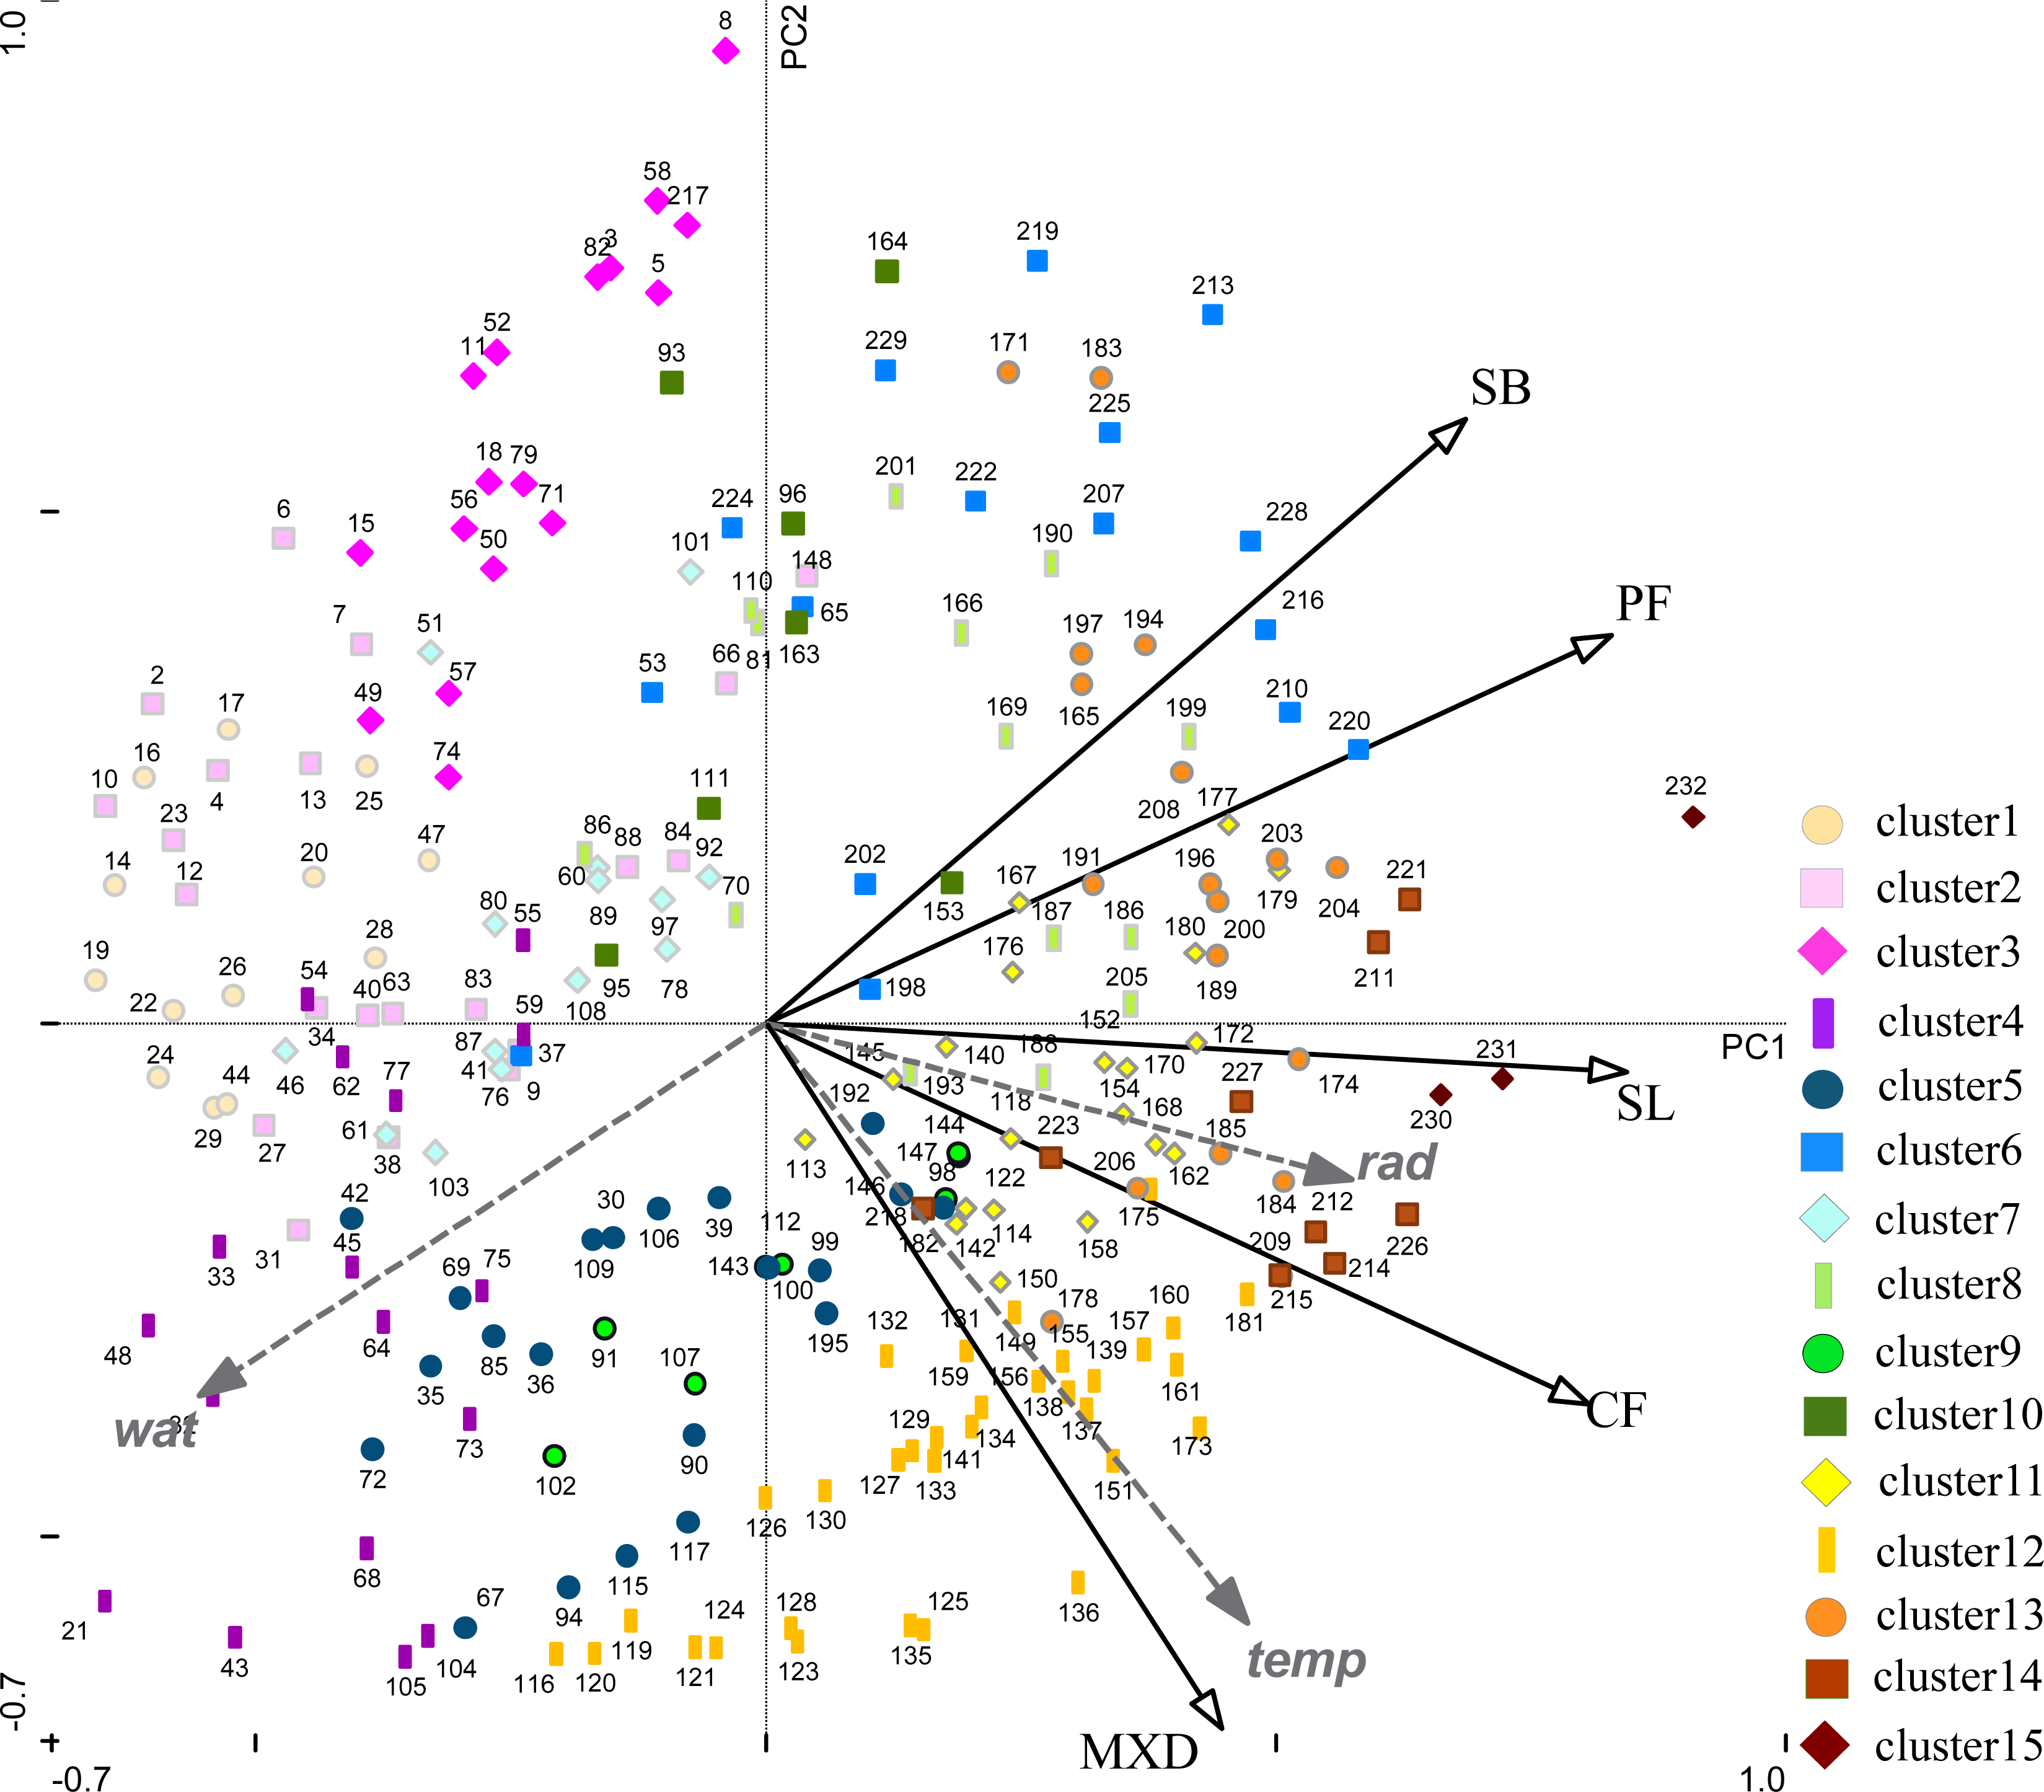
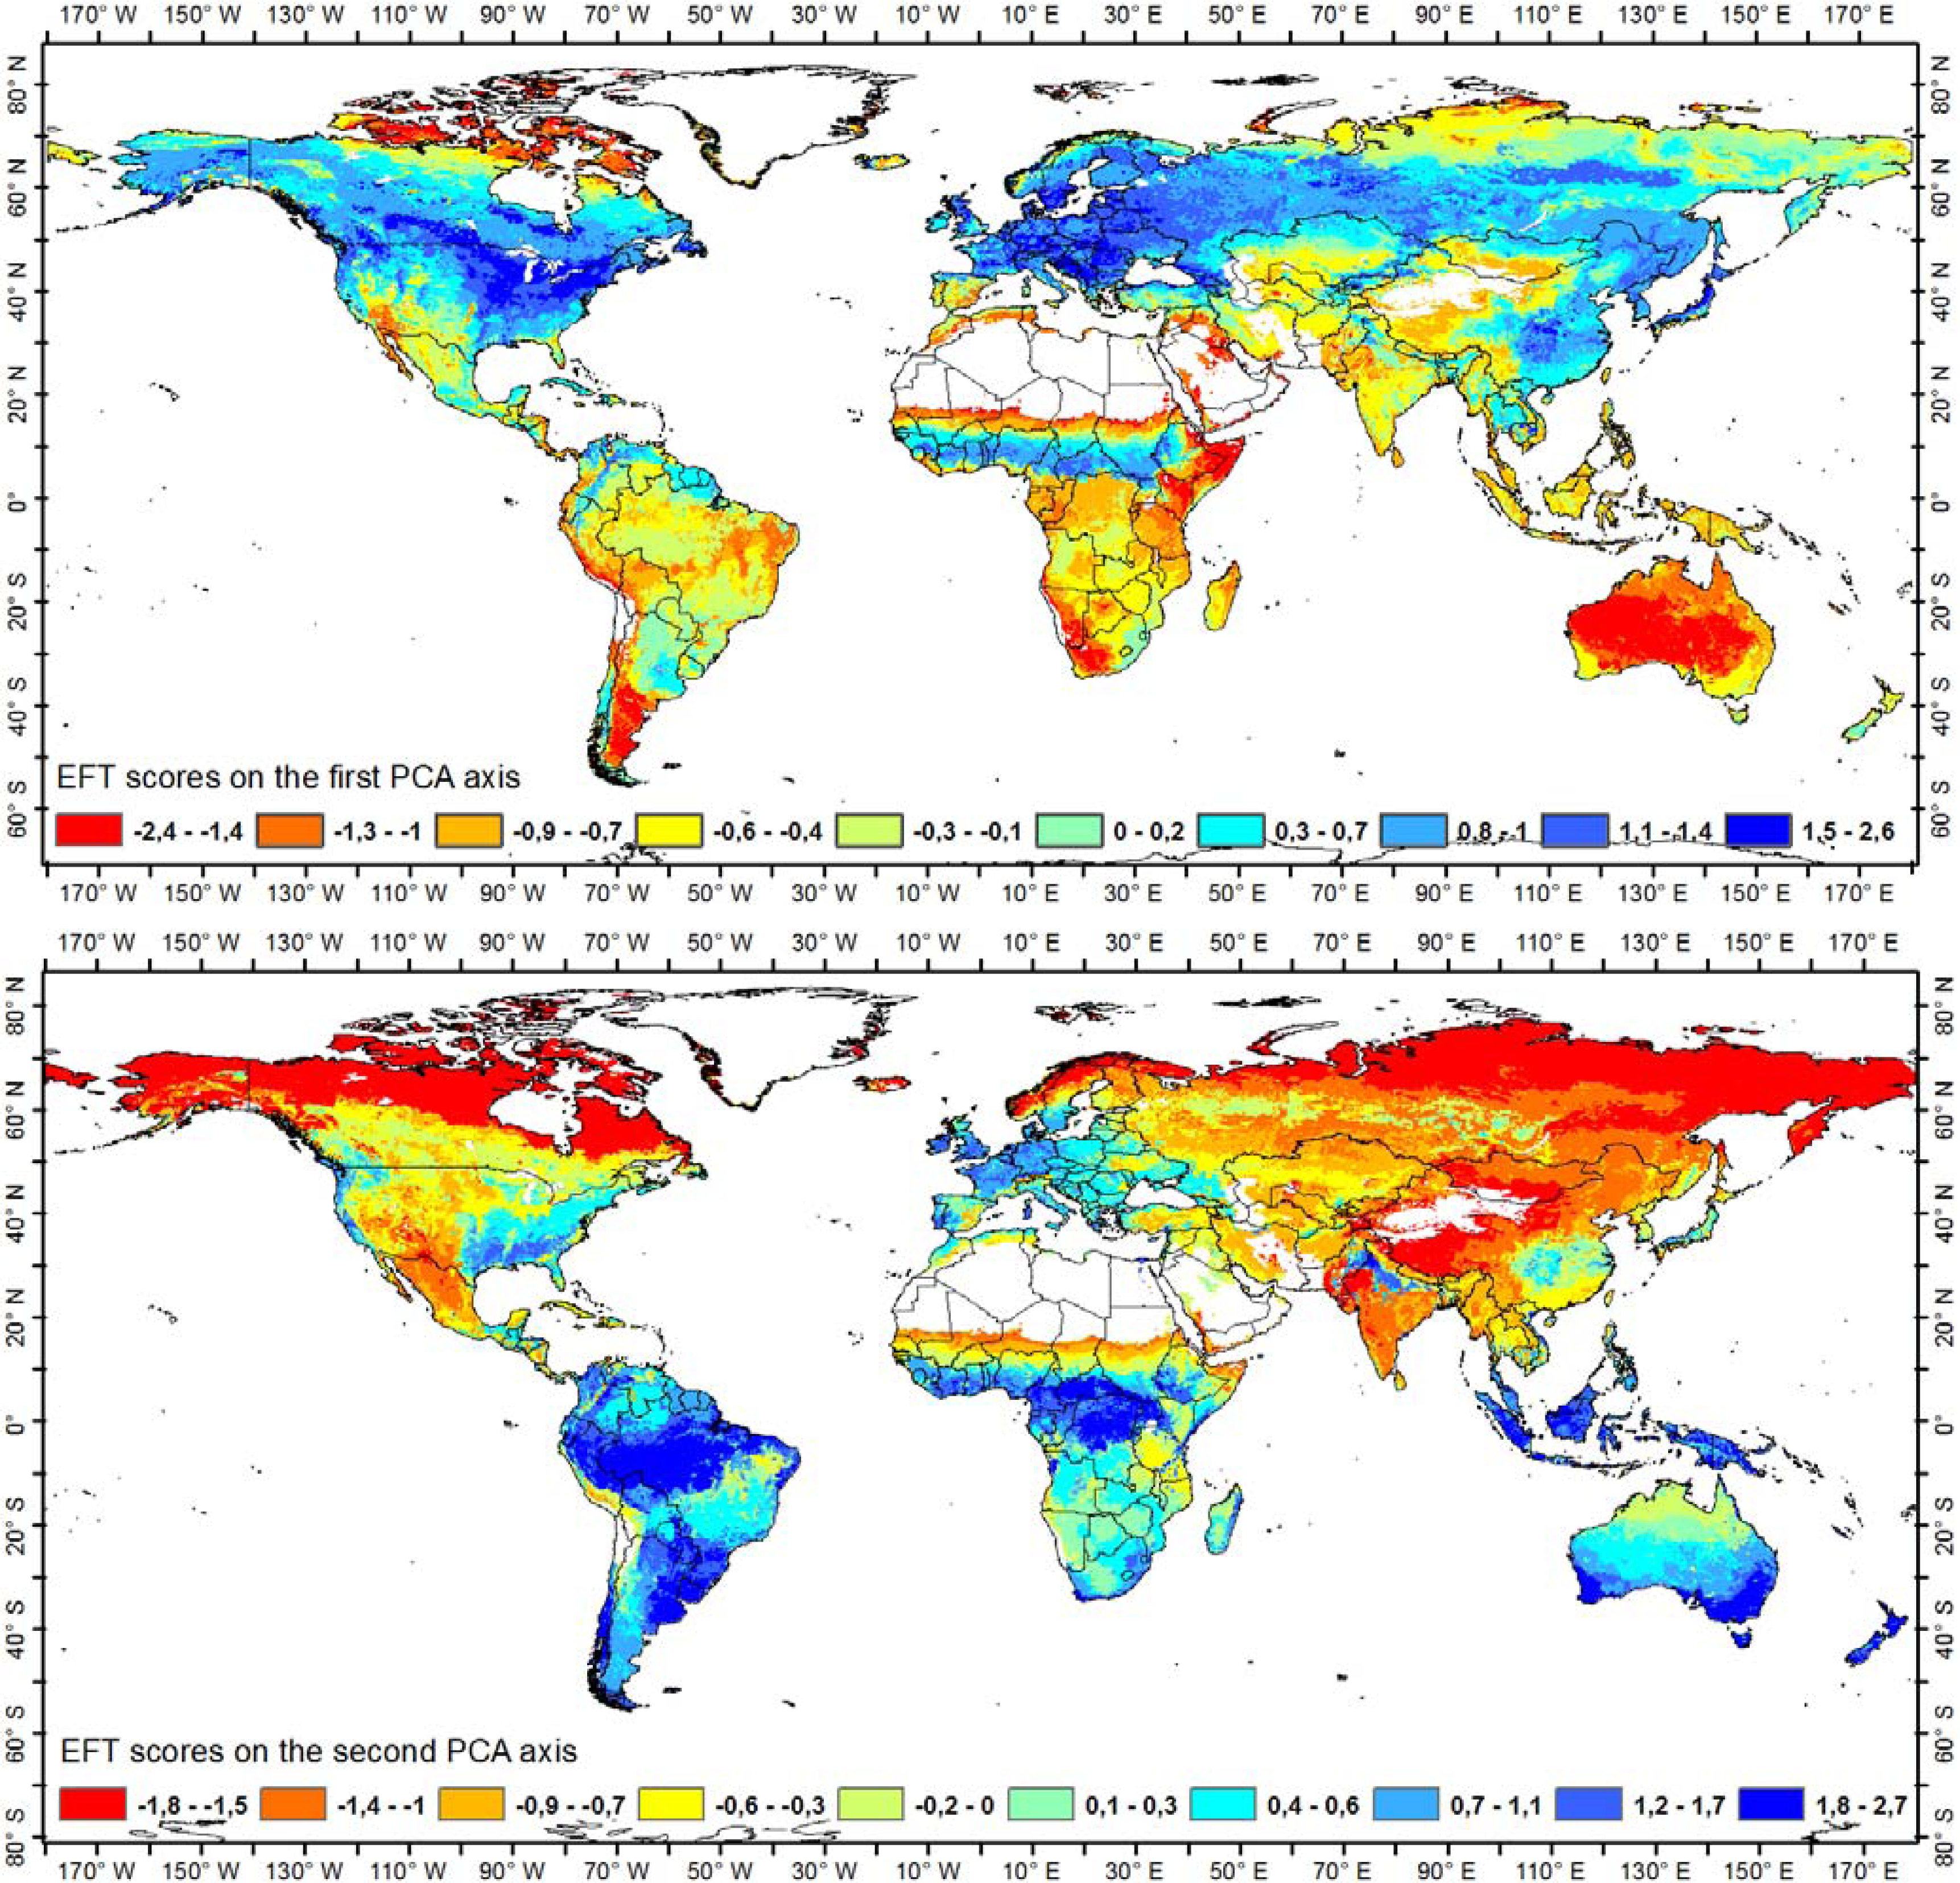
2.5. Relation of the EFTs to the Phenological and Productivity Parameters and to Climatic Vegetation Growth Constraints
2.6. Relation of the EFTs to Global Climate and Land Use Classifications
3. Results
3.1. Statistical Screening of the Phenological and Productivity Parameters
3.2. Relation of the EFTs to the Phenological and Productivity Parameters
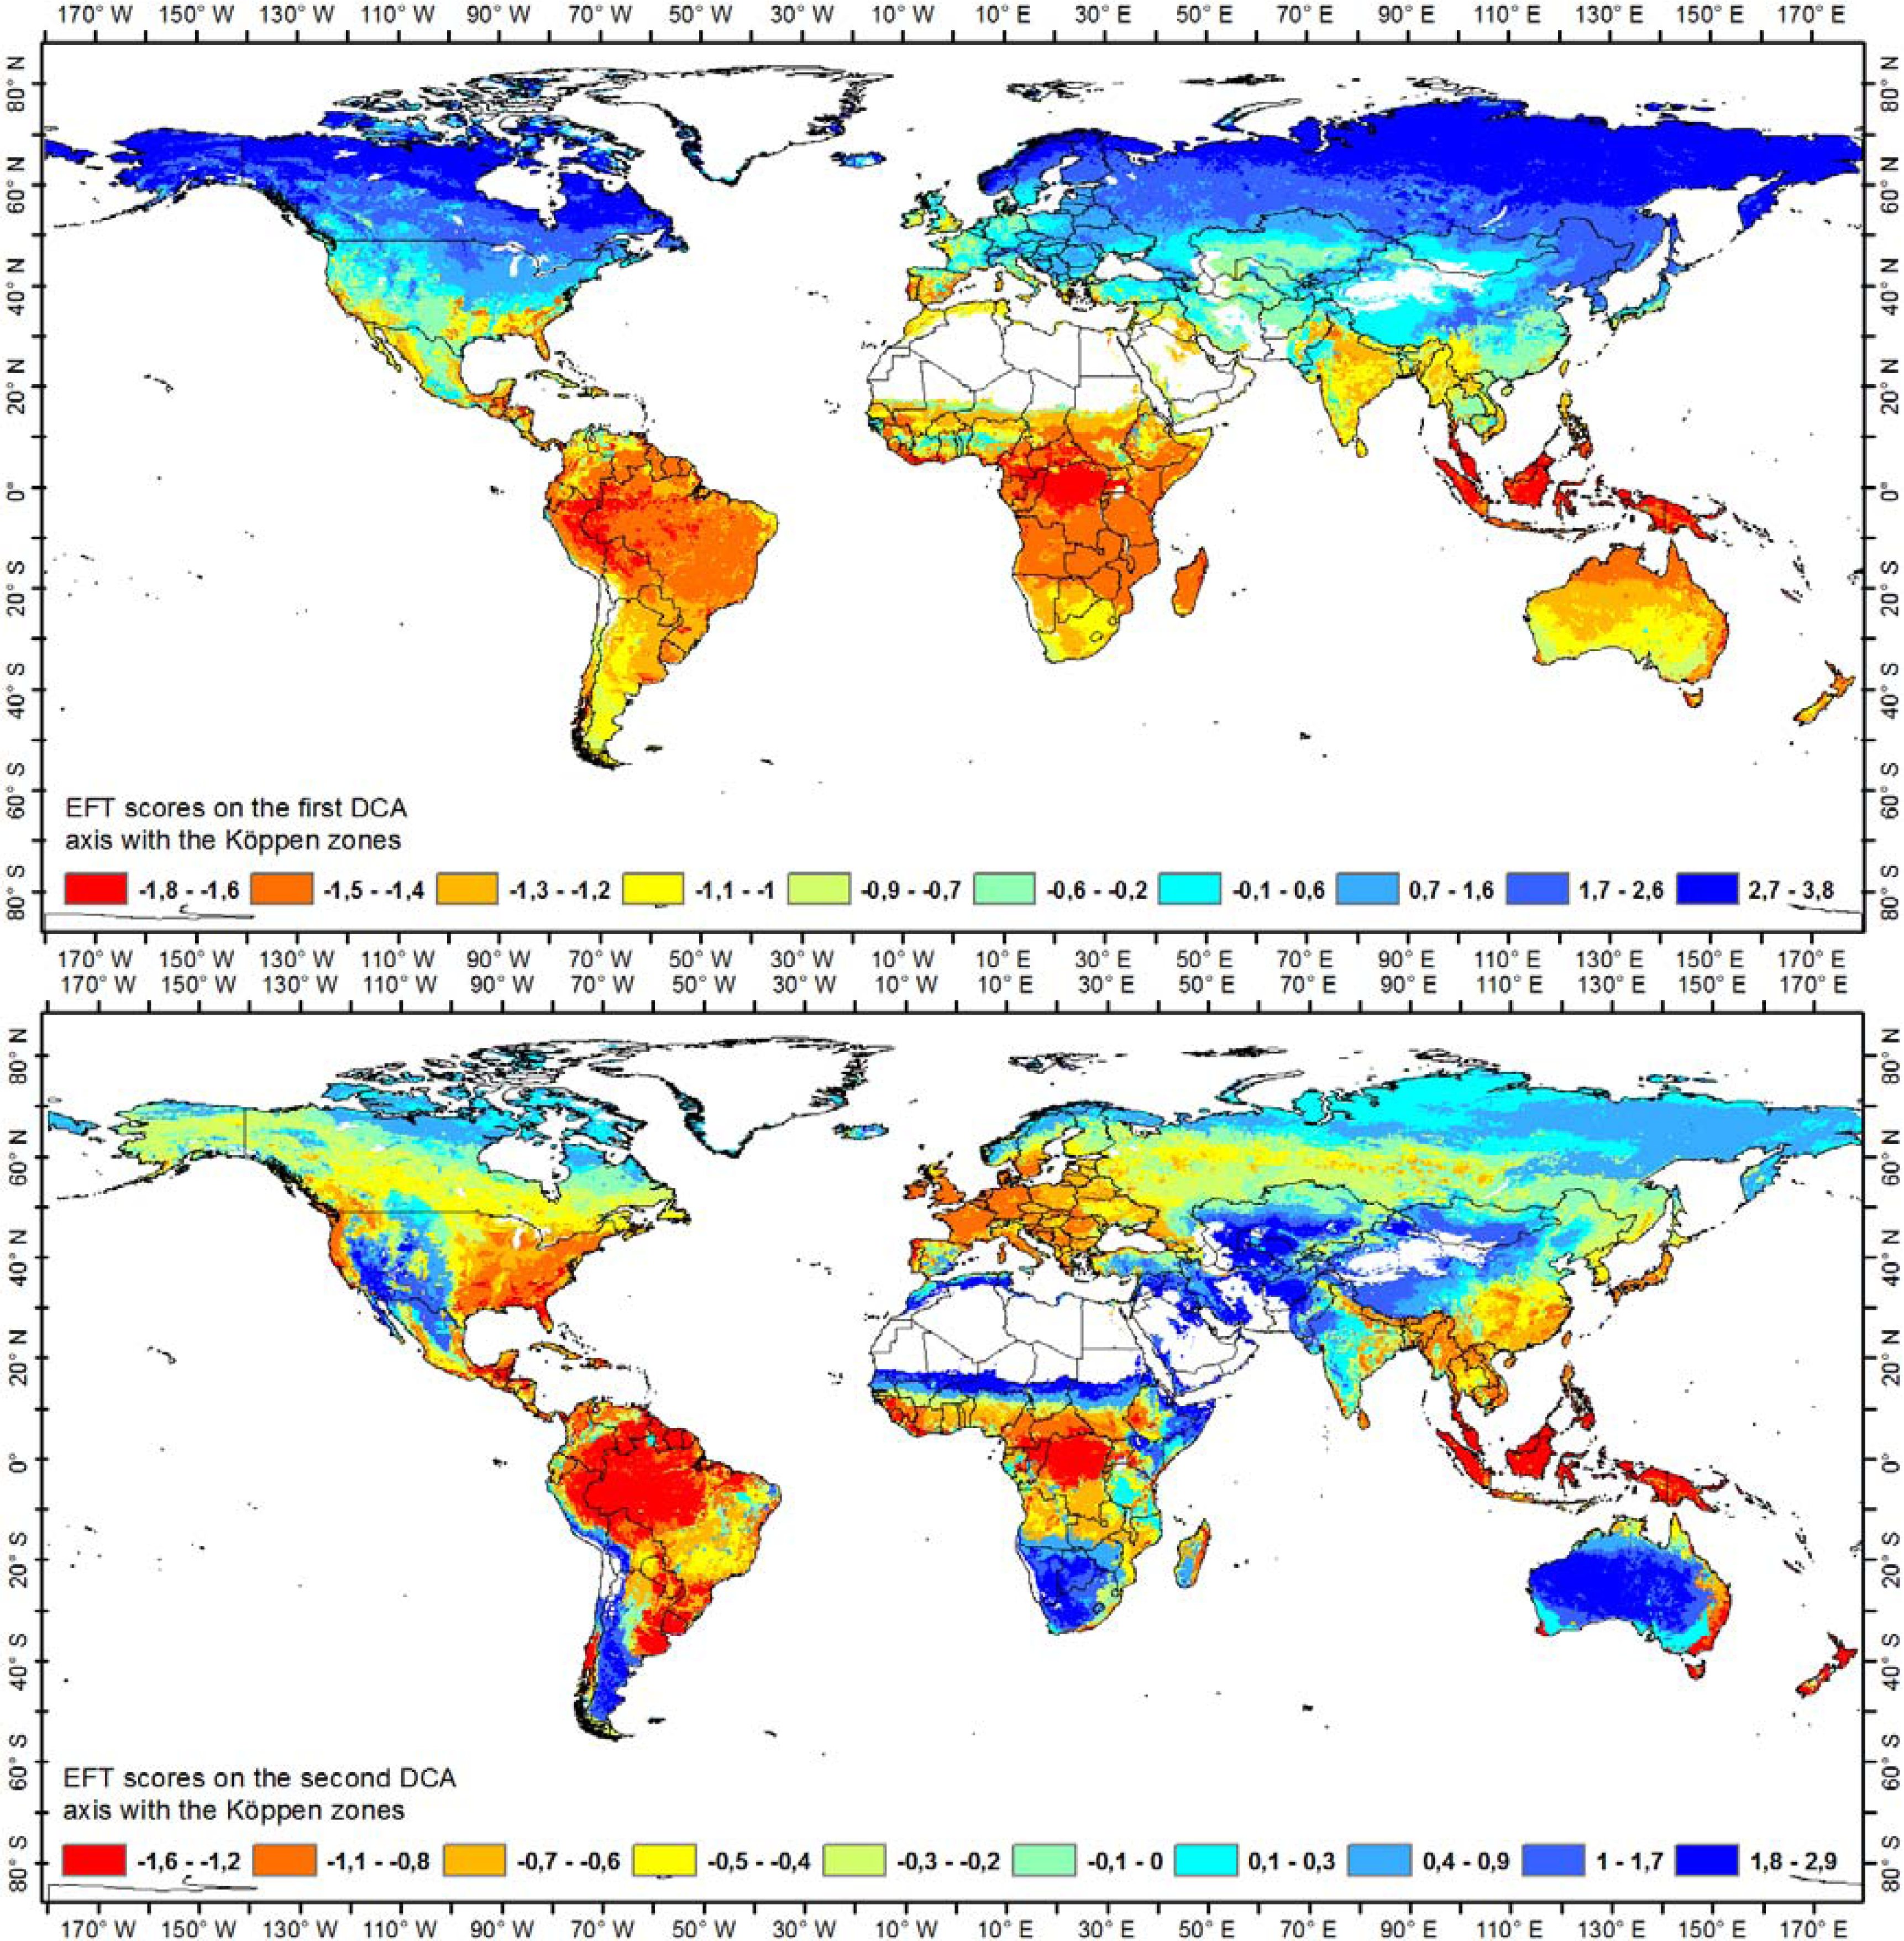
3.3. Relation of the EFTs to Climatic Constraints of Vegetation Growth
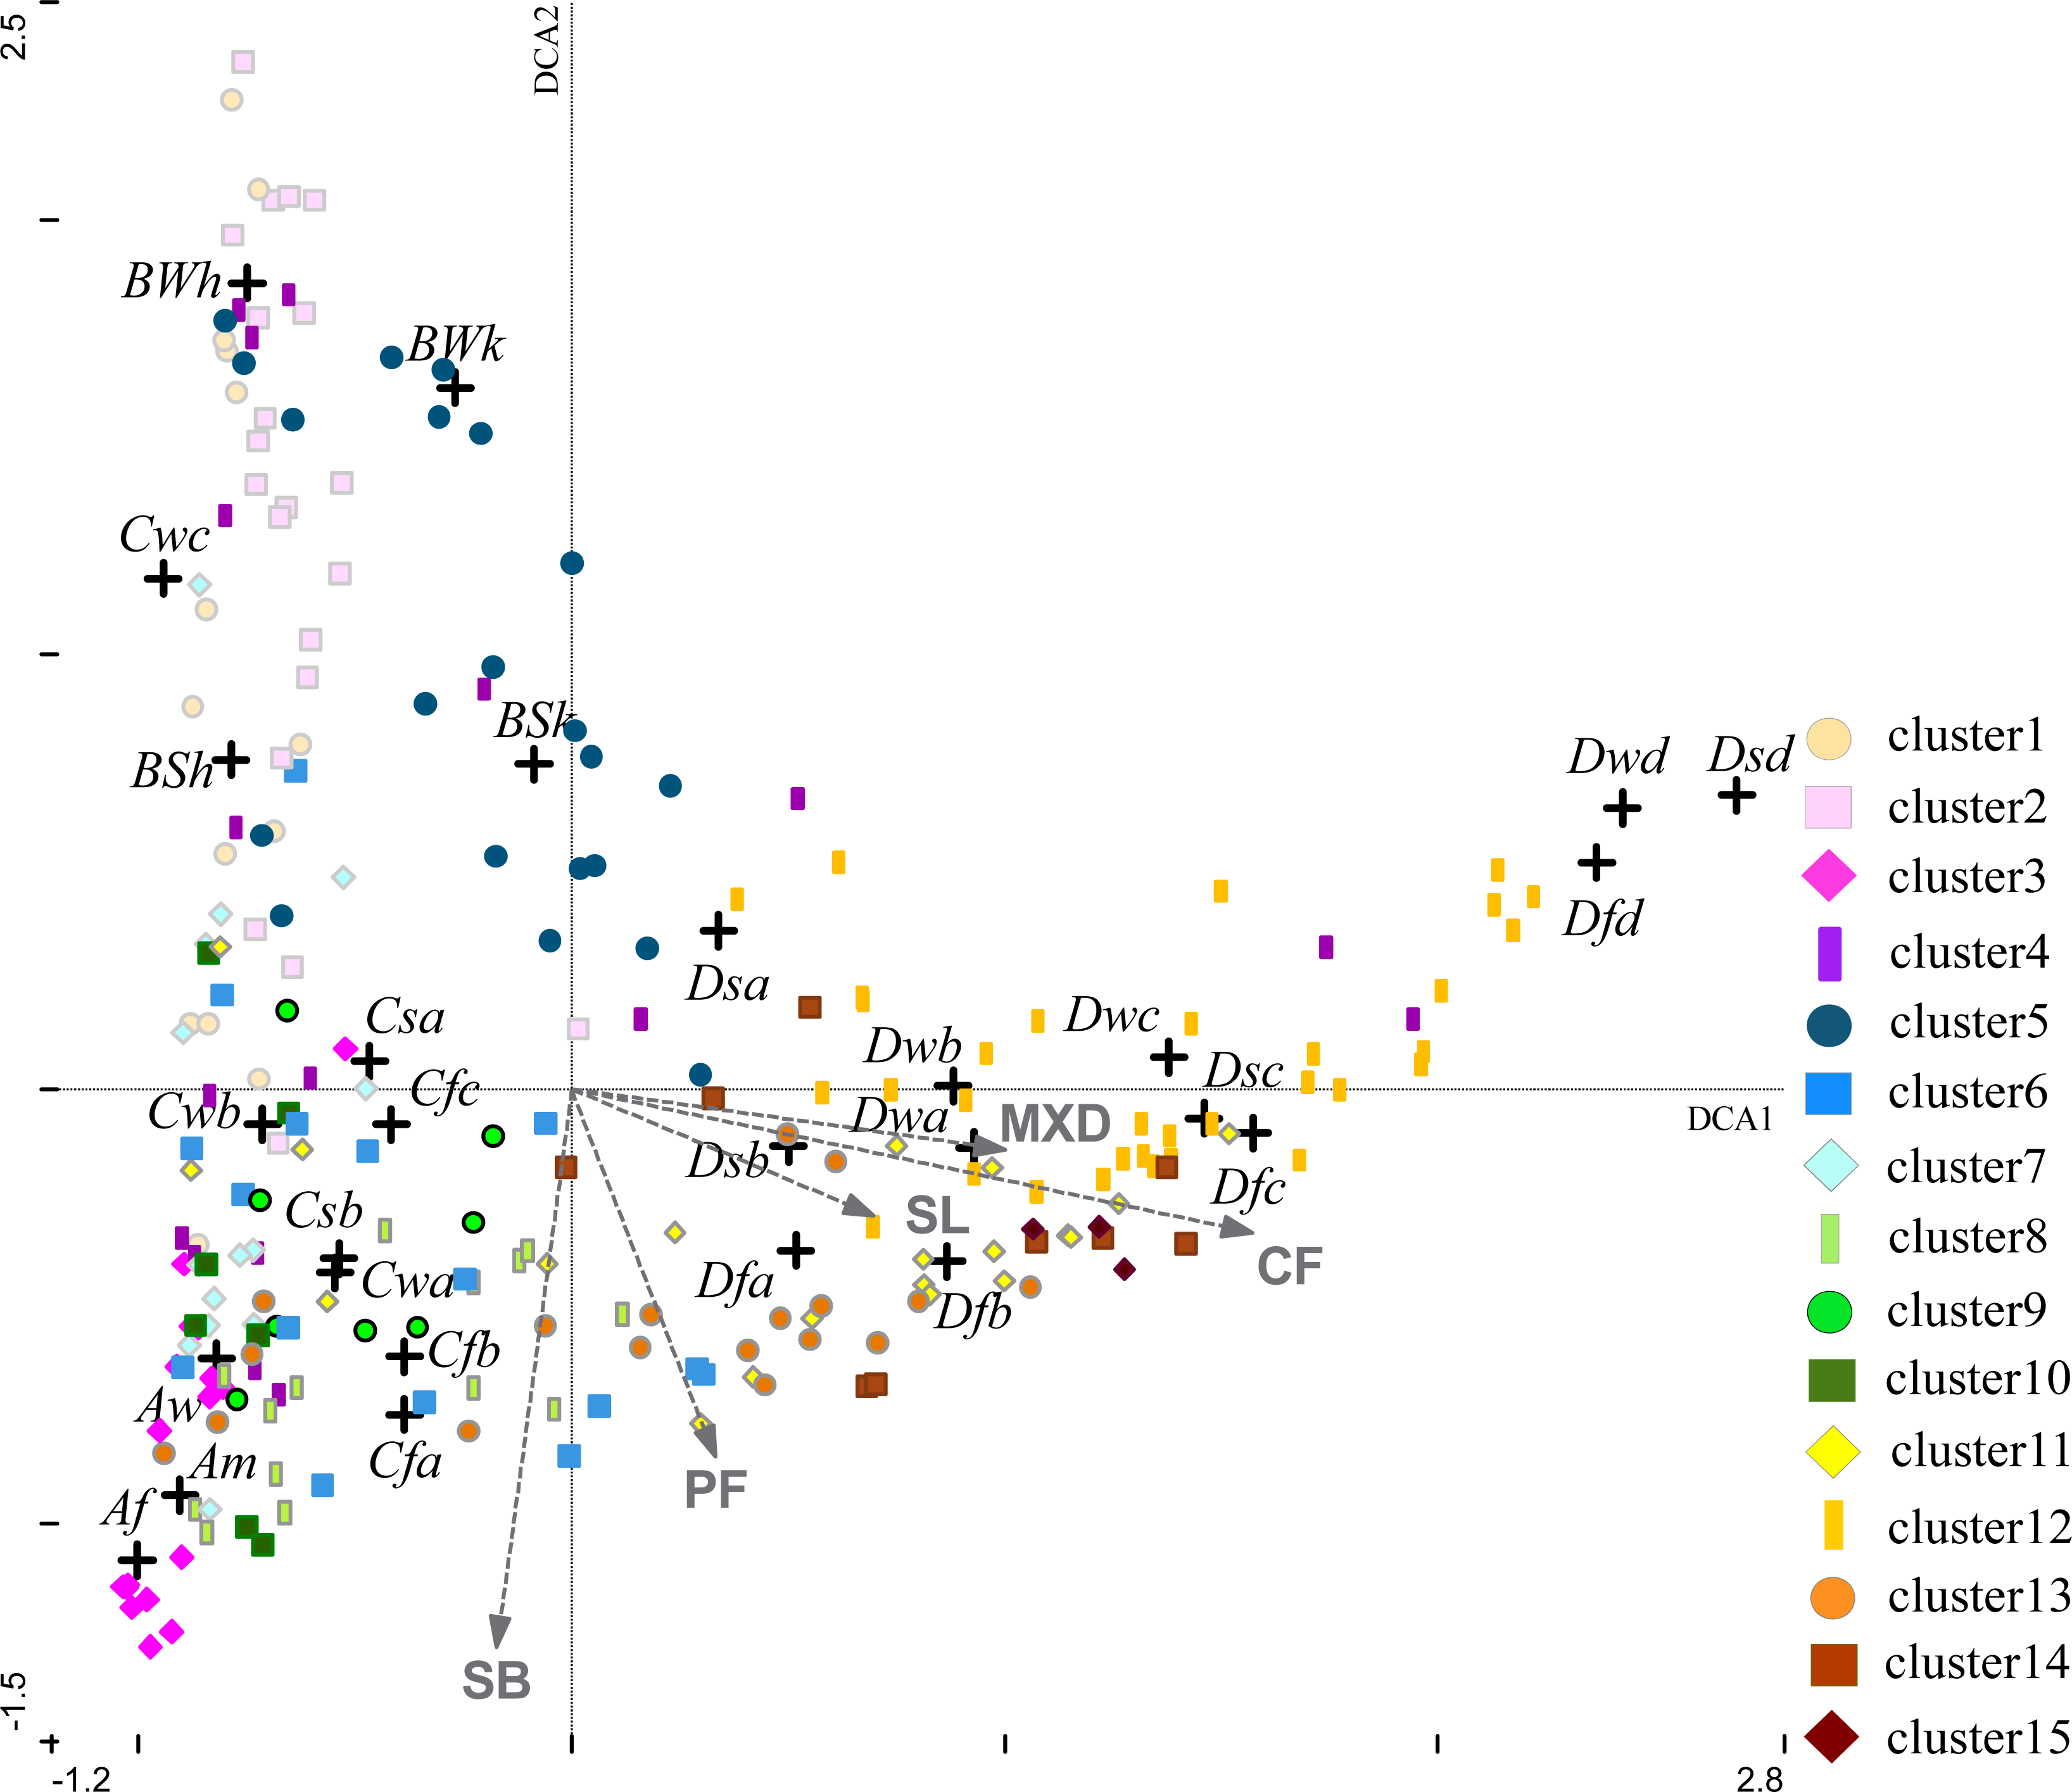
3.4. Relation of the EFTs to Global Climate Classifications
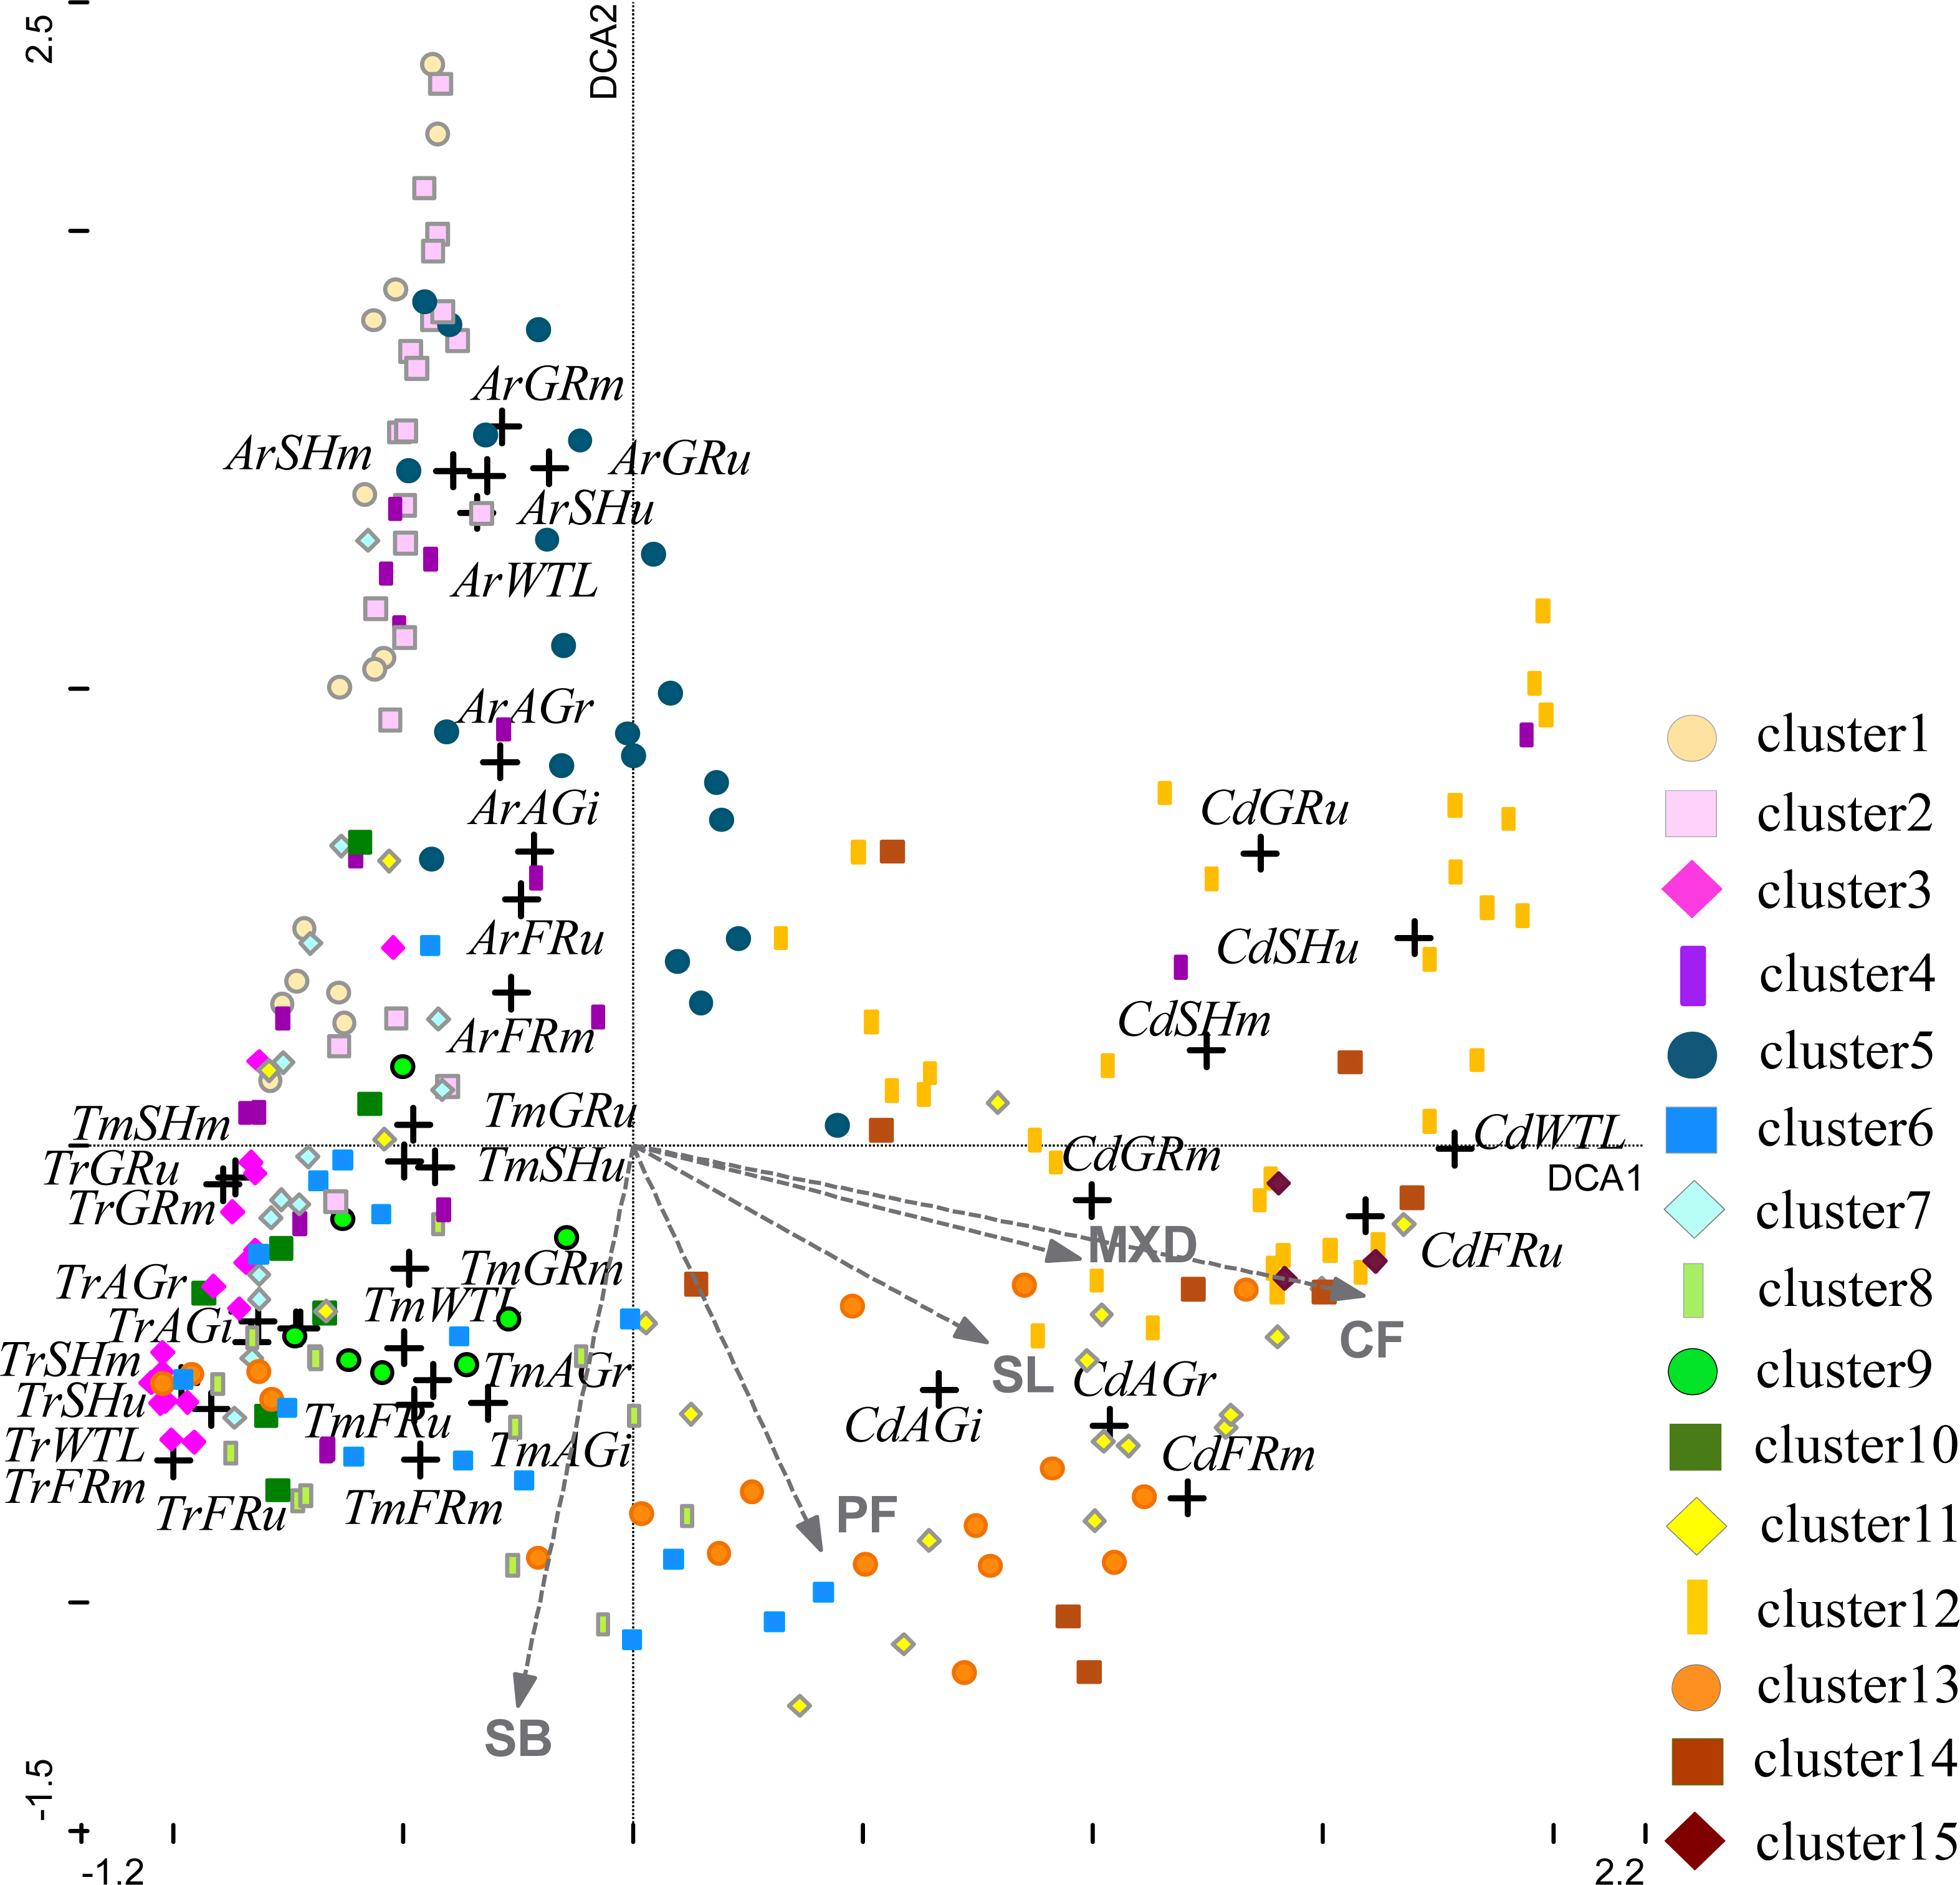
3.5. Relation of the EFTs to the Global Land Use Systems Classification
4. Discussion
5. Conclusions
- (1)
- Gradient analysis confirmed the potential of the Ecosystem Functional Types in assessing the phenological and productivity dynamics of global ecosystems.
- (2)
- Redundancy Analysis showed that the gradient of the Ecosystem Functional Types indicates the global pattern of climatic vegetation growth constraints.
- (3)
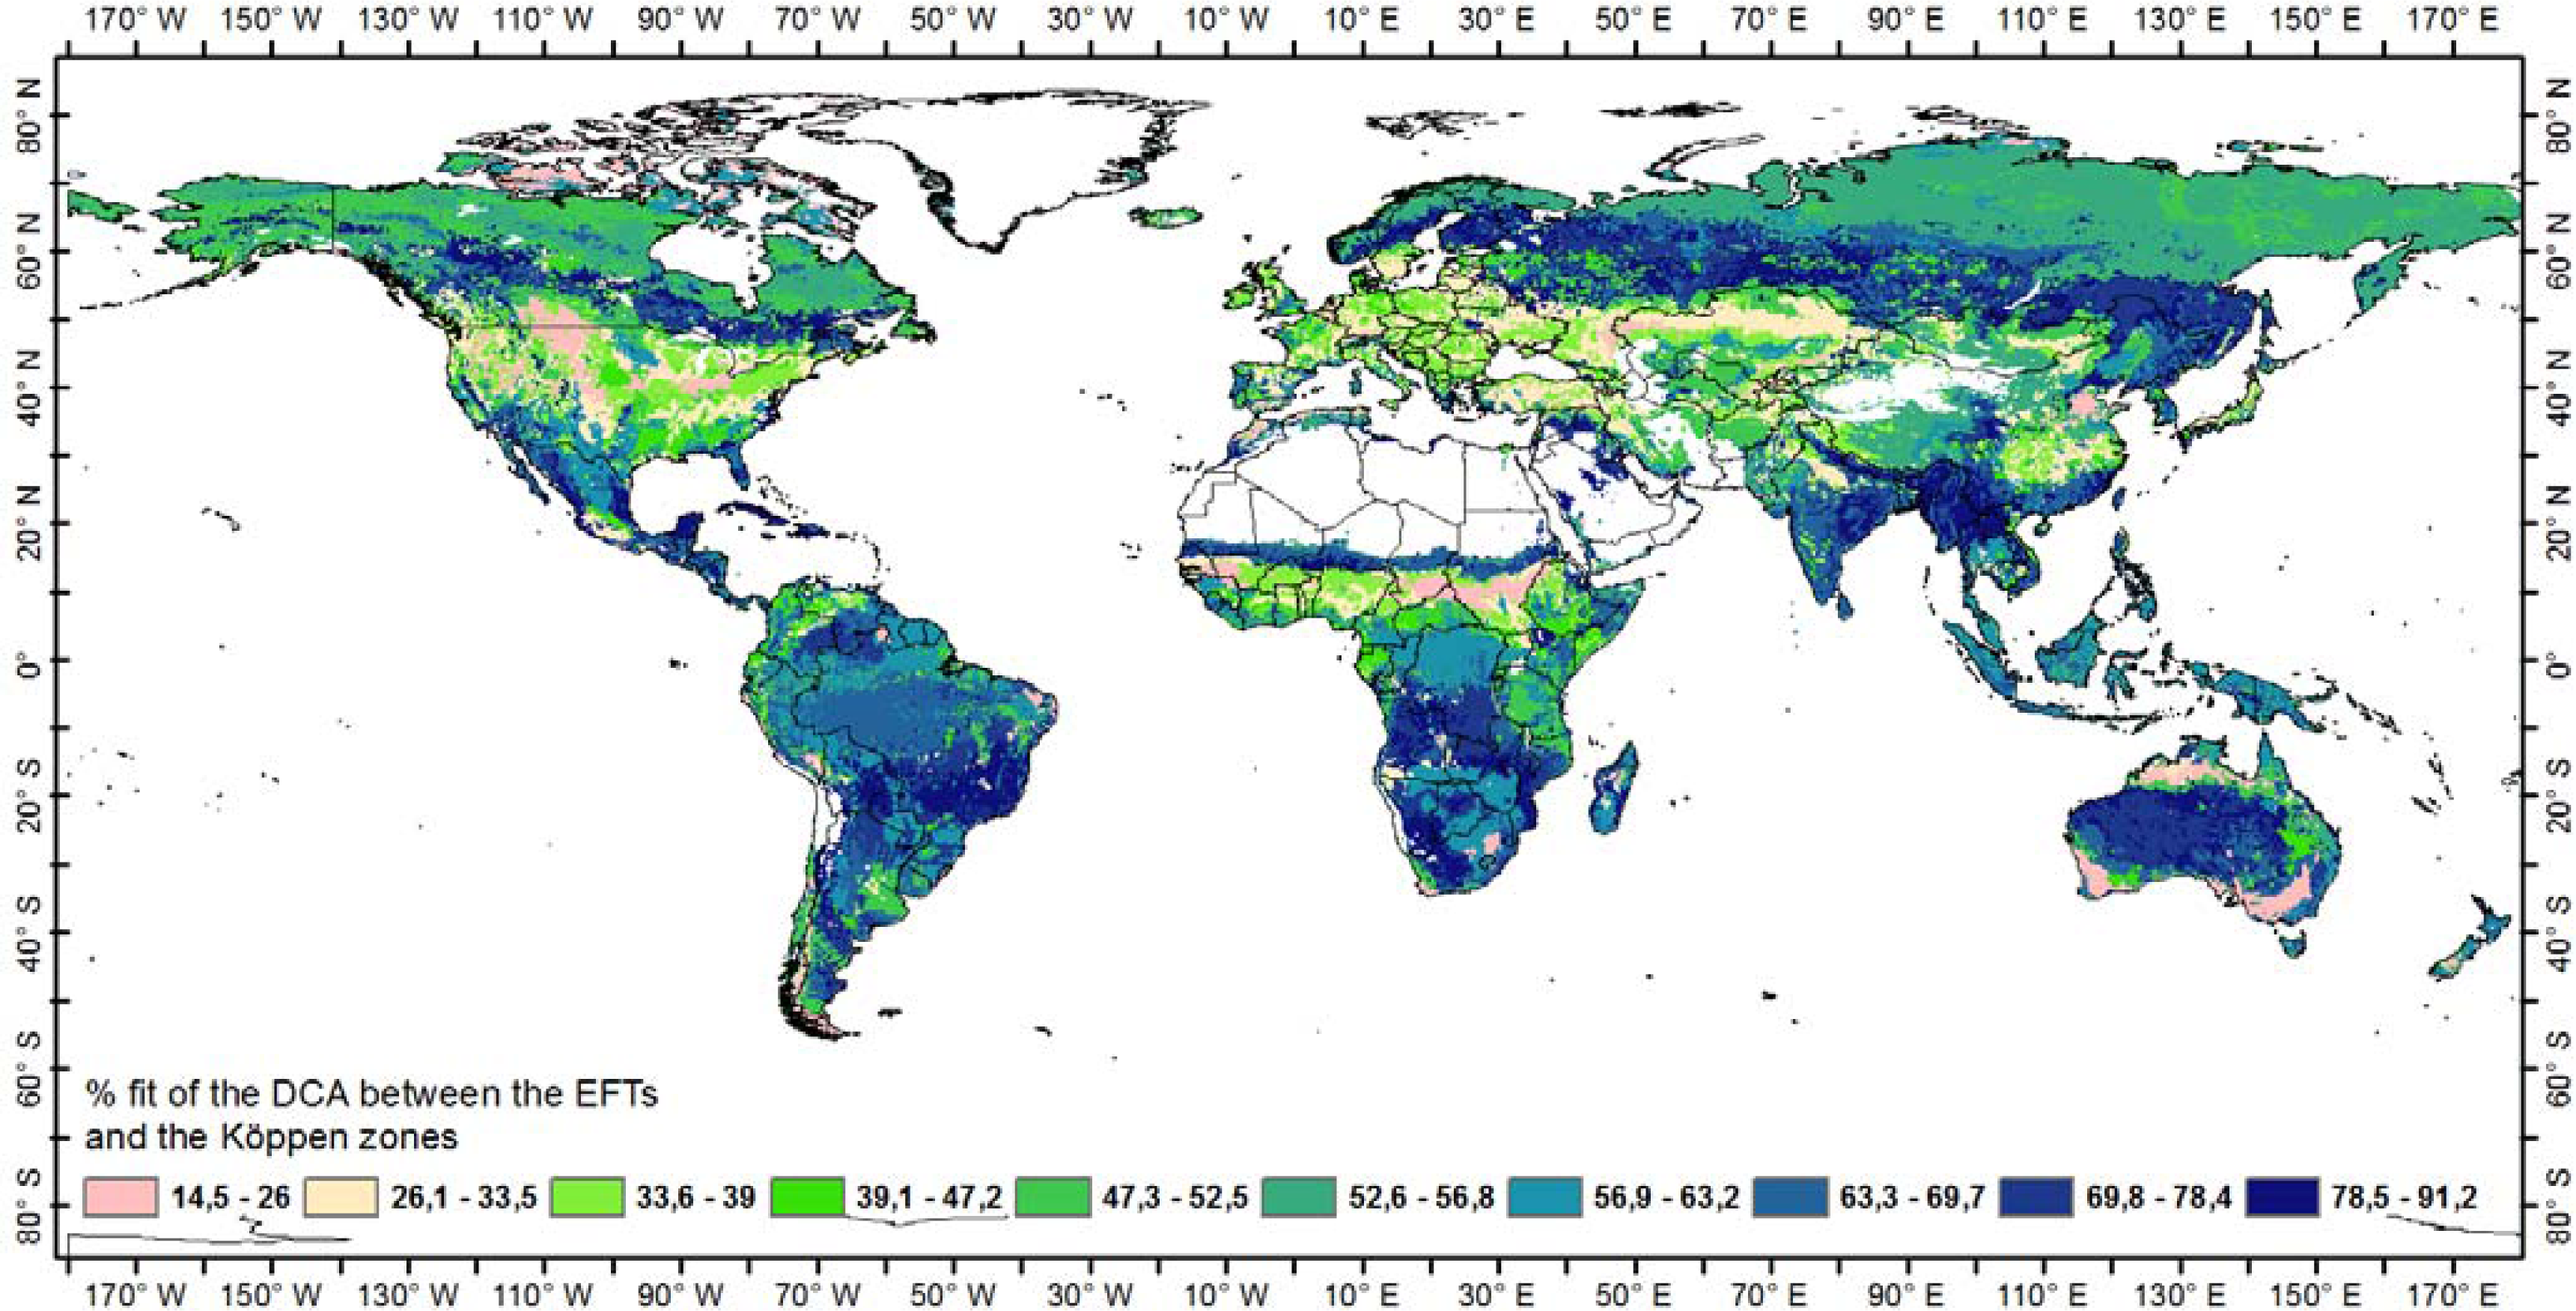
- Correspondence Analysis confirmed that Ecosystem Functional Types relate to classification of global climatic zones.
- (4)
- Correspondence Analysis also indicated that it is not only climate controlling the distribution of Ecosystem Functional Types but that they also correspond to classifications of Land Use Systems, showing that the functional types of global ecosystems might be substantially influenced by anthropogenic activities as well.
- (5)
- By incorporating the spatial information of Earth Observation derived metrics into a new ecosystem functional map, we demonstrated that Ecosystem Functional Types comprise functional information that is not inherent in bio-climatic classifications and have potential in the monitoring of human influence on ecosystem functioning and in supporting ecosystem degradation studies.
Acknowledgments
Conflict of Interest
References
- Ayensu, E.; Claasen, D.V.; Collins, M.; Dearing, A.; Fresco, L.; Gadgil, M.; Gitay, H.; Glaser, G.; Lohn, C.L.; Krebs, J.; et al. Ecology—International ecosystem assessment. Science 1999, 286, 685–686. [Google Scholar]
- Ellis, E.C.; Ramankutty, N. Putting people in the map: Anthropogenic biomes of the world. Front. Ecol. Environ 2007, 6, 439–447. [Google Scholar]
- Lambin, E.F.; Geist, H.J. (Eds.) Land Use and Land Cover Change: Local Processes and Global Imoacts; Springer Verlag: New York, NY, USA, 2006; p. 222.
- Hellden, U.; Tottrup, C. Regional desertification: A global synthesis. Global Planet. Change 2008, 64, 169–176. [Google Scholar]
- Vogt, J.; Safriel, U.; von Maltitz, G.; Sokona, Y.; Zougmore, R.; Bastin, G.; Hill, J. Monitoring and assessment of land, Degradation and desertification—Towards new conceptual and integrated approaches. Land Degrad. Dev 2011, 22, 150–165. [Google Scholar]
- Fensholt, R.F.; Rasmussen, K.; Kaspersen, P.; Huber, S.; Horion, S.; Swinnen, E. Assessing land degradation/recovery in the African Sahel from long-term earth observation based primary productivity and precipitation relationships. Remote Sens 2013, 5, 664–686. [Google Scholar]
- Wessels, K.J.; Prince, S.D.; Malherbe, J.; Small, J.; Frost, P.E.; VanZyl, D. Can human-induced land degradation be distinguished from the effects of rainfall variability? A case study in South Africa. J. Arid Environ 2007, 68, 271–297. [Google Scholar]
- Prince, S.D. Mapping desertification in Southern Africa. In Land Change Science: Observing, Monitoring and Understanding Trajectories of Change on the Earth’s Surface; Gutman, G., Janetso, A., Eds.; Springer: Berlin, Germany, 2004; pp. 163–184. [Google Scholar]
- Walker, B.H. Biodiversity and ecological redundancy. Conserv. Biol 1992, 6, 18–23. [Google Scholar]
- Noble, I.R.; Gitay, H. A functional classification for predicting the dynamics of landscapes. J. Veg. Sci 1996, 7, 329–336. [Google Scholar]
- Diaz, S.; Abido, M. Plant functional types and ecosystem function in relation to global change. J. Veg. Sci 1997, 8, 463–474. [Google Scholar]
- Paruelo, J.M.; Jobbagy, E.G.; Sala, O.E. Current distribution of ecosystem functional types in temperate South America. Ecosystems 2001, 4, 683–698. [Google Scholar]
- Pennington, W. Lags in adjustment of vegetation to climate caused by the pace of soil development: evidence from Britain. Vegetatio 1986, 67, 105–118. [Google Scholar]
- Milchunas, D.G.; Laurenroth, W.K. Inertia in plant community structure: State changes after cessation of nutrient enrichment stress. Ecol. Appl 1995, 5, 1995–2005. [Google Scholar]
- McNaughton, S.; Oesterheld, M.; Frank, D.; Williams, K. Ecosystem-Level patterns of primary productivity and herbivory in terrestrial habitats. Nature 1989, 341, 142–144. [Google Scholar]
- Myneni, R.B.; Keeling, C.D.; Tucker, C.J.; Asrar, G.; Nemani, R.R. Increased plant growth in the northern high latitudes from 1981 to 1991. Nature 1997, 386, 698–702. [Google Scholar]
- Hill, J.; Stellmes, M.; Udelhoven, T.; Roder, A.; Sommer, S. Mediterranean desertification and land degradation: Mapping related land use change syndrimes based on satellite observations. Global Planet. Change 2008, 64, 146–157. [Google Scholar]
- Gu, Y.; Brown, J.F.; Miura, T.; van Leeuwen, W.J.D.; Reed, B.C. phenological classification of the United States: A geographic framework for extending multi-sensor time-series data. Remote Sens 2010, 2, 526–544. [Google Scholar]
- Ivits, E.; Cherlet, M.; Mehl, W.; Sommer, S. Ecosystem functional units characterized by satellite observed phenology and productivity gradients: A case study for Europe. Ecol. Indic 2013, 27, 17–28. [Google Scholar]
- McCloy, K.R. Development and evaluation of phenological change indices derived from time series of image data. Remote Sens 2010, 2, 2442–2473. [Google Scholar]
- Melendez-Pastor, I.; Navarro-Pedreño, J.; Koch, M.; Gómez, I.; Hernández, E.I. Land-Cover phenologies and their relation to climatic variables in an anthropogenically impacted Mediterranean coastal area. Remote Sens 2010, 2, 697–716. [Google Scholar]
- Motohka, T.; Nasahara, K.N.; Oguma, H.; Tsuchida, S. Applicability of green-red vegetation index for remote sensing of vegetation phenology. Remote Sens 2010, 2, 2369–2387. [Google Scholar]
- van Leeuwen, W.J.D.; Davison, J.E.; Casady, G.M.; Marsh, S.E. Phenological characterization of Desert Sky Island vegetation communities with remotely sensed and climate time series data. Remote Sens 2010, 2, 388–415. [Google Scholar]
- Kariyeva, J.; van Leeuwen, W.J.D. Environmental drivers of NDVI-based vegetation phenology in Central Asia. Remote Sens 2011, 3, 203–246. [Google Scholar]
- Ivits, E.; Cherlet, M.; Tóth, G.; Sommer, S.; Mehl, W.; Vogt, J.; Micale, F. Combining satellite derived phenology with climate data for climate change impact assessment. Global Planet. Change 2012, 88–89, 85–97. [Google Scholar]
- Chen, X.; Pan, W. Relationships among phenological growing season, time-integrated normalized difference vegetation index and climate forcing in the temperate region of eastern China. Int. J. Climatol 2002, 22, 1781–1792. [Google Scholar]
- Schwartz, M.D.; Reed, B.C. Surface phenology and satellite sensor-derived onset of greenness: An initial comparison. Int. J. Remote Sens 2002, 20, 3451–3457. [Google Scholar]
- Menzel, A. Trends in phenological phases in Europe between 1951 and 1996. Int. J. Biometeorol 2000, 44, 76–81. [Google Scholar]
- Nemani, R.R.; Keeling, C.D.; Hashimoto, H.; Jolly, W.M.; Piper, S.C.; Tucker, C.J.; Myneni, R.B.; Running, S.W. Climate-driven increases in global terrestrial net primary production from 1982 to 1999. Science 2003, 300, 1560–1563. [Google Scholar]
- Lloyd, D. A phenological classification of terrestrial vegetation cover using shortwave vegetation index imagery. Int. J. Remote Sens 1990, 11, 2269–2279. [Google Scholar]
- Soriano, A.; Paruelo, J.M. Biozones: Vegetation units defined by functional characters identifiable with the aid of satellite sensor images. Global Ecol. Biogeogr 1992, 2, 82–89. [Google Scholar]
- Alcaraz-Seguera, D.; Paruelo, J.M.; Epstein, H.E.; Cabello, J. Environmental and human controls of ecosystem functional diversity in temperate South America. Remote Sens 2013, 5, 127–154. [Google Scholar]
- Dregne, H.E. Land degradation in the drylands. Arid Land Res. Manag 2002, 16, 99–132. [Google Scholar]
- Stow, D.; Daeschner, S.; Boynton, W.; Hope, A. Arctic tundra functional types by classification of single-date and AVHRR bi-weekly NDVI composite datasets. Int. J. Remote Sens 2000, 21, 1773–1779. [Google Scholar]
- Alcaraz-Seguera, D.; Paruelo, J.M.; Cabello, J. Identification of current ecosystem functional types in the Iberian Peninsula. Global Ecol. Biogeogr 2006, 15, 200–212. [Google Scholar]
- Alcaraz-Seguera, D.; Cabello, J.; Paruelo, J. Basline characterisation of major Iberian vegetation types based on the NDVI dynamics. Plant Ecol 2009, 202, 13–29. [Google Scholar]
- Fernández, N.; Paruelo, J.M.; Delibes, M. Ecosystem functioning of protected and altered Mediterranean environments: A remote sensing classification in Doñana, Spain. Remote Sens. Environ 2010, 114, 211–220. [Google Scholar]
- Vermote, E.; Kaufman, Y.J. Absolute calibration of AVHRR visible and near-infrared channels using ocean and cloud views. Int. J. Remote Sens 1995, 16, 2317–2340. [Google Scholar]
- Los, S.O. Estimation of the ratio of sensor degradation between NOAA AVHRR channels 1 and 2 from monthly NDVI composites. IEEE Trans. Geosci. Remote Sens 1998, 36, 206–213. [Google Scholar]
- Stowe, L.L.; McClain, E.P.; Carey, R.; Pellegrino, P.; Gutman, G.G.; Davis, P.; Long, C.; Hart, S. Global distribution of cloud cover derived from NOAA/AVHRR operational satellite data. Adv. Space Res 1991, 3, 51–54. [Google Scholar]
- Tucker, C.J.; Pinzon, J.E.; Brown, M.E.; Slayback, D.A.; Pak, E.W.; Mahoney, R.; Vermote, E.F.; El Saleous, N. An extended AVHRR 8-km NDVI dataset compatible with MODIS and SPOT vegetation NDVI data. Int. J. Remote Sens 2005, 26, 4485–4498. [Google Scholar]
- Pinzon, J.E.; Brown, M.E.; Tucker, C.J. EMD Correction of Orbital Drift Artifacts in Satellite Datastream. In Hilbert-Huang Transform and Its Applications; Interdisciplinary Mathematical Sciences; Huang, N.E., Shen, S.P., Eds.; World Scientific: Singapore, 2005; Volume 5. [Google Scholar]
- Fensholt, R.; Proud, S.R. Evaluation of Earth observation based global long term vegetation trends—Comparing GIMMS and MODIS global NDVI time series. Remote Sens Environ 2012, 119, 131–147. [Google Scholar]
- Churkina, G.; Running, S.W. Contrasting climatic controls on the estimated productivity of global terrestrial biomes. Ecosystems 1998, 1, 206–215. [Google Scholar]
- Peel, M.C.; Finlayson, B.L.; McMahon, T.A. Updated world map of the Köppen-Geiger climate classification. Hydrol. Earth Syst. Sci 2007, 11, 1633–1644. [Google Scholar]
- Nachtergaele, F.; Petri, M. Land Degradation Assessment in Drylands: Mapping Land Use Systems at Global and Regional Scales for Land Degradation Assessment Analysis; Food and Agriculture Organization of the United Nations: Rome, Italy, 2011. [Google Scholar]
- Reed, B.; Brown, J.F.; Vanderzee, D.; Loveland, T.R.; Merchant, J.W.; Ohlen, D.O. Measuring phenological variability from satellite imagery. J. Veg. Sci 1994, 5, 703–714. [Google Scholar]
- Kaiser, H.F. The varimax criterion for analytic rotation in factor analysis. Psychometrika 1958. [Google Scholar] [CrossRef]
- Hill, M.O.; Gauch, H.G. Detrended correspondence analysis, an improved ordination technique. Vegetatio 1980, 42, 47–58. [Google Scholar]
- DeGaetano, A.T.; Knapp, W.W. Standardization of weekly growing degree day accumulations based on differences in temperature observation time and method. Agric. For. Meteorol 1993, 66, 1–19. [Google Scholar]
- Yang, S.; Logan, J.; Coffey, D.L. Mathematical formulae for calculating the base temperature for growing degree days. Agric. For. Meteorol 1995, 74, 61–74. [Google Scholar]
- Stephenson, N.L. Climatic control of vegetation distribution: The role of the water balance. Am. Nat 1990, 135, 649–670. [Google Scholar]


| LUS Classes | Code | Köppen Climatic Zones | Code | Köppen Climatic Zones | Code |
|---|---|---|---|---|---|
| Forests, unmanaged | FRu | Tropical rainforest | Af | Temperate, dry winter, cold summer | Cwc |
| Forests, managed | FRm | Tropical Monsoon | Am | Cold, dry and hot summer | Dsa |
| Grassland, unmanaged | GRu | Tropical Savannah | Aw | Cold, dry and warm summer | Dsb |
| Grassland, managed | GRm | Arid, desert, hot | Bwh | Cold, dry and cold summer | Dsc |
| Shrubland, unmanaged | SHu | Arid, desert, cold | Bwk | Cold, dry summer, very cold winter | Dsd |
| Shrubland, managed | SHm | Arid, steppe, hot | Bsh | Cold, dry winter, hot summer | Dwa |
| Rainfed agriculture | AGr | Arid, steppe, cold | Bsk | Cold, dry winter, warm summer | Dwb |
| Irrigated agriculture | AGi | Temperate, Dry and hot summer | Csa | Cold, dry winter, cold summer | Dwc |
| Wetlands | WTL | Temperate, Dry and warm summer | Csb | Cold, dry and very cold winter | Dwd |
| Temperate, no dry season, hot summer | Cfa | Cold, no dry season, hot summer | Dfa | ||
| Temperate, no dry season, warm summer | Cfb | Cold, no dry season, warm summer | Dfb | ||
| Temperate, no dry season, cold summer | Cfc | Cold, no dry season, cold summer | Dfc | ||
| Temperate, dry winter, hot summer | Cwa | Cold, no dry season, very cold winter | Dfd | ||
| Temperate, dry winter, warm summer | Cwb |
| Component | Eigenvalues | % of Explained Variance | Cumulative % of Explained Variance |
|---|---|---|---|
| Screening PCA with 10 variables (as in Figure 1) | |||
| 1 | 4.1 | 41.1 | 41.1 |
| 2 | 1.9 | 19.4 | 60.5 |
| 3 | 1.7 | 17.4 | 77.9 |
| 4 | 1.3 | 12.5 | 90.4 |
| 5 | 0.8 | 8.2 | 98.6 |
| Final PCA with 5 selected variables | |||
| 1 | 1.06 | 21.2 | 21.2 |
| 2 | 1.02 | 20.4 | 41.6 |
| 3 | 1.01 | 20.3 | 61.9 |
| 4 | 0.99 | 19.9 | 81.8 |
| 5 | 0.91 | 18.2 | 100.0 |
| Rotated PCA Components | |||||
|---|---|---|---|---|---|
| Variables | PC1 | PC2 | PC3 | PC4 | PC5 |
| Season Length | 0.184 | 0.928 | 0.086 | 0.199 | 0.239 |
| Permanent Fraction | 0.392 | 0.289 | −0.016 | 0.148 | 0.861 |
| Cyclic Fraction | 0.032 | 0.193 | 0.265 | 0.936 | 0.122 |
| Standing Biomass | 0.928 | 0.178 | −0.104 | 0.024 | 0.308 |
| Maximum Day | −0.093 | 0.074 | 0.963 | 0.242 | −0.016 |
| Axis1 | Axis2 | Axis3 | Axis4 | |
|---|---|---|---|---|
| Eigenvalues | 0.343 | 0.139 | 0.018 | 0.226 |
| Cumulative % of explained variance | 34.3 | 48.3 | 50.0 | 72.7 |
| Sum of canonical eigenvalues | 0.500 | |||
| Monte Carlo test: F-ratio/significance | 76.135/p < 0.001 | |||
| Axis1 | Axis2 | Axis3 | Axis4 | |
|---|---|---|---|---|
| Eigenvalues | 0.641 | 0.354 | 0.157 | 0.065 |
| Cumulative % of explained variance | 30.1 | 46.7 | 54.1 | 57.1 |
| Axis1 | Axis2 | Axis3 | Axis4 | |
|---|---|---|---|---|
| Eigenvalues | 0.586 | 0.306 | 0.077 | 0.043 |
| Cumulative % of explained variance | 35.1 | 53.4 | 58.0 | 60.6 |
© 2013 by the authors; licensee MDPI, Basel, Switzerland This article is an open access article distributed under the terms and conditions of the Creative Commons Attribution license (http://creativecommons.org/licenses/by/3.0/).
Share and Cite
Ivits, E.; Cherlet, M.; Horion, S.; Fensholt, R. Global Biogeographical Pattern of Ecosystem Functional Types Derived From Earth Observation Data. Remote Sens. 2013, 5, 3305-3330. https://doi.org/10.3390/rs5073305
Ivits E, Cherlet M, Horion S, Fensholt R. Global Biogeographical Pattern of Ecosystem Functional Types Derived From Earth Observation Data. Remote Sensing. 2013; 5(7):3305-3330. https://doi.org/10.3390/rs5073305
Chicago/Turabian StyleIvits, Eva, Michael Cherlet, Stephanie Horion, and Rasmus Fensholt. 2013. "Global Biogeographical Pattern of Ecosystem Functional Types Derived From Earth Observation Data" Remote Sensing 5, no. 7: 3305-3330. https://doi.org/10.3390/rs5073305
APA StyleIvits, E., Cherlet, M., Horion, S., & Fensholt, R. (2013). Global Biogeographical Pattern of Ecosystem Functional Types Derived From Earth Observation Data. Remote Sensing, 5(7), 3305-3330. https://doi.org/10.3390/rs5073305