Comparison of Satellite-Derived Land Surface Temperature and Air Temperature from Meteorological Stations on the Pan-Arctic Scale

 ,
,
Abstract
:1. Introduction
2. Data
2.1. Remote Sensing Data
2.1.1. AVHRR Polar Pathfinder Land Surface Temperature
2.1.2. MODIS Land Surface Temperature (MOD11C1, MYD11C1)
2.1.3. Land Surface Temperature from AATSR
2.2. Global Surface Summary of Day Data—Version 7
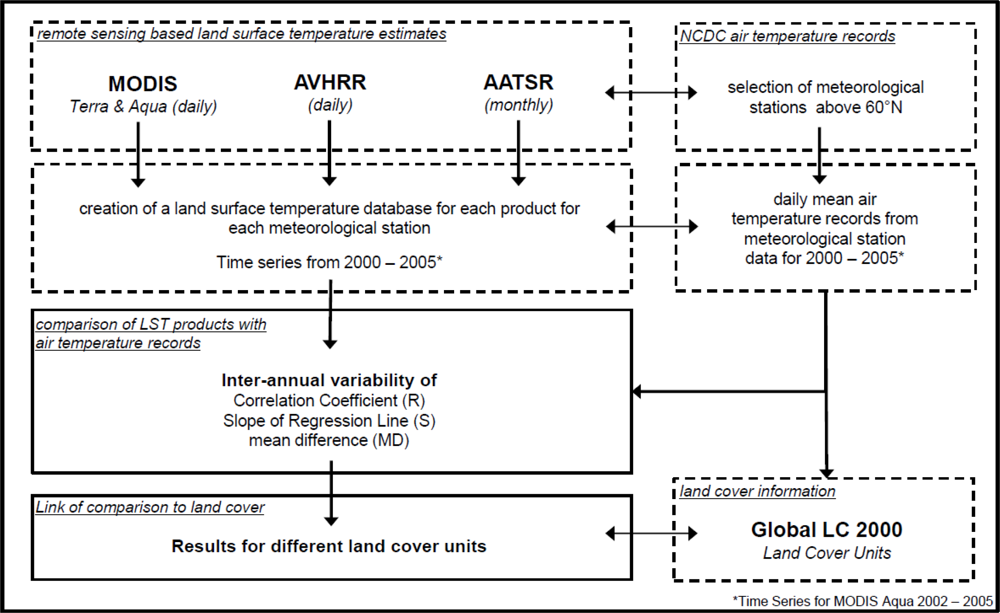
3. Methodology
- (1)
- Extraction of meteorological stations on pan-arctic scale (above 60 degrees north).
- (2)
- Identification of geographic location of meteorological stations and extraction of data from pixels in remote sensing-based LST products.
- (3)
- Comparison of LST and Tair time series for the whole temporal coverage of each product.
- (4)
- Reduction of both databases to the overlapping time period of the remote sensing products (2000–2005).
- (5)
- Inter-annual comparison of LST and Tair data based on the overlapping time period.
- (6)
- Link of the results to land cover classes extracted for each meteorological stations based on GLC2000 (Global Land Cover 2000).
- The extractions of the meteorological stations, which are situated north of 60 degrees, are done by metadata file, which was provided by the NCDC. This file includes additional information for each station, such as station ID, starting time of acquisition, geographic coordinates, country and measured parameters. This extraction results in over 600 stations suitable for this analysis. After an automated consistency check, identifying missing daily data, the data gaps where filled to create a consistent database. Meteorological stations, which have shown a significant number of missing data, were not used for this study.
- To develop a comprehensive validation database, the geographic coordinates of each of the selected meteorological stations was extracted from the metadata and applied to the remote sensing time series product. Afterwards it was possible to convert the pixel stack from the LST products, which are including each time step, into a single vector. For each meteorological station, a matrix was developed, which included the time, the LST that was based on the remote sensing data, and the Tair values.
- In a first step, the remote sensing-based LST was compared to Tair measurements for the complete time series of each product (Section 4.1). Only daytime temperature information was used in this study. This analysis should give an impression about the agreement between both parameters.
- To derive a detailed insight in the comparison and to assure the comparability of this study, the overlapping period of the remote sensing products (2000–2005) was analyzed (Section 4.2).
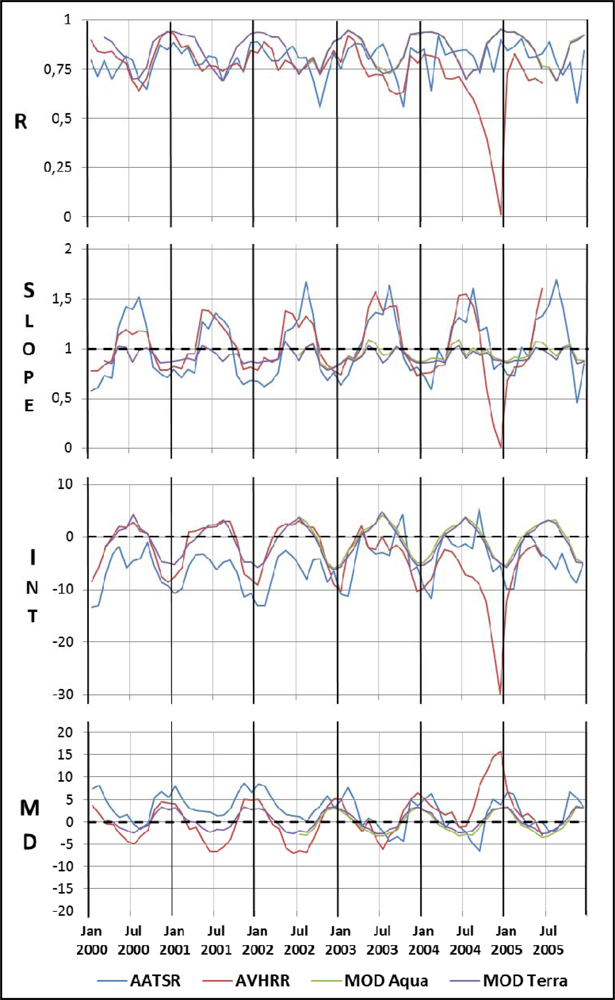
- For this time period, the inter-annual variability between LST and Tair were analyzed, using different statistical parameters, such as the Pearson correlation coefficient (R), the slope (S) and the intercept of the regression line (I), as well as the mean difference (MD).
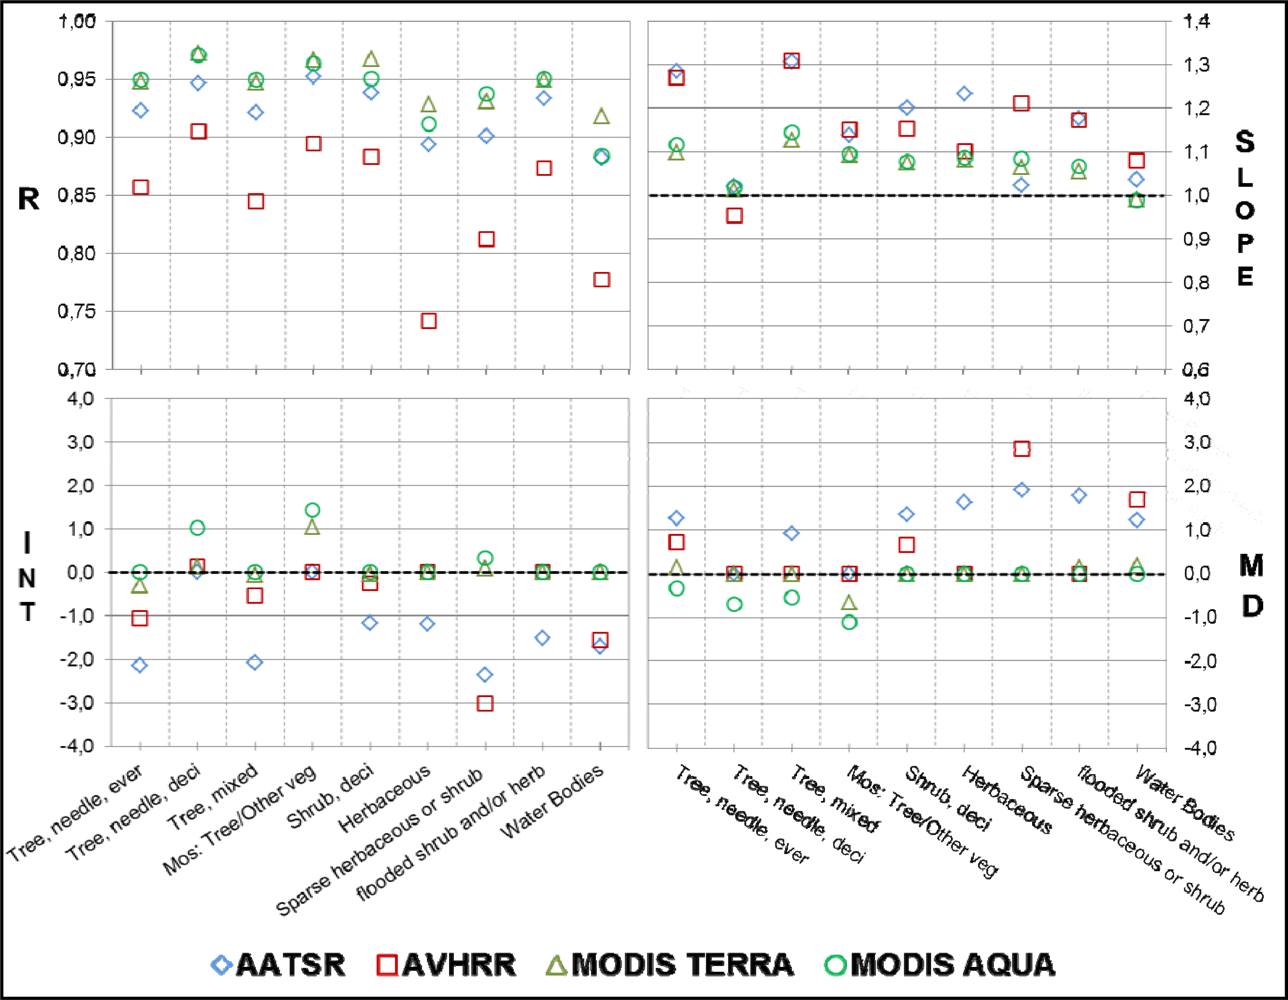
- Prior to the inter-annual variability by comparing LST and Tair time series information, the results were linked to land cover units (Sections 4.3 and 4.4). The goal was to provide information about land cover classes, which are showing the highest variability and discrepancies between remote sensing and ground temperature measurements. The aim was to use the most recent global land cover product GlobCover 2009, developed by ESA [50]. Unfortunately, this classification is not suitable for this analysis, since the land cover class “needle-leaved deciduous forest” (80) does not appear in the final product. The reason for that is that this class needs a seasonal observation from a remote sensing satellite, which was not sufficient for this classification [50]. Thus, the Global Land Cover Classification 2000 (GLC2000), produced by the Joint Research Centre (JRC), was used for this study. This classification is based on satellite data from VEGETATION on SPOT-4 and uses the standardized Land Cover Classification System (LCCS) developed by FAO (Food and Agriculture Organization) as land cover legend [51]. A brief overview of the methodology is shown in Figure 1.
4. Results and Discussion
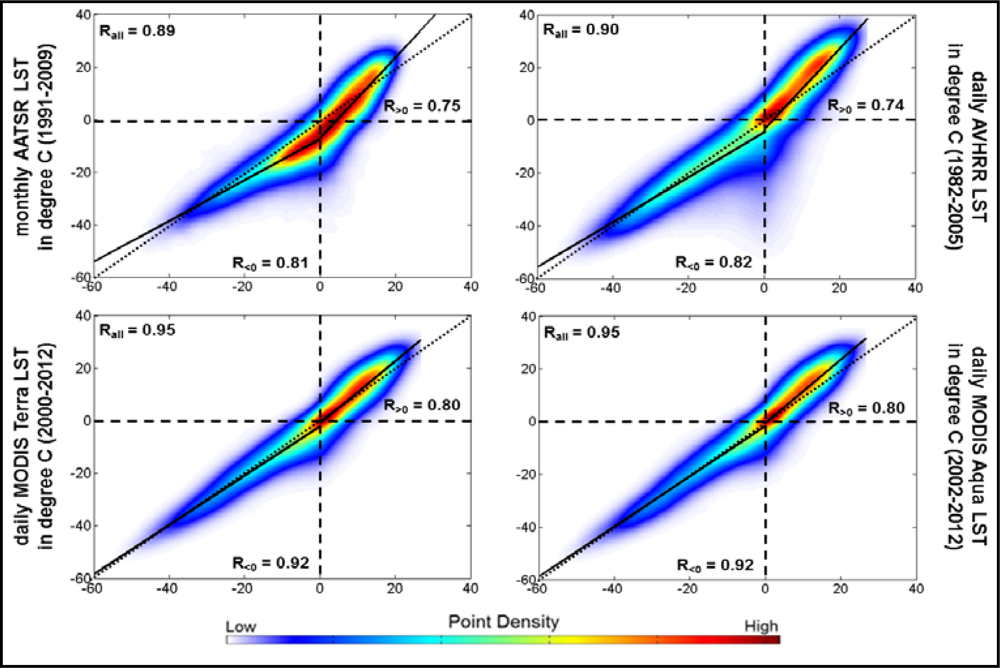
4.1. Correlation of Remote Sensing-Based LST Estimates with Tair Measurements
4.2. Inter-Annual Variability of LST Estimates for the Time Period between 2000 and 2005
4.3. Comparison of Land Surface Temperature and Air Temperature for Selected Land Cover Classes
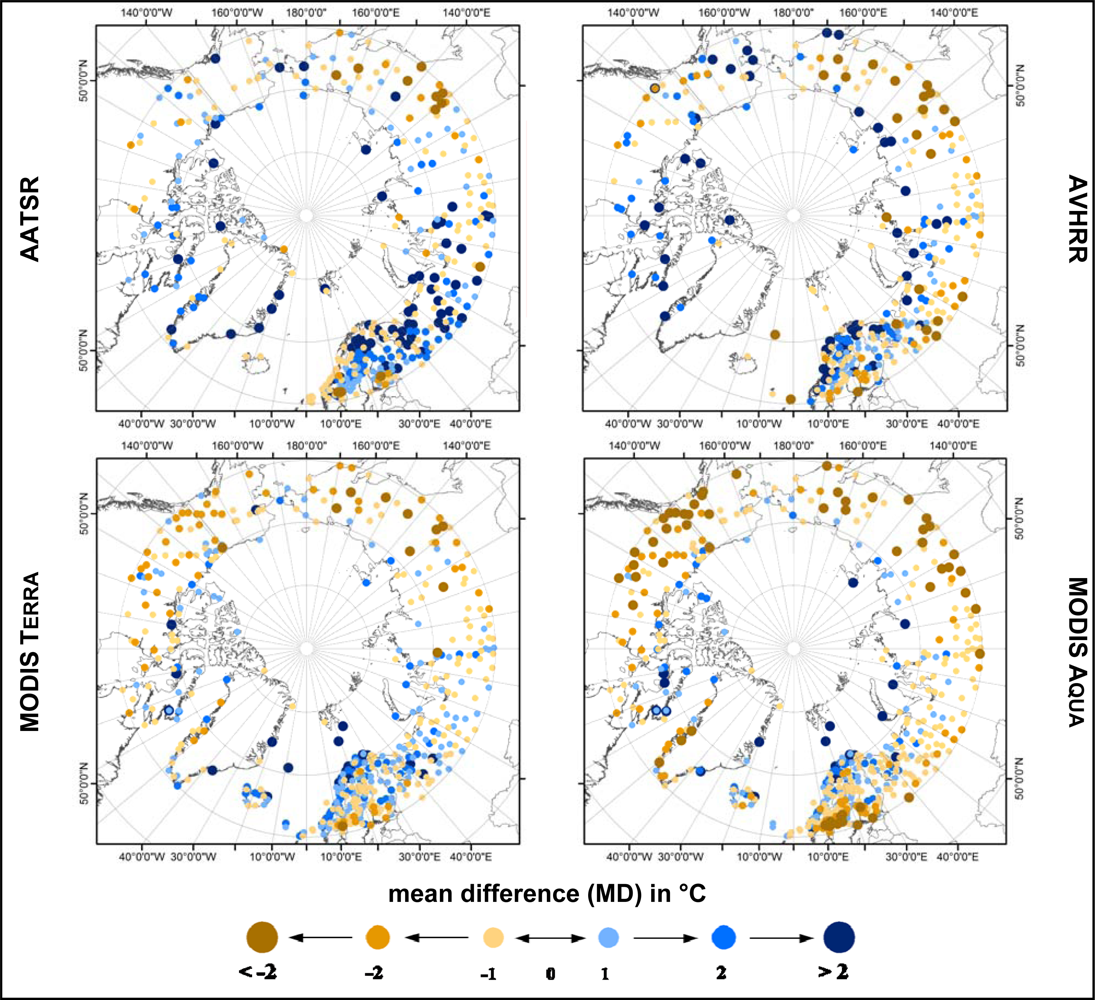
4.4. Pan-Arctic Perspective of the Mean Difference for the Time Period of 2000–2005
5. Conclusion and Outlook
Acknowledgments
- Conflict of InterestThe authors declare no conflict of interest.
References
- GCOS. Supplemental Details to the Satellite-Based Component of the “Implementation Plan for the Global Observing System for Climate in Support of the UNFCCC (2010 Update). 2011. Avaiable online: http://www.wmo.int/pages/prog/gcos/documents/SatelliteSupplement2011Update.pdf (accessed on 28 February 2013).
- Overpeck, J.; Hughen, K.; Hardy, D.; Bradley, R.; Case, R.; Douglas, M.; Finney, B.; Gajewski, K.; Jacoby, G.; Jennings, A.; et al. Arctic environmental change of the last four centuries. Science 1997, 278, 1251–1256. [Google Scholar]
- Chapin, F.S.; Sturm, M.; Serreze, M.C.; McFadden, J.P.; Key, J.R.; Lloyd, A.H.; McGuire, A.D.; Rupp, T.S.; Lynch, A.H.; Schimel, J.P.; et al. Role of land-surface changes in arctic summer warming. Science 2005, 310, 657–660. [Google Scholar]
- Moritz, R.E.; Bitz, C.M.; Steig, E.J. Dynamics of recent climate change in the Arctic. Science 2002, 297, 1497–1502. [Google Scholar]
- Grace, J.; Beringer, F.; Laszlo, N. Impacts of climate change on the tree line. Ann. Bot. 2002, 90, 537–544. [Google Scholar]
- Nelson, F.E. (Un)frozen in Time. Science 2003, 299, 1673–1675. [Google Scholar]
- Kaplan, J.O.; New, M. Arctic climate change with a 2 °C global warming: Timing, climate patterns and vegetation change. Climatic Change 2006, 79, 213–241. [Google Scholar]
- Post, E.; Forchhammer, M.C.; Bret-Harte, M.S.; Callaghan, T.V.; Christensen, T.R.; Elberling, B.; Fox, A.D.; Gilg, O.; Hik, D.S.; Høye, T.T.; et al. Ecological dynamics across the Arctic associated with recent climate change. Science 2009, 325, 1355–1358. [Google Scholar]
- Hinzman, L.D.; Stow, D.A.; Hope, A.; McGuire, D.; Verbyla, D.; Gamon, J.; Huemmrich, F.; Houston, S.; Racine, C.; Sturm, M.; et al. Remote sensing of vegetation and land-cover change in Arctic Tundra ecosystems. Remote Sens. Environ. 2004, 89, 281–308. [Google Scholar]
- Myneni, R.B.; Keeling, C.D.; Tucker, C.J.; Asrar, G.; Nemani, R.R. Increased plant growth in the northern high latitudes from 1981 to 1991. Nature 1997, 386, 698–702. [Google Scholar]
- Romanovsky, V.; Burgess, M.; Smith, S.; Yoshikawa, K.; Brown, J. Permafrost temperature records: Indicators of climate change. EOS Trans. AGU 2002, 83, 589–594. [Google Scholar]
- Serreze, M.C.; Walsh, J.E.; Osterkamp, T.E.; Dyurgerov, M.; Romanovsky, V.E.; Oechel, W.C.; Morison, J.; Zhang, T.; Barry, R.G. Observational evidence of recent change in the northern high-latitude environment. Climatic Change 2000, 46, 159–207. [Google Scholar]
- Hachem, S.; Duguay, C.R.; Allard, M. Comparison of MODIS-derived land surface temperatures with ground surface and air temperature measurements in continuous permafrost terrain. Cryosphere 2012, 6, 51–69. [Google Scholar] [Green Version]
- Bartsch, A.; Wiesmann, A.; Strozzi, T.; Schmullius, C.; Hese, S.; Duguay, C.; Heim, B.; Seifert, F.M. Implementation of a Satellite Data Based Permafrost Information System—The DUE Permafrost Project. Proceedings of ESA Living Planet Symposium 2010, Bergen, Norway, 28 June–2 July 2010.
- Soliman, A.; Duguay, C.; Saunders, W.; Hachem, S. Pan-arctic land surface temperature from MODIS and AATSR: Product development and intercomparison. Remote Sens. 2012, 4, 3833–3856. [Google Scholar]
- Jin, M.; Dickinson, R.E. Land surface skin temperature climatology: Benefitting from the strengths of satellite observations. Environ. Res. Lett. 2010. [Google Scholar] [CrossRef]
- Mildrexler, D.J.; Zhao, M.; Running, S.W. A global comparison between station air temperatures and MODIS land surface temperatures reveals the cooling role of forests. J. Geophys. Res. 2011, 116, 1–15. [Google Scholar]
- Maslanik, J.; Fowler, I.C.; Key, I.J.; Scambos, T.E.D.; Son, T.H.; Emeryl, V. AVHRR-based polar pathfinder products for modeling applications. Ann. Glaciol. 1997, 25, 388–392. [Google Scholar]
- Green, R.M.; Hay, S.I. The potential of Pathfinder AVHRR data for providing surrogate climatic variables across Africa and Europe for epidemiological applications. Remote Sens. Environ. 2002, 79, 166–175. [Google Scholar]
- Sobrino, J.A.; Julien, Y.; Morales, L. Multitemporal analysis of PAL images for the study of land cover dynamics in South America. Glob. Planet. Chang. 2006, 51, 172–180. [Google Scholar]
- Julien, Y.; Sobrino, J.A.; Verhoef, W. Changes in land surface temperatures and NDVI values over Europe between 1982 and 1999. Remote Sens. Environ. 2006, 103, 43–55. [Google Scholar]
- Ouaidrari, H.; Goward, S.N.; Czajkowski, K.P.; Sobrino, J.A.; Vermote, E. Land surface temperature estimation from AVHRR thermal infrared measurements. An assessment for the AVHRR Land Pathfinder II data set. Remote Sens. Environ. 2002, 81, 114–128. [Google Scholar]
- Fowler, C.; Maslanik, J.; Haran, T.; Scambos, T.; Key, J.; Emery, W. AVHRR Polar Pathfinder Twice-Daily 5 km EASE-Grid Composites V003. Avaiable online: http://nsidc.org/data/docs/daac/nsidc0066_avhrr_5km.gd.html (accessed on 15 March 2012).
- Key, R.; Collins, J.B.; Fowler, C.; Stone, R.S. High-latitude surface temperature from thermal satellite data. Remote Sens. Environ. 1997, 61, 302–309. [Google Scholar]
- Gleason, A.C.R.; Prince, S.D.; Goetz, S.J.; Small, J. Effects of orbital drift on land surface temperature measured by AVHRR thermal sensors. Remote Sens. Environ. 2002, 79, 147–165. [Google Scholar]
- Julien, Y.; Sobrino, J.A. Correcting AVHRR Long Term Data Record V3 estimated LST from orbital drift effects. Remote Sens. Environ. 2012, 123, 207–219. [Google Scholar]
- Hengl, T.; Heuvelink, G.B.M.; Perčec Tadić, M.; Pebesma, E.J. Spatio-temporal prediction of daily temperatures using time-series of MODIS LST images. Theor. Appl. Climatol. 2012, 107, 265–277. [Google Scholar]
- Guangmeng, G.; Mei, Z. Using MODIS land surface temperature to evaluate forest fire risk of northeast China. IEEE Geosci. Remote Sens. Lett. 2004, 1, 98–100. [Google Scholar]
- Julien, Y.; Sobrino, J. The Yearly Land Cover Dynamics (YLCD) method: An analysis of global vegetation from NDVI and LST parameters. Remote Sens. Environ. 2009, 113, 329–334. [Google Scholar]
- Liu, Y.; Hiyama, T.; Yamaguchi, Y. Scaling of land surface temperature using satellite data: A case examination on ASTER and MODIS products over a heterogeneous terrain area. Remote Sens. Environ. 2006, 105, 115–128. [Google Scholar]
- Langer, M.; Westermann, S.; Boike, J. Spatial and temporal variations of summer surface temperatures of wet polygonal tundra in Siberia—Implications for MODIS LST based permafrost monitoring. Remote Sens. Environ. 2010, 114, 2059–2069. [Google Scholar]
- Hulley, G.C.; Hook, S.J. Intercomparison of versions 4, 4.1 and 5 of the MODIS Land Surface Temperature and Emissivity products and validation with laboratory measurements of sand samples from the Namib desert, Namibia. Remote Sens. Environ. 2009, 113, 1313–1318. [Google Scholar]
- Zhong, L.; Ma, Y.; Su, Z.; Salama, M.S. Estimation of land surface temperature over the Tibetan Plateau using AVHRR and MODIS data. Adv. Atmos. Sci. 2010, 27, 1110–1118. [Google Scholar]
- Zhang, W.; Huang, Y.; Yu, Y.; Sun, W. Empirical models for estimating daily maximum, minimum and mean air temperatures with MODIS land surface temperatures. Int. J. Remote Sens. 2011, 32, 9415–9440. [Google Scholar]
- Crosson, W.L.; Al-Hamdan, M.Z.; Hemmings, S.N.J.; Wade, G.M. A daily merged MODIS Aqua-Terra land surface temperature data set for the conterminous United States. Remote Sens. Environ. 2012, 119, 315–324. [Google Scholar]
- Savtchenko, A.; Ouzounov, D.; Ahmad, S.; Acker, J.; Leptoukh, G.; Koziana, J.; Nickless, D. Terra and Aqua MODIS products available from NASA GES DAAC. Adv. Space Res. 2004, 34, 710–714. [Google Scholar]
- Wan, Z.; Li, Z. A physics-based algorithm for retrieving land-surface emissivity and temperature from EOS/MODIS Data. IEEE Trans. Geosci. Remote Sens. 1997, 35, 980–996. [Google Scholar]
- Snyder, W.C.; Wan, Z. BRDF models to predict spectral reflectance and emissivity in the thermal infrared. IEEE Trans. Geosci. Remote Sens. 1998, 36, 214–225. [Google Scholar]
- Coll, C.; Hook, S.J.; Galve, J.M. Land surface temperature from the advanced along-track scanning radiometer: Validation over inland waters and vegetated surfaces. IEEE Trans. Geosci. Remote Sens. 2009, 47, 350–360. [Google Scholar]
- Mutlow, C.; Bailey, P.; Birks, A.; Smith, D. ATSR-1/2 User Guide—A Short Guide to the ATSR-1 and -2 Instruments and Their Data Products. 1999, pp. 1–29. Avaiable online: http://www.neodc.rl.ac.uk/docs/atsr/atsr_user_guide_rev_3.pdf (accessed on 11 December 2012).
- Prata, F. Land Surface Temperature Measurement from Space: AATSR Algorithm Theoretical Basis Document. 2002. Avaiable online: https://earth.esa.int/pub/ESA_DOC/LST-ATBD.pdf (accessed on 11 December 2012).
- Dorman, J.L.; Sellers, P.J. A global climatology of albedo, roughness length and stomatal resistance for atmospheric general circulation models as represented by the simple biosphere model (SiB). J. Appl. Meteorol. 1989, 28, 833–855. [Google Scholar]
- Scarpino, M.; Cardaci, M. Envisat-1 Product Specifications, Vol. 7 AATSR Products Specifications, ESA Doc Ref. PO-RS-MDA-GS-2009. 2009, pp. 1–42. Avaiable online: http://envisat.esa.int/pub/ESA_DOC/ENVISAT/Vol07_Aatsr_4A.pdf (accessed on 11 December 2012).
- Pinnock, S. GlobTemperature—Satellite Land Surface Temperature User Consultation. 2012. Avaiable online: https://docs.google.com/viewer?a=v&pid=sites&srcid=ZGVmYXVsdGRvbWFpbnxzaW1vbnBpbm5vY2t8Z3g6NmNlNjMwMjBkZWFmNGQ1MA (accessed on 21 January 2013).
- Kogler, C.; Pinnock, S.; Arino, O.; Casadio, S.; Corlett, G.; Prata, F.; Bras, T. Note on the quality of the (A)ATSR land surface temperature record from 1991 to 2009. Int. J. Remote Sens. 2012, 33, 4178–4192. [Google Scholar]
- Smith, D.L. Update on AATSR Visible Channel Long Term Trends. 2006, pp. 1–11. Avaiable online: https://earth.esa.int/pub/ESA_DOC/ENVISAT/AATSR/Visible_Channel_Update_TN-0552.pdf (accessed on 11 December 2012).
- Ruff, T.W.; Neelin, J.D. Long tails in regional surface temperature probability distributions with implications for extremes under global warming. Geophys. Res. Lett. 2012, 39, 1–6. [Google Scholar]
- Lott, N.; Vose, R.; Del Greco, S.A.; Ross, T.; Worley, S.; Comeaux, J. The Integrated Surface Database: Partnerships and Progress. Proceedings of 88th AMS Annual Meeting—American Meteorological Society, New Orleans, LA, USA, 20–24 January 2008; pp. 1–3.
- NCDC Global Surface Summary of the Day—GSOD 2012. Avaiable online: https://www.ncdc.noaa.gov/cgi-bin/res40.pl (accessed on 13 June 2012).
- Bontemps, S.; Defourny, P.; van Bogaert, E.; Kalogirou, V.; Perez, J.R.; Arino, O. GLOBCOVER 2009 Products Description and Validation Report; ESA ESRIN: Frascati, Italy, 2010.
- Bartholomé, E.; Belward, A.S. GLC2000: A new approach to global land cover mapping from earth observation data. Int. J. Remote Sens. 2005, 26, 1959–1977. [Google Scholar]
- Vardavas, I.; Taylor, F. Radiation and Climate: Atmospheric Energy Budget from Satellite Remote Sensing; Oxford University Press: Oxford, UK, 2012; p. 512. [Google Scholar]
- Sun, J.; Mahrt, L. Determination of surface fluxes from the surface radiative temperature. J. Atmos. Sci. 1995, 52, 1096–1106. [Google Scholar]
- Seidel, D.; Melissa, F. Diurnal cycle of upper-air temperature estimated from radiosondes. J. Geophys. Res. 2005, 110, 1–13. [Google Scholar]
- Frey, C.; Kuenzer, C.; Dech, S. Quantitative comparison of the operational NOAA-AVHRR LST product of DLR and the MODIS LST product. Int. J. Remote Sens. 2012, 33, 7165–7183. [Google Scholar]
- Herold, M.; Mayaux, P.; Woodcock, C.; Baccini, A.; Schmullius, C. Some challenges in global land cover mapping: An assessment of agreement and accuracy in existing 1 km datasets. Remote Sens. Environ. 2008, 112, 2538–2556. [Google Scholar]
- Lu, L.; Venus, V.; Skidmore, A.; Wang, T.; Luo, G. Estimating land-surface temperature under clouds using MSG/SEVIRI observations. Int. J. Appl. Earth Obs. Geoinf. 2011, 13, 265–276. [Google Scholar]
- Dutrieux, L.P.; Bartholomeus, H.; Herold, M.; Verbesselt, J. Relationships between declining summer sea ice, increasing temperatures and changing vegetation in the Siberian Arctic tundra from MODIS time series (2000–11). Environ. Res. Lett. 2012, 7, 1–12. [Google Scholar]
- Smith, A.; Lott, N.; Vose, R. The integrated surface database: Recent developments and partnerships. Bull. Amer. Meteorol. Soc. 2011, 92, 704–708. [Google Scholar]


| Land Cover | AATSR | AVHRR | MOD Terra | MOD Aqua | ø | AATSR | AVHRR | MOD Terra | MOD Aqua | ø |
|---|---|---|---|---|---|---|---|---|---|---|
| R | Mean Difference | |||||||||
| tree, needle, ever | 0.38 | 0.29 | 0.29 | 0.33 | 0.32 | 2.66 | 2.70 | 1.49 | 1.78 | 2.16 |
| tree, needle, deci | 0.49 | 0.48 | 0.50 | 0.50 | 0.49 | 1.51 | 1.46 | 1.17 | 1.51 | 1.41 |
| tree, mixed | 0.39 | 0.37 | 0.36 | 0.38 | 0.38 | 1.76 | 2.86 | 0.98 | 1.19 | 1.70 |
| mos: tree/other veg | 0.46 | 0.42 | 0.43 | 0.45 | 0.44 | 1.44 | 1.59 | 0.82 | 1.21 | 1.26 |
| shrub, deciduous | 0.42 | 0.30 | 0.24 | 0.35 | 0.33 | 3.04 | 3.96 | 1.59 | 1.75 | 2.59 |
| herbaceous | 0.45 | 0.41 | 0.40 | 0.42 | 0.42 | 3.03 | 3.96 | 1.52 | 1.72 | 2.56 |
| sparse herb or shrub | 0.33 | 0.24 | 0.27 | 0.29 | 0.28 | 2.05 | 3.13 | 1.47 | 1.75 | 2.10 |
| flood shrub/herb | 0.42 | 0.38 | 0.41 | 0.44 | 0.41 | 2.13 | 1.87 | 1.22 | 1.13 | 1.59 |
| water bodies | 0.42 | 0.35 | 0.38 | 0.40 | 0.39 | 2.92 | 3.20 | 1.56 | 1.65 | 2.33 |
© 2013 by the authors; licensee MDPI, Basel, Switzerland This article is an open access article distributed under the terms and conditions of the Creative Commons Attribution license ( http://creativecommons.org/licenses/by/3.0/).
Share and Cite
Urban, M.; Eberle, J.; Hüttich, C.; Schmullius, C.; Herold, M. Comparison of Satellite-Derived Land Surface Temperature and Air Temperature from Meteorological Stations on the Pan-Arctic Scale. Remote Sens. 2013, 5, 2348-2367. https://doi.org/10.3390/rs5052348
Urban M, Eberle J, Hüttich C, Schmullius C, Herold M. Comparison of Satellite-Derived Land Surface Temperature and Air Temperature from Meteorological Stations on the Pan-Arctic Scale. Remote Sensing. 2013; 5(5):2348-2367. https://doi.org/10.3390/rs5052348
Chicago/Turabian StyleUrban, Marcel, Jonas Eberle, Christian Hüttich, Christiane Schmullius, and Martin Herold. 2013. "Comparison of Satellite-Derived Land Surface Temperature and Air Temperature from Meteorological Stations on the Pan-Arctic Scale" Remote Sensing 5, no. 5: 2348-2367. https://doi.org/10.3390/rs5052348