Evaluation of Soil Moisture Retrieval from the ERS and Metop Scatterometers in the Lower Mekong Basin

 ,
, 
Abstract
:1. Introduction
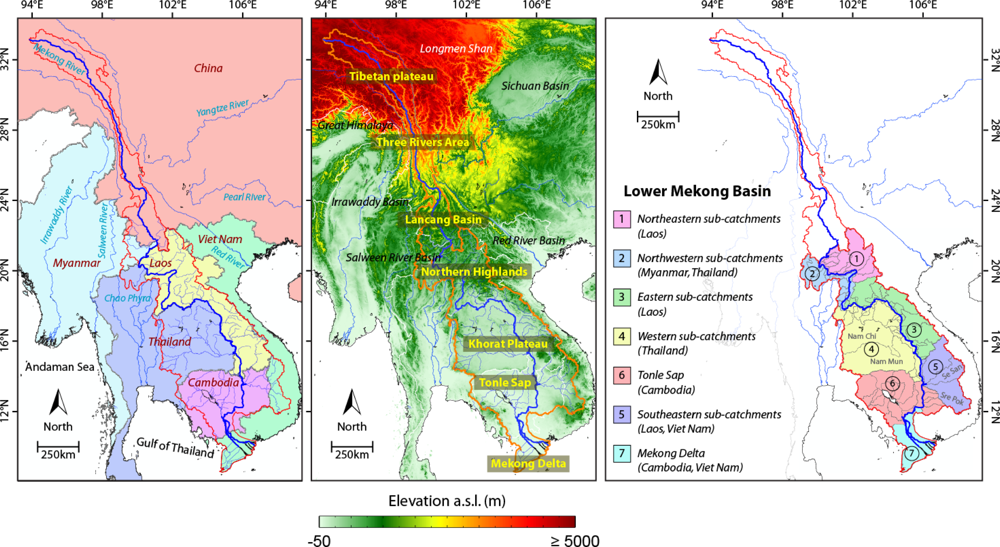
2. Study Area
3. Data
3.1. Scatterometer-Derived Soil Moisture Product
3.2. Hydro-Meteorological Data
3.2.1. Evaporation in situ Data
3.2.2. Reanalysis Precipitation Data
4. Method
4.1. TUWien Soil Moisture Retrieval Algorithm
4.2. TUWien Soil Moisture Retrieval Uncertainty
4.3. Basin Water Index (BWI)
5. Results and Discussion
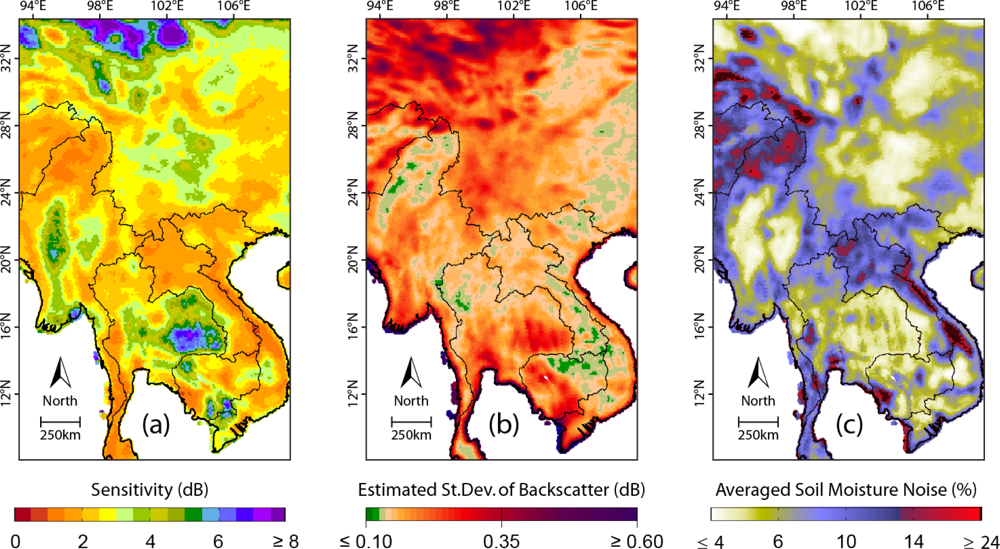
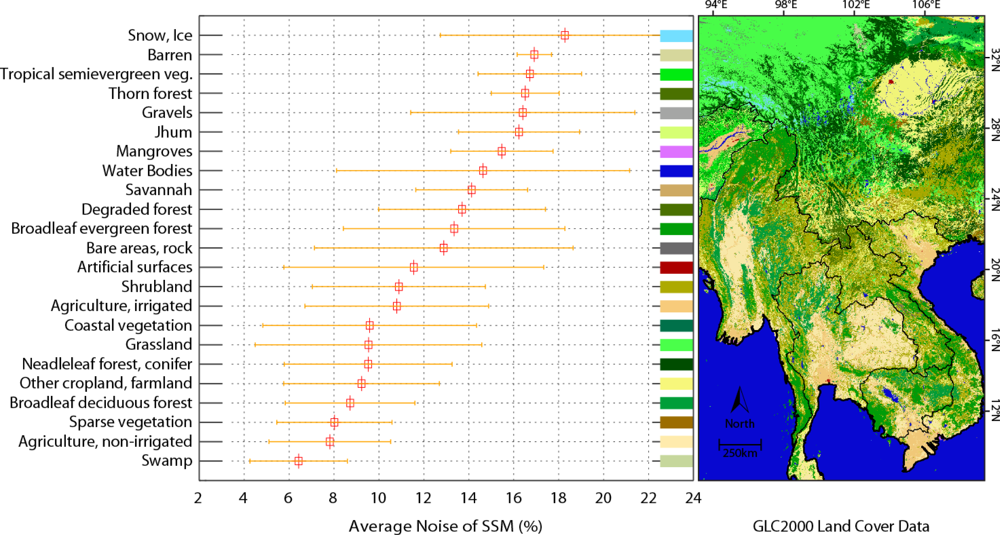
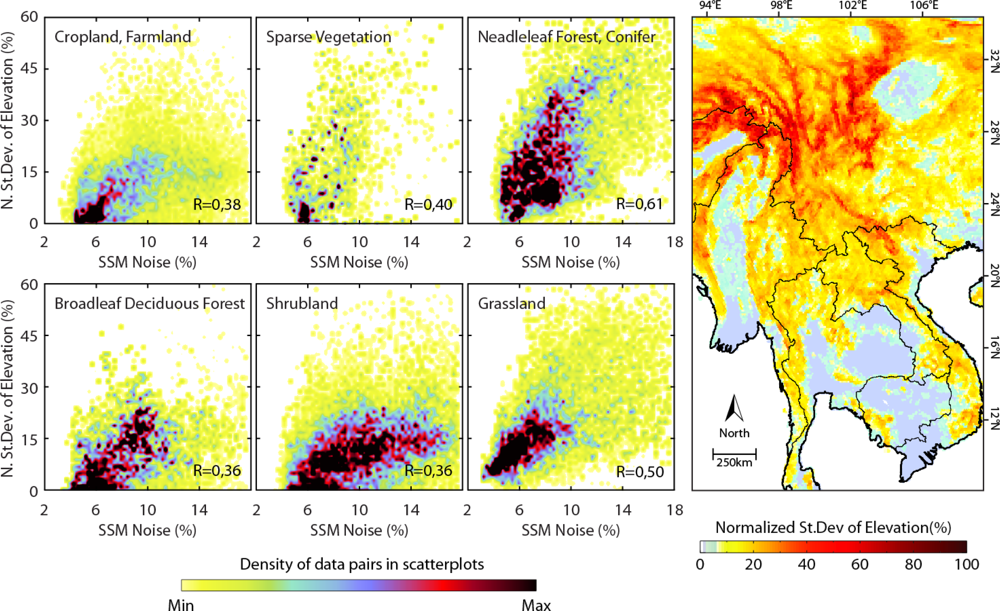
5.1. Quality Assessment of the SSM Retrieval
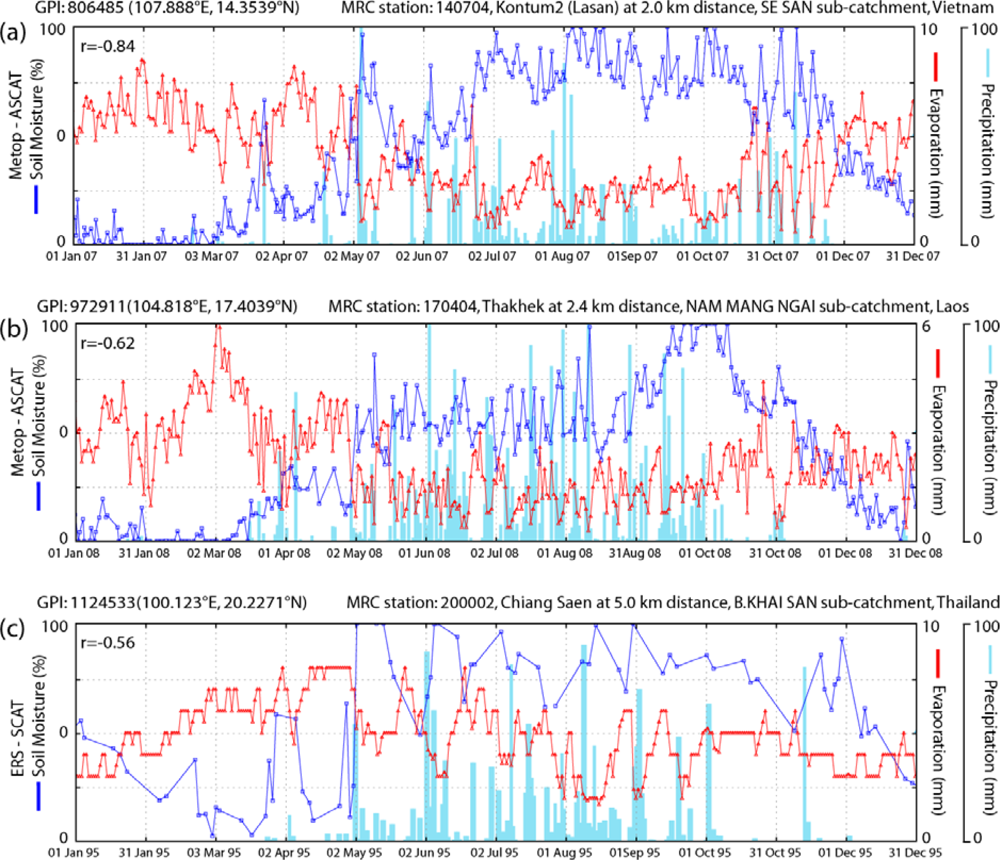
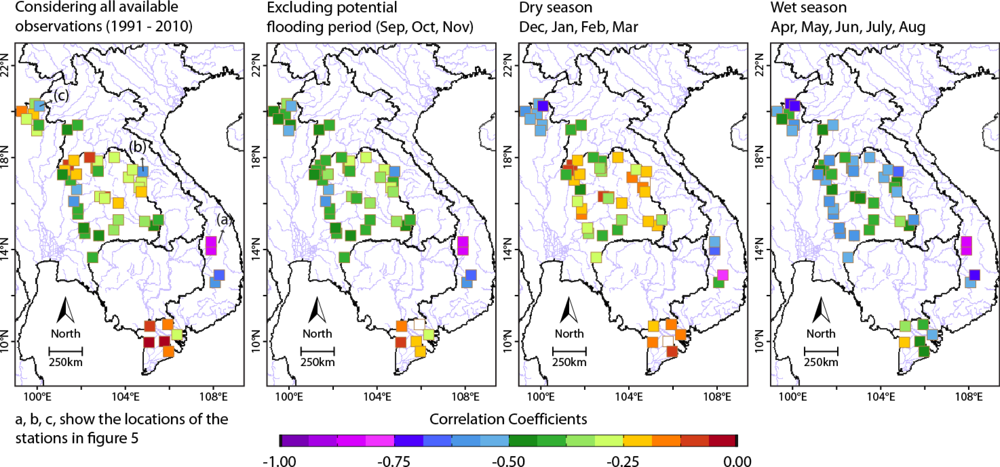
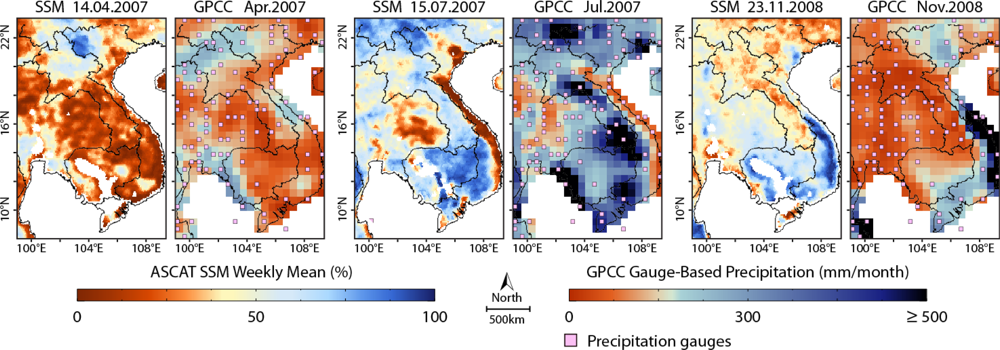
5.2. Comparison of the SSM with Hydro-Meteorological Data
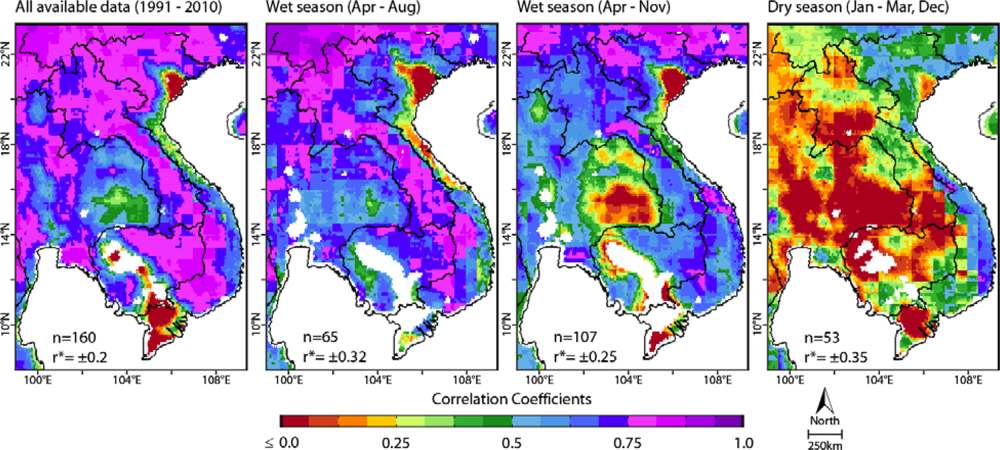
5.3. Spatiotemporal Variability of Soil Moisture in the LMB
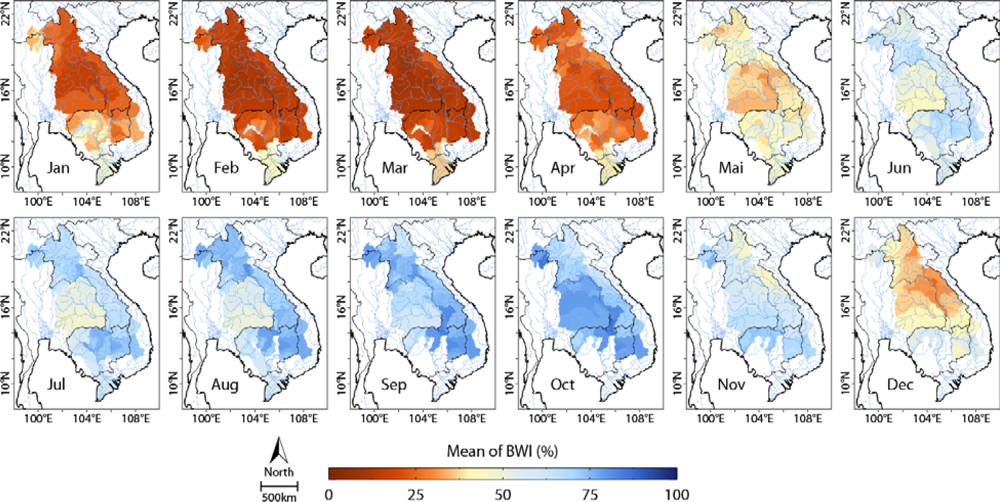
5.3.1. Seasonal Variability of the BWI
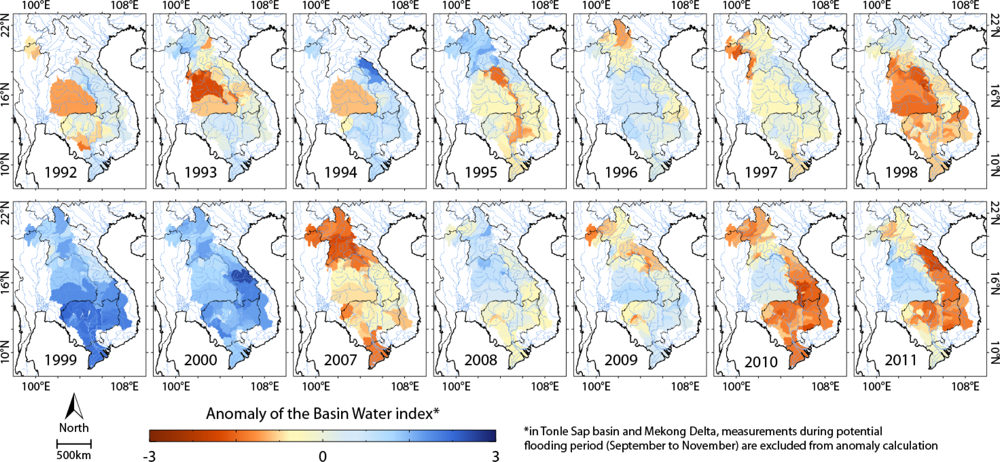
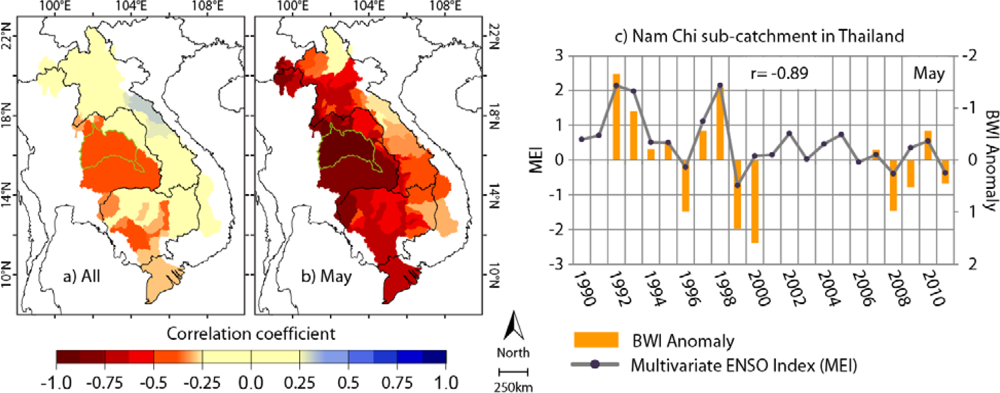
5.3.2. BWI Anomalies
6. Summary and Conclusions
Acknowledgments
References
- Campbell, I. Introduction. In The Mekong; Ian, C.C., Ed.; Chapter 1; Academic Press: San Diego, CA, USA, 2009; pp. 1–11. [Google Scholar]
- Mekong River Commission (MRC). State of the Basin Report: 2010; MRC: Vientiane, Lao PDR, 2010; p. 232. [Google Scholar]
- Mekong River Commission (MRC). State of the Basin Report: 2003, Executive Summary; MRC: Phnom Penh, Cambodia, 2003; p. 50. [Google Scholar]
- Mekong River Commission (MRC). Annual Flood Report 2009; MRC: Phnom Penh, Cambodia, 2009; p. 80. [Google Scholar]
- Costa-Cabral, M.C.; Richey, J.E.; Goteti, G.; Lettenmaier, D.P.; Feldkotter, C.; Snidvongs, A. Landscape structure and use, climate, and water movement in the Mekong River basin. Hydrol. Process 2008, 22, 1731–1746. [Google Scholar]
- Kuenzer, C.; Campbell, I.; Roch, M.; Leinenkugel, P.; Tuan, V.Q.; Dech, S. Understanding the impact of hydropower developments in the context of upstream-downstream relations in the Mekong river basin. Sustain. Sci. 2012. [Google Scholar] [CrossRef]
- Grayson, R.B.; Western, A.W.; Chiew, F.H.S.; Blöschl, G. Preferred states in spatial soil moisture patterns: Local and nonlocal controls. Water Resour. Res 1997, 33, 2897–2908. [Google Scholar]
- CEOS. The Earth Observation Handbook, Climate Change Special Edition ed; Noordwijk, The Netherlands, 2008. [Google Scholar]
- Delworth, T.L.; Manabe, S. The influence of potential evaporation on the variabilities of simulated soil wetness and climate. J. Clim 1988, 1, 523–547. [Google Scholar]
- Reichle, R.H.; McLaughlin, D.B.; Entekhabi, D. Hydrologic data assimilation with the ensemble Kalman filter. Mon. Wea. Rev 2002, 130, 103–114. [Google Scholar]
- Robock, A.; Vinnikov, K.Y.; Srinivasan, G.; Entin, J.K.; Hollinger, S.E.; Speranskaya, N.A.; Liu, S.X.; Namkhai, A. The global soil moisture data bank. Bull. Am. Meteorol. Soc 2000, 81, 1281–1299. [Google Scholar]
- Famiglietti, J.S.; Devereaux, J.A.; Laymon, C.A.; Tsegaye, T.; Houser, P.R.; Jackson, T.J.; Graham, S.T.; Rodell, M.; van Oevelen, P.J. Ground-based investigation of soil moisture variability within remote sensing footprints during the Southern Great Plains 1997 (SGP97) hydrology experiment. Water Resour. Res 1999, 35, 1839–1851. [Google Scholar]
- Ulaby, F.T.; Fung, A.K.; Moore, R.K. Microwave Remote Sensing: Active and Passive; Addison-Wesley: Norwood, NJ, USA, 1982. [Google Scholar]
- Leinenkugel, P.; Kuenzer, C.; Dech, S. Comparison and optimisation of MODIS cloud mask products for South East Asia. Int. J. Remote Sens. 2012; in review. [Google Scholar]
- Adamson, P.T.; Rutherfurd, I.D.; Peel, M.C.; Conlan, I.A. Chapter 4-The Hydrology of the Mekong River. In The Mekong; Ian, C.C., Ed.; Academic Press: San Diego, CA, USA, 2009; pp. 53–76. [Google Scholar]
- Attema, E.P.W. The active microwave instrument on-board the ERS-1 satellite. Proc. IEEE 1991, 79, 791–799. [Google Scholar]
- Figa-Saldana, J.; Wilson, J.J.W.; Attema, E.; Gelsthorpe, R.; Drinkwater, M.R.; Stoffelen, A. The Advanced Scatterometer (ASCAT) on the meteorological operational (MetOp) platform: A follow on for European wind scatterometers. Can. J. Remote Sens 2002, 28, 404–412. [Google Scholar]
- Wagner, W.; Lemoine, G.; Rott, H. A method for estimating soil moisture from ERS scatterometer and soil data. Remote Sens. Environ 1999, 70, 191–207. [Google Scholar]
- Naeimi, V.; Scipal, K.; Bartalis, Z.; Hasenauer, S.; Wagner, W. An Improved soil moisture retrieval algorithm for ERS and METOP scatterometer observations. IEEE Trans. Geosci. Remote Sens 2009, 47, 1999–2013. [Google Scholar]
- Wagner, W.; Bartalis, Z.; Naeimi, V.; Park, S.E.; Figa-Saldana, J.; Bonekamp, H. Status of the Metop ASCAT Soil Moisture Product. Proceedings of the IEEE International Geosciences and Remote Sensing Symposium, Honolulu, HI, USA, 25–30 July 2010; pp. 276–279.
- Naeimi, V.; Bartalis, Z.; Wagner, W. ASCAT soil moisture: An assessment of the data quality and consistency with the ERS scatterometer heritage. J. Hydrometeorol 2009, 10, 555–563. [Google Scholar]
- Mekong River commission (MRC). Lower Mekong Basin Hydro Meteorology Database. 2012. Available online: http://portal.mrcmekong.org/mastercatalogue/search?giai=9506000003818_E0200hvv (accessed on 1 February 2012).
- Schneider, U.; Becker, A.; Finger, P.; Meyer-Christoffer, A.; Ziese, M.; Rudolf, B. GPCC’s new land surface precipitation climatology based on quality-controlled in situ data and its role in quantifying the global water cycle. Theor. Appl. Climatol. 2013. [Google Scholar] [CrossRef]
- Schneider, U.; Becker, A.; Finger, P.; Meyer-Christoffer, A.; Rudolf, B.; Ziese, M. GPCC Full Data Reanalysis Version 6.0 at 0.5°: Monthly Land-Surface Precipitation from Rain-Gauges Built on GTS-Based and Historic Data; GPCC: Main, Germany, 2011. [Google Scholar] [CrossRef]
- Ceballos, A.; Scipal, K.; Wagner, W.; Martinez-Fernandez, J. Validation of ERS scatterometer-derived soil moisture data in the central part of the Duero Basin, Spain. Hydrol. Process 2005, 19, 1549–1566. [Google Scholar]
- Parajka, J.; Naeimi, V.; Bloschl, G.; Wagner, W.; Merz, R.; Scipal, K. Assimilating scatterometer soil moisture data into conceptual hydrologic models at the regional scale. Hydrol. Earth Syst. Sci 2006, 10, 353–368. [Google Scholar]
- Scipal, K.; Drusch, M.; Wagner, W. Assimilation of a ERS scatterometer derived soil moisture index in the ECMWF numerical weal-her prediction system. Adv. Water Resour 2008, 31, 1101–1112. [Google Scholar]
- Zhao, D.; Kuenzer, C.; Fu, C.; Wagner, W. Evaluation of the ERS scatterometer-derived soil water index to monitor water availability and precipitation distribution at three different scales in China. J. Hydrometeorol 2008, 9, 549–562. [Google Scholar]
- Liu, S.; Mo, X.; Zhao, W.; Naeimi, V.; Dai, D.; Shu, C.; Mao, L. Temporal variation of soil moisture over the Wuding River basin assessed with an eco-hydrological model, in situ observations and remote sensing. Hydrol. Earth Syst. Sci 2009, 13, 1375–1398. [Google Scholar]
- Albergel, C.; Rüdiger, C.; Carrer, D.; Calvet, J.C.; Fritz, N.; Naeimi, V.; Bartalis, Z.; Hasenauer, S. An evaluation of ASCAT surface soil moisture products with in situ observations in Southwestern France. Hydrol. Earth Syst. Sci 2009, 13, 115–124. [Google Scholar]
- Brocca, L.; Melone, F.; Moramarco, T.; Wagner, W.; Naeimi, V.; Bartalis, Z.; Hasenauer, S. Improving runoff prediction through the assimilation of the ASCAT soil moisture product. Hydrol. Earth Syst. Sci 2010, 14, 1881–1893. [Google Scholar]
- Crow, W.T.; Wagner, W.; Naeimi, V. The impact of radar incidence angle on soil-moisture-retrieval skill. IEEE Geosci. Remote Sens. Lett 2010, 7, 501–505. [Google Scholar]
- Dorigo, W.A.; Scipal, K.; Parinussa, R.M.; Liu, Y.Y.; Wagner, W.; de Jeu, R.A.M.; Naeimi, V. Error characterisation of global active and passive microwave soil moisture datasets. Hydrol. Earth Syst. Sci 2010, 14, 2605–2616. [Google Scholar]
- Liu, Y.Y.; Parinussa, R.M.; Dorigo, W.A.; de Jeu, R.A.M.; Wagner, W.; van Dijk, A.I.J.M.; McCabe, M.F.; Evans, J.P. Developing an improved soil moisture dataset by blending passive and active microwave satellite-based retrievals. Hydrol. Earth Syst. Sci 2011, 15, 425–436. [Google Scholar]
- Naeimi, V.; Kuenzer, C.; Hasenauer, S.; Bartalis, Z.; Wagner, W. Evaluation of the Influence of Land Cover on the Noise Level of ERS-Scatterometer Backscatter. Proceedings of the IEEE International Geosciences and Remote Sensing Symposium, Barcelona, Spain, 23–29 July 2007; pp. 3685–3688.
- Wang, A.; Zeng, X.; Shen, S.S.P.; Zeng, Q.-C.; Dickinson, R.E. Time scales of land surface hydrology. J. Hydrometeorol 2006, 7, 868–879. [Google Scholar]
- Wagner, W.; Bloschl, G.; Pampaloni, P.; Calvet, J.C.; Bizzarri, B.; Wigneron, J.P.; Kerr, Y. Operational readiness of microwave remote sensing of soil moisture for hydrologic applications. Nordic Hydrol 2007, 38, 1–20. [Google Scholar]
- Bartholome, E.; Belward, A.S. GLC2000: A new approach to global land cover mapping from Earth observation data. Int. J. Remote Sens 2005, 26, 1959–1977. [Google Scholar]
- Kennett, R.G.; Li, F.K. Seasat over-land scatterometer data–II: Selection of extended area land-target sites for the calibration of spaceborne scatterometers. IEEE Trans. Geosci. Remote Sens 1989, 27, 779–788. [Google Scholar]
- Frison, P.-L.; Mougin, E. Use of ERS-1 wind scatterometer data over land surfaces. IEEE Trans. Geosci. Remote Sens 1996, 34, 550–560. [Google Scholar]
- Wagner, W.; Lemoine, G.; Borgeaud, M.; Rott, H. A study of vegetation cover effects on ers scatterometer data. IEEE Trans. Geosci. Remote Sens 1999, 37, 938–948. [Google Scholar]
- Macelloni, G.; Paloscia, S.; Pampaloni, P.; Santi, E. Global scale monitoring of soil and vegetation using SSM/I and ERS wind scatterometer. Int. J. Remote Sens 2003, 24, 2409–2425. [Google Scholar]
- US Geological Survey. GTOPO30 Digital Elevation Model. 1997. Available online: http://eros.usgs.gov/#/Find_Data/Products_and_Data_Available/gtopo30_info (accessed on 1 February 2007).
- Delworth, T.L.; Manabe, S. The influence of potential evaporation on the variabilities of simulated soil wetness and climate. J. Clim 1988, 1, 523–547. [Google Scholar]
- Dirmeyer, P.A.; Schlosser, C.A.; Brubaker, K.L. Precipitation, recycling, and land memory: An integrated analysis. J. Hydrometeorol 2009, 10, 278–288. [Google Scholar]
- Hillel, D. Introduction to Environmental Soil Physics; Academic Press: Waltham, MA, USA, 2003. [Google Scholar]
- Naeimi, V.; Paulik, C.; Bartsch, A.; Wagner, W.; Kidd, R.; Park, S.E.; Elger, K.; Boike, J. ASCAT Surface State Flag (SSF): Extracting information on surface freeze/thaw conditions from backscatter data using an empirical threshold-analysis algorithm. IEEE Trans. Geosci. Remote Sens 2012, 50, 2566–2582. [Google Scholar]
- Mekong River commission (MRC). Overview of the Hydrology of the Mekong Basin; MRC: Vientiane, Lao PDR, 2005; p. 73. [Google Scholar]
- Lamberts, D. Little Impact, much Damage: The Consequences of Mekong River Flow Alterations for the Tonle Sap Ecosystem. In Modern Myths of the Mekong: A Critical Review of Water and Development Concepts, Principles and Policies; Kummu, M., Keskinen, M., Varis, O., Eds.; Helsinki University of Technology: Helsinki, Finland, 2008; pp. 3–18. [Google Scholar]
- Mekong River commission (MRC). Annual Flood Report 2009; MRC: Phnom Penh, Cambodia, 2009; p. 80. [Google Scholar]
- Nikula, J. Is Harm and Destructions all that Floods Bring? In Modern Myths of the Mekong: A Critical Review of Water and Development Concepts, Principles and Policies; Kummu, M., Keskinen, M., Varis, O., Eds.; Helsinki University of Technology: Helsinki, Finland, 2008; pp. 27–38. [Google Scholar]
- Mekong River commission (MRC). Annual Flood Report 2005; MRC: Vientiane, Lao PDR, 2005; p. 82. [Google Scholar]
- Mekong River commission (MRC). Annual Flood Report 2010; MRC: Phnom Penh, Cambodia, 2010; p. 76. [Google Scholar]
- Ju, J.; Slingo, J. The Asian summer monsoon and ENSO. Q. J. R. Meteorol. Soc 1995, 121, 1133–1168. [Google Scholar]
- Wang, B.; Wu, R.; Fu, X. Pacific–East Asian teleconnection: How does ENSO affect East Asian climate? J. Clim 2000, 13, 1517–1536. [Google Scholar]
- Buckley, B.M.; Palakit, K.; Duangsathaporn, K.; Sanguantham, P.; Prasomsin, P. Decadal scale droughts over northwestern Thailand over the past 448 years: Links to the tropical Pacific and Indian Ocean sectors. Clim. Dyn 2007, 29, 63–71. [Google Scholar]
- Kuenzer, C.; Zhao, D.; Scipal, K.; Sabel, D.; Naeimi, V.; Bartalis, Z.; Hasenauer, S.; Mehl, H.; Dech, S.; Wagner, W. El Niño southern oscillation influences represented in ERS scatterometer-derived soil moisture data. Appl. Geogr 2009, 29, 463–477. [Google Scholar]
- Wolter, K.; Timlin, M.S. Monitoring ENSO in COADS with a Seasonally Adjusted Principal Component Index. Proceedings of the 17th Climate Diagnostics Workshop, Norman, OK, USA, 1–5 November 1993; pp. 52–57.
- Wolter, K.; Timlin, M.S. Measuring the strength of ENSO events: How does 1997/98 rank? Weather 1998, 53, 315–324. [Google Scholar]
- Delgado, J.M.; Merz, B.; Apel, H. A climate-flood link for the lower Mekong River. Hydrol. Earth Syst. Sci 2012, 16, 1533–1541. [Google Scholar]


Share and Cite
Naeimi, V.; Leinenkugel, P.; Sabel, D.; Wagner, W.; Apel, H.; Kuenzer, C. Evaluation of Soil Moisture Retrieval from the ERS and Metop Scatterometers in the Lower Mekong Basin. Remote Sens. 2013, 5, 1603-1623. https://doi.org/10.3390/rs5041603
Naeimi V, Leinenkugel P, Sabel D, Wagner W, Apel H, Kuenzer C. Evaluation of Soil Moisture Retrieval from the ERS and Metop Scatterometers in the Lower Mekong Basin. Remote Sensing. 2013; 5(4):1603-1623. https://doi.org/10.3390/rs5041603
Chicago/Turabian StyleNaeimi, Vahid, Patrick Leinenkugel, Daniel Sabel, Wolfgang Wagner, Heiko Apel, and Claudia Kuenzer. 2013. "Evaluation of Soil Moisture Retrieval from the ERS and Metop Scatterometers in the Lower Mekong Basin" Remote Sensing 5, no. 4: 1603-1623. https://doi.org/10.3390/rs5041603
APA StyleNaeimi, V., Leinenkugel, P., Sabel, D., Wagner, W., Apel, H., & Kuenzer, C. (2013). Evaluation of Soil Moisture Retrieval from the ERS and Metop Scatterometers in the Lower Mekong Basin. Remote Sensing, 5(4), 1603-1623. https://doi.org/10.3390/rs5041603