Abstract
An accurate estimation of soybean crop areas while the plants are still in the field is highly necessary for reliable calculation of real crop parameters as to yield, production and other data important to decision-making policies related to government planning. An algorithm for soybean classification over the Rio Grande do Sul State, Brazil, was developed as an objective, automated tool. It is based on reflectance from medium spatial resolution images. The classification method was called the RCDA (Reflectance-based Crop Detection Algorithm), which operates through a mathematical combination of multi-temporal optical reflectance data obtained from Landsat-5 TM images. A set of 39 municipalities was analyzed for eight crop years between 1996/1997 and 2009/2010. RCDA estimates were compared to the official estimates of the Brazilian Institute of Geography and Statistics (IBGE) for soybean area at a municipal level. Coefficients R2 were between 0.81 and 0.98, indicating good agreement of the estimates. The RCDA was also compared to a soybean crop map derived from Landsat images for the 2000/2001 crop year, the overall map accuracy was 91.91% and the Kappa Index of Agreement was 0.76. Due to the calculation chain and pre-defined parameters, RCDA is a timesaving procedure and is less subjected to analyst skills for image interpretation. Thus, the RCDA was considered advantageous to provide thematic soybean maps at local and regional scales.
1. Introduction
Statistical data in agriculture plays a key role in the food supply chain and improvements in methods of precise and timely estimates for crop areas and yield are extremely important for management, trade and pricing policies. The Brazilian agencies CONAB (Companhia Nacional de Abastecimento—National Company of Food Supply) and IBGE (Instituto Brasileiro de Geografia e Estatística—Brazilian Institute of Geography and Statistics) are both responsible for the official agricultural statistics in Brazil. Presently, these estimates are based heavily on polls made on a farmer level, being considered subjective and without associated error measurement [1].
Remote sensing satellite data have been successfully used on mappings of crops in Brazil such as soybean [2,3] and sugarcane [4]. Most of the research related to crop area estimation is associated with classification of Landsat Thematic Mapper (TM) images of medium spatial resolution [3]. In Brazil, important know-how of large scale agricultural monitoring was gained from the projects GeoSafras (soybean, maize and rice fields mapping) and Canasat (sugarcane mapping) [5,6]. The main difficulties were clearly associated with the handling of a large volume of data and a timely generation of the desired products. Another two difficulties were the pressure for results and systematic cloud cover occurrences. The former leads to the need of a large staff team and the latter can limit the Landsat-like images operationality in providing agricultural statistics [7,8]. Focused on the crop area problem in Brazil, several studies [1,9,10] have been conducted using different conceptual approaches with high temporal-resolution data with coarser spatial-resolution. However, these methodologies did not prove to be useful to routine monitoring, and were generally applied for relatively few crop years and specific regions Other developments as made with the MODIS Crop Detection Algorithm (MCDA) [11], produced R2 greater than 0.95 and overall accuracy of 82% for several crop years in Rio Grande do Sul State, but they also found limitations on mapping accuracy dependence with mean field size, according to [12], since they used 250 m spatial-resolution.
Literature reviewing has shown that automated moderate spatial resolution models are able to generate timely classification results, and that medium spatial resolution can generate good mapping accuracy. This work is going a step further, combining both methods to obtain timely classification results with good mapping accuracy. The objective in this work is to evaluate a reflectance-based algorithm using medium resolution sensor images, to the accurate classification of soybean areas prior to the time of crop harvest.
2. Material and Methods
In recent years, the average contribution of Rio Grande do Sul State accounted for about 17% of the national grain production. It is the third soybean producer in Brazil [13] and both yield and crop area is still rising. The State has a total area of 282,062 km2 with 496 municipalities. Its soybean production is concentrated in the center-north region. The average annual rainfall is 1,500 mm, being relatively well distributed throughout the year, but subjected to dry periods. The State climate is subtropical with four well-defined seasons. The 39 municipalities analyzed are totally covered by a Landsat scene path/row 222-080. All municipalities are aggregated inside an intensive soybean production area, which is shown at Figure 1.
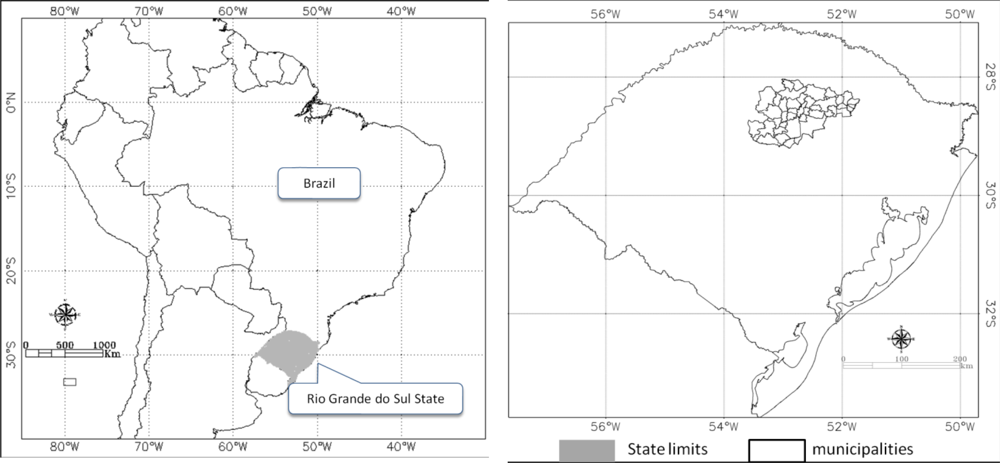
Figure 1.
Rio Grande do Sul State, Brazil, and the 39 municipalities evaluated.
2.1. Study Area
The covered crop area represents nearly 18% of total area of soybean crops in Rio Grande do Sul. The sowing calendar for soybean goes from early October to late December, based on agricultural zoning for different soils, regions, and cultivars [14]; depending on sowing date, maximum plant growth is thus observed from late January to early March [11].
2.2. Satellite Data
The data sources used for the algorithm development were the following: (i) Landsat-5 TM images, obtained from Instituto Nacional de Pesquisas Espaciais (INPE: www.dgi.inpe.br); (ii) Shuttle Radar Topography Mission (SRTM) data, used to generate a slope map with 90 m spatial resolution, according to [15], in order to exclude improper areas for mechanization (slope > 12%); (iii) annual soybean agricultural statistics, at State and municipality level, from IBGE, used to compare and evaluate the obtained results from the present soybean area estimation procedure for the 39 municipalities; (iv) a soybean reference thematic map, available for crop year 2000/2001 [3] obtained from multi-temporal Landsat TM images analysis, at 30 m spatial resolution, used to evaluate the soybean thematic map obtained from 2000/2001 in this study; and (v) geolocation reference images from Global Land Survey (GLS), which is composed by cloud free images and geo-referencing metrics with good quality. This product was used to provide an accurate geo-registration of the selected images at Table 1.

Table 1.
Selected Landsat-5 TM images for soybean crop area detection.
2.3. LANDSAT Image Calibration
The Landsat-5 TM images were fully calibrated and corrected to generate reflectance values, according to Landsat Calibration Documents [16,17]. Usually, correction includes atmospheric and sensor related parameters and thus leads to the derivation of physical units such as reflectance [18]. In the strict sense, full absolute image correction involves both applications of absolute calibration coefficients for sensor and related parameters of atmospheric correction, to derive estimates of surface reflectance in order to produce a consistent temporal reflectance trajectory [18]. In this work, the first step was to convert the digital numbers (DN) into radiance and afterwards to reflectance, according to calibration parameters of [17]. After the transformation of DN to reflectance, images were atmospherically corrected according to the methodology of [19].
2.4. Selected Bands
During soybean vegetation development, a rapid increase of near-infrared (NIR) reflectance values is observed, reaching its maximum values after a relatively short period. After that, the maximum vegetation period is observed in the time window between 20 January and before 20 March [11,20] for Rio Grande do Sul. During the maximum vegetation development stage, soybean crop cultivation presents a particular spectral behavior when compared with other classes of regional land use cover [3]. At that stage, vegetation is expected to present low reflectance values at the red band (0.65 to 0.69 μm), high reflectance values at the NIR band (0.76 to 0.90 μm) and a very steady reflectance variation at the Short-Wave Infrared (SWIR) band (1.55 to 1.75 μm), as described in [21] for irrigated and rainfed soybean crops. So, using a mathematical-computational rule, it is possible to establish operators that are able to identify soybean crop area characteristics that remain through time even under different vegetation development conditions. This means that an algorithm that meets the appropriate mathematical combination of bands 3, 4 and 5 can accurately select soybean crop areas.
Soybean sowing occurs from around early October to early December. Usually, maize is sown earlier than soybean [20], favoring a calendar-based discrimination. In this sense, even when maize is sown during the same period as soybean, it would not be erroneously tagged as soybean, because it is possible to identify a particularly spectral behavior by using simultaneously the bands 3–5 that is associated to each culture.
2.5. Algorithm Development: Theoretical Approach
The soybean classification procedure developed in this study was named Reflectance-based Crop Detection Algorithm (RCDA), whose diagrammatic flowchart is presented in Figure 2. RCDA was developed in the ERDAS 9.1 Modeler Environment. Initially, surface reflectance values for soybean during maximum plant development were tested. Based on published spectral characteristics [22,23] of bands 3–5 of Landsat-5 TM, soybean crop vegetation typically presents a calibrated reflectance of about 5%, 50% and 21% respectively. It is because those reflectance values, usually available on literature, are averaged from standardized conditions and represent soybean crop fields at full-pixel coverage over soybean areas.
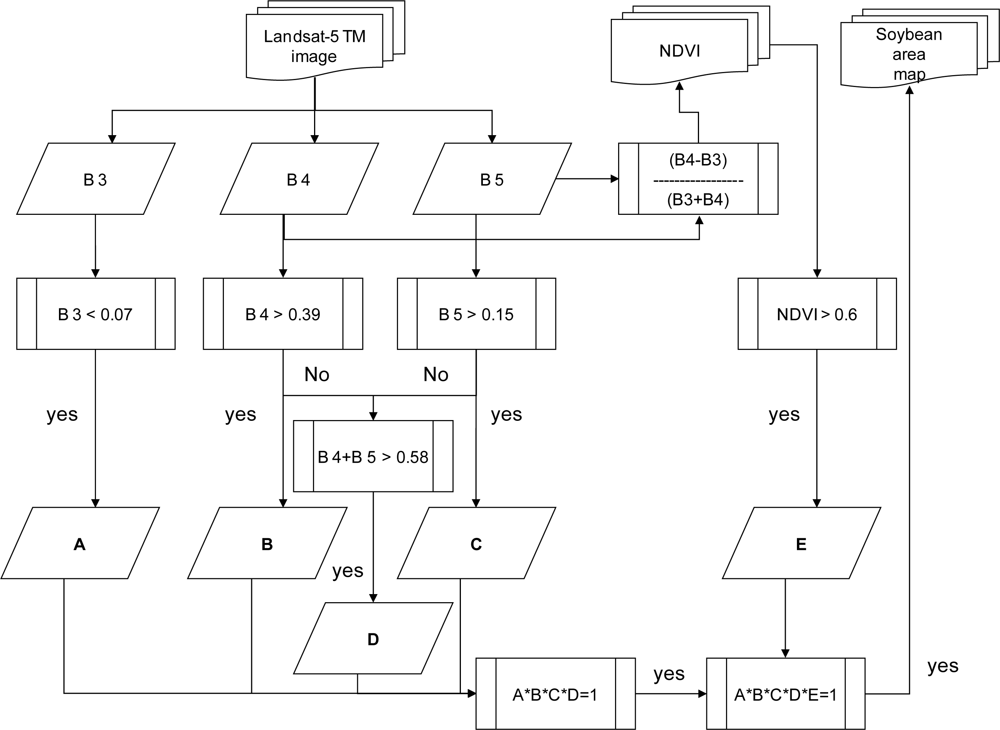
Figure 2.
Flowchart of the Reflectance-based Crop Detection Algorithm (RCDA).
It is well known that in drought-free years, well developed vegetation reflects just a little part of incident solar radiation in the visible band of spectrum, due to chlorophyll absorption properties and others plant pigments that absorbs sunlight. In the NIR, plants reflect much more, due to a scattering effect caused by the internal structure of leaves and water content [24]. Depending on the intensity of water deficit due to drought, seasonal heat waves or both effects coupled together [25] it is possible that vegetation remains green for a time lag after the onset of water stress [26]. In this way, it is expected that bands 3 (red) and 4 (NIR) do not retrieve detectable changes during this time lag. Additionally, reflectance at band 5 of Landsat is closely associated to vegetation moisture [27,28] and therefore, its behavior through time needs to be more deeply investigated. However, it is also known to have the property of penetrating thin clouds due to wavelength size [28,29], which tends to be very useful in a mapping study and land use change.
It became clear that the challenge is to find out those accurate reflectance values located at the lower limits of the spectral range (lower reflectance values) for each band, in a way that includes not only pure soybean pixels at the normal conditions, but also under water deficit development or mixed pixels located at the border of soybean fields. Those lower limits values were defined in this work as R3min, R4min and R5min.
2.6. RCDA Development: Test Sites
One way to perform the better fitting of the representative reflectance values, due to their importance as input parameters for RCDA, was to obtain a set of soybean reflectance samples in each of the bands 3–5 from selected test sites inside the 39 municipalities.
Direct visual inspection and mapping over the images was used to set the location of test sites with total of 9,925 pixels through all crop years 1996/1997, 2000/2001, 2003/2004, 2005/2006, 2006/2007, 2007/2008, 2008/2009 and 2009/2010. It is important to note that at least, two of the selected crop years (2003/2004 and 2006/2007) were under quite different development conditions [30]. So, different Physically Driven Components (PDC) related to agricultural practices, weather or climatological forcings were acting at the agricultural system. We refer PDC to the main physical dynamic processes involved, from one harvest to another, which leads to adjustments in the mathematical modeling of vegetation development. PDC investigation became necessary in order to identify more accurately a multi-temporal threshold for band 3–5 that remained representative of soybean vegetation through time.
The soybean areas were mapped and selected by using false-color composition of bands (RGB-453) described at [3]. Those minimum reflectance values for each band are also associated to the limits of border regions between full-pixel coverage of soybean and mixed pixels.
Pixels below R3min are typically associated to cloud shadows or water bodies. Actually, it was observed at the test sites that soybean vegetation reflectance, even under different development conditions, stands lower than 0.07 in the red, band 3; stands greater than 0.42 in the NIR band 4; and stands greater than 0.18 in the Short-wave Infrared (SWIR) band, band 5. In terms of reflectance, these are crucial as input parameters to soybean characterization.
2.7. RCDA Development: How Does That Work?
For a given crop year, all available Landsat-5 TM images from the maximum development period were combined into the algorithm. In doing so, five computational steps were established in order to get the best use of PDC that rule soybean spectral behavior in bands 3–5.
Pixels with reflectance values that fall under the defined R3min were tagged as soybean according to condition A; pixels with reflectance values that fall above R4min were tagged as soybean according to condition B; pixels with reflectance values that fall above R5min were tagged as soybean according to condition C; pixels which the reflectance are above the sum of bands 4 and 5 were tagged as soybean according to condition D; and pixels with NDVI values which are above NDVImim were tagged as soybean according to condition E, in Figure 2. In the final step, all conditions are multiplied and a pixel that is representative of a soybean area must have the value one. In this procedure, a pixel will be automatically classified as soybean if it adheres simultaneously to conditions A, B, C, D and E. By using mathematical Boolean rule, a pixel will be selected as soybean if all conditions are simultaneously satisfied.
Pixels with a calibrated reflectance that does not follow at least one of defined rules A, B, C, D or E, are not selected, because they will overlap areas that are not from soybean crops. Additionally, all four conditions are modulated by NDVI values greater than 0.6 units in order to avoid background and/or cloud contamination that usually have high values of reflectance. Also, saturation effects of Normalized Difference Vegetation Index (NDVI) when Leaf Area Index (LAI) is greater than 3 can mask water stress [31].
2.8. Tuning Procedure of the RCDA
After a first run of the RCDA, follows a tuning phase based on a stepwise procedure using some specific Landsat satellite image from Table 1. This step is necessary to interactively fine tune the most appropriate values of R3min, R4min and R5min in order to minimize the omission and commission errors, when comparing to the reference map from [3].
A comparison of Landsat images and RCDA mapping was then performed. By overlaying the Landsat images and the classification maps, we observed that the soybean area was overestimated for the first run of the RCDA. Therefore, a second run was performed adjusting the values of R3min, R4min and R5min. For each combination, a new soybean classification was generated, which was visually compared with the corresponding available Landsat-5 TM images.
After several interactions, over several crop years and comparing the results of each one of new RCDA classification with Landsat-5 TM images, the combination with best performance of the final calibrated values of RCDA were defined as R3min = 0.07; R4min = 0.39; R5min = 0.15 and R4min + R5min = 0.58, according to Figure 2.
We should emphasize that the RCDA tuning procedure is only completed when R3min, R4min and R5min, which were chosen to be representative of predominantly PDC of soybean, can be used as the same input for all analyzed crop years. Therefore, once the parameters R3min, R4min and R5min were identified, no post-adjustment was allowed, partially to constrain dynamical adjustment process of the algorithm. During this phase, when some further adjustment was needed, in order to plot a better fitting of crop area map for one crop year or more, then this new parameter is run for all tested crops years.
Since the RCDA map is a binary image where 1 indicates soybean and zero indicates non-soybean, the next step is to combine a soybean area map from one Landsat-5 TM image to another one. It is expected that a combination of three consecutive Landsat-5 TM images would be available for the maximum vegetation development period. According to [3], it is mandatory that at least two images inside the critical period with good quality and low cloud contamination exist. If cloud occurrence is severe over the interest area, a delay of 16 d is expected in order to acquire the next Landsat-5 TM image. Therefore, the soybean estimation can be released no later than early March if two or more Landsat-5 TM images are available. Even if a third image is necessary, a soybean map can still be released during March. However, if no useful images were found due to at least one of the following situations, no other computational rules are applicable and no crop area estimation is generated for the crop year: cloud contamination, named as situation Cloud; image quality/noise presence, named as situation Quality, or unavailable overpassing, named as situation No overpassing,. In the case of a crop area forecast, a RCDA map can be provided right after a second Landsat-5 TM image is available inside the time-window, which normally occurs in mid/late February. Table 1 presents all Landsat-5 TM images available. All crop years that the available Landsat-5 TM images have flagged as OK, in Table 1, were used in the validation process. It is important to emphasize that the parameters defined in RCDA for detection crop areas are constant, as a fixed criteria during the period we studied (eight crop years between 1996/1997 and 2009/2010).
3. Validation
3.1. Validation of the RCDA: Step 1
RCDA was developed in order to provide an automated tool for soybean classification. The performance of the RCDA was validated in two steps. The first one was using a thematic soybean map elaborated from multi-temporal Landsat images for crop year 2000/2001 of [3]. The confusion matrix and the overall map accuracy were provided.
When comparing the obtained results of RCDA estimates with those obtained by [3] for crop year 2000/2001, we noticed that the two estimates are in good agreement. Table 2 shows the confusion matrix resulting from the comparison between the mapping provided by [3] and the RCDA. The overall map accuracy was approximately 91.91% and the Kappa Index of Agreement was 0.76. For classification maps assessment, usually Kappa Index of Agreement values greater than 0.5 are considered good results [32].
Table 2.
Confusion matrix from the comparison of RCDA mapping and [3] mapping.
Analysis of the user’s (commission) and producer’s (omission) accuracy for the soybean class is similar, indicating that errors tend to be compensated among the overall calculation. Figure 3 presents a comparison between a Landsat-5 TM and RCDA classification over 2000/2001 soybean crop areas. Figure 4 presents a scatterplot diagram and regression analysis for the 39 municipality estimates from the RCDA procedure and from the reference map [3] for the crop years 2000/2001. Coefficient of determination (R2) was 0.99.
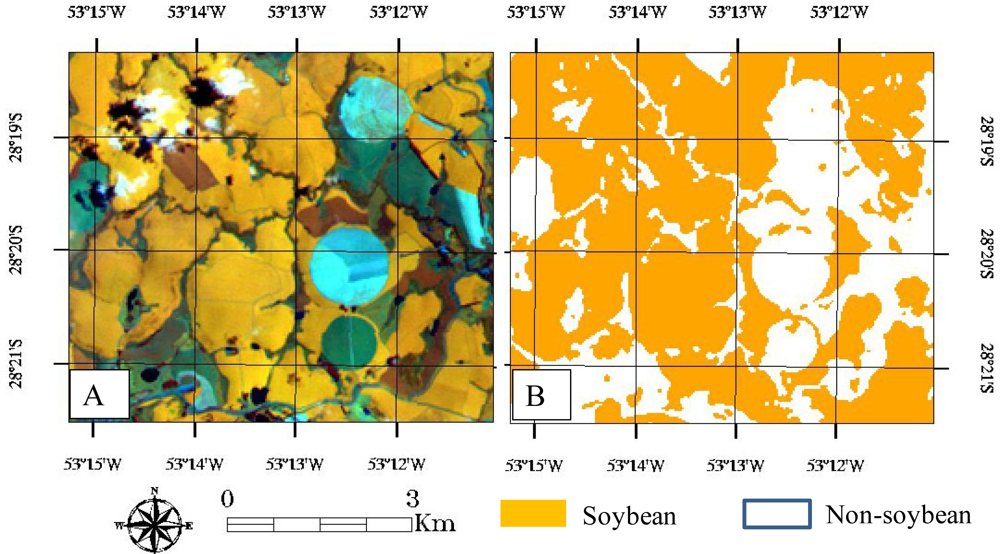
Figure 3.
Sector enlargement in Rio Grande do Sul State, for comparison between: (A) Landsat-5TM, (RGB/453) in 25 February 2001; and (B) resulting soybean map classification from RCDA in 2000/2001 crop year.
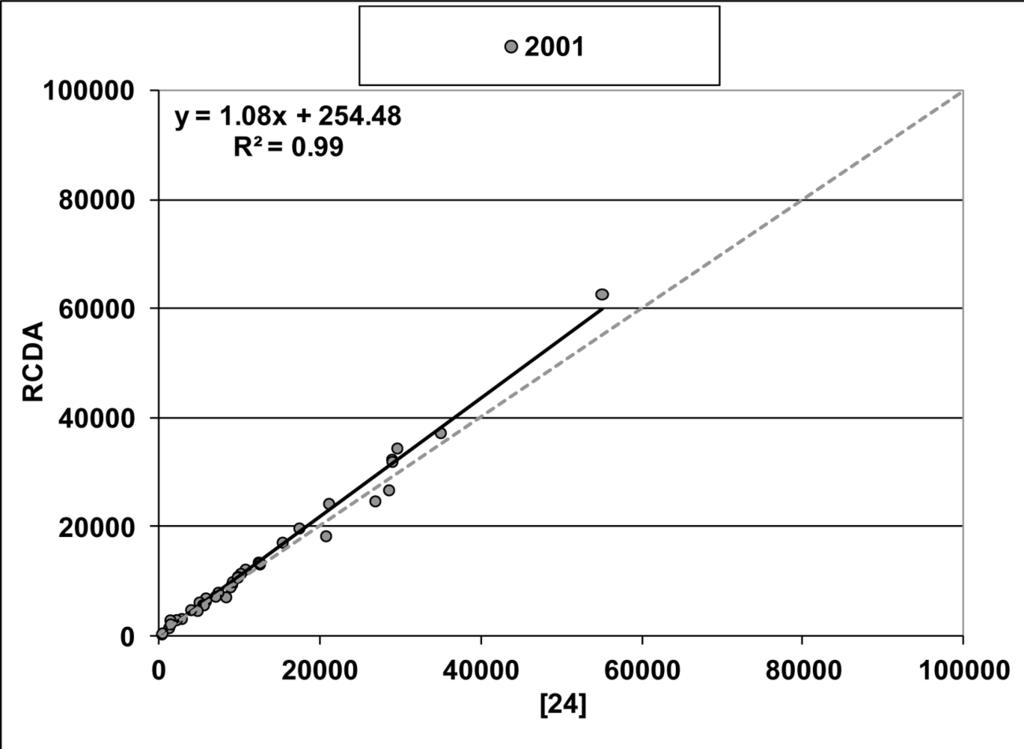
Figure 4.
Scatterplot diagram and regression analysis, of soybean area estimates, between RCDA and the reference map [3].
Visual inspection of the RCDA map compared to reference map suggests a slight displacement towards Northeast direction of RCDA map, of a length at around one pixel. It might be considered that an inaccurate process of registration for the assembling of the three images can increase errors in this analysis. RCDA applied to other Brazilian regions where soybean crop areas use to be extensive must generate better results.
3.2. Validation of RCDA: Step 2
In the second validation step, in order to have some perception of its performance, we compared its results to results generated by a classification through Maximum Likelihood procedure, which is widely known as a robust method for classification.
For the same Landsat-5 TM images used for RCDA, in 2001 crop year, which are presented in Table 1, we selected seven classes, in order to accurately identify soybean pixels separately from non-soybean classes. The selected classes are: soybean new, soybean old, other vegetation, forest, urban area, crop harvest and water bodies. The Maximum Likelihood procedure operates under an analyst-made classification procedure with the visual selection of pixels of all chosen classes. This is a laborious and time-consuming task because it is done manually and consists of several steps, including the visual selection of the representative sample pixels of each class. Obviously, results depend on skills and subjective judgment of the analyst. After this, we generated the soybean map from Maximum Likelihood classification procedure (ML map). The generated ML map was also compared to the reference map from [3].
Table 3 shows the confusion matrix resulting from the comparison between the mapping provided by [3] and the ML map. The overall map accuracy was approximately 92.45% and the Kappa Index of Agreement was 0.76.
Table 3.
Confusion matrix from the comparison between ML map and the [3] mapping.
Figure 5 present a scatterplot diagram and regression analysis for the 39 municipality estimates from the ML map procedure and from the reference map [3] for the crop years 2000/2001. Coefficient of determination (R2) was 0.99.
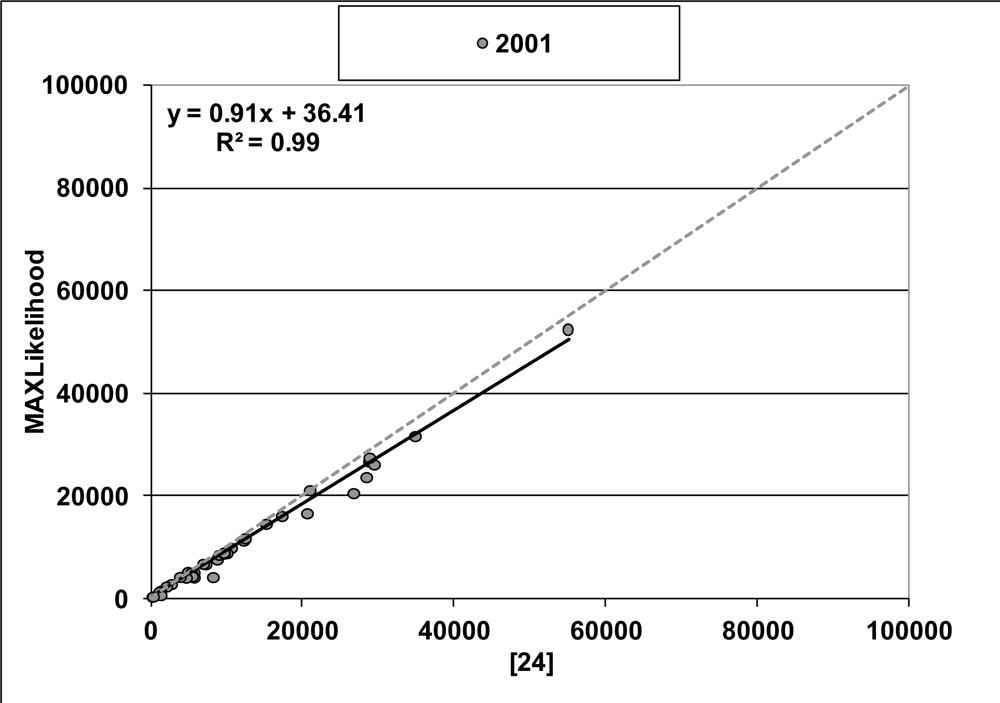
Figure 5.
Scatterplot diagram and regression analysis, of soybean area estimates, between ML map and the reference map [3].
According to Tables 2 and 3, and comparing results from Figures 4 and 5, in both validation tests it becomes clear that RCDA and the Maximum Likelihood procedures are essentially similar in accuracy. The main difference is that RCDA is an objective automated tool for soybean classification and which does not depend upon the analyst skills and subjective sources of decision, as described previously, being rather based in physical criteria. This is perceived from confusion matrix comparison, where the Kappa Index of Agreement had the same result (0.76) but RCDA Producer’s accuracy, for soybean, is 8.7% greater than Maximum Likelihood procedure. Besides, RCDA leads to rapid results.
4. Results and Discussion
Even in a low temporal resolution of Landsat-5 TM images and reflectance of soybean crop field heterogeneity, throughout the summer season, the computational approach of RCDA has shown to be consistent and stable. Soybean area provided by RCDA was estimated by municipality and compared to official estimates provided by IBGE ( http://www.sidra.igbe.gov.br) using regression analysis. IBGE data are only published around 18 months after the end of the soybean season. So, presently, the most recent data from IBGE is 2009/2010.
For crop years 1996/1997 and 2003/2004 IBGE data do not indicate a crop area presence greater than zero for several municipalities. However, further analysis, by means of detailed visual inspection and mapping with Landsat images (RGB-453) revealed the presence of soybean crops.
Figure 6 present scatterplot diagrams and regression analysis for the 39 municipality estimates from the RCDA procedure and from IBGE for the crop years 1996/1997 to 2009/2010. Coefficients of determination (R2) were between 0.81 and 0.98, an agreement indicator between the estimates. The averaged slope value around 1.005 for all tested crops also indicates good agreement. In Figure 7, the comparing totals from RCDA and IBGE in municipality estimates level are shown.
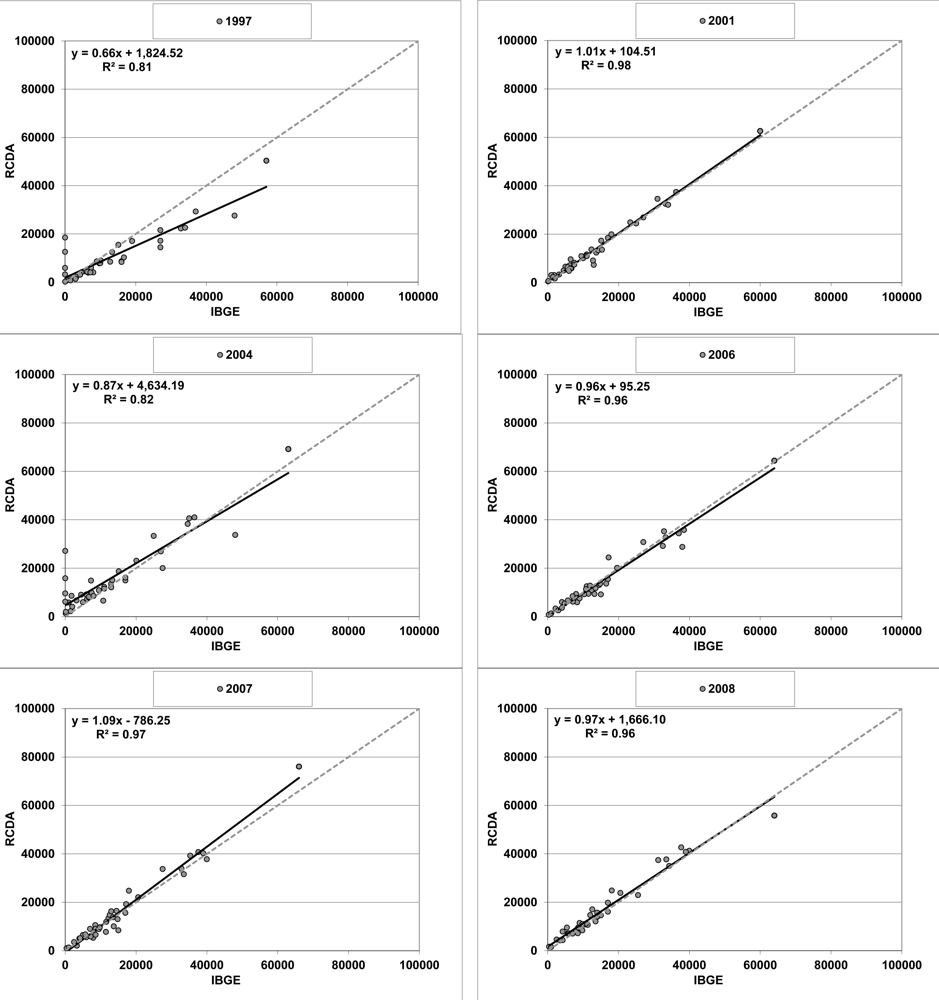
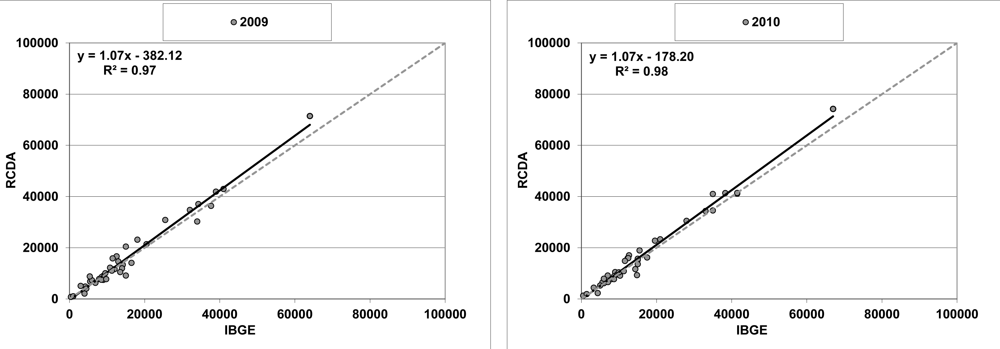
Figure 6.
Scatterplot diagram and regression analysis, of soybean area estimates, between RCDA and IBGE municipalities for each of the selected crop years through 1996/1997 to 2009/2010.
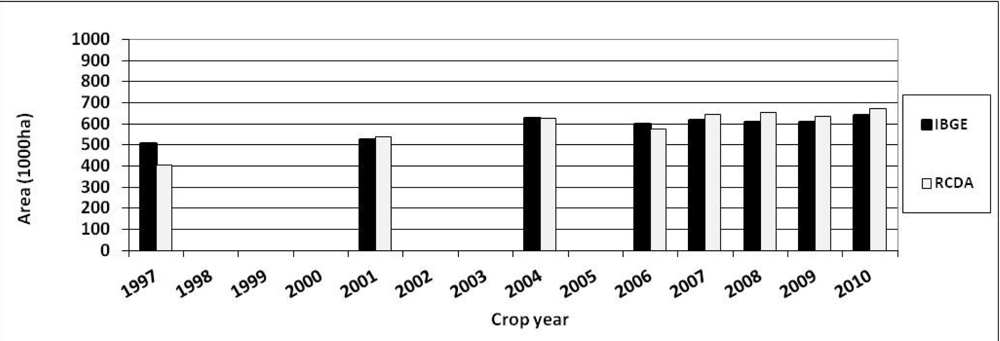
Figure 7.
Comparison between RCDA and IBGE soybean area estimates for the entire study area.
5. Conclusions
The RCDA algorithm presents an objective and consistent methodology for soybean classification and provides crop areas with estimates that are comparable to the official agricultural statistics of IBGE and visual inspection methodologies. Due to the calculation chain and pre-defined parameters, RCDA is a timesaving procedure and is less vulnerable to analyst image interpretation skills and subjectivity. This is perceived by the validation step results (Section 3) and the Maximum Likelihood procedure, wherein the Kappa Index of Agreement had the same result (0.76) and the Overall Accuracy was only 0.54% greater than the RCDA. Besides, the RCDA Producer’s accuracy, for soybean, is 8.7% greater than Producer’s accuracy from the Maximum Likelihood procedure. Therefore, RCDA represents a considerable gain in time and accuracy of spatial information.
RCDA can assist the local agricultural management demands, providing reliable and adequate spatialized information. The RCDA approach is not species-specific and is therefore applicable with the proper calibrations to other crops besides soybean.
Abbreviations
| CONAB | Companhia Nacional de Abastecimento |
| IBGE | Instituto Brasileiro de Geografia e Estatística |
| TM | Thematic Mapper |
| MCDA | MODIS Crop Detection Algorithm |
| INPE | Instituto Nacional de Pesquisas Espaciais |
| SRTM | Shuttle Radar Topography Mission |
| GLS | Global Land Survey |
| DN | Digital Number |
| NIR | Near Infrared |
| RCDA | Reflectance-based Crop Detection Algorithm |
| NDVI | Normalized Difference Vegetation Index |
| LAI | Leaf Area Index |
| IR | Infrared |
| PDC | Physically Driven Components |
| UFRGS | Universidade Federal do Rio Grande do Sul |
Acknowledgments
Sincere appreciation to the Center for Remote Sensing and Meteorological Research at the Federal University of Rio Grande do Sul (UFRGS), University of Vale do Rio dos Sinos (UNISINOS) and to the Image Processing Division at INPE for the Landsat-5 TM images provided.
References
- Rizzi, R.; Rudorff, B.F.T.; Adami, M. Estimativa da área da soja no Estado do Rio Grande do Sul por um método de amostragem. Ciência Rural 2006, 36, 30–35. [Google Scholar]
- Fontana, D.C.; Ducati, J.R.; Weber, E.; Berlato, M.A.; Bergamaschi, H.; Figueiredo, D.C. Monitoramento e Previsão da Safra de Soja 1999/2000 no Brasil; Technical Report–N°005/01; Centro Estadual de Pesquisas em Sensoriamento Remoto e Meteorologia: Porto Alegre, Brazil, 2001; p. 116. [Google Scholar]
- Rizzi, R.; Rudorff, B.F.T. Soybean crop area estimation in Rio Grande do Sul through Landsat images. Revista Brasileira de Cartografia 2005, 57, 226–234. [Google Scholar]
- Rudorff, B.F.T.; Berka, L.M.S.; Moreira, M.A.; Duarte, V.; Xavier, A.C.; Rosa, V.G.C.; Shimabukuro, Y.E. Imagens de satélite no mapeamento e estimativa de área de cana-de-açúcar em São Paulo: Ano-safra 2003/04. Agricultura em São Paulo 2005, 52, 21–39. [Google Scholar]
- Projeto de Revitalização da Companhia Nacional de Abastecimento. GEOSAFRAS-BRA/03/34–2004. Available online: http://www.conab.gov.br/conteudos.php?a=1079&t=2 (accessed on 5 December 2011).
- CANASAT. Mapeamento da Cana-de-açúcar via Imagens de Satélite de Observação da Terra, 2011. Available online: http://www.dsr.inpe.br/laf/canasat/ (accessed on 29 November 2011).
- Sano, E.E.; Ferreira, L.G.; Asner, G.P.; Steinke, E.T. Spatial and temporal probabilities of obtaining cloud-free Landsat images over the Brazilian tropical savanna. Int. J. Remote Sens 2007, 28, 2739–2752. [Google Scholar]
- Sugawara, L.M.; Rudorff, B.F.T.; Adami, M. Viabilidade de uso de imagens do Landsat em mapeamento de área cultivada com soja no Estado do Paraná. Pesquisa Agropecuária Brasileira 2008, 43, 1763–1768. [Google Scholar]
- Epiphanio, R.D.V.; Formaggio, A.R.; Rudorff, B.T.F.; Maeda, E.E.; Luiz, A.J.B. Estimating soybean crop areas using spectral-temporal surfaces derived from MODIS images in Mato Grosso, Brazil. Pesquisa Agropecuária Brasileira 2010, 45, 72–80. [Google Scholar]
- Figueiredo, D.C. Projeto GeoSafras: Aperfeiçoamento do sistema de previsão de safras da Conab. Revista de Política Agrícola 2005, 14, 110–120. [Google Scholar]
- Gusso, A.; Formaggio, A.R.; Rizzi, R.; Adami, M.; Rudorff, B.T.F. Soybean area estimation by MODIS/EVI data. Pesquisa Agropecuária Brasileira 2012, 47, 425–435. [Google Scholar]
- Lobell, D.B.; Asner, G.P. Cropland distributions from temporal unmixing of MODIS data. Remote Sens. Environ 2004, 93, 412–422. [Google Scholar]
- IBGE–Instituto Brasileiro de Geografia e Estatística. Produção Agrícola Municipal–Automatic Data Recovery System–SIDRA. Available online: http://www.sidra.ibge.gov.br/ (accessed on 2 October 2011).
- Cunha, G.R.; Barni, N.A.; Haas, J.C.; Maluf, J.R.T.; Matzenauer, R.; Pasinato, A.; Pimentel, M.B.M.; Pires, J.L.F. Agricultural zoning and sowing dates for soybean in Rio Grande do Sul, southern Brazil. Revista Brasileira de Agrometeorologia 2001, 9, 446–459. [Google Scholar]
- Raabus, B.M.; Eineder, A.R.R. The shuttle radar topography mission—A new class of digital elevation models acquired by spaceborne radar. Photogramm. Eng. Remote Sensing 2003, 57, 241–262. [Google Scholar]
- Chander, G.; Markham, B. Revised Landsat-5 TM radiometric calibration procedures and post-calibration dynamic ranges. IEEE Geosci. Remote Sens. Lett 2007, 4, 490–494. [Google Scholar]
- Chander, G.; Markham, B.; Helder, D.L. Summary of current radiometric calibration coefficients for Landsat MSS, TM, ETM+, and EO-1 ALI sensors. Remote Sens. Environ 2009, 113, 893–903. [Google Scholar]
- Schroeder, T.A.; Cohen, W.B.; Song, C.; Canty, M.J.; Yang, Z. Radiometric correction of multi-temporal Landsat data for characterization of early successional forest patterns in western Oregon. Remote Sens. Environ 2006, 103, 16–26. [Google Scholar]
- Chavez, P.S., Jr. Image-based atmospheric correction—Revisited and improved. Photogramm. Eng. Remote Sensing 1996, 62, 1025–1036. [Google Scholar]
- Ministério da Agricultura, Pecuária e do Abastecimento–MAPA. Zoneamento Agrícola Para a Cultura de Soja no Estado do Rio Grande do Sul, Ano-Safra 2009/2010; Ministério da Agricultura, Pecuária e do Abastecimento–MAPA: Brasília, Brazil, 2009; p. 15. [Google Scholar]
- Gitelson, A.A.; Merzlyak, M.N. Signature analysis of leaf reflectance spectra: Algorithm development for remote sensing chlorophyll. J. Plant Physiol 1996, 148, 494–500. [Google Scholar]
- Jensen, J.R. Remote Sensing of the Environment: An Earth Resource Perspective, 2nd ed; Prentice Hall: Upper Saddle River, NJ, USA, 2007; p. 592. [Google Scholar]
- Kogan, F.N. World droughts in the new millennium from AVHRR-based vegetation health indices. Eos Trans. AGU 2002, 83, 557–564. [Google Scholar]
- Mercante, E.; Lamparelli, R.A.C.; Uribe-Opazo, M.A.; Rocha, J.V. Características Espectrais da soja ao longo do ciclo vegetativo com imagens Landsat 5/TM em área agrícola no oeste do Paraná-Artigo Técnico. Engenharia Agrícola 2009, 29, 328–338. [Google Scholar]
- Batistti, D.S.; Naylor, R.L. Historical warnings of future food insecurity with unprecedented seasonal heat. Science 2009, 323, 240–244. [Google Scholar]
- Kogan, F.N.; Gitelson, A.; Zakarin, E.; Spivak, L.; Lebed, L. AVHRR-based spectral vegetation index for quantitative assessment of vegetation state and productivity: Calibration and validation. Photogramm. Eng. Remote Sensing 2003, 69, 899–906. [Google Scholar]
- National Aeronautics and Space Administration (NASA). Landsat Data. Available online: http://landsat.gsfc.nasa.gov/ (accessed on 5 December 2011).
- United States Geological Survey. Landsat: A Global Land-Imaging Project. Available online: http://pubs.usgs.gov/fs/2010/3026/pdf/FS2010-3026.pdf (accessed on 19 July 2011).
- United States Geological Survey. Landsat: A Global Land-Observing Program. Available online: http://egsc.usgs.gov/isb/pubs/factsheets/fs02303.html (accessed on 25 November 2011).
- Gusso, A. Produtividade da cultura da soja no Rio Grande do Sul com dados EVI/MODIS. Proceedings of the 15th Brazilian Remote Sensing Symposium (SBSR 2011), Curitiba, PR, Brazil, 30 April 2011; pp. 55–062.
- Gray, S.B.; Dermody, O.; de Lucia, E.H. Spectral reflectance from a soybean canopy exposed to elevated CO2 and O3. J. Exp. Bot 2010, 61, 4413–4422. [Google Scholar]
- Ismail, M.H.; Jusoff, K. Satellite data classification accuracy assessment based from reference dataset. Int. J. Comp. Inf. Eng 2008, 2, 386–392. [Google Scholar]