1. Introduction
Application of airborne LiDAR (Light Detection and Ranging) techniques over coastal waters has focused to a large extent on airborne laser bathymetry to map water depth (
i.e., the sea floor topography) from reflections off the sea floor using blue-green visible light (532 nm) to penetrate the seawater column [
1,
2]. Here we are concerned with reflections from the sea surface. Ocean surface topography is typically derived from satellite altimetry [
3], and provides a relatively low lateral resolution. Airborne studies have used non-scanning lasers to study sea surface roughness and directional wave spectra [
4,
5,
6]. Two-dimensional (2D “pushbroom”) airborne laser scanning capability can provide a three-dimensional (3D) measurement of the surface topography. (We use the term “scanning” to differentiate from non-scanning LiDAR applications, e.g., sea surface roughness, wind finding, backscatter for aerosol measurements and cloud physics). One of the earliest applications was that by Krabill
et al. [
7], using an airborne oceanographic LiDAR to map the thickness of the Greenland ice sheet. Hwang
et al. [
8] discuss the application of a scanning LiDAR system and a scanning radar to study wave propagation in coastal regions. Hwang
et al. [
9,
10,
11] used an airborne scanning laser (the Airborne Topographic Mapper, ATM, developed by NASA and EC&G Technical Services) to measure the 3D topography of ocean surface waves to determine their spectral slope, dimensionless spectral coefficient and directional distribution, derived from computed wavenumber spectra. Melville
et al. [
12] and Romero and Melville [
13] present the evolution of wave spectra obtained from observations of fetch-limited waves during strong offshore winds using the ATM instrument. Other coastal applications of airborne and terrestrial LiDAR, although not involving direct measurements over seawater, include measurements of, for example, shoreline variations [
14] and sea cliff erosion [
15,
16].
Many of these airborne studies are based on relatively large, fully integrated and expensive LiDAR systems, which may require the use of larger aircraft. Here we investigate the use of two smaller, lighter and less expensive LiDAR systems that can be flown on light aircraft. These LiDAR instruments are portable and less expensive than fully integrated systems such as the ATM because the 2D laser scanner can be completely integrated with relatively cheap inertial measurement units and differential GPS. The deployment of the lighter LiDAR instrumentation on light aircraft also results in cheaper operational aircraft costs. The portability of one of these systems was demonstrated by attaching the LiDAR system to an operational airborne electromagnetic (AEM) system which was flown as a sling load beneath a helicopter to permit side-by-side LiDAR measurements and AEM bathymetriy measurements [
17]. The AEM method uses a transmitter loop with a known magnetic moment that generates a primary magnetic field to induce currents in the ground which in turn give rise to a secondary magnetic field which is detected by a receiver loop [
18,
19]. The AEM method is a standard geophysics technique for mineral exploration and more recently for environmental applications such as salinity mapping and coastal bathymetry.
The 3D topography of surface waves in coastal waters is relevant to the application of AEM methods for measuring waters depths in shallow coastal waters in areas of ocean swell and in the surf zone. The AEM bathymetry method usually assumes a one-dimensional (1D) layered-earth model consisting of at least two layers (seawater and unconsolidated sediment) overlying a less conductive basement, for interpretation of AEM data [
20]. Apart from investigating wave propagation in coastal regions, knowledge of the sea surface topography (
i.e., instantaneous wave surface) obtained from 2D laser scanning during AEM survey can support AEM bathymetry studies by measuring the deviation of the sea surface from 1D, thereby invoking the use of 2D and 3D EM interpretation methods if necessary.
The altimetry measurements obtained from the 2D LiDAR data over the sea surface is very relevant to AEM measurements over seawater. In this application, the 2D LiDAR sensor would operate simultaneously with the AEM instrumentation. Altimetry (
i.e., the height of the AEM sensor over seawater) is an important parameter because the EM response over conductive seawater at typical survey altitudes of approximately 35 m is
very sensitive to sub-meter variations in altitude and therefore, the interpretation of AEM data to obtain water depths to sub-meter accuracy is affected by altimetry errors. Usually, spot measurements of altimetry are obtained from a laser altimeter. Sea surface topography referenced to the airborne sensor frame is simply an altimetry map which can be averaged over a given time interval to provide an averaged altimetry, measured over a portion (15–20%) of the AEM footprint [
17,
21]. This averaged altimetry would be deemed to be a considerably more accurate representation of the altimetry “viewed” by the AEM system than single beam nadir-looking spot measurements obtained from a laser altimeter.
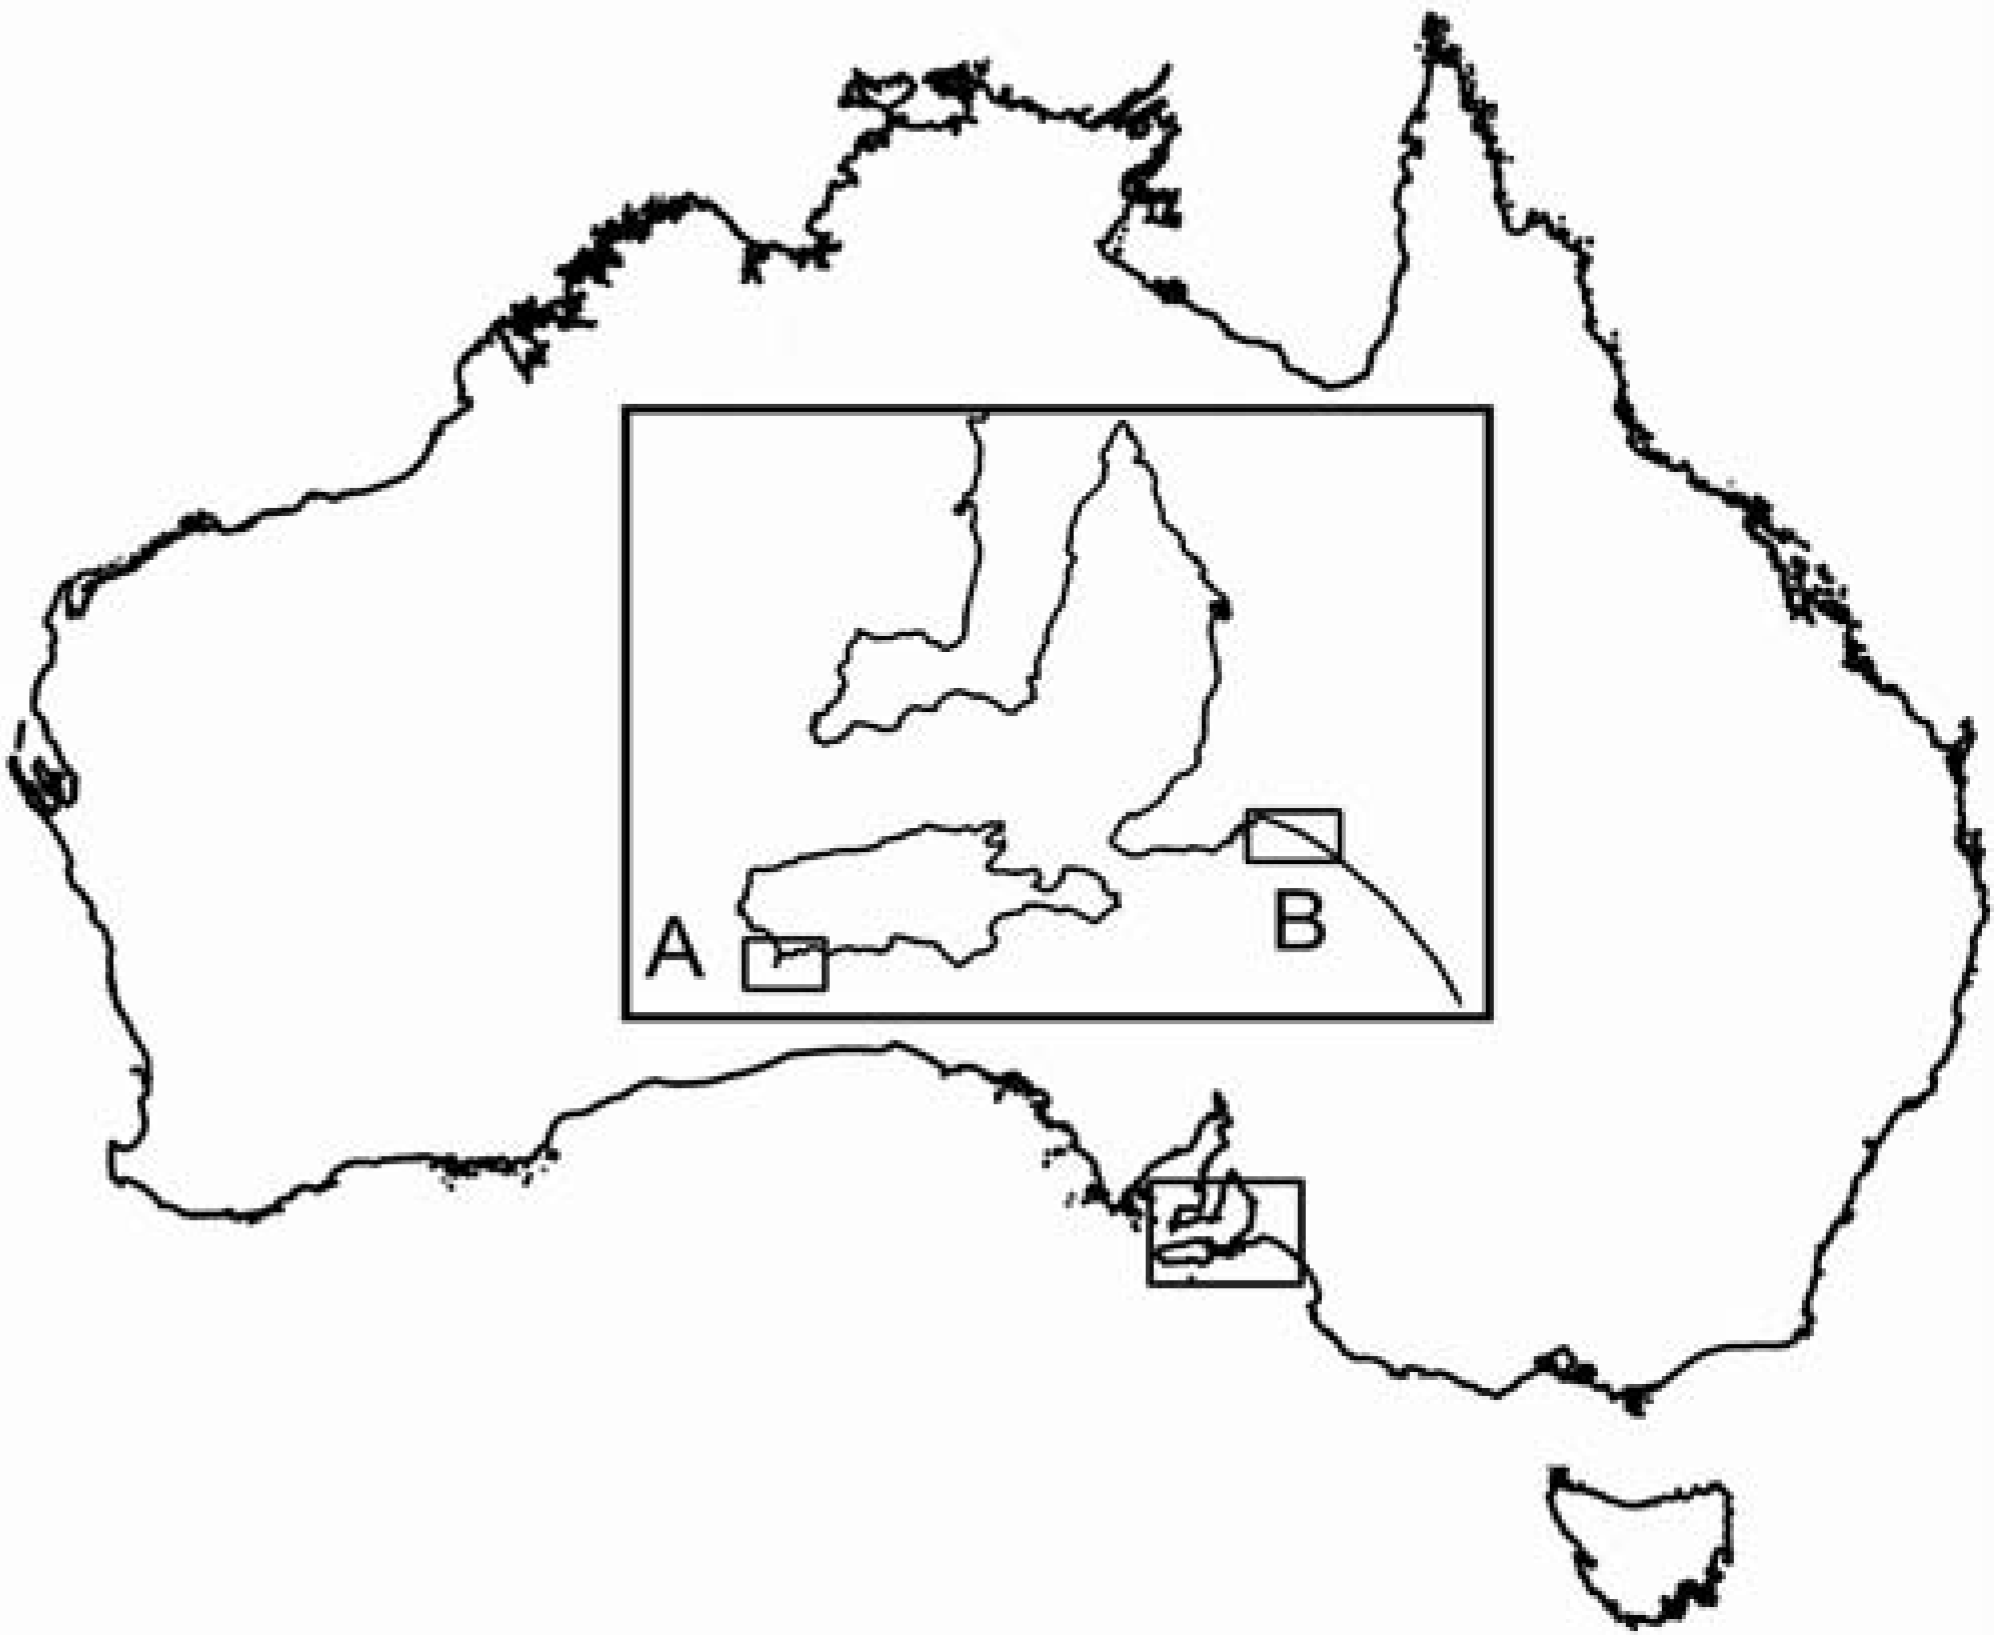
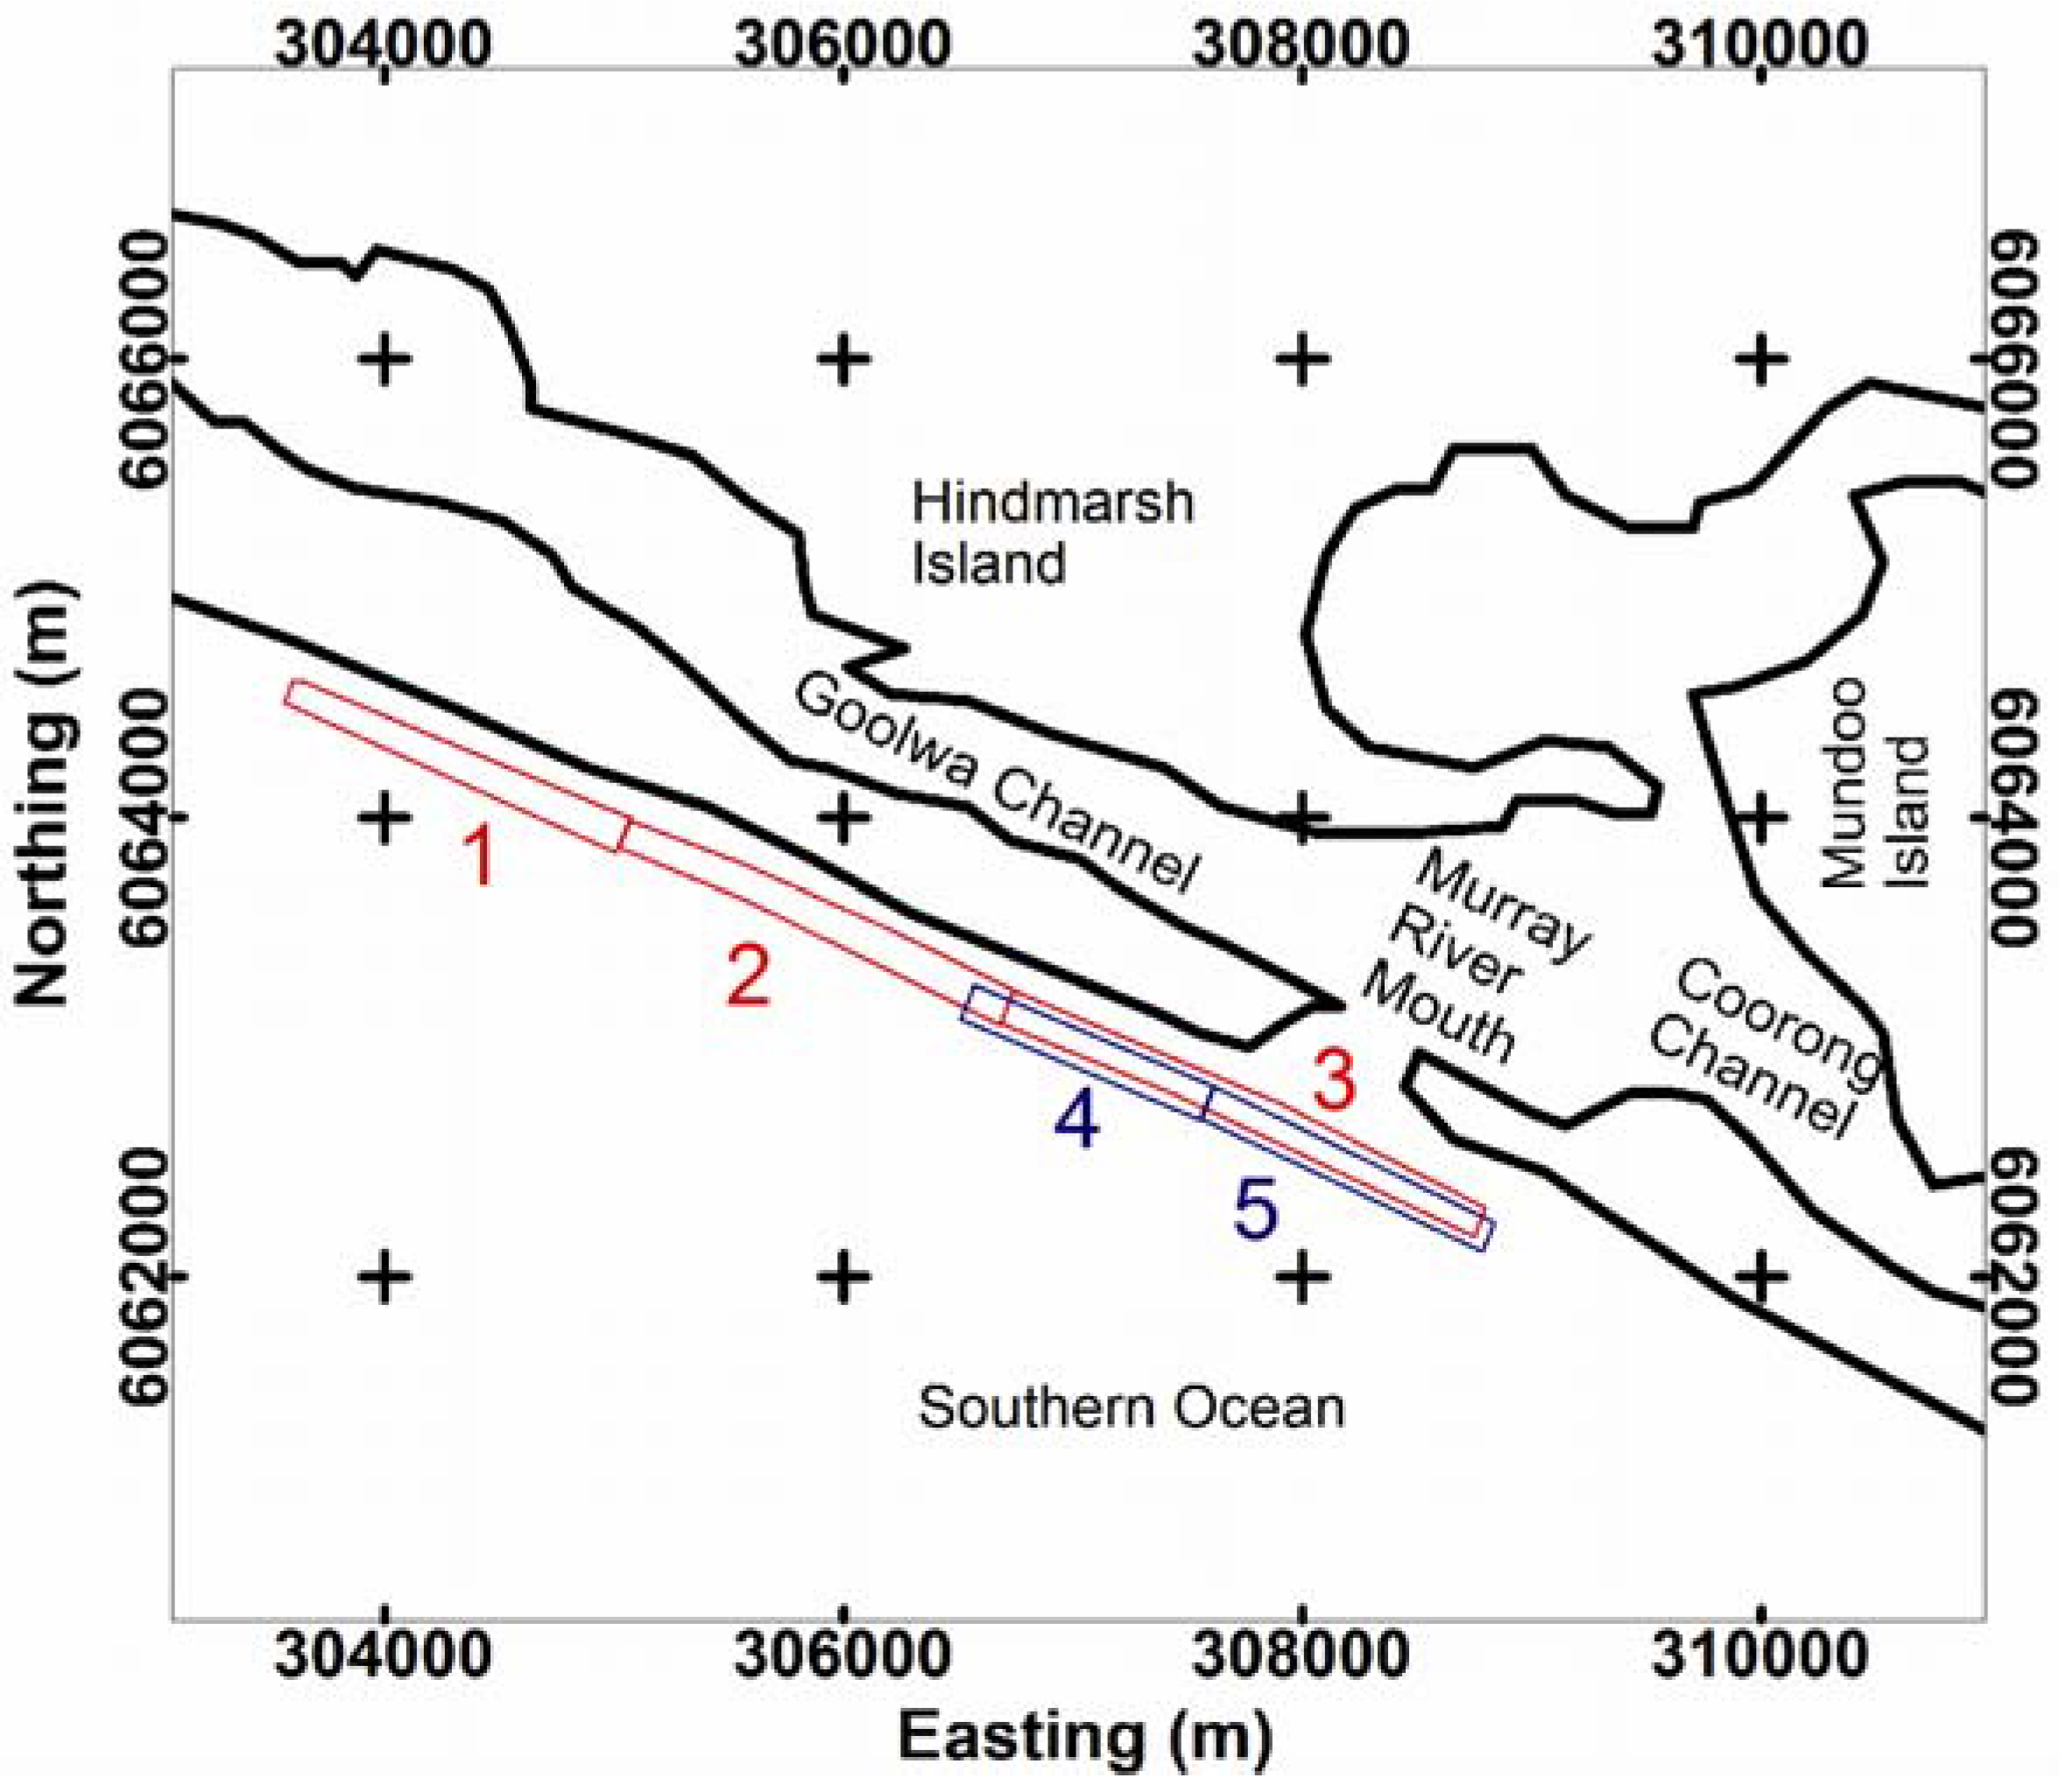
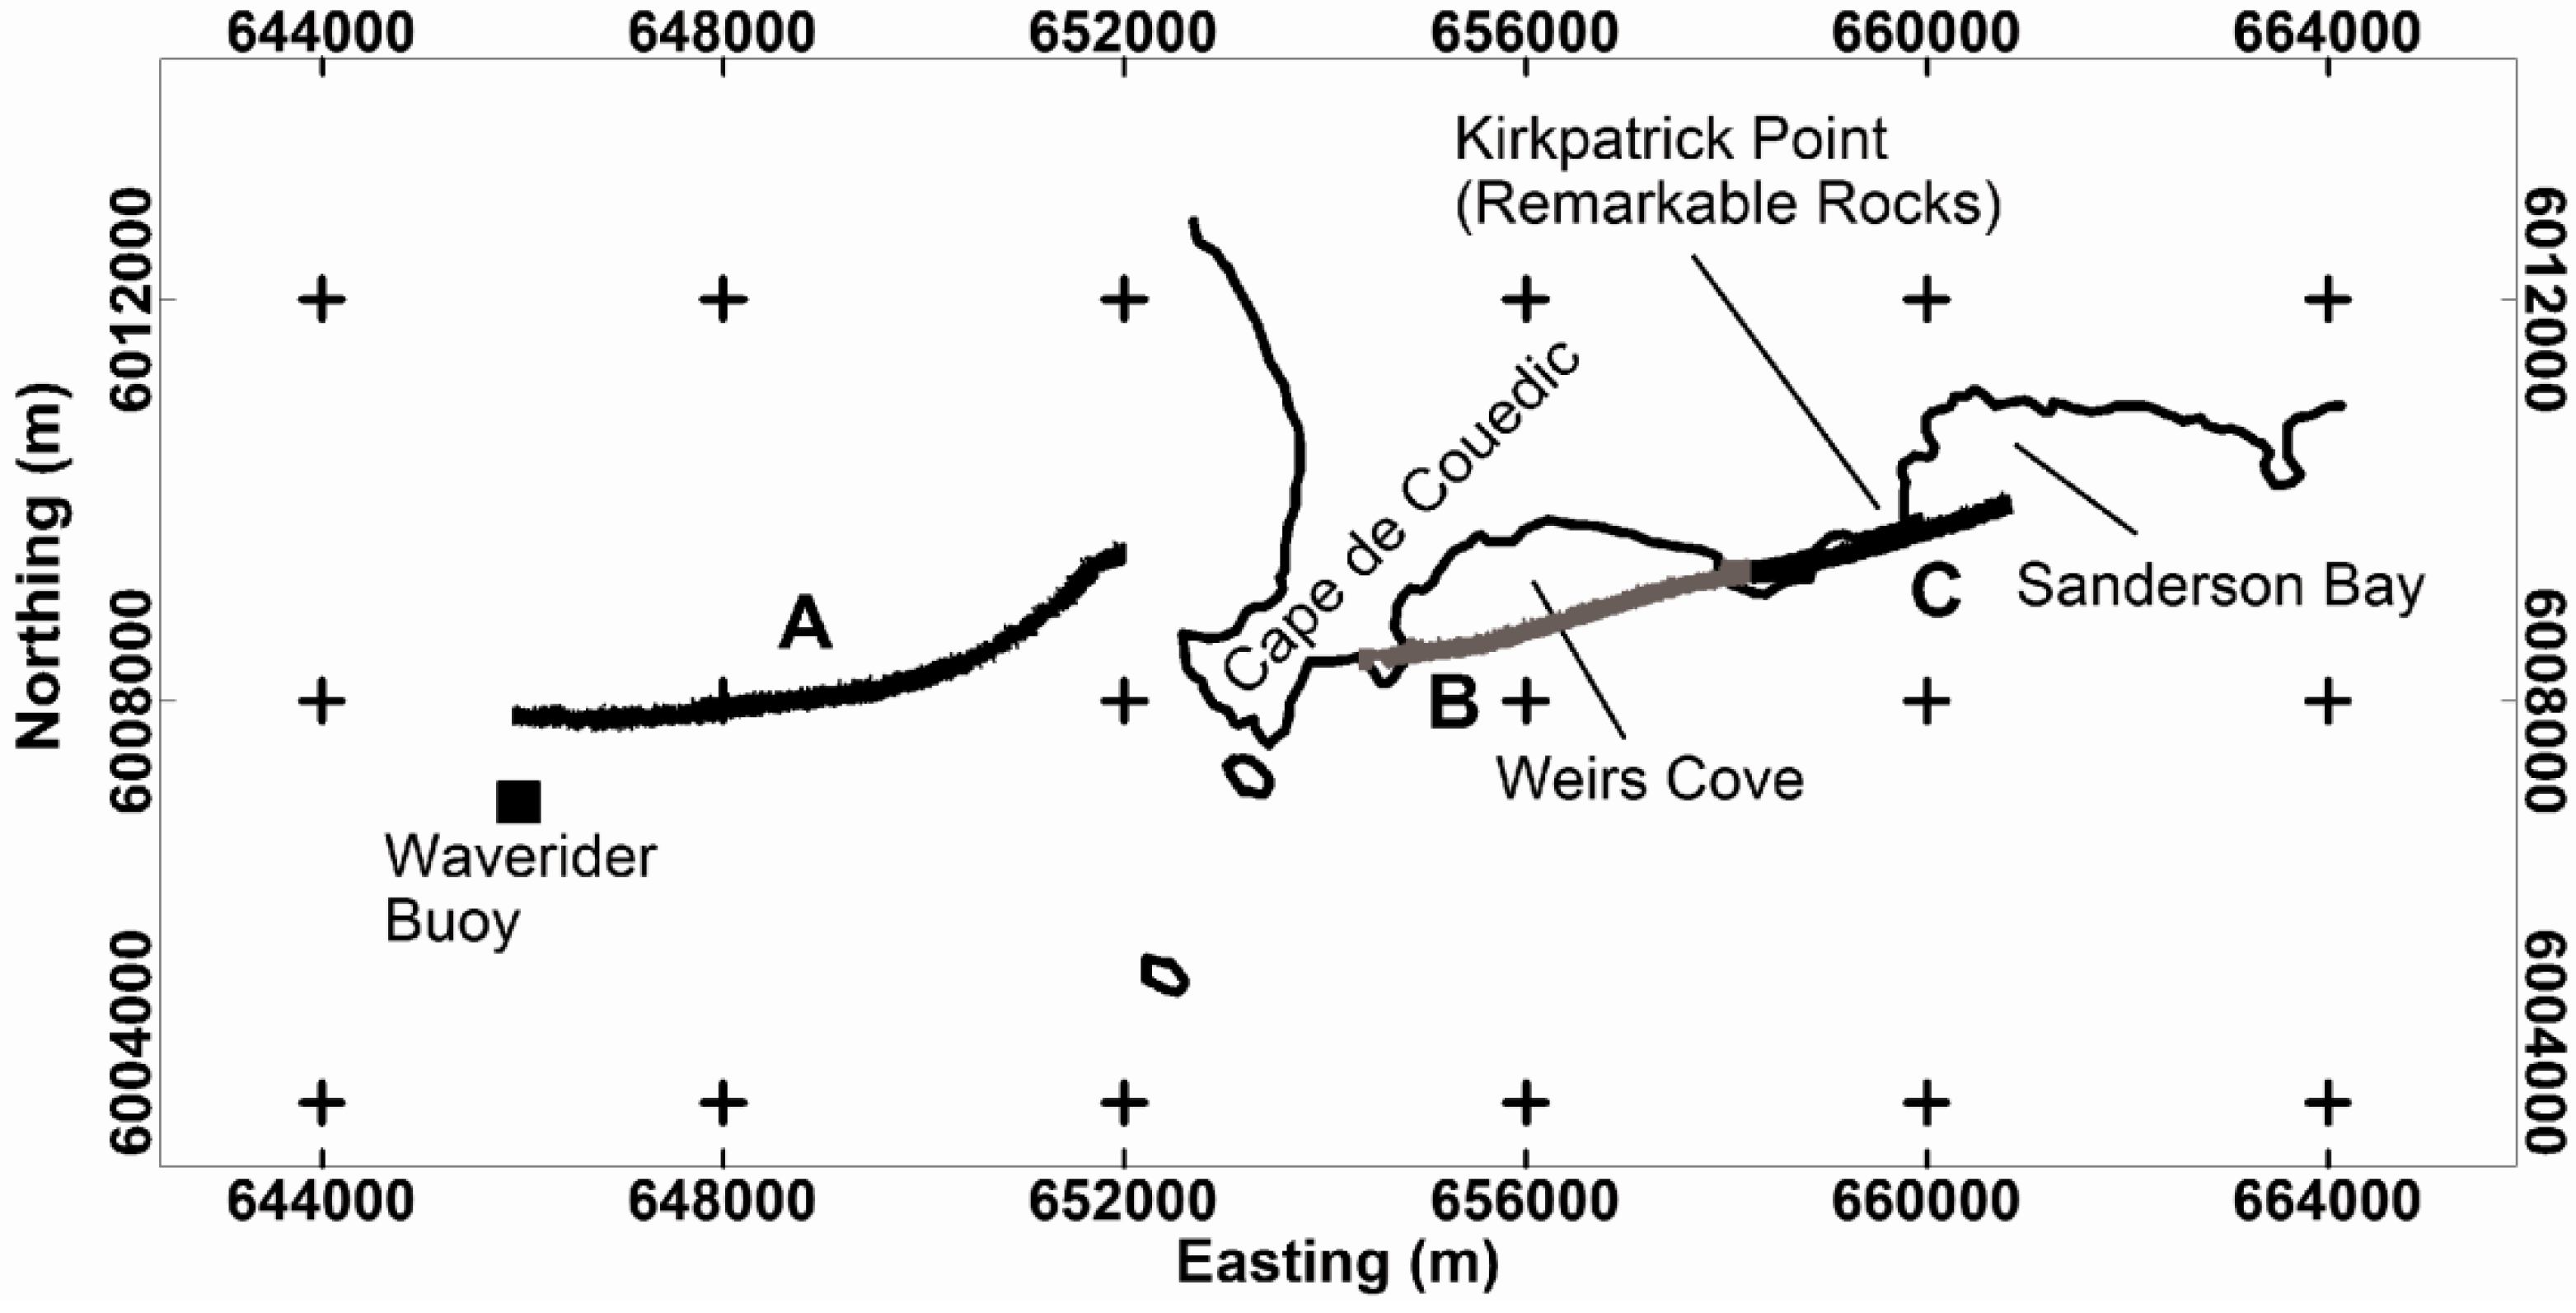
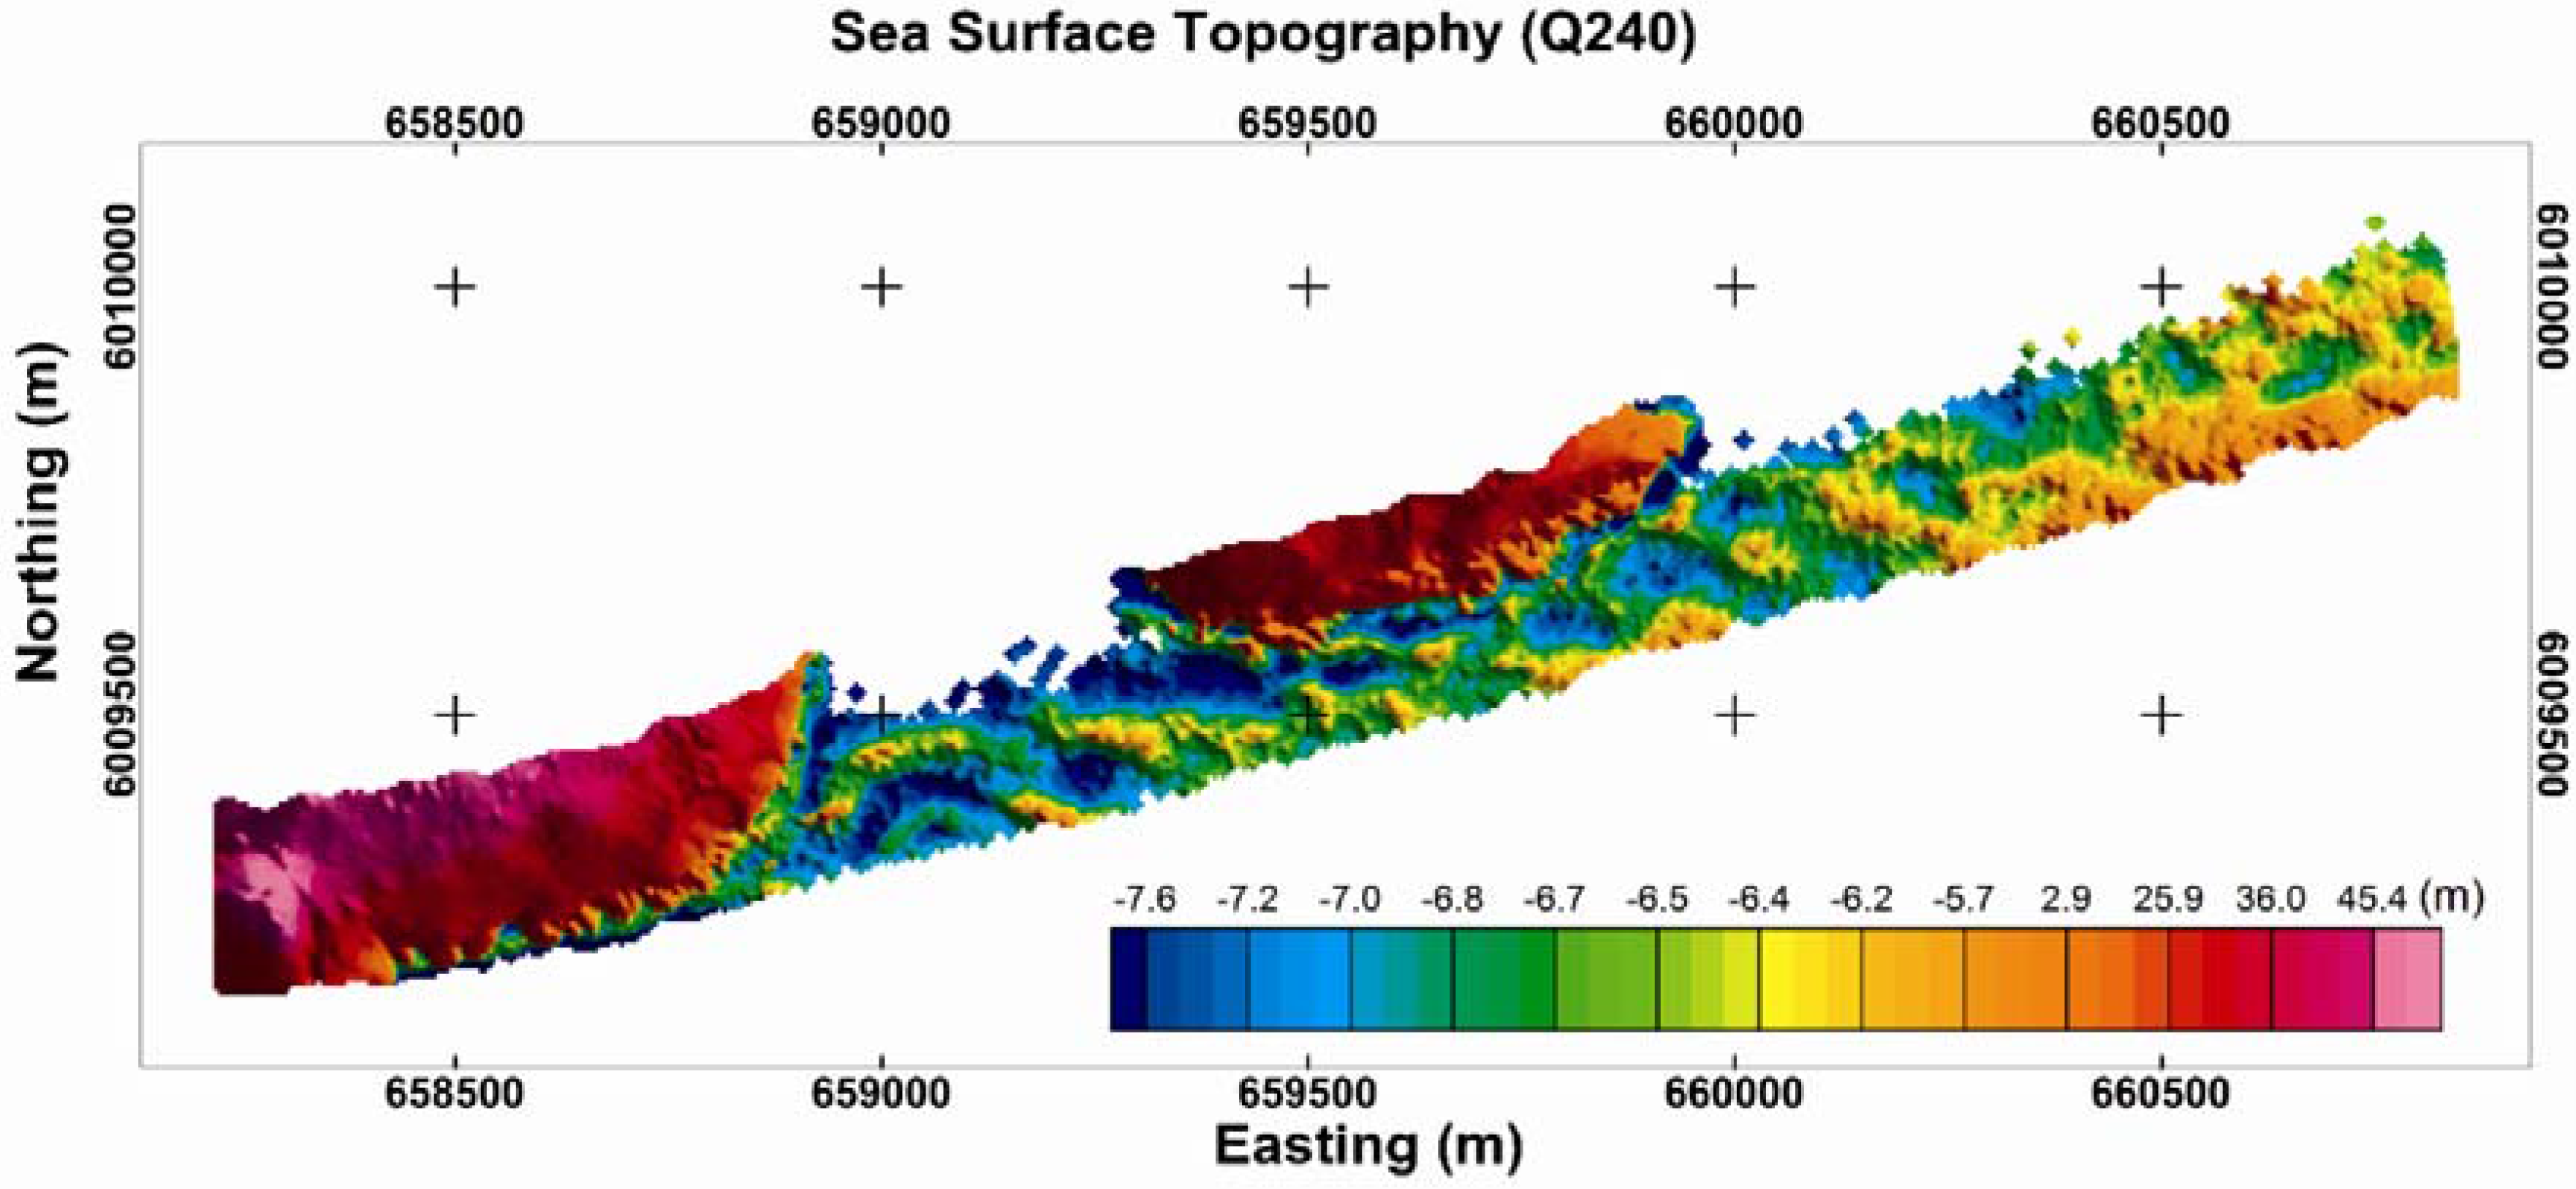
In this study, we evaluated the efficacy of a 2D laser scanner (Riegl model Q240i-80) for measuring the topographic surface of waves in shallow coastal waters and in the surf zone in two study areas shown in
Figure 1, the mouth of the Murray River, South Australia (SA) and in surrounding waters of Kangaroo Island, SA, where relative wave heights were compared with wave rider buoy data located near Cape De Couedic on the south-west tip of Kangaroo Island. The Murray River and Cape de Couedic LiDAR surveys were completed in May and June 2007 respectively. A comparison was also made with a second, more complex 2D laser scanner (Riegl model Q560) of significantly higher weight and power supply requirements, simultaneously operating at a longer wavelength with a much higher pulse repetition rate. As this unit has been routinely used and ground-truthed during accurate measurements of terrestrial topographic features [
22], its data can be considered to be of benchmark quality for the present study.
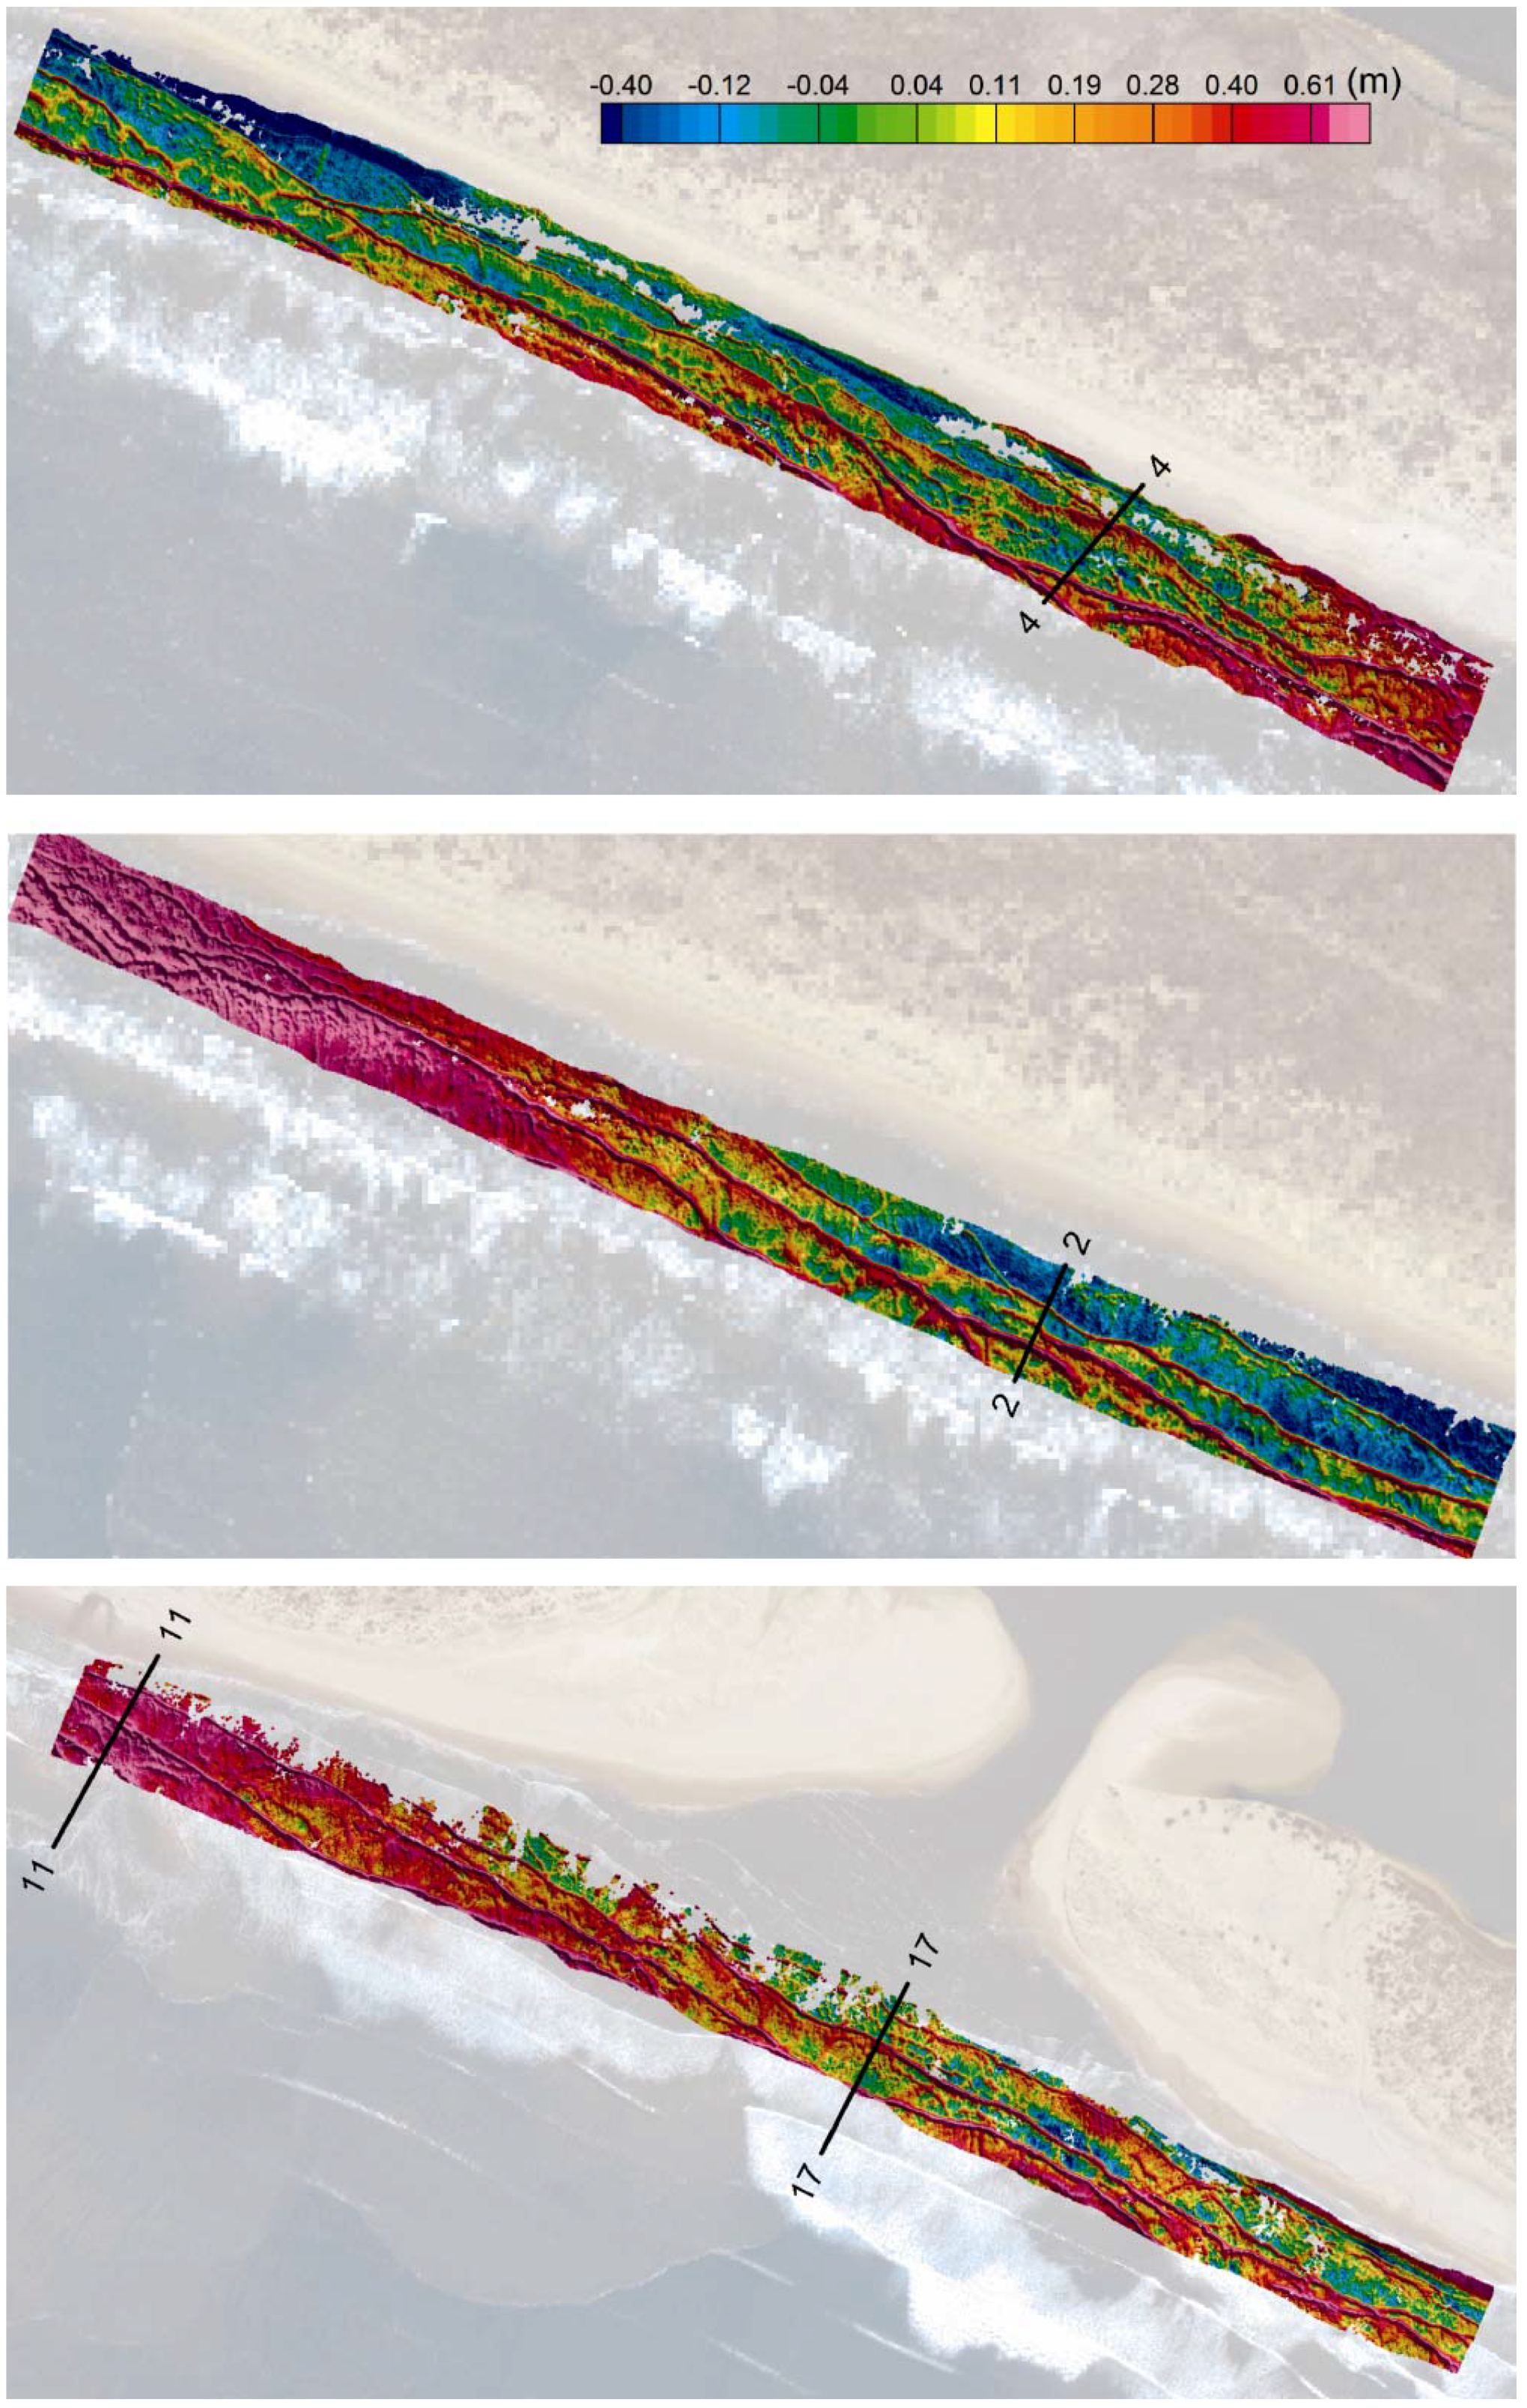
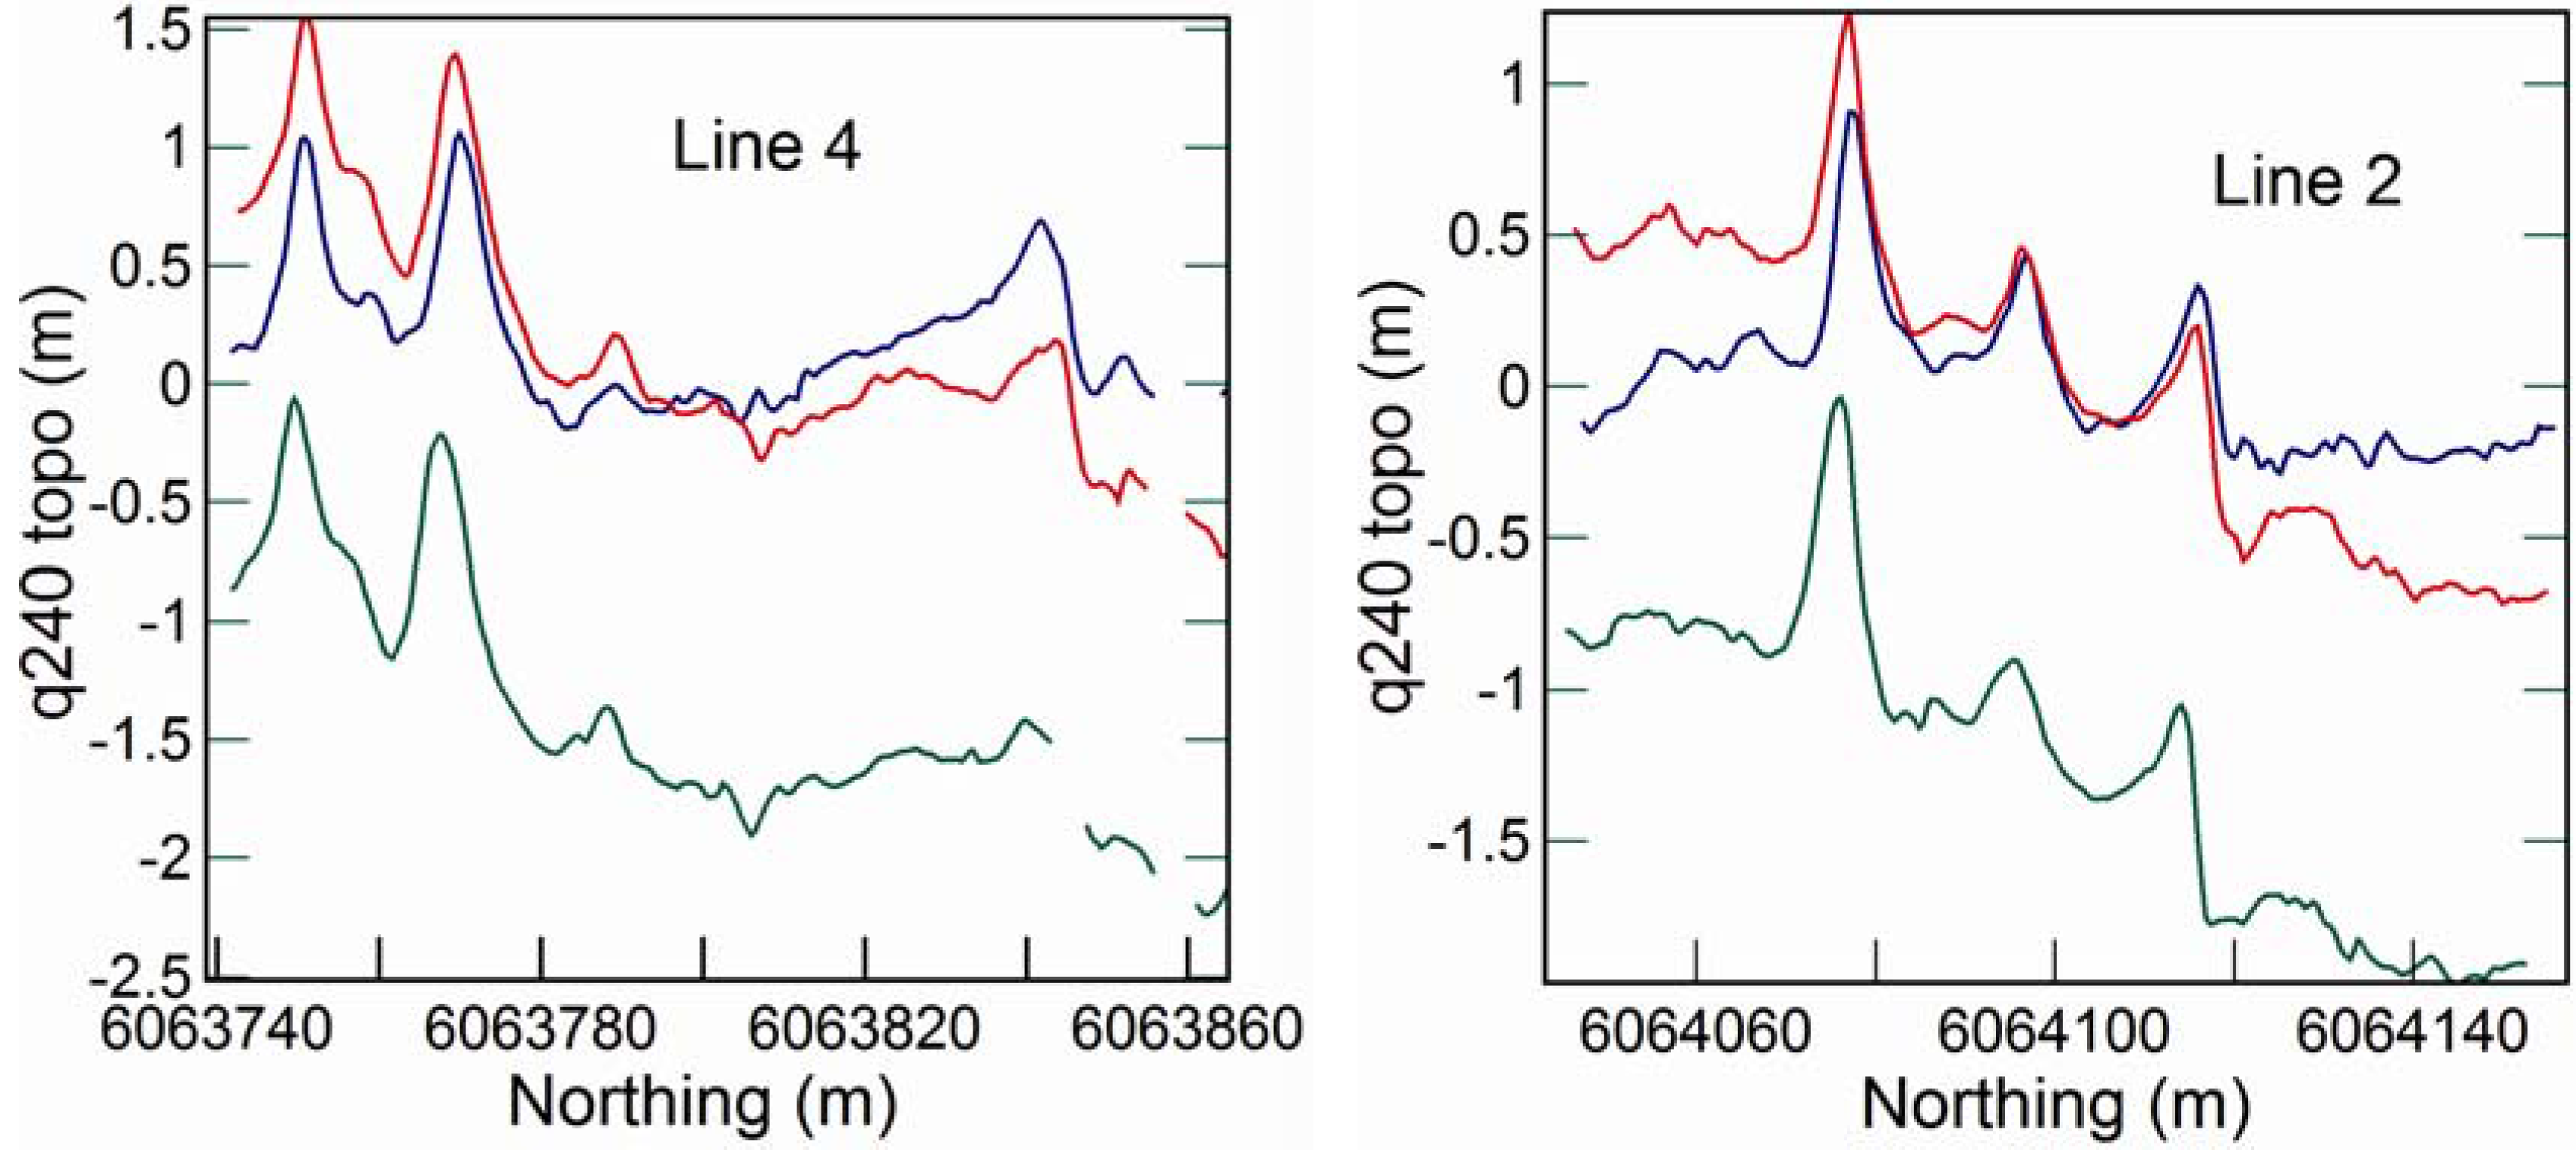
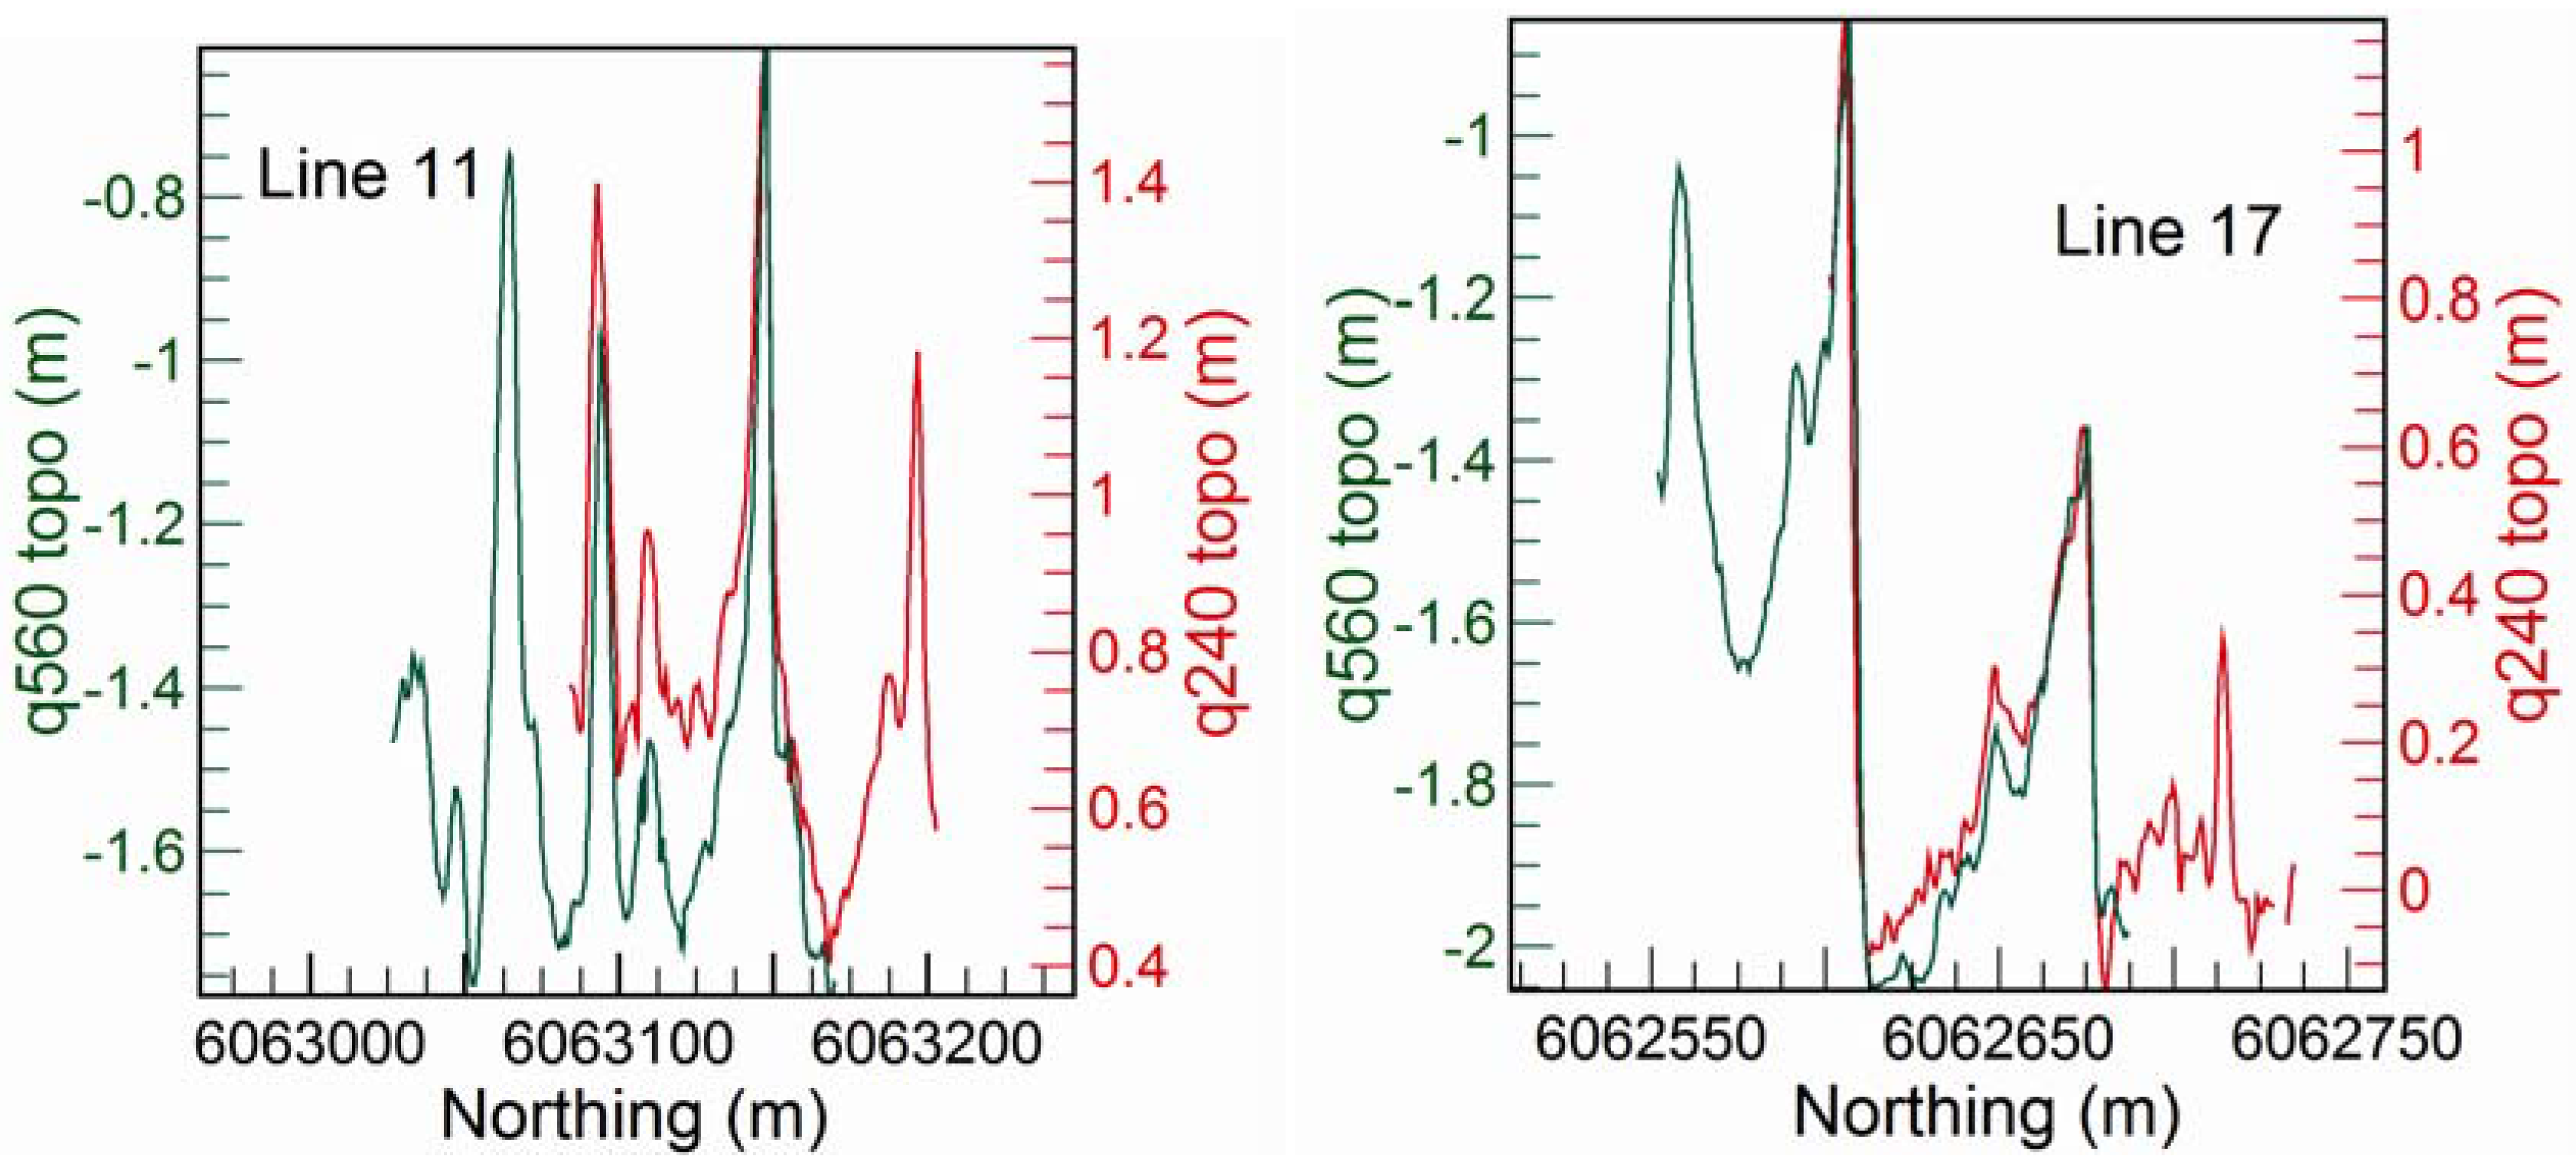
We present examples of sea surface topography in both survey areas, using data obtained from a laser scanner operating with a NovAtel/Honeywell GPS-IMU navigation system. We also present similar examples from the mouth of the Murray River survey area using data obtained from: (i) both laser scanners operating simultaneously; and (ii) from one laser scanner operating with two independent navigation systems.
Figure 1.
Location of survey areas on Australia’s coastline. Inset: A, Cape de Couedic located on south-west tip of Kangaroo Island (see first figure in
Section 3.3 for detail); B, mouth of Murray River area (see first Figure in
Section 3.1 for detail).
Figure 1.
Location of survey areas on Australia’s coastline. Inset: A, Cape de Couedic located on south-west tip of Kangaroo Island (see first figure in
Section 3.3 for detail); B, mouth of Murray River area (see first Figure in
Section 3.1 for detail).
A similar study was conducted by Reineman
et al. [
23] in 2008, post-dating our surveys by approximately one year, where a Q240 laser scanner was deployed for ocean and coastal applications, for example: (i) to measure the effects of storm events with regards to beach morphology and erosion; (ii) to determine omnidirectional wavenumber spectrum from sea surface topographic data; and (iii) to measure the wave field around the reef and ocean surrounding a coral island. Whilst there is a degree of overlap between our study and that of Reineman
et al. [
23], our focus is the comparison of the two LiDAR systems operating simultaneously, over coastal waters and over a surf zone region (to obtain wave profiles) and the use of LiDAR to obtain an altimetry map, which can be used to assist AEM methods for bathymetric mapping by providing an averaged altimetry within an area contained by the larger footprint (relative to the LiDAR system) of the AEM system.
2. Instrumentation
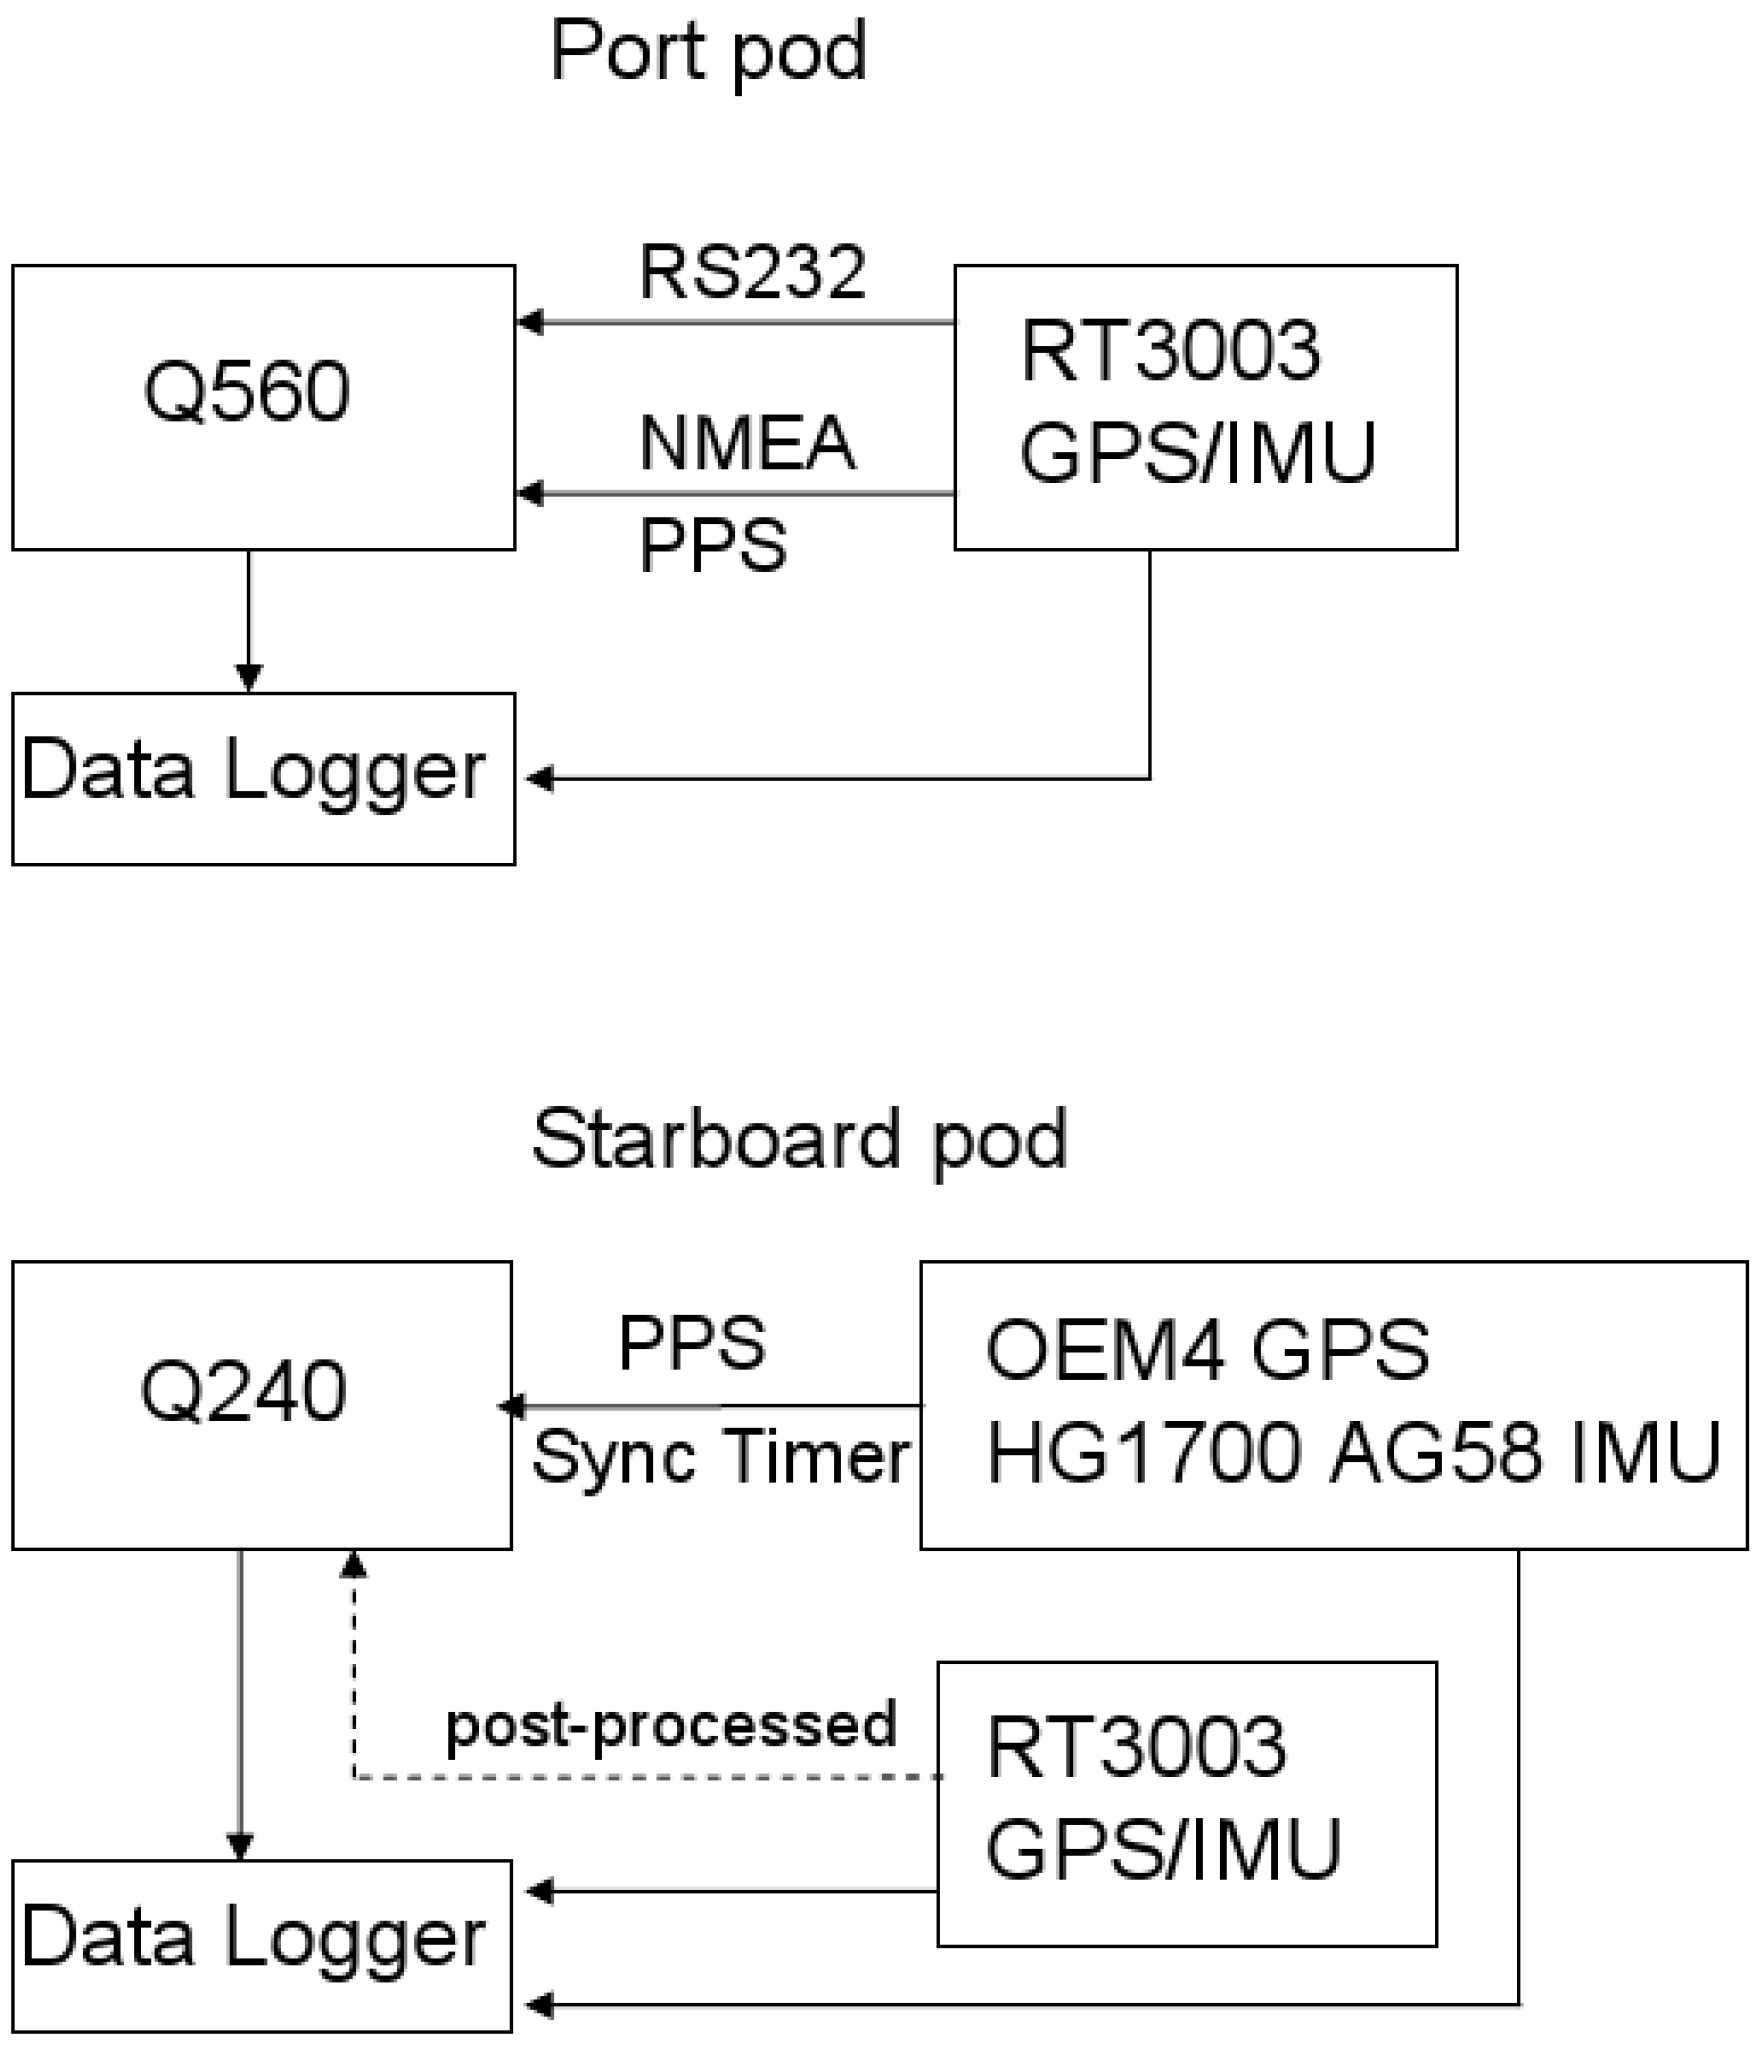
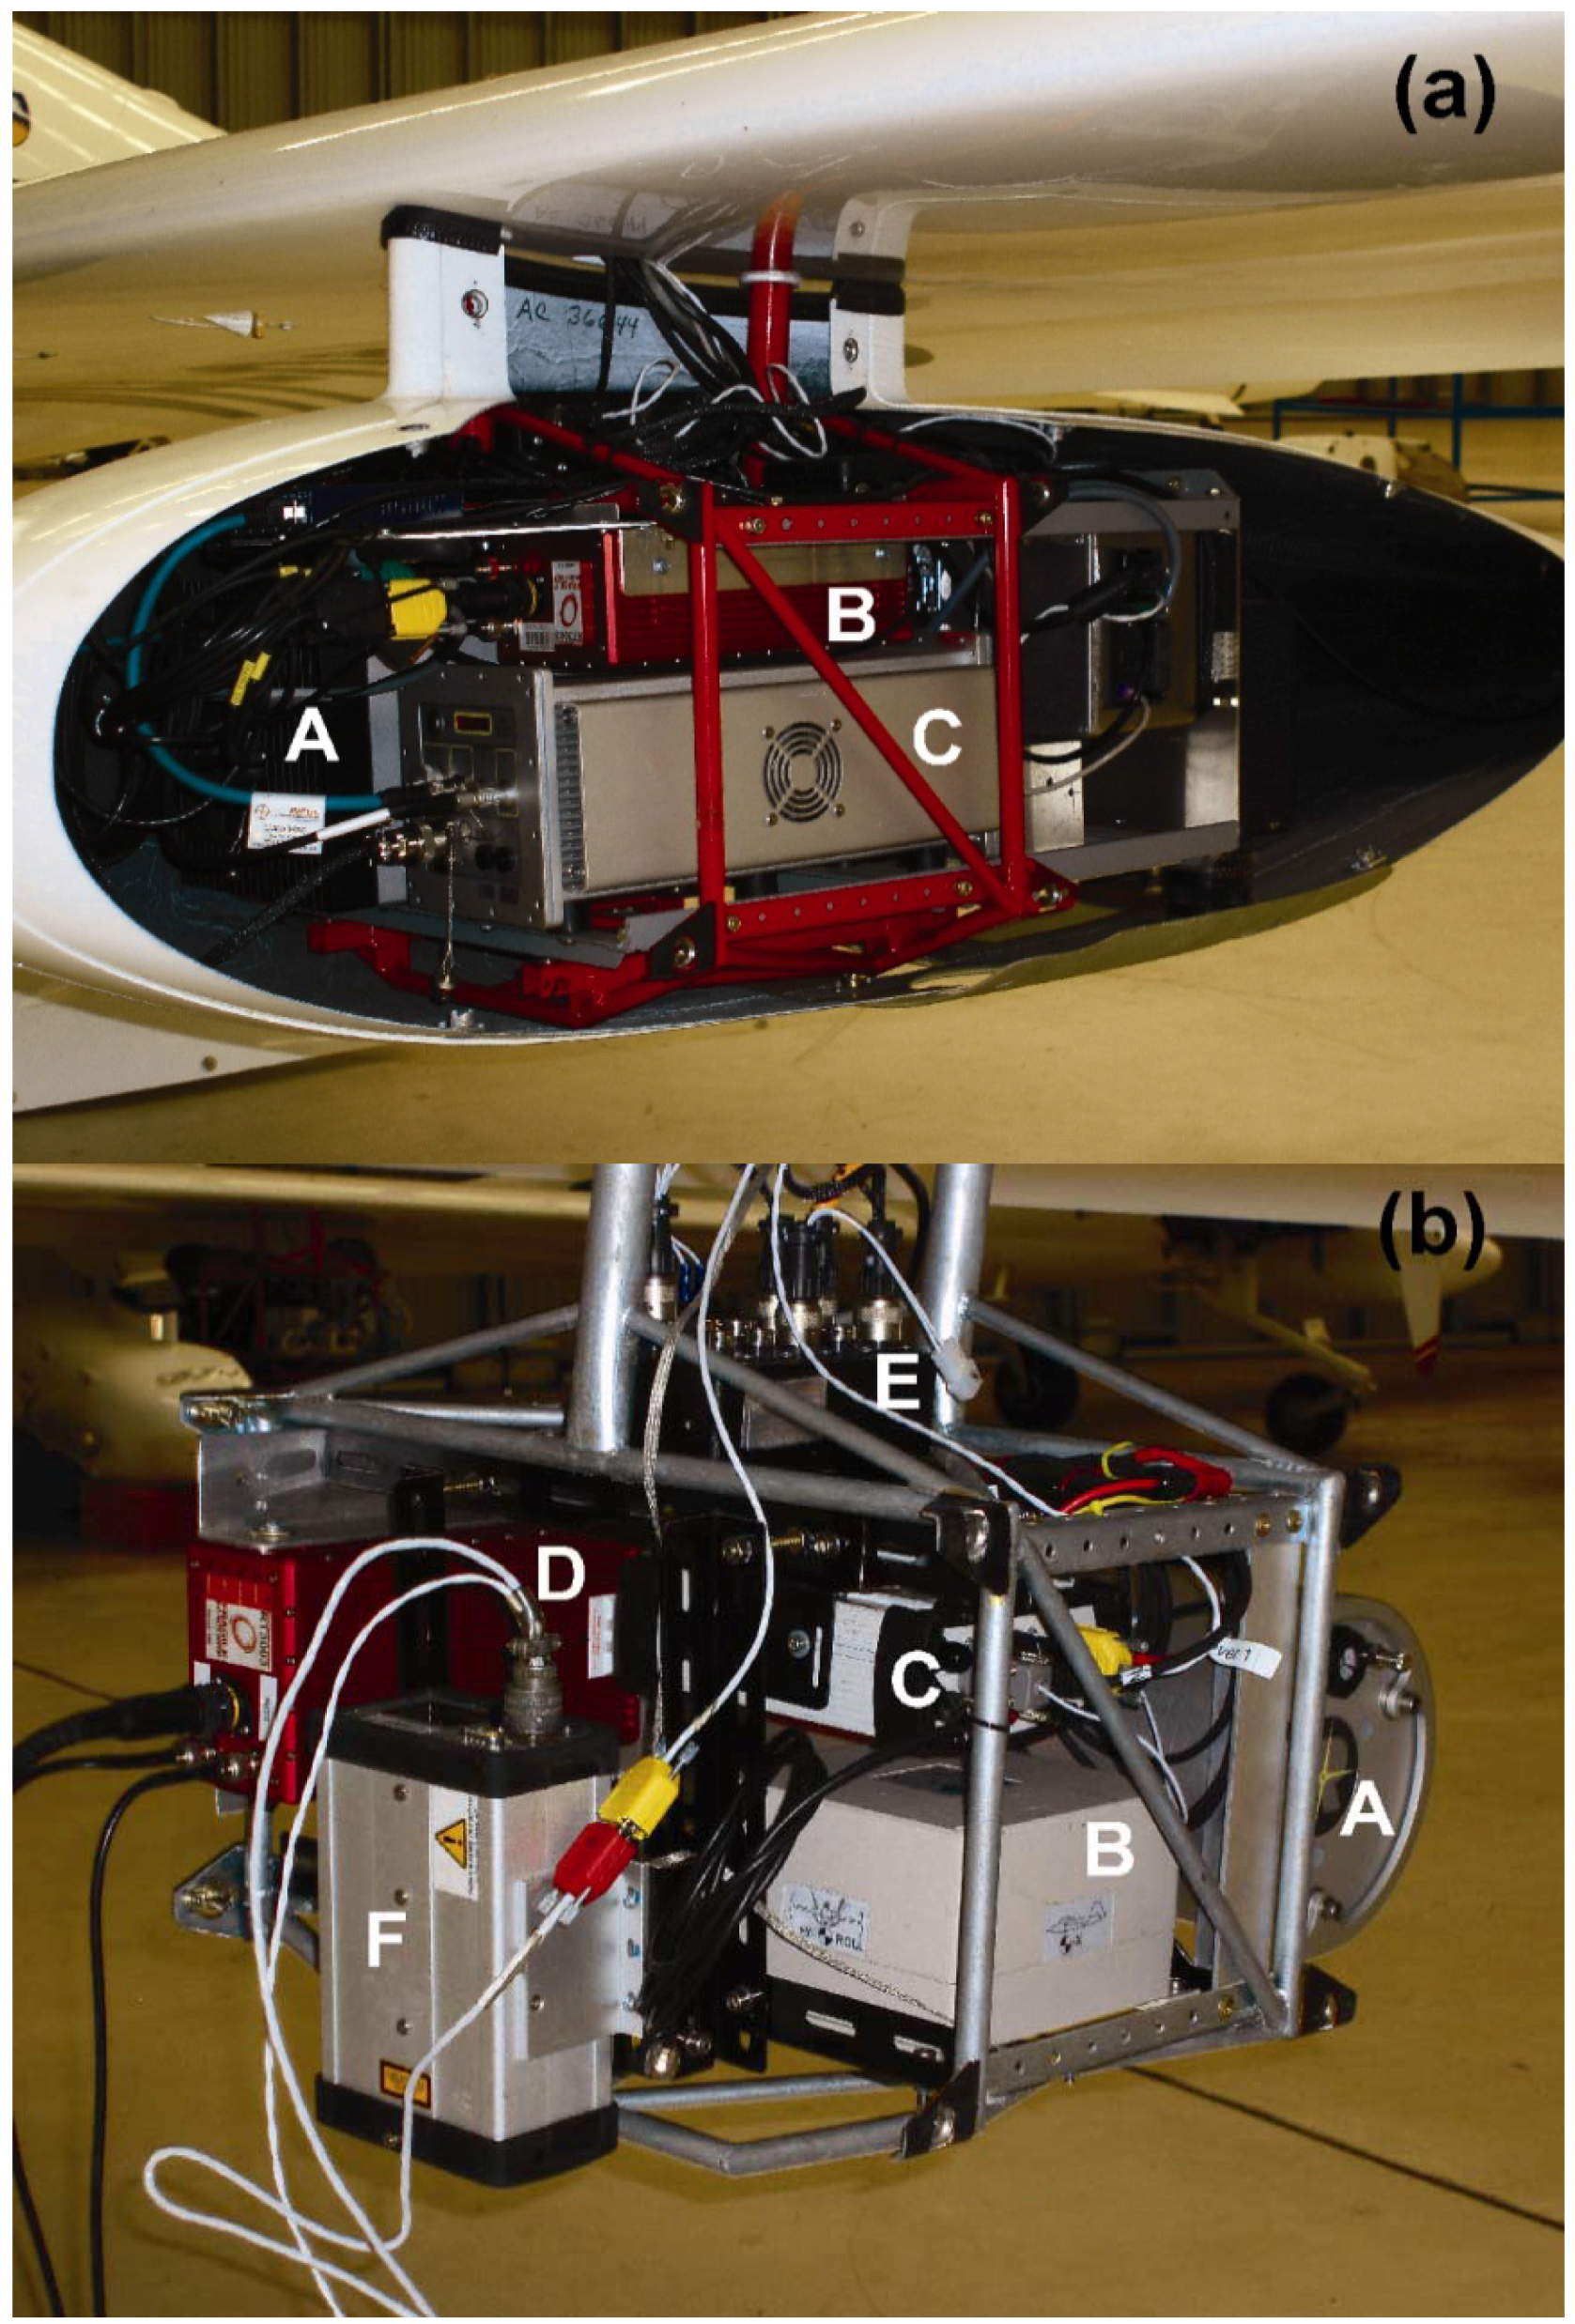
The instrumentation was housed in two pods located on the port and starboard wings of a Diamond HK36TTC -ECO Dimona single-engine aircraft, see
Figure 2 and
Figure 3. A 2D laser scanner (Riegl model Q240i-80) was mounted within the starboard pod, interfaced to and co-located with a NovAtel SPAN inertial navigation-GPS system (NovAtel OEM4-G2 GPS receiver and Honeywell HG1700 AG58 inertial measurement unit, IMU) co-located with the Q240 scanner. Another GPS-IMU system (OXTS: Oxford Technical Solutions, dual-antenna RT3003 unit) was also co-located with the scanner. This unit contains two NovAtel GPS OEMV receivers, one for each GPS antenna, integrated with a proprietary IMU unit. Temporally synchronized data was acquired from the scanner and the two GPS-IMU systems. The second 2D laser scanner (a full waveform-digitizing Riegl model Q560) was mounted within the port pod, interfaced to and co-located with a second, identical, OXTS RT3003 GPS-IMU system. Temporally synchronized data was acquired from the Q560 scanner and RT3003 unit. The performance of the Q560/RT3003 LiDAR system has been thoroughly demonstrated over terrestrial terrain [
24] and is routinely used by Airborne Research Australia (ARA) and others for remote sensing of the environment [
22,
25,
26,
27,
28].
The focus of this study was to demonstrate the operational functionality and effectiveness of the Q240 and Q560 scanners for measuring sea surface topography and for obtaining wave profiles. The experimental configuration (
Figure 2 and
Figure 3) allowed a direct comparison of the considerably more expensive Q560 scanner with the Q240 scanner, operating at wavelengths of around 1,500 nm and 1,000 nm respectively, using the same GPS-IMU system (OXTS RT3003), and also a comparison of topographic data obtained from the Q240 scanner using two different GPS-IMU systems.
While the Q240 scanner has a maximum available scan angle range of ±40°, this was set to ±22.5° (start angle 67.5°, angular step 0.18°, 250 shots per line) to match the footprint (as determined by the scan angle) of the Q560 scanner. The pulse repetition rate was set to 30 kHz, which in conjunction with the angular step rate and number of facets of the mirror wheel results in an overall scan rate of about 60 lines/s (resulting in less than 1 m line spacing on the ground at typical survey speeds). As the Q240 is limited to registering and analyzing only one of the many possible returns generated by an outgoing pulse, it was configured to record only the last valid return for each scan step.
The Q560 scanner also was set up for a scan angle of ±22.5° at a line rate of 60 lines/s. Due to the much higher pulse repetition rate of 100 kHz, this results in a much smaller angular step (i.e., the interval between individual samples along the scan line) and thus about 835 laser shots in each scan line. As the Q560 digitizes the full waveform of the receiver signal it does not require any arbitrary restriction to a given return (reflected back from the sea surface).
The set-up of the scanners neglected the wing dihedral angle (3°), thus the central beams of the two scanners are offset by 6° resulting in approximately 40° of overlap between the two fields of view. In order to achieve the best possible quality of post-processed navigation data, the GPS units and inertial systems were configured to record raw data at their highest respective rates (about 2 Hz for GPS measurements and 100 Hz for accelerometers and gyro data).
Figure 2.
Experimental set-up on port and starboard wing pods.
Figure 2.
Experimental set-up on port and starboard wing pods.
Figure 3.
Instrumentation configuration: (a) Port pod assembly: (A), Q560 scanner; (B), RT3003 GPS-IMU; (C), data logger; and (b) Starboard pod assembly: (A), Q240 scanner; (B), HG1700 AG58 IMU; (C), NovAtel OEM4 GPS; (D), RT3003 GPS-IMU; (E), data logger; (F), LD90 altimeter.
Figure 3.
Instrumentation configuration: (a) Port pod assembly: (A), Q560 scanner; (B), RT3003 GPS-IMU; (C), data logger; and (b) Starboard pod assembly: (A), Q240 scanner; (B), HG1700 AG58 IMU; (C), NovAtel OEM4 GPS; (D), RT3003 GPS-IMU; (E), data logger; (F), LD90 altimeter.
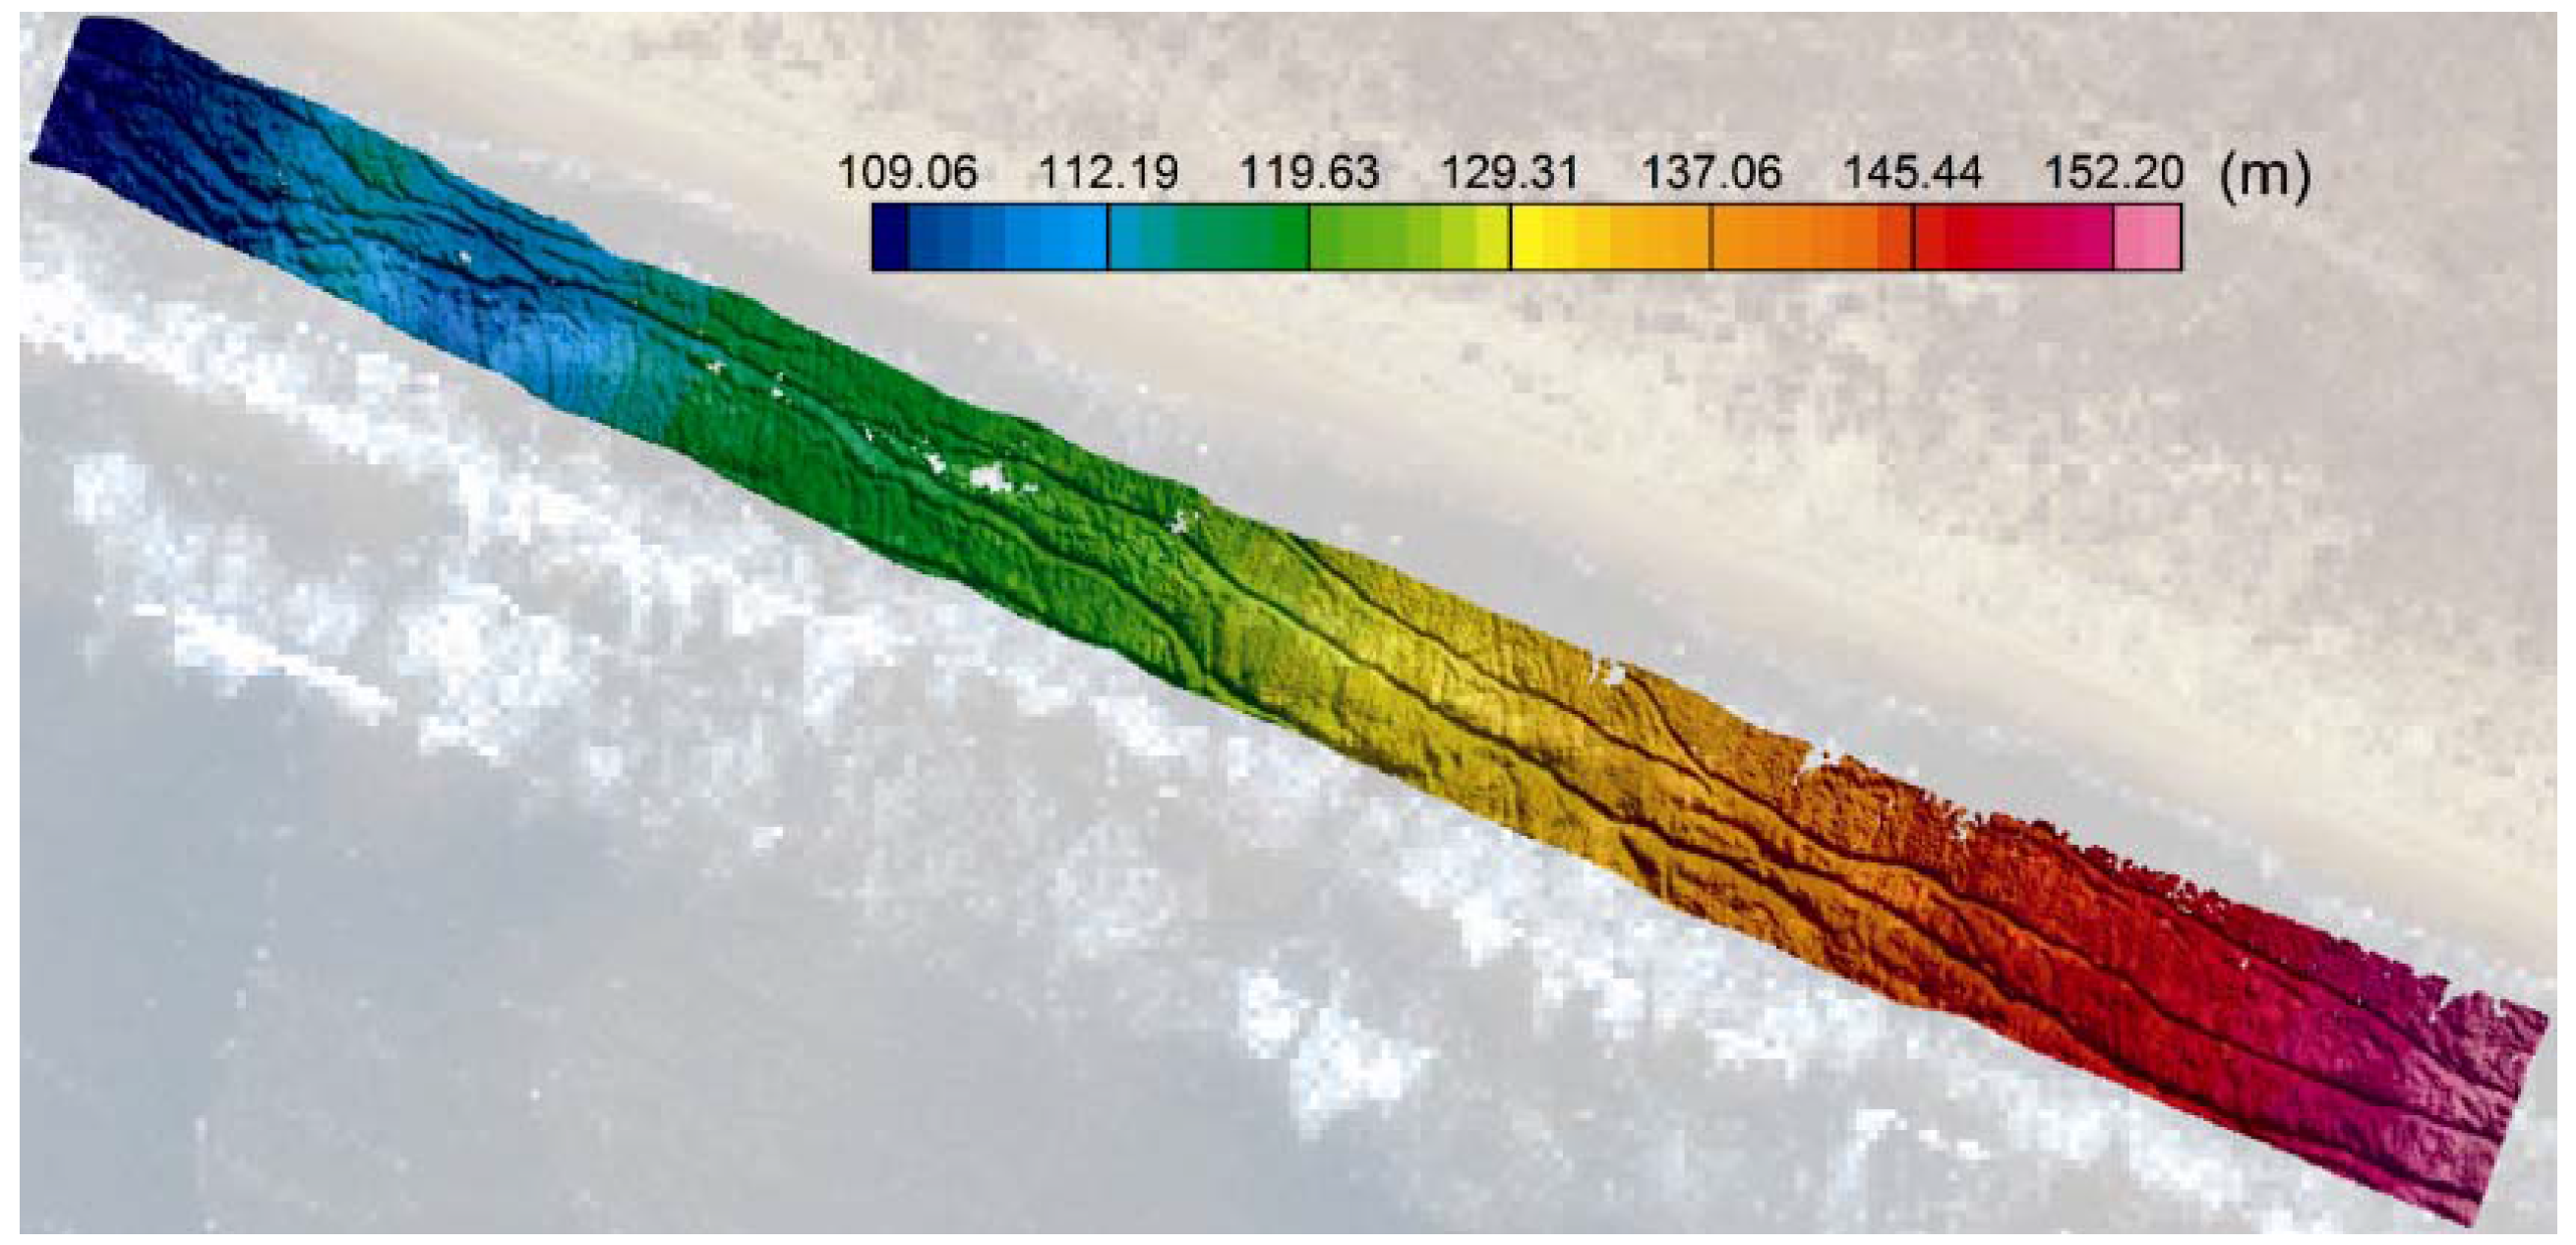
The post-processed scanner data provides the altitude (elevation) between the sea surface and the LiDAR which is independent of the GPS height accuracy. This elevation is subtracted from the GPS altitude which is referenced to the WGS84 ellipsoid to determine the instantaneous sea surface topography. Thus the datum of the wave topography is the ellipsoid. While the accuracy of the laser ranging (and hence altimetry) is of the order of cm, the accuracy of the absolute height of the instantaneous sea surface relative to the ellipsoid is determined chiefly by the height accuracy of the GPS data. As the focus of this study was to demonstrate the functionality and effectiveness of the Q240 and Q560 scanners for measuring relative sea surface topography over short time scales (minutes), as opposed to absolute altimetry referenced to a given datum, the use of geoidal GPS data (e.g., using the Australian Height Datum AHD or the EGM96 geoid specifications) was not required, neither was the use of base station differential GPS corrections to improve GPS height accuracy and to remove low frequency drift in the GPS height above the WGS84 ellipsoid. The elevation of the LiDAR system above the sea surface is derived from post-processed data obtained directly from LiDAR measurements and is independent of the GPS altitude. Thus altimetry maps derived from laser scanner data are not affected by GPS errors to the same extent as sea surface topography referenced to the WGS84 ellipsoid datum, and are deemed to be suitable for supporting AEM methodology.
Kinematic differential GPS processing combined with GPS base station data would be required to obtain accurate GPS solutions for the flight trajectories, in particular the vertical GPS height, in order to remove significant low frequency drift that would mask low frequency changes in wave height in coastal areas. Such corrections would be critical, for example, for comparing spatial changes of wave heights over long periods, for obtaining the omnidirectional wavenumber spectrum, and for providing a datum for wave height profiles. In order to proceed from the demonstration phase which is the objective of this study, to more robust applications of LiDAR for studying coastal processes, we recommend normal LiDAR industry practice, i.e., the use of GPS base station corrections, differential kinematic GPS processing and post-processing (e.g., processing with NovAtel’s Waypoint GrafNav and Inertial Explorer software).
System Validation
Initial flight trials over buildings and roads at an altitude range of about 150 to 300 m, confirmed that both scanners were operating correctly. After post-processing/refining the navigation data from all 3 GPS-IMU units using the NovAtel ‘WayPoint’ software package, various comparisons were made: (i) the data from the Q240 scanner, processed either using the NovAtel SPAN or OXTS RT3003 navigation data, resulted in essentially the same 3D topographic accuracy (about 1 m horizontal resolution from 300 m altitude with a vertical jitter of less than 5 cm) based on ground structures with well documented position and altitude that were used as reference targets; (ii) the relative agreement between the Q560 and Q240 scanners, both processed in conjunction with the RT3003 data from the unit mounted in their respective pods, was also likewise estimated to be better than 5 cm for this range of altitudes.
The effect of errors associated with the IMUs on measuring sea surface heights are small compared to GPS errors for the survey altitudes of 150 to 300 m used in this study. Following Reineman
et al. [
23], the attitude errors can be decomposed as a sum of the mean and fluctuating errors. The mean pitch, roll and azimuth errors are associated with the static alignment offsets between the LiDAR scanner and the IMU and were minimized (by determining the offset constants and minimizing the residuals) during initial flight trials using known ground structures as reference targets. The attitude accuracies (fluctuating errors) of the NovAtel SPAN and the Oxford Technical Solutions RT3003 systems are estimated by the manufacturers to be 0.015° and 0.03° respectively for pitch and roll angles (ξ, θ) and 0.05° and 0.1° respectively for azimuth (yaw, heading) angle (φ). Thus Δθ = Δξ = 0.015° and 0.03° and Δφ = 0.05° and 0.1° for the SPAN and RT3003 systems respectively. The vertical and horizontal position errors arising from the time-varying attitude errors are a function of the swath angle (α) and distance
h above the planar surface. Assuming small attitude errors (
i.e., within the small angle approximation for trigonometric functions), the vertical position error resulting from the roll error is given by
; the horizontal position error resulting from the pitch and roll error is given by
and
respectively; and the horizontal position error Δ
r resulting from the azimuthal error
is
. Note that the position errors scale linearly with height—thus the class 1 rating of both laser scanners allows deployment at lower altitudes thereby reducing the effects of the fluctuating attitude errors. At the maximum swath angle set to 22.5°, and assuming a flying height of 200 m, the fluctuating errors associated with the RT3003 system are estimated to be Δz = 4.3 cm, Δx = 10.5 cm and Δr = 14.6 cm, and half these values for the SPAN system. These horizontal errors are comparable or smaller than the typical GPS horizontal errors and the vertical errors are smaller than the vertical errors associated with single point GPS positioning (where no differential or base station corrections have been applied) which will be affected by low frequency drift in height accuracy.
4. Conclusions
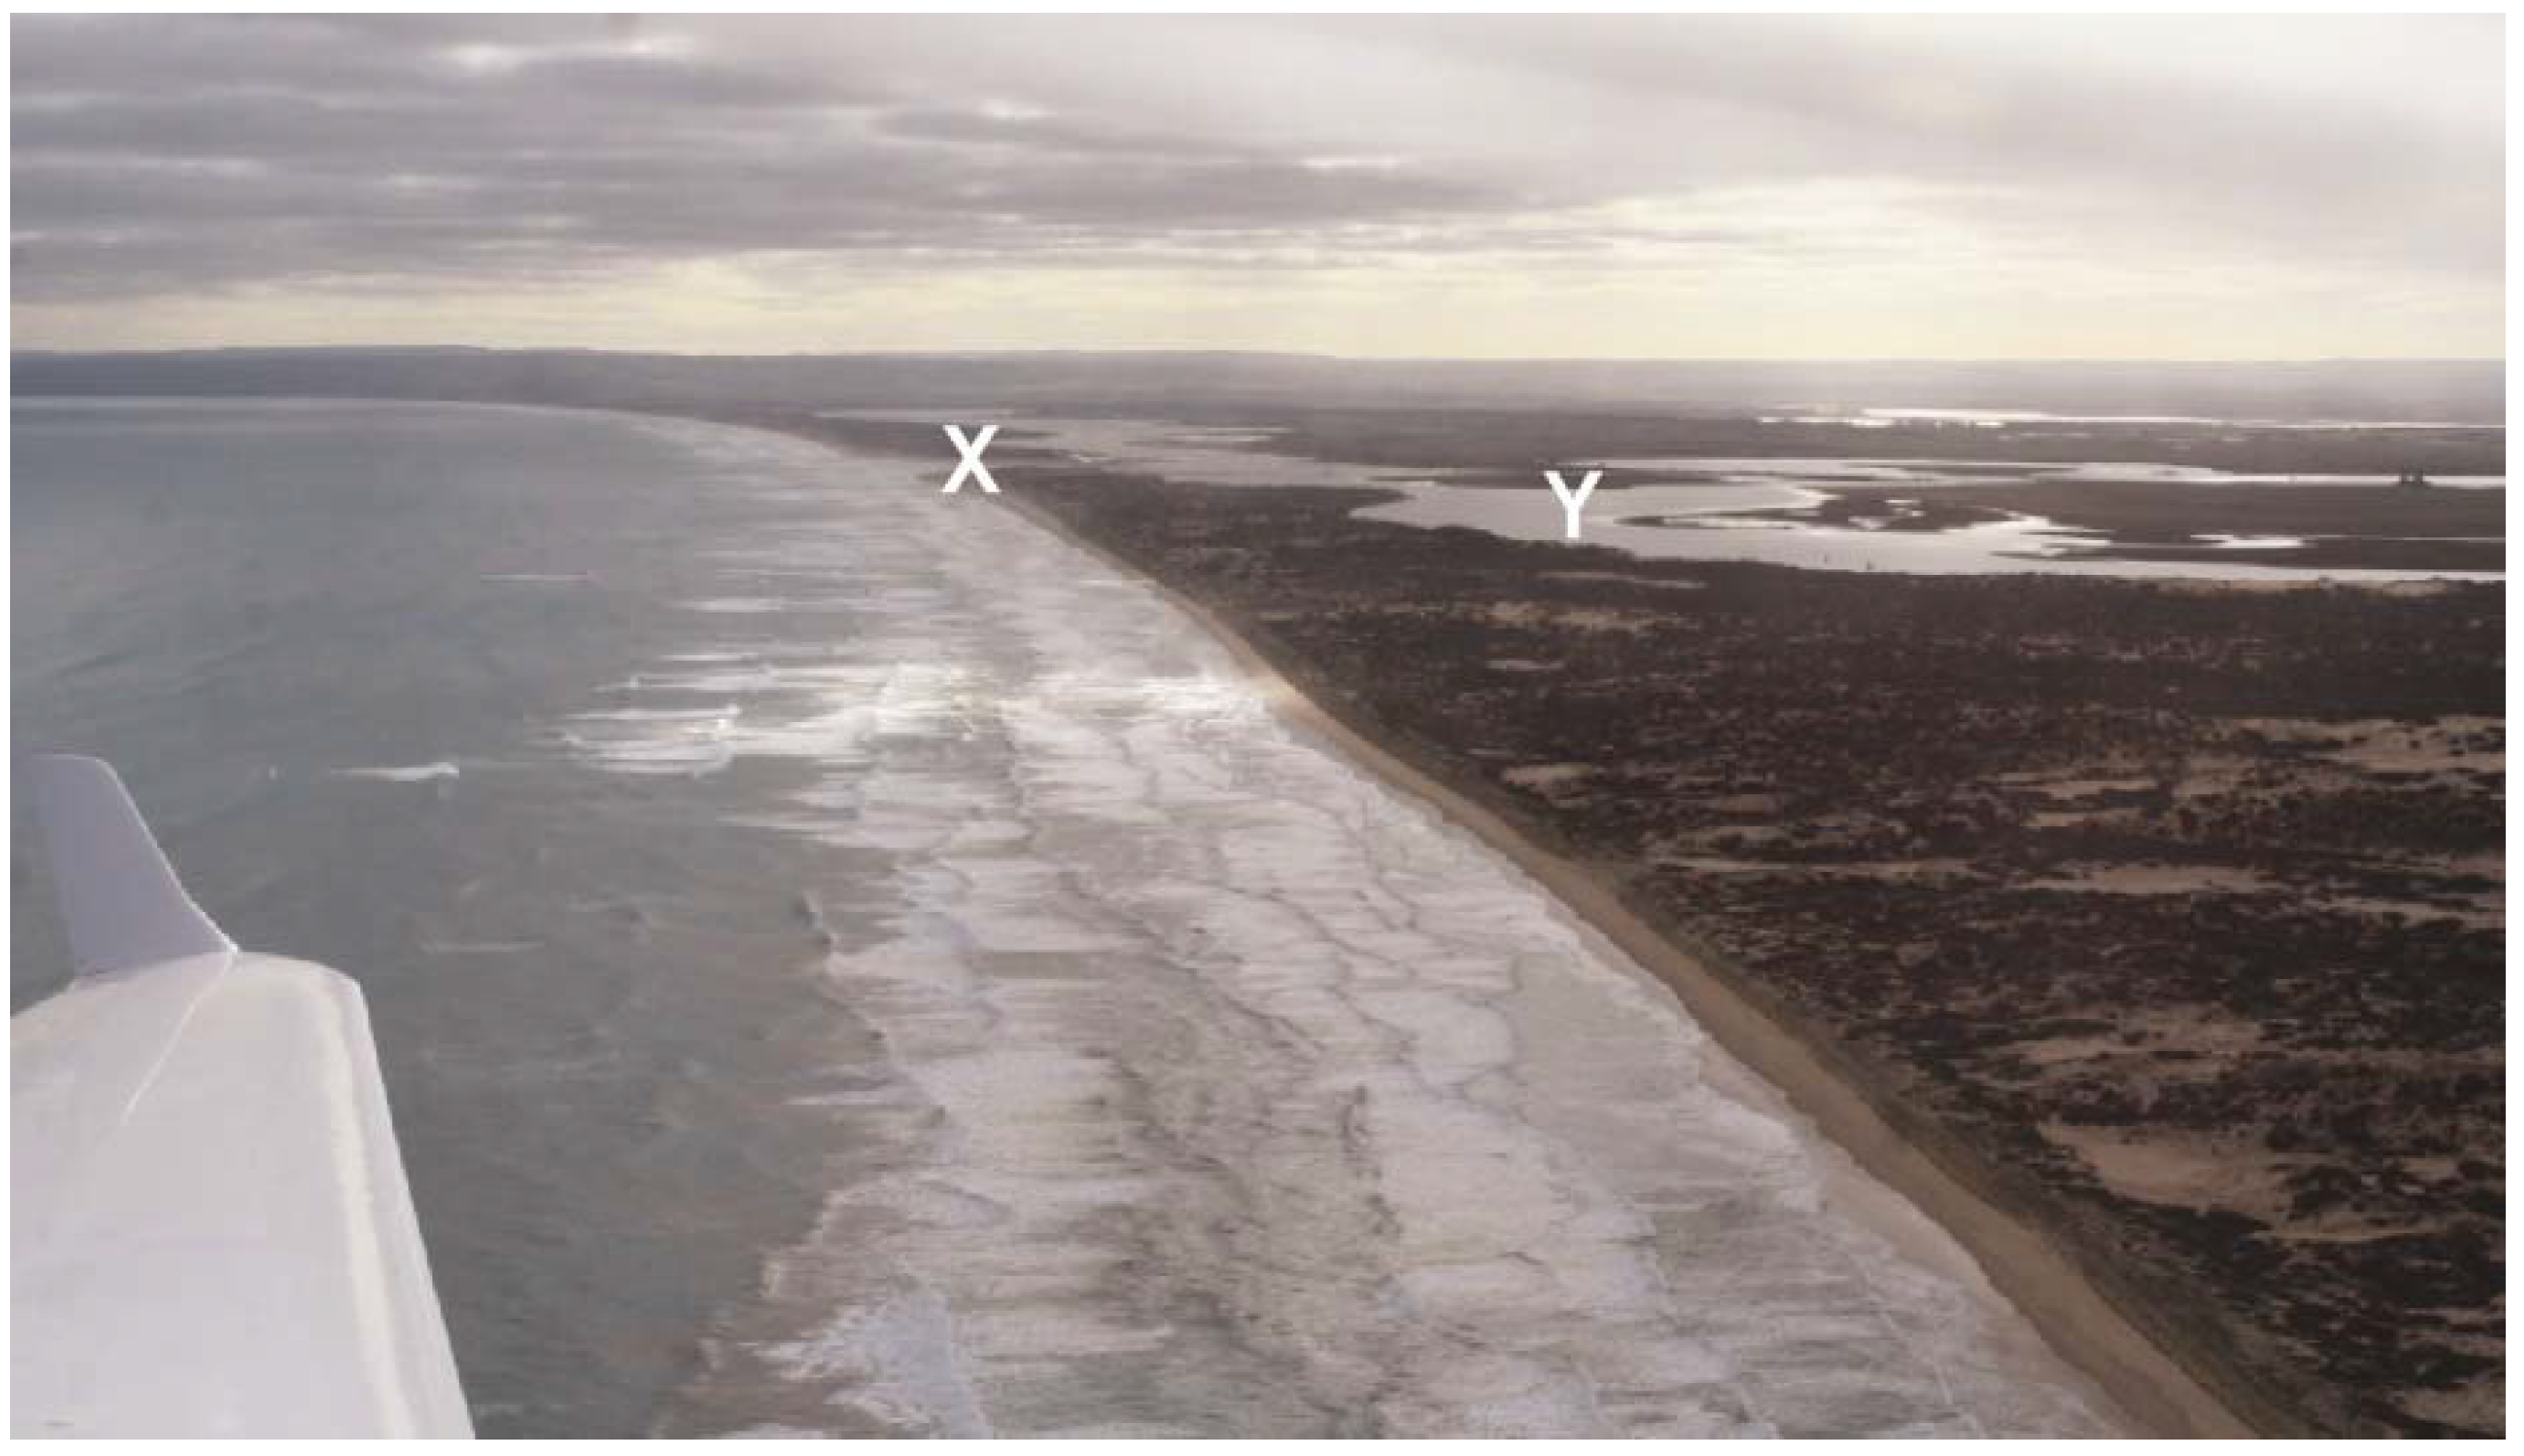
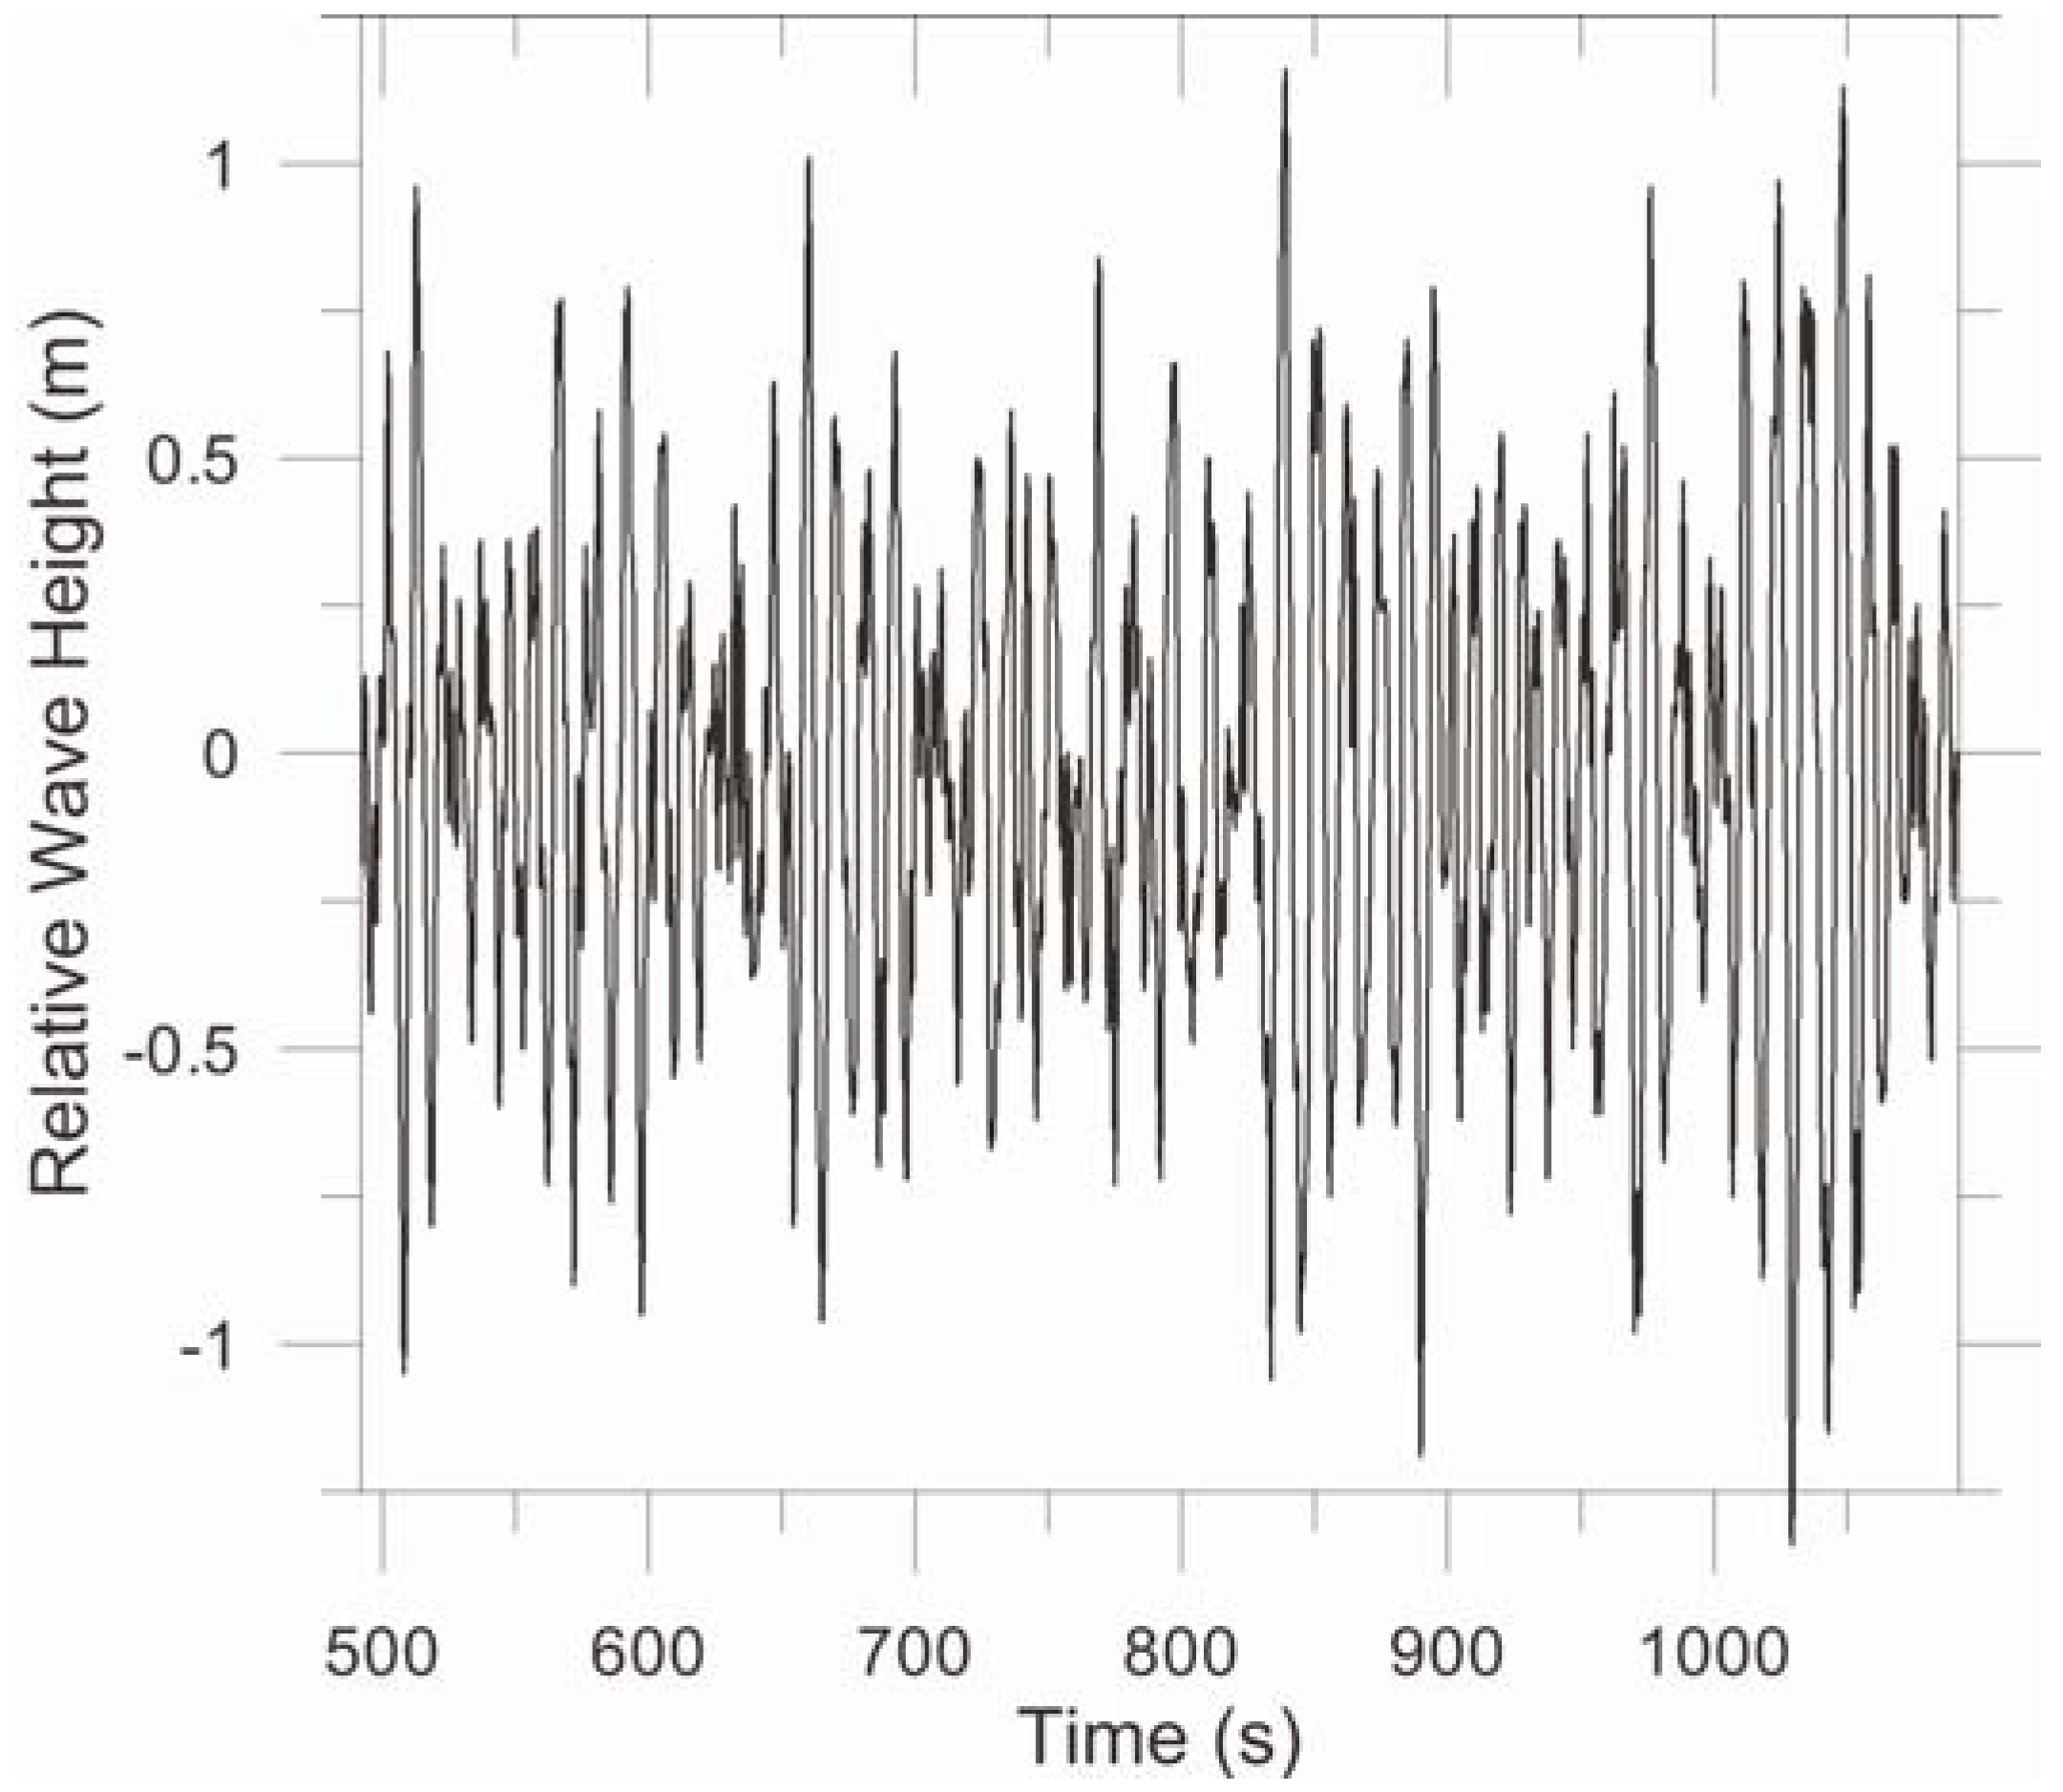
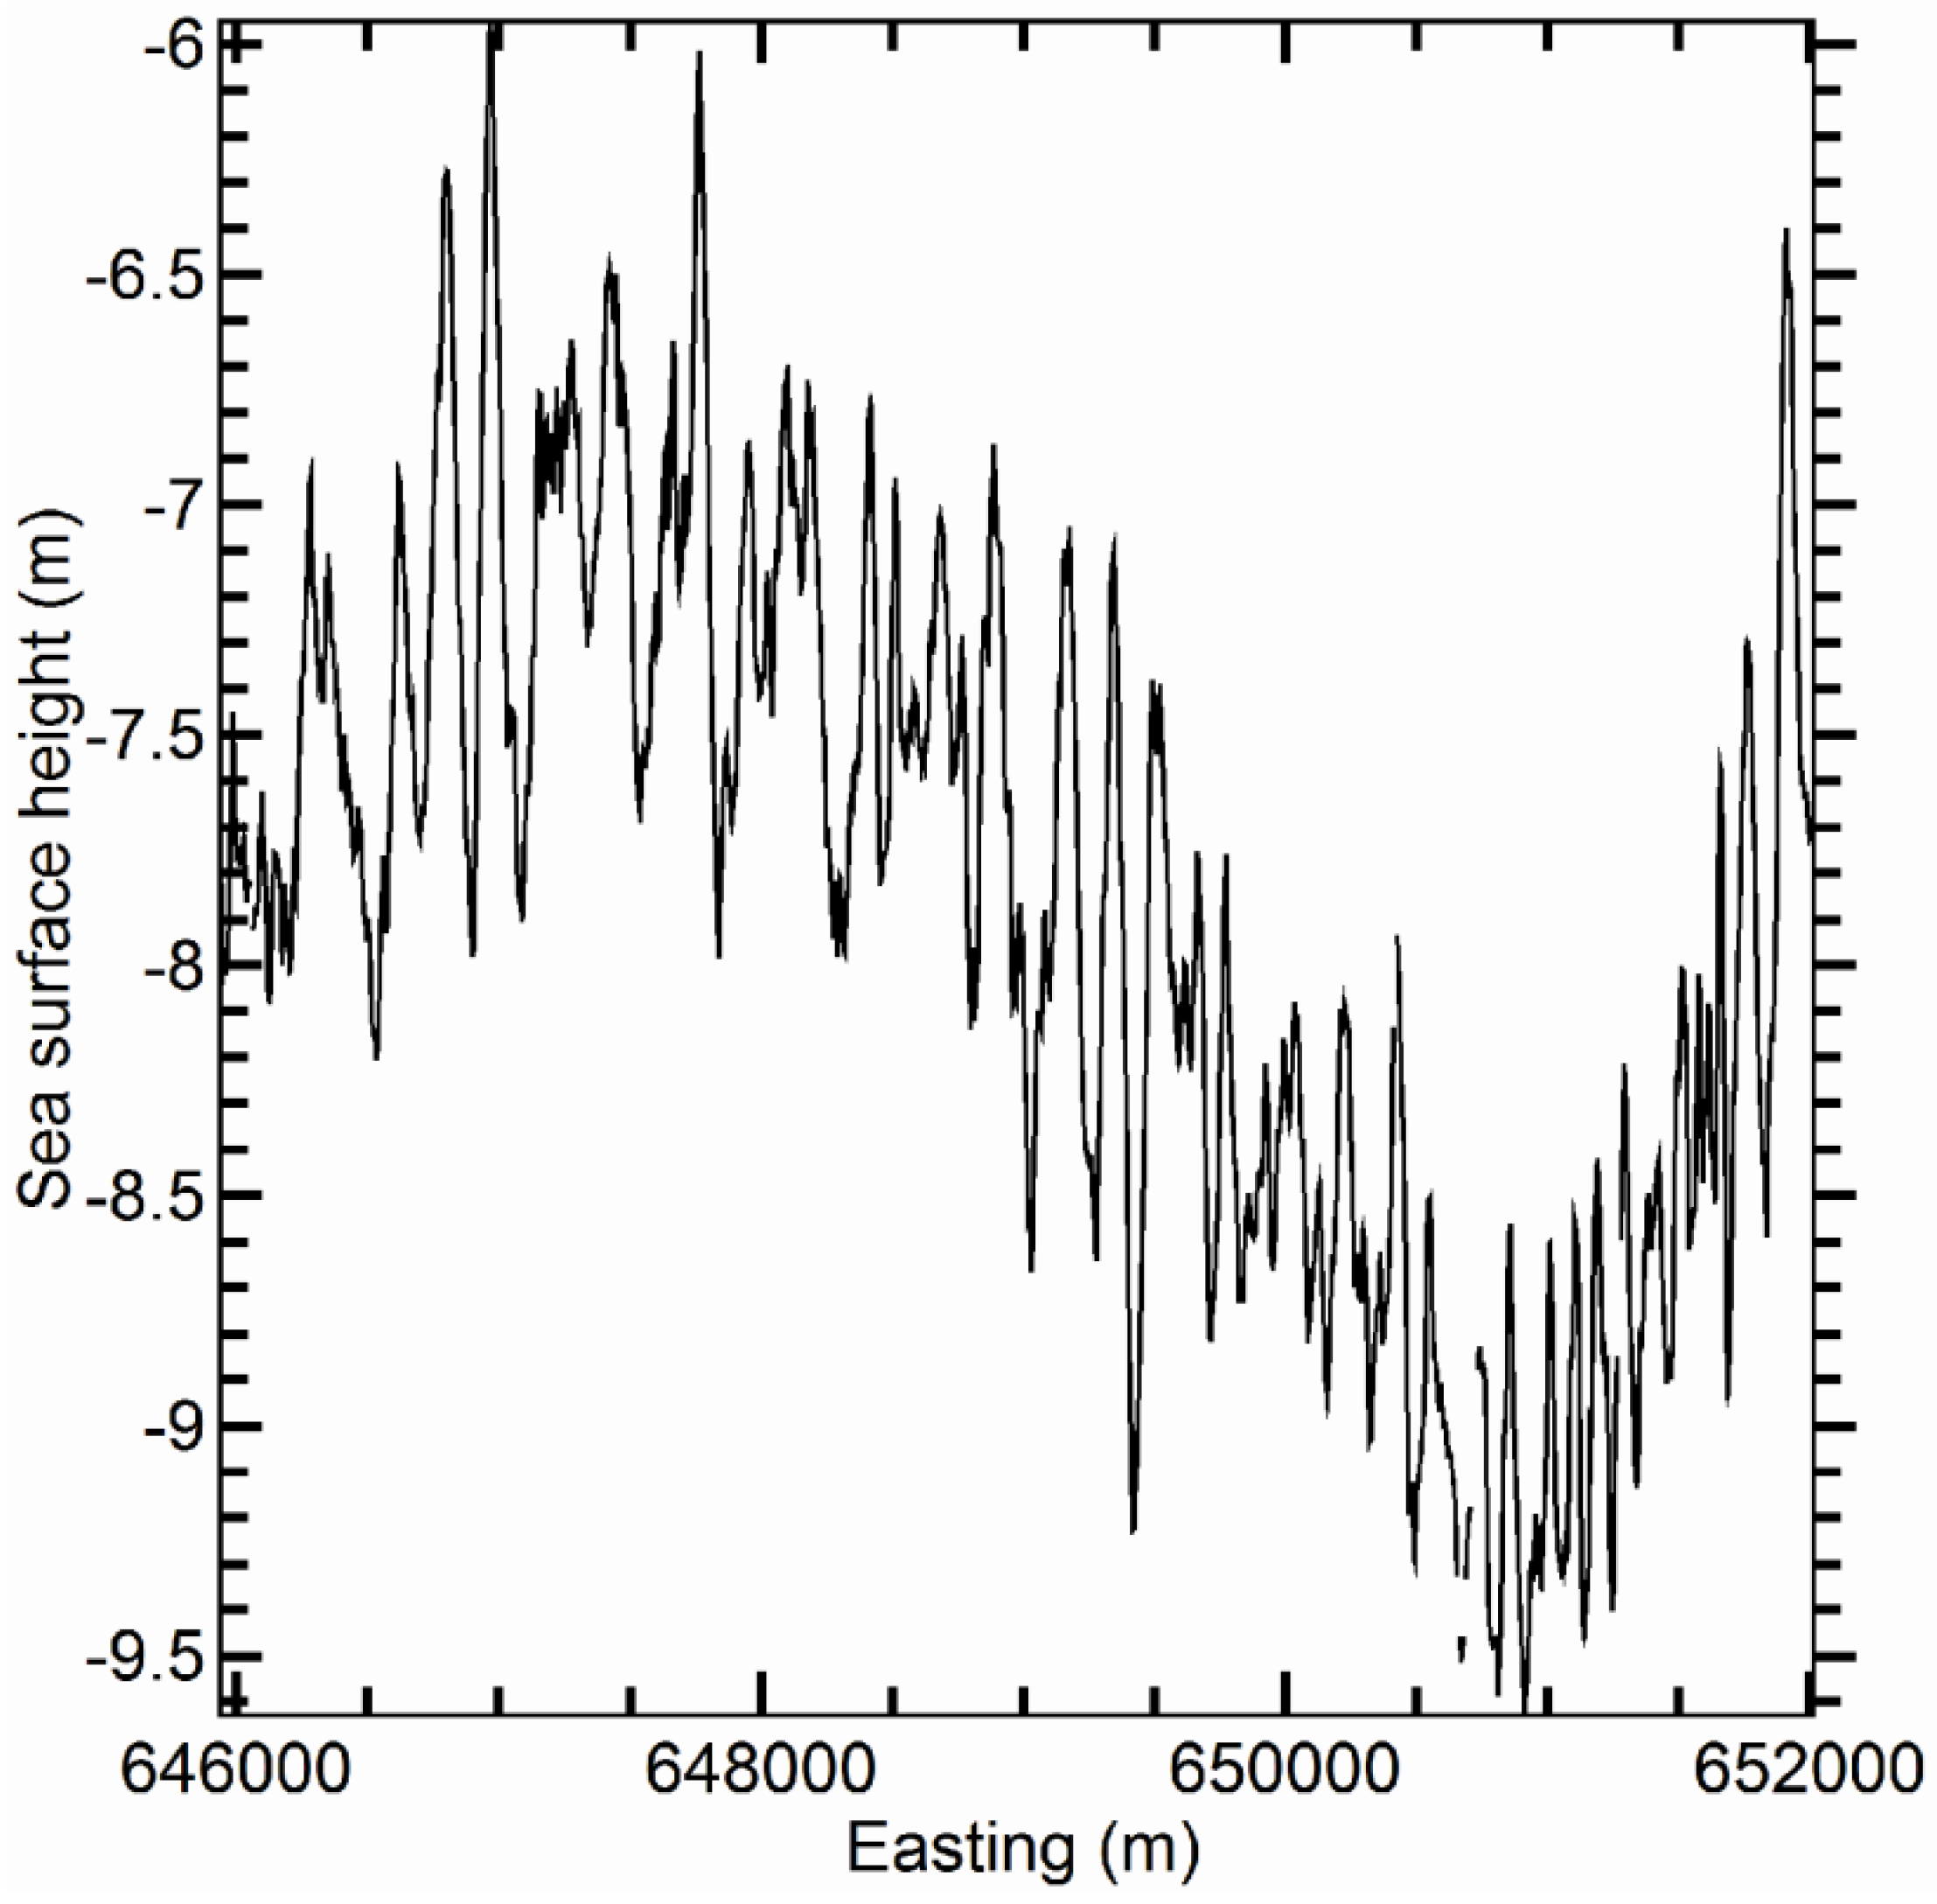
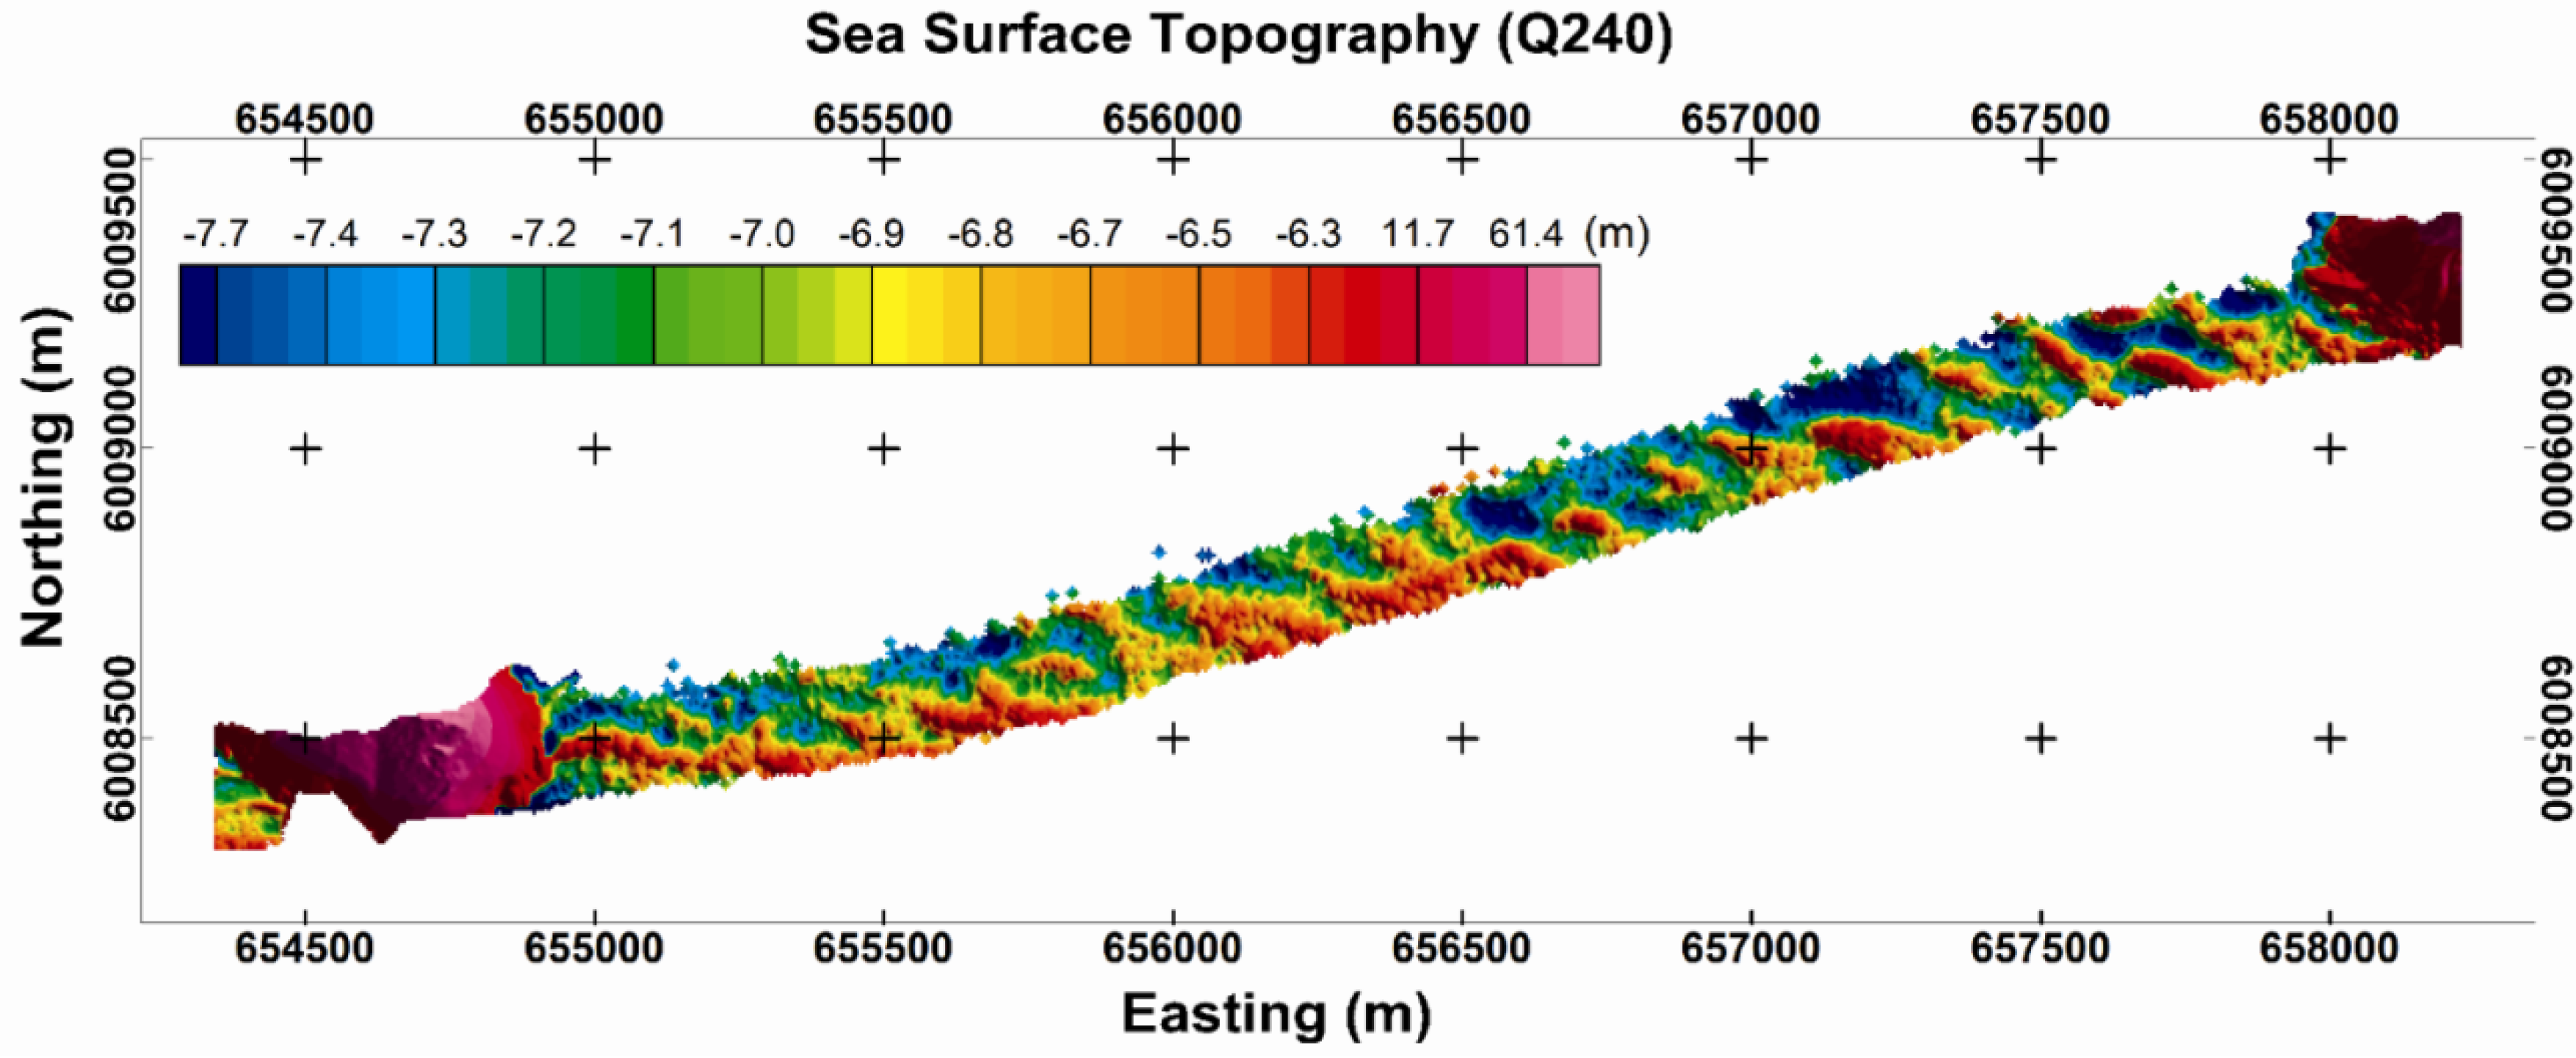
The sea surface topography in coastal waters adjacent to Cape de Couedic, Kangaroo Island (South Australia) and in the surf zone in waters adjacent to the mouth of the Murray River (South Australia) was successfully mapped using two 2D laser scanners (referred to as Q240 and Q560), giving wave profiles that resolve relative height variations of approximately 10 cm. The data for both scanners were recorded simultaneously, mounted on the same aircraft (i.e., the data was measured in a common reference frame), thereby allowing a comparison of the two scanners, which operate at different wavelengths. Both scanners performed equally well in resolving the fine structure of wave profiles. The relative wave heights recorded by the scanners were shown to be consistent with relative wave heights recorded by a waverider buoy in the vicinity of Cape de Couedic.
One potential application of LiDAR over the sea surface is to act as an auxiliary sensor to support the use of airborne electromagnetic methods for bathymetric mapping. The sea surface topography in areas of significant swell could be used for 2D/3D modeling of the electromagnetic response rather than assuming a planar conductive sea surface. Additionally, the processed LiDAR data (prior to subtracting the GPS altitude to determine the sea surface topography) provide altimetry maps which can be subsequently averaged over suitable areas compatible with the electromagnetic footprint to determine an effective altimetry which would be expected to be more reliable that single spot nadir-looking altimeter data.
Based on topographic grids obtained over a range of altitudes, we observed that the Q240 scanner is most suitable for scanning seawater topography from an altitude of about 160–200 m. The limit of obtaining useful reflections from the sea surface is determined by the incidence angle of the laser scanner at the water surface and not by the scan angle (aperture range). Thus scanning at a higher altitude with a narrower aperture can provide a larger useable swath than scanning at a lower altitude with a larger aperture (larger incidence angle). Approximately the same swath can be achieved with the Q560 for water surfaces, but the return reflections require significantly more filtering to remove echoes from foam and spray; there is also occasional loss of returns from the sea surface when the laser penetrates the water column.
