Estimating Crown Variables of Individual Trees Using Airborne and Terrestrial Laser Scanners


Abstract
:1. Introduction
2. Materials
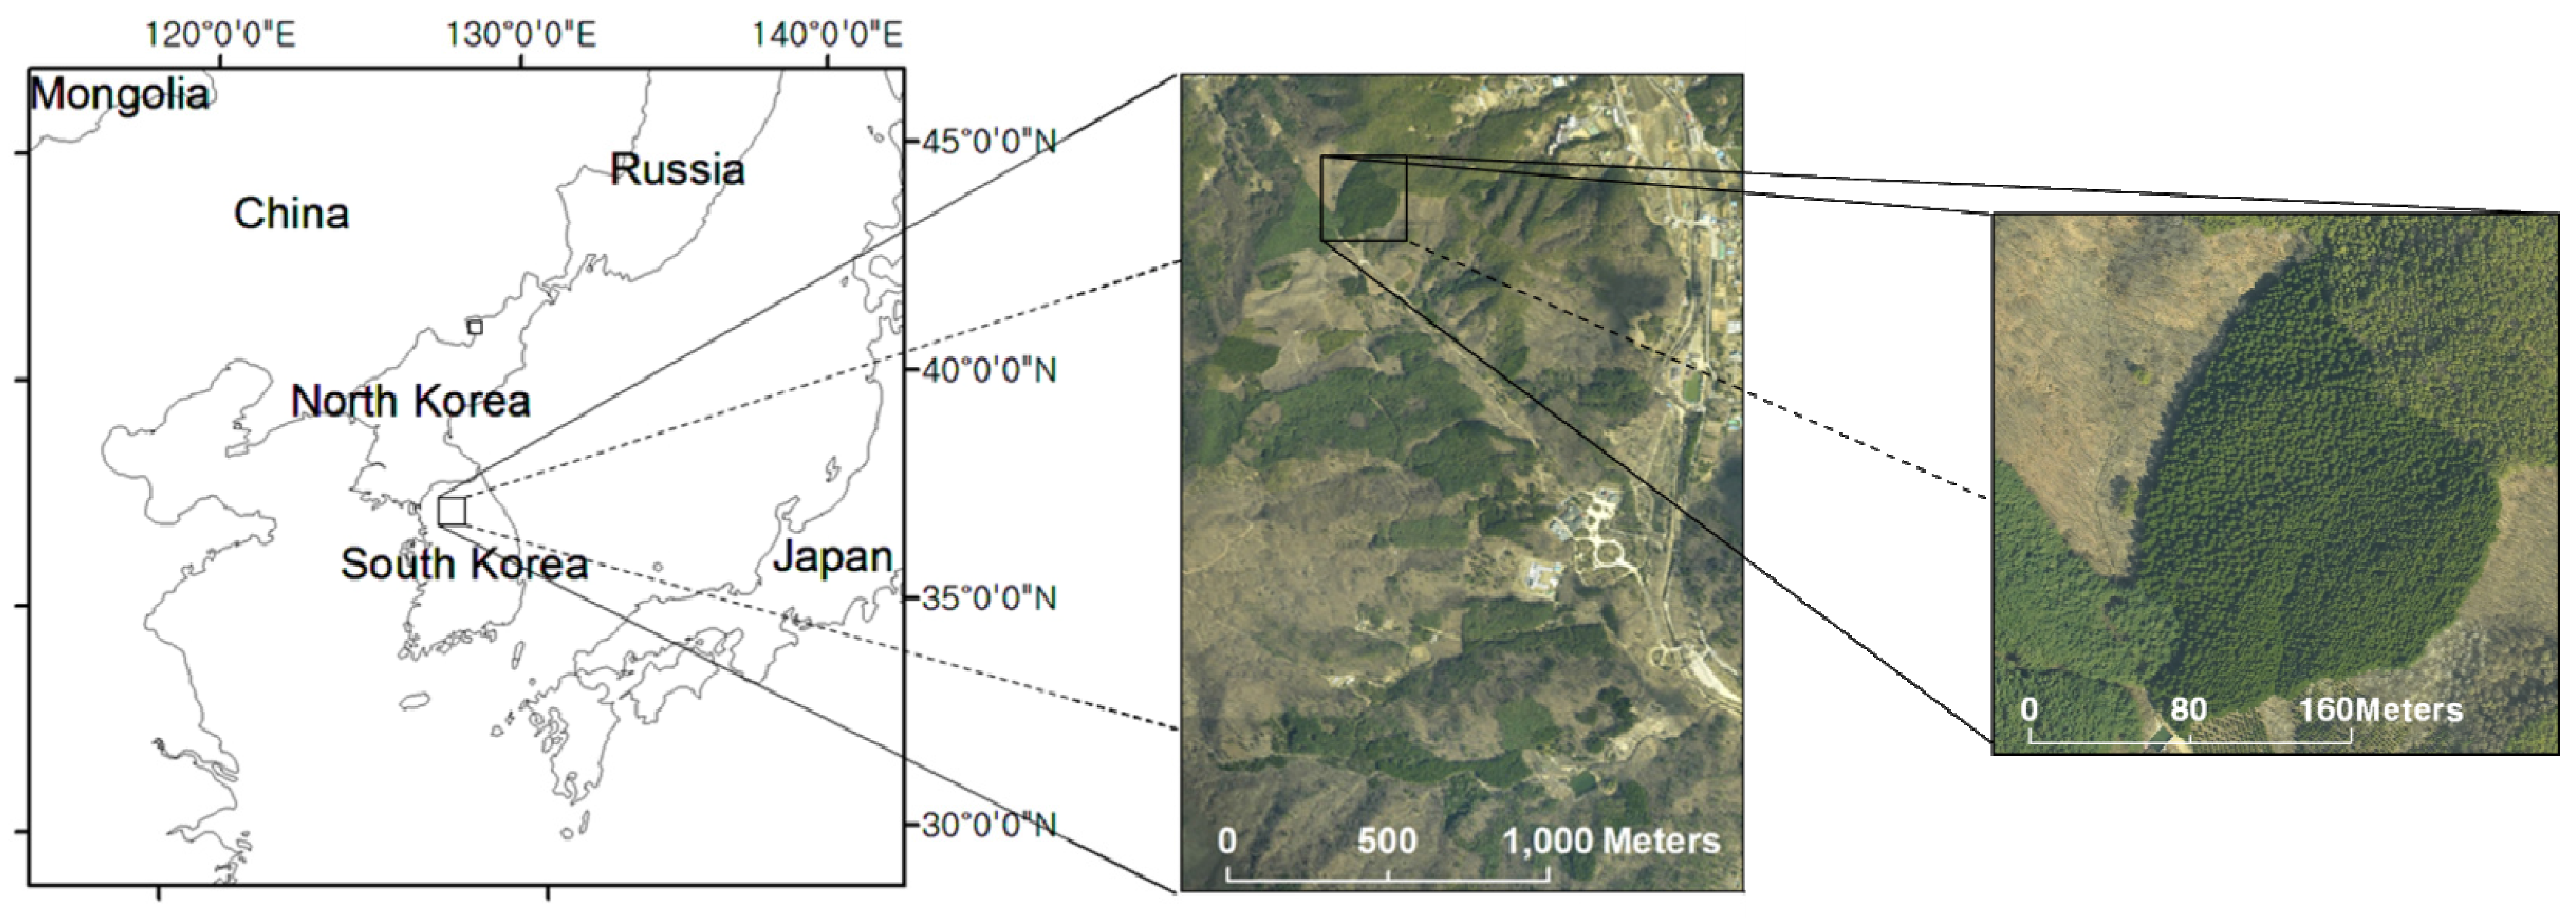
2.1. Study Area

2.2. Acquisition of Airborne Laser Scanner Data
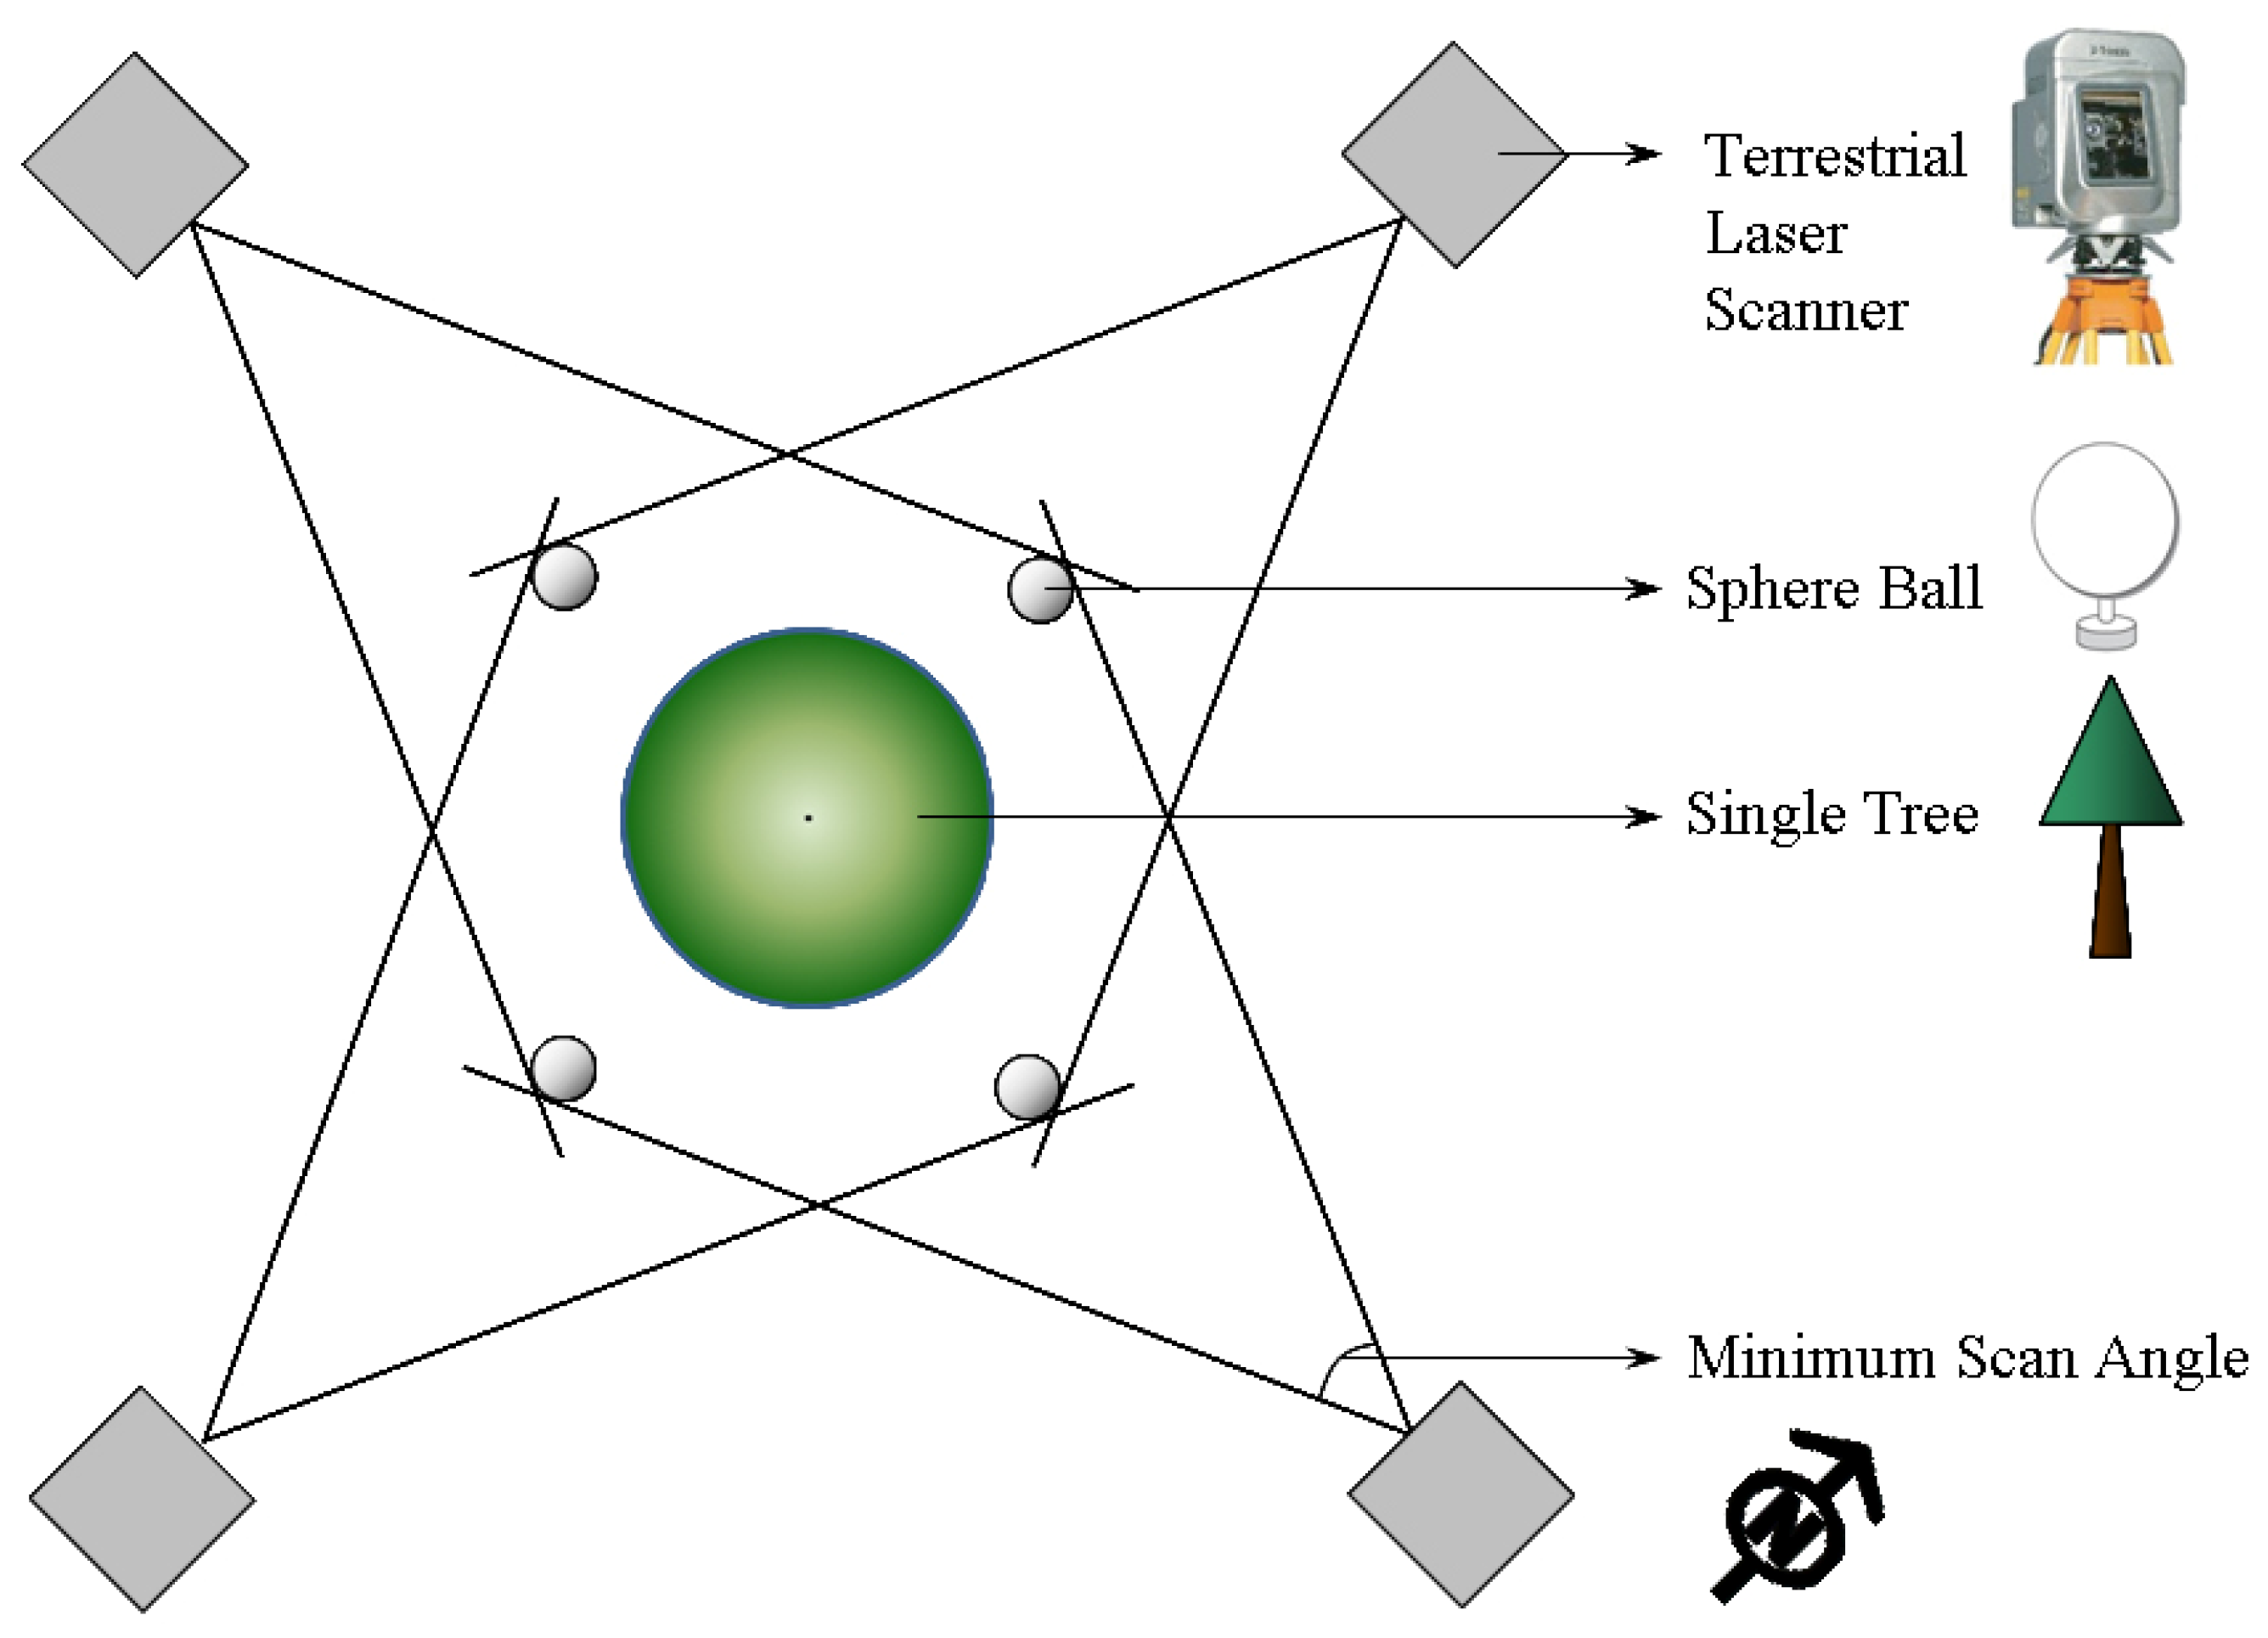
2.3. Acquisition of Terrestrial Laser Scanner Data

| Measured Parameters | N/ha | Max. | Min. | Mean | SD |
|---|---|---|---|---|---|
| Tree height (m) | 427 | 26.8 | 18.0 | 22.3 | 2.3 |
| DBH (cm) | 49.7 | 21.7 | 32.1 | 6.3 | |
| Crown base height (m) | 20.2 | 12.7 | 16.2 | 1.9 | |
| Crown width (m) | 6.7 | 4.4 | 5.5 | 0.7 |
3. Method
3.1. Extraction of Tree Parameters Using Airborne Laser Scanner Data
3.1.1. Derivation of Crown Height Model
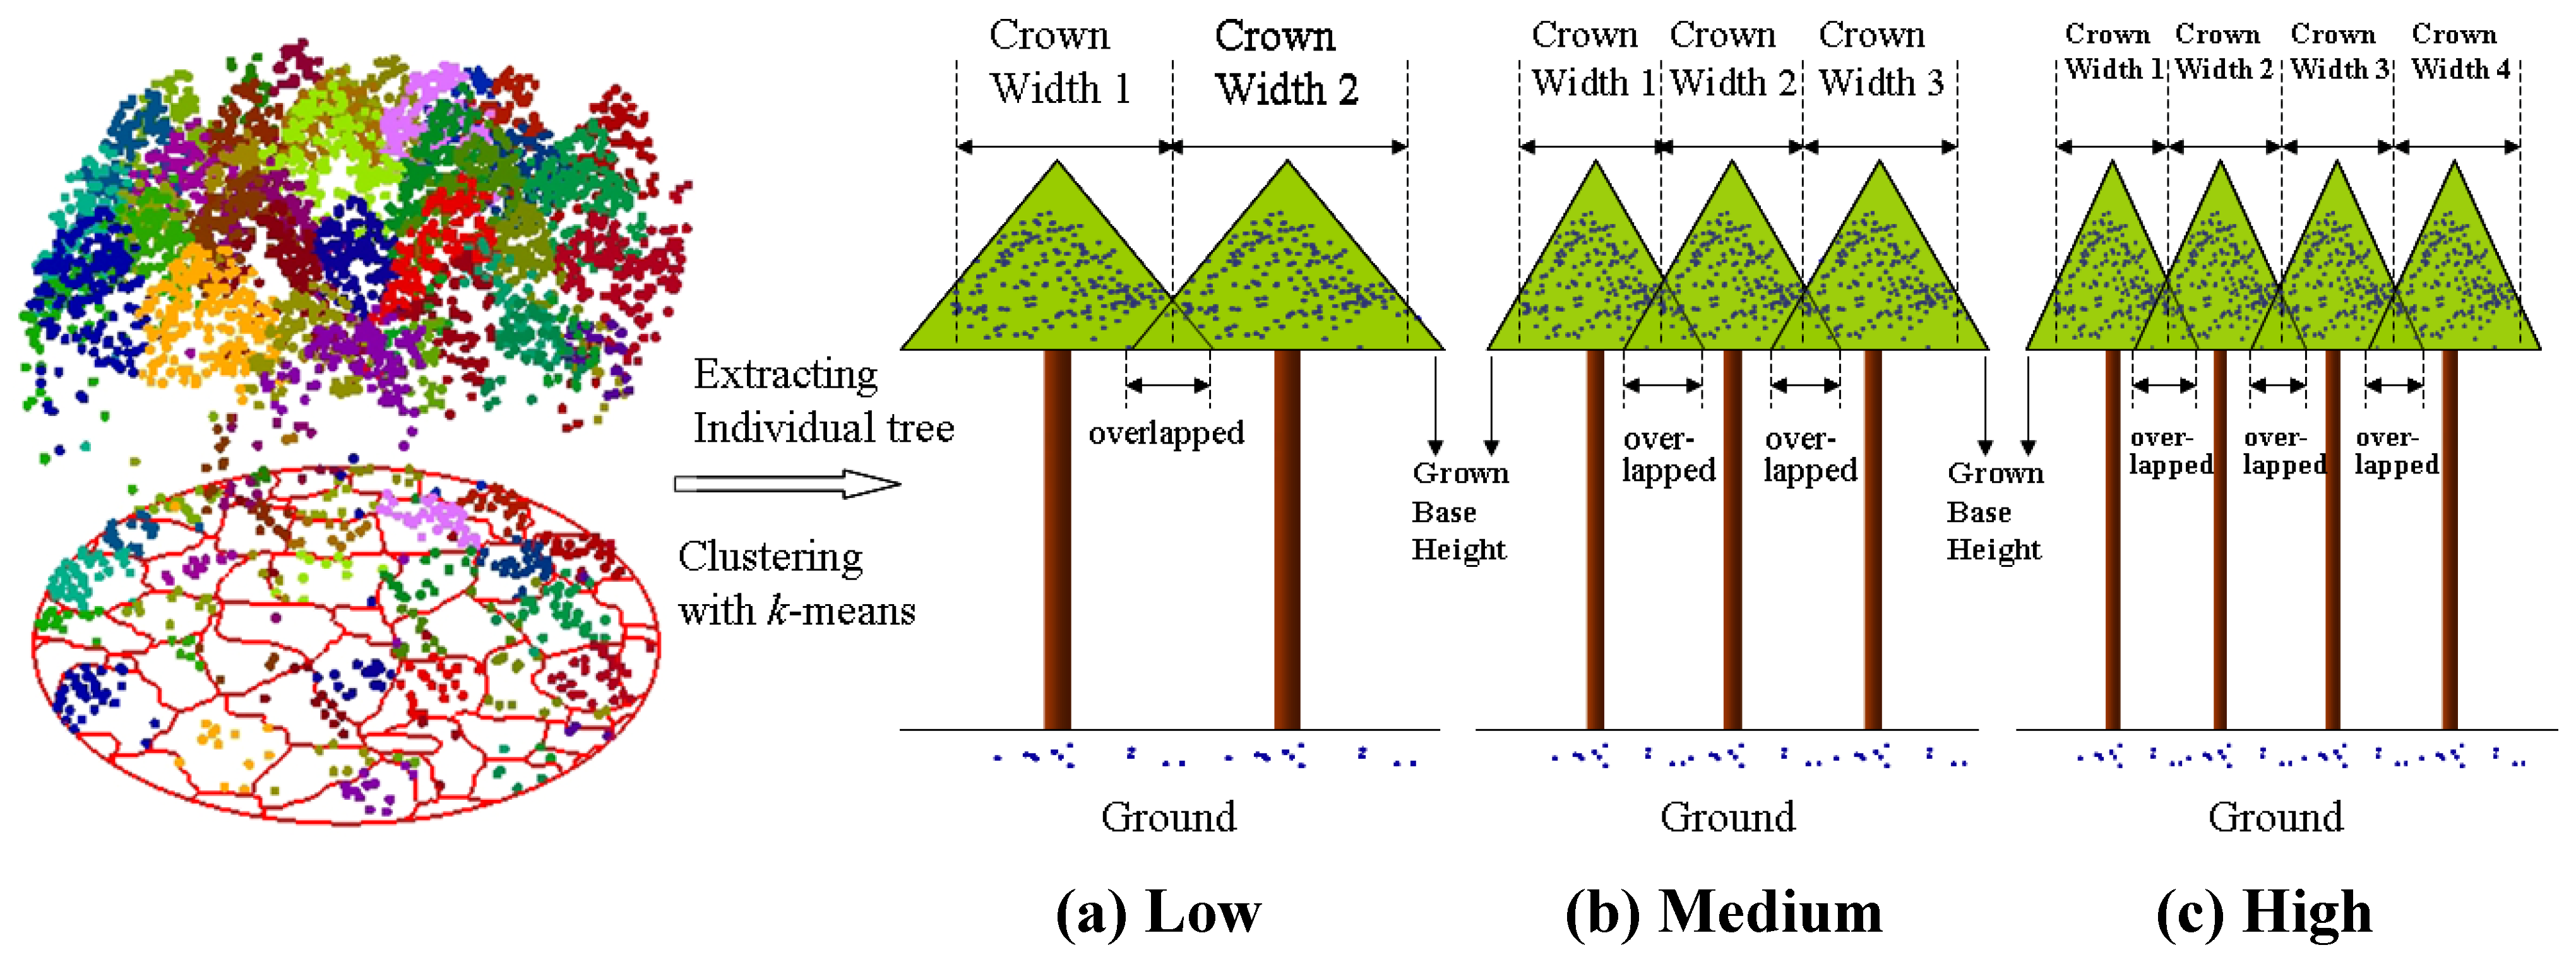
3.1.2. Crown Delineation
3.1.3. Estimation of Individual Tree Height and Crown Base Height
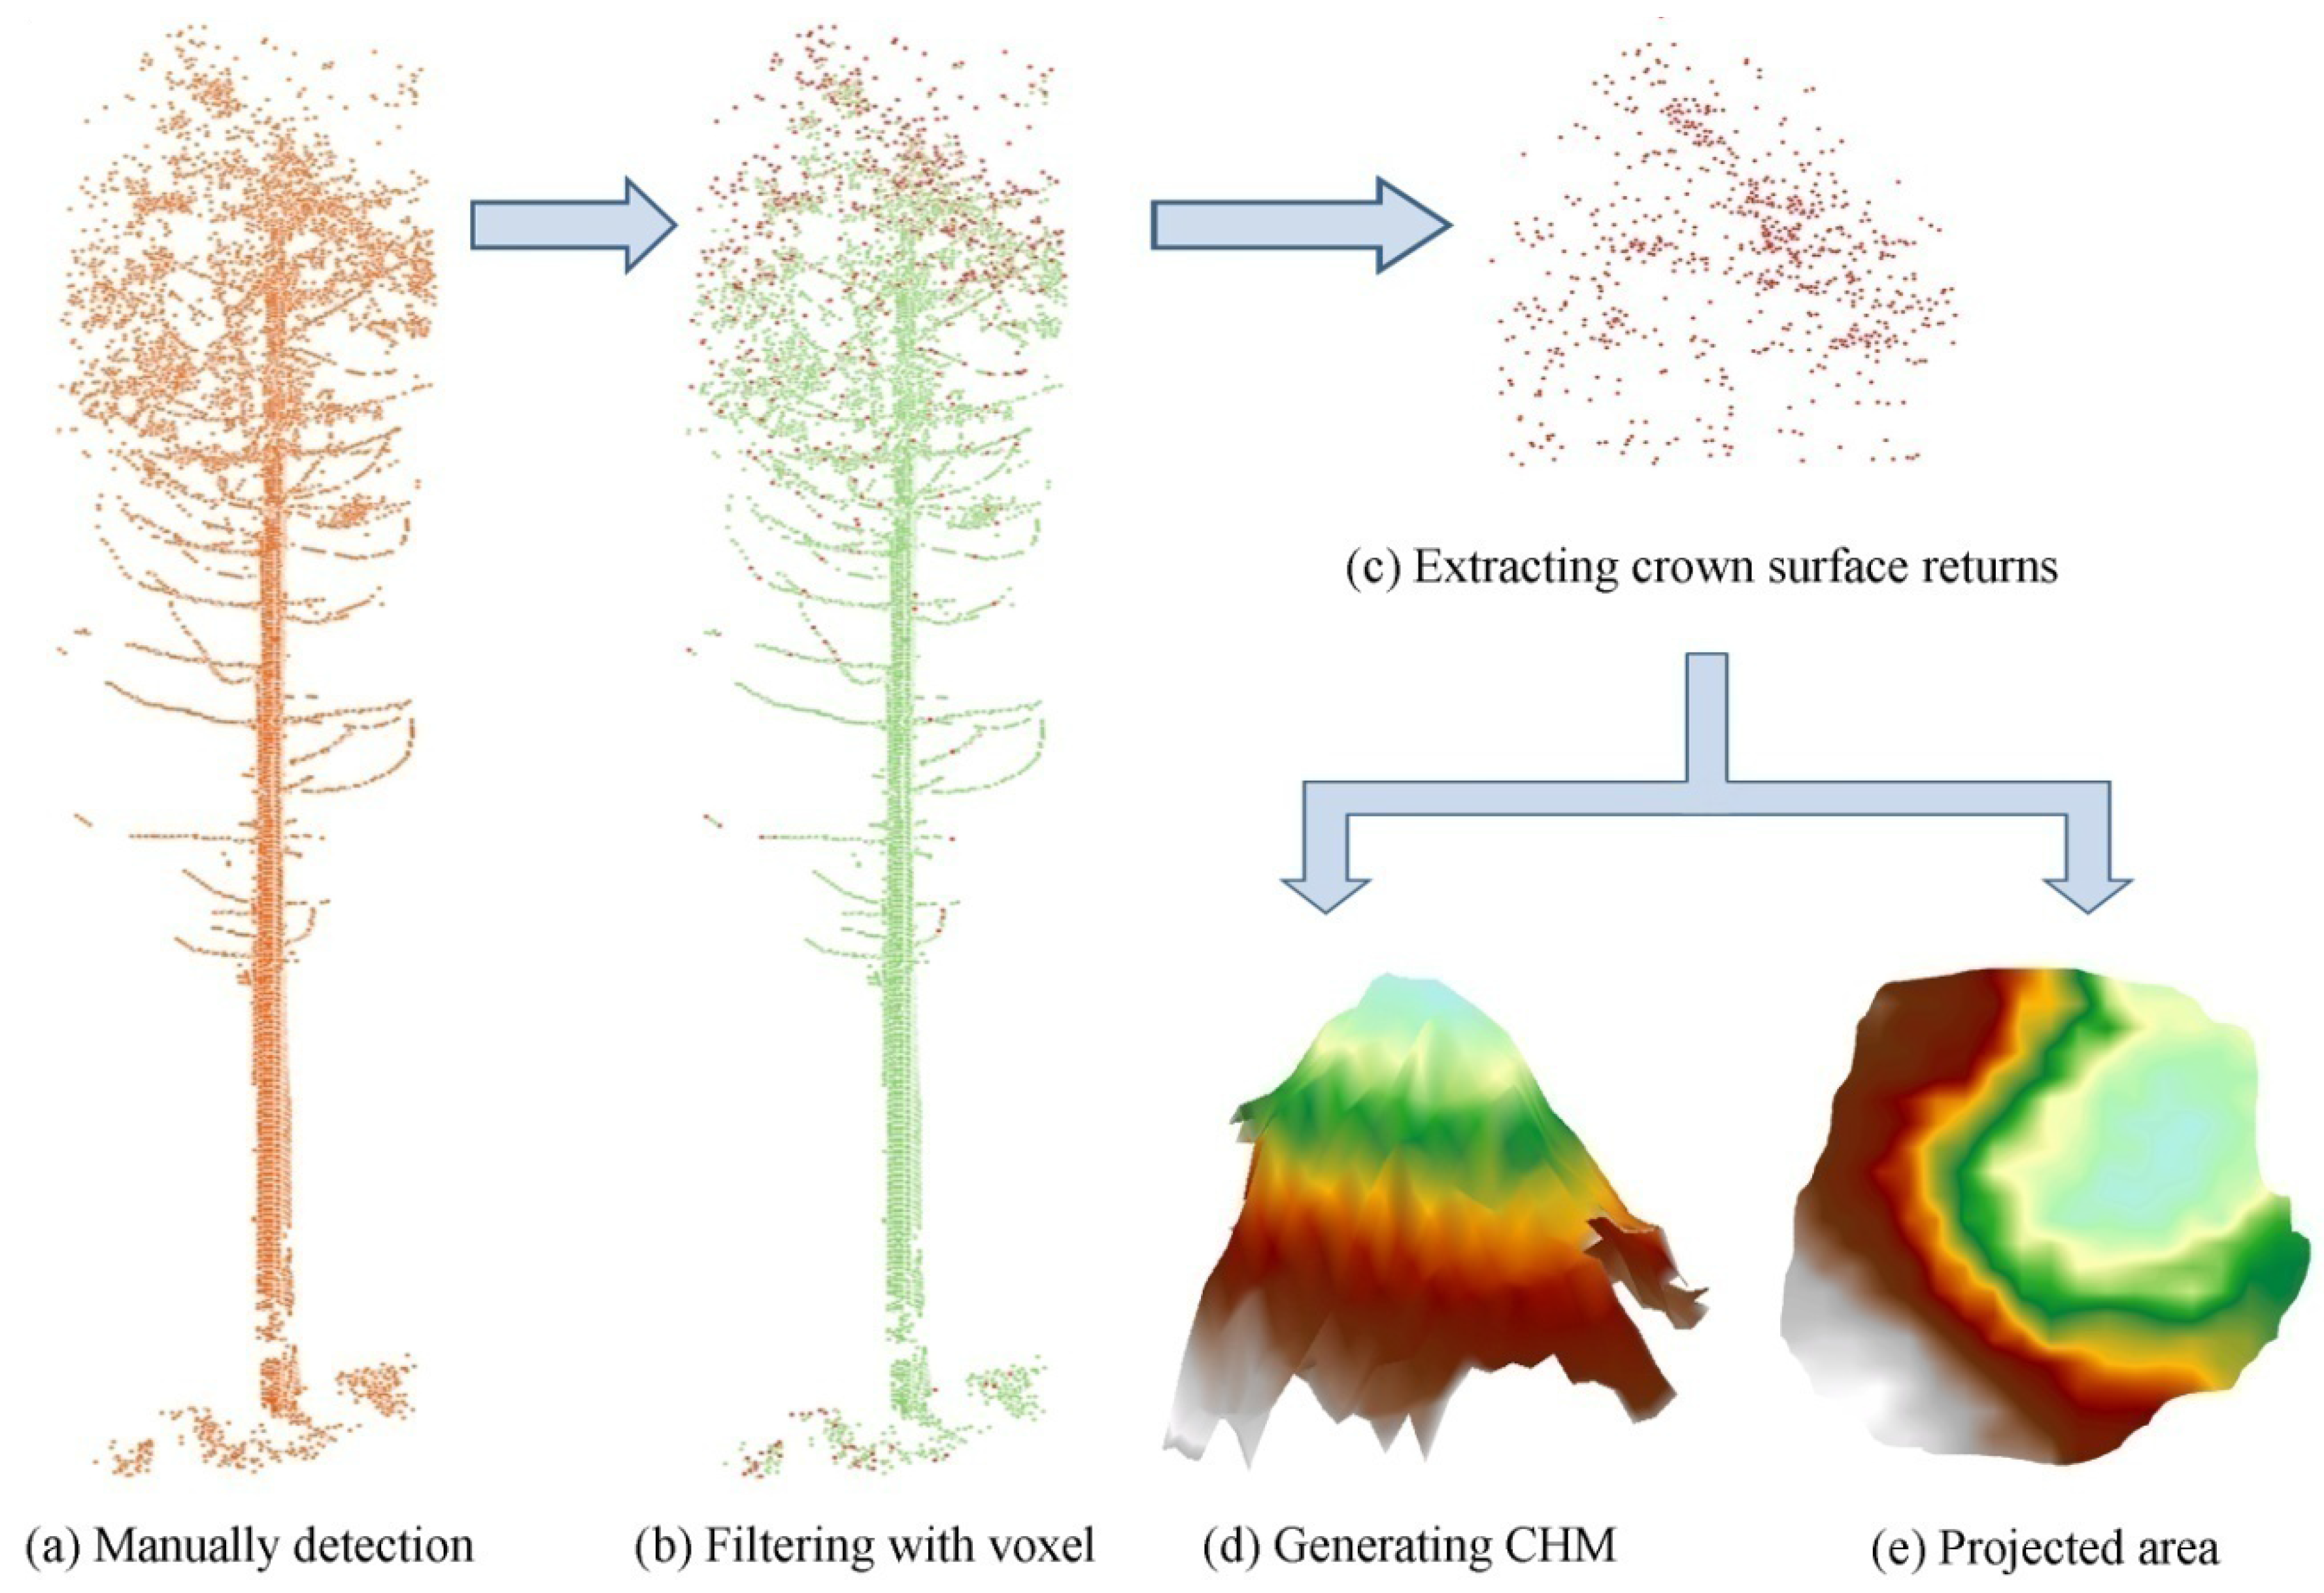
3.1.4. Estimation of Crown Area and Crown Geometric Volume
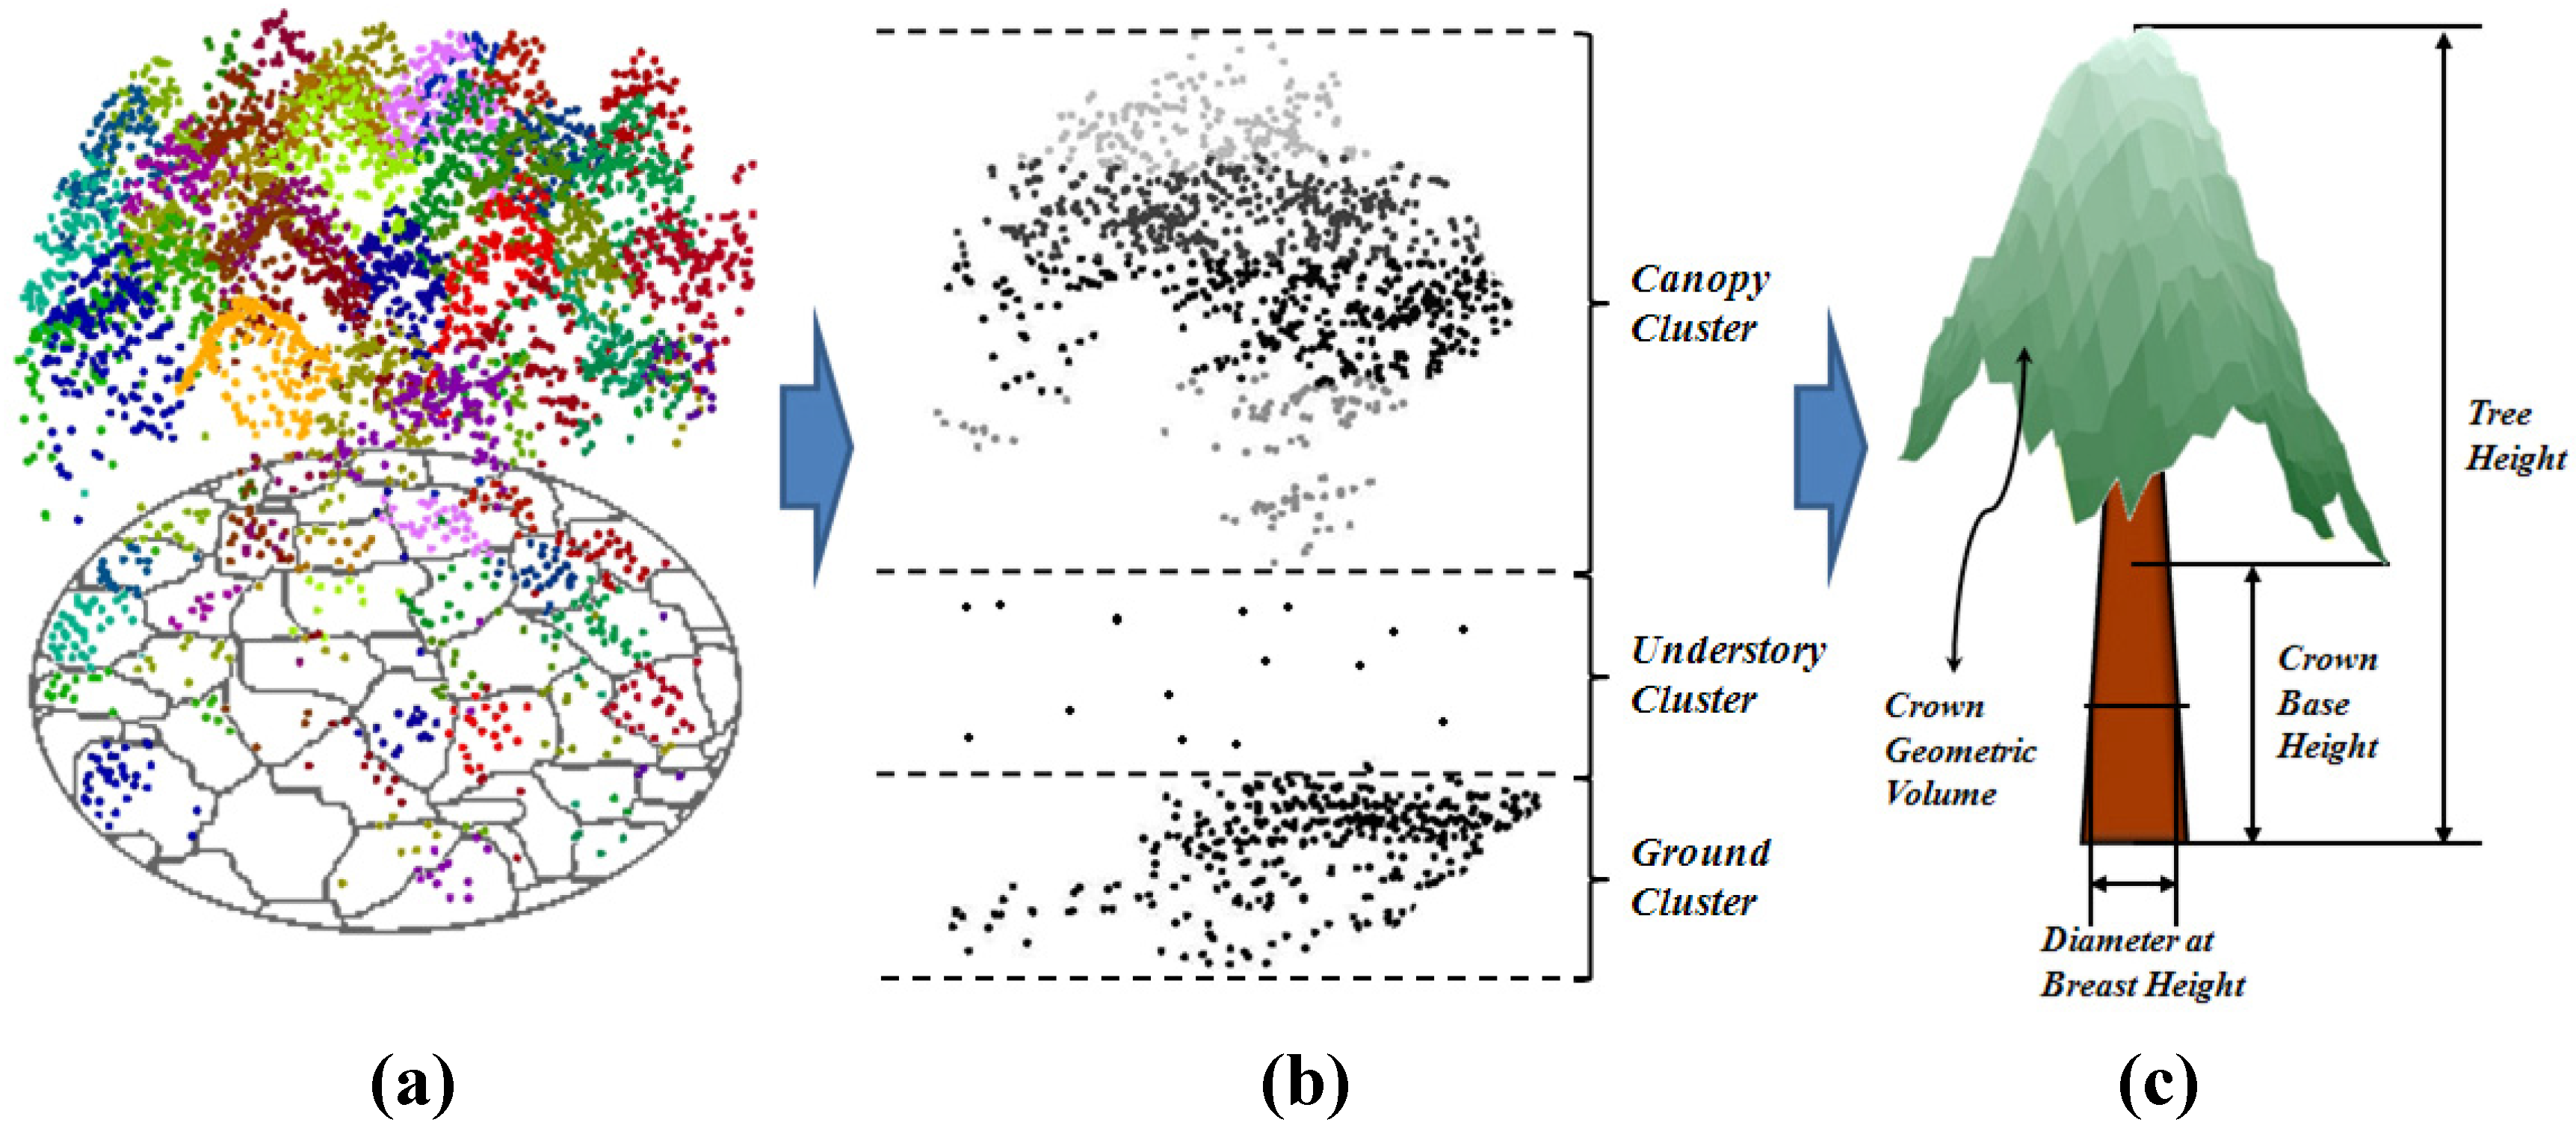
3.2. Extraction of Tree Parameters Using Terrestrial Laser Scanner Data
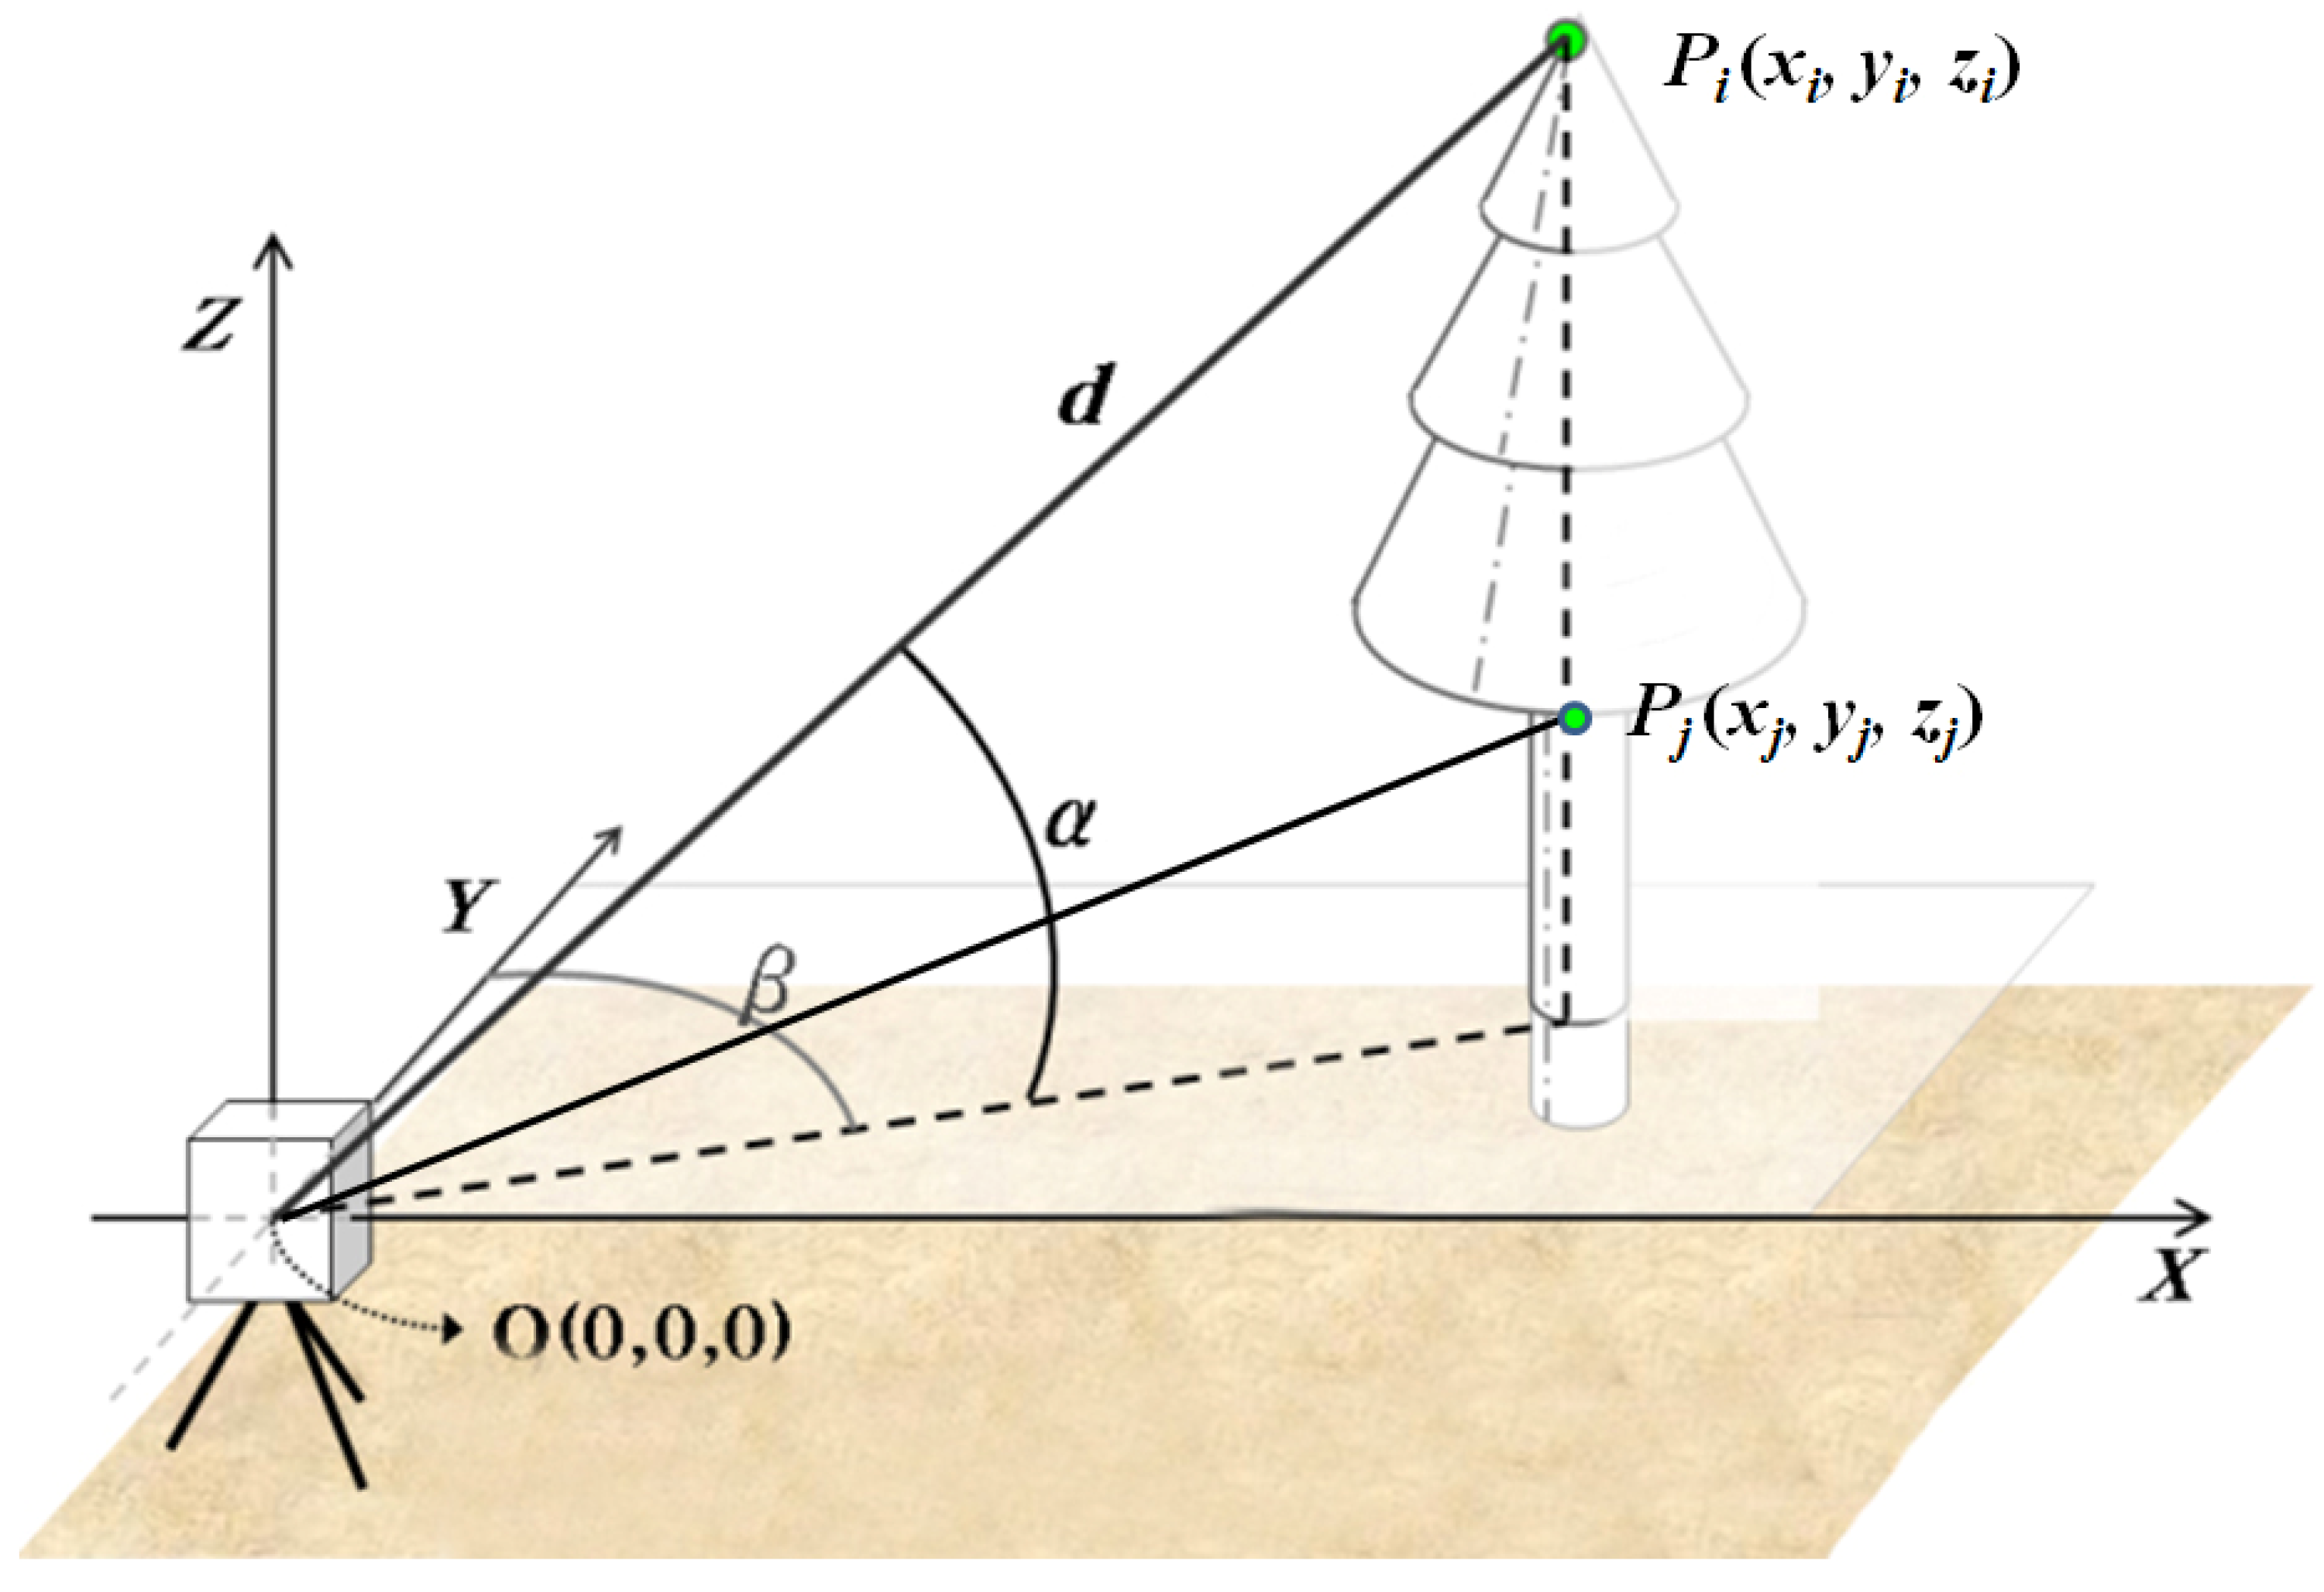
3.2.1. Measurement of Tree Height and Crown Base Height

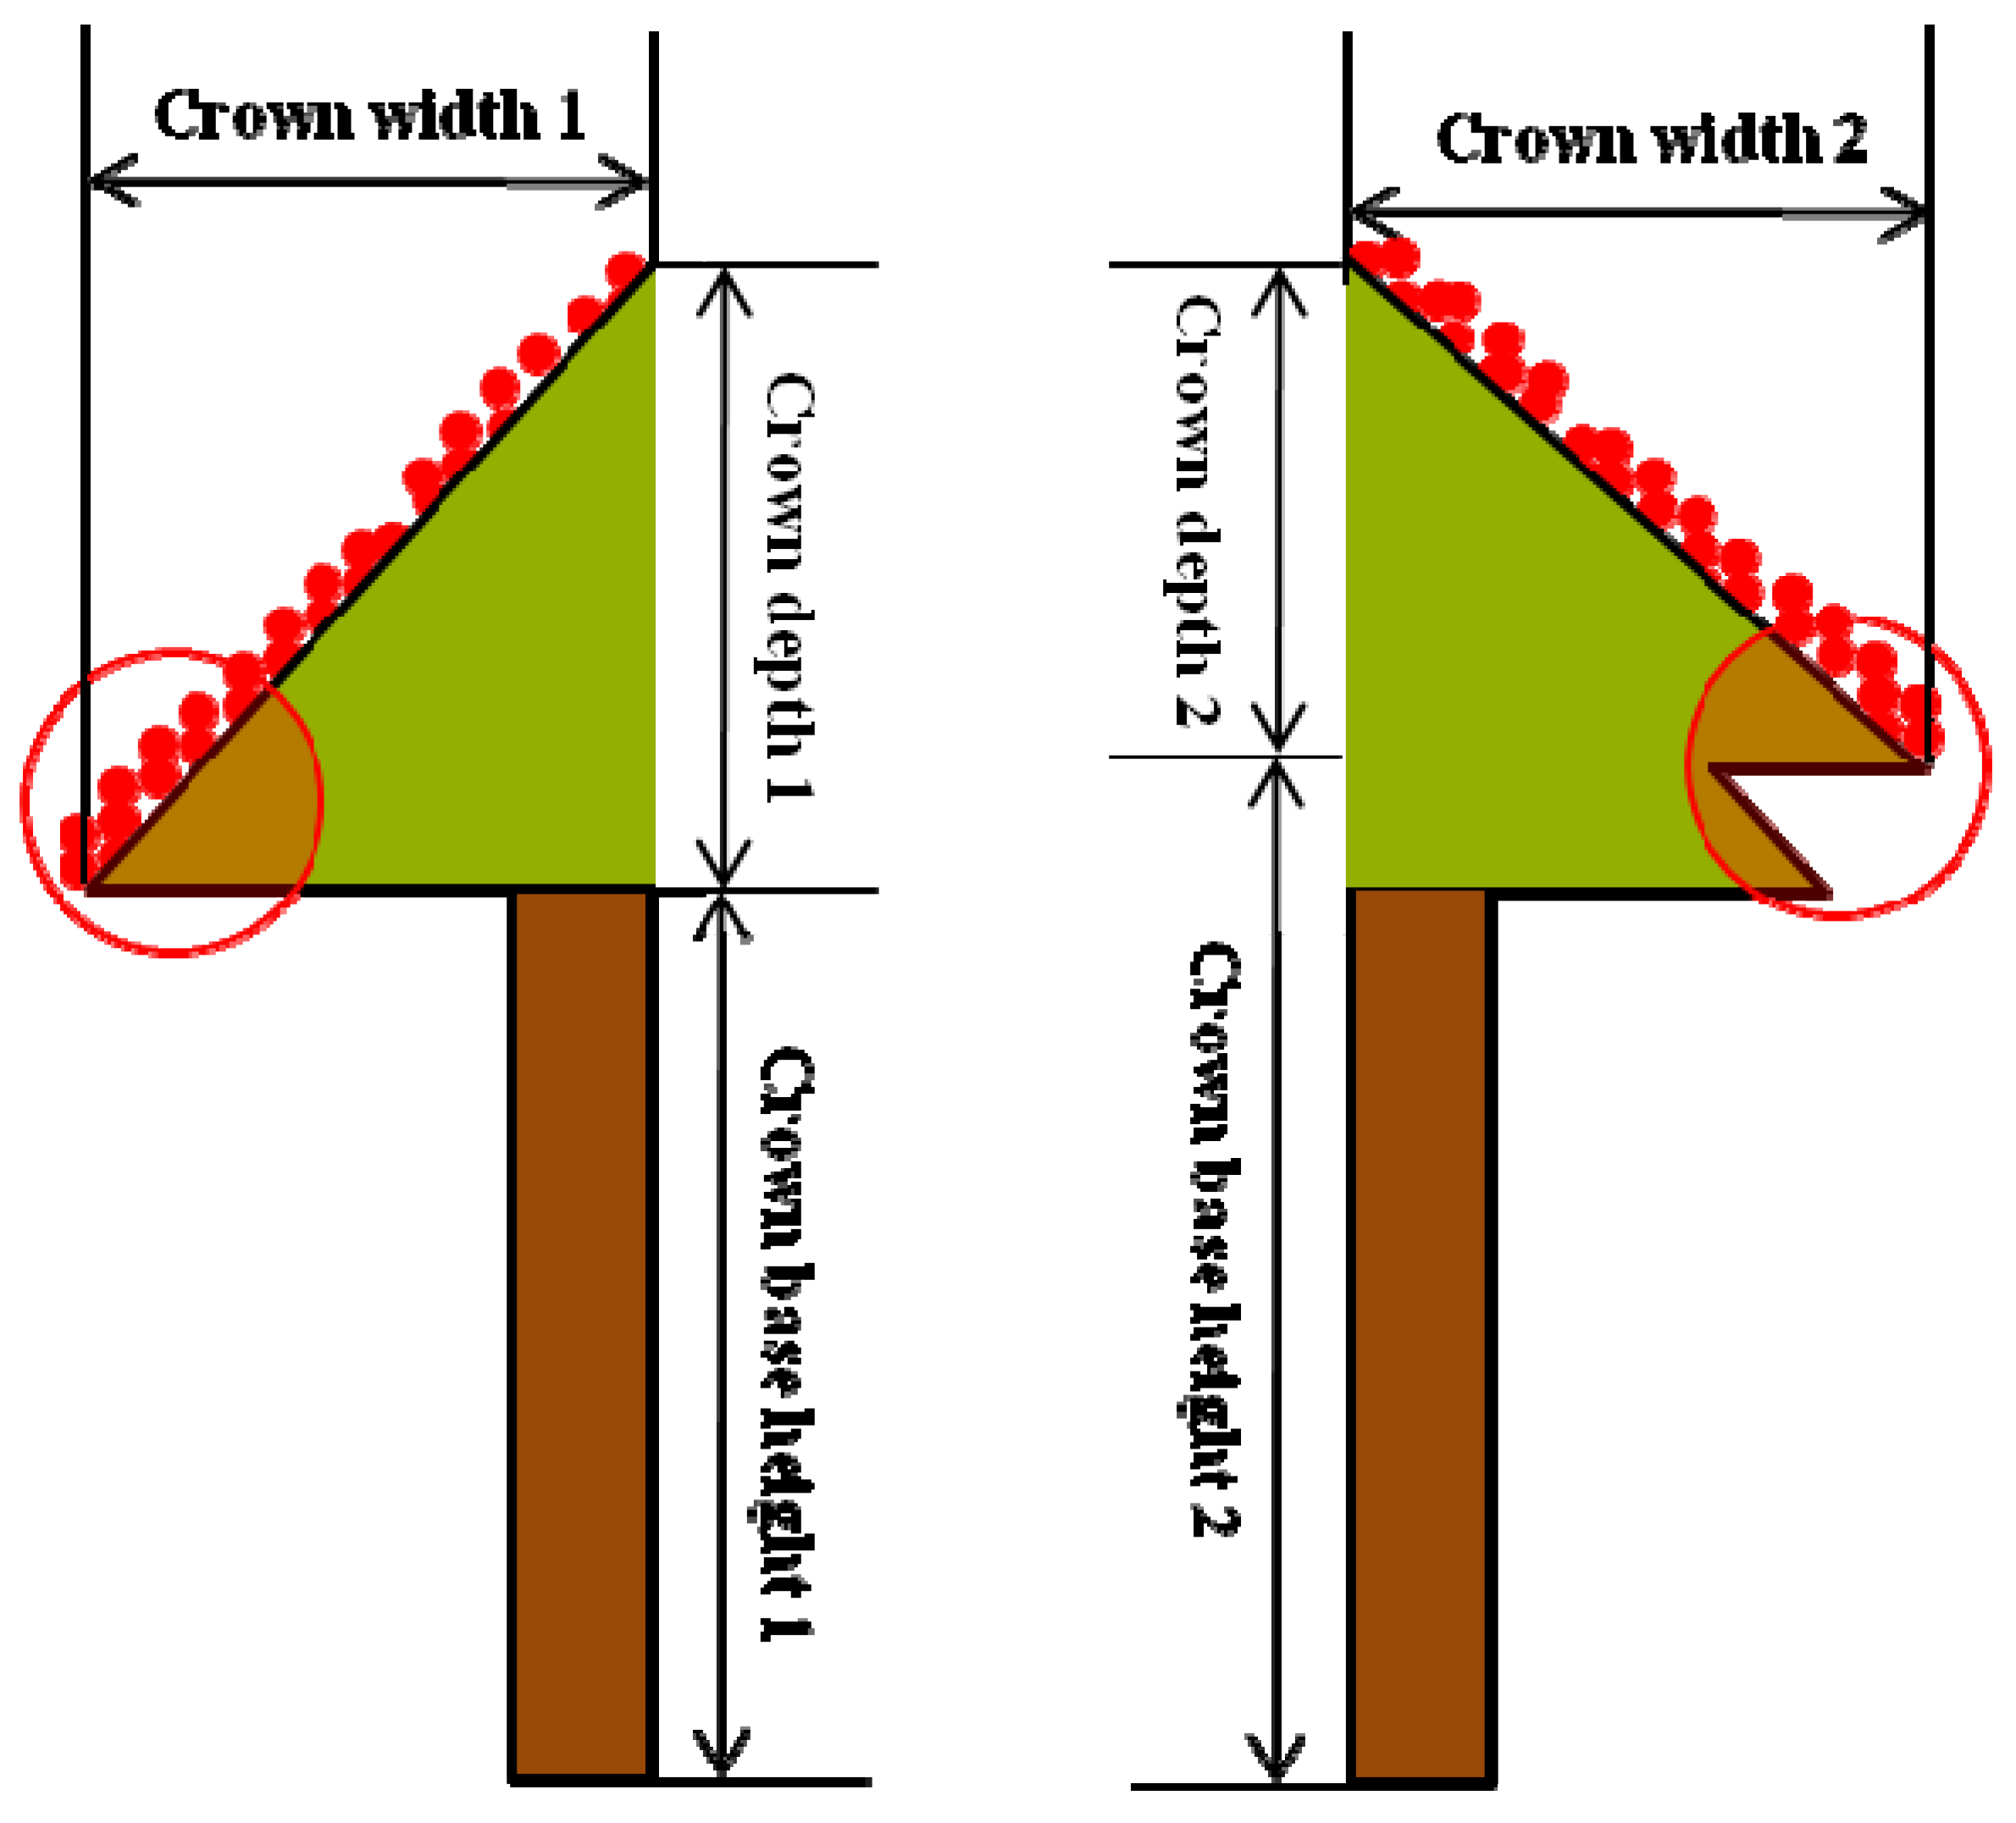
3.2.2. Measurement of Crown Area and Crown Geometric Volume
3.3. Regression Analysis and Accuracy Assessment
4. Results and Discussions
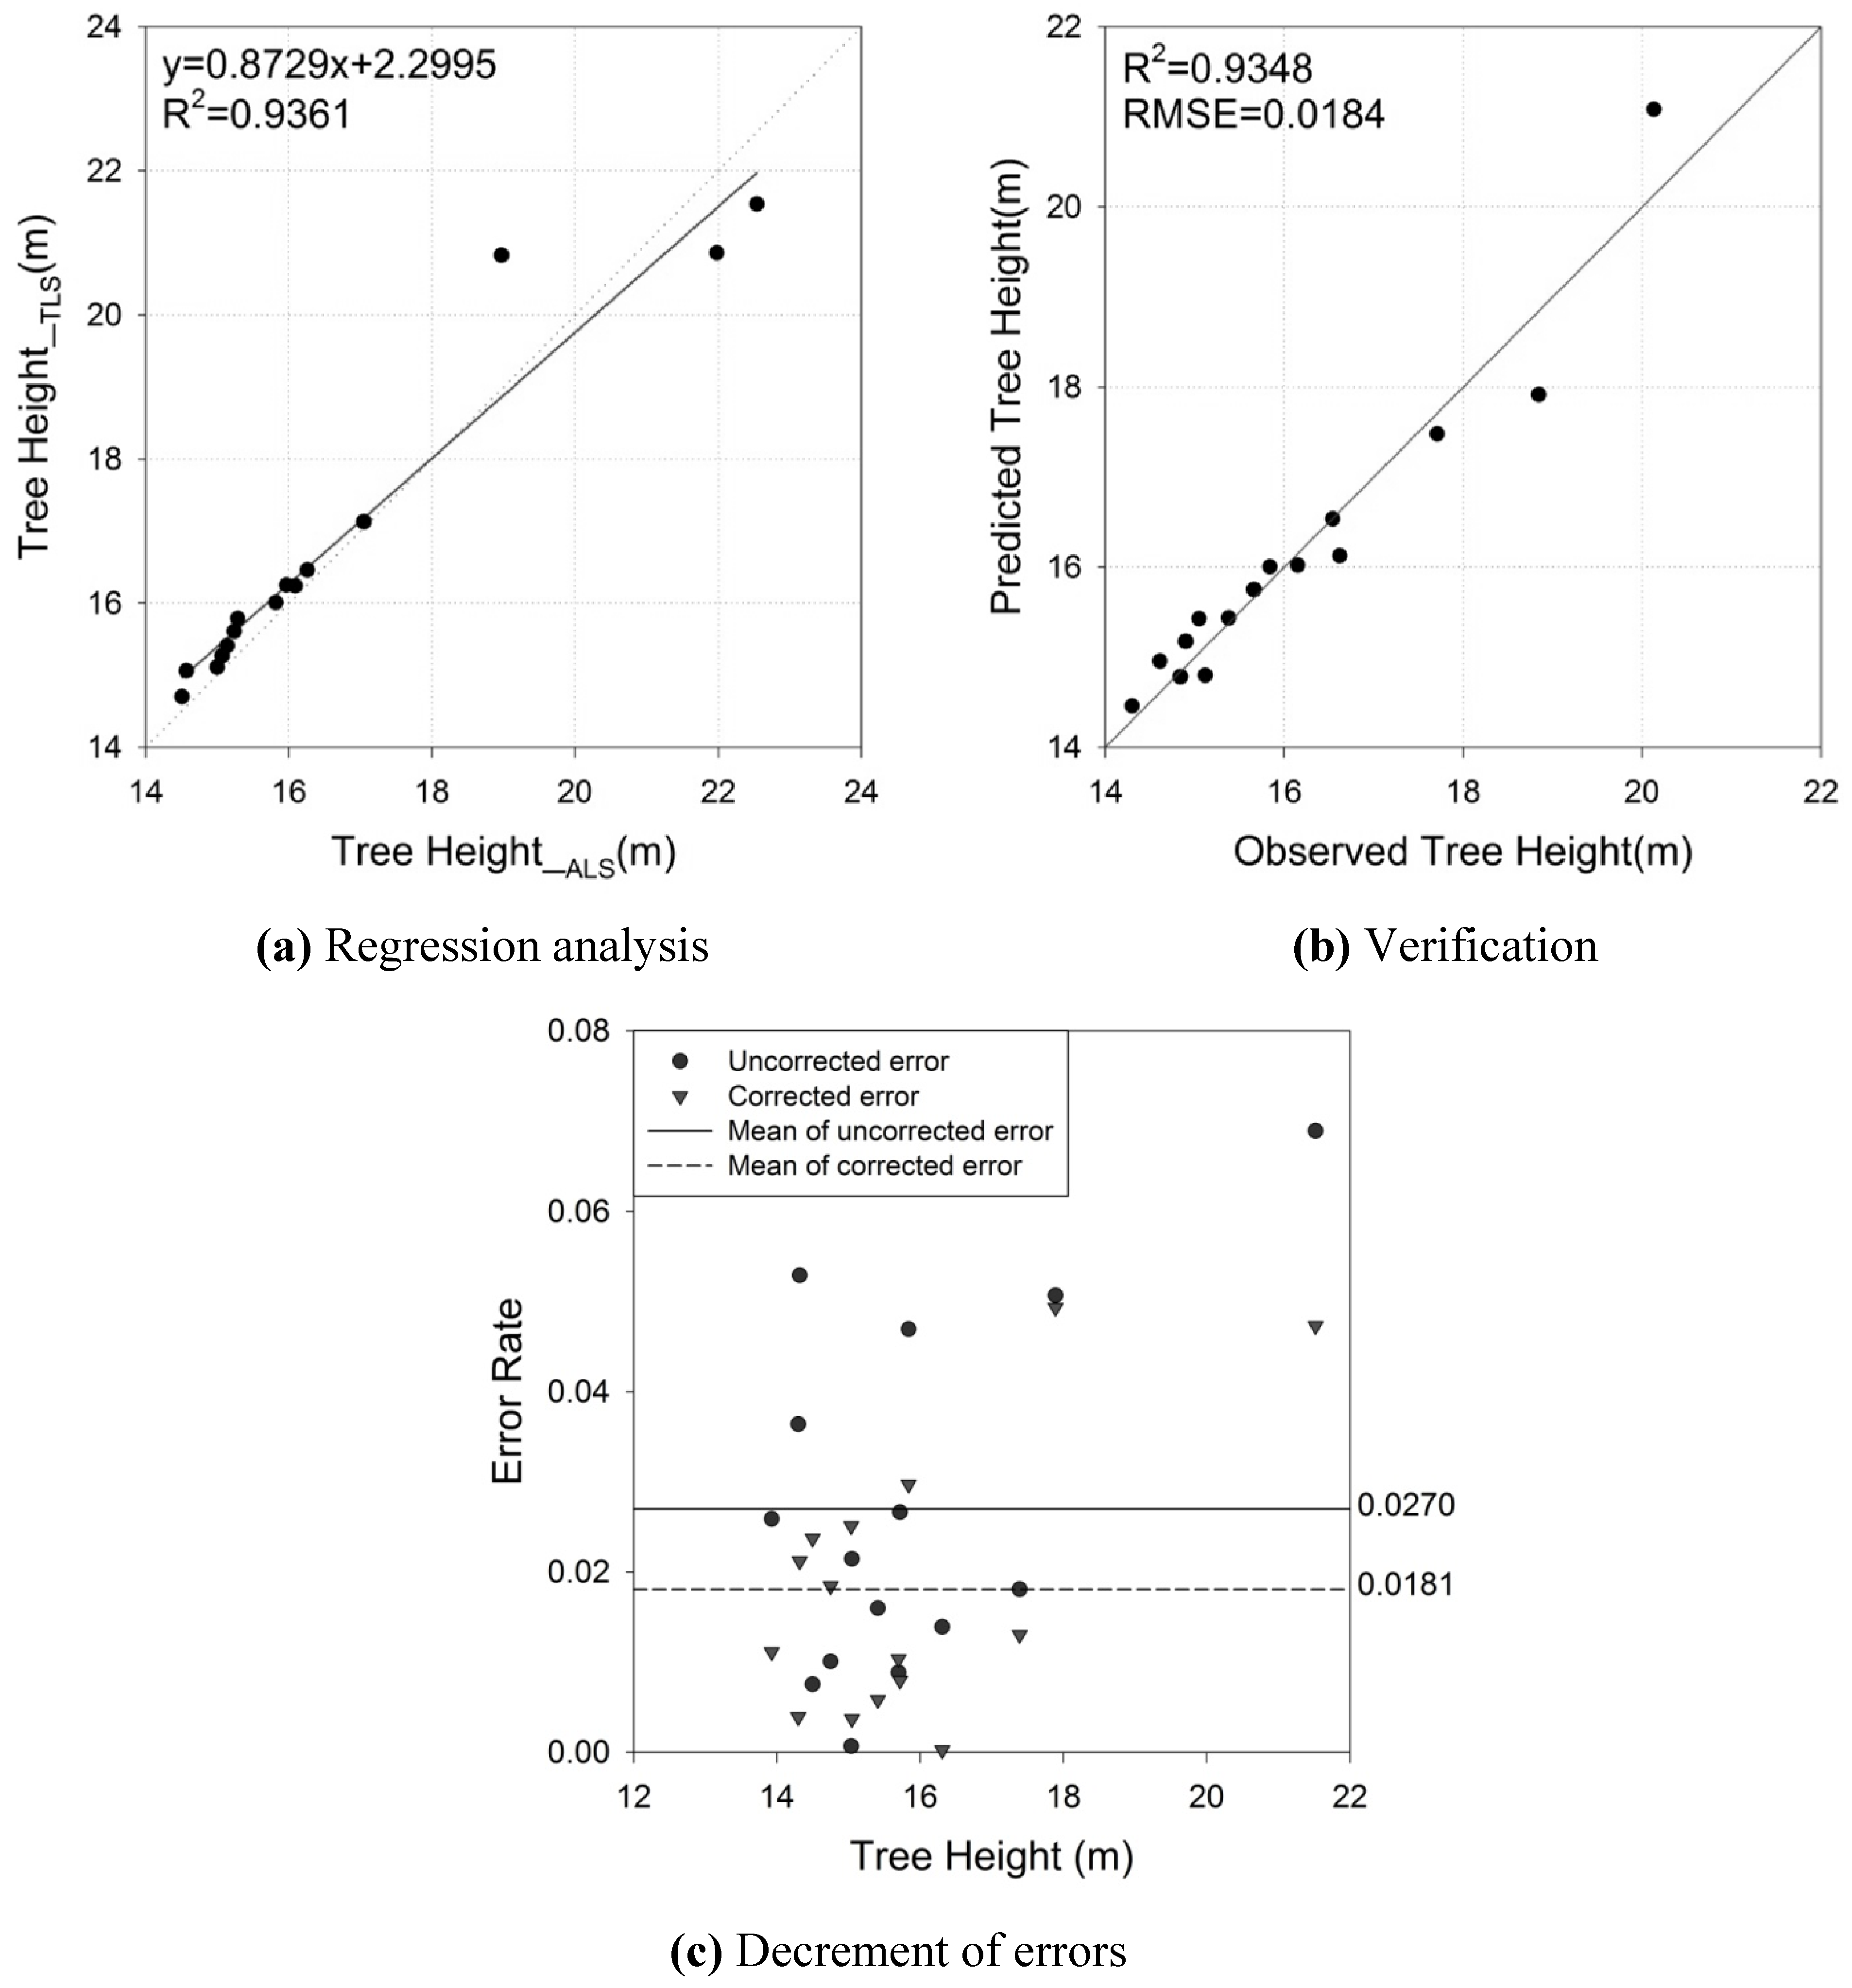
4.1. Tree Height
| Parameters | Coefficient | Estimate | Standard Error | T statistics | P value | R2 | RMSE |
| TH | αTH | 0.8729 | 0.0632 | 13.9000 | <0.0001 | 0.9361 | 0.6016 (m) |
| βTH | 2.2995 | 1.0633 | 2.1600 | 0.0498 | |||
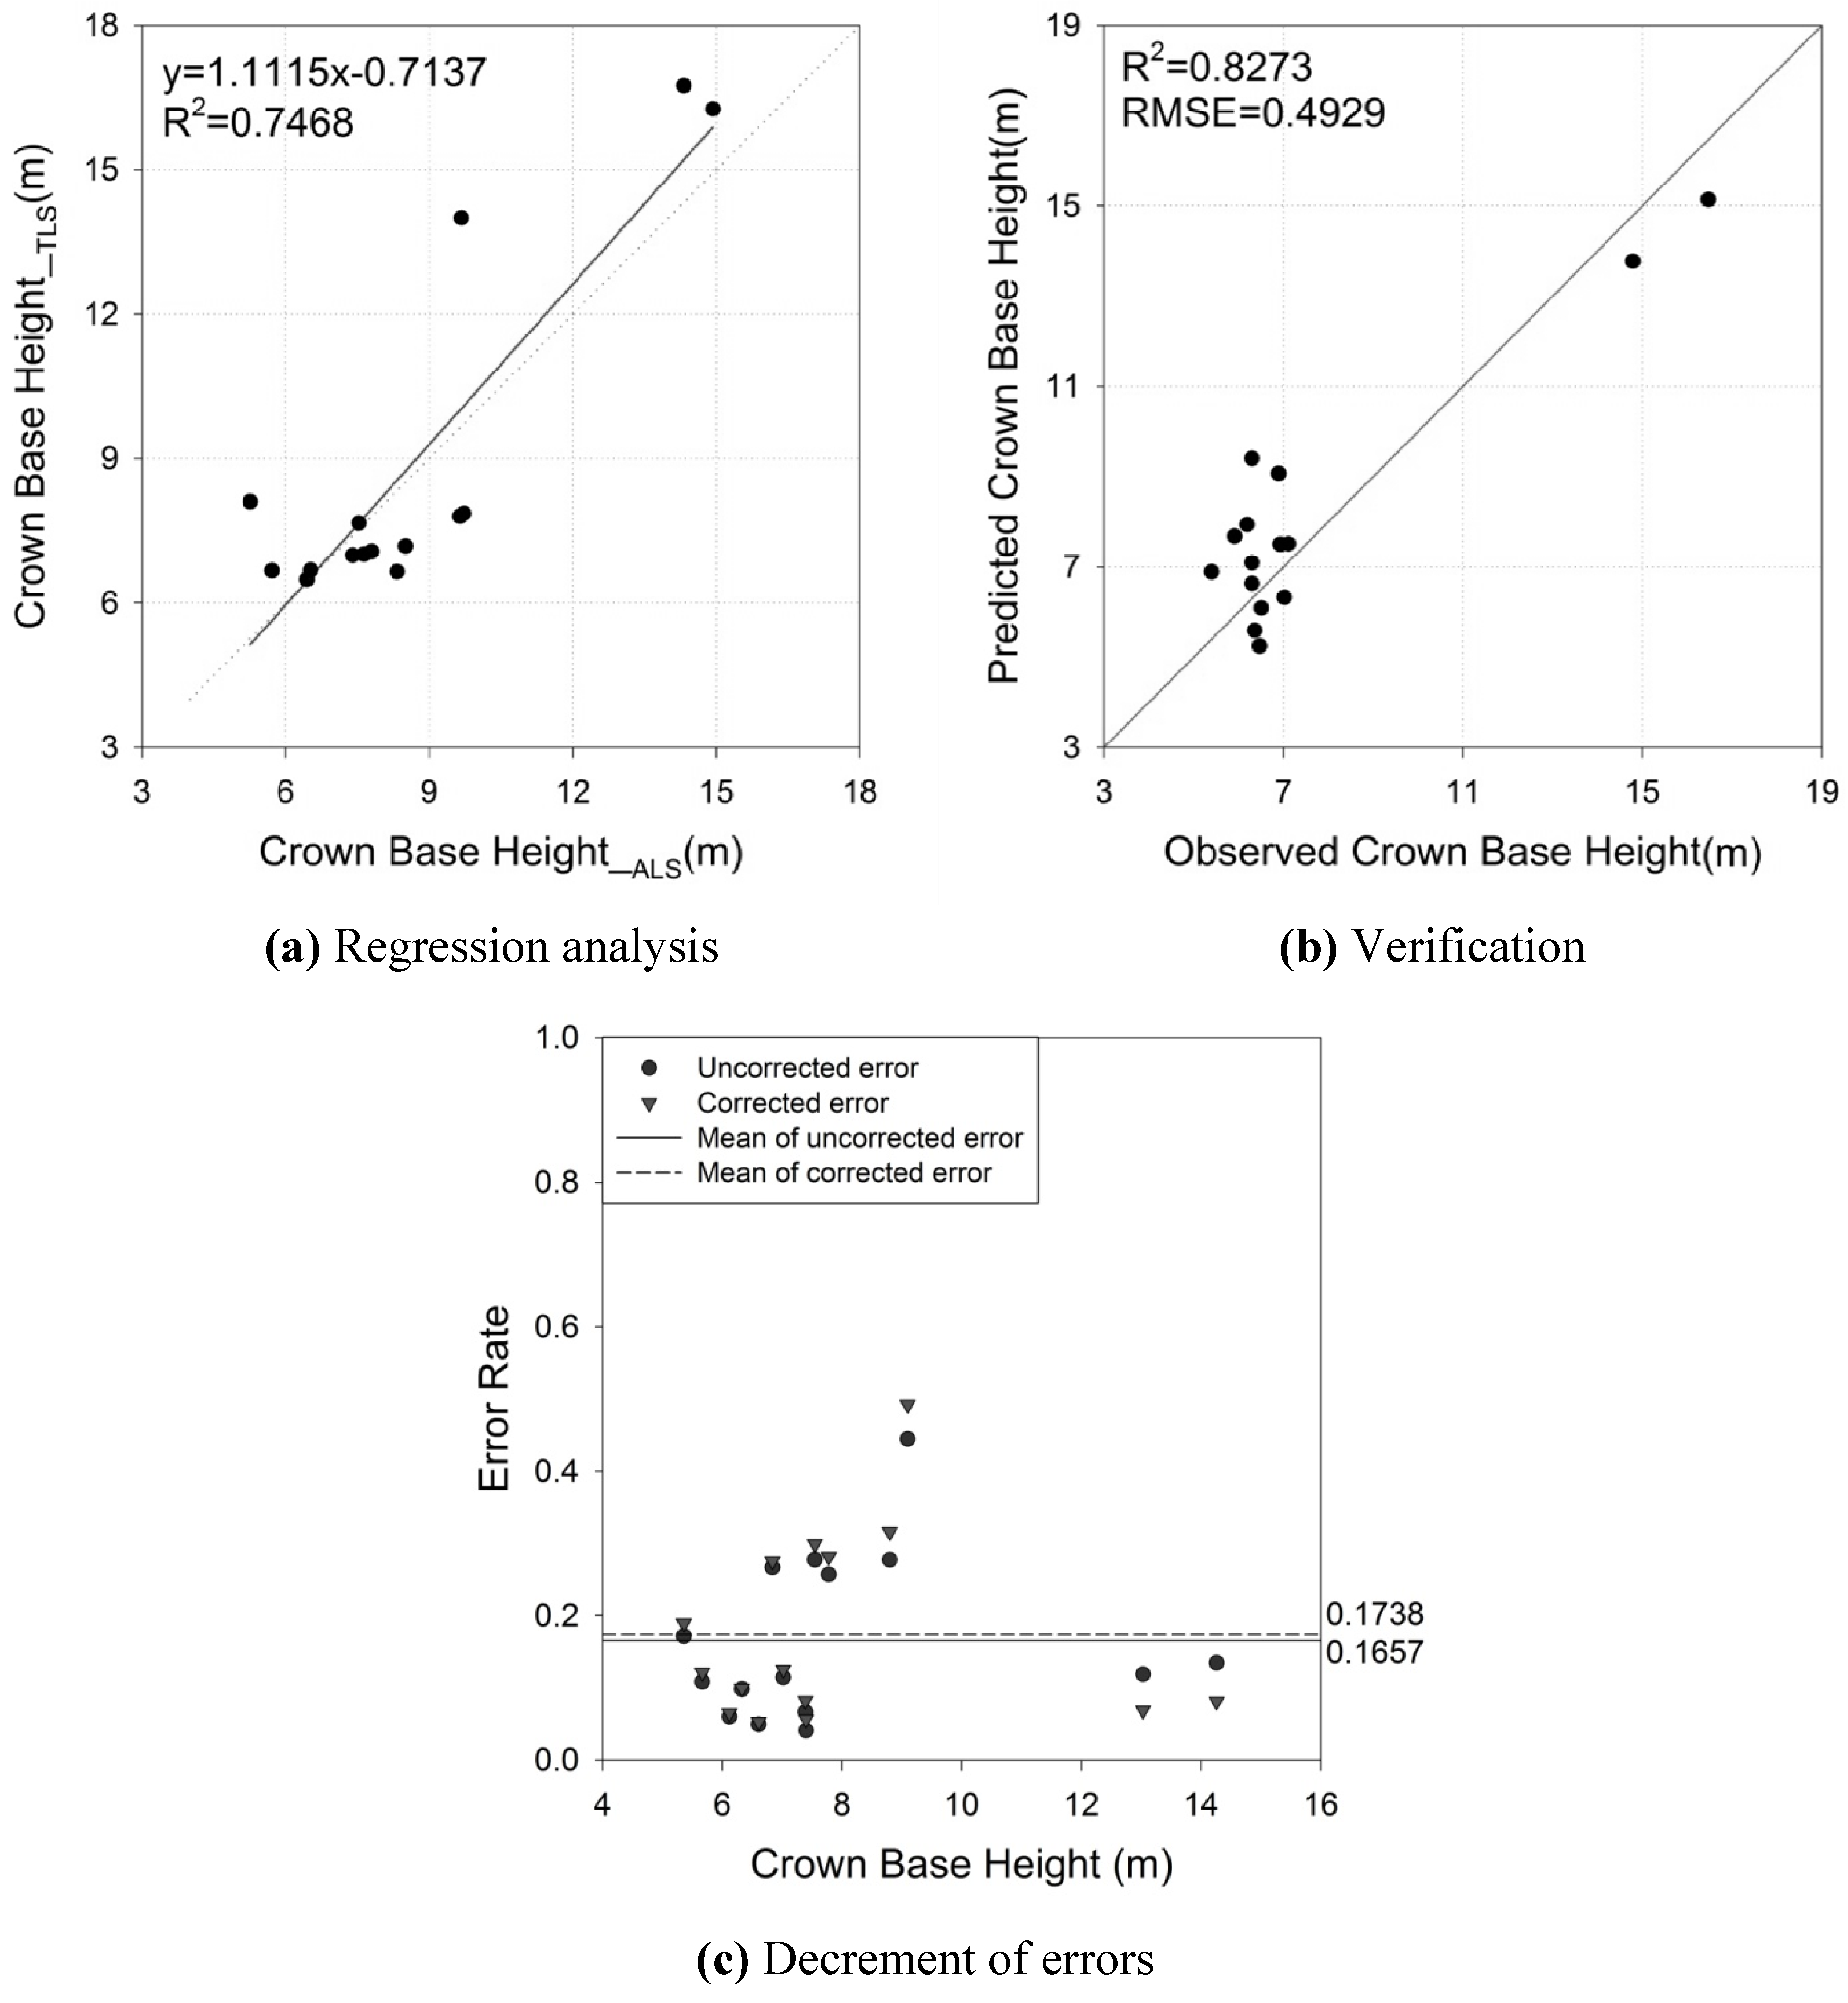
| CBH | αCBH | 1.1115 | 0.1795 | 6.1900 | <0.0001 | 0.7468 | 1.8742 (m) |
| βCBH | −0.7137 | 1.6226 | −0.4400 | 0.6673 | |||
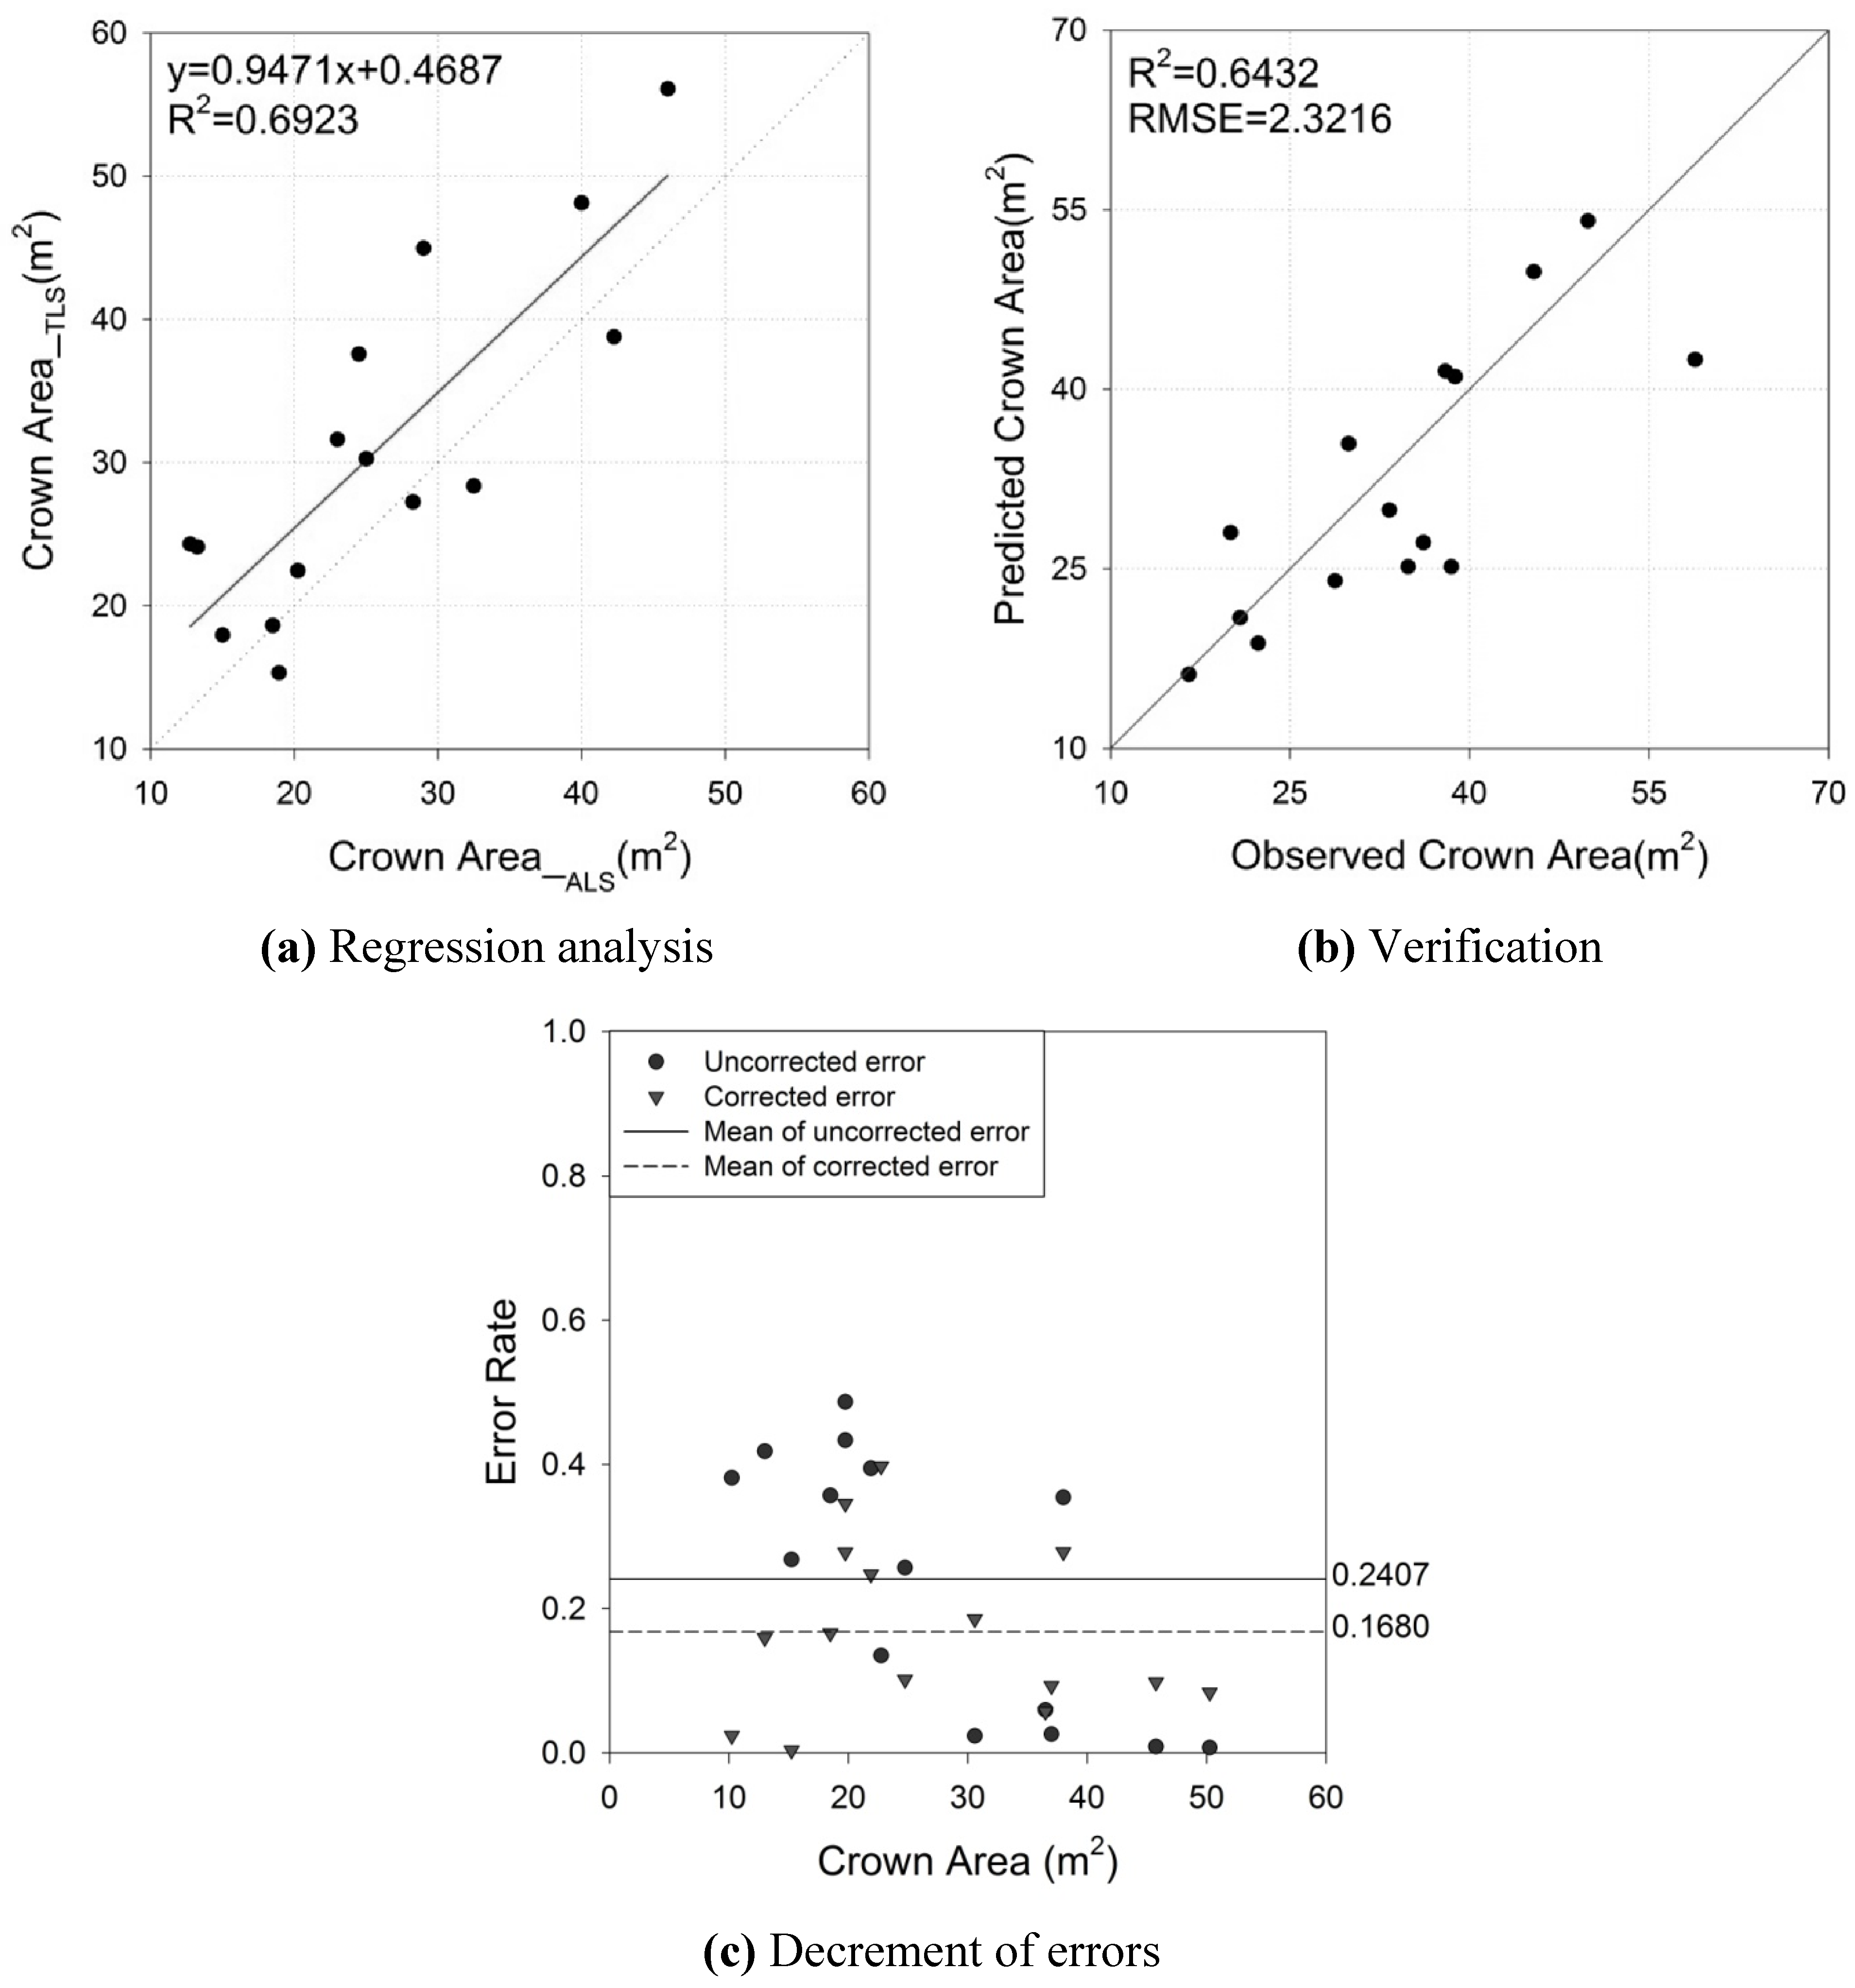
| CA | αCA | 0.9471 | 0.1752 | 5.4100 | <0.0001 | 0.6923 | 6.8435 (m2) |
| βCA | 6.4687 | 4.8759 | 1.3300 | 0.2074 | |||
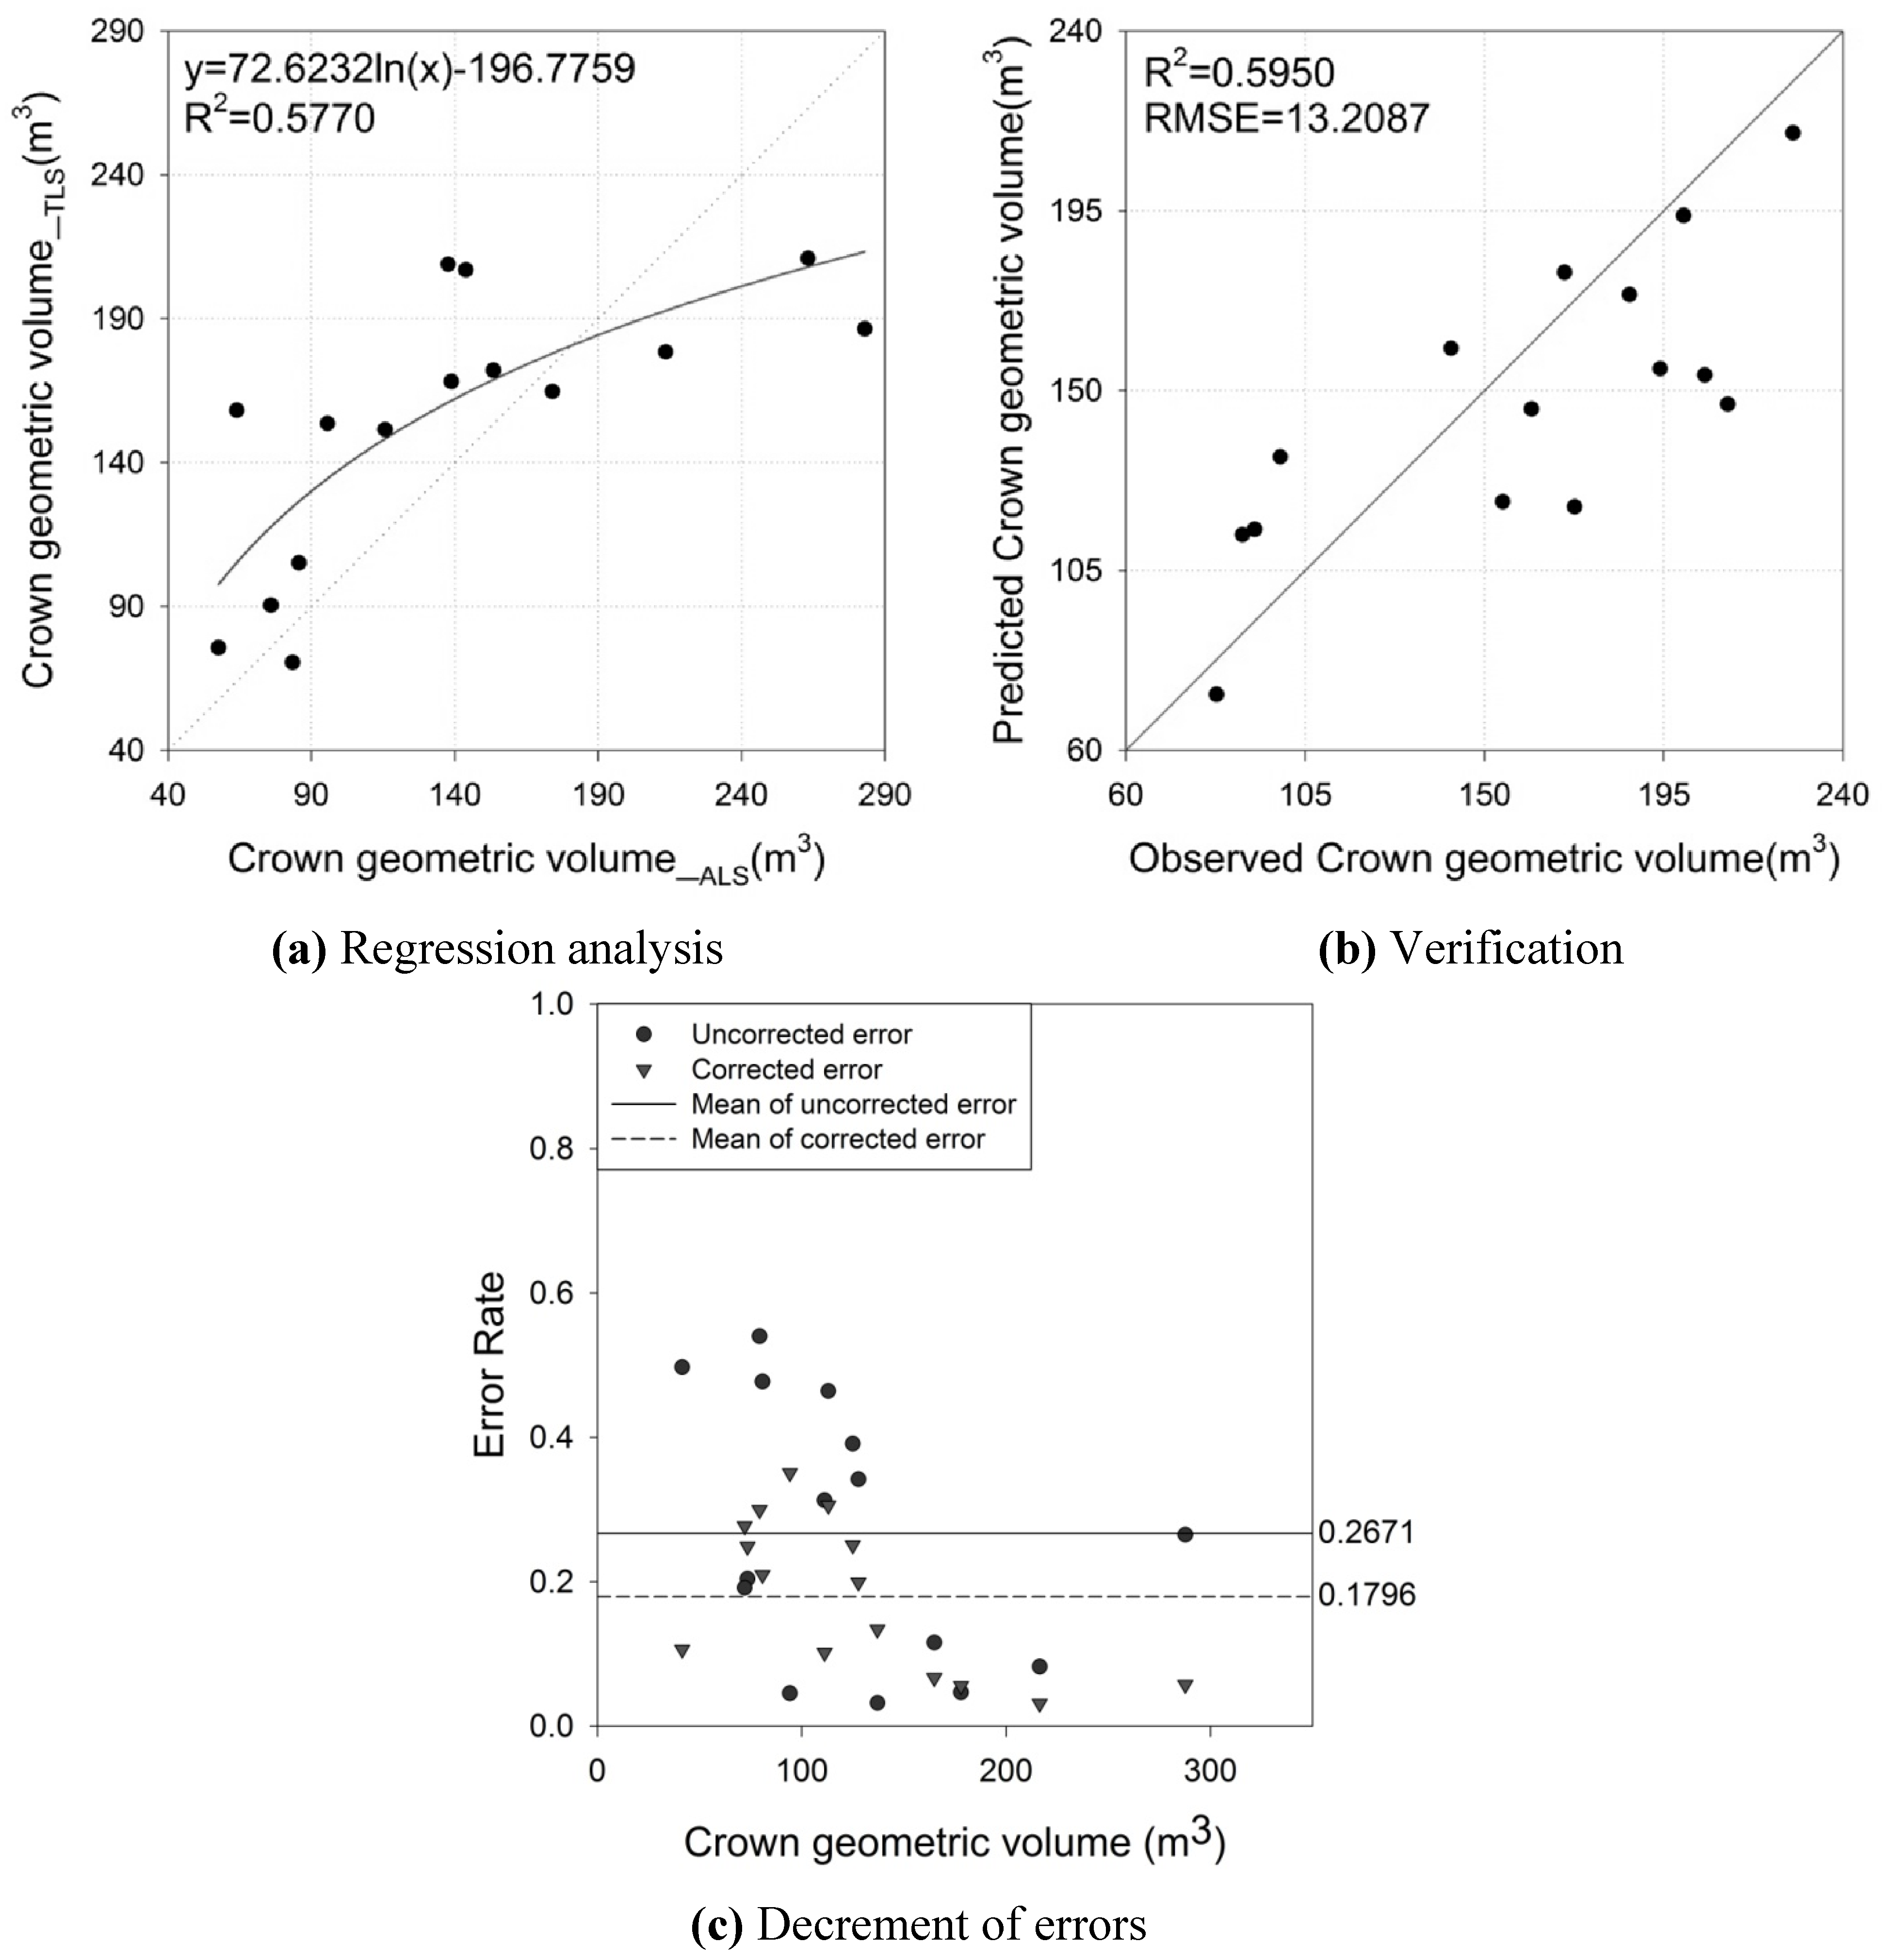
| CGV | αCGV | 72.6232 | 17.2458 | 4.2111 | 0.0010 | 0.5770 | 31.7109 (m3) |
| βCGV | −196.7759 | 83.5614 | −2.3549 | 0.0349 |

4.2. Crown Base Height

4.3. Crown Area
4.4. Crown Geometric Volume
4.5. Overall Analysis
6. Conclusions
Acknowledgements
References
- Koch, B.; Heyder, U.; Welnacker, H. Detection of individual tree crowns in airborne lidar data. Photogramm. Eng. Remote Sensing 2006, 4, 357–363. [Google Scholar] [CrossRef]
- Avery, T.E.; Burkhart, H.E. Forest Measurements, 4th ed.; McGraw–Hill: Boston, MA, USA, 1994. [Google Scholar]
- Shivers, B.D.; Borders, B.E. Sampling Techniques for Forest Resource Inventory, 1st ed.; Wiley: New York, NY, USA, 1996. [Google Scholar]
- Lefsky, M.A.; Cohen, W.B.; Parker, G.G.; Harding, D.J. LiDAR remote sensing for ecosystem studies. Bioscience 2002, 52, 19–30. [Google Scholar] [CrossRef]
- Kwak, D.A.; Lee, W.K.; Lee, J.H.; Biging, G.S.; Gong, P. Detection of individual trees and estimation of tree height using LiDAR data. J. Forest Res. 2007, 12, 425–434. [Google Scholar] [CrossRef]
- Lefsky, M.A.; Cohen, W.B. Selection of remotely sensed data. In Remote Sensing of Forest Environments, Concepts and Case Studies, 1st ed.; Wulder, M.A., Franklin, S.E., Eds.; Kluwer Academic Publishers: Norwell, MA, USA, 2003; pp. 13–46. [Google Scholar]
- Dubayah, R.O.; Drake, J.B. Lidar remote sensing for forestry. J. Forest. 2000, 98, 44–46. [Google Scholar]
- Aldred, A.; Bonnor, M. Application of Airborne Lasers to Forest Surveys; Information Report PI-X-51; Canadian Forestry Service, Petawawa National Forestry Centre: Chalk River, ON, Canada, 1985; p. 62. [Google Scholar]
- MacLean, G.A.; Martin, G.L. Merchantable timber volume estimation using cross-sectional photogrammetric and densitometric methods. Can. J. Forest Res. 1984, 14, 803–810. [Google Scholar] [CrossRef]
- Nelson, R. Determining forest canopy characteristics using airborne laser data. Remote Sens. Environ. 1984, 15, 201–212. [Google Scholar] [CrossRef]
- Næsset, E. Determination of mean tree height of forest stands using airborne laser scanner data. ISPRS J. Photogramm. 1997, 52, 49–56. [Google Scholar] [CrossRef]
- Magnussen, S.; Boudewyn, P. Derivations of stand height from airborne laser scanner data with canopy-based quantile estimators. Can. J. Forest Res. 1998, 28, 1016–1031. [Google Scholar] [CrossRef]
- Chen, Q.; Baldocchi, D.; Gong, P.; Kelly, M. Delineating individual trees in a Savanna Woodland using small footprint LiDAR data. Photogramm. Eng. Remote Sensing 2006, 72, 923–932. [Google Scholar] [CrossRef]
- Næsset, E. Estimating timber volume of forest stands using airborne laser scanner data. Remote Sens. Environ. 1997, 61, 246–253. [Google Scholar] [CrossRef]
- Lim, K.; Treitz, P.; Baldwin, K.; Morrison, I.; Green, J. LiDAR remote sensing of biophysical properties of tolerant northern hardwood forests. Can. J. Remote Sens. 2003, 29, 658–678. [Google Scholar] [CrossRef]
- Kwak, D.A.; Lee, W.K.; Cho, H.K.; Lee, S.H.; Son, Y.; Kafatos, M.; Kim, S.R. Estimating stem volume and biomass of Pinus koraiensis using LiDAR data. J. Plant Res. 2010, 123, 421–432. [Google Scholar] [CrossRef] [PubMed]
- Zimble, D.A.; Evans, D.L.; Carlson, G.C.; Parker, R.C.; Grado, S.C.; Gerardd, P.D. Characterizing vertical forest structure using small-footprint airborne LiDAR. Remote Sens. Environ. 2003, 87, 171–182. [Google Scholar] [CrossRef]
- Parker, G.G.; Harding, D.J.; Berger, M.L. A portable LIDAR system for rapid determination of forest canopy structure. J. Appl. Ecol. 2004, 41, 755–767. [Google Scholar] [CrossRef]
- Tickle, P.K.; Lee, A.; Lucas, R.M.; Austin, J.; Witte, C. Quantifying Australian forest floristics and structure using small footprint LiDAR and large scale aerial photography. Forest Ecol. Manage. 2006, 223, 379–394. [Google Scholar] [CrossRef]
- Hopkinson, C.; Chasmer, L.; Young-Pow, C.; Treitz, P. Assessing plot level metrics with a ground-based scanning LiDAR. Can. J. Remote Sens. 2004, 34, 573–583. [Google Scholar]
- Thies, M.; Spoecker, H. Evaluation and future prospects of terrestrial laser scanning for standardized forest inventories. ISPRS J. Photogramm. 2004, 36, 192–197. [Google Scholar]
- Simonse, M.; Aschoff, T.; Spiecker, H.; Thies, M. Automatic Determination of Forest Inventory Parameters Using Terrestrial Laserscanning. In Proceedings of the ScandLaser Scientific Workshop on Airborne Laser Scanning of Forests, Umeå, Sweden, 3–4 September 2003; pp. 251–257.
- Chen, Q.; Gong, P.; Baldocchi, D.; Tian, Y.Q. Estimating basal area and stem volume for individual trees from LiDAR data. Photogramm. Eng. Remote Sensing 2007, 73, 1355–1365. [Google Scholar] [CrossRef]
- Watt, P.J.; Donoghue, D.N.M.; Dunford, R.W. Forest Parameter Extraction Using Terrestrial Laser Scanning. In Proceedings of the ScandLaser Scientific Workshop on Airborne Laser Scanning of Forests, Umeå, Sweden, 3–4 September 2003; pp. 237–244.
- Henning, J.G.; Radtke, P.J. Detailed stem measurements of standing trees from ground-based scanning lidar. Forest Sci. 2006, 52, 67–80. [Google Scholar]
- Trimble Home Page. GS200 3D Scanner. Available online: www.trimble.com/gs200.shtml (accessed on 22 September 2010).
- Soille, P. Morphological Image Analysis: Principles and Applications, 2nd ed.; Springer-Verlag: Berlin, Germany, 2003; p. 391. [Google Scholar]
- Popescu, S.C.; Wynne, R.H.; Scrivani, J.A. Fusion of small footprint LiDAR and multispectral data to estimate plot-level volume and biomass in deciduous and pine forests in Virginia, USA. Forest Sci. 2004, 50, 551–565. [Google Scholar]
- Hyyppä, J.; Kelle, O.; Lehikoinen, M.; Inkinen, M. A segmentation based method to retrieve stem volume estimates from 3-D tree height models produced by laser scanners. IEEE Trans. Geosci. Remote 2001, 39, 969–975. [Google Scholar] [CrossRef]
- Riano, D.; Chuvieco, E.; Condis, S.; Gonzalez-Matesanz, J.; Ustin, S. L. Generation of crown bulk density for Pinus sylvestris from LIDAR. Remote Sens. Environ. 2004, 92, 345–352. [Google Scholar] [CrossRef]
- MATLAB. Help Documents in MatLab 2006; Mathwork: Natick, MA, USA, 2006. [Google Scholar]
- Chen, Q.; Gong, P.; Baldocchi, D.D.; Xie, G. Filtering airborne laser scanning data with morphological methods. Photogramm. Eng. Remote Sensing 2007, 73, 171–181. [Google Scholar] [CrossRef]
- ArcGIS. Help Documents in ArcGIS 8.1; Environmental Systems Research Institute (ESRI): Redlands, CA, USA, 2001. [Google Scholar]
- Coder, K.D. Crown Shape Factor & Volumes; Tree Biomechanics 672 Series; University of Georgia: Athens, GA, USA, 2000; pp. 1–5. [Google Scholar]
- Kwak, D.A.; Lee, W.K.; Cho, H.K.; Lee, S.H. Estimation of Tree Volume Using LiDAR Remote Sensing. In Proceeding of the A3 Foresight Program (Ecological Processes for Carbon Cycling: Temporal and Spatial Variations), Jinju, Korea, 21–23 April 2009; pp. 49–52.
- Holmgren, J.; Persson, Å. Identifying species of individual trees using airborne laser scanner. Remote Sens. Environ. 2004, 90, 415–423. [Google Scholar] [CrossRef]
- Popescu, S.C.; Zhao, K. A voxel-based lidar method for estimating crown base height for deciduous and pine trees. Remote Sens. Environ. 2008, 112, 767–781. [Google Scholar] [CrossRef]
- Chasmer, L.; Hopkinson, C.; Treitz, P. Investigating laser pulse penetration through a conifer canopy by integrating airborne and terrestrial lidar. Can. J. Remte Sens. 2006, 32, 116–125. [Google Scholar] [CrossRef]
© 2011 by the authors; licensee MDPI, Basel, Switzerland. This article is an open access article distributed under the terms and conditions of the Creative Commons Attribution license (http://creativecommons.org/licenses/by/3.0/).
Share and Cite
Jung, S.-E.; Kwak, D.-A.; Park, T.; Lee, W.-K.; Yoo, S. Estimating Crown Variables of Individual Trees Using Airborne and Terrestrial Laser Scanners. Remote Sens. 2011, 3, 2346-2363. https://doi.org/10.3390/rs3112346
Jung S-E, Kwak D-A, Park T, Lee W-K, Yoo S. Estimating Crown Variables of Individual Trees Using Airborne and Terrestrial Laser Scanners. Remote Sensing. 2011; 3(11):2346-2363. https://doi.org/10.3390/rs3112346
Chicago/Turabian StyleJung, Sung-Eun, Doo-Ahn Kwak, Taejin Park, Woo-Kyun Lee, and Seongjin Yoo. 2011. "Estimating Crown Variables of Individual Trees Using Airborne and Terrestrial Laser Scanners" Remote Sensing 3, no. 11: 2346-2363. https://doi.org/10.3390/rs3112346
APA StyleJung, S.-E., Kwak, D.-A., Park, T., Lee, W.-K., & Yoo, S. (2011). Estimating Crown Variables of Individual Trees Using Airborne and Terrestrial Laser Scanners. Remote Sensing, 3(11), 2346-2363. https://doi.org/10.3390/rs3112346