Landslide Catastrophes and Disaster Risk Reduction: A GIS Framework for Landslide Prevention and Management

Abstract
:1. Introduction
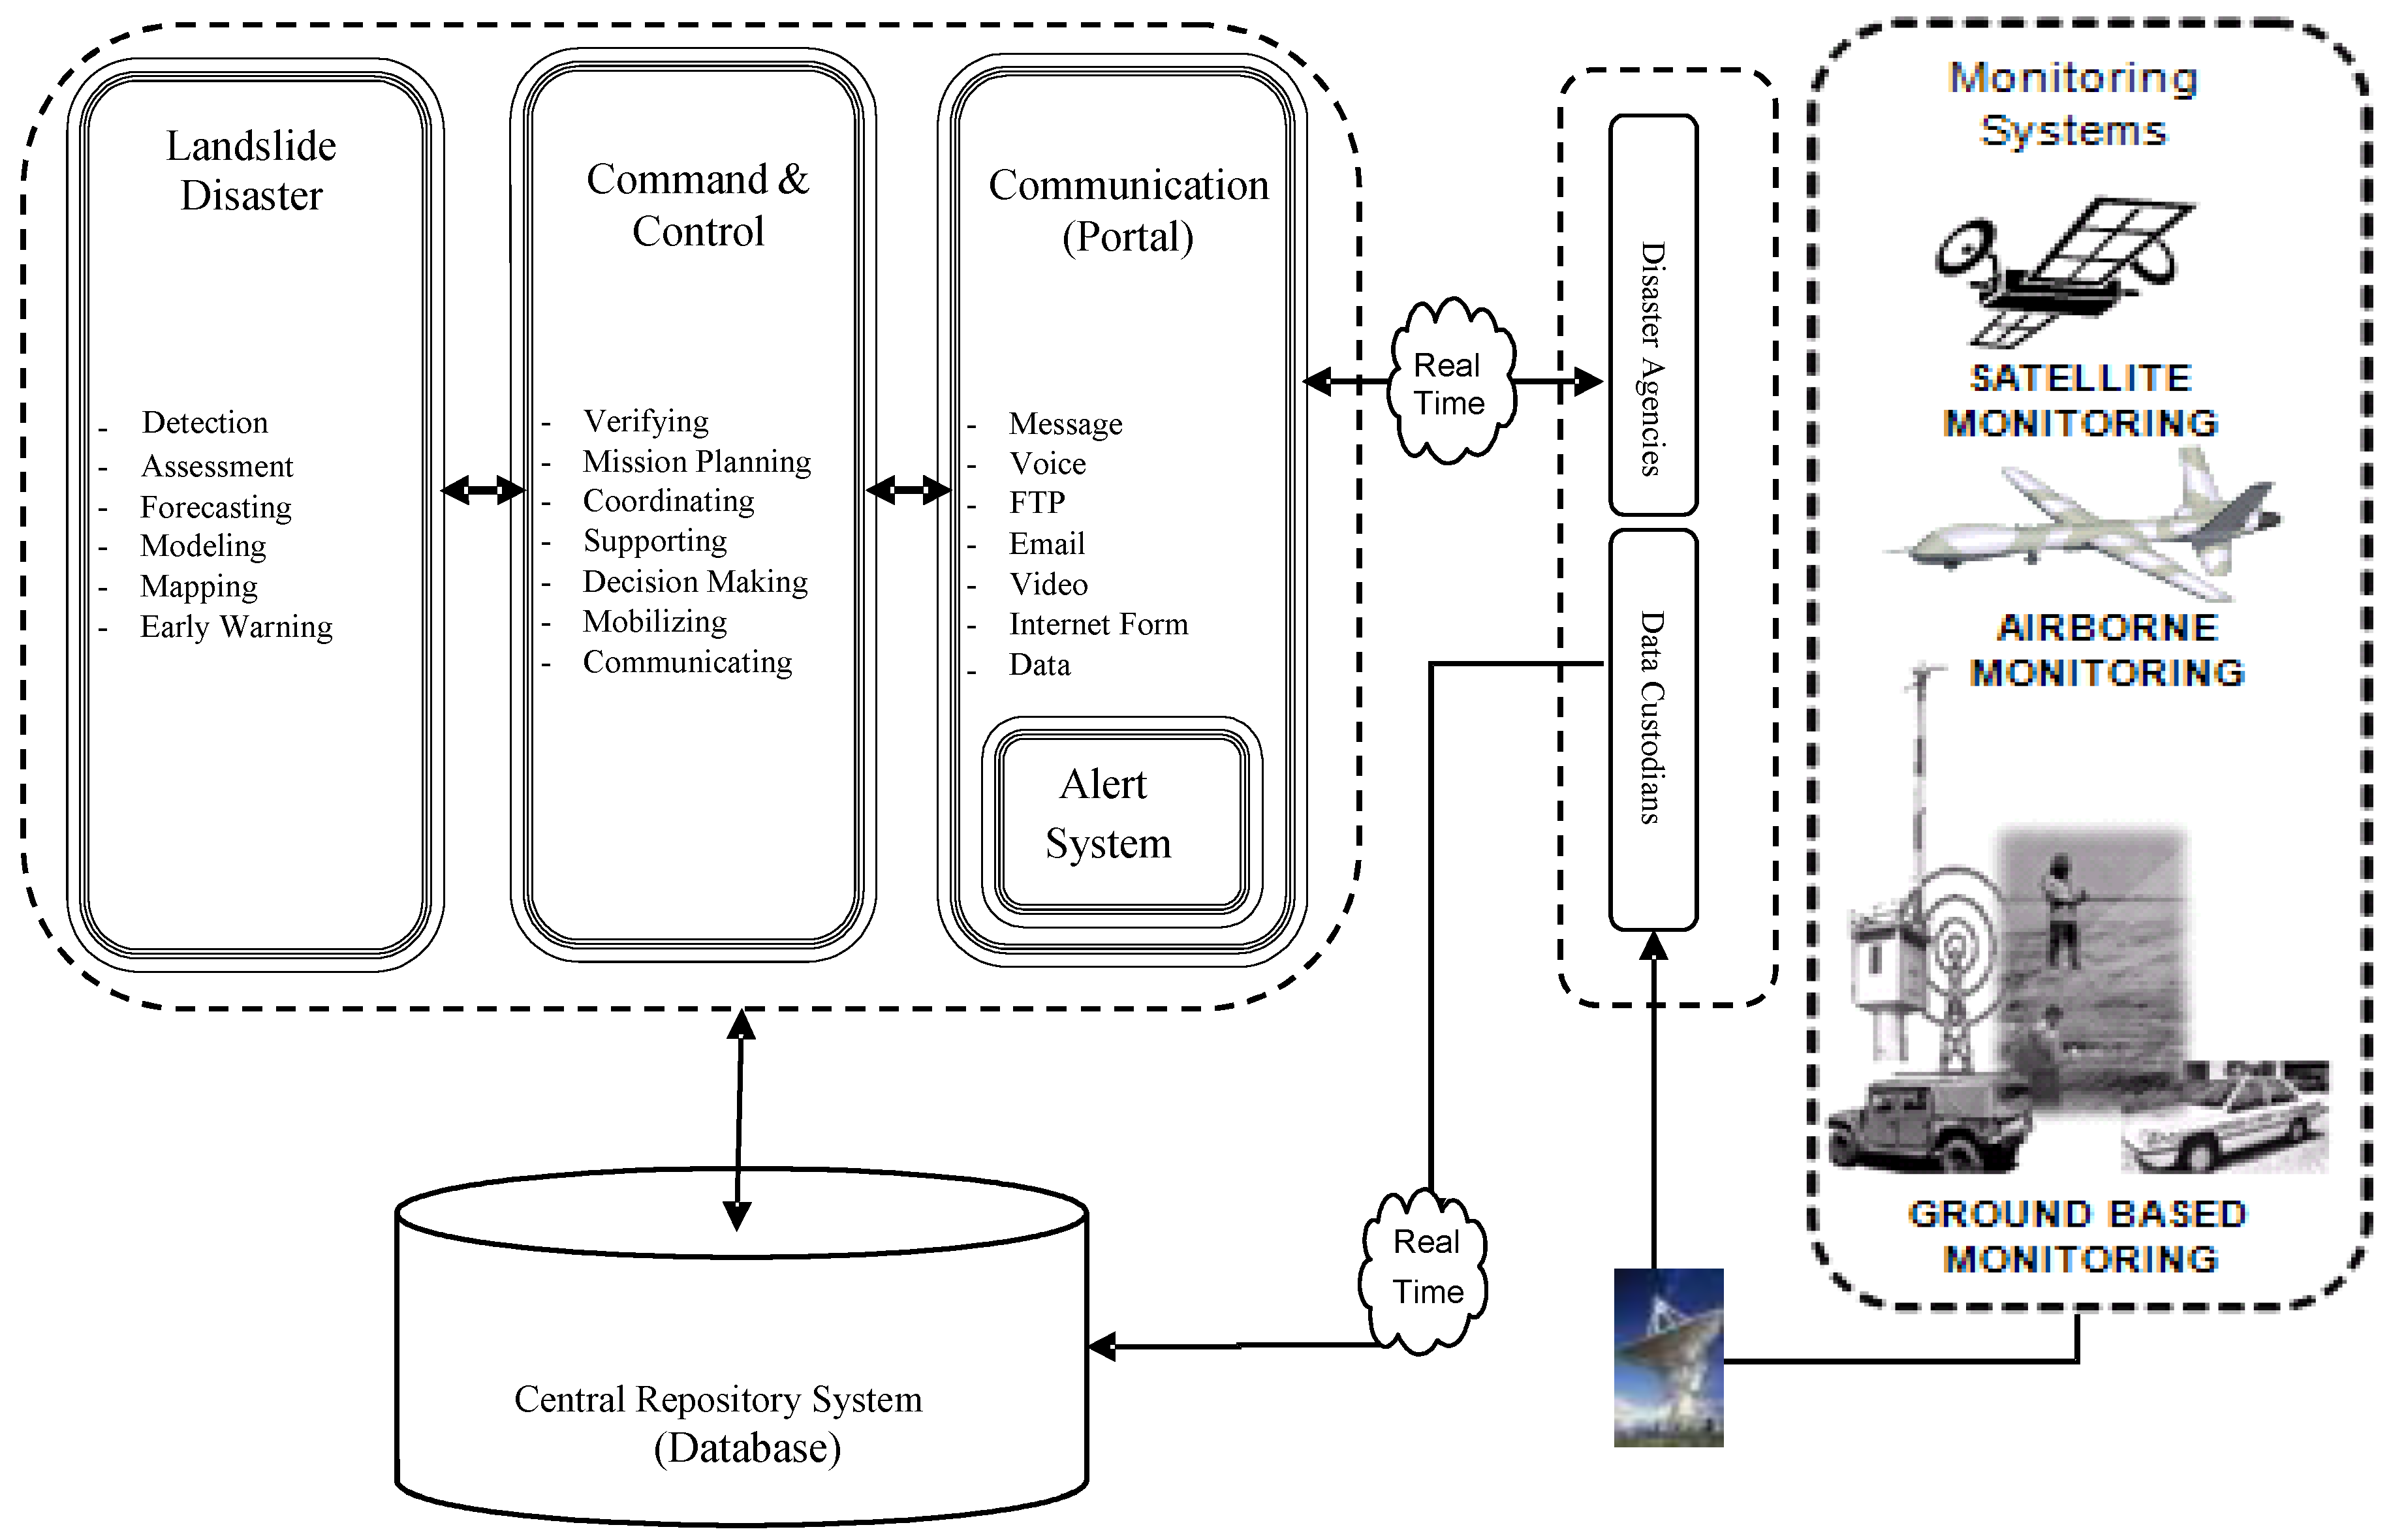
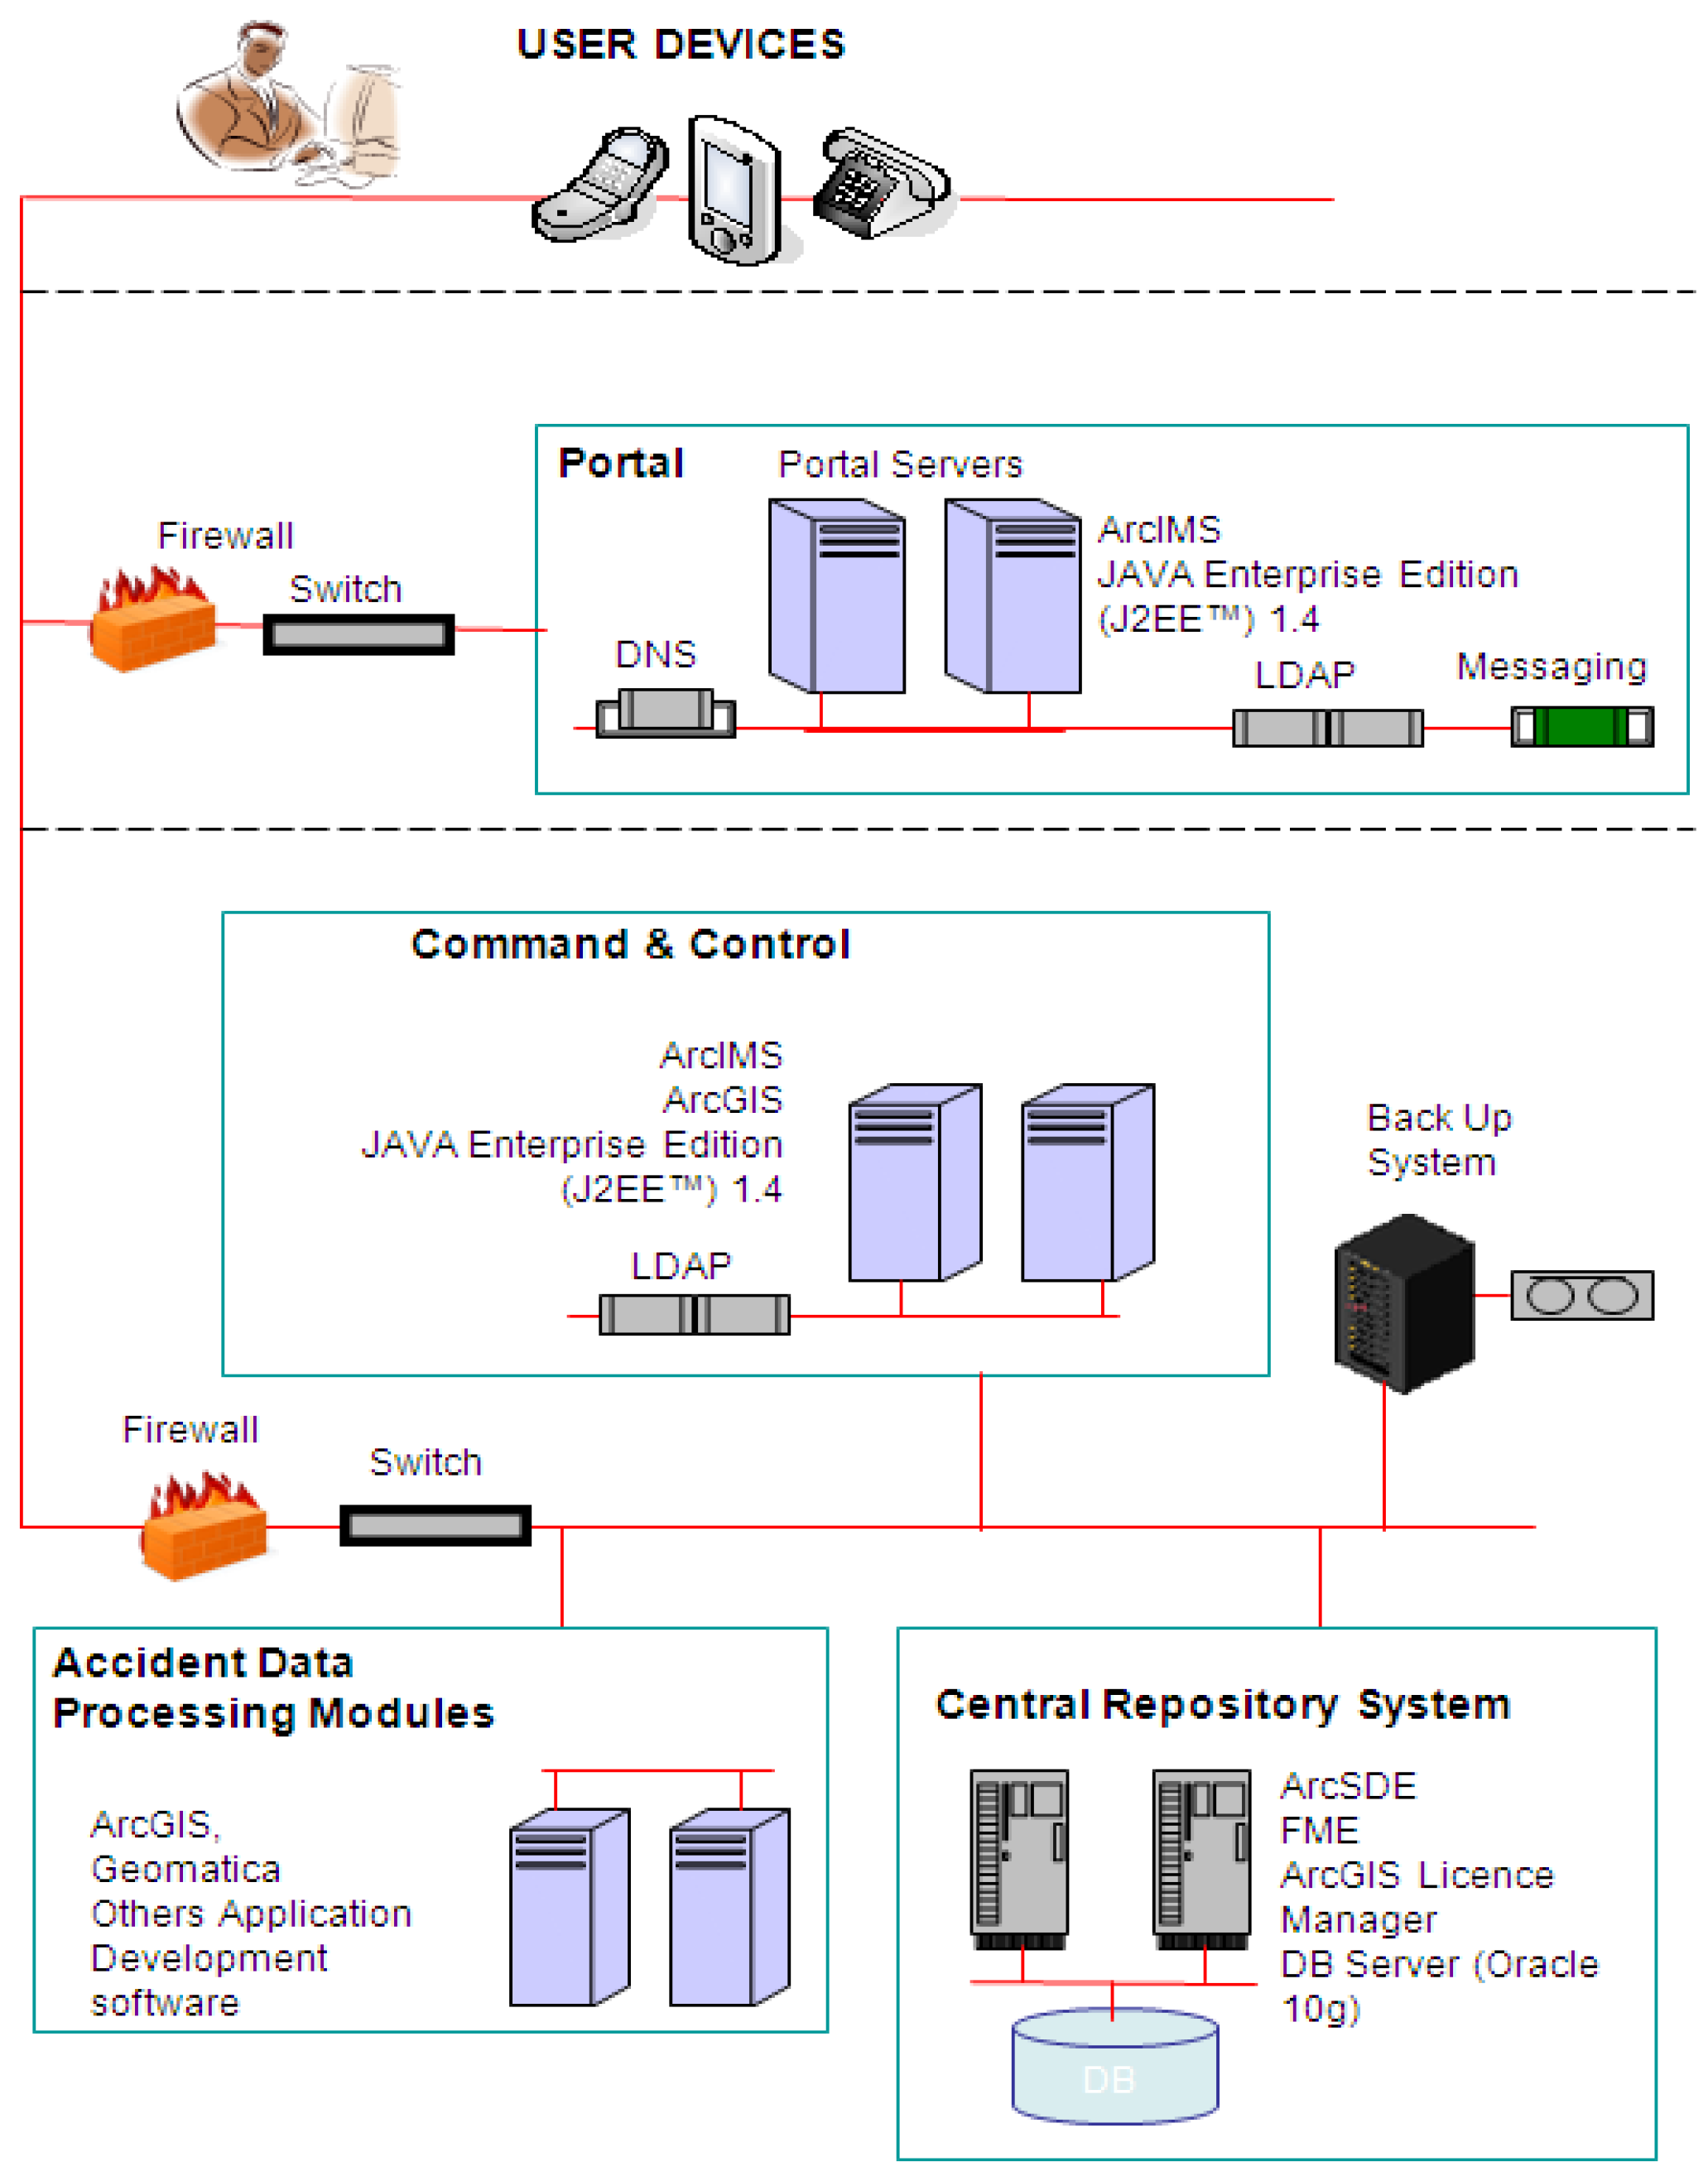
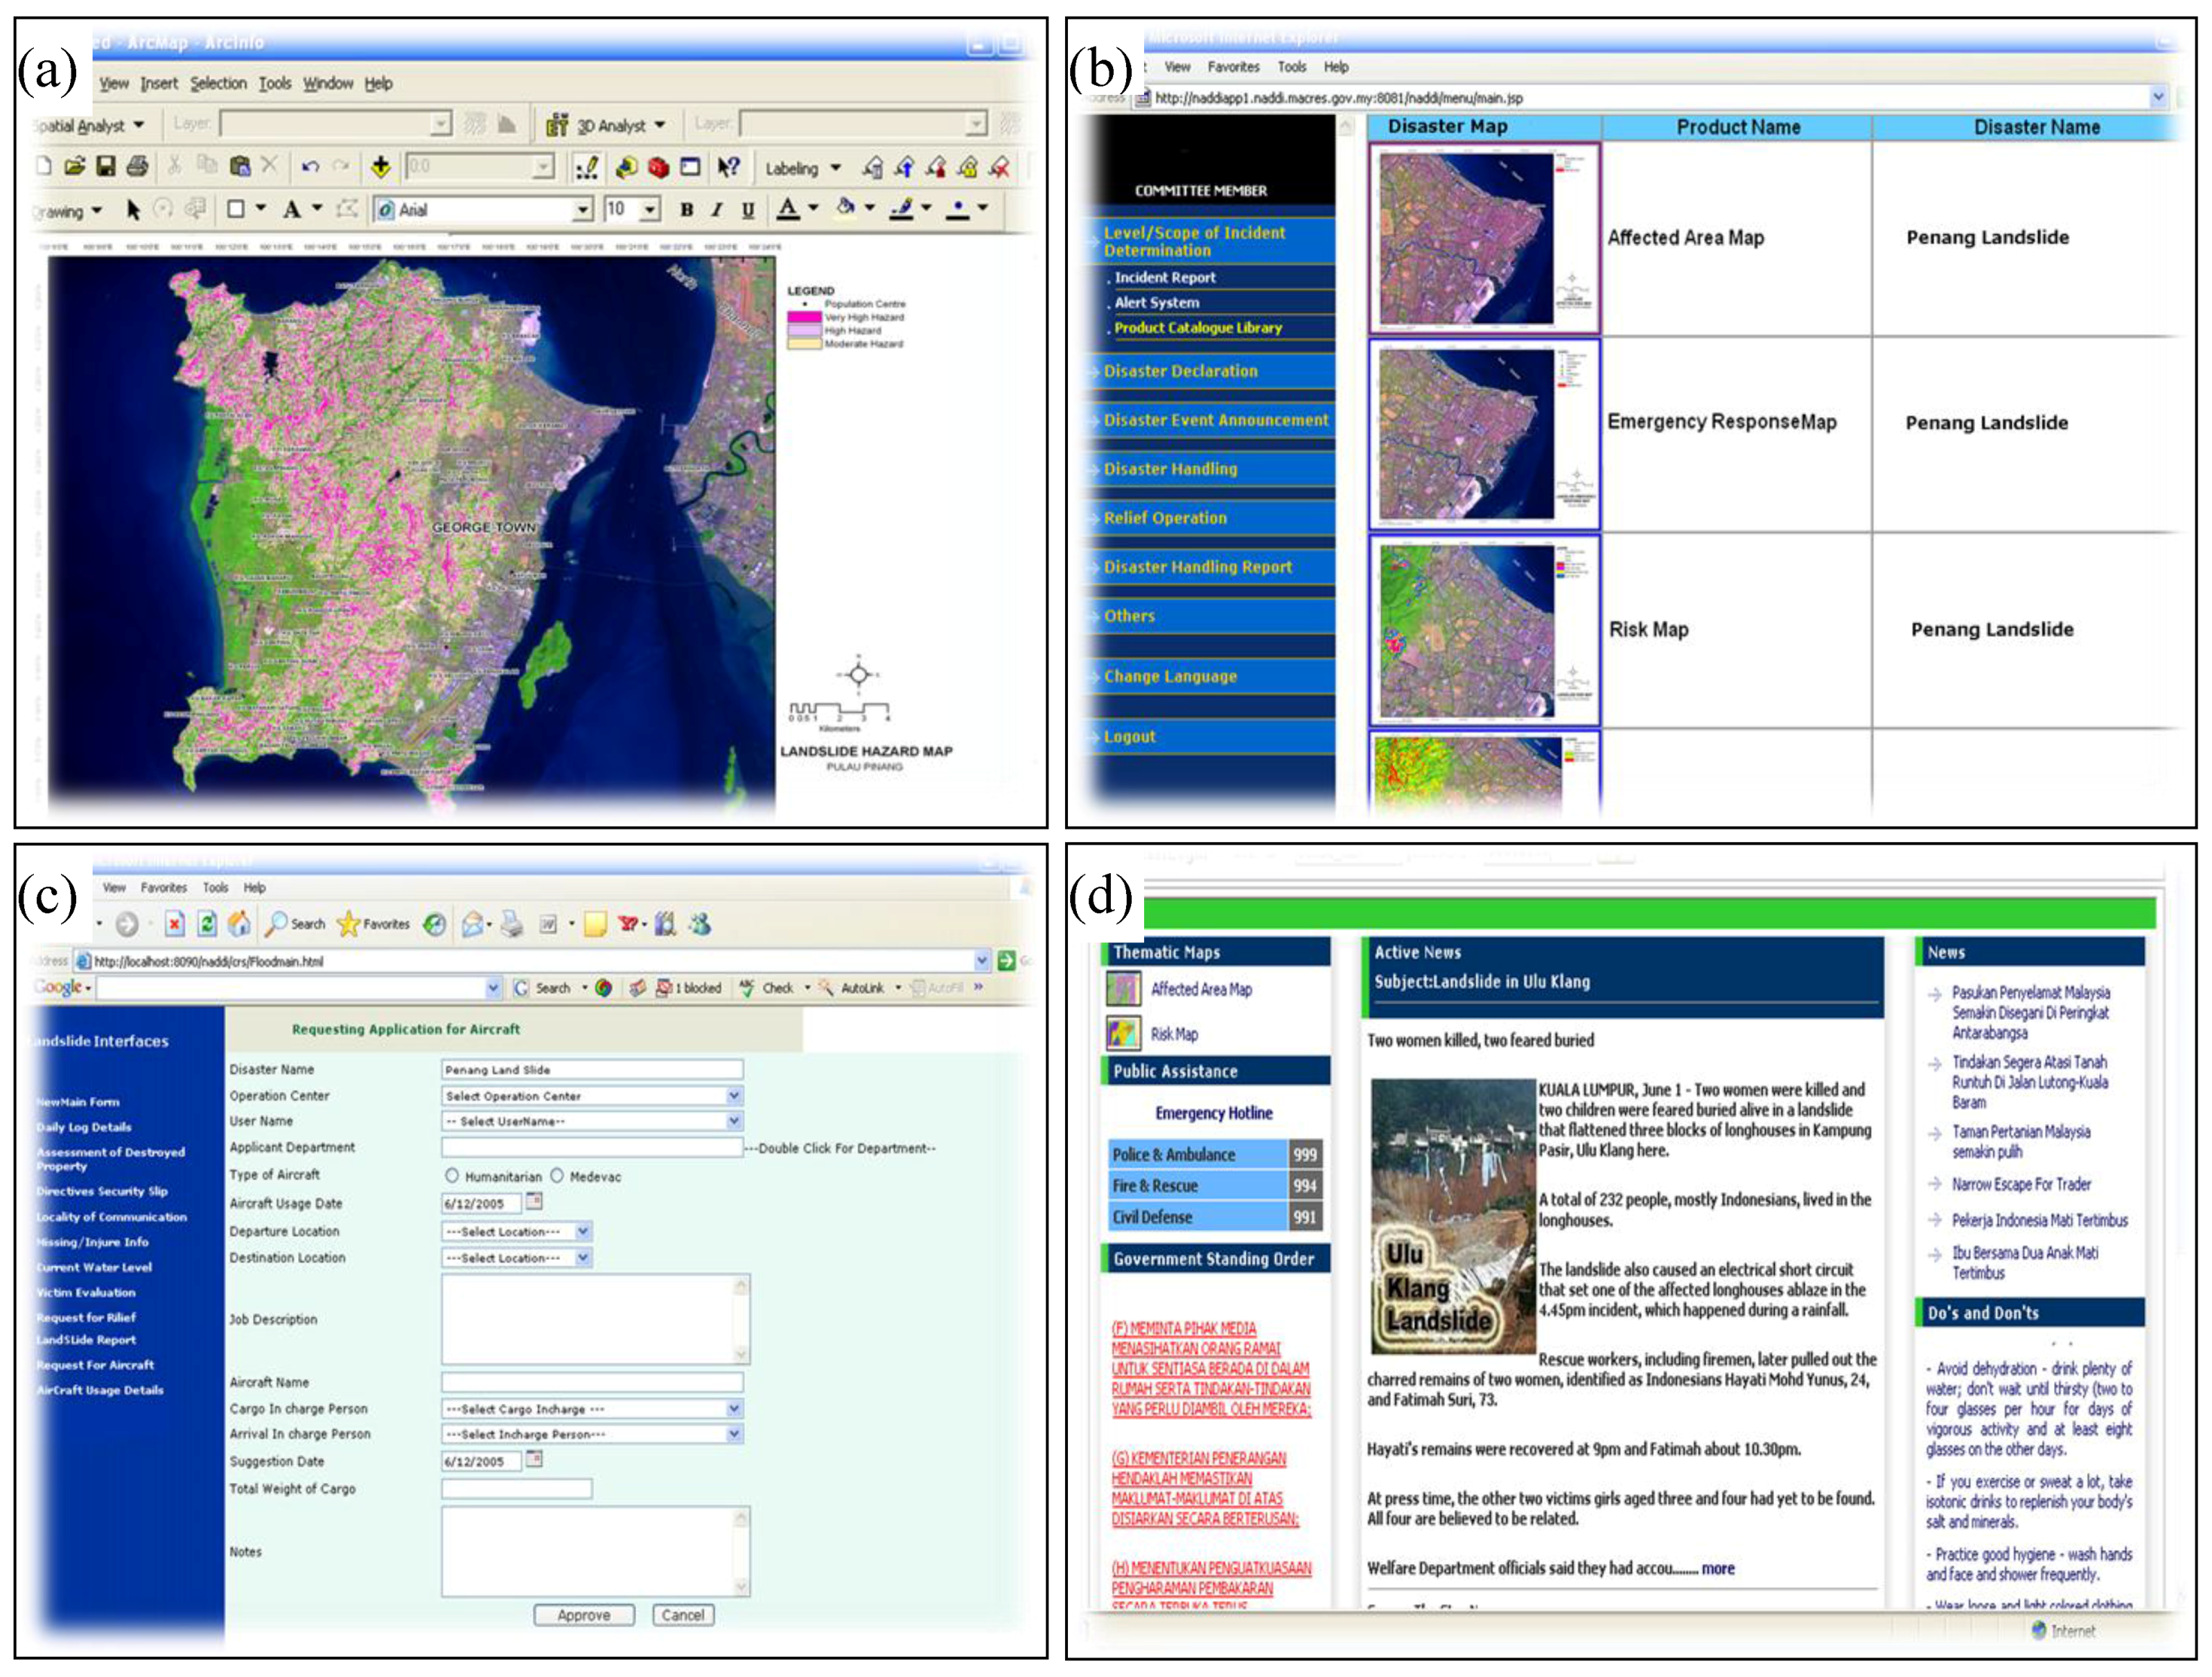
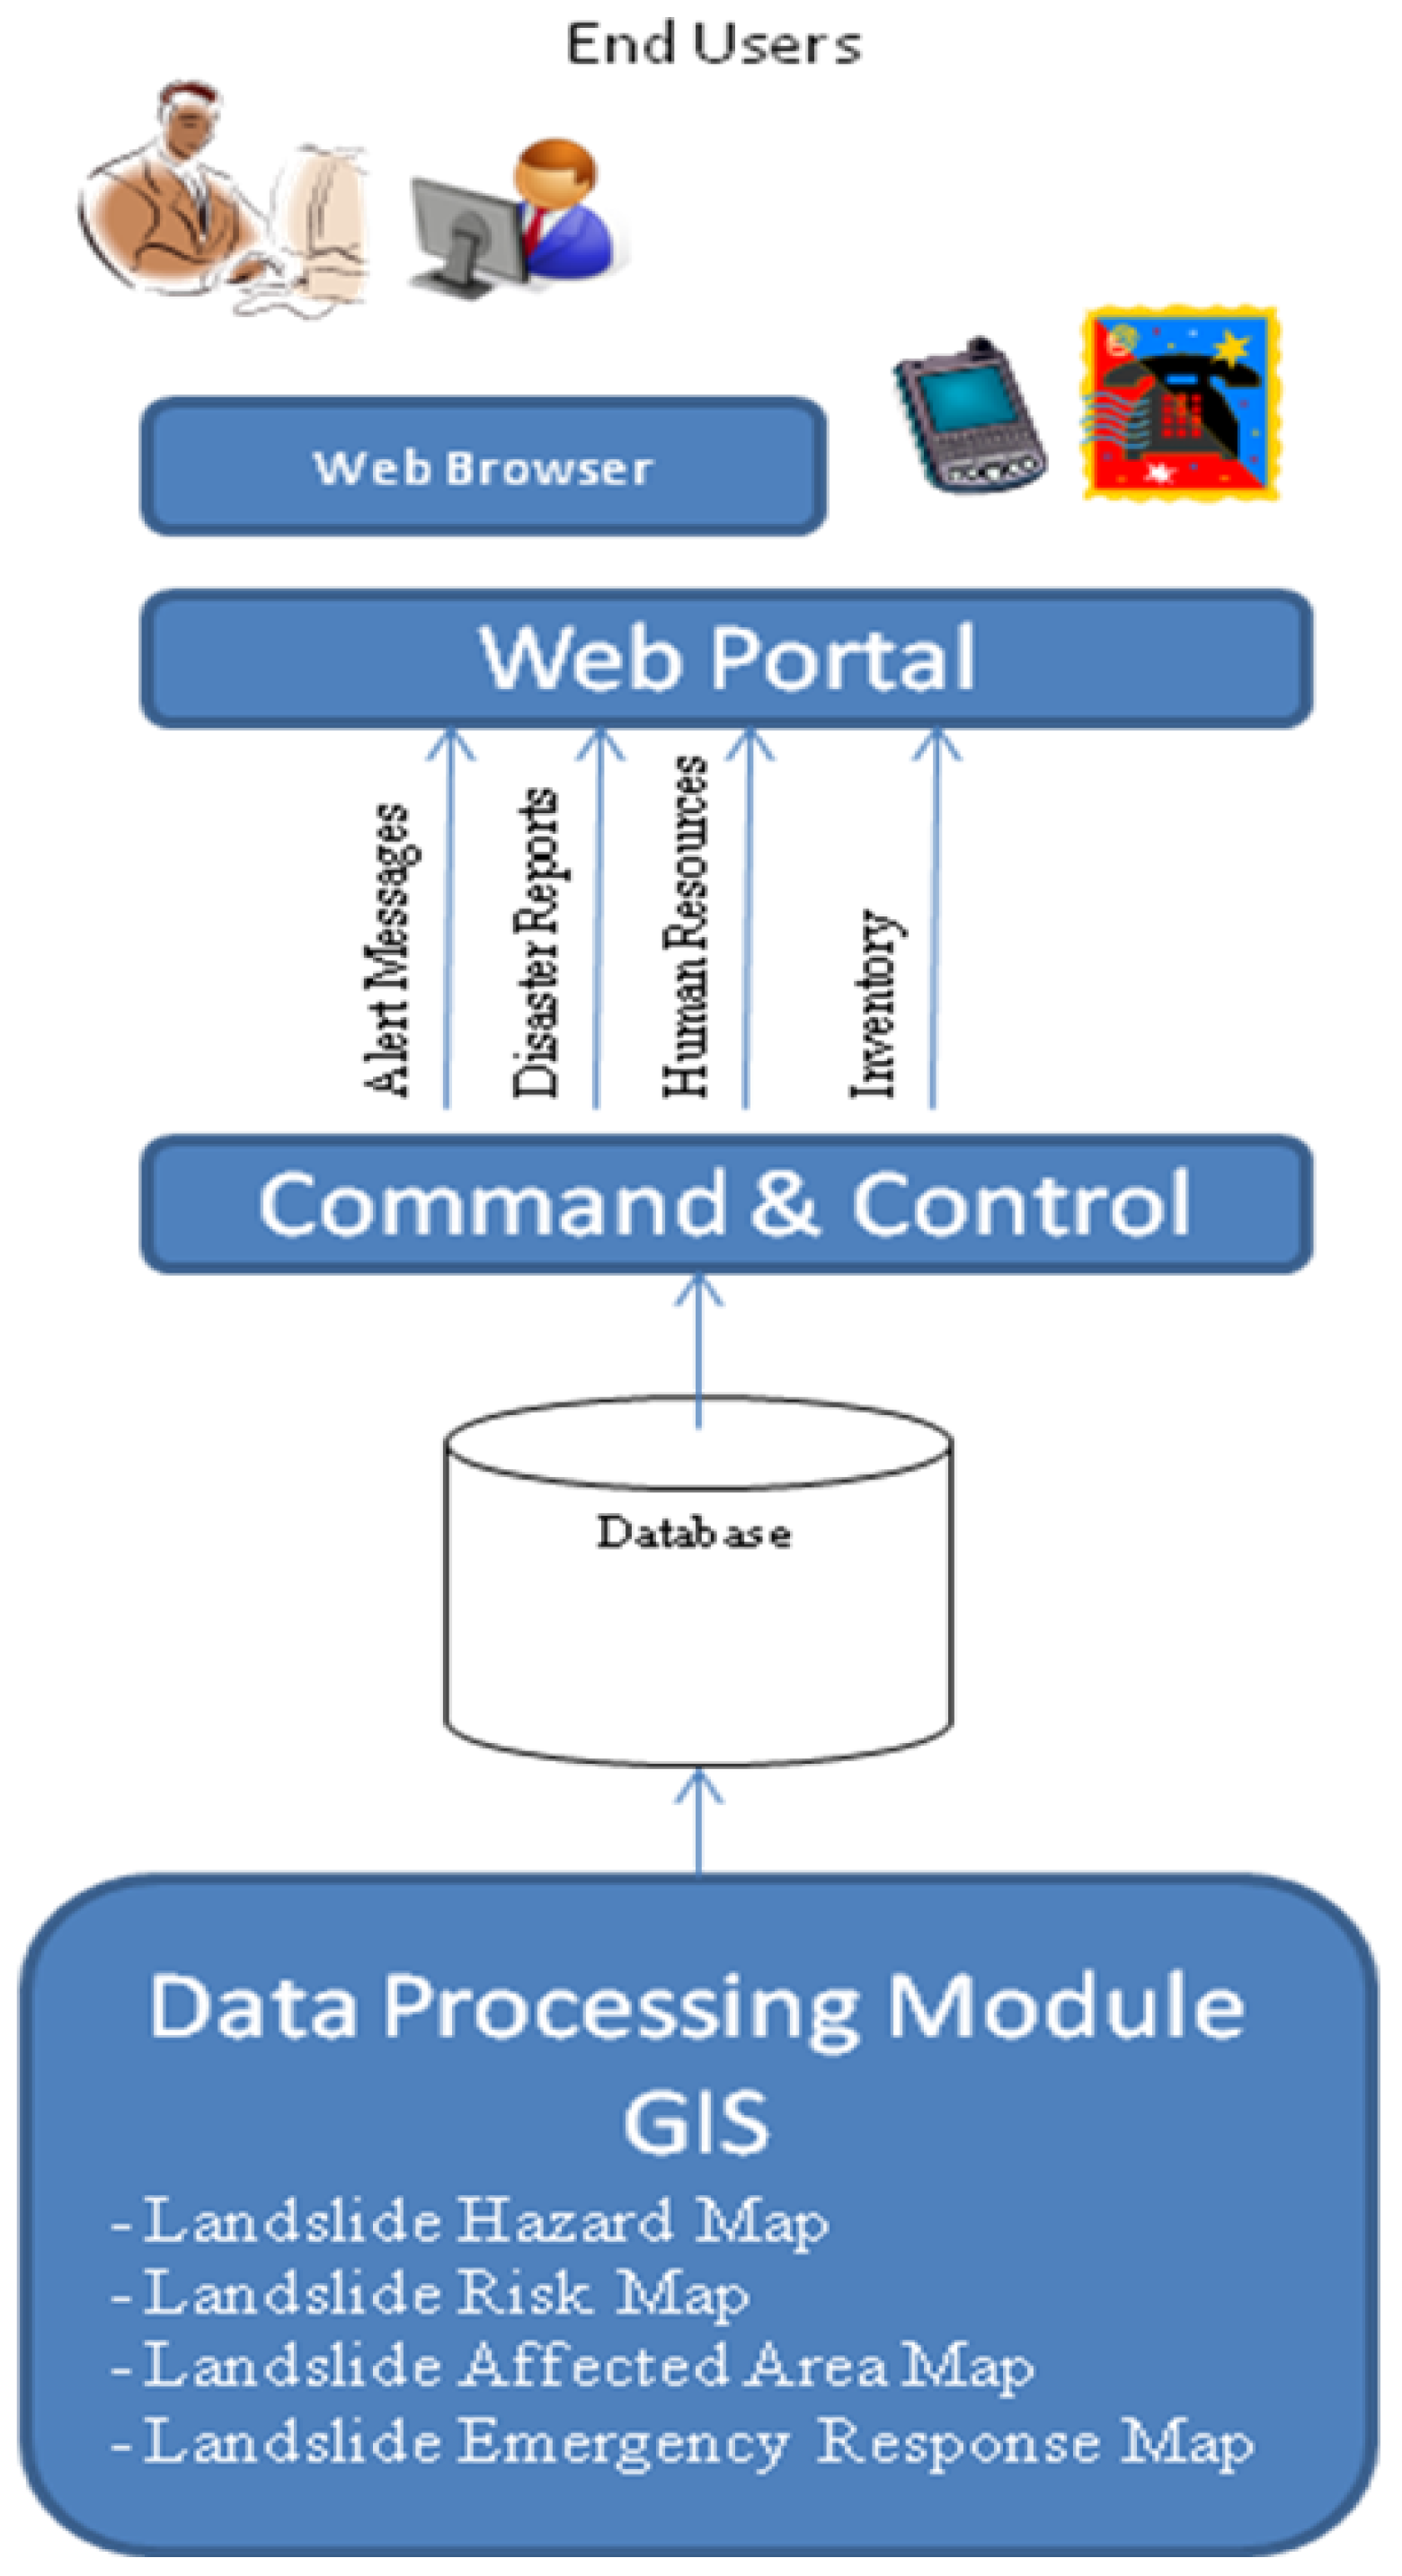
2. System Components and Functionalities
- (a)
- The Central Repository System (CRS) is composed of computer servers and database storage servers. ArcSDE v9.3 workgroup geodatabase and Oracle 10g database servers are used for storage and access management of spatial data.
- (b)
- The Disaster Data Processing Modules (DDPM) assist with landslide monitoring and data modeling. Image analysis and processing is performed using Geomatica 10.1 while disaster models have been developed in ArcGIS 9.3.
- (c)
- The Command and Control System (CCS) serves as a bridge between the portal system, the data processing modules and the central repository system. Predesigned forms were developed in JAVA Enterprise Edition (J2EETM) 1.4 to link with the ArcGIS Server.
- (d)
- The Portal Management System (PMS) manages all incoming and outgoing data transactions through the CCS. The portal system is an internet based communication system which facilitates communications between all decision makers. It is a high-performance and secure messaging platform that provides extensive security features to ensure the integrity of communications through user authentication, session encryption, and content filtering. The portal system was developed using Java and ArcGIS server and supports GIS data transactions.
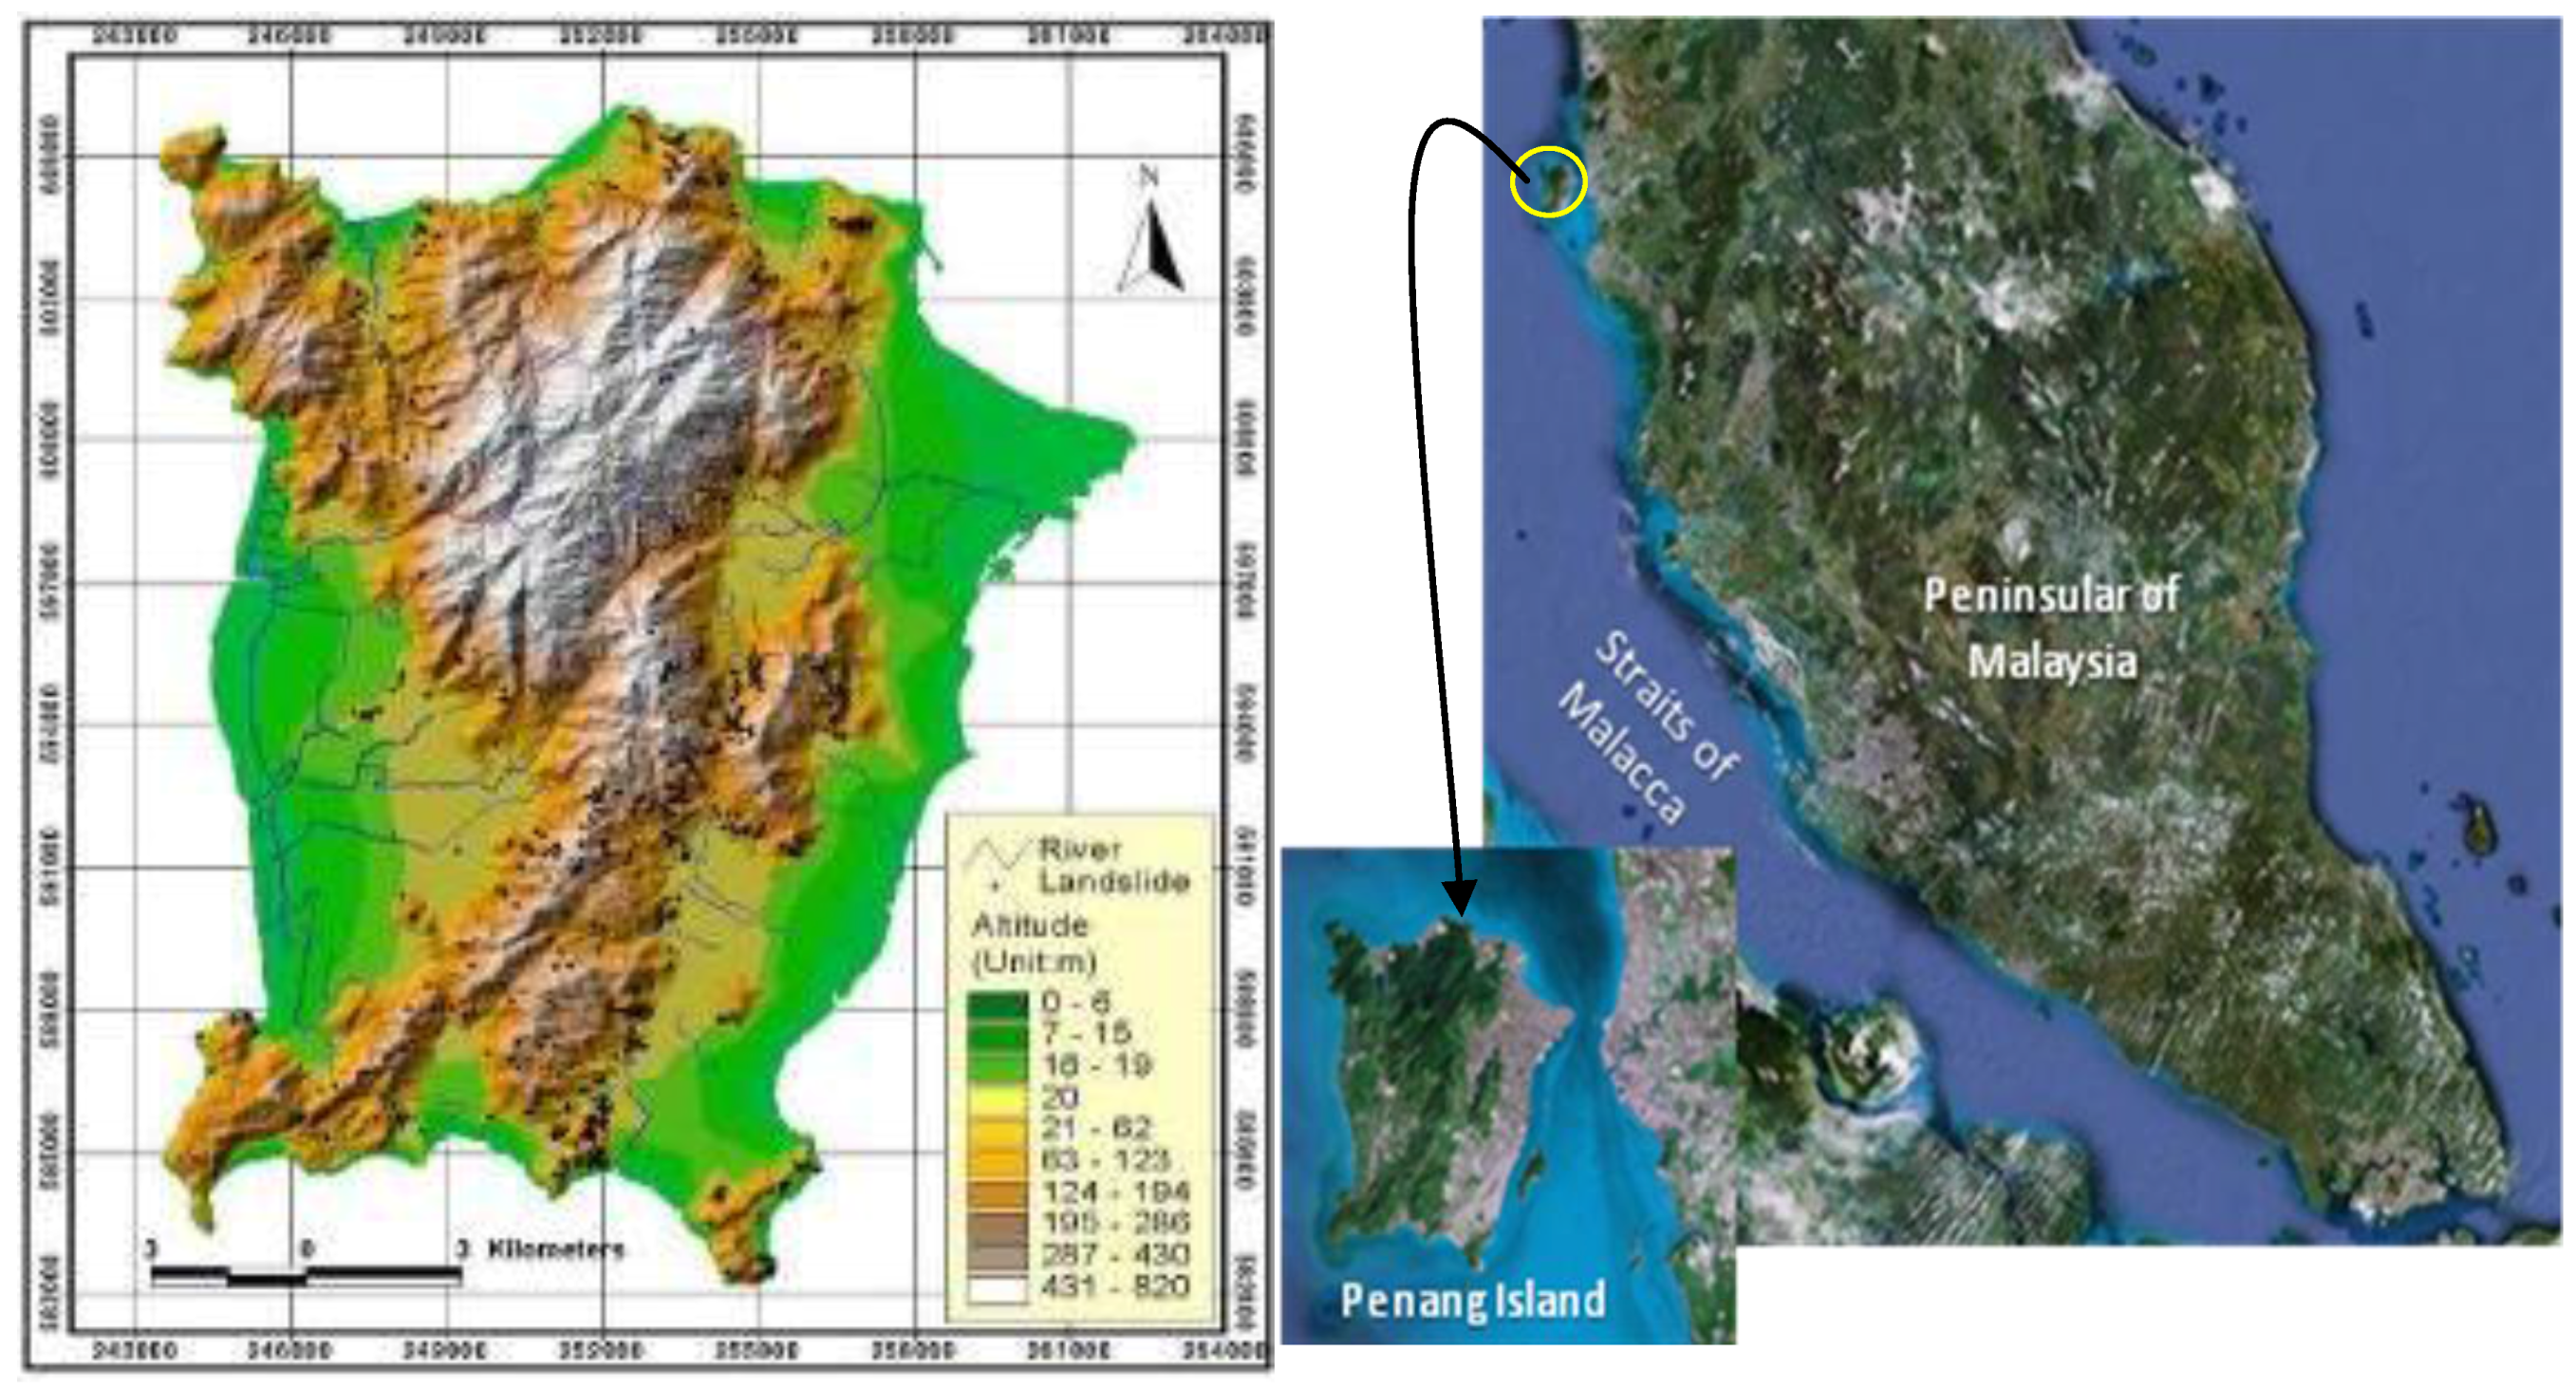
3. Case Study Area

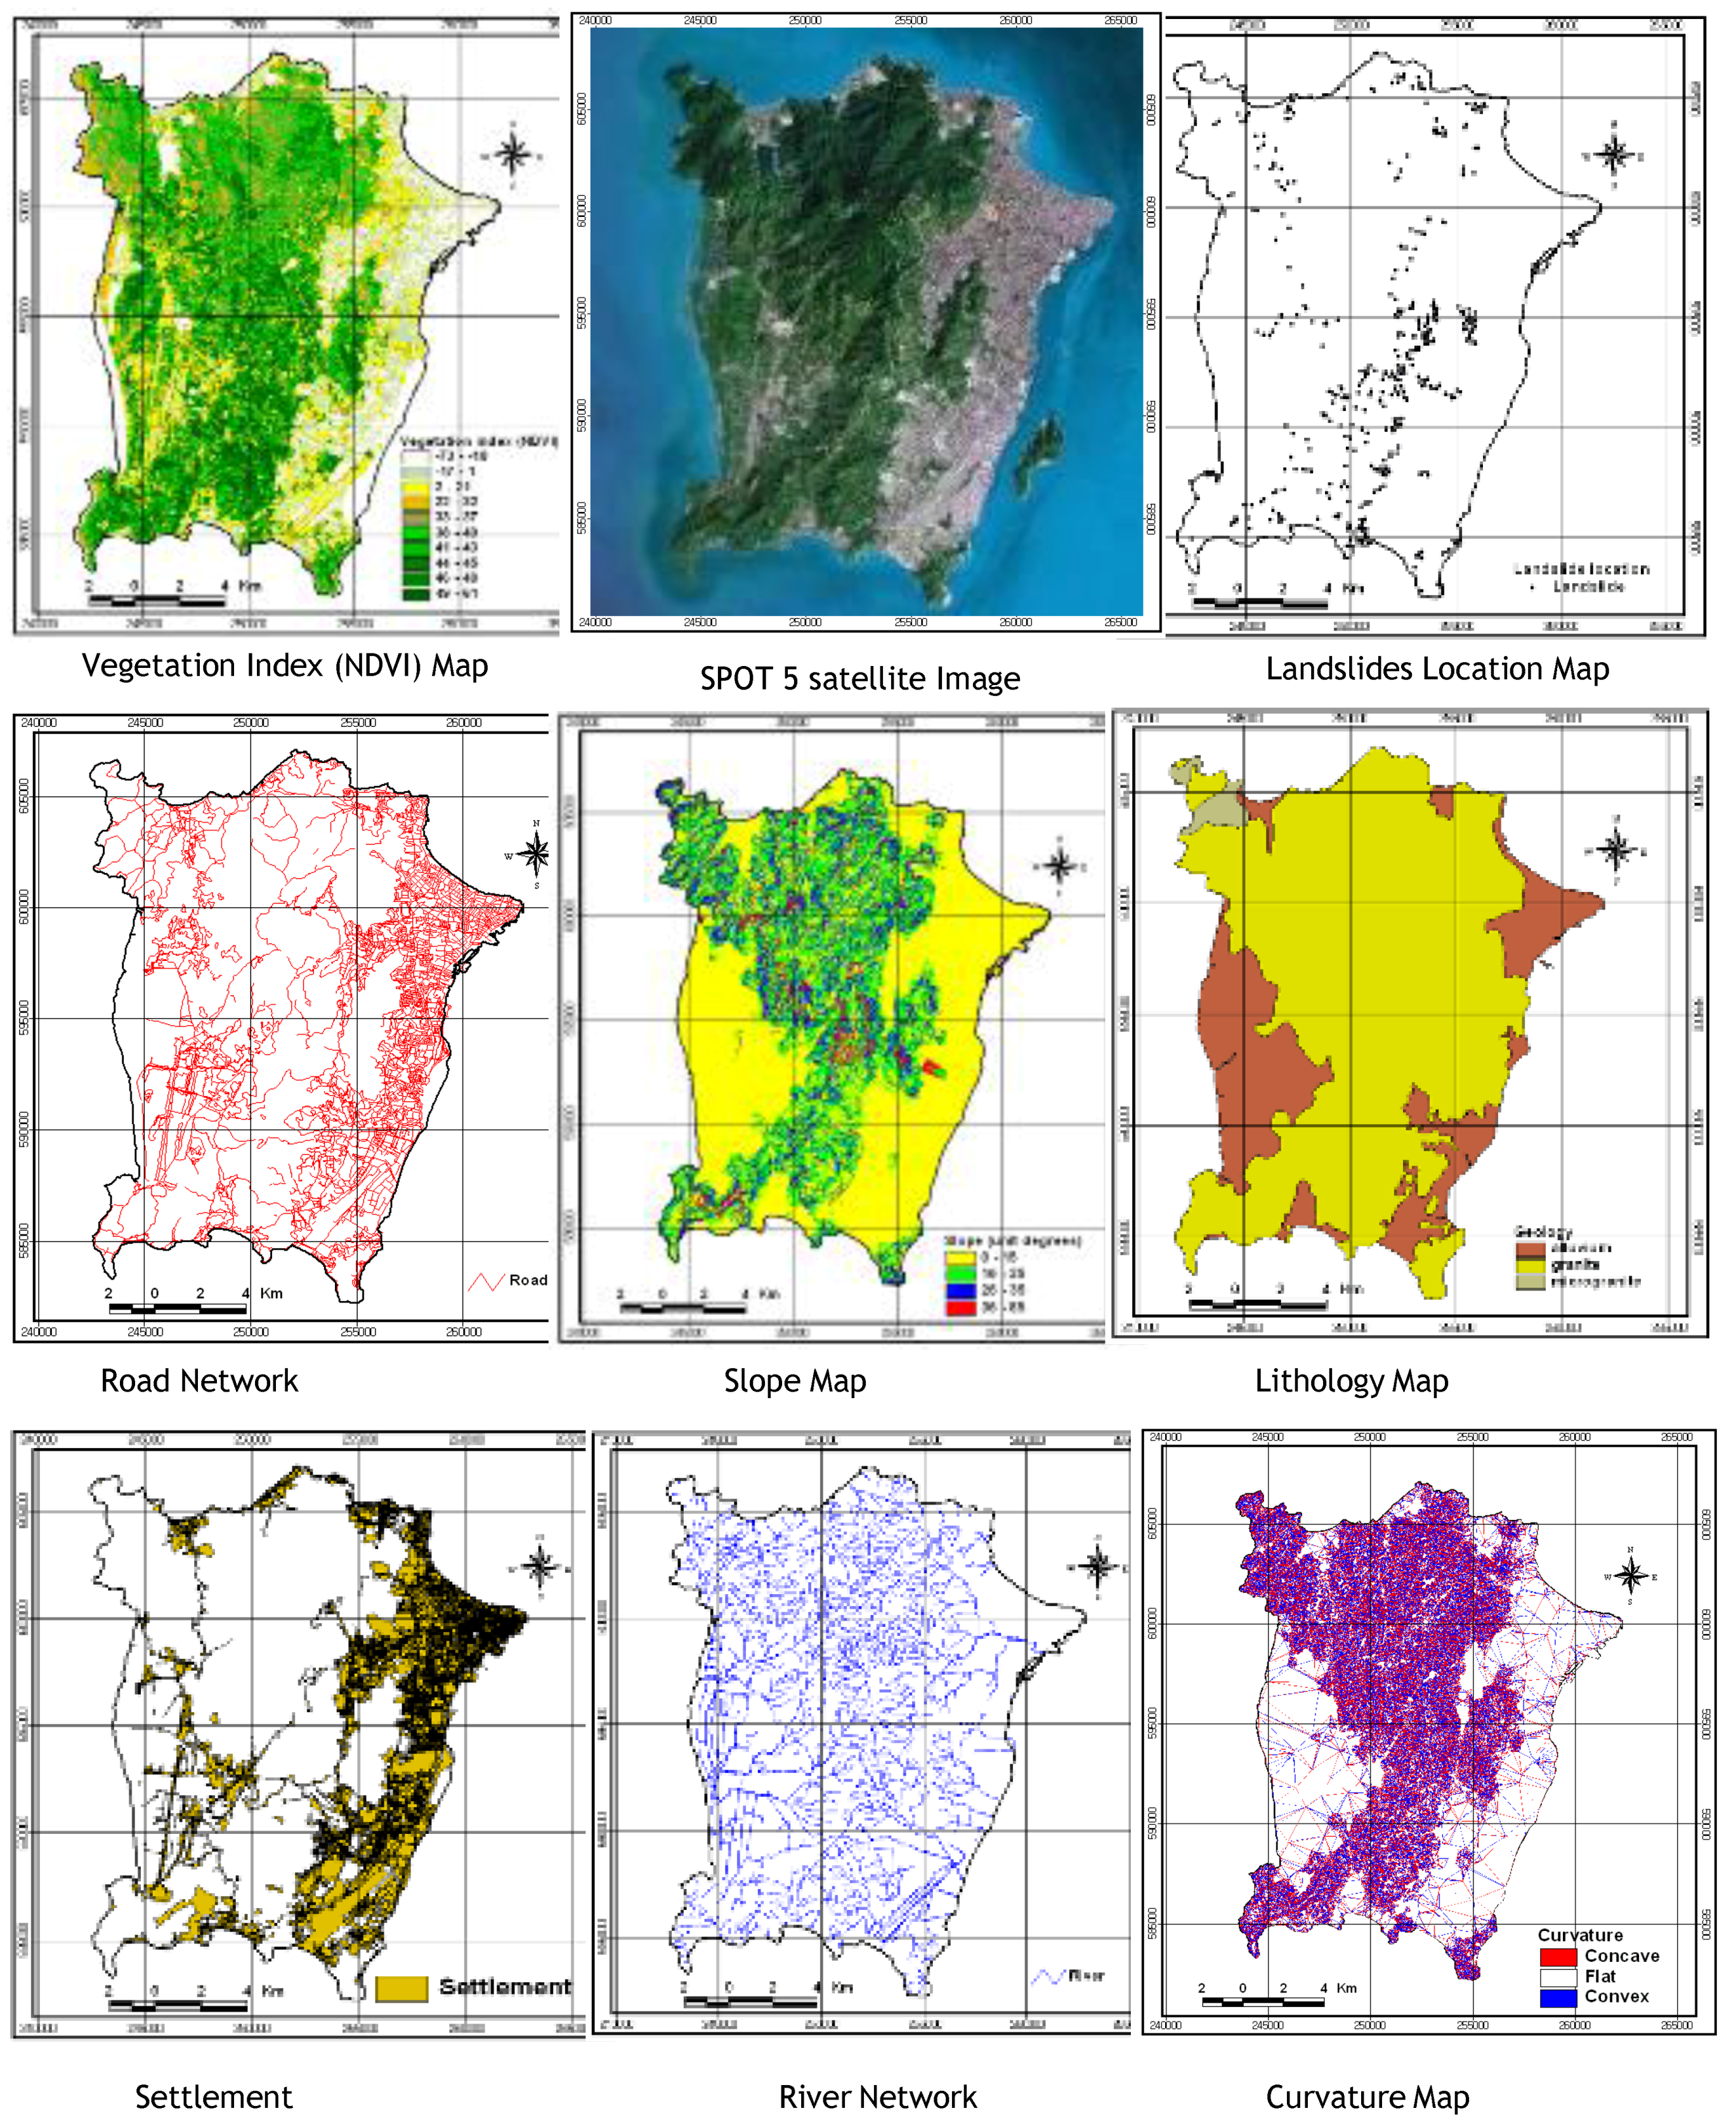
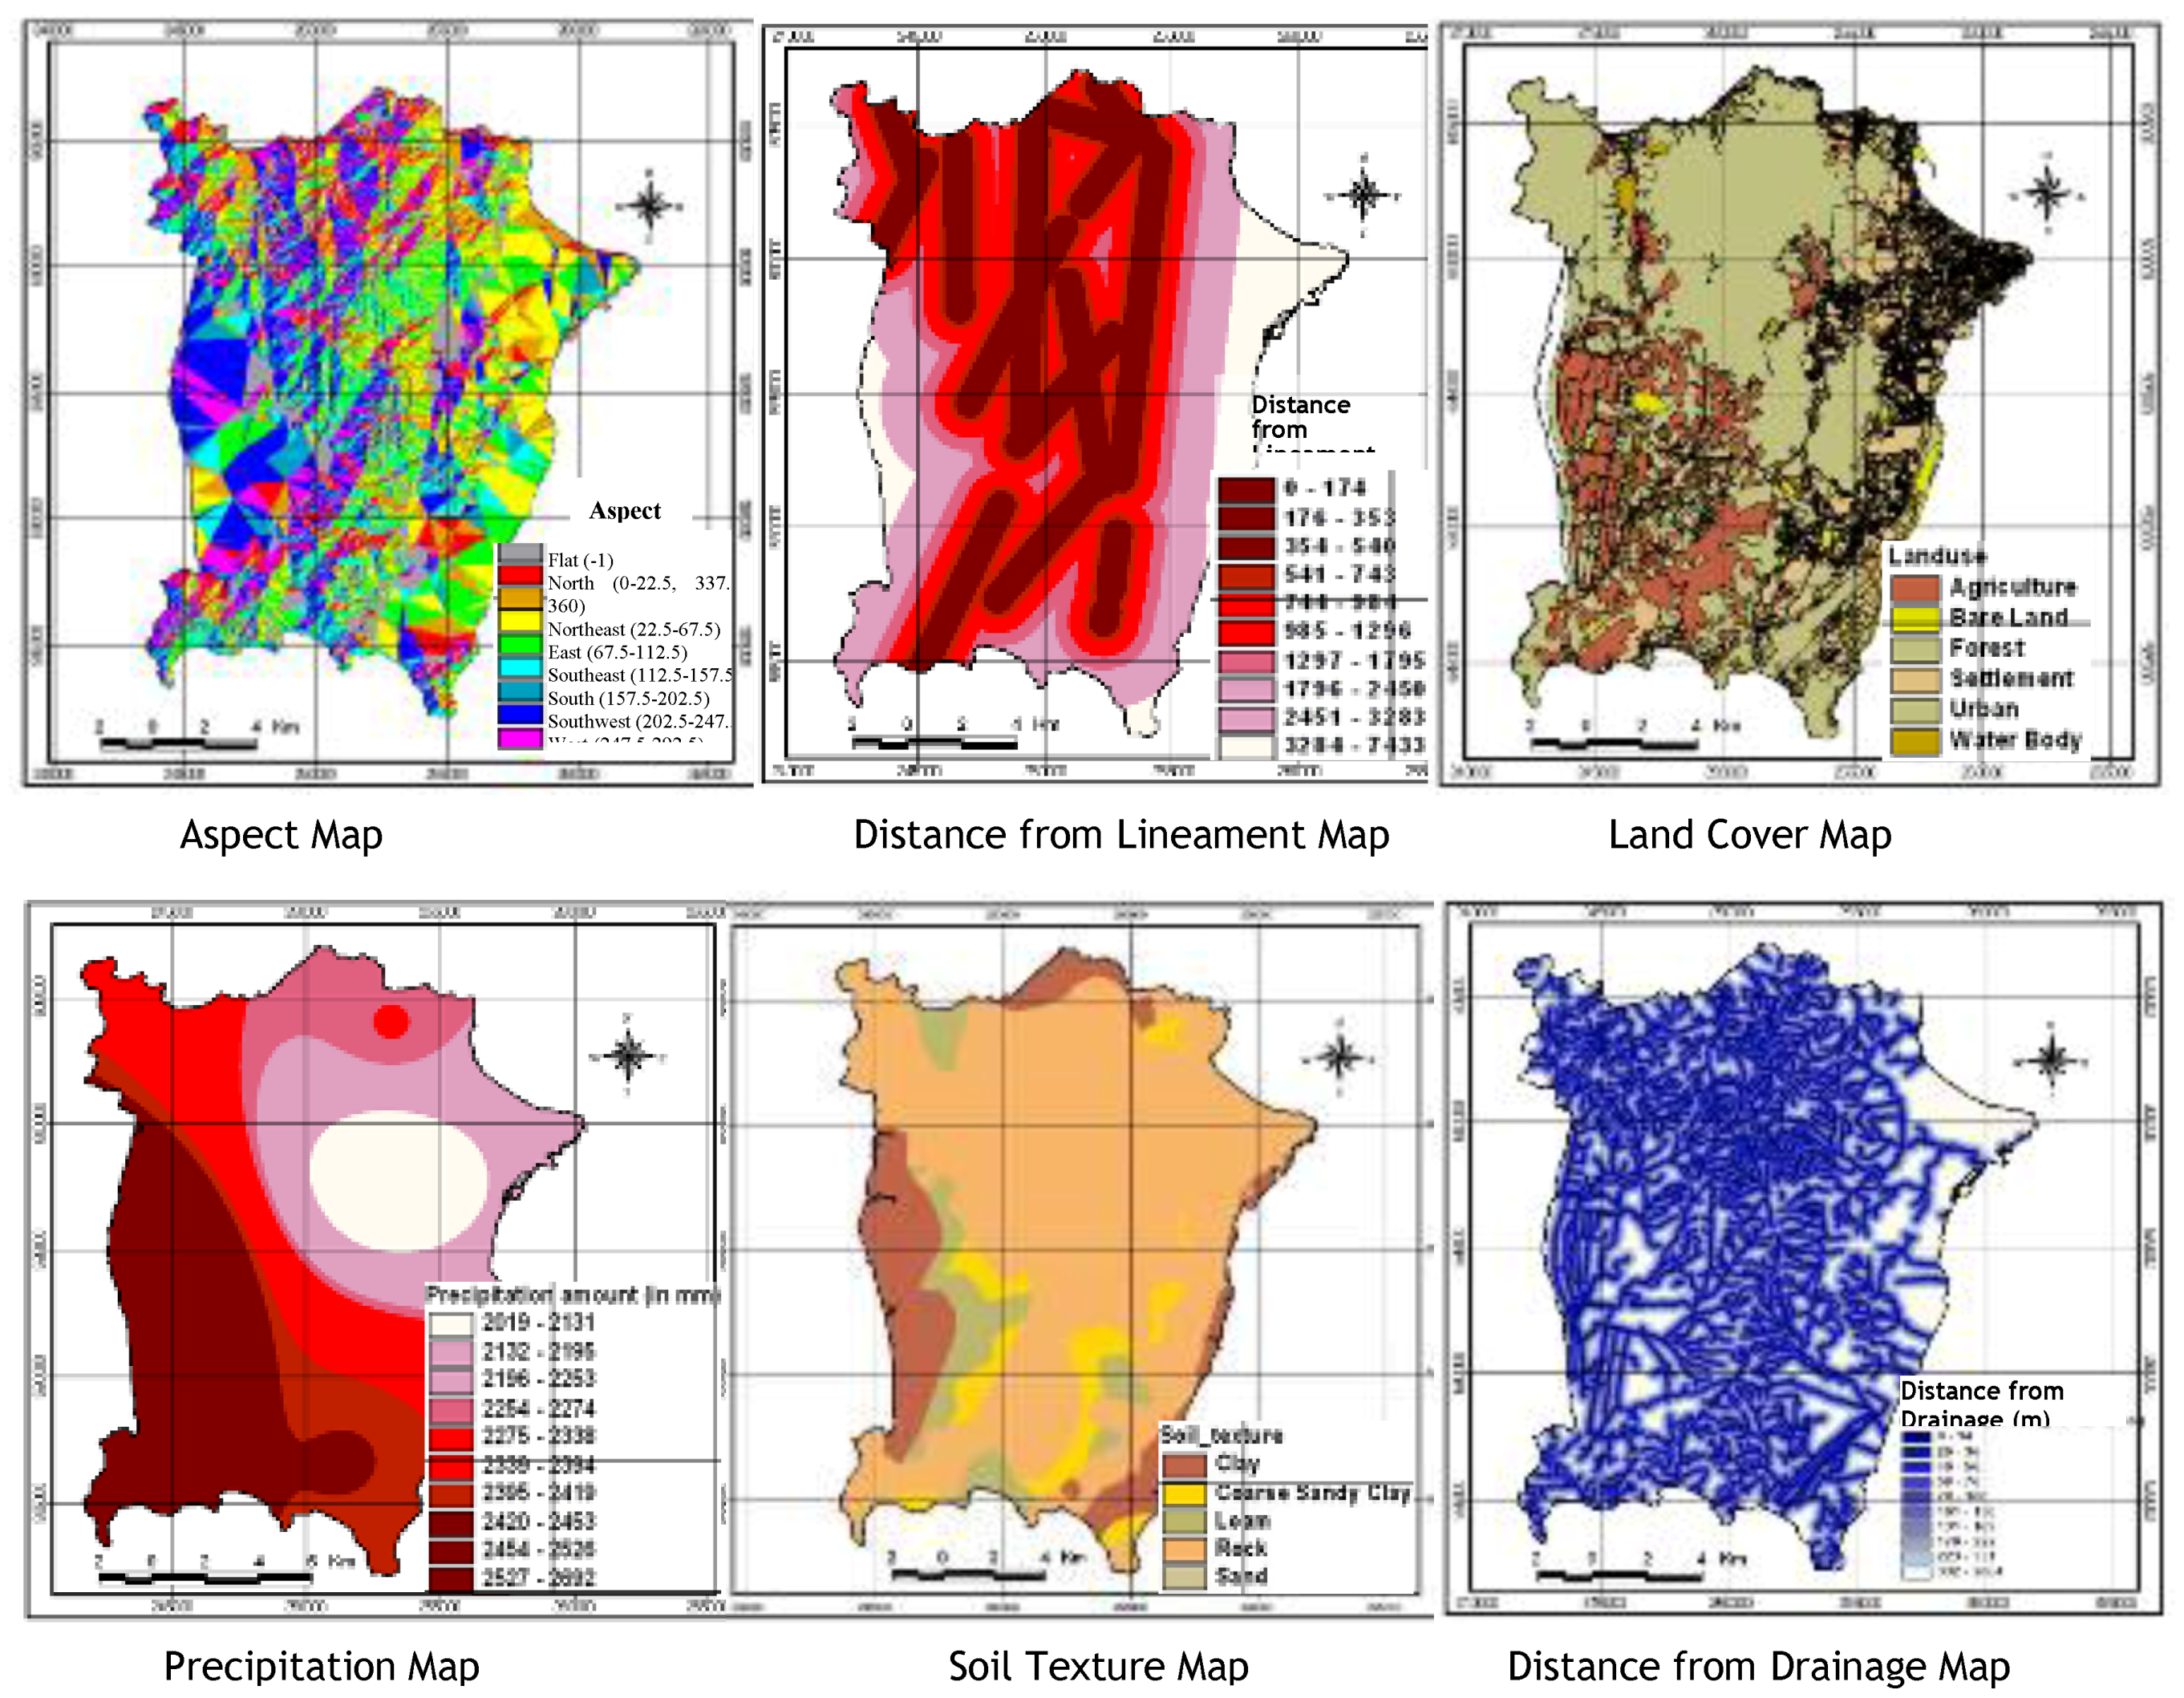
3.1. Input Data

| GIS Layer | Type | Format | Field Attribute | Description |
|---|---|---|---|---|
| Landslide location | Point | Vector | ID | Location of previous landslide hazards were mapped from the aerial photographs at the scale of 1:10,000–1:50, 000 |
| Slope | Grid | Raster | Value | Slope Angle in degrees extracted from topographic data; Scale 1:25,000 |
| Aspect | Grid | Raster | Value | Aspect direction extracted from topographic data; Scale 1:25,000 |
| Curvature | Grid | Raster | Value | Curvature value extracted from topographic data; Scale 1:25,000 |
| Distance from drainage | Grid | Raster | Value | Distance from drainage ; Scale 1:25,000 |
| Lithology | Polygon | Vector | Types | Litho types extracted from lithologyogy maps; Scale 1:63,300 |
| Lineament | Line | Vector | Length | Distance from lineaments extracted from topographic data; Scale 1:25,000 |
| Soil Type | Polygon | Vector | Type | Soil texture types extracted from soil map; Scale 1:100,000 |
| Land Use | Polygon | Vector | Type | Land use Types extracted from topographic and SPOT-5 data; Scale 10m×10m |
| NDVI | Grid | Raster | Value | Vegetation Index NDVI value from SPOT-5 data; Scale 10m×10m |
| Precipitation | Grid | Raster | Value | Precipitation (Historical Rainfall) amount; Scale 10m×10m |
| Transportation | Line | Vector | Type | Road networks, highways and railways extracted from topographic data; Scale 1:25,000 |
| Administrative Boundaries | Line | Vector | Length | Administrative areas extracted from topographic data; Scale 1:25,000 |
| Contour (DEM) | Grid | Raster | Value | Terrain elevation using 10-meter interval contours and survey base points extracted topographic maps; scale 1:25,000 |
| Settlement | Polygon | Vector | Type | Residential, public and administration buildings extracted from topographic data; Scale 1:25,000 |
| Population | Grid | Vector | Value | Population Densities Scale 1:25,000 data collected from statistic department. |
| Emergency Resources | Polygon | Vector | Type | Emergency and mitigation resource locations including: Fire Fighter Stations, Police Stations, Hospitals, Schools, Religious Centers, Town Halls/Cultural, Airports, Army Base, Stadium, Open Fields |


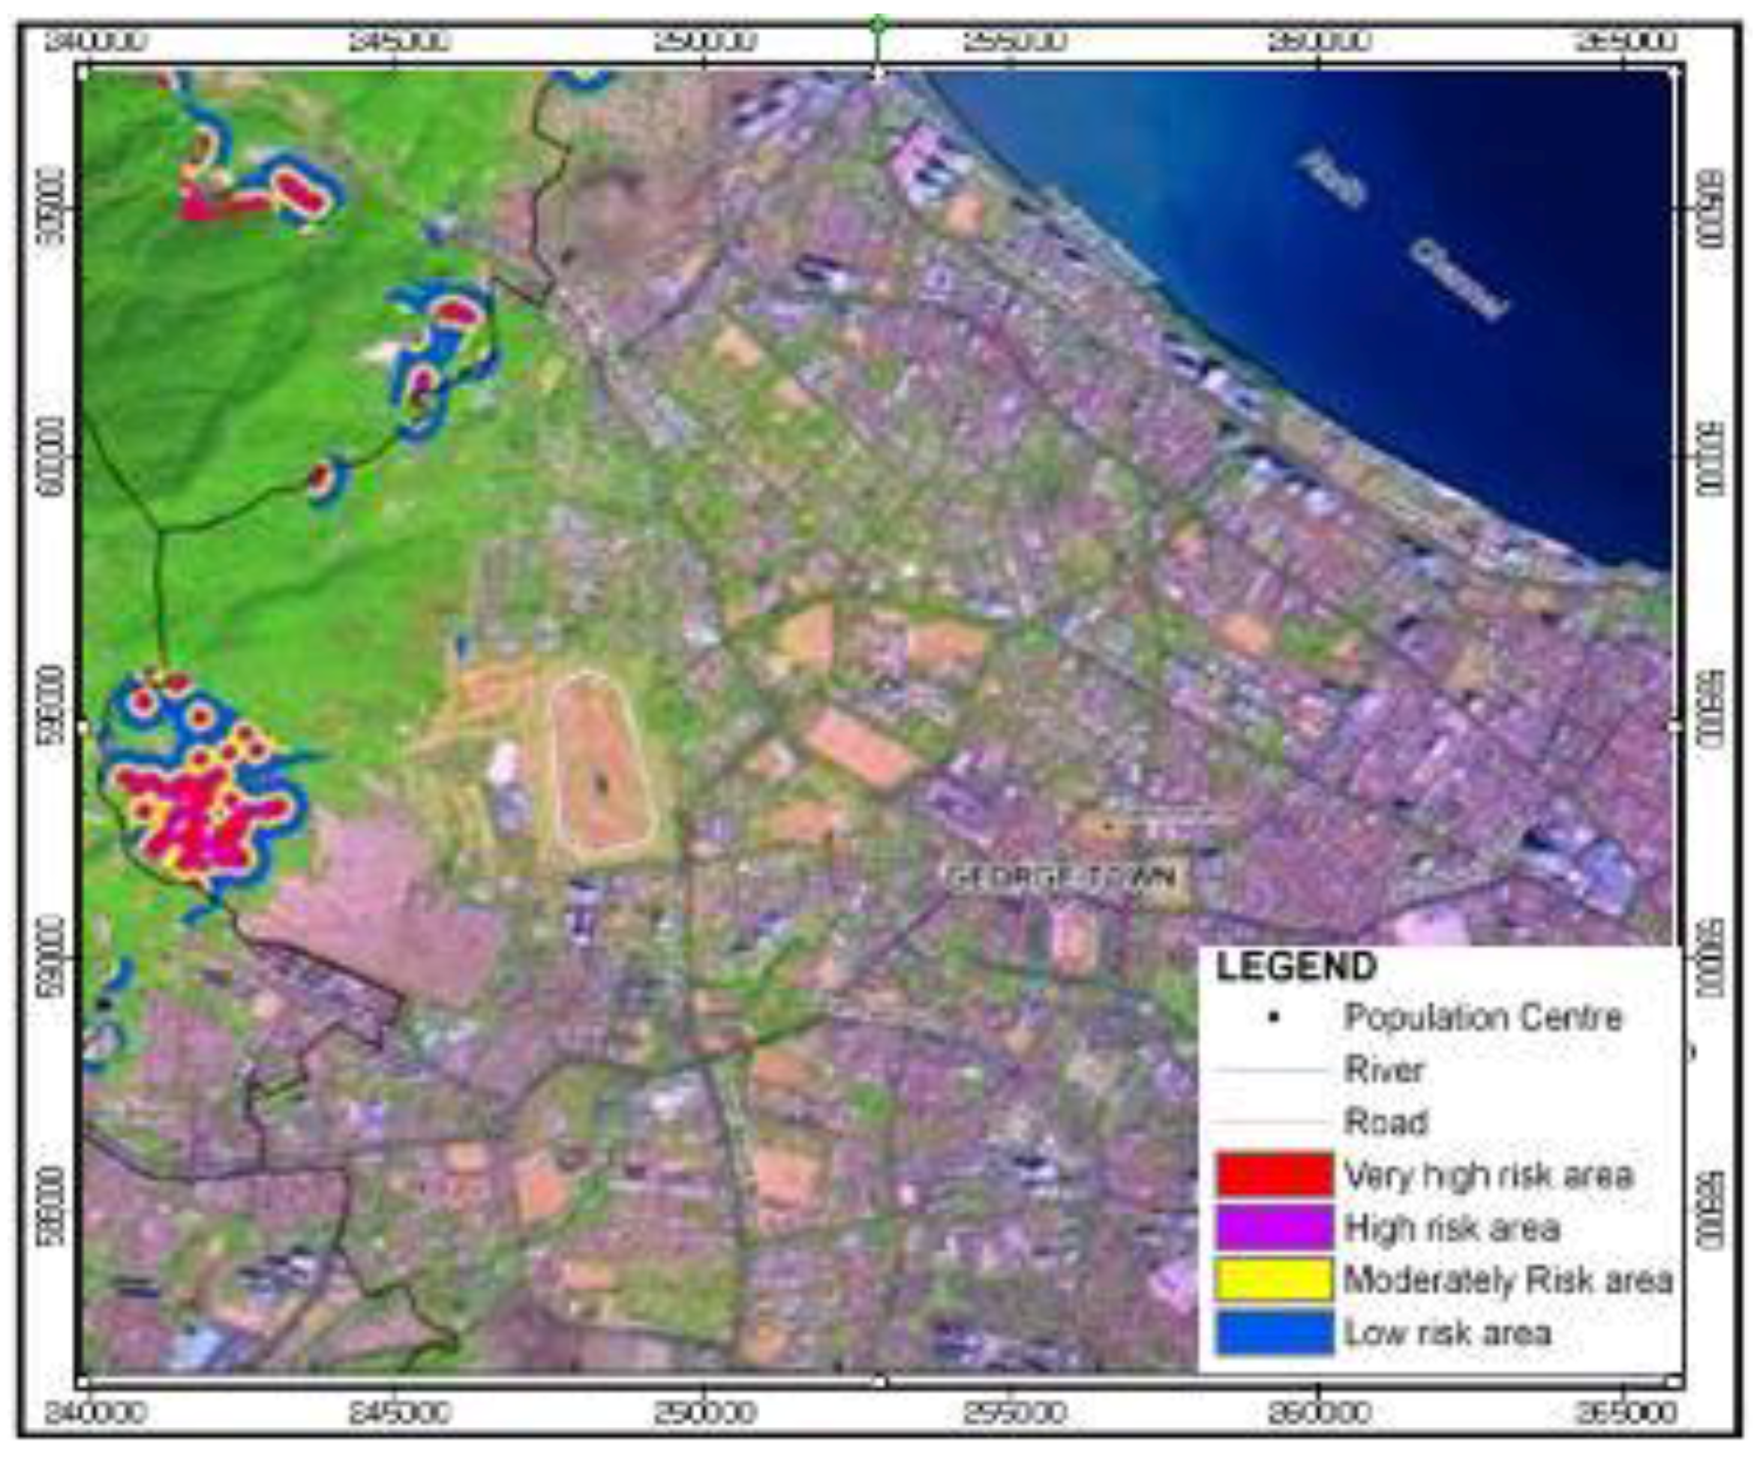
3.2 Landslide Disaster Model and Products
| Model/System | Thematic Layers/Input | Functionalities | |
| 1. | Landslide Hazard Map |
|
|
| 2. | Areas affected by Landslides |
|
|
| 3. | Landslide Risk Map |
|
|
| 4. | Improved Emergency Management |
|
|

| Command & Control System Components | Functionalities; Provide Tasks or Information About: |
| Alert Messages | Disaster Event, Danger And Warning Notification (SMS, Email, Portal) |
| Disaster Reports | Landslide Situational Awareness, Damage, Victim, Evacuation Information |
| Human Resources | Contact Person, Officers on Duty, Role & Responsibilities, Task Assigned, Directive & Feedback, Designation, etc. |
| Inventory | Availabilities, Request, Approval, Receive, Utilization, Allocation, Return, etc. |
| Support Center | Disaster Capacity, Location, Distribution, Type (Evacuation, Operation And Relief) |

4. Conclusions
Acknowledgements
References and Notes
- Soeters, R.; Van Westen, C.J. Slope instability recognition, analysis, and zonation. In Landslides, Investigation and Mitigation; Turner, A.K., Schuster, R.L., Eds.; Transportation Research Board Special Report 247; National Research Council: Washington, DC, USA, 1996; pp. 129–177. [Google Scholar]
- Harp, E.L.; Baum, R.L.; Wilson, R.C.; Laprade, W.T.; Conradi, K. Government-private partnership in mapping landslide hazards in Seattle, Washington. In Proceedings of Association of Engineering Geologists 41st Annual Meeting, Seattle, WA, USA, September 1998; p. 93.
- Baum, R.L.; Harp, E.L.; Hultman, W.A. Map Showing Recent and Historic Landslide Activity on Coastal Bluffs of Puget Sound between Shilshole Bay and Everett, Washington; US Geological Survey Miscellaneous Field Studies Map MF 2346; USGS: Denver, CO, USA, 2000.
- Schulz, W.H. Landslides Mapped Using LIDAR Imagery, Seattle, Washington; US Geological Survey Open-File Report 2004-1396 2004a; USGS: Seattle, WA, USA, 2004.
- Schulz, W.H. Landslide Mapping in Seattle, Washington Using LIDAR Imagery; US Geological Survey Open-File Report 2004-1396 2004b; USGS: Seattle, WA, USA, 2004.
- Godt, J.W. Observed and Modeled Conditions for Shallow Land Sliding in the Seattle, Washington, Area. Ph.D. Dissertation, University of Colorado, Boulder, CO, USA, 2004. [Google Scholar]
- Wu, T.H; Tang, W.H.; Einstein, H.H. Landslide hazard and risk assessment. In Landslides, Investigation and Mitigation; Turner, A.K., Schuster, R.L., Eds.; Transportation Research Board Special Report 247; National Research Council: Washington, DC, USA, 1996; pp. 106–118. [Google Scholar]
- Coe, J.A.; Michael, J.A.; Crovelli, R.A.; Savage, W.Z. Preliminary Map Showing Landslide Densities, Mean Recurrence Intervals, and Exceedance Probabilities as Determined from Historic Records, Seattle, Washington; US Geological Survey Open-File Report 2000 00-303; USGS: Seattle, WA, USA, 2000.
- Coe, J.A.; Michael, J.A.; Crovelli, R.A.; Savage, W.Z.; Laprade, W.T.; Nashem, W.D. Probabilistic assessment of precipitation-triggered landslides using historical records of landslide occurrence, Seattle, Washington. Environ. Eng. Geosci. 2004, 10, 103–122. [Google Scholar] [CrossRef]
- Baum, R.L.; Chleborad, A.F.; Schuster, R.L. Landslides Triggered by the December 1996 and January 1997 Storms in the Puget Sound Area, Washington; US Geological Survey Open-File Report 98-239; USGS: Seattle, WA, USA, 1998.
- Baum, R.L.; Godt, J.W.; Harp, E.L.; McKenna, J.P.; McMullen, S.R. Early warning of landslides for rail traffic between Seattle and Everett, Washington, USA. In Proceedings of the International Conference on Landslide Risk Assessment, Vancouver, BC, Canada, 2005.
- Chleborad, A.F. Preliminary Method for Anticipating the Occurrence of Precipitation-Induced Landslides in Seattle, Washington; US Geological Survey Open-File Report 00-0469; USGS: Seattle, WA, USA, 2000.
- Chleborad, A.F. Preliminary Evaluation of a Precipitation Threshold for Anticipating the Occurrence of Landslides in the Seattle, Washington, Area; US Geological Survey Open-File Report 03-463; USGS: Seattle, WA, USA, 2003.
- Arndt, B.P. Determination of the Conditions Necessary for Slope Failure of a Deep-Seated Landslide at Woodway. M.Eng. Thesis, Colorado School of Mines, Golden, CO, USA, 1999; p. 216. [Google Scholar]
- Savage, W.Z.; Baum, R.L.; Morrissey, M.M.; Arndt, B.P. Finite-Element Analysis of the Woodway Landslide, Washington; US Geological Survey Bulletin 2180; USGS: Denver, CO, USA, 2000.
- Baum, R.L.; Godt, J.W.; Highland, L. Landslides and Engineering Geology of the Seattle, Washington Area; Geological Society of America: Boulder, CO, USA, 2008; p. 181. [Google Scholar]
- Burns, S.F.; Burns, W.J.; James, D.H.; Hinkle, J.C. Landslides in Portland, Oregon Metropolitan Area Resulting from the Storm of February 1996: Inventory Map, Database, and Evaluation; METRO: Portland, OR, USA, 1998. [Google Scholar]
- Cornforth, D.H. Landslides in Practice Investigation, Analysis, and Remedial/Preventative Options in Soils; John Wiley & Sons, Inc.: Hoboken, NJ, USA, 2005. [Google Scholar]
- Hofmeister, R.J.; Miller, D.J.; Mills, K.A.; Hinkle, J.C.; Beier, A.E. GIS Overview of Potential Rapidly Moving Landslide Hazards in Western Oregon; Interpretative Map Series IMS-22; Department of Geology and Mineral Industries: Portland, OR, USA, 2002. [Google Scholar]
- Skaugset, A.; Robison, G.E.; Mills, K.A.; Paul, P.E.; Dent, L. Storm Impacts and Landslides of 1996: Final Report; Forest Practices Technical Report Number 4; Forest Practices Monitoring Program, Oregon Department of Forestry: Salem, OR, USA, 1999. [Google Scholar]
- Wold, R.L.; Jochim, C.L. Landslide Loss Reduction: A Guide for State and Local Government Planning; Open-File Report 1995, 0-95-8; Department of Geology and Mineral Industries: Los Angeles, CA, USA, 1995. [Google Scholar]
- Pack, R.T.; Tarboton, D.G.; Goodwin, C.N. SINMAP—A Stability Index Approach to Terrain Stability Hazard Mapping—Users Manual; Utah State University: Logan, UT, USA, 1997; Available online: http://www.fs.fed.us/informs/sinmap/sinmap_users_guide.pdf (accessed on 12 August 2010).
- Pack, R.T.; Tarboton, D.G.; Goodwin, C.N. The SINMAP approach to terrain stability mapping. In The 8th Congress of the International Association of Engineering Geology; Vancouver, BC, Canada, 1998. [Google Scholar]
- Dianne, L.B.; Mark, E.R. Modeling 3-D Slope Stability of Coastal Bluffs Using 3-D Ground-Water Flow, Southwestern Seattle, Washington; US Geological Survey Scientific Investigations Report 2007-5092; USGS: Seattle, WA, USA, 2007.
- Dianne, L.B.; Mark, E.R. Assessing deep seated landslide susceptibility using 3-D groundwater and slope-stability analysis, southwestern Seattle, Washington. Reviews Eng. Geol. 2008, 20, 83–101. [Google Scholar]
- Schilling, S.P. LAHARZ: GIS Programs for Automated Mapping of Lahar-Inundation Hazard Zones; US Geological Survey Open-File Report 98-638; USGS: Seattle, WA, USA, 1998.
- Schilling, S.P.; Griswold, J.P.; Iverson, R.M. Using LAHARZ to Forecast Inundation from lahars, debris flows, and rock avalanches: Confidence limits on prediction. In Proceedings of American Geophysical Union, Fall Meeting, San Francisco, CA, USA; 2008. [Google Scholar]
- Friele, P.; Jakob, M.; Clague, J.J. Hazard and risk from large landslides from Mount Meager Volcano, British Columbia, Canada. Georisk 2008, 2, 48–64. [Google Scholar] [CrossRef]
- Hewitt, K.; Clague, J.J.; Orwin, J.F. Legacies of catastrophic rock slope failures in mountain landscapes. Earth-Sci. Review. 2008, 87, 1–38. [Google Scholar] [CrossRef]
- McKillop, R.J.; Clague, J.J. Statistical, remote sensing-based approach for estimating the probability of catastrophic drainage from moraine-dammed lakes in southwestern British Columbia. Glob. Planet. Change 2007, 56, 153–171. [Google Scholar] [CrossRef]
- Clague, J.J. Tsunamis. In A Synthesis of Geological Hazards in Canada; Brooks, G.R., Ed.; Bulletin 548; Geological Survey of Canada: Ottawa, ON, Canada, 2001; pp. 27–42. [Google Scholar]
- Clague, J.J.; Evans, S.G. Geologic framework of large historic landslides in Thompson River valley, British Columbia. Environ. Eng. Geosci. 2003, 9, 201–212. [Google Scholar] [CrossRef]
- Fauziah, A.; Ahmad, S.Y.; Mohd, A.F. Characterization and geotechnical properties of penang residual soils with emphasis on landslides. Amer. J. Environ. Sci. 2006, 2, 121–128. [Google Scholar]
- The Climate of Malaysia; National Environmental Agency, Government of Singapore: Singapore, Year? Available online: http://app2.nea.gov.sg/asiacities_malaysia.aspx (accessed on 12 August 2010).
- Lee, S.; Pradhan, B. Probabilistic landslide hazards and risk mapping on Penang Island, Malaysia. Earth Syst. Sci. 2006, 115, 661–672. [Google Scholar] [CrossRef]
- Mehrnoosh, J.; Helmi, Z.M.S.; Mansor, S.B.; Mohammad, S.; Saeid, P. Landslide susceptibility evaluation and factor effect analysis using probabilistic-frequency ratio model. Eur. J. Scientific Res. 2009, 33, 654–668. [Google Scholar]
- Pradhan, B.; Lee, S. Delineation of landslide hazard areas on Penang Island, Malaysia, by using frequency ratio, logistic regression, and artificial neural network models. Environ. Earth Sci. 2010, 60, 1037–1054. [Google Scholar] [CrossRef]
© 2010 by the authors; licensee MDPI, Basel, Switzerland. This article is an open access article distributed under the terms and conditions of the Creative Commons Attribution license (http://creativecommons.org/licenses/by/3.0/).
Share and Cite
Assilzadeh, H.; Levy, J.K.; Wang, X. Landslide Catastrophes and Disaster Risk Reduction: A GIS Framework for Landslide Prevention and Management. Remote Sens. 2010, 2, 2259-2273. https://doi.org/10.3390/rs2092259
Assilzadeh H, Levy JK, Wang X. Landslide Catastrophes and Disaster Risk Reduction: A GIS Framework for Landslide Prevention and Management. Remote Sensing. 2010; 2(9):2259-2273. https://doi.org/10.3390/rs2092259
Chicago/Turabian StyleAssilzadeh, Hamid, Jason K. Levy, and Xin Wang. 2010. "Landslide Catastrophes and Disaster Risk Reduction: A GIS Framework for Landslide Prevention and Management" Remote Sensing 2, no. 9: 2259-2273. https://doi.org/10.3390/rs2092259
APA StyleAssilzadeh, H., Levy, J. K., & Wang, X. (2010). Landslide Catastrophes and Disaster Risk Reduction: A GIS Framework for Landslide Prevention and Management. Remote Sensing, 2(9), 2259-2273. https://doi.org/10.3390/rs2092259