Assessment of Light Environment Variability in Broadleaved Forest Canopies Using Terrestrial Laser Scanning

Abstract
:
1. Introduction
2. Study Site
3. Materials and Methods
3.1. Structure Data Acquisition
3.2. Data Pre-Processing
- (i)
- Transformation of the LiDAR data from a polar to a Cartesian coordinate system.
- (ii)
- Registration of the separate datasets per measurement plot to one central coordinate system, enabling the merging of the datasets into a comprehensive scan of the 3D scene with minimal shadowing effect [16].
- (iii)
- Transformation of vector data to raster data with cubic voxels. The 3D space, considered with a ground surface of 30 m × 30 m and a height of 25 m, was subdivided into cubic voxels of 0.1 m × 0.1 m × 0.1 m (i.e., ‘small’ voxels). This resulted in arrays of 300 × 300 × 250 voxels. The voxel size was set at 0.1 m to obtain sufficient detail and to avoid the use of a statistical description of the leaf distribution, as the voxel size resembles the actual leaf size. All laser beams emitted from the different measurement positions were traced through the voxel array representing the forest stand. Following the methodology of [14], the voxels were characterized depending on beam/voxel interaction. Voxels with at least one intercepted laser beam were given the attribute F (filled). Attribute E (empty) was assigned to voxels that were intersected by laser beams without interception. Attribute X (no data) was granted to voxels that were not touched by any laser beam. While the diamond setup was used to minimize the amount of voxels with attribute X, shadowing is always present when dealing with a first return laser scanner. To obtain an accurate and complete structure description of the canopy from LiDAR datasets, these ‘X’ voxels needed to be given an attribute F or E. 1,000 small voxels were grouped into large voxels of 1 m × 1 m × 1 m. For each of these large voxels, the contact frequency (CF) was calculated. The CF can be defined as the proportion of filled voxels (F) to the measured voxels (F + E). For each large voxel of 1,000 small voxels, a proportion of ‘X’ voxels equal to the calculated CF was given attribute F. These ‘X’ voxels were chosen randomly in the large voxel.
- (iv)
- Differentiating voxels representing stem material from voxels filled with leaves by using a specially developed ‘stem locator’ algorithm. The algorithm is based on the density distributions of vertically projected leaf/beam intersections. As stems are characterized by a strong vertical structure, one can assume that the vertical organization of the laser hits reflected by stems will form dense clusters in the horizontal projection, thus revealing the stem positions. A cone with its base, height, and taper equal to the mean characteristics of the stems of the considered forest plots is positioned at each of the determined stem locations. Voxels contained in this cone are identified as ‘stem’ voxels and the remaining voxels as ‘leaf’ voxels.
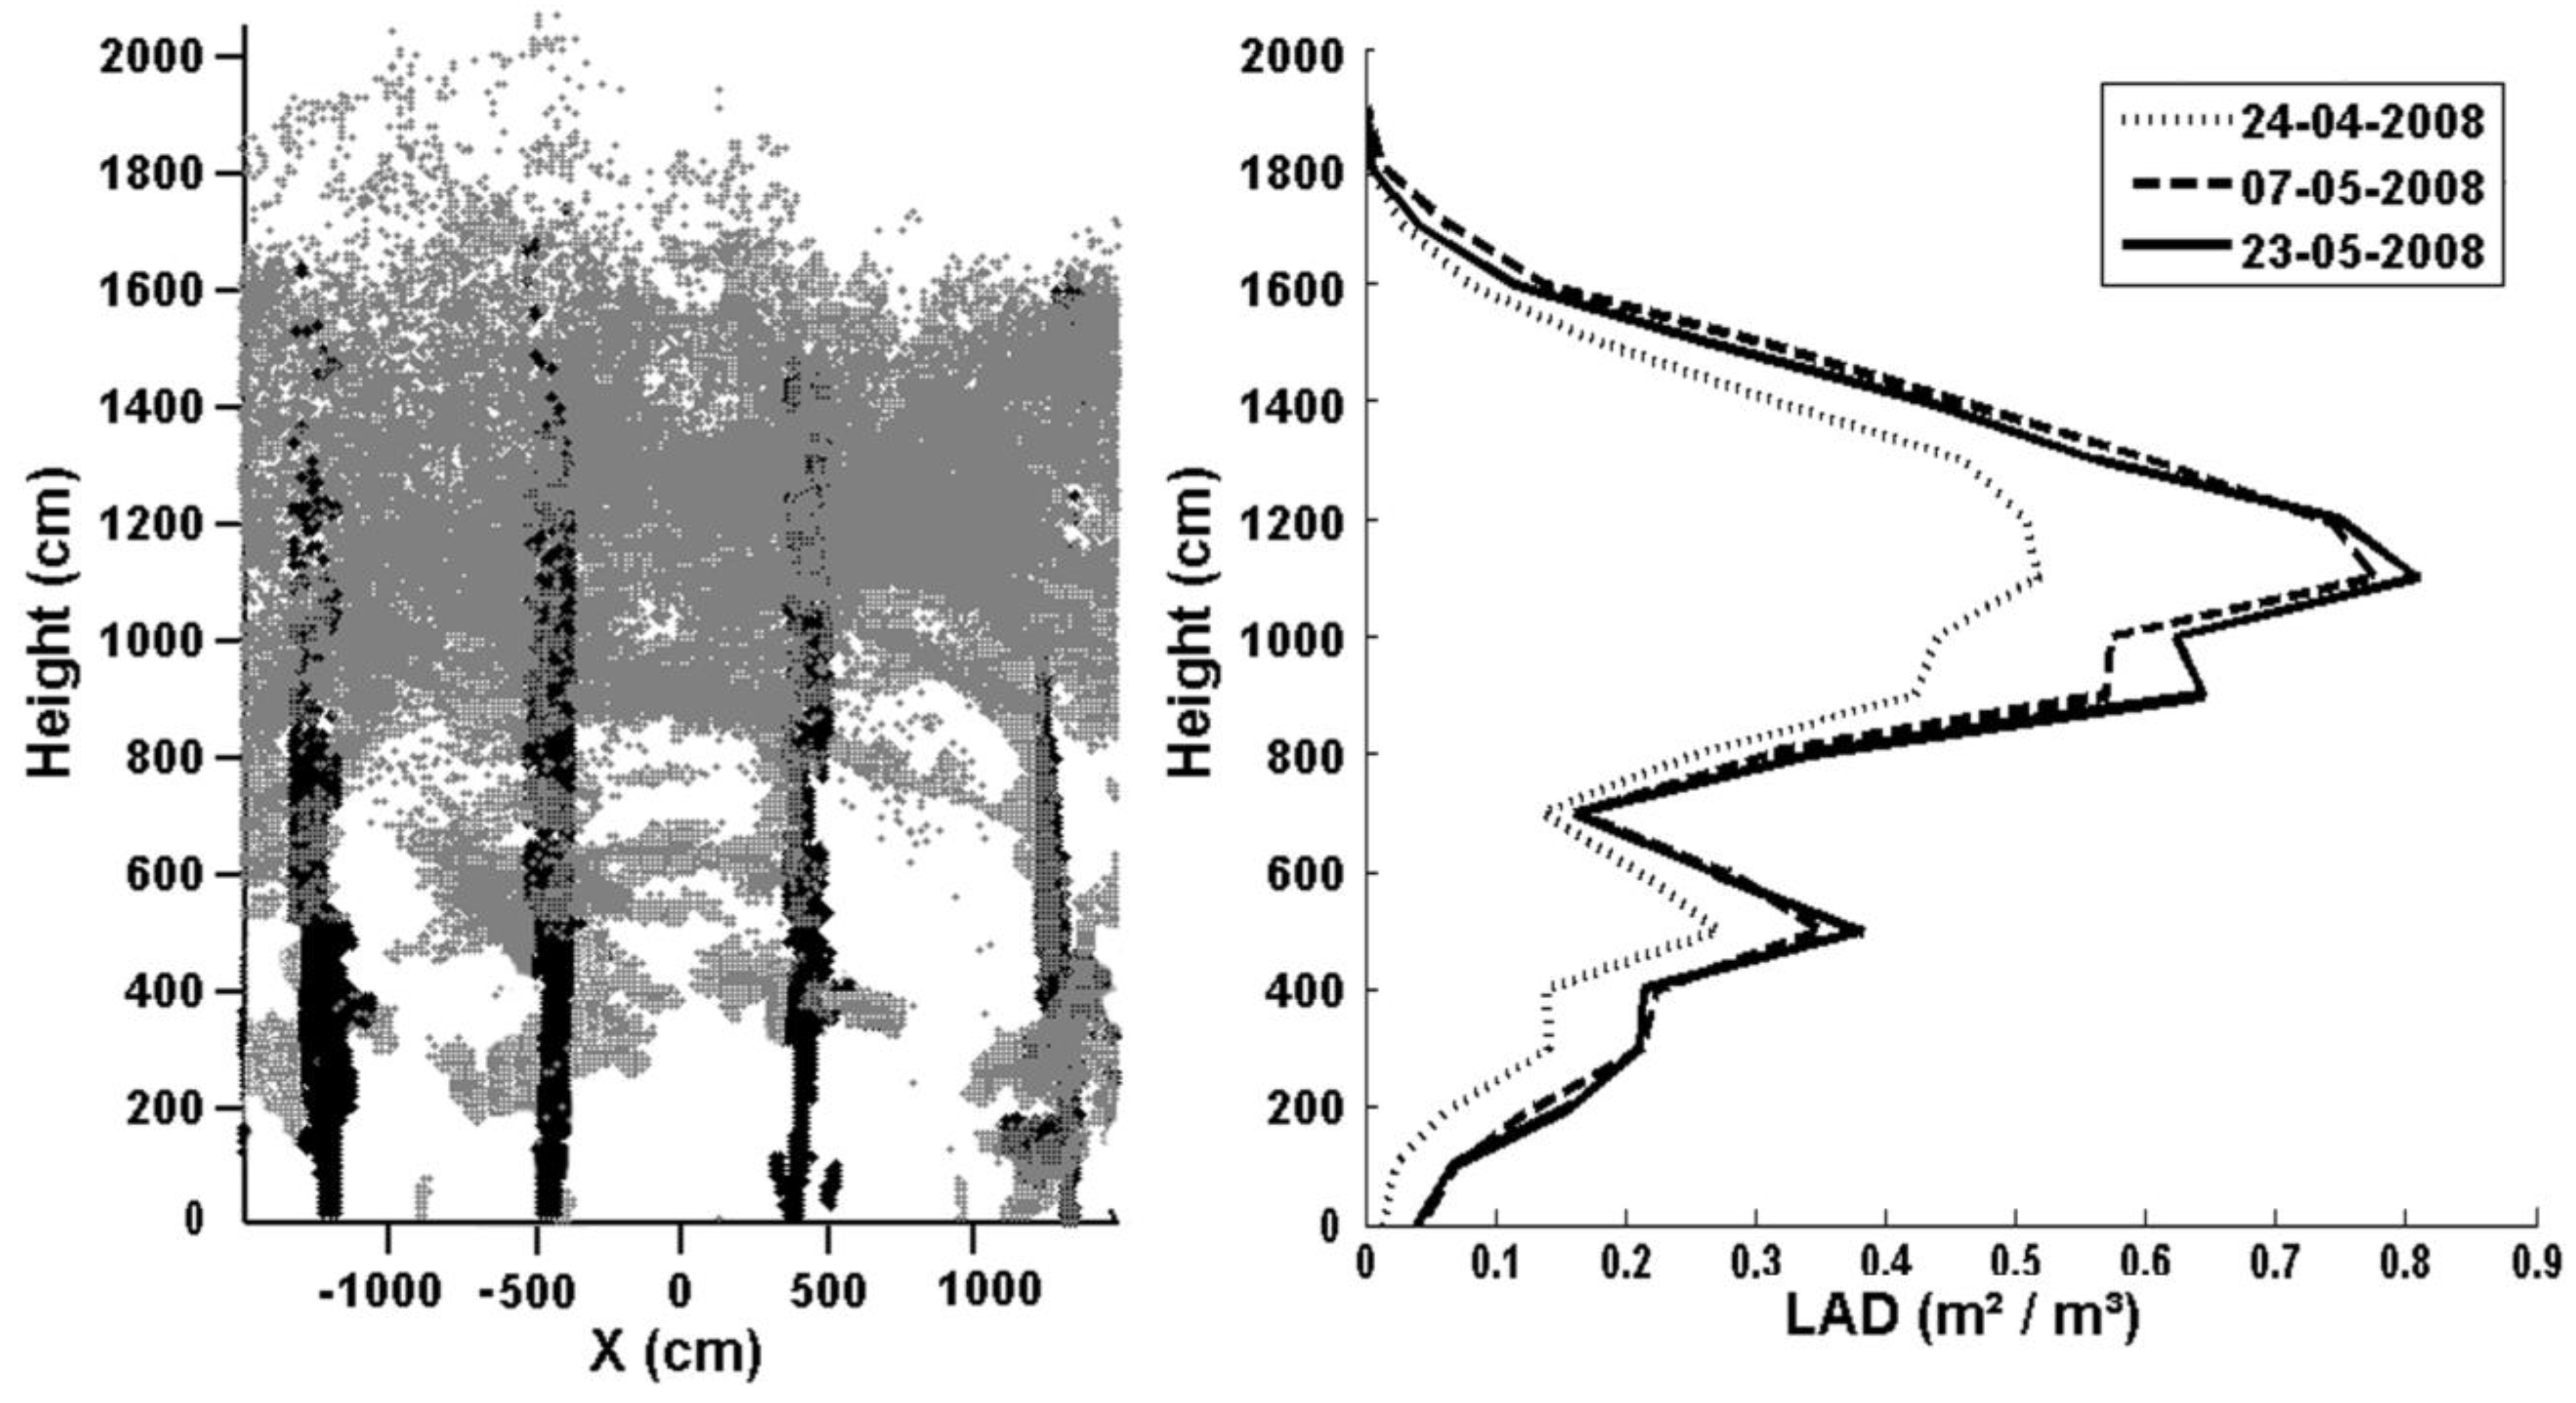
3.3. Leaf Area Distribution (LAD)
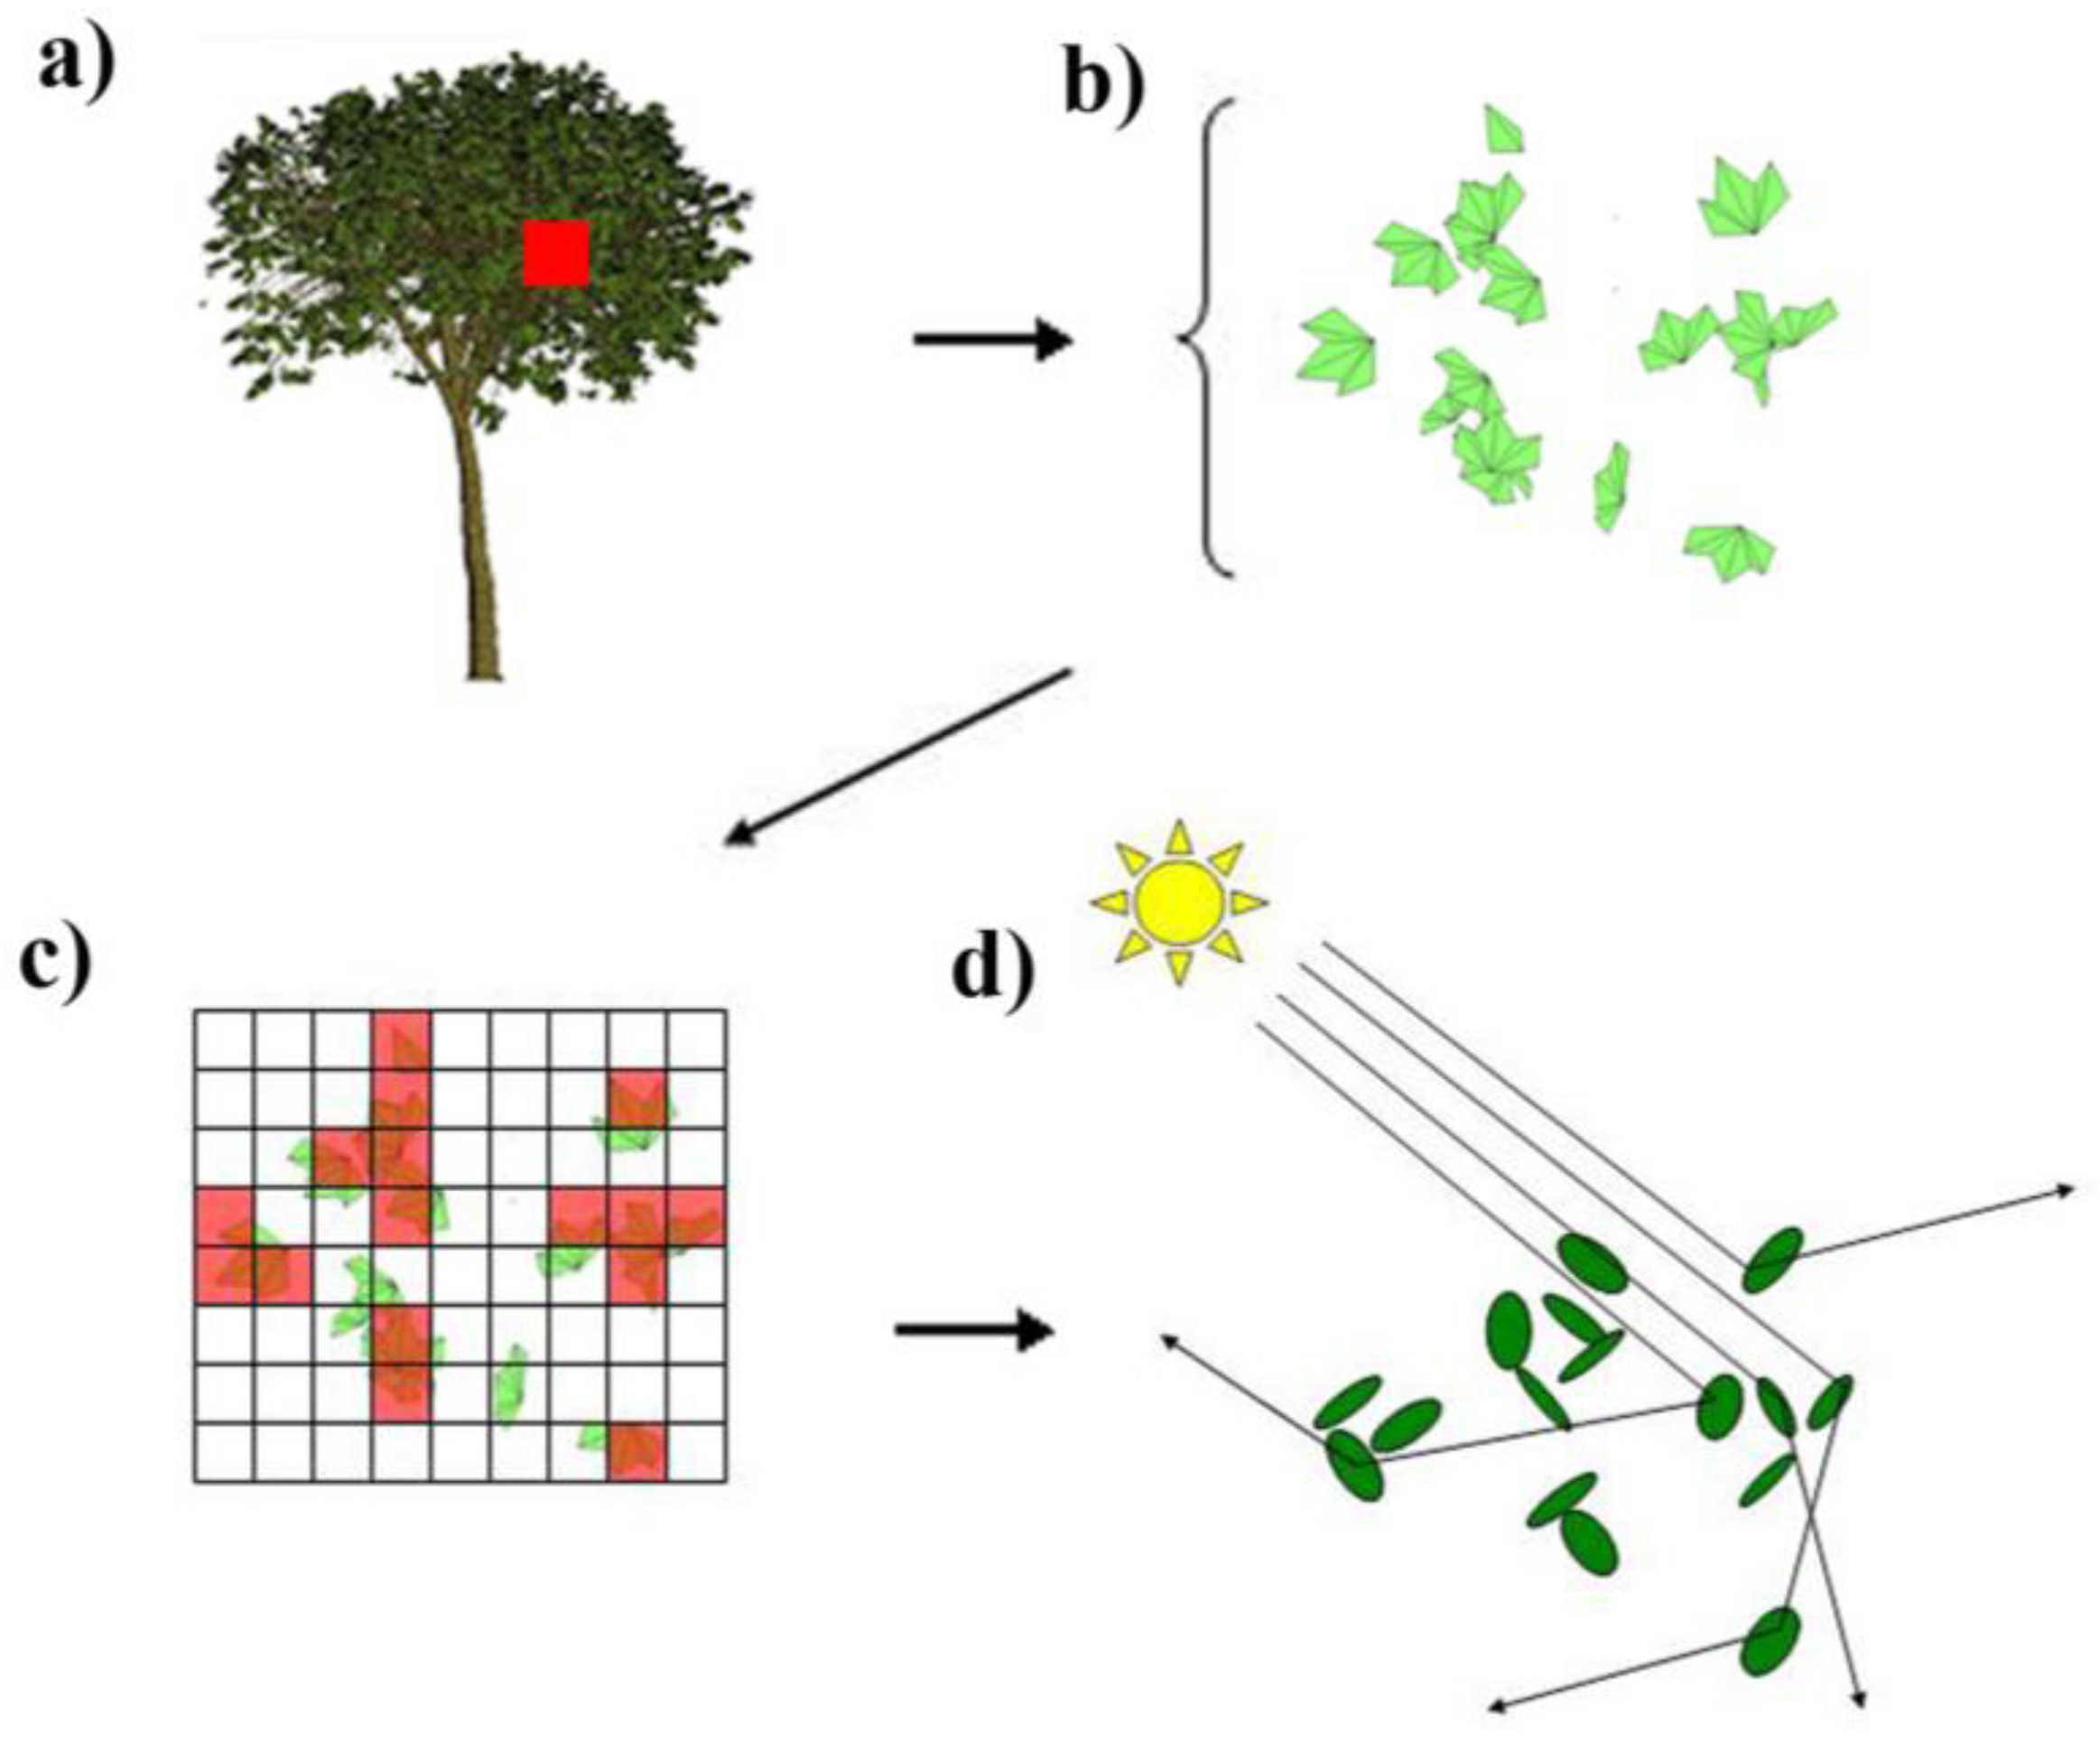
3.4. Voxel-based Light Interception Model (VLIM)

4. Results and Discussion
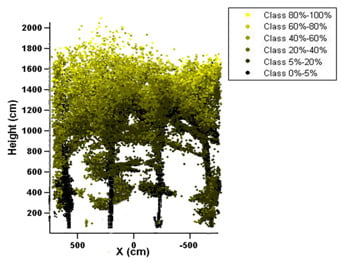
4.1. 3D Canopy Representation

| plot | date 1 -TLS- | date 1 -HEM- | date2 -TLS- | date 2 -HEM- | date 3 -TLS- | date 3 -HEM- |
|---|---|---|---|---|---|---|
| 1 | 2.91 | 1.15 | 4.87 | 3.36 | 5.53 | 3.43 |
| 2 | 3.18 | 1.28 | 4.78 | 3.25 | 4.95 | 3.27 |
| 3 | 3.11 | 1.17 | 5.36 | 3.81 | 5.68 | 3.64 |
| 4 | 3.31 | 1.77 | 4.74 | 3.31 | 5.36 | 3.34 |
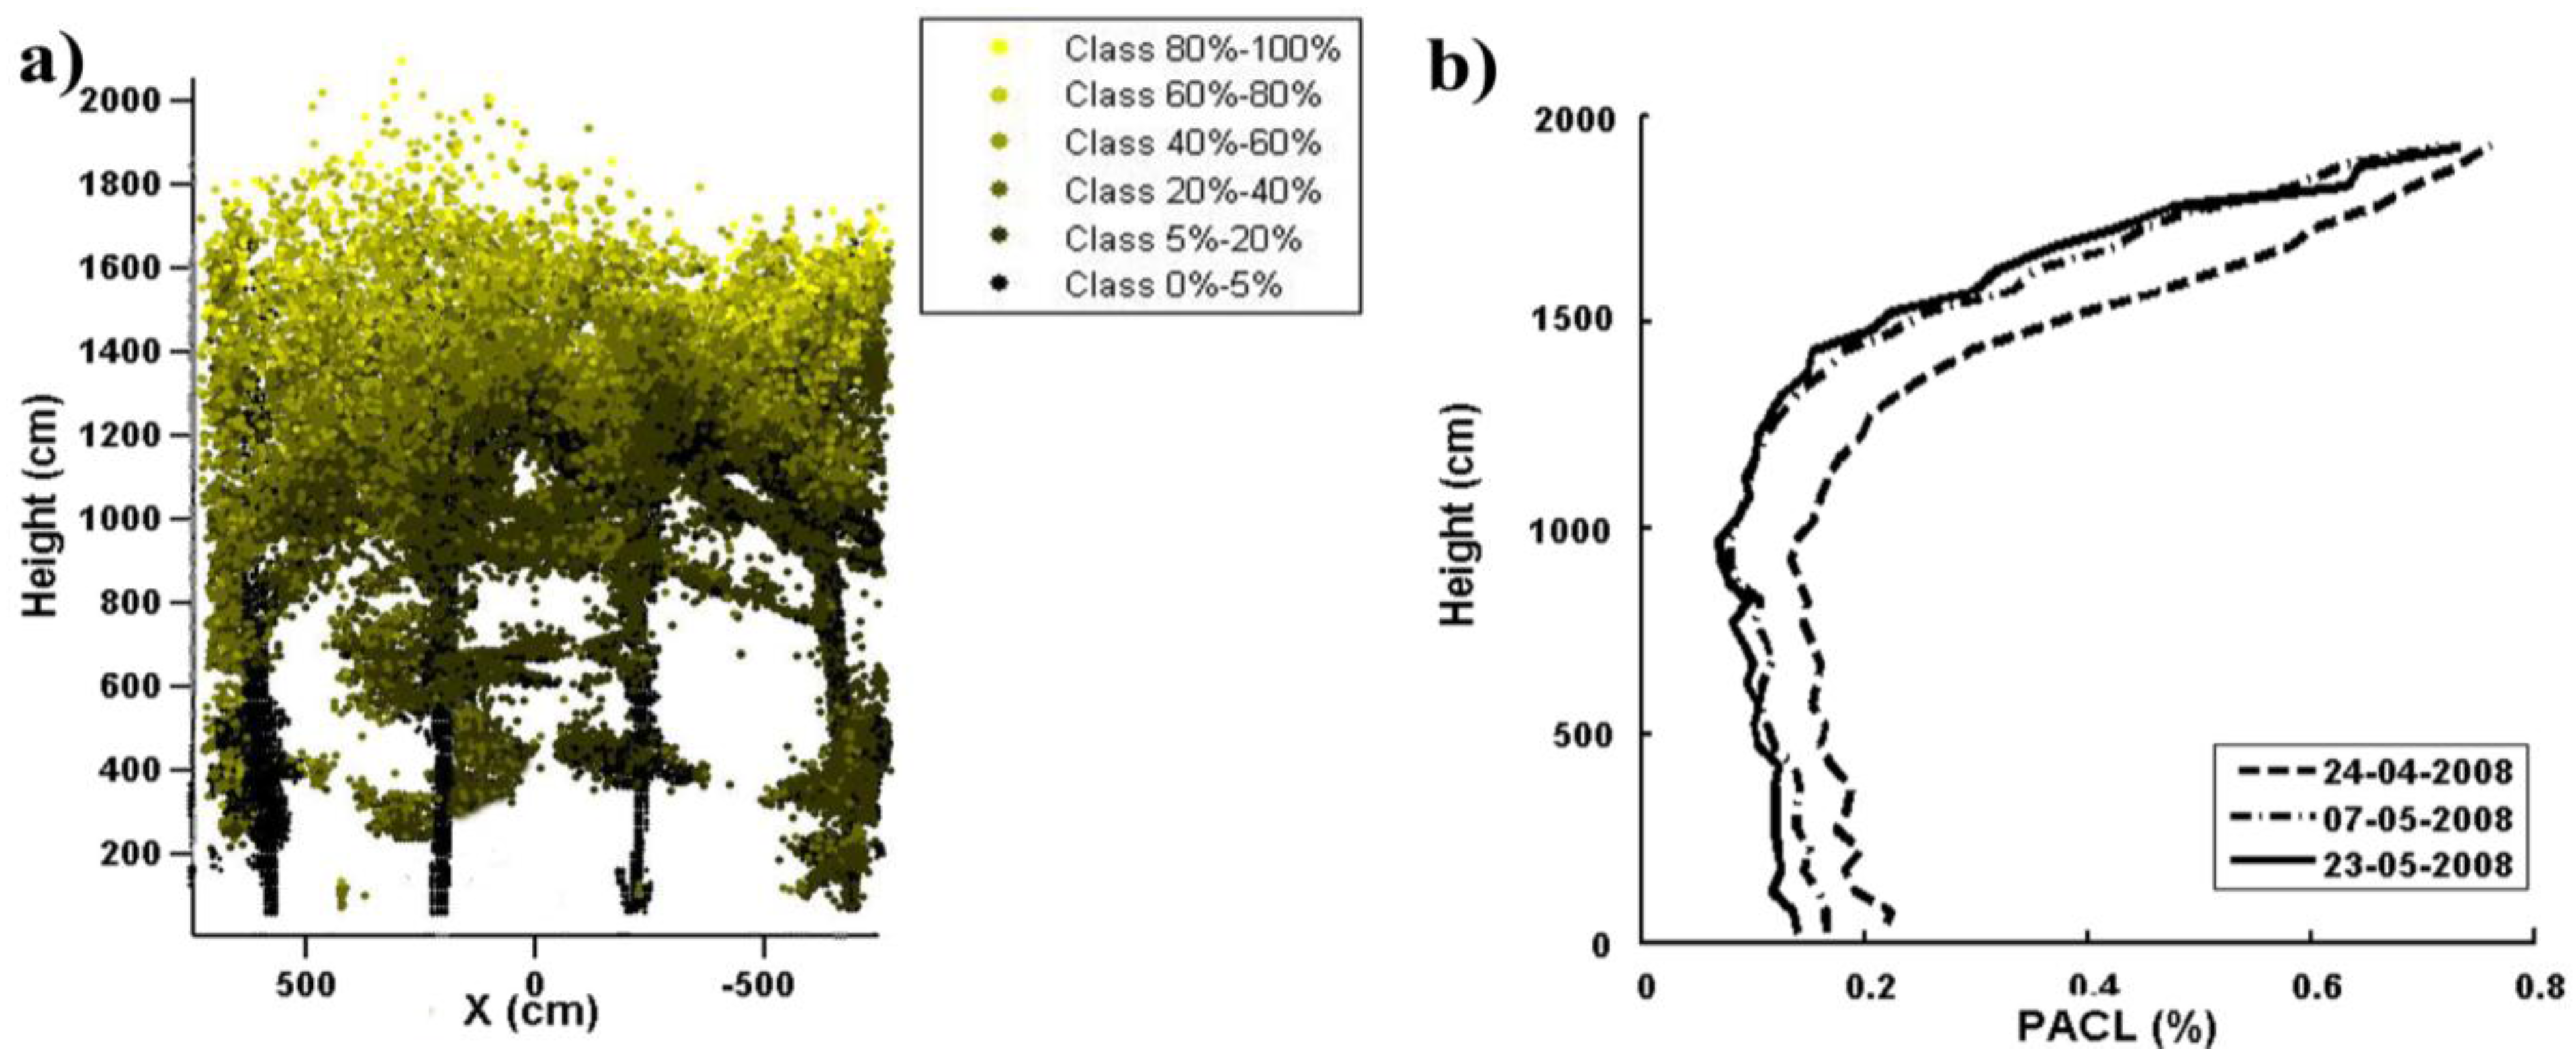
4.2. VLIM
5. Conclusions
Ackowledgments
References
- Brunner, A. A light model for spatially explicit forest stand models. Forest Ecol. Manage. 1998, 107, 19–46. [Google Scholar] [CrossRef]
- Sinoquet, H.; Le Roux, X.; Adam, B.; Amglio, T.; Daudet, F. RATP, a model for simulating the spatial distribution of radiation absorption, transpiration and photosynthesis within canopies: application to an isolated tree crown. Plant Cell Environ. 2001, 24, 395–406. [Google Scholar] [CrossRef]
- Piboule, A.; Collet, C.; Frochot, H.; Dhote, J. Reconstructing crown shape from stem diameter and tree position to supply light models. I. Algorithms and comparison of light simulations. Ann. For. Sci. 2005, 62, 645–657. [Google Scholar] [CrossRef]
- Ivanov, N.; Boissard, P.; Chapron, M.; Andrieu, B. Computer stereo plotting for 3-D reconstruction of a maize canopy. Agr. Forest Meteorol. 1995, 75, 85–102. [Google Scholar] [CrossRef]
- Biskup, B.; Scharr, H.; Schurr, U.; Rascher, U. A stereo imaging system for measuring structural parameters of plant canopies. Plant Cell Environ. 2007, 30, 1299–1308. [Google Scholar] [CrossRef] [PubMed]
- Frasson, R.; Krajewski, W. Three-dimensional digital model of a maize plant. Agr. Forest Meteorol. 2010, 150, 478–488. [Google Scholar] [CrossRef]
- Sinoquet, H.; Rivet, P. Measurement and visualization of the architecture of an adult tree based on a three-dimensional digitizing device. Trees-Struct. Funct. 1997, 11, 265–270. [Google Scholar] [CrossRef]
- Sinoquet, H.; Thanisawanyangkura, S.; Mabrouk, H.; Kasemsap, P. Characterization of the light environment in canopies using 3D digitizing and image processing. Ann. Bot. 1998, 82, 203–212. [Google Scholar] [CrossRef]
- Rakocevic, M.; Sinoquet, H.; Christophe, A.; Varlet-Grancher, C. Assessing the geometric structure of a white clover (Trifolium repens) canopy using 3-D digitizing. Ann. Bot. 2000, 86, 519–526. [Google Scholar] [CrossRef]
- Omasa, K.; Hosoi, F.; Uenishi, T.M.; Shimizu, Y.; Akiyama, Y. Three-Dimensional modeling of an urban park and trees by combined airborne and portable on-ground scanning LIDAR remote sensing. Environ. Model. Assess. 2008, 13, 473–481. [Google Scholar] [CrossRef]
- Weiss, M.; Baret, F.; Smith, G.; Jonckheere, I.; Coppin, P. Review of methods for in situ leaf area index (LAI) determination Part II. Estimation of LAI, errors and sampling. Agr. Forest Meteorol. 2004, 121, 37–53. [Google Scholar] [CrossRef]
- Wilson, W. Inclined point quadrats. New Phytol. 1960, 59, 1–8. [Google Scholar] [CrossRef]
- Wilson, W. Estimation of foliage denseness and foliage angle by inclined point quadrats. Aust. J. Bot. 1963, 11, 95–105. [Google Scholar] [CrossRef]
- Hosoi, F.; Omasa, K. Voxel-based 3-D modeling of individual trees for estimating leaf area density using high-resolution portable scanning LiDAR. IEEE Trans. Geosci. Remote Sens. 2006, 44, 3610–3618. [Google Scholar] [CrossRef]
- Van der Zande, D.; Hoet, W.; Jonckheere, I.; van Aardt, J.; Coppin, P. Influence of measurement setup of ground-based LiDAR for derivation of tree structure. Agr. Forest Meteorol. 2006, 141, 147–160. [Google Scholar] [CrossRef]
- Van der Zande, D. Mathematical Modeling of 3D Canopy Structure in Forest Stands Using Ground-Based Lidar. Ph.D. Thesis, Katholieke Universiteit Leuven, Leuven, Belgium, 2008. [Google Scholar]
- Van der Zande, D.; Jonckheere, I.; Stuckens, J.; Verstraeten, W.; Coppin, P. Sampling Design of Ground-based LiDAR measurements and its effect on Shadowing. Can. J. Forest. Res. 2007, 34, 526–538. [Google Scholar]
- Jonckheere, I.; Fleck, S.; Nackaerts, K.; Muys, B.; Coppin, P.; Weiss, M.; Baret, F. Review of methods for in situ leaf area index determination—Part I. Theories, sensors and hemispherical photography. Agr. For. Meteorol. 2004, 121, 19–35. [Google Scholar] [CrossRef]
- Norman, J.; Campbell, G. Canopy structure. In Plant Physiological Ecology: Field Methods and Instrumentation; Pearcy, R., Ehleringer, J., Mooney, H., Rundel, P., Eds.; Chapman & Hall: London, UK, 1989; pp. 301–325. [Google Scholar]
- Welles, J.; Norman, J. Instrument for indirect measurement of canopy architecture. Agron. J. 1991, 83, 818–825. [Google Scholar] [CrossRef]
- Hosgood, B.; Jacquemoud, S.; Andreoli, G.; Verdebout, J.; Pedrini, G.; Schmuck, G. Leaf Optical Properties Experiment (LOPEX93). Report EUR 16095; Institute for Remote Sensing Applications, Joint Research Center, European Commission: Brussels, Belgium, 1994. [Google Scholar]
- de Castro, F.; Fetcher, N. The effect of leaf clustering in the interception of light in vegetal canopies: Theoretical considerations. Ecol. Model. 1999, 116, 125–134. [Google Scholar] [CrossRef]
- Van der Zande, S.; Nadezdina, N.; Cermak, J.; Muys, B.; Coppin, P.; Manes, F. 3D upscaling of transpiration from leaf to tree using ground based LiDAR: application in a Mediterranean Holm oak (Quercus ilex L.) stand. Agr. Forest Meteorol. 2009, 149, 1573–1583. [Google Scholar]
- Chambelland, J.C.; Dassot, M.; Adam, B.; Dones, N.; Balandier, P.; Marquier, A.; Saudreau, M.; Sonohat, G.; Sinoquet, H. A double-digitizing method for building 3D virtual trees with non-planar leaves: application to the morphology and light-capture properties of young beech trees (Fagus sylvatica). Funct. Plant Biol. 2008, 35, 1059–1069. [Google Scholar] [CrossRef]
© 2010 by the authors; licensee MDPI, Basel, Switzerland. This article is an Open Access article distributed under the terms and conditions of the Creative Commons Attribution license (http://creativecommons.org/licenses/by/4.0/).
Share and Cite
Van der Zande, D.; Stuckens, J.; Verstraeten, W.W.; Muys, B.; Coppin, P. Assessment of Light Environment Variability in Broadleaved Forest Canopies Using Terrestrial Laser Scanning. Remote Sens. 2010, 2, 1564-1574. https://doi.org/10.3390/rs2061564
Van der Zande D, Stuckens J, Verstraeten WW, Muys B, Coppin P. Assessment of Light Environment Variability in Broadleaved Forest Canopies Using Terrestrial Laser Scanning. Remote Sensing. 2010; 2(6):1564-1574. https://doi.org/10.3390/rs2061564
Chicago/Turabian StyleVan der Zande, Dimitry, Jan Stuckens, Willem W. Verstraeten, Bart Muys, and Pol Coppin. 2010. "Assessment of Light Environment Variability in Broadleaved Forest Canopies Using Terrestrial Laser Scanning" Remote Sensing 2, no. 6: 1564-1574. https://doi.org/10.3390/rs2061564
APA StyleVan der Zande, D., Stuckens, J., Verstraeten, W. W., Muys, B., & Coppin, P. (2010). Assessment of Light Environment Variability in Broadleaved Forest Canopies Using Terrestrial Laser Scanning. Remote Sensing, 2(6), 1564-1574. https://doi.org/10.3390/rs2061564