Article

Applying Multifractal Analysis to Remotely Sensed Data for Assessing PYVV Infection in Potato (Solanum tuberosum L.) Crops

1
Production Systems and the Environment Division, International Potato Center, Av. La Molina 1895, Lima 12, Peru
2
Integrated Crop Management Division, International Potato Center, Av. La Molina 1895, Lima 12, Peru
3
Research Group in Biology of Plants under Mediterranean Conditions, University of Balearic Islands, Crtra. Valldemossa km.7.5, 07122 Palma de Mallorca, Spain
4
Physics Department, University of Balearic Islands, Crtra, Valldemossa km.7.5, 07122 Palma de Mallorca, Spain
*
Author to whom correspondence should be addressed.
Remote Sens. 2010, 2(5), 1197-1216; https://doi.org/10.3390/rs2051197
Submission received: 21 December 2009 / Revised: 12 April 2010 / Accepted: 14 April 2010 / Published: 27 April 2010

Abstract

:
Multispectral reflectance imagery and spectroradiometry can be used to detect stresses affecting crops. Previously, we have shown that changes in spectral reflectance and vegetation indices detected viral infection 14 days before visual symptoms were noticed by the trained eye. Herein we present evidence that shows that the application of multifractal analysis and wavelet transform to spectroradiometrical data improves the diagnostic power of the remote sensing-based methodology proposed in our previous work. The diagnosis of viral infection was effectively enhanced, providing the earliest detection ever reported, as anomalies were detected 29 and 33 days before appearance of visual symptoms in two experiments.

1. Introduction

Monitoring plant health with remotely sensed data is now a practical tool for most field crops with high commercial value [1,2]. Multispectral curves and imagery differences can be used to assess the spatial extent and severity of stresses and anomalies such as diseases, weeds and pests [3,4,5,6]. The multispectral analysis is based on the reflectivity and propagation of solar radiation from and within plant canopies and tissues, where a fraction is absorbed and others reflected in all directions [1]. This absorption and reflectivity of light is linked to the biochemical and structural components of the plant, such as chlorophyll, water, proteins and cell wall materials [2,7]. All these components, particularly chlorophyll content, are affected by diseases, resulting in differences in the spectral signature of healthy and stressed plants.
In a previous work [8], we assessed the usefulness of remotely sensed multispectral reflectance imagery and spectroradiometry to determine yellow vein virus (PYVV) infection in potatoes before symptoms became visually perceptible. Our results showed that changes in reflectance in certain regions of the electromagnetic spectrum—indicative of disturbances in light absorption and reflection by vascular tissues in infected plants—enabled the early detection of viral infection in potato plants grown under controlled conditions, long before symptoms of chlorosis were detected by the trained eye. The most reliable response of early diagnostic value corresponded to changes in reflectance in the blue region (450–495 nm), which allowed the flagging of infected plants some 23 days after infection, although differences in reflectance in the near-infrared (NIR) region (>750 nm) were also detected as early as 11 days after inoculation.
Multifractal techniques are increasingly recognized as the most appropriate and straightforward framework for analyzing and simulating not only the scale dependency of geophysical observables, but also their extreme variability over a wide range of scales [9]. Multifractal theory permits the characterization of complex phenomena in a fully quantitative fashion, for continuous signals (e.g., time, space or wavelength) [10]. An important property of multifractal systems is that they are scale invariant [11], which means that the information they provide is constant across different scales, allowing for a valid extrapolation up and down scales. This property of the multifractal analysis is particularly relevant in the work herewith reported, as it was hypothesized that it would confer robustness and consistency to the analysis of observed data. Moreover, the multifractal analysis gives a description of several physical properties of the observed signal such as the internal entropy, the anisotropy and the correlation among data. Indeed, many workers have successfully applied multifractals analysis to signals data in several research fields such as solar flare x-ray emissions [12], soil science [13,14,15], neurology [16,17] and cardiology [18,19].
On the other hand, the wavelet analysis has been successfully used for extracting meaningful quantitative information from plant reflectance spectra [20]. To optimize the determination of the multifractal parameters, the wavelet transform is used for two basic reasons: one is that it is possible to characterize the singularities of the function (signal) through the estimation of their wavelets coefficient, and the other is that there is an optimal relationship between the estimated multifractal function and the real function (signal) [21].
The aim of this work was to test the hypothesis that applying multifractal analysis and wavelet transform to remotely sensed spectroradiometrical data would improve the diagnostic power of the remote sensing-based methodology proposed in our previous work [8]. Before testing the central hypothesis, we corroborated the condition that the continuous reflectance signals obtained from healthy and infected plants, in the range of 390–1,020 nm, presented scale invariance properties and thus could be subjected to multifractal analysis.

2. Materials and Methods

2.1. Plant Material and Treatments

Two indoor experiments conducted under a split-plot in time design, with inoculated and control treatments in the main plot and time measurements as sub-plots, were carried out in Lima, Peru, from May to September 2007. The two experiments were similar in design and treatments. The only relevant difference was that for the first experiment, the aperture angle of the fore-optics used for the gathering of spectroradiometric data was 25°, whereas in the second experiment, a collimator was used and the normal aperture angle of the fore-optics of the spectroradiometer was reduced to 1°. Each experiment comprised 20 potato plants, with 10 plants as control (Ctrl) and 10 as PYVV infected (PYVVi) treatment. The PYVV infection was induced through lateral grafting some two weeks after plant emergence. Plants were germinated in a nursery and then transplanted into individual six-liter pots containing a mixture of compost (10%), organic soil (70%) and perlite stone (20%) as substrate. The pots were located under an insect-free net house and irrigated to maintain the soil at field capacity. The environmental conditions (temperature, relative humidity and light) and management, including irrigation and fertilizer application, were the same for infected and control plants.

2.2. Data Collection

2.2.1. Spectroradiometric Data

Solar radiation reflected by individual plants was recorded in both experiments before and after the virus inoculation, until the symptoms of disease were visually perceptible. A computer-assisted ASD Fieldspec Pro spectroradiometer (Analytical Spectral Devices Inc., CO, USA), covering the 325–1,075 nm wavelength region, was used for data recording. In both experiments, measurements were taken from nadir at a distance of 30 cm from the plant canopy, resulting in a circular projected field of view of 13 cm and 0.52 cm diameter for fore-optics angles of 25° and 1°, respectively (Figure 1). Spectroradiometric measurements were taken every 2–3 days with the sun at 30° of zenith angle throughout the observational period. A white Spectralon® panel was used for converting the reflected radiation into relative reflectance values. At the same time, a visual assessment of disease symptoms in PYVVi plants was continuously conducted and compared to Ctrl plants.
Figure 1. Aperture of the spectroradiometer sensor for each experiment. (a) Experiment with a 25° solid angle aperture, (b) Experiment with a 1° solid angle aperture.
Remotesensing 02 01197 g001

2.2.2. Multispectral Imagery

In addition to spectroradiometric data, multispectral images of Ctrl and PYVVi plants were recorded (only from experiment 1) to provide a comparative analysis between continuous and discrete reflectance responses. The latter was registered with a sensor widely used in agricultural research. Images were taken using an agricultural digital camera (Tetracam Inc., CA, USA) equipped with green (520–600 nm), red (630–690 nm) and NIR (760–900 nm) bands and a sensor resolution of 3.2 megapixels (2,048 × 1,536 pixels). The camera was placed 0.60 m above the observed plants, and independent images were registered for each plant. Multispectral images were taken at the same time of day every five days during the crop phenological cycle. The reflectance data recorded per pixel throughout every image were analyzed through the free software Briv32 (Band Rationing Image Viewer, Tetracam Inc., CA, USA) to obtain several spectral vegetation indices (SVI): the normalized difference vegetation index (NDVI = (RNIR − Rred)/(RNIR + Rred), R=reflectance, ranging from −1 to +1) that track changes in chlorophyll concentration [22]; the soil adjusted vegetation index (SAVI = {(RNIR − Rred)/(RNIR + Rred + L)*(1 + L)} , where L ranges from 0 to 1), proposed as a soil-line vegetation index to reduce the background effect [23]; and the infrared percentage vegetation index (IPVI = RNIR/(RNIR + Rred)), a ratio-based index that holds a limited range with no negative values (0 < IPVI < 1), whose main disadvantage is its sensitivity to atmospheric noise [24]. These three SVIs had proved to be good indicators of infection by PYVV in potato [8].

2.2.3. Spectroradiometric Data Pre-Processing

The pre-processing of spectroradiometric data consisted of two steps. First, a background correction was performed to reduce the undesired variations caused by small atmospheric changes occurring while measuring all the plants within a day and non-systematic measuring errors. The background correction was performed by the linear regression shown in Equation 1 [25]. The slope and intercept of the regression were estimated by Equations 2 and 3.
S j ( λ i ) = A j G j ( λ i ) + B j
A j = ( G max j G min j ) ( G T o t a l max G T o t a l min )
B j = G min j A j G T o t a l min = G max j A j G T o t a l max
where:
  • Sji) and Gji) are the corrected and raw signals for the jth plant at the ith wavelength, respectively
  • Gmax j and Gmin j are the maximum and minimum raw measures of the jth plant, and
  • GTotal max and GTotal min are the maximum and minimum raw measures of all the plants within a treatment, measured in a sampling date.
  • Aj is the ratio: response range of the jth plant to total population.
  • Bj is the regression intercept.
In the second step, anomalies over moving averages of 41 wavelengths (see Equations 4 and 5) were calculated. The use of filters such as wavelets, the first difference of reflectance signal or its anomalies, has been shown to highlight the plant attributes or responses associated with physiological changes induced by stressing factors and thus reduce the signal to noise ratio [20,26,27]. Moving average
S j ( λ i ) = k = i 20 i + 20 S j ( λ k ) 41 ,
where Ŝj is the resultant reflectance, for the jth plant, after application of moving average; Sj is the reflectance value obtained from Equation 1, through the λk wavelength values in the analyzed moving window; and k is the counter that allows the analyzed window to move from −20 to +20. The λi wavelength value ranged from 390 to 1,020 nm.
Anomalies:
S ' ( λ i ) = S ^ ( λ i ) S ( λ i ) .

2.3. Wavelet and Multifractal Data Analysis
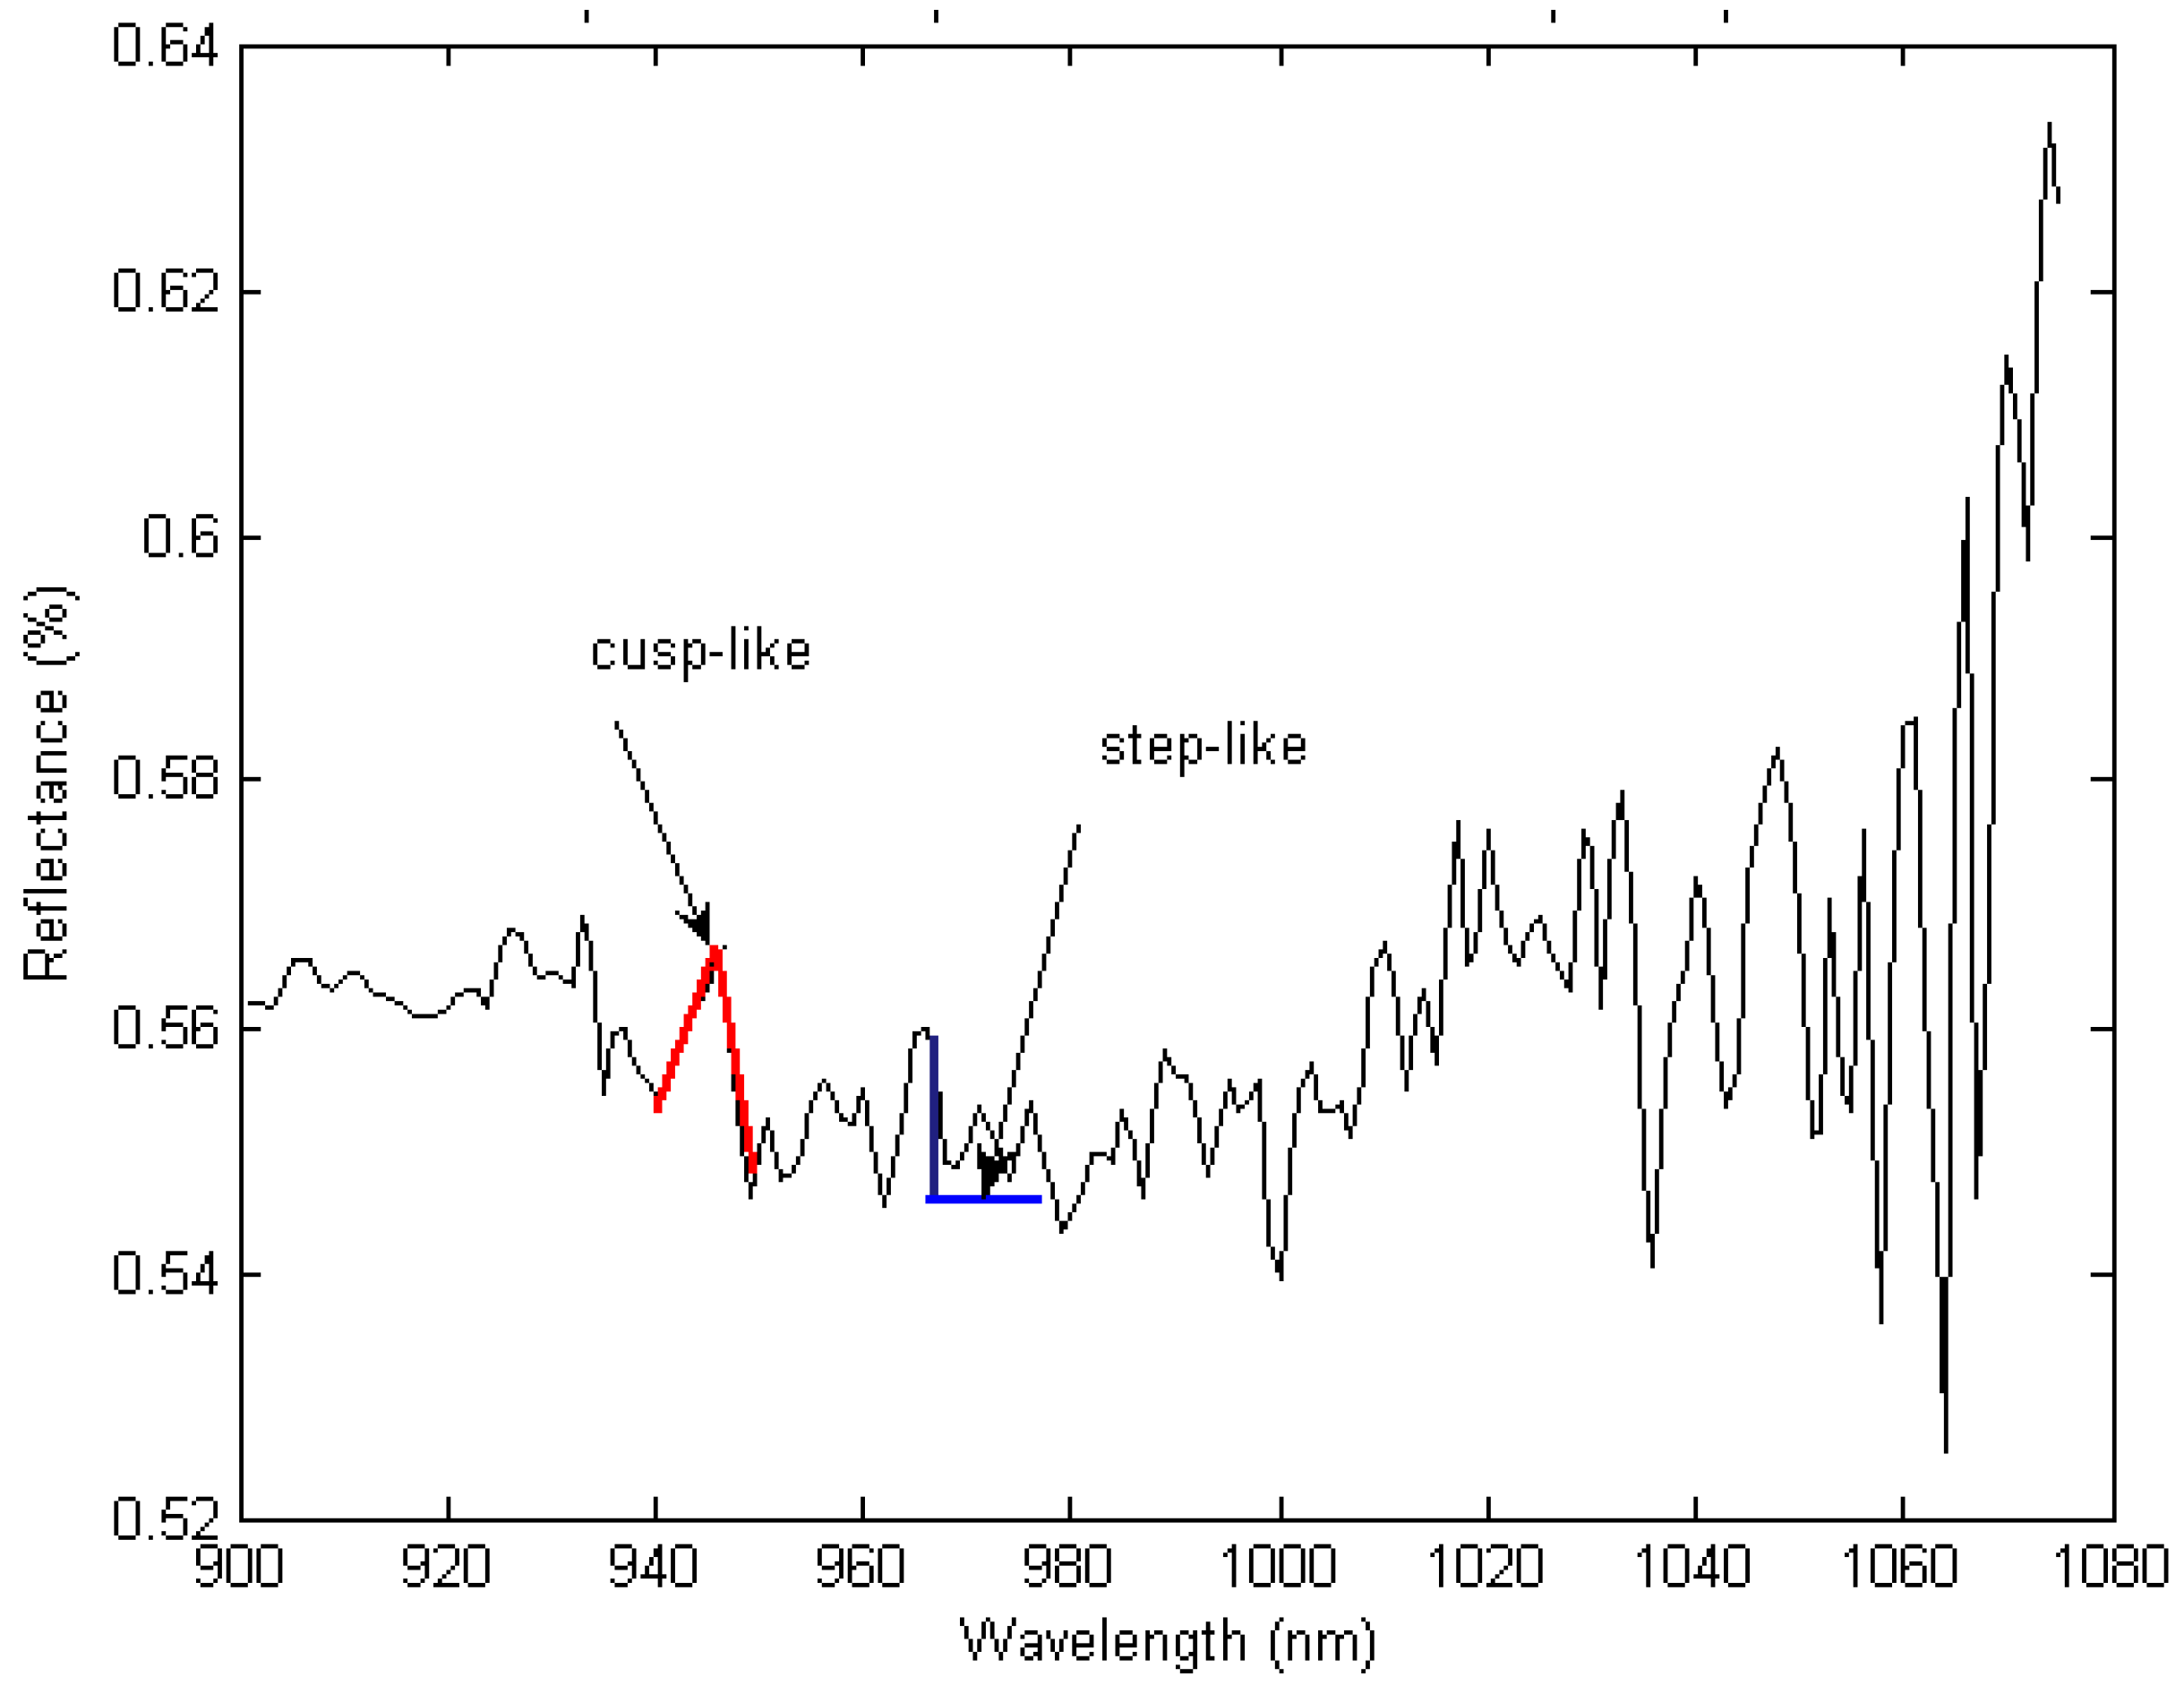
The continuous reflectance signal was pre-processed, as described above, and submitted to a wavelet-based multifractal analysis to search for singularities in the response. The wavelet used for this multifractal analysis was the Mexican hat wavelet, which is the negative normalized second derivative of a Gaussian function. This filter is widely used for studying singularities in different types of signals [21,28,29]. Multifractal functions are used to model signals whose regularity may change abruptly from one point to the next [21]. In a physical context, this property holds only within a few magnitudes of changes, the so-called singularities in the signal [10]. This condition was evidenced (Figure 2) as cusp-like and step-like singularities shown by the reflectance data obtained in the present work. The singularities are quantified by the Hölder exponent, obtained through the scale-invariant property. The definition of statistical moments is used in the present work, where q > 0 is the qth order statistical moment [30]. A summarized explanation about wavelet-multifractal theory is presented in the Appendix for interested readers. For more details on the subject, see the papers by [12] and [31]. Thus, following the works of [12] and [14], wavelet and multifractal formalisms were applied to the data, aiming at detecting such singularities and obtaining the multifractal spectrum for each group, infected and control.
Figure 2. Heterogeneous signal of a reflectance spectrum, obtained from a potato plant, showing two types of singularities: cusp-like and step-like features, the so-called singularities in the signal.
Remotesensing 02 01197 g002

2.4. Statistical Analysis

All the response variables (raw spectra, multifractal parameters and multispectral images) were analyzed following the split-plot in time design. In the main plot, plants were randomly assigned to each of the treatments prior to the infection with the virus, to avoid biases in the allocation of plants. Reflectance measurements taken in time (or sub-plot) cannot be randomized, therefore a carryover effect—i.e., observations close in time may be more related than observations far apart in time—cannot be avoided. To minimize the bias introduced by this carryover effect, repeated measurement analyses were performed as explained by [32]. The analysis of variance generated by the General Lineal Model (GLM) for a split-plot in time design permits the determination of statistical differences between treatments, as a function of time, with a pre-established probability level (P value) of 5%. A significant difference indicates that, on the one hand, the variation due to treatment, at a particular time within the experiment, was greater than the variation among plants within each treatment. On the other hand, it indicates that the number of replicates was enough to reach a robust assessment of the difference between healthy and infected plants. All the statistical analyses were performed with the SAS software package (SAS Institute, NC, USA).

3. Results and Discussion

3.1. Reflectance Measurements
The reflectance pattern of healthy and diseased potato plants—in the visible and NIR range of the spectrum—is expected to differ due to physiology and ontogeny. Changes in the reflectance, as the normal plant ages, are attributed to changes in the ratio of new and aged leaves with different concentration of pigments that absorbs light in this range of the spectrum. With the onset of the translocation of assimilates from the aerial part to the tubers, the leaves initiate a rapid senescence process that spectrally resembles the effect produced by stressors in a diseased plant. However, the effects of biotic or abiotic stressors disrupt the normal pattern of change of reflectance that occurs in a healthy plant along its development from emergence to maturity. This particular departure from a normal reflectance pattern over time—difficult to notice at early stages—causes trouble in developing an early detection protocol for stressing agents such as viruses, thus requiring non-conventional processing techniques. In this work the wavelet-based multifractal approach was used.
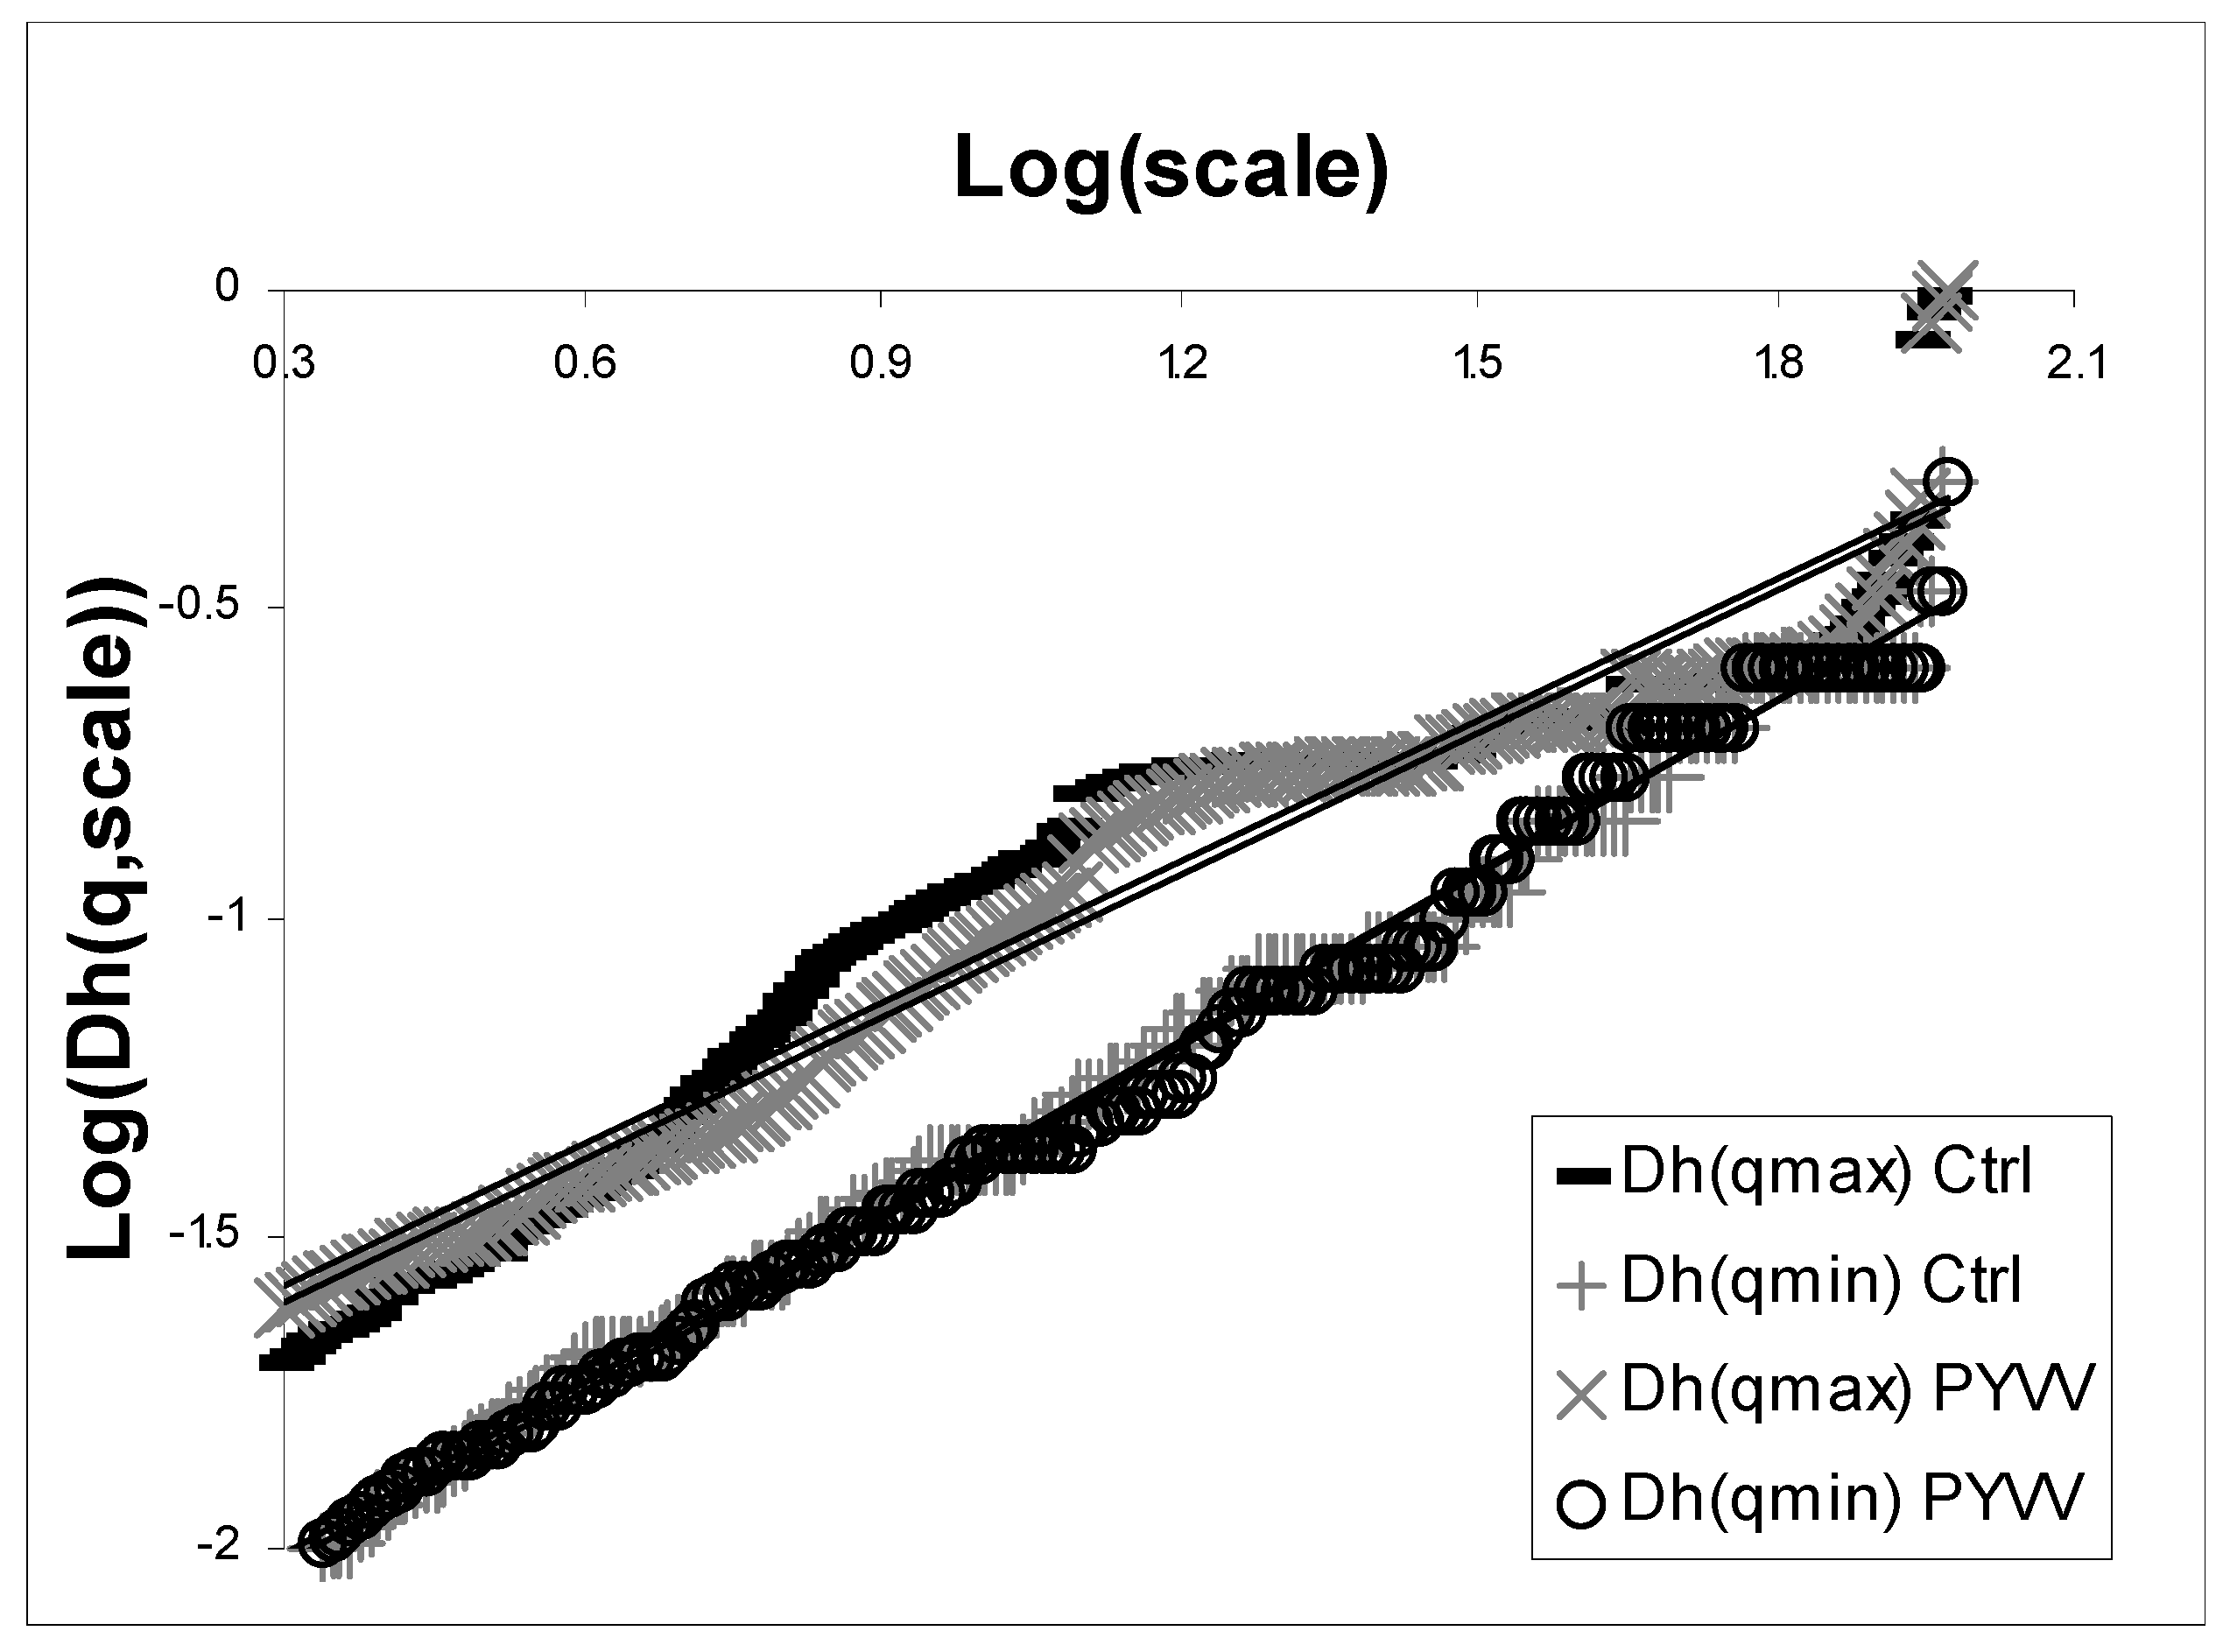
To apply the multifractal analysis to the reflectance signals obtained from healthy and infected plants, the first step was to show that the data presented multifractal attributes. On the one hand, the signal showed cusp-like and step-like singularities (Figure 2). On the other hand, the scale invariance (linearity along a scale) property shown for both types of signals (Figure 3) allowed for the estimation of the multifractal singularity spectra and its parameters. The system showed linearity through the scales 2–596 nm for the order moments q ranging from 0 to 1.3.
Owing to physiological and developmental effects, multifractal parameters of healthy plants are expected to change over time. To differentiate a normal (healthy plants) from abnormal (diseased plants) evolution of reflectance, multifractal analysis was performed in order to compare singularities. This comparison was performed through the values ΔDh(q) = Dhcontrol(q) − DhPYVV(q) and Δh(q) = hcontrol(q) − hPYVV(q), for a given qth order of statistical moment. When ΔDh(q) = 0 and Δh(q) = 0, for a given q, it is taken as an indication of a normal evolution of reflectance (healthy plants). Conversely, any value other than zero (ΔDh ≠ 0 or Δh ≠ 0) is an indicator of stress (infected plants).
Figure 3. Scale invariance assessment for the reflectance data of healthy and infected plants. Dh(q, scale) is the numerator of Equation 6 in the Appendix for each order moment q > 0 along the wavelength scale. The slopes correspond to the Hölder exponents.
Remotesensing 02 01197 g003
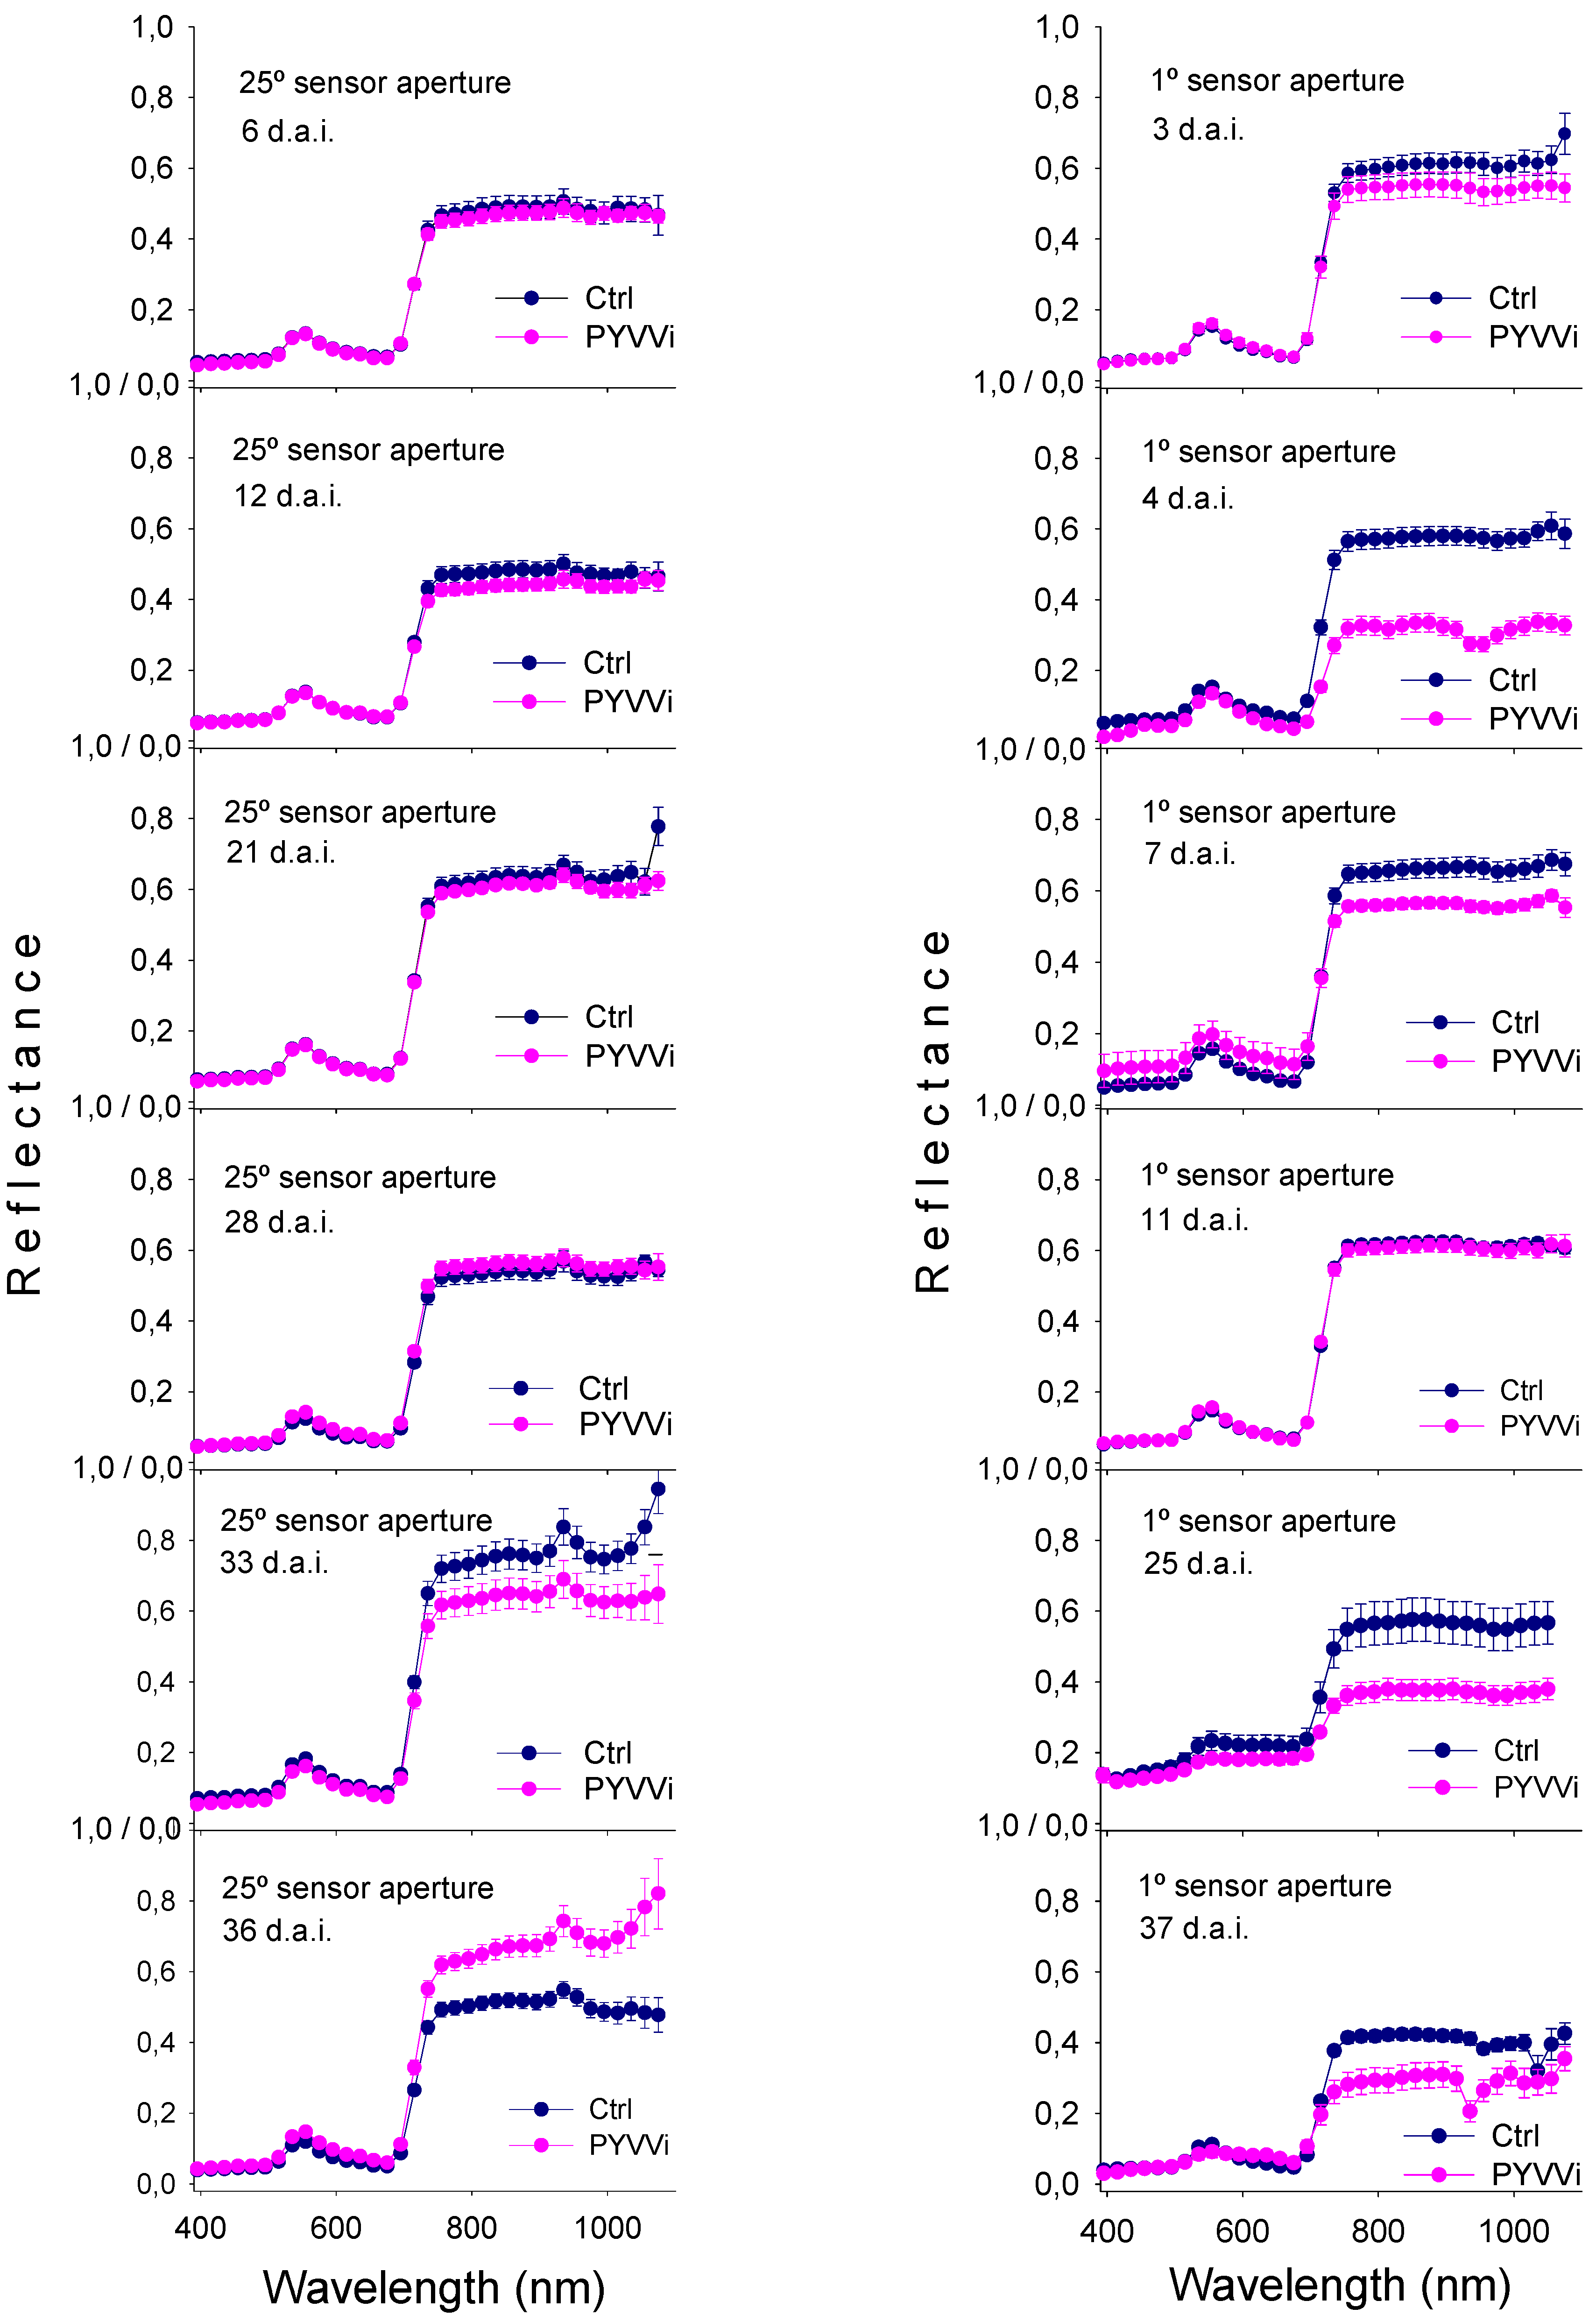
For the first experiment, in which spectroradiometric data were obtained through a 25° solid angle sensor’s aperture, the primary passive reflectance of plants of both treatments was very similar, making it impossible to determine signs of infection through the direct observation of the spectra (Figure 4). Moreover, the multifractal analysis run directly on the raw data did not show differences between treatments (results not shown). It is likely that the indistinct diagnosis from unprocessed data resulted from the reduced signal to noise ratio caused by significant reflectance from objects and plant organs other than leaves, captured by the wide field of view. However, when the data were pre-processed, differences between treatments were detected through the multifractal analysis (P value < 0.05). Figure 5 shows that the multifractal singularity spectra have more than one fractal dimension, which is a characteristic of multifractal systems. The values of the Hölder exponents (h) for control and infected plants cover the range [0.08; 0.63] and [0.02; 0.58], respectively, during the observational period. The range of D(h) for control plants was [0.72; 1.06] and for infected plants the range was [0.71; 1.05]. Differences between Hölder exponents of healthy and infected plants (Δh) were evident from day 6 after infection (i.e., 29 days before symptoms became visible to the trained naked eye), at which date the value of Δh (q = 1.3) was 0.12. Differences hold up to the 21st day after infection. From the 21st to the 26th day after infection, the singularity spectrums of both treatments were again similar, suggesting a recovery of the PYVVi plants (see Section 3.3), but differences again became significant from the 28th day after infection onwards (Figure 5).
The second experiment was designed to prove whether a higher precision of the field of view would reveal changes directly from recorded data, thus the sensor aperture of fore-optics of the spectroradiometer was adjusted to 1° by means of a collimator. In this instance, the raw multispectral reflectance data revealed that PYVVi and Ctrl plants originated very distinct spectra that were easily noticeable, well before symptoms of PYVV infection were visually observed, which occurred 37 days after infection (Figure 4). The multifractal analysis of the primary reflectance data strongly enhanced the evidence of such spectral differences, making them noticeable even earlier than in the previous experiment, the 4th day after infection—i.e., 33 days before the symptoms were visible—when Δh(q = 0) =0.33. Again, an apparent unexpected recovery of PYVVi plants occurred from the 7th day after infection (ΔDh y Δh ≈ 0) to the 11th day. Significant differences between treatments were re-established on the 11th day after inoculation and held until the last date of measurement, just as evidenced by the raw data (Figure 4).
The multifractal analysis gave the range of Hölder exponent values for control [1.19; 1.99] and infected plants [1.09; 2.04]. It is shown that the range of values for infected plants was larger and that the spectra moved to the left (Figure 5). The range of h values of diseased plants got progressively out of phase with respect to the values of healthy plants, evincing that the signal became more random, which indicated that the signal from infected plants became more heterogeneous and with more anti-persistency [12]. The same trend was given by the ranges of Dh for control [0.54; 1.04] and infected plants [0.53; 1.22]. Moreover, it was observed that the fractal dimension (D(h) for q = 0) for infected plants increased over time, which indicated that their spectra had a larger fractal dimension from day 11 after infection onwards—i.e., the multifractal spectra of infected plants appeared over that of the control (Figure 5).
Earliness of PYVVi diagnosis was sharper and sooner with the fore-optic aperture of 1° as a consequence of the smaller instantaneous field of view, which gave a sharper measurement as the incoming scattering was close to zero. In contrast, the fore-optic aperture of 25° permitted a higher scattering influence from the surrounding area, producing a less sharp measurement. Scattering directs irradiance from outside the sensor’s field of view toward the sensor’s aperture [33]. It has been suggested that sensors with small field of view show little within-scene atmospheric variation, whereas sensors with wide field of view can show considerable scan-angle effects. Such effects are due to changes in the atmospheric path in the cross-scan direction [34].
Figure 4. Passive reflectance of plants of both the first (left) and second experiments (right). Notice that the observable differences in the raw reflectance spectra registered by a sensor aperture of 25° (left) do not allow a clear treatments discrimination. In contrast, the spectra obtained by a sensor aperture of 1° (right) shows more clearly the differences in the spectra, at earlier dates.
Remotesensing 02 01197 g004
Figure 5. Multifractal singularity spectra of plants. The first experiment was with a sensor aperture of 25° (left) and the second experiment was with a sensor aperture of 1° (right) .
Remotesensing 02 01197 g005

3.2. Visible and Near-Infrared Reflectance

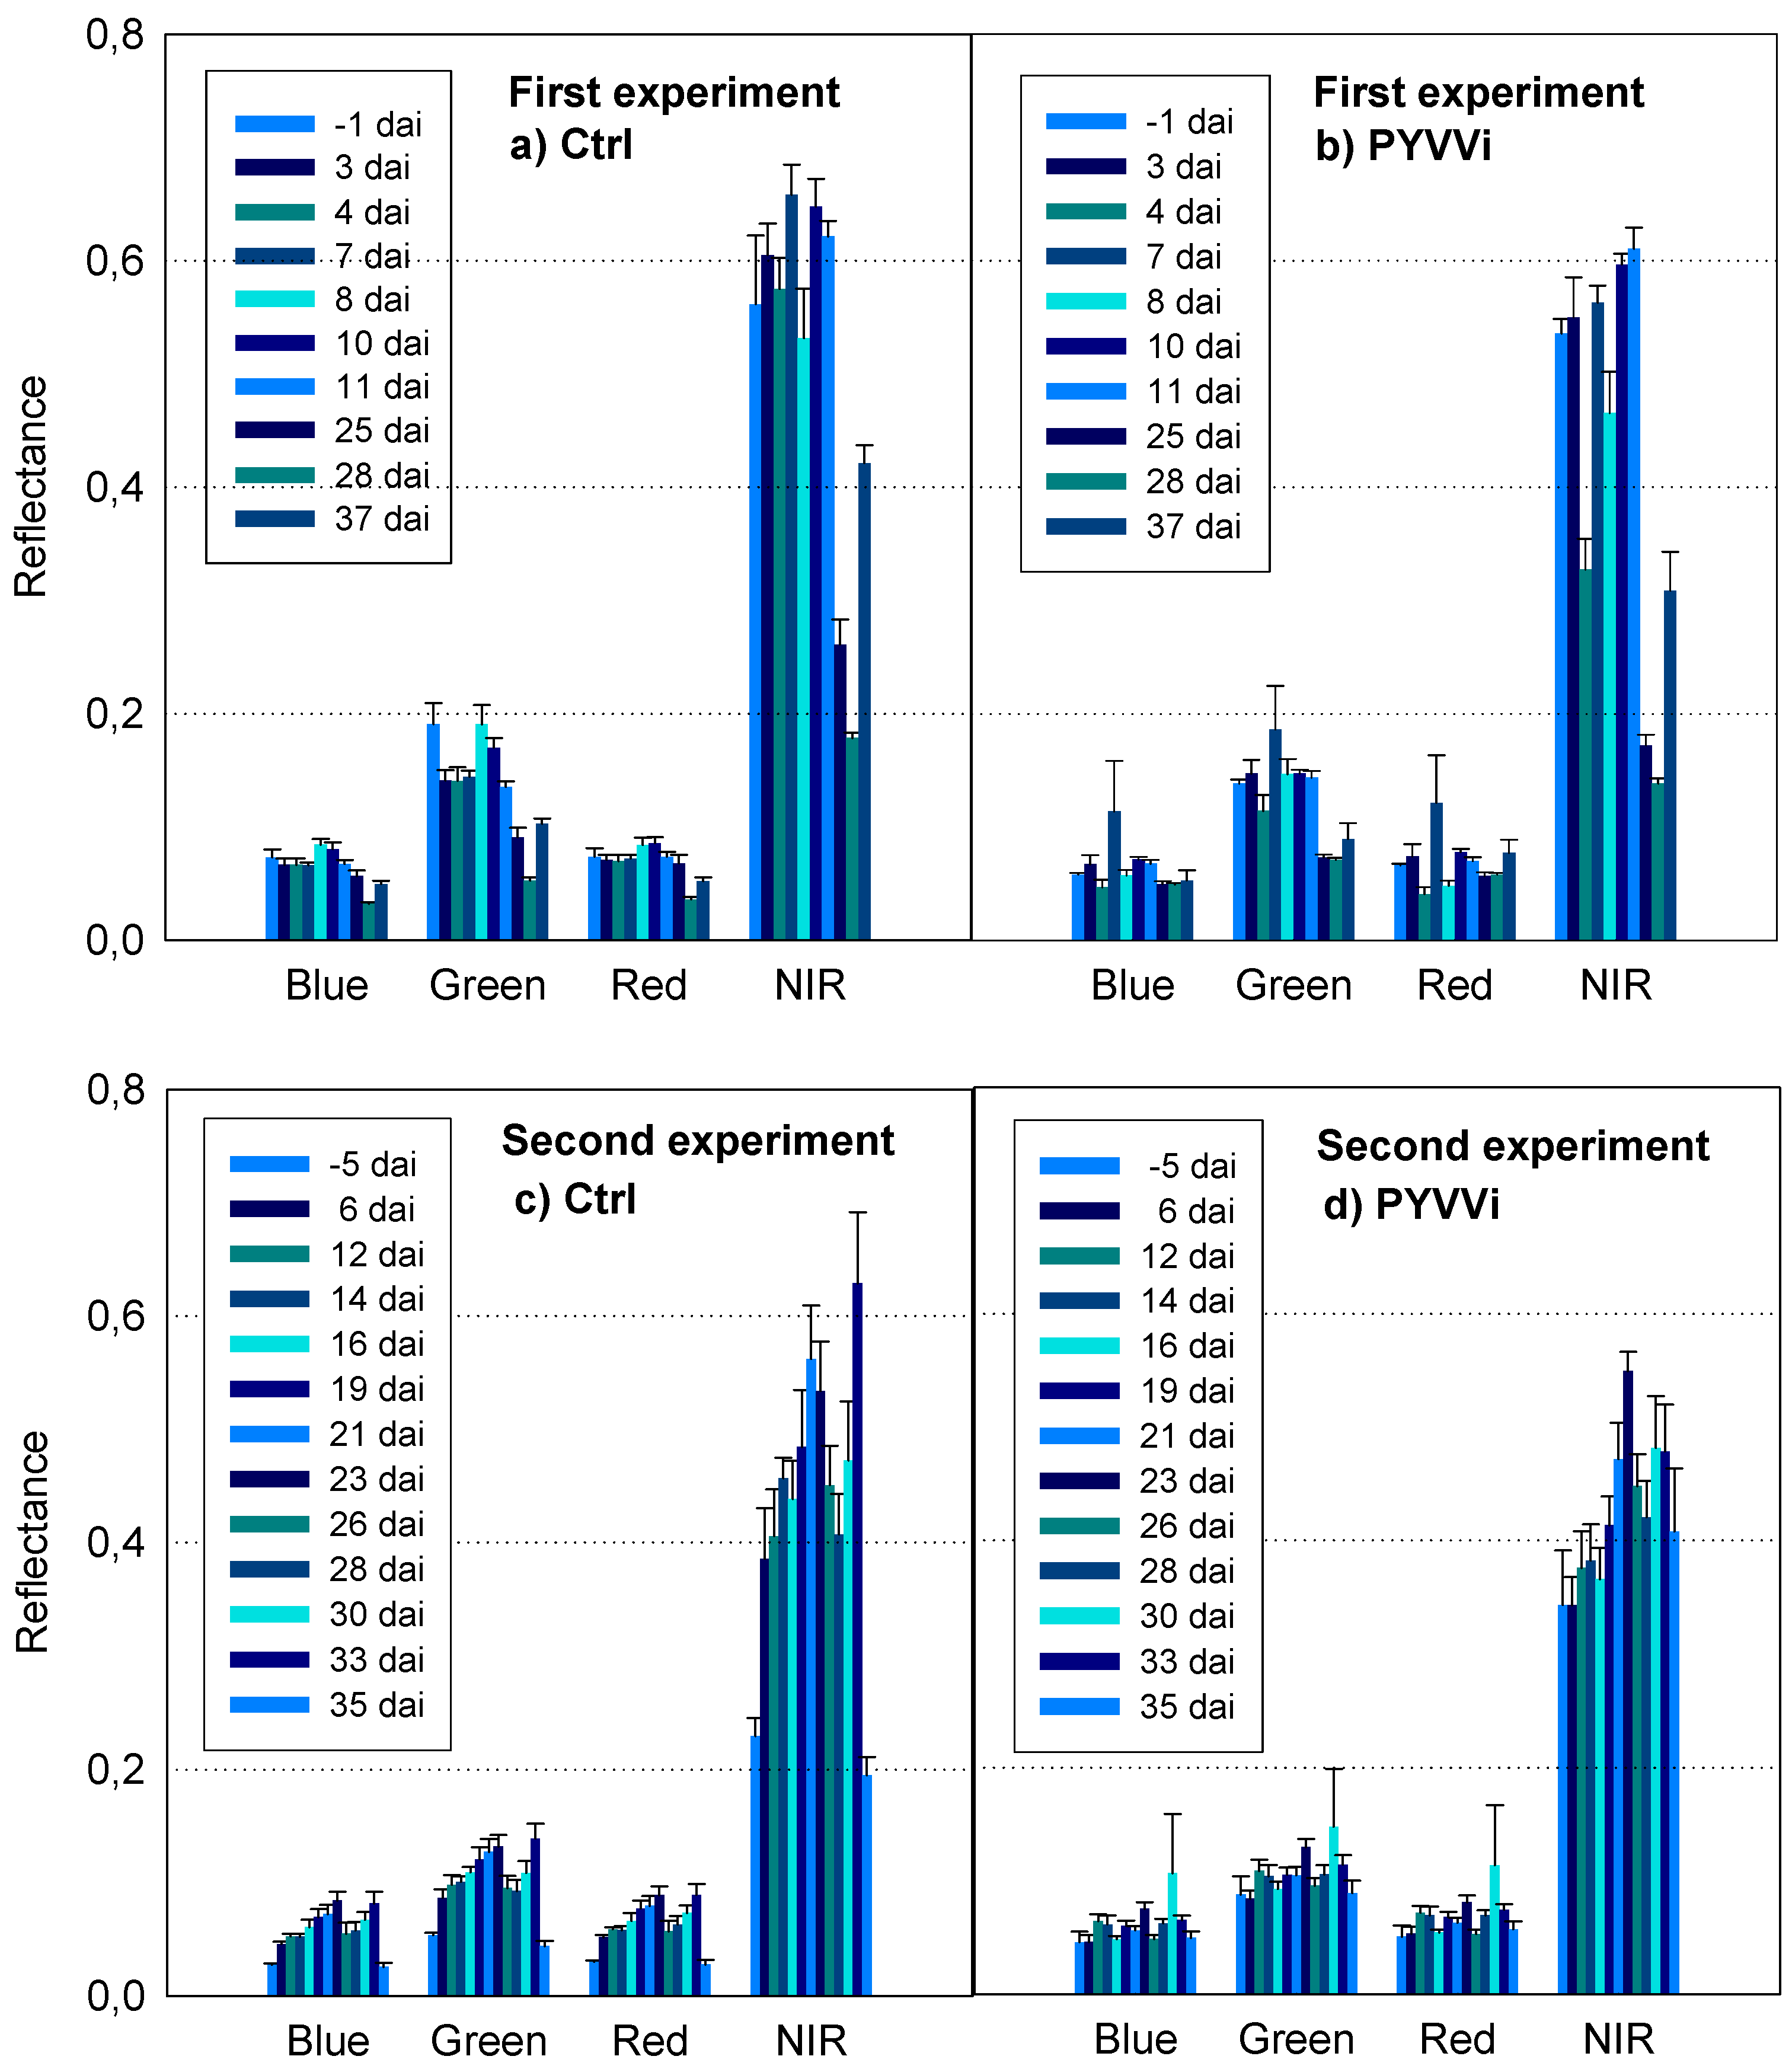
The analysis of the reflectance of discrete sections of the spectrum (blue, green, red, NIR) revealed a distinct reflectance pattern from infected plants as compared to control plants. This difference was evident for several wavelengths within the visible and NIR section of the electromagnetic spectrum at day 25 after infection for the experiment with 25° of sensor aperture (P value < 0.05), and 23 days after infection for the experiment with 1° of sensor aperture (P value < 0.05). For both experiments, visible and NIR reflectance showed differences between treatments, with different singularity spectra (data not shown). The blue region (450–495 nm) band showed the most robust statistical response. Reflectance in the green region (495–570 nm) was also indicative of infection, but it seems to be a less reliable indicator. Responses in the red region (620–750 nm) presented more noise. NIR did not provide robust evidence of differences between treatments as the responses were highly variable in time (Figure 6). NIR is thus an unreliable indicator of the presence of the symptoms if the other bands of the electromagnetic spectrum were not taken into account, confirming the results obtained by the multifractal analysis described in the section above. Therefore, our results suggest that multifractal analysis of the visible region or the continuous multispectral reflectance spectrum (visible and NIR) is required to obtain reliable and accurate information about the presence of PYVV infection in potato plants. They also confirm the accuracy of this methodology as obtained in our previous work [8], in which telltale anomalies in reflectance were detected some 14 days before symptoms were visible. The fact that in our previous work we used a sensor with an aperture of 180°, which became 60° due to its built-in cosine corrector, without significant changes in the results indicates that with sensor aperture ≥ 25° there might be no substantial changes in the measurement.

3.3. Recovery Period

The apparent transitory recovery of infected plants, suggested by the observed realignment of the singularity spectra, could be explained by the fact that plants possess more than one defense mechanism to protect themselves against different pathogenic attacks. It has been shown that some virus–host interactions naturally lead to host recovery [35]. Although some of the defense mechanisms are still unknown, there is one specially targeted at avoiding viral infections, called RNA silencing, reported for potato, tobacco and other species. This gene silencing differs from many other plant defense systems in that it is adaptive. The plant perceives information from the infecting virus genome and produces a defensive response that is specific for that genome [36]. The silencing RNA mechanism, induced by double-stranded RNAs (dsRNA) and targeted to homologous RNA and DNA sequences, is a complex surveillance and regulatory process. It mediates the post-transcriptional repression of the target gene expression and represses the proliferation and expression of different invading nucleic acids, such as those carried by viruses, viroids, transposons or transgenes, as well as regulates the gene expression [37]. The silencing response may not be limited to the plant cell being actively infected by the virus, but it extends into newly dividing cells at the plant’s growing points and enables plant cells far removed from the initial infection site to be prepared when viruses get to them [36]. Furthermore, it appears that young plants can exert more resistance to viral infection and endogenously expressed viral transcripts [38]. This finding could explain why the multifractal analysis showed an early temporary recovery of PYVVi plants as denoted by the similarity of their reflectance spectrum compared to that of Ctrl plants, since plants at this stage were juveniles. Later on, the barrier of silencing RNA of PYVVi plants was overwhelmed by the infection and symptoms developed. It has been suggested [35] that the activation of silencing is accompanied by recovery of the host from the initially virulent infection so that the new growth is free of both symptom and virus and is highly resistant to a secondary challenge by the same virus. The recovery is cyclical: plants recover then show disease and then recover again. However, after a period, the virus accumulates to higher levels and the disease takes over the plant (D. Baulcombe, personal communication).
Figure 6. Analysis of discrete bands (blue, green, red and NIR) of reflectance spectra from plants. In the first experiment, (a) and (b), the difference between treatments was evident at the 25th day after infection. For the second experiment, (c) and (d), the difference between treatments was noticed on the 23rd day after infection.
Remotesensing 02 01197 g006

3.4. Spectral Vegetation Indices

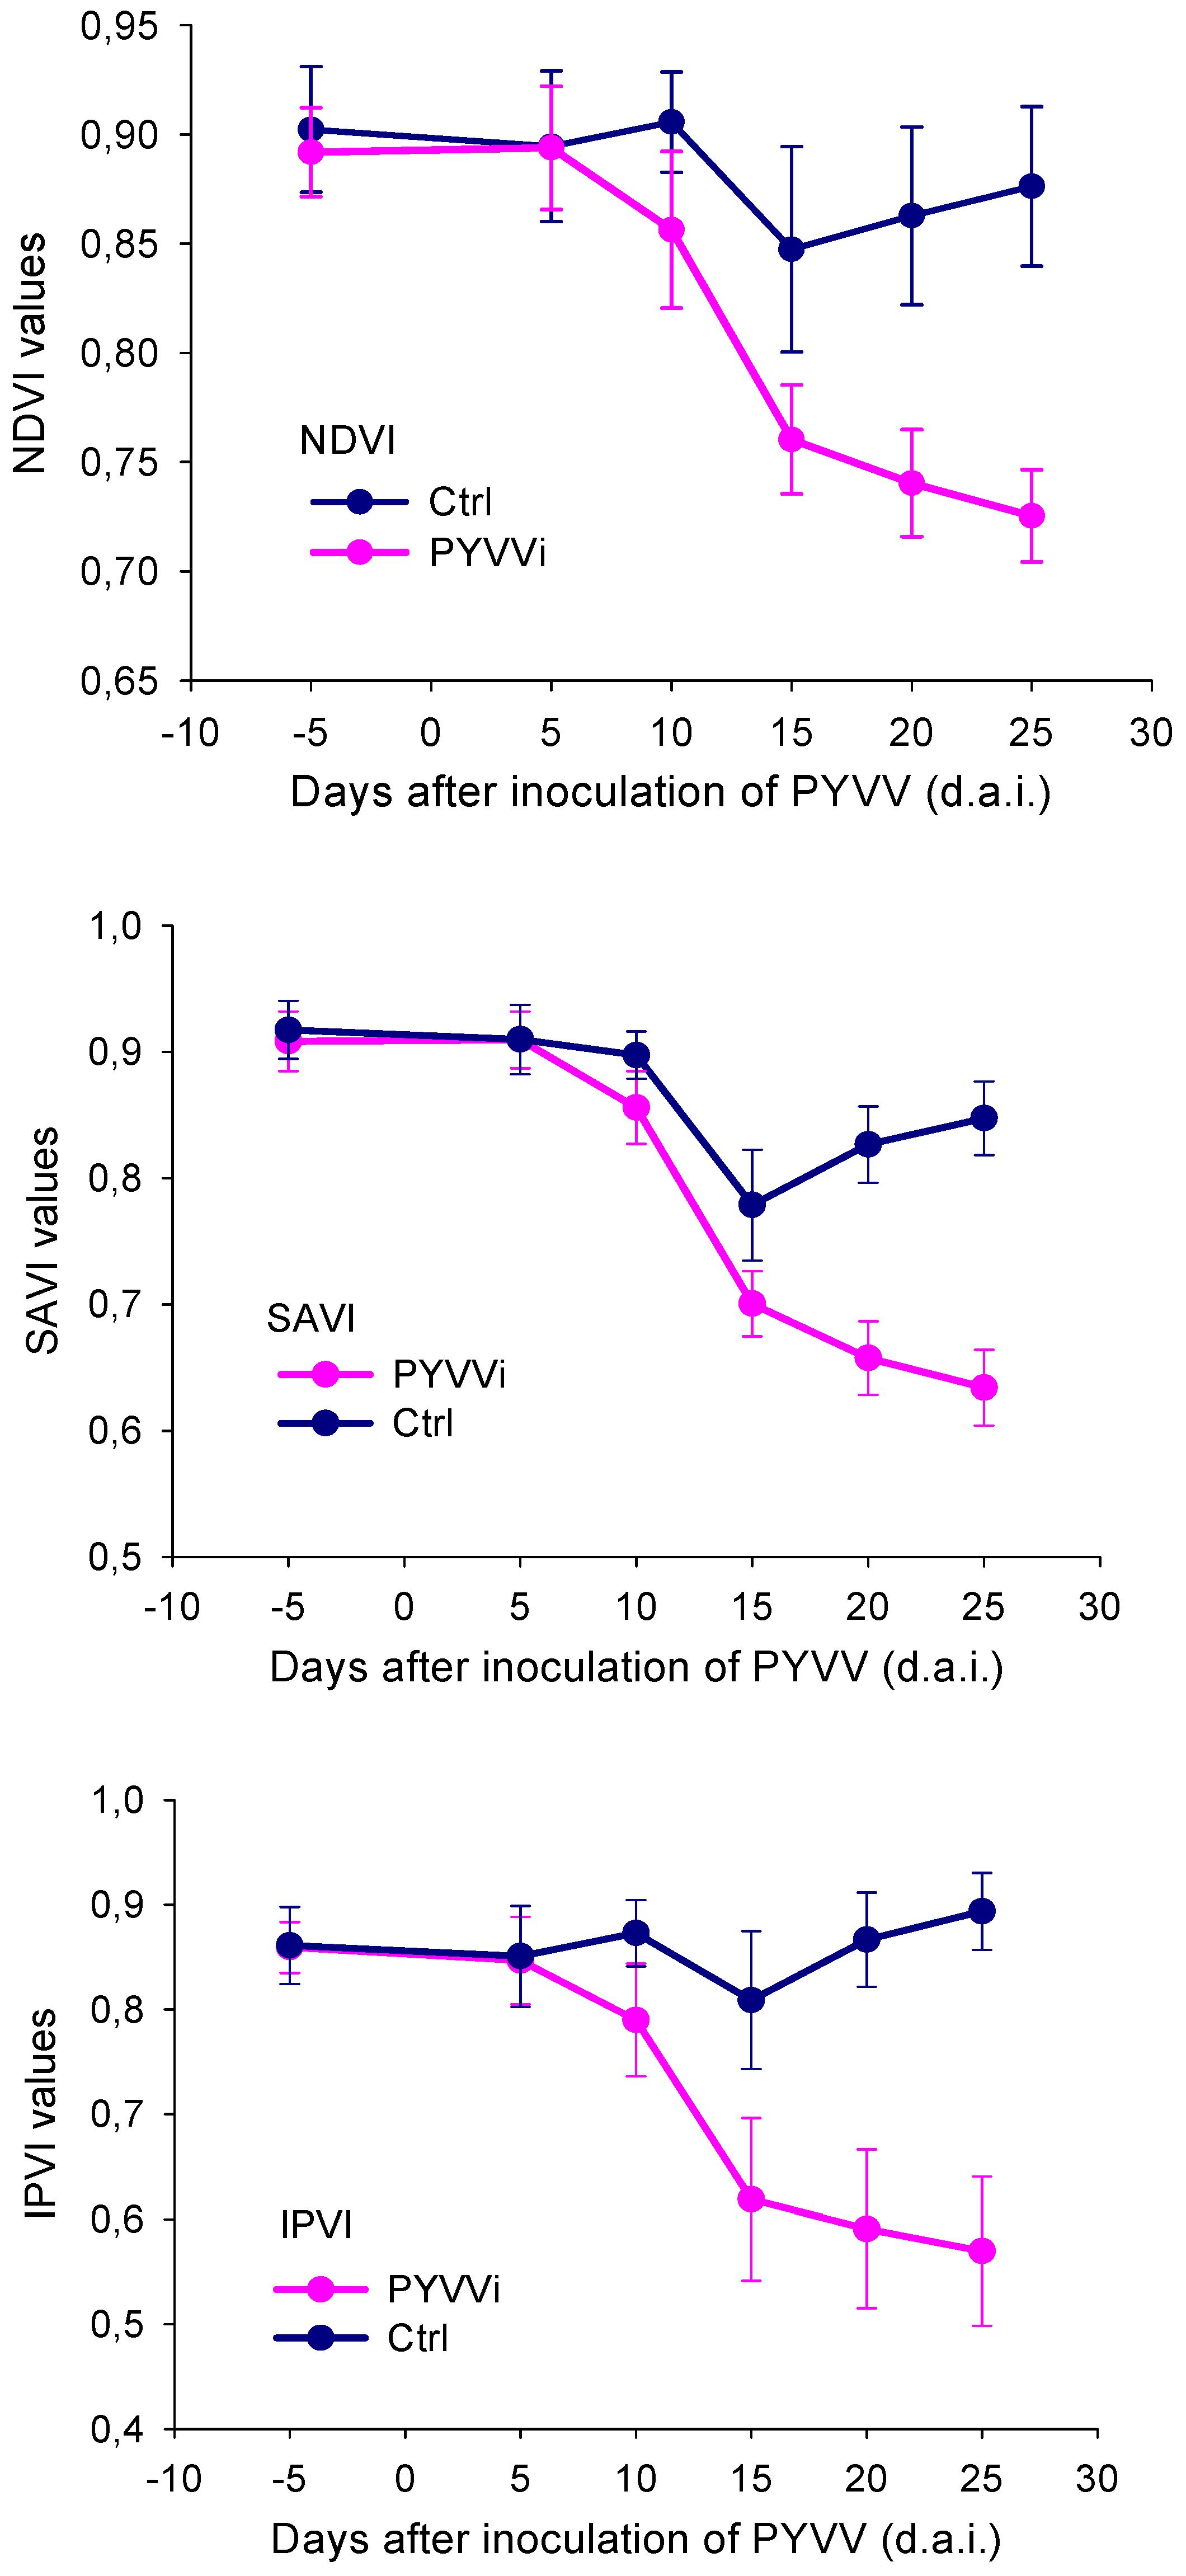
It has been pointed out [22] that vegetation indices are not sensitive to rapid changes in plant photosynthetic status caused by environmental stressors, as most vegetation indices have no direct link to photosynthetic functioning beyond their sensitivity to canopy structure and pigment concentrations. Nevertheless, our results did show a good diagnosis capability of NDVI, SAVI and IPVI for viral infection in potato plants, suggesting that damage to the photosynthetic tissues produced by the virus infection are rapidly reflected in the components of the vegetation indices. In fact, in agreement with the results described in a previous paper [8], the above-mentioned SVIs calculated from the multispectral images captured by the three bands (red, green and NIR) agricultural camera did show differences between treatments at 15–20 days after infection (Figure 7), which was around five days before the diagnosis obtained in the previous work, which used a two-band sensor (red and NIR) camera.
Figure 7. Spectral vegetation indices calculated from the images registered by the three-band (red, green, NIR) multispectral Tetracam® agricultural camera. Viral infection was evidenced 15 days after inoculation, 22 days before symptoms were visible.
Remotesensing 02 01197 g007

4. Conclusions

Early diagnosis of PYVV infection in potato plants, as reported in our previous work, was improved by applying a wavelet-based multifractal analysis to the primary remotely sensed spectroradiometry data, allowing for the earliest detection of infection ever reported: six days after inoculation—i.e., 29 days prior to the detection of visual symptoms by a trained eye—for the experiment with 25° of sensor aperture and four days after inoculation—i.e., 33 days before visual symptoms appeared—for the experiment with 1° of sensor aperture.
Diagnosis based on multifractal analysis of pre-processed data was very effective and sharper than that based on multifractal analysis of raw data obtained through a fore-optic sensor aperture of 25°. It appears that pre-processing is necessary when reflectance data are obtained through a 25° solid angle aperture sensor, but it is not imperative for data obtained through a 1° solid angle aperture sensor, owing to the precision of focus. In the former case, pre-processing (background correction and the use of anomalies) increased the signal to noise ratio, thus increasing the likelihood of earlier detection of differences.
The main advantages of multifractal analysis lay in the earliness of diagnosis of PYVV infection in plants and the statistical accuracy of results. This is due to the amplification of differences, which is an intrinsic feature of the methodology. The sensitivity with this processing methodology is such that differences prior to the transitory recovery period could be detected.
The spectral vegetation indices NDVI, SAVI and IPVI confirmed their usefulness in accurately evincing the infection caused by PYVV. The use of a three-band camera improved the earliness of prediction in five days compared to the diagnosis based on the use of a two-band camera as reported in our previous work. Although SVIs indicated infection no earlier than the occurrence of the recovery period, the discrete sections of the multispectral reflectance spectrum (blue, green, red, NIR) used to estimate them have confirmed their accuracy in diagnosing the PYVV infection, 25 and 23 days after the virus inoculation.

Acknowledgments

Support for this work was provided by the International Foundation for Science (IFS Grant 4068/-I), the Production Systems and the Environment Division of the International Potato Center (CIP), the CIP-ALTAGRO project, and the Agencia Española para la Cooperación Internacional of Ministerio de Asuntos Exteriores, Spain (MAE-AECI). The authors thank Luciano Ponce, Hugo Espinoza, Richard Uribe and Luis Silva from CIP for the logistical support, and R.T.J. McAteer for kindly sharing his wavelet-multifractal algorithm. P. Chávez gives special thanks to Arnauld A. Thiry for his constant and unconditional support, and Salomón Helfgott and Vicente Rázuri from La Molina Agricultural University for their helpful comments. We also thank Gary Harrison from CIP for his careful editorial review.

References and Notes

  1. Gilabert, M.A.; García-Haro, F.J.; González Piqueras, J. Acerca de los índices de vegetación. Revista de Teledetección 1997, 8, 1–10. [Google Scholar]
  2. Ritchie, G.L. Use of Ground-Based Canopy Reflectance to Determine Radiation Capture, Nitrogen and Water Status, and Final Yield in Wheat. M.Sc. Thesis, Utah State University, Logan, UT, USA, 2003. [Google Scholar]
  3. Brown, R.B.; Steckler, J.P.G.A.; Anderson, G.W. Remote sensing for identification of weeds in no-till corn. Trans. ASAE 1994, 37, 297–302. [Google Scholar] [CrossRef]
  4. Fitzgerald, G.; Maas, S.J.; DeTar, W.R. Detecting spider mite damage in cotton through spectral mixture analysis of aviris imagery. 2002. Available online: http://www.ars.usda.gov/research/publications/publications.htm?seq_no_115=132435 (accessed on 17 January 2005). [Google Scholar]
  5. Peñuelas, J.; Filella, I.; Lloret, P.; Muñoz, F.; Vilajeliu, M. Reflectance assessment of mite effects on apple trees. Int. J. Remote Sens. 1995, 16, 2727–2733. [Google Scholar] [CrossRef]
  6. Summy, K.R.; Everitt, J.H.; Escobar, D.E.; Alaniz, A.; Davis, M.R. Use of airborne digital video imagery to monitor damage caused by two honeydew-excreting insects on cotton. In Proceedings of the 16th Biennial Workshop in Videography and Color Photography in Resource Management, American Society of Photogrammetry and Remote Sensing, Bethesda, MD, USA, 29 April–1 May 1997; pp. 238–244.
  7. Gamon, J.A.; Peñuelas, J.; Field, C.B. A narrow waveband spectral index that tracks diurnal changes in photosynthetic efficiency. Remote Sens. Environ. 1992, 41, 35–44. [Google Scholar] [CrossRef]
  8. Chávez, P.; Zorogastúa, P.; Chuquillanqui, C.; Salazar, L.F.; Mares, V.; Quiroz, R. Assessing Potato Yellow Vein Virus (PYVV) infection using remotely sensed data. Int. J. Pest Manag. 2009, 55, 251–256. [Google Scholar] [CrossRef]
  9. Schertzer, D.; Lovejoy, S. Uncertainty and predictability in geophysics: chaos and multifractal insights. In State of the Planet, Frontiers and Challenges in Geophysics; Sparks, R.S.J., Hawkesworth, C.J., Eds.; AGU: Washington, DC, USA, 2004; pp. 317–334. [Google Scholar]
  10. Vicsek, T. Fractal Growth Phenomena, 2nd ed.; Word Scientific Publishing Co.: Singapore, 1992; p. 380. [Google Scholar]
  11. Schertzer, D.; Lovejoy, S. Nonlinear variability in geophysics: multifractal analysis and simulation. In Fractals: Physical Origin and Consequences; Pietronero, L., Ed.; Plenum: New York, NY, USA, 1989; pp. 49–79. [Google Scholar]
  12. McAteer, R.T.J.; Young, C.A.; Ireland, J.; Gallagher, P.T. The bursty nature of solar flare x-ray emission. The Astrophysical Journal 2007, 662, 691–700. [Google Scholar] [CrossRef]
  13. Montero Pascual, M.A. Aplicación de técnicas de análisis multifractal a distribuciones de tamaño-volumen de partículas de suelo obtenidas mediante análisis por difracción de láser. PhD Tesis, Universidad Politécnica de Madrid, Madrid, Spain, 2003. [Google Scholar]
  14. Posadas, A.N.D.; Giménez, D.; Quiroz, R.A.; Protz, R. Multifractal characterization of soil pore systems. Soil Sci. Soc. Am. J. 2003, 67, 1361–1369. [Google Scholar] [CrossRef]
  15. Posadas, A.N.D.; Quiroz, R.; Zorogastúa, P.; León-Velarde, C. Multifractal Characterization of the Spatial Distribution of Ulexite in a Bolivian Salt Flat. Int. J. Remote Sens. 2005, 26, 615–627. [Google Scholar] [CrossRef]
  16. Latka, M.; Glaubic-Latka, M.; Latka, D.; West, B. The loss of multifractality in migraines. 2002. Available online: http://arxiv.org/PS_cache/physics/pdf/0204/0204010v1.pdf (accessed on 7 March 2006).
  17. Yu, Z.G.; Anh, V.; Lau, K.-S. Multifractal characterisation of length sequences of coding and noncoding segments in a complete genome. Physica A 2001, 301, 351–361. [Google Scholar] [CrossRef]
  18. Byalovskii, Y.Y.; Bulatetskii, S.V.; Suchkova, Z.V. Heart rate variability and fractal neurodynamics during local magnetic vibroacoustic treatment. Hum Physiol 2005, 31, 413–420, Translated from Fiziologiya Cheloveka, 431(414), pp. 450–460. [Google Scholar] [CrossRef]
  19. Ivanov, P.C.; Nunes Amaral, L.A.; Goldberger, A.L.; Havlin, S.; Rosenblum, M.G.; Struzik, Z. R.; Stanley, H.E. Multifractality in human heartbeat dynamics. Nature 1999, 399, 461–465. [Google Scholar] [CrossRef] [PubMed]
  20. Blackburn, G.A.; Ferwerda, J.G. Retrieval of chlorophyll concentration from leaf reflectance spectra using wavelet analysis. Remote Sens. Environ. 2008, 112, 1614–1632. [Google Scholar] [CrossRef]
  21. Jaffard, S. Wavelet techniques in multifractal analysis, fractal geometry and applications. In Proceedings of Symposia in Pure Mathematics, Providence, RI, USA, 2004.
  22. Dobrowski, S.Z.; Pushnik, J.C.; Zarco-Tejada, P.J.; Ustin, S.L. Simple reflectance indices track heat steady-state chlorophyll fluorescence at the canopy scale. Remote Sens. Environ. 2005, 97, 403–414. [Google Scholar] [CrossRef]
  23. Huete, A.R. A soil-adjusted vegetation index (SAVI). Remote Sens. Environ. 1988, 25, 295–309. [Google Scholar] [CrossRef]
  24. Crippen, R.E. Calculating the vegetation index faster. Remote Sens. Environ. 1990, 34, 71–73. [Google Scholar] [CrossRef]
  25. Yarlequé, C. Análisis de campos de biomasa del altiplano usando wavelet y parámetros universales multifractales. Tesis de Licenciatura en Física, Universidad Nacional del Callao, Perú, 2009; p. 202. [Google Scholar]
  26. Filella, I.; Penuelas, J. The red edge position and shape as indicators of plant chlorophyll content, biomass and hydric status. Int. J. Remote Sens. 1994, 15, 1459–1470. [Google Scholar] [CrossRef]
  27. Han, L.; Rundquist, D.C. Comparison of NIR/RED ratio and first derivative of reflectance in estimating algal-chlorophyll concentration: A case study in a turbid reservoir. Remote Sens. Environ. 1997, 62, 253–261. [Google Scholar] [CrossRef]
  28. Mallat, S. A Wavelet Tour of Signal Processing, 2nd ed.; Academic Press: San Diego, CA, USA, 1999; p. 637. [Google Scholar]
  29. Muzy, J.F.; Bacry, E.; Arneodo, A. Wavelets and multifractal formalism for singular signals: Application to turbulence data. Phys. Rev. Lett. 1991, 67, 3515–3518. [Google Scholar] [CrossRef] [PubMed]
  30. Lavallée, D. Multifractal analysis and simulation techniques and turbulent fields. Ph.D. Thesis, McGill University, Quebec, Canada, 1991; p. 132. [Google Scholar]
  31. Arneodo, A.; Bacry, E.; Graves, P.V.; Muzzy, J.F. Characterizing long-range correlations in DNA sequences from wavelet analysis. Phys. Rev. Lett. 1995, 74, 3293–3296. [Google Scholar] [CrossRef] [PubMed]
  32. Wolfinger, R.D.; Chang, M. Comparing the SAS GLM and MIXED procedures for repeated measures. In SUGI Proceedings; Cary, NC, USA, 1998. [Google Scholar]
  33. Campbell, J.B. Introduction to Remote Sensing, 2nd ed.; The Guilford Press: New York, NY, USA, 1996; p. 622. [Google Scholar]
  34. Schowengerdt, R.A. Remote Sensing, Models and Methods for Image Processing; Academic Press: San Diego, CA, USA, 1997; p. 522. [Google Scholar]
  35. Ding, S.W. RNA silencing. Curr. Opin. Biotechnol. 2000, 11, 152–156. [Google Scholar] [CrossRef]
  36. Argerter, M. Plant viruses discover how to overcome gene silencing. Washington State University: Pullman, WA, USA, 1999. Available online: http://www.wsu.edu/NIS/Universe/virus.htm (accessed on 9 April 2007).
  37. Baulcombe, D. RNA Silencing in plants. Nature 2004, 431, 356–363. [Google Scholar] [CrossRef] [PubMed]
  38. Siddiqui, S.A. RNA silencing and its inhibition in transgenic tobacco plants. Ph.D. Thesis, University of Turku, Turku, Finland, 2007. [Google Scholar]
  39. Falconer, K. Techniques in Fractal Geometry; John Wiley and Sons Ltd.: New York, NY, USA, 1997. [Google Scholar]
  40. Chhabra, A.B.; Meneveu, C.; Jensen, R.V.; Sreenivasan, K.R. Direct determination of the f(a) singularity spectrum and its application to fully developed turbulence. Physical Review A 1989, 40, 5284–5294. [Google Scholar] [CrossRef] [PubMed]
  41. Bacry, E.; Muzy, J.F.; Arnéodo, A. Singularity spectrum of fractal signals from wavelet analysis: exact results. J. Stat. Phys. 2003, 70, 635–674. [Google Scholar] [CrossRef]
  42. Addison, P.S. The Illustrated Wavelet Transform Handbook: Introductory Theory and Applications in Science, Engineering, Medicine and Finance; Institute of Physics Publishing: Bristol, UK, 2002; p. 368. [Google Scholar]
  43. Arneodo, A.; Grasseau, G.; Holschneider, M. Wavelet transform of multifractals. Phys. Rev. Lett. 1988, 61, 2281–2284. [Google Scholar] [CrossRef] [PubMed]
  44. Daves, A.M.C. Back to basics: spectral pre-treatments—Derivatives. Tony Davies Column 2007, 19, 32–33. [Google Scholar] [CrossRef]

Appendix

The Continuous Wavelet Transform and the Wavelet Transform Modulus Maxima Multifractal

The multifractal formalism is based on the calculation of two sets of coefficients associated with the signals: the Hölder exponents that quantify the local regularity of a signal or function f, and the multifractal spectrum (MS) that quantifies the multifractality of f. The MS relates each group of data having the same regularity at a given point with the Hausdorff dimension (or fractal dimension) of the set of points. In this way, it defines a function between the Hölder exponent and the Hausdorff dimension that is also known as the spectrum of singularities [39]. It has been demonstrated [40] that the MS corresponds to the entropy density of the system, whereas the set of Hölder exponents is related with its free energy. Some years later, [29,31,41] developed a statistical method for the estimation of the MS based on the study of the maxima of the continuous wavelet transform (CWT) of the signal. This method is known as the wavelet transform modulus maxima (WTMM) method, which was used for our reflectance signal analysis to obtain the MS.
The wavelet transform is a convolution product of the data sequence (a function f(t), where t is usually a time or space variable) with the scaled and translated version of the analyzing wavelet ψ(x), called the mother wavelet [42]. The scaling and translation are performed by two parameters; the scale parameter a stretches (or compresses) the mother wavelet to the required resolution, and the translation parameter b shifts the analyzing wavelet to the desired location [12,43].
W T ( b , a ) = 1 a + ψ * ( x b a ) f ( t ) d t ,
where a and b are real, a > 0 for the continuous version (CWT) and ψ* is the complex conjugate of ψ (the mother wavelet). The wavelet transform acts as a microscope: it reveals more and more details while going toward smaller scales (i.e., toward smaller a values).
The mother wavelet (ψ(x)) is generally chosen to be well localized in space (or time) and frequency. Usually, ψ(x) is only required to be zero mean, but for the particular purpose of multifractal analysis, ψ(x) is also required to be orthogonal to some low-order polynomials, up to the degree n:
x m ψ ( x ) d x = 0 ,   m ,   0 m < n
Thus, while filtering out the trends, the wavelet transform can reveal the local characteristics of a signal and, more precisely, its singularities. The Hölder exponent can be understood as a global indicator of the local differentiability of a function. By preserving both scale and location (time, space) information, the CWT is an excellent tool for mapping the changing properties of non-stationary signals. A class of commonly used real-valued analyzing wavelets, which satisfies the above condition (1b), is given by the successive derivatives of the Gaussian function:
ψ η ( t ) = d η d t η e t 2 2 ,
where η is the ηth derivative of the Gaussian function for which we used η = 2, the Mexican hat wavelet.
It has been shown [31] that there is always at least one maxima ridgeline pointing toward any singularity, t0, and this scales as
W T ( t 0 , a ) ~ a h ( t 0 ) , a 0 .
The exponent h(t0) describes the local degree of singularity or regularity around the point t0 and is called the Hölder exponent (or singularity strength). The singularities can be measured by calculating their h(t0) exponent, which permits the characterization of singularities in time regardless of whether the derivative exists at that point. The Hölder exponent is a useful tool for mathematically encapsulating the notion of ‘‘sharp changes’’ in a time series. Locally, the Hölder exponent h(t0) is then governed by the singularities that accumulate at t0. This results in unavoidable oscillations around the expected power-law behavior of the wavelet transform amplitude. The exact determination of h from log-log plots on a finite range of scales is therefore somewhat uncertain [32]. WTMM methods circumvent these difficulties. As proven by [31], the WTMM (i.e., the local maxima of |TW(t,a0)| at a given scale a0) detect all the singularities of a large class of signals. Thus, they are likely to contain all the information on the hierarchical distribution of singularities in the signal.
When singularities are well separated in time, these can be used to calculate the local Hölder exponent for each singularity. However, when singularities are not isolated, use of the canonical approach proposed by [40] and further elaborated by [32] is preferred, where the new measurement is defined as:
μ m m i ( q , a ) = | W T ( t m m i , a ) | q m m i | W T ( t m m i , a | q ,
where | W T ( t m m i , a ) | are the local maxima at the scale a and interval tmmi, and t and mm are the location parameter and location index, respectively. Then, the scaling exponent, h, and the singularity spectrum, D(h), are calculated from [29,32].
h ( q ) = lim a 0 1 log a m m i μ m m i ( q , a ) log | W T ( t m m i , a ) | ,
and
D ( h ( q ) ) = lim a 0 1 log a m m i μ m m i ( q , a ) log μ m m i ( q , a ) ,
where h is the Hölder exponent (internal energy), D(h) is the singularity spectrum (entropy), tmm denotes all positions of local maxima of |TW(t,a0)| at some scale a0, being mm the index referring to the modulus maxima and q is the statistical moment. The moment q provides a microscope for exploring different regions of the singular measure. For q > 1, u(q) amplifies the more singular regions of the measure, whereas for q < 1, it accentuates the less singular regions, and for q = 1, the measure μ(1) replicates the original measurement [40].
The curve defined by D(h) against h is called the singularity (or multifractal) spectrum and fully describes the statistical distribution of the system. Hence, by studying the singularities of the passive reflectance of plants across time, one is in effect characterizing the dynamics of the non-smooth reflectance processes.
Software based on Equations 5 and 6 that describe the canonical method of the WTMM was implemented by [12] to run it in IDL6.2 for Linux. This software was modified to analyze our reflectance spectrum data following the methodology described by [43] and adapted to run in IDL 6.3 for Windows®. The reflectance data obtained from the above-mentioned experiments were processed with the WTMM method using the second derivative of the Gaussian function (Mexican hat) as mother wavelet analyzer. Derivatives are a reliable method for removing the noise or disturbance from remote sensing data, such as the additive baseline shift and the linear baseline increase [2,44].