Mapping Irrigated Lands at 250-m Scale by Merging MODIS Data and National Agricultural Statistics


Abstract
1. Introduction
2. Background
2.1. Irrigation and Irrigation Water Use in the United States
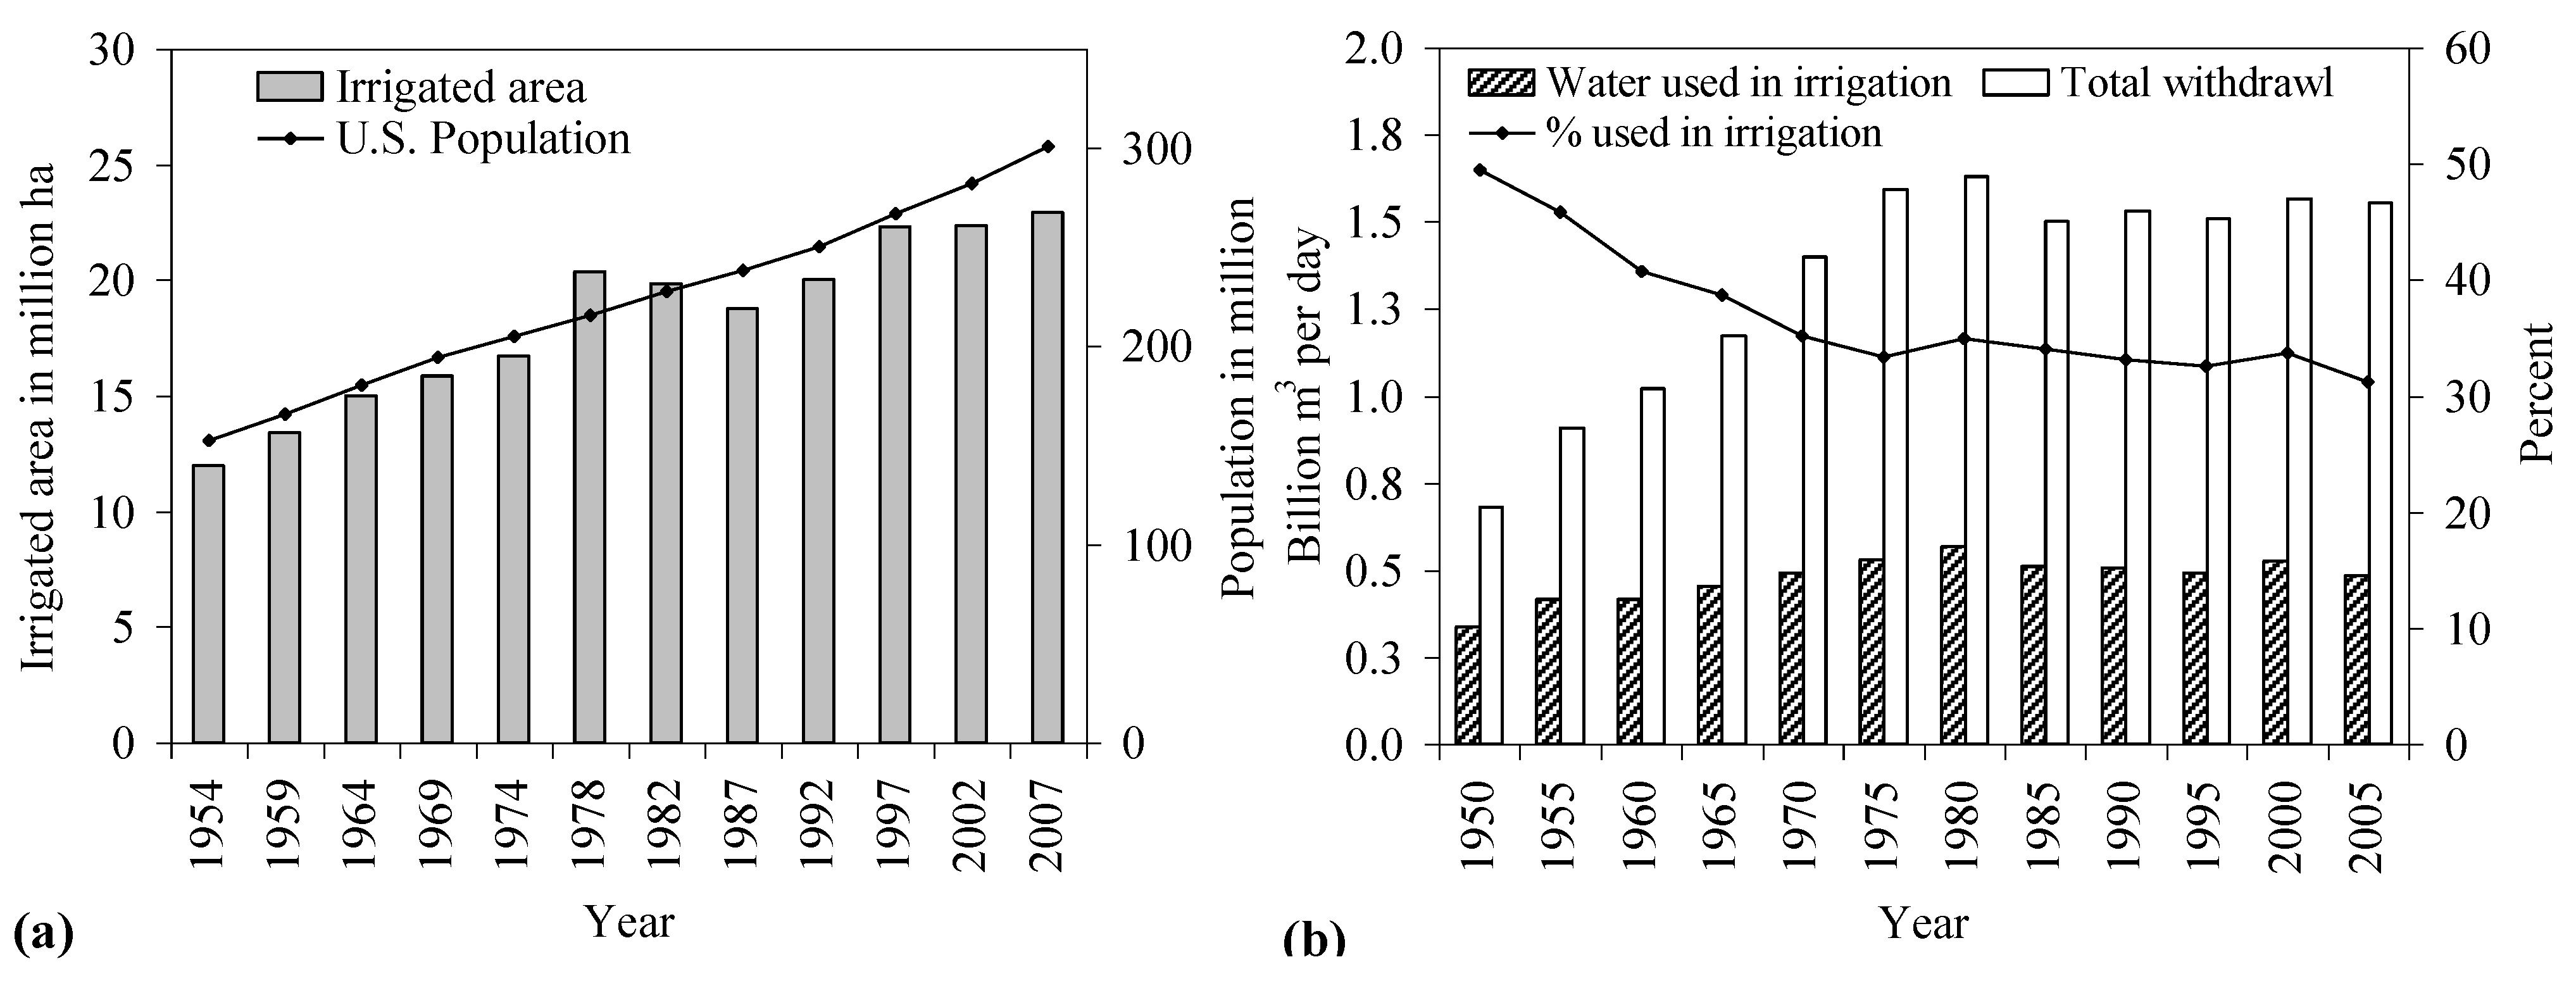
2.2. Irrigation Statistics in the United States
2.3. Existing Geospatial Irrigation Maps
3. Materials and Method
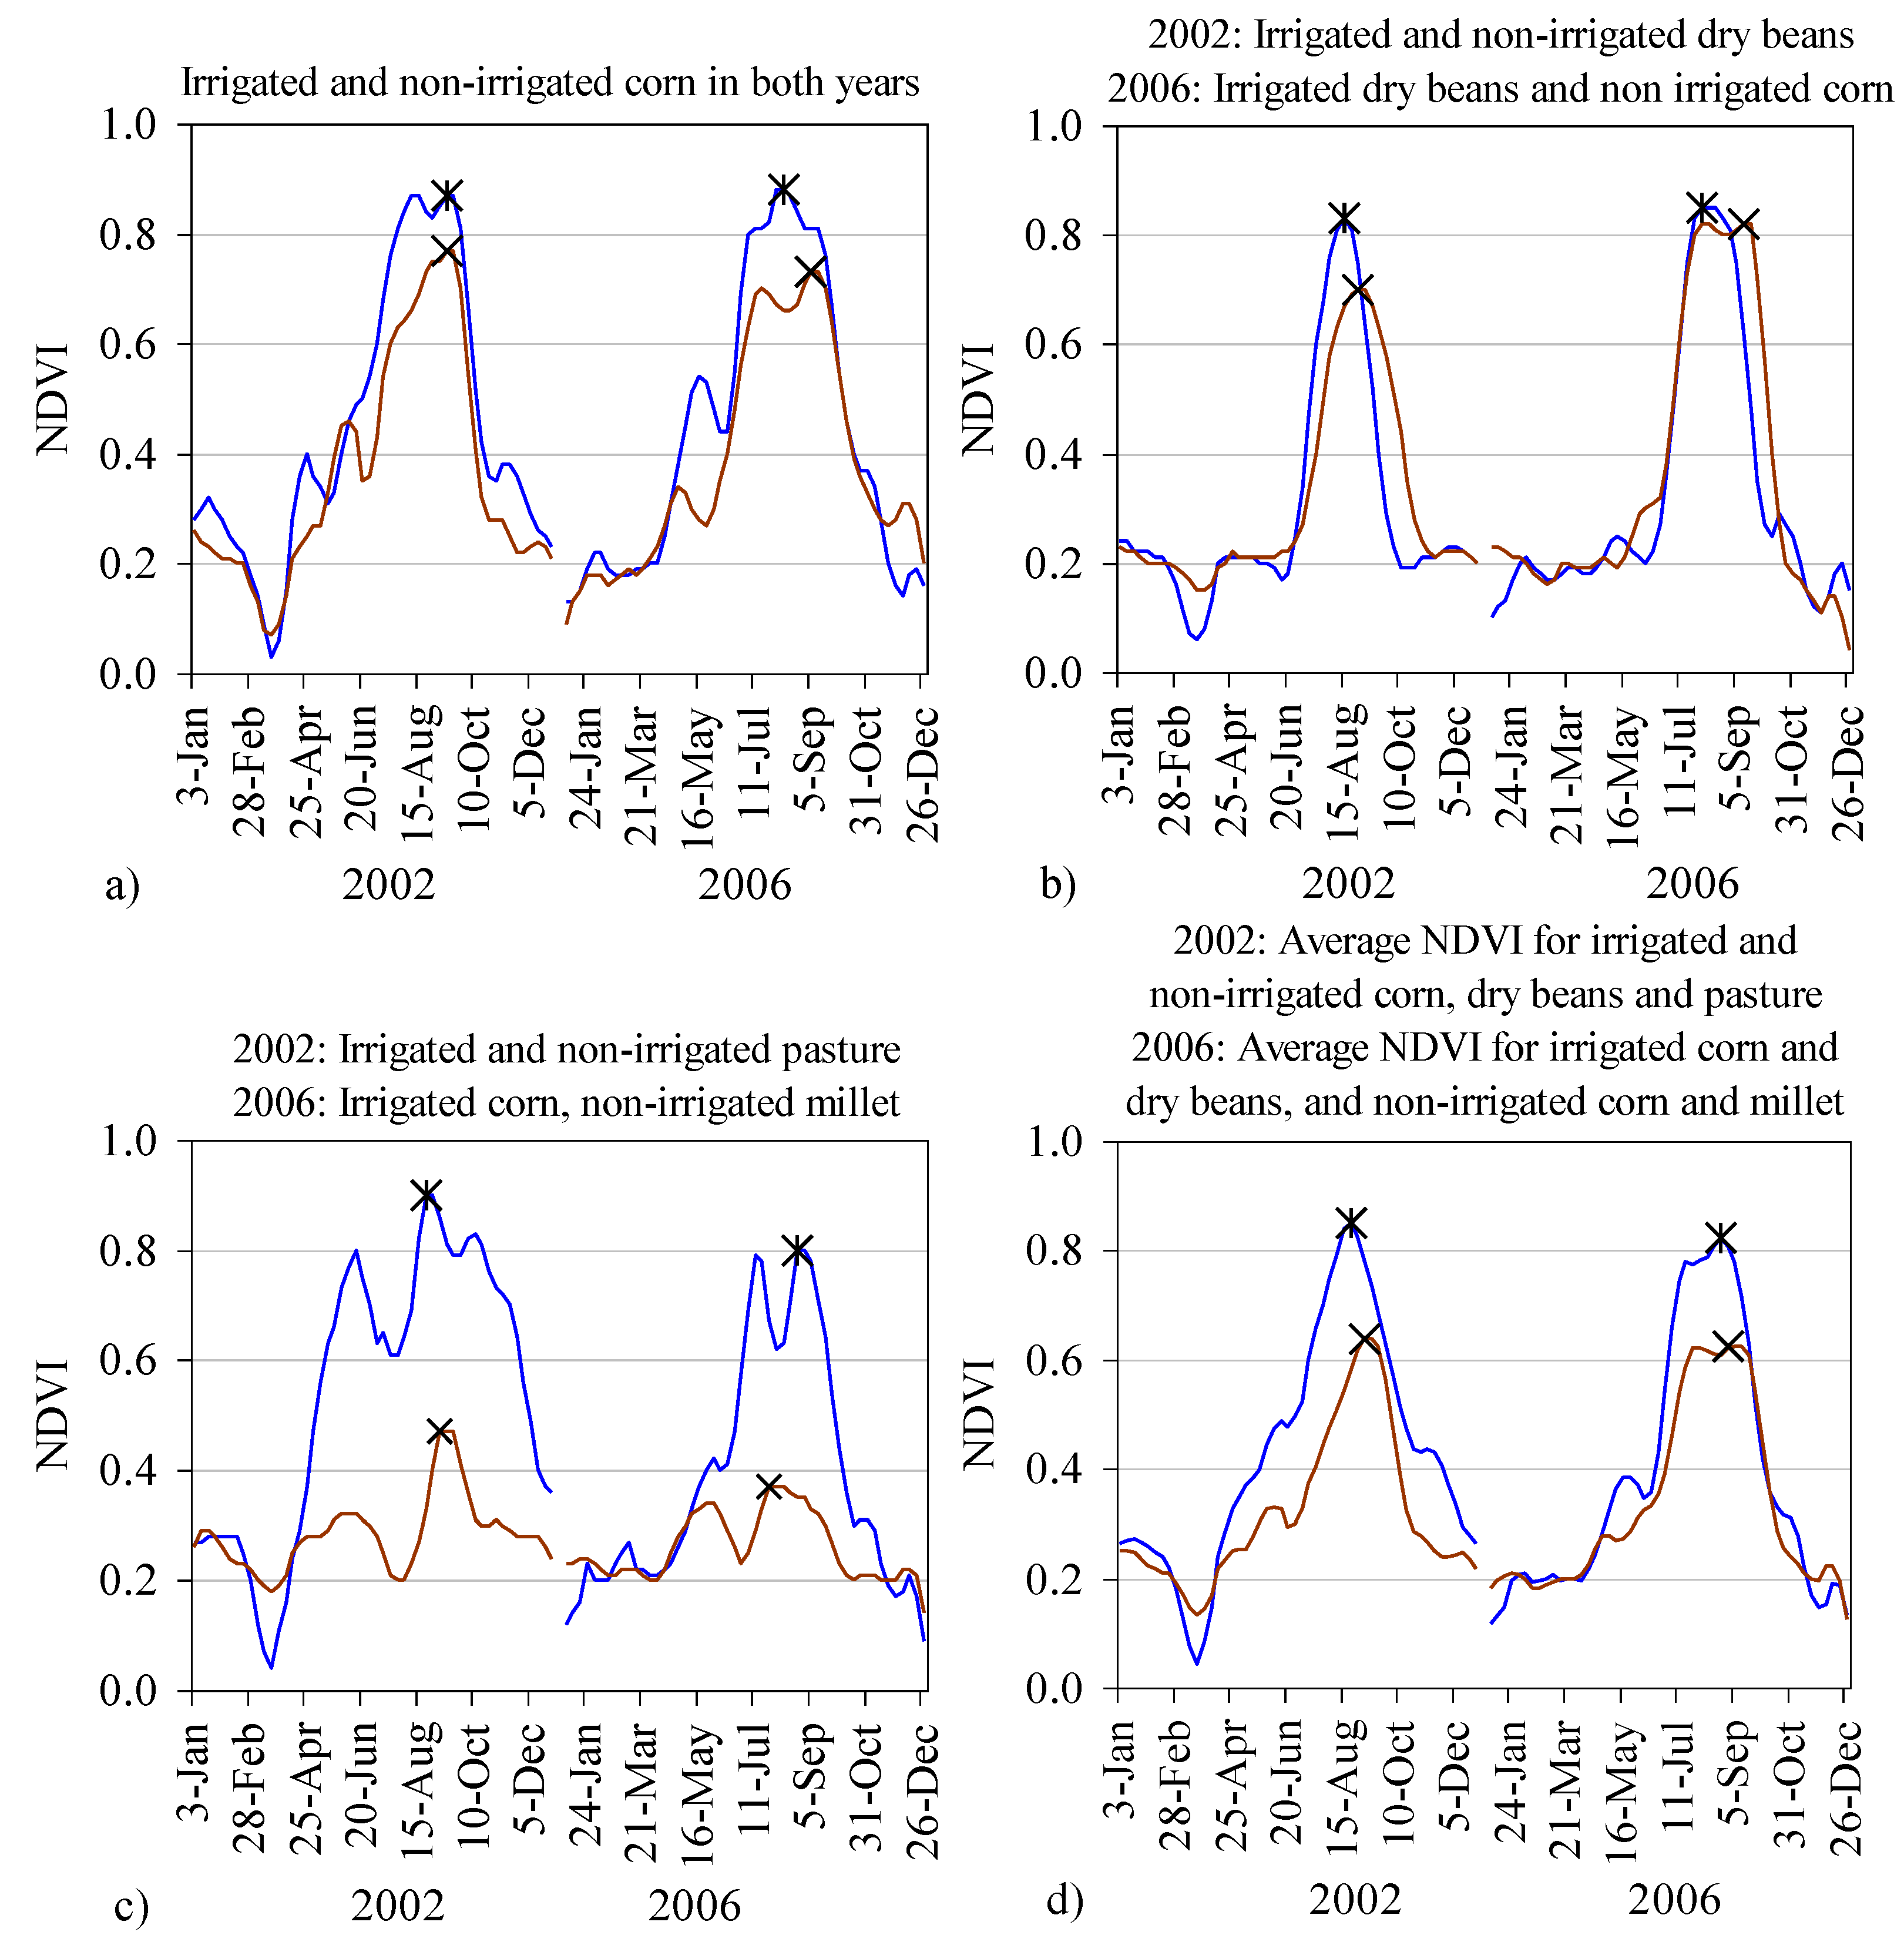
- Irrigated crops have higher annual peak NDVI values than non-irrigated crops in the same county.
- The growing season peak NDVI, at any time it occurs, will vary for each crop and for each geographic region of the United States.
- The difference in NDVI between irrigated and non-irrigated crops will be enhanced under non-optimal precipitation conditions (e.g., drought).
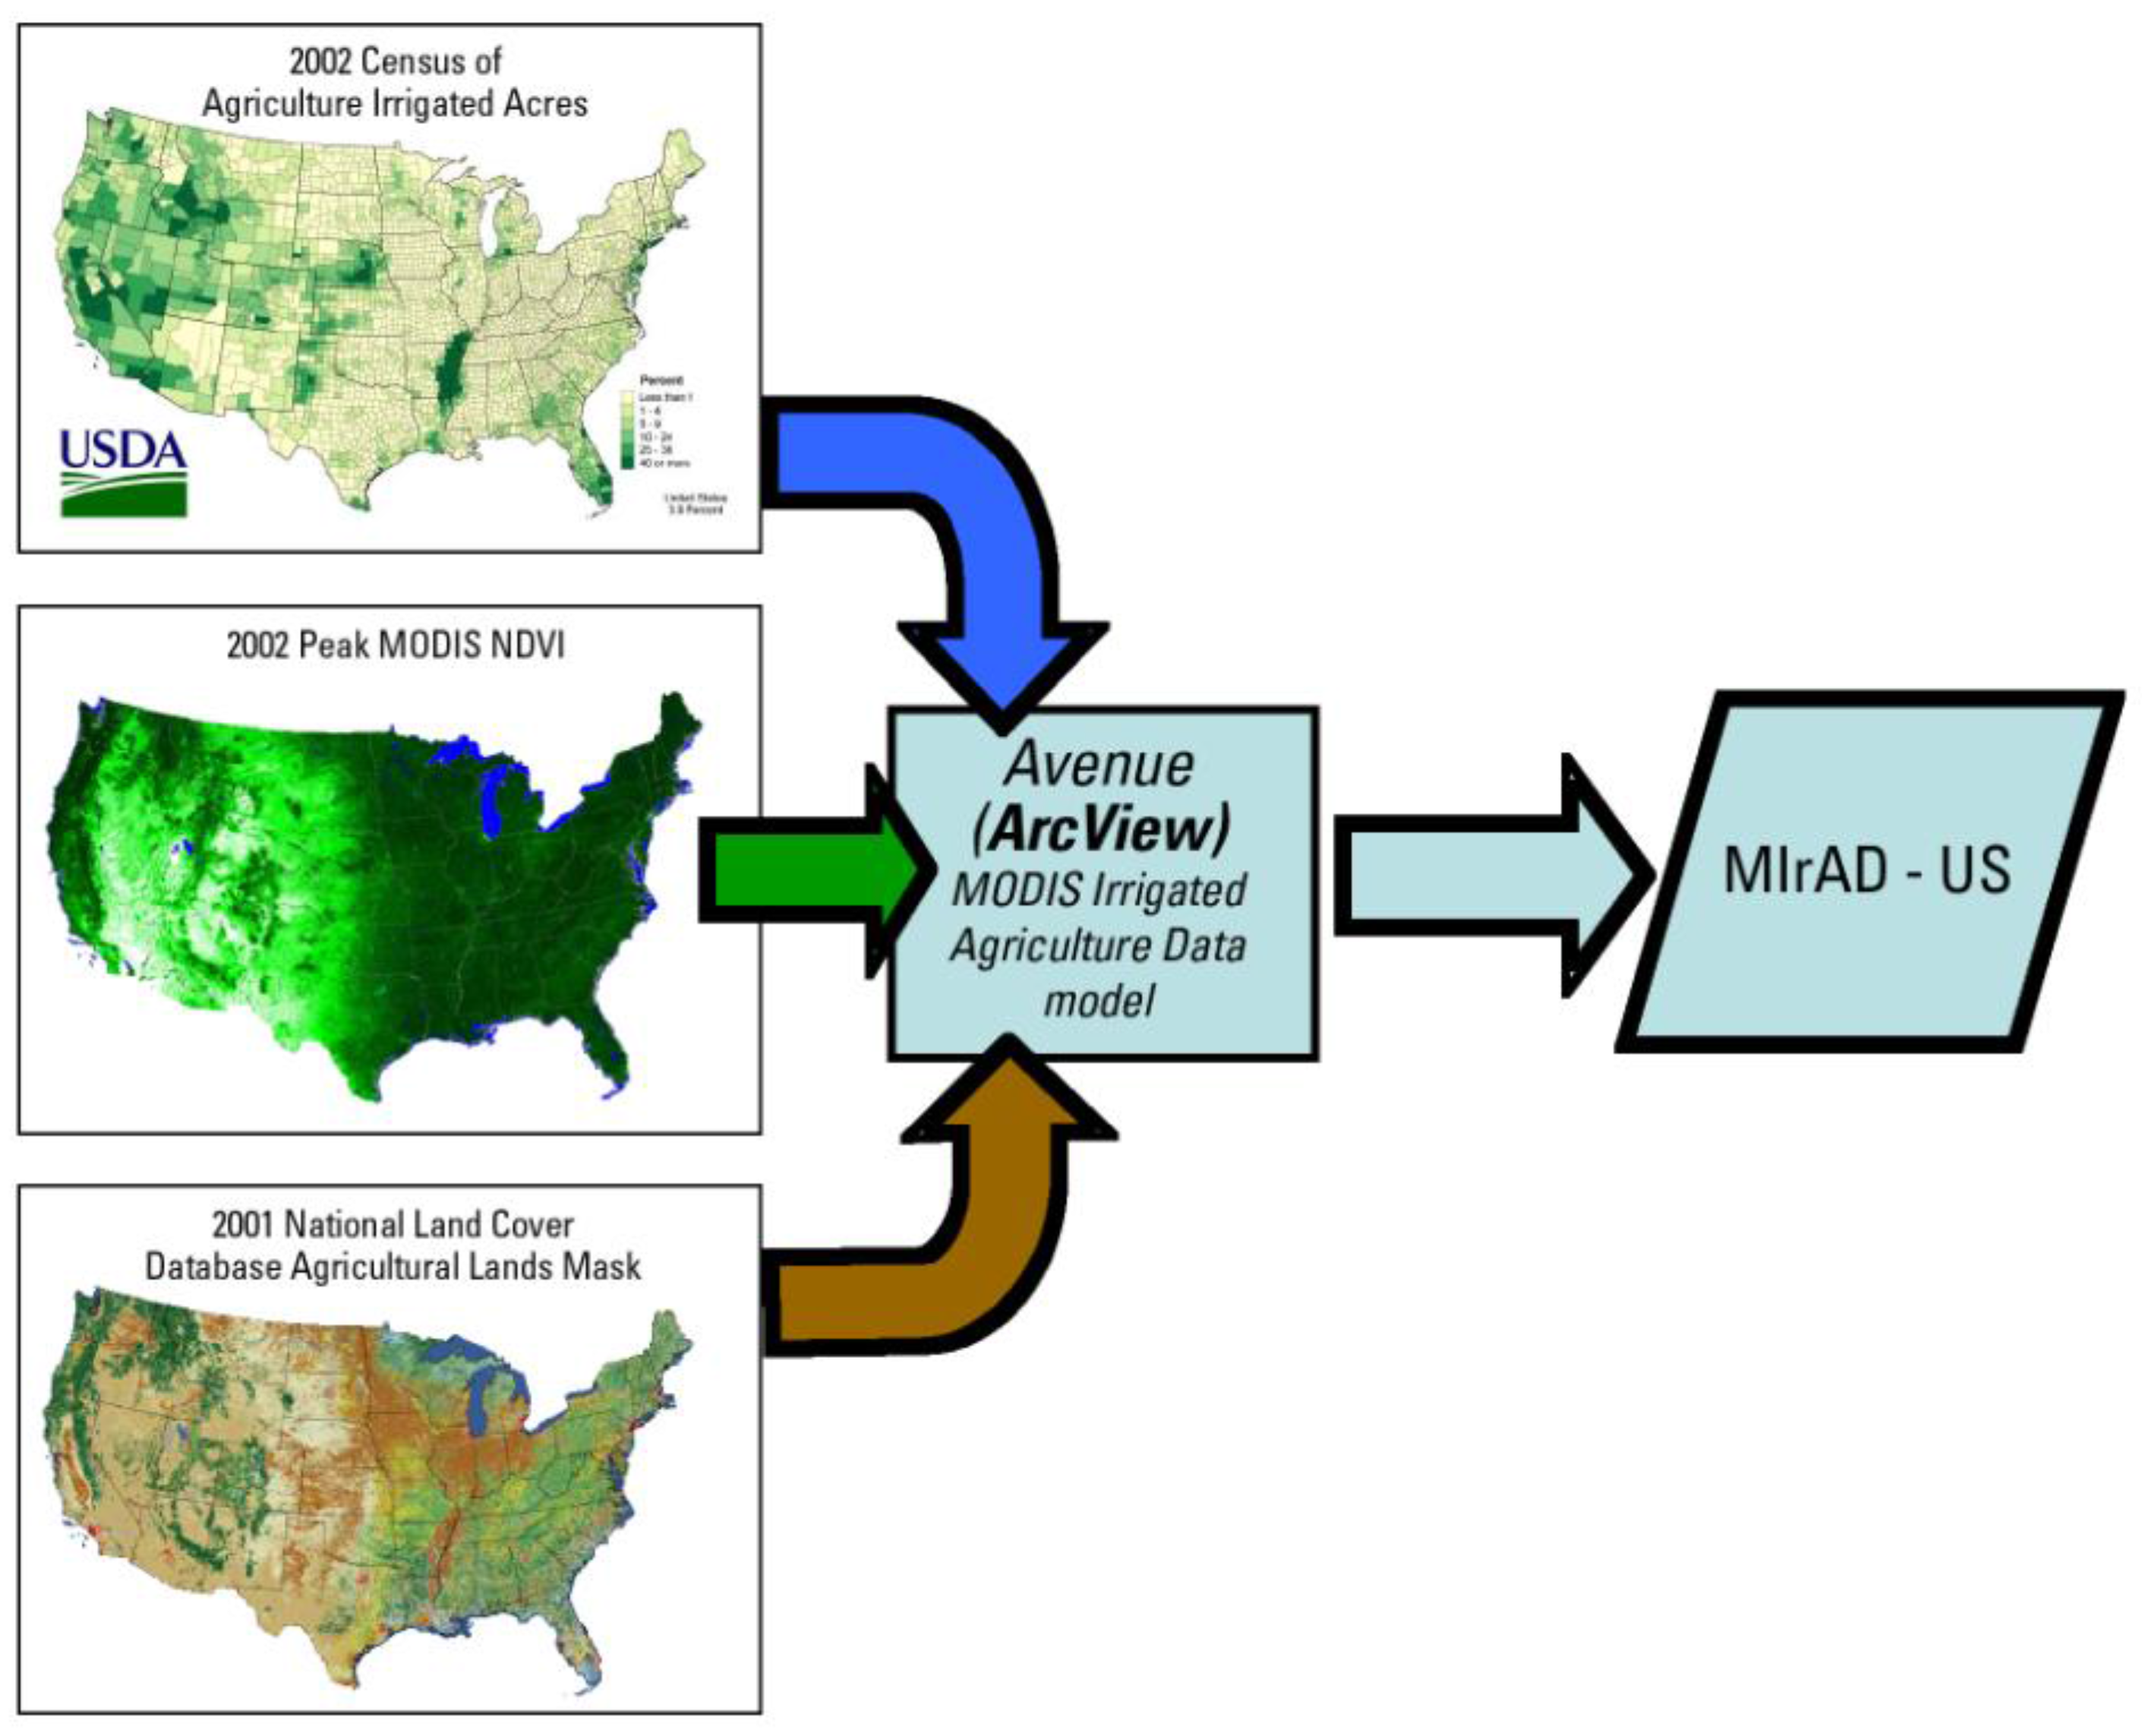
3.1. Input Data
County Irrigation Statistics
MODIS Annual Peak NDVI
Land cover
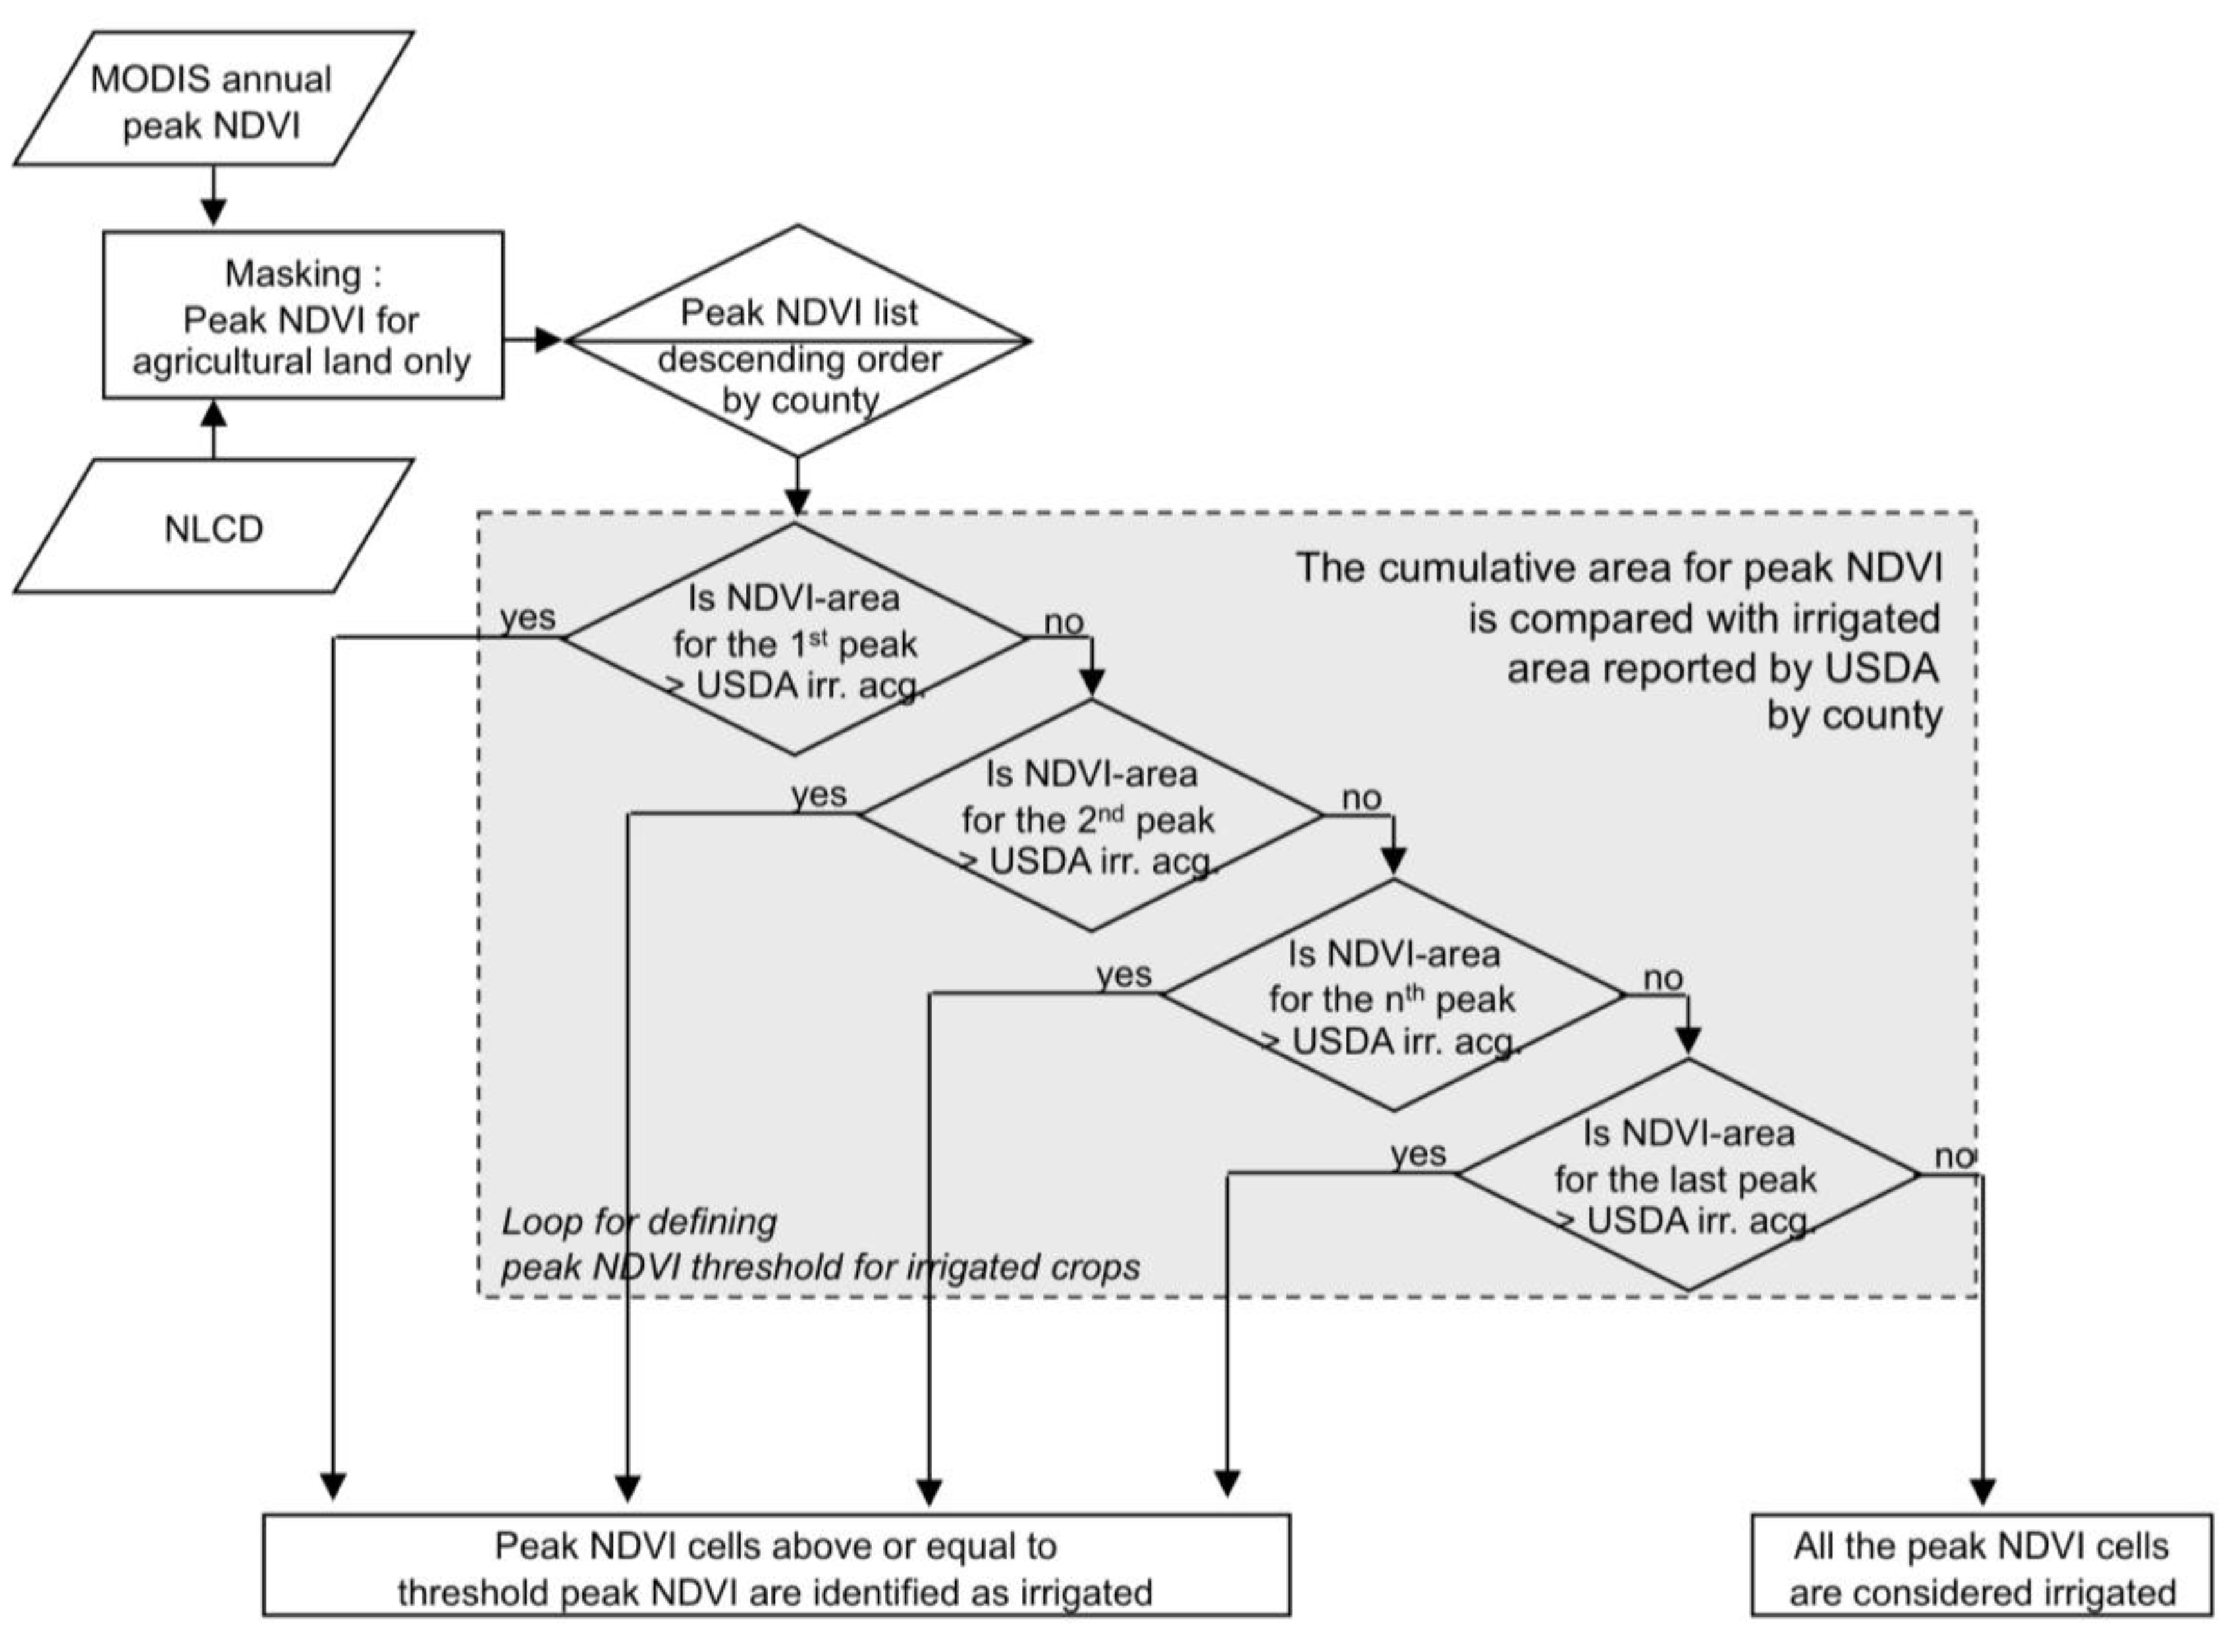
3.2. Description of the Geospatial Model
4. MIrAD-US for the Conterminous United States
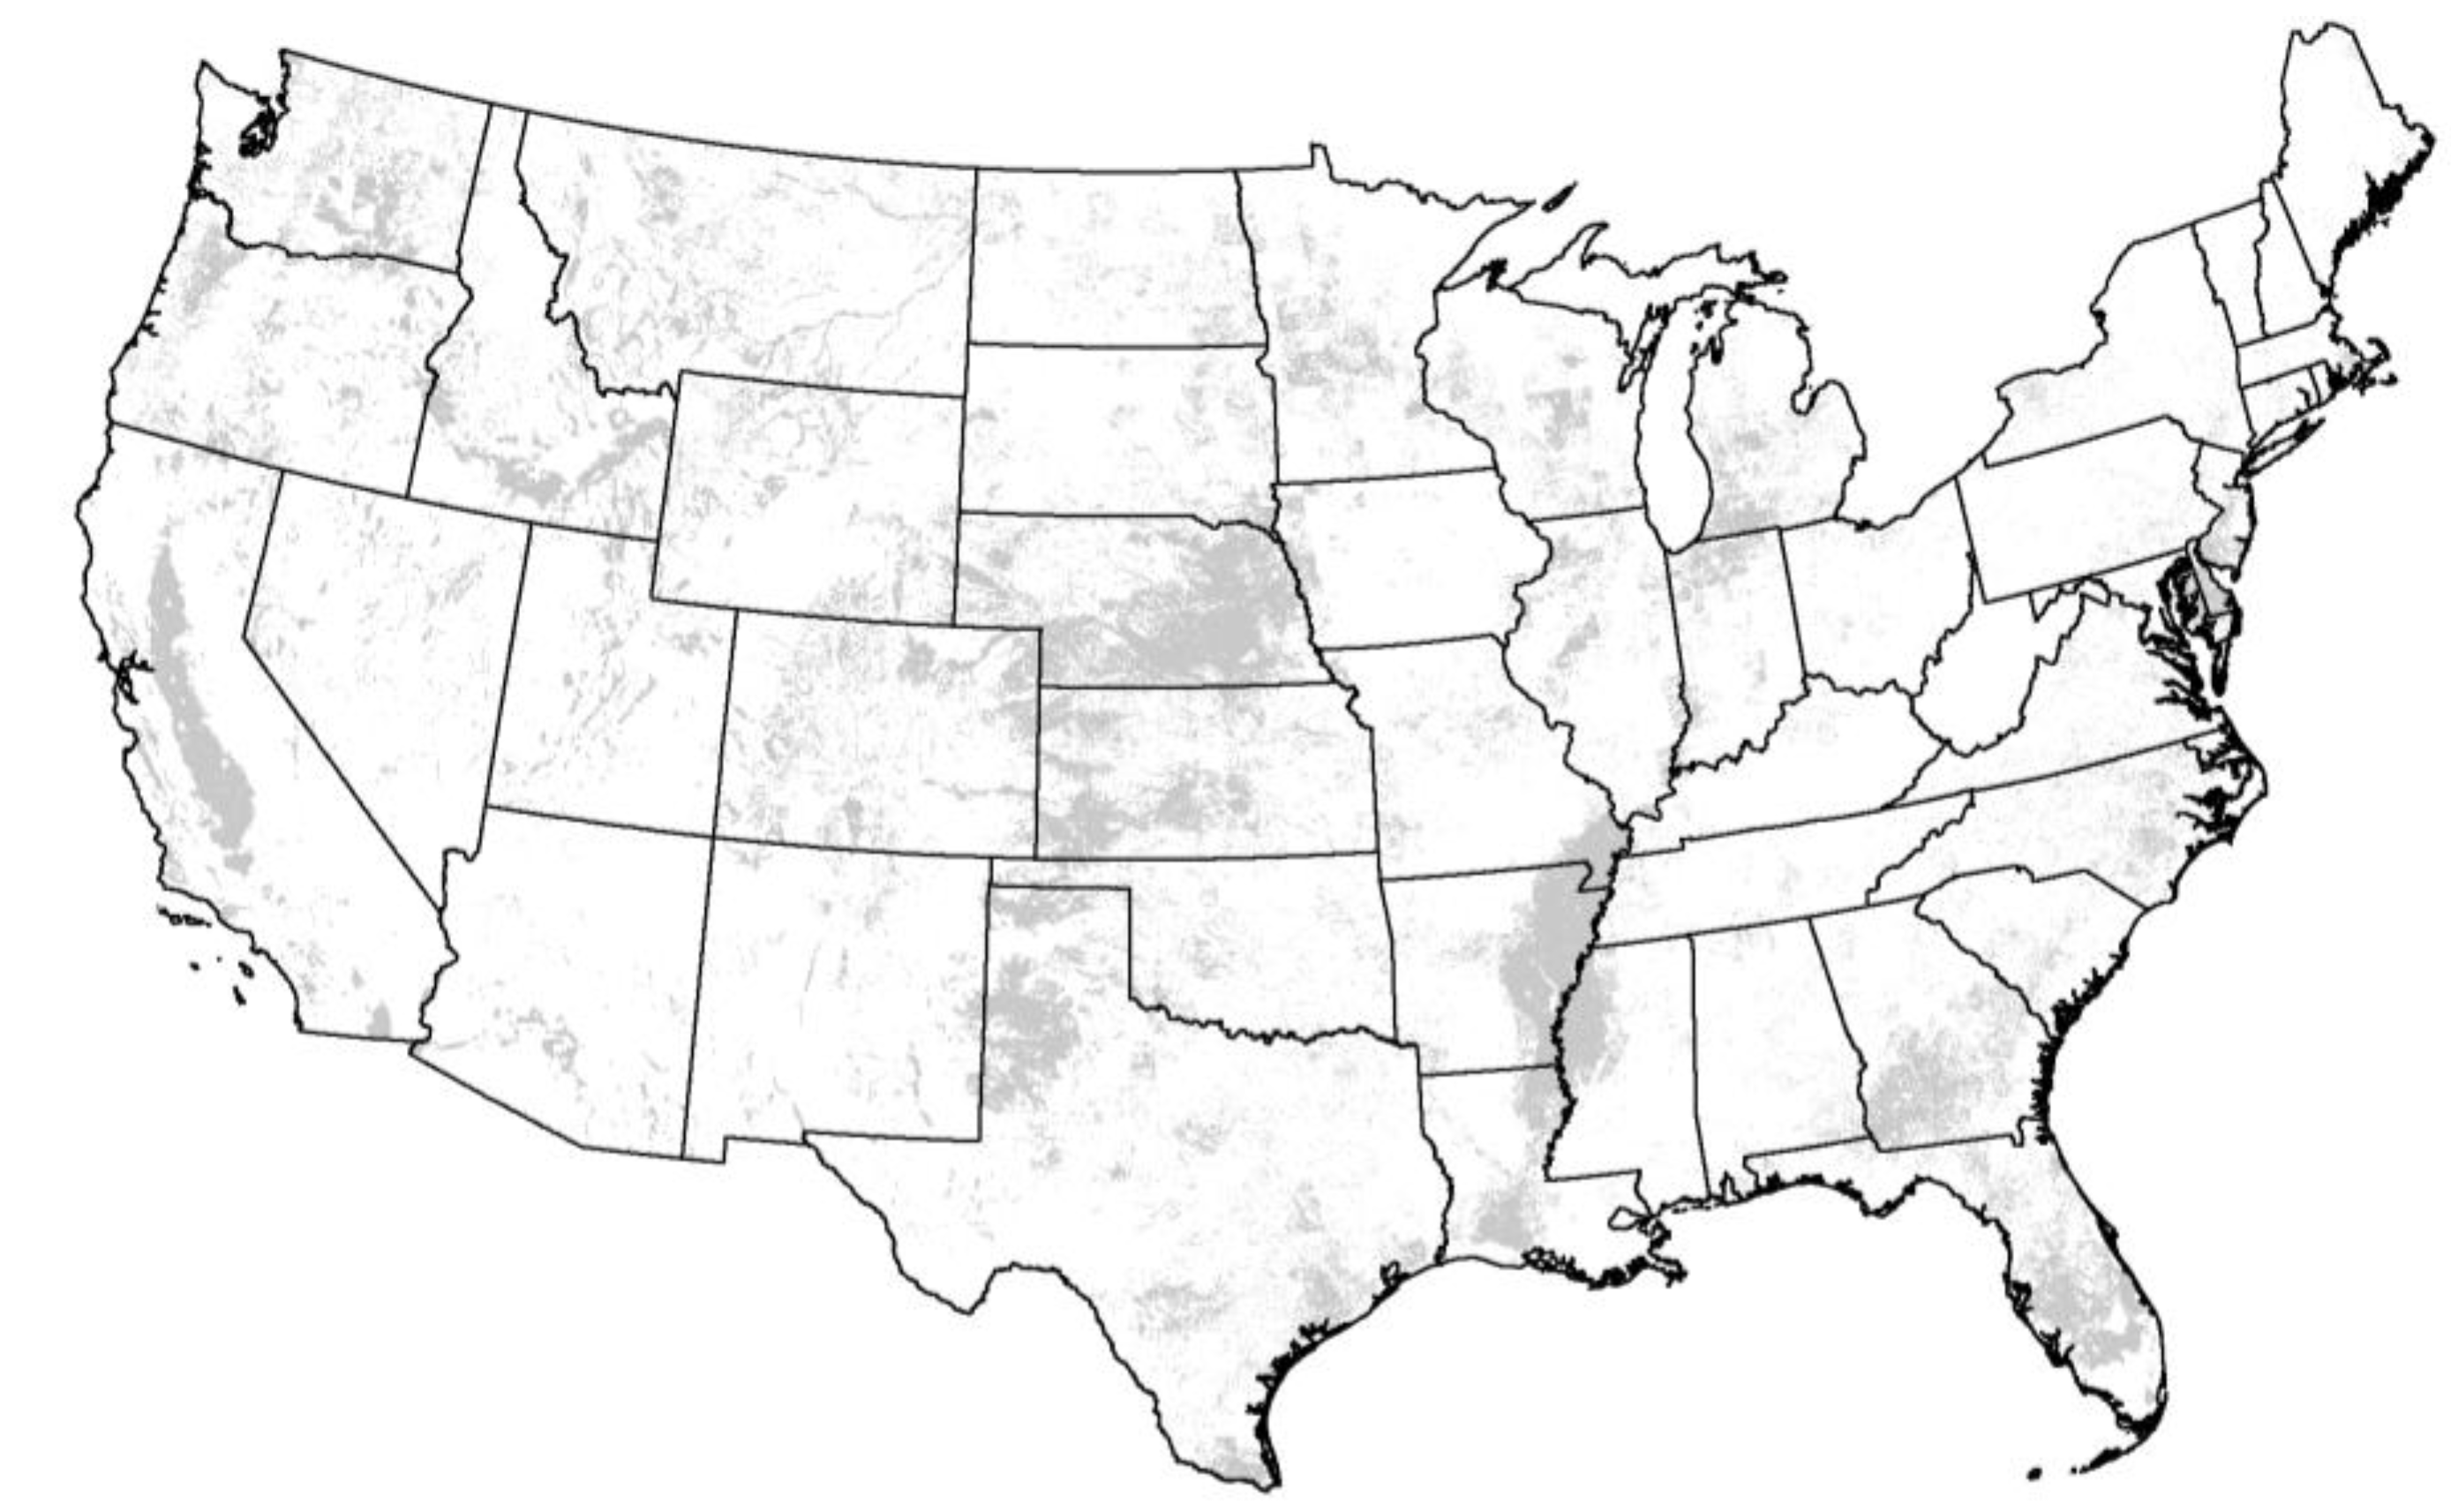
4.1. Results

| States | Irrigated lands by source in ha | % Difference | States | Irrigated lands by source in ha | % Difference | ||
| USDA | MIrAD-US | USDA | MIrAD-US | ||||
| California | 3,524,550 | 3,507,406 | −0.5 | Illinois | 158,169 | 190,113 | 20.2 |
| Nebraska | 3,085,797 | 3,192,381 | 3.5 | Wisconsin | 156,169 | 164,919 | 5.6 |
| Texas | 2,053,633 | 2,058,038 | 0.2 | Indiana | 126,719 | 143,713 | 13.4 |
| Arkansas | 1,679,351 | 1,781,975 | 6.1 | North Carolina | 106,860 | 89,850 | −15.9 |
| Idaho | 1,330,818 | 1,352,225 | 1.6 | North Dakota | 82,077 | 97,669 | 19.0 |
| Kansas | 1,083,860 | 1,110,800 | 2.5 | Iowa | 57,509 | 85,325 | 48.4 |
| Colorado | 1,048,400 | 1,041,769 | −0.6 | Alabama | 44,023 | 28,506 | −35.2 |
| Montana | 799,704 | 818,656 | 2.4 | Virginia | 40,029 | 30,700 | −23.3 |
| Oregon | 771,989 | 772,456 | 0.1 | Delaware | 39,322 | 35,463 | −9.8 |
| Washington | 737,805 | 743,531 | 0.8 | New Jersey | 39,211 | 36,400 | −7.2 |
| Florida | 734,575 | 746,100 | 1.6 | South Carolina | 38,705 | 27,356 | −29.3 |
| Wyoming | 623,899 | 602,763 | −3.4 | Maryland | 32,710 | 30,400 | −7.1 |
| Mississippi | 475,720 | 501,081 | 5.3 | New York | 30,215 | 25,644 | −15.1 |
| Utah | 441,516 | 438,700 | −0.6 | Tennessee | 24,774 | 19,681 | −20.6 |
| Missouri | 418,029 | 444,300 | 6.3 | Pennsylvania | 17,206 | 12,381 | −28.0 |
| Louisiana | 379,935 | 396,569 | 4.4 | Ohio | 16,465 | 14,106 | −14.3 |
| Arizona | 377,060 | 376,156 | −0.2 | Kentucky | 14,873 | 10,081 | −32.2 |
| Georgia | 352,404 | 318,831 | −9.5 | Massachusetts | 9,599 | 6,838 | −28.8 |
| New Mexico | 341,878 | 337,675 | −1.2 | Maine | 7,974 | 7,131 | −10.6 |
| Nevada | 302,160 | 291,369 | −3.6 | Connecticut | 4,103 | 2,938 | −28.4 |
| Oklahoma | 209,446 | 207,000 | −1.2 | Rhode Island | 1,604 | 931 | −41.9 |
| Michigan | 184,649 | 197,419 | 6.9 | Vermont | 945 | 500 | −47.1 |
| Minnesota | 184,071 | 212,450 | 15.4 | New Hampshire | 928 | 356 | −61.6 |
| South Dakota | 162,313 | 187,619 | 15.6 | West Virginia | 802 | 431 | −46.2 |
| Total U.S. | 22,354,552 | 22,698,700 | 1.5 | ||||
4.2. Validation
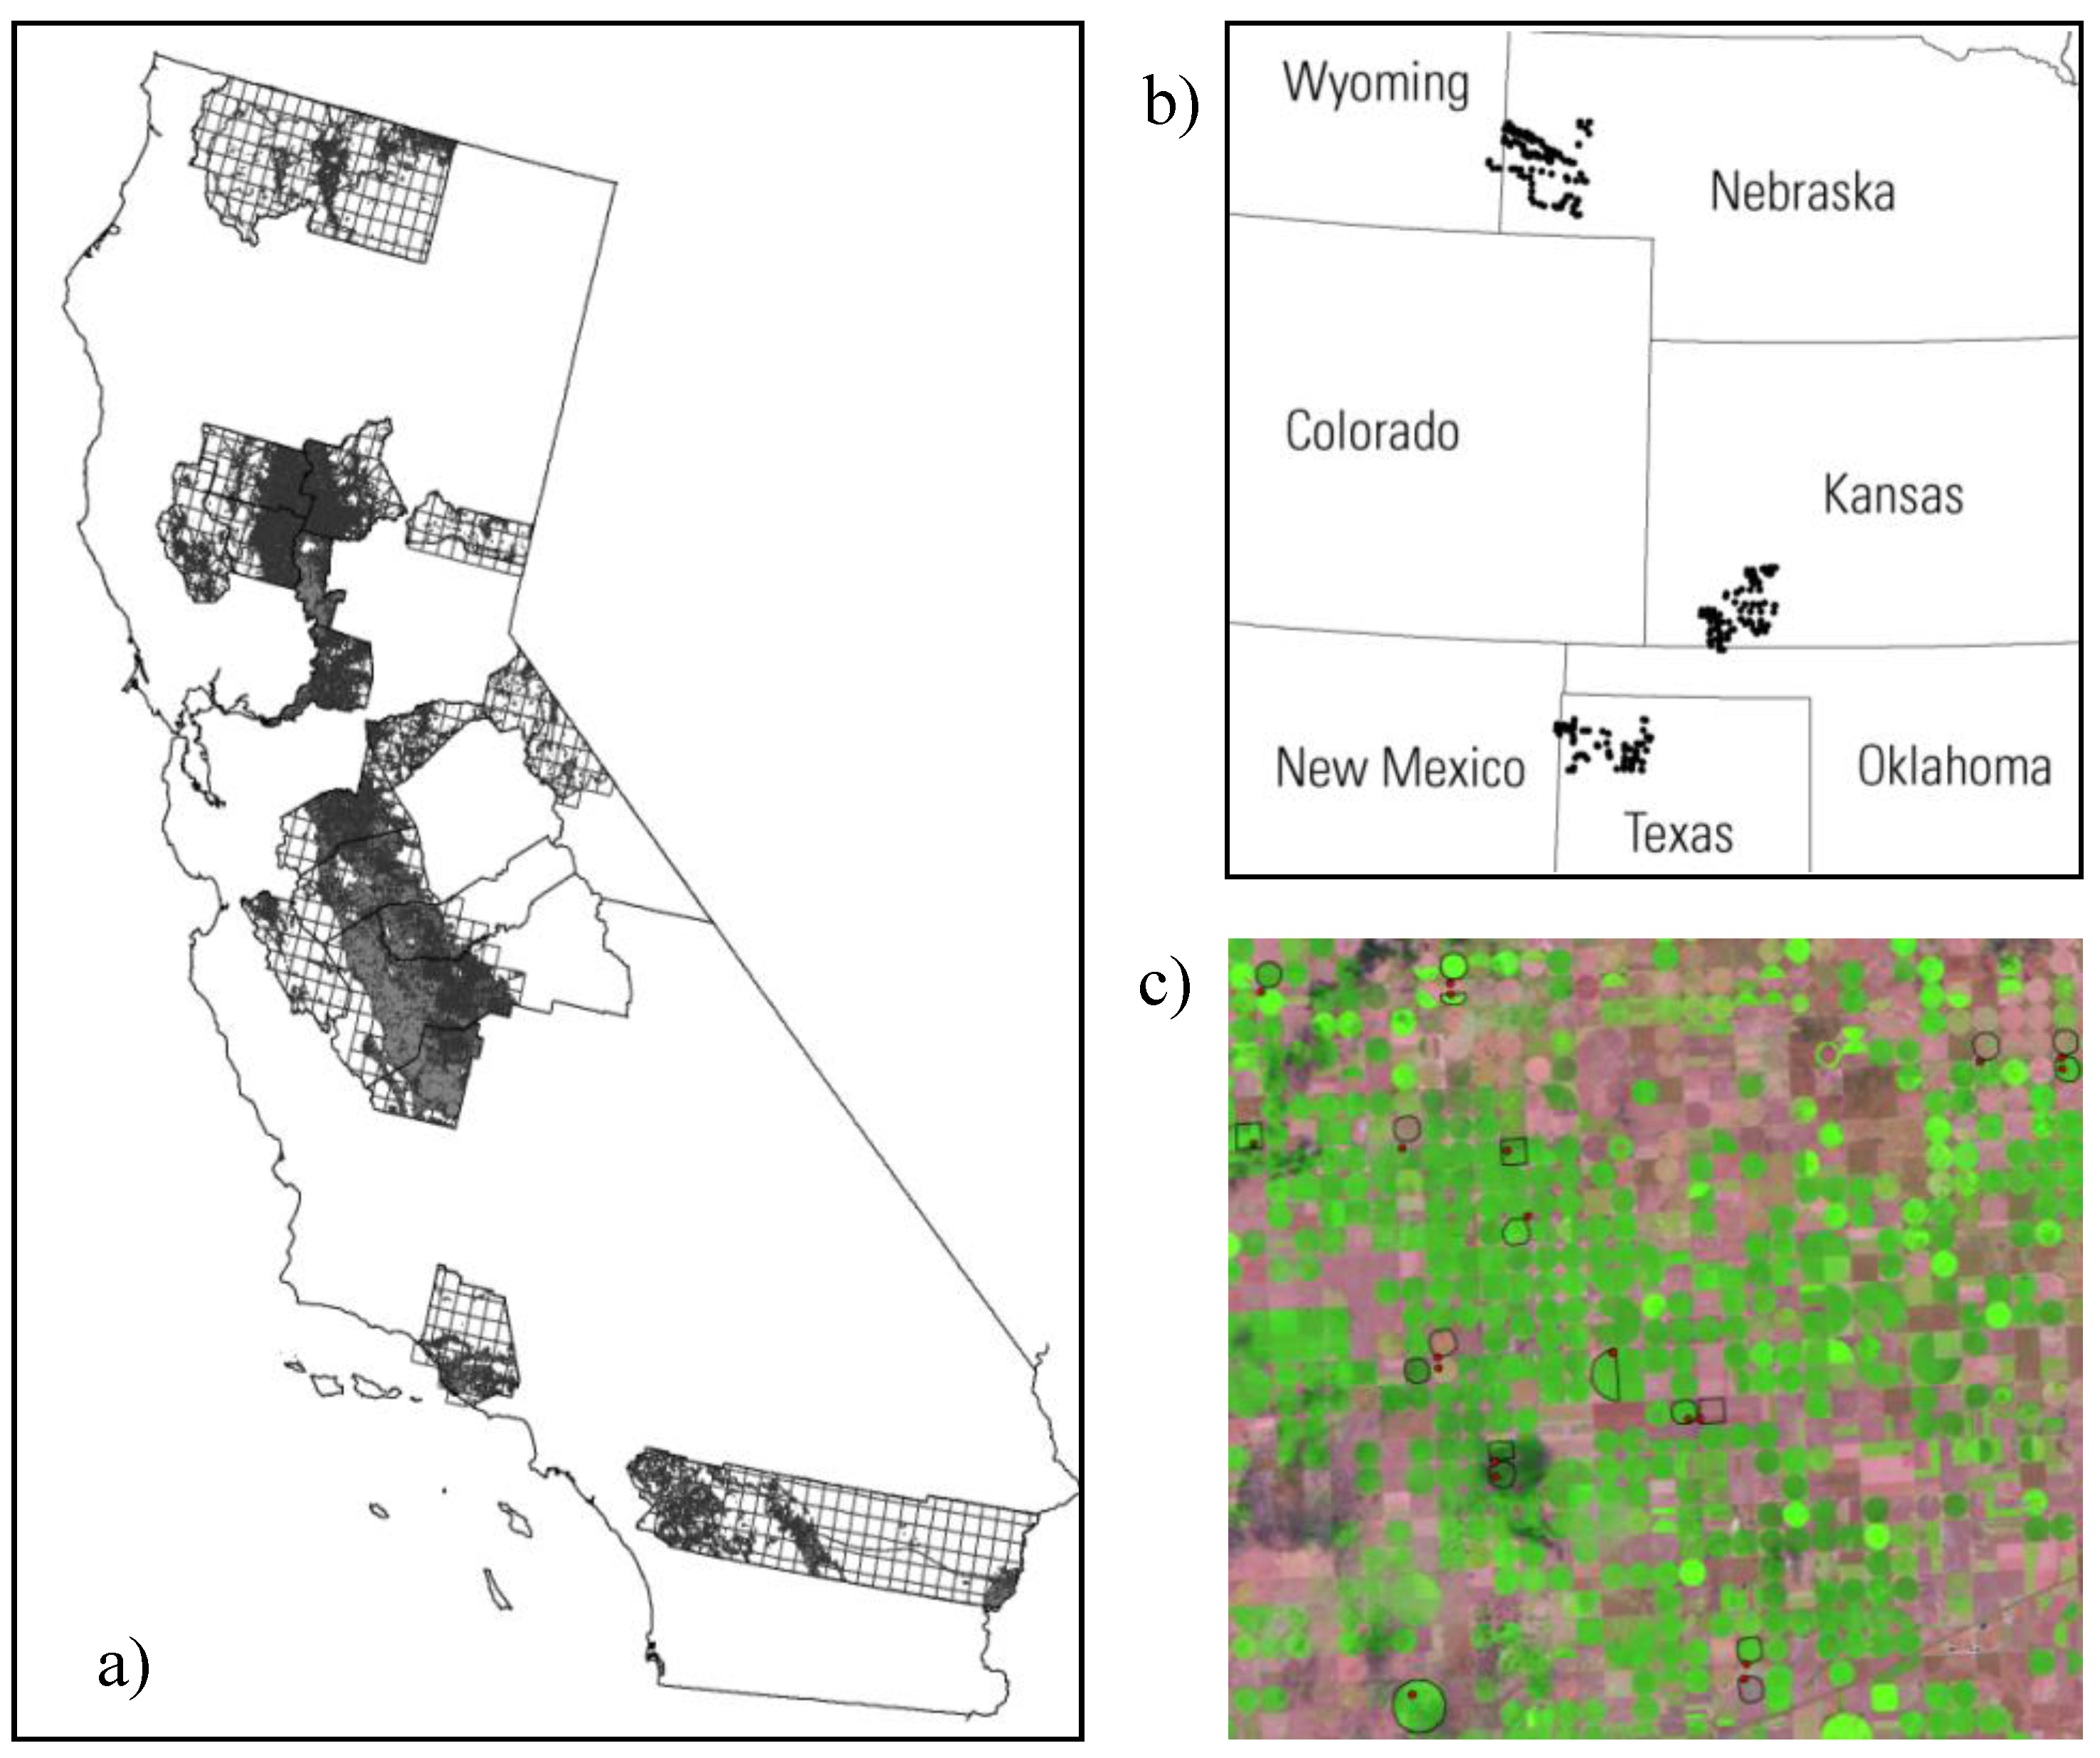
Accuracy Assessment of MIrAD-US in California
| Sample # / density per point in km2 | Classes | Producer’s accuracy | Errors of omission | User’s accuracy | Errors of commission | Overall accuracy | Kappa stat |
| 3000/32.2 | Irrigated | 0.75 | 0.25 | 0.86 | 0.14 | 0.92 | 0.75 |
| Non-Irrigated | 0.97 | 0.03 | 0.94 | 0.06 |
Accuracy Assessment of MIrAD-US in Great Plains
| Comparison type | Producer’s accuracy | Errors of omission | User’s accuracy | Errors of commission | Overall accuracy | Kappa stat |
| By grid cells | 0.67 | 0.33 | 0.94 | 0.06 | 0.75 | 0.51 |
| By polygons | 0.79 | 0.21 | 0.94 | 0.06 | 0.81 | 0.56 |

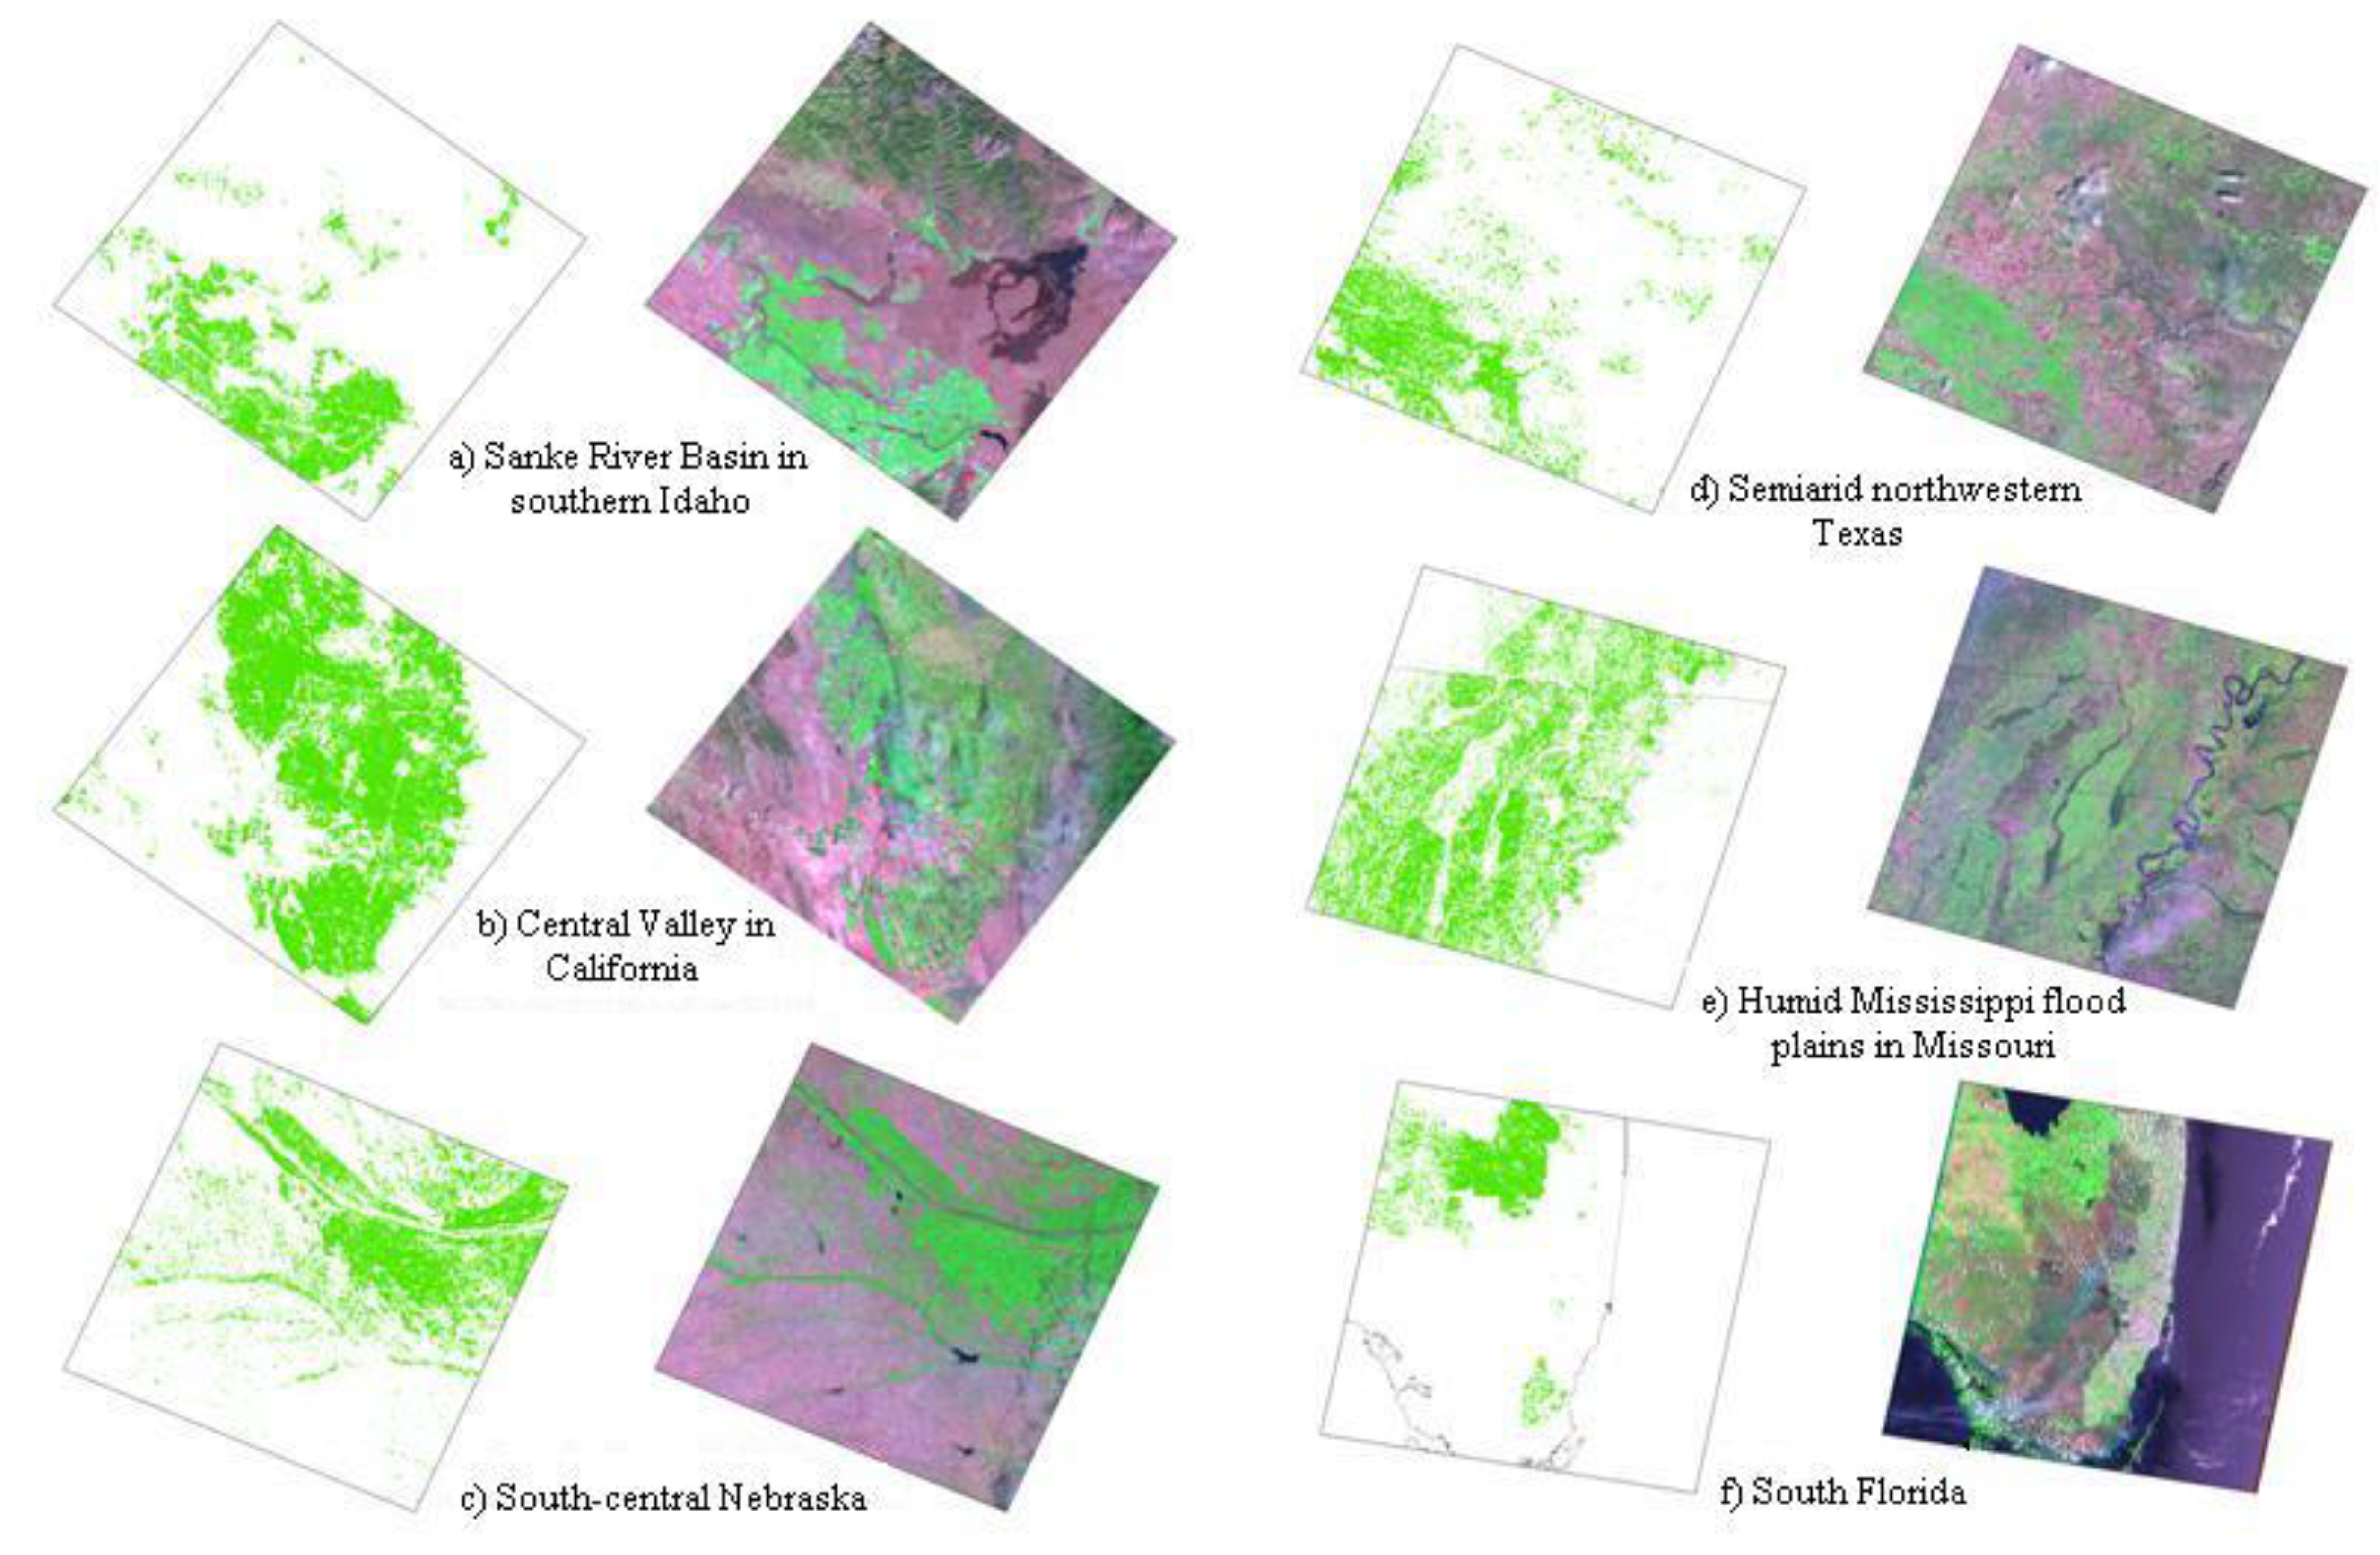
Qualitative Assessment of MIrAD-US
5. Discussion and Conclusion
Acknowledgements
References
- USDA-NASS. 2007 Census of Agriculture, Summary and State Data; Geographic Area Series, Part 51, AC-07-A-51; U.S. Department of Agriculture, National Agricultural Statistics Service: Washington, DC, USA, 2009; Volume 1. Available online: http://www.agcensus.usda.gov/Publications/2007/Full_Report/usv1.pdf (accessed on 23 February 2010).
- Brown, J.F.; Maxwell, S.; Pervez, M.S. Mapping irrigated lands across the United States using MODIS satellite imagery. In Remote Sensing of Global Croplands for Food Security; Thenkabail, P.S., Lyon, J.G., Turral, H., Biradar, C.M., Eds.; Taylor & Francis: Boca Raton, FL, USA, 2009; pp. 177–198. [Google Scholar]
- Ozdogan, M.; Gutman, G. A new methodology to map irrigated areas using multitemporal MODIS and ancillary data: An application example in the continental US. Remote Sens. Environ. 2008, 112, 3520–3537. [Google Scholar] [CrossRef]
- Weare, B.C.; Hui, D. Modeling regional climate changes: influences of recent global warming and irrigation in California. Int. J. Climatol. 2008, 28, 1201–1212. [Google Scholar] [CrossRef]
- Kueppers, L.M.; Snyder, M.A.; Sloan, L.C.; Cayan, D.; Jin, J.; Kanamaru, H.; Kanamitsu, M.; Miller, N.L.; Tyree, M.; Du, H.; Weare, B.C. Multi-model comparison of the climate response to land-use change in the western United States. Glob. Planet. Change 2008, 60, 250–264. [Google Scholar] [CrossRef]
- Kenny, J.F.; Barber, N.L.; Hutson, S.S.; Linsey, K.S.; Lovelace, J.K.; Maupin, M.A. Estimated Use of Water in the United States in 2005; U.S. Geological Survey Circular 1344; USGS: Reston, VA, USA, 2009.
- Droogers, P. Adaptation to climate change to enhance food security and preserve environmental quality: example for southern Sri Lanka. Agr. Water Manage. 2004, 66, 15–33. [Google Scholar] [CrossRef]
- Lambert, F.H.; Stine, A.; Krakauer, N.Y.; Chiang, J.C.H. How much will precipitation increase with global warming? EOS Trans. AGU 2008, 89. [Google Scholar] [CrossRef]
- Previdi, M.; Liepert, B.G. Interdecadal variability of rainfall on a warming planet. EOS Trans. AGU 2008, 89. [Google Scholar] [CrossRef]
- Kabat, P.; Van Schaik, H. Climate Changes the Water Rules: How Water Managers Can Cope with Today’s Climate Variability and Tomorrow’s Climate Change; Dialogue on Water and Climate; Co-operative Programme on Water and Climate: Delft, The Netherlands, March 2003. [Google Scholar]
- Siebert, S.; Döll, P.; Feick, S.; Frenken, K.; Hoogeveen, J. Global Map of Irrigated Areas, Version 4.0.1; University of Frankfurt (Main): Frankfurt, Germany; Food and Agriculture Organization of the United Nations: Rome, Italy, 2007. [Google Scholar]
- Döll, P.; Siebert, S. A Digital Global Map of Irrigated Areas; Report A9901; Center for Environmental Systems Research, University of Kassel: Kassel, Germany, 1999. [Google Scholar]
- Thenkabail, P.S.; Biradar, C.M.; Noojipady, P.; Dheeravath, V.; Li, Y.; Velpuri, M.; Gumma, M.G.; Obi, R.P.; Turral, H.; Cai, X.; Vithanage, J.; Schull, M.A.; Dutta, R. Global irrigated area map (GIAM), derived from remote sensing, for the end of the last millennium. Int. J. Remote Sens. 2009, 30, 3679–3733. [Google Scholar] [CrossRef]
- Loveland, T.R.; Reed, B.C.; Brown, J.F.; Ohlen, D.O.; Zhu, J.; Yang, L.; Merchant, J.W. Development of a global land cover characteristics database and IGBP DISCover from 1km AVHRR data. Int. J. Remote Sens. 2000, 21, 1303–1330. [Google Scholar] [CrossRef]
- Friedl, M.A.; Muchoney, D.; McIver, D.; Gao, F.; Hodges, J.F.C.; Strahler, A.H. Characterization of North American land cover from NOAA-AVHRR data using the EOS MODIS land cover classification algorithm. Geophys. Res. Lett. 2000, 27, 977–980. [Google Scholar] [CrossRef]
- Bartholome, E.; Belward, A.S. GLC2000: A new approach to global land cover mapping from Earth observation data. Int. J. Remote Sens. 2005, 26, 1959–1977. [Google Scholar] [CrossRef]
- Homer, C.; Dewitz, J.; Fry, J.; Coan, M.; Hossain, N.; Larson, C.; Herold, N.; McKerrow, A.; VanDriel, J.N.; Wickham, J. Completion of the 2001 national land cover database for the conterminous United States. Photogramm. Eng. Remote Sensing 2007, 73, 337–341. [Google Scholar]
- Schaible, G.D.; Kim, C.S.; Sandretto, C. Western Irrigated Agriculture: Characteristics by Farm-Size Class; U.S. Department of Agriculture Economic Research Services: Washington, DC, USA, 2004. Available online: http://www.ers.usda.gov/Data/WesternIrrigation/ShowTables.asp (accessed on 13 August 2010).
- Yoon, K.S.; Yoo, K.H.; Tyson, T.W.; Curtis, L.M. Farmers’ irrigation practices in a high rainfall area, effects on soil moisture. Irrig. Drain. Systems 1993, 7, 221–229. [Google Scholar] [CrossRef]
- USDA-NASS. 2002 Census of Agriculture, Summary and State Data; Geographic Area Series, Part 51, AC-02-A-51; U.S. Department of Agriculture, National Agricultural Statistics Service: Washington, DC, USA, 2004; Volume 1. Available online: http://www.nass.usda.gov/census/census02/volume1/us/USVolume104.pdf (accessed 26 January 2007).
- Wiebe, K.; Gollehon, N. Agricultural Resources and Environmental Indicators, 2006 ed.Economic Research Service, U.S. Department of Agriculture: Washington, DC, USA, 2006.
- Hutson, S.S.; Barber, N.L.; Kenny, J.F.; Linsey, K.S.; Lumia, D.S.; Maupin, M.A. Estimated Use of Water in the United States in 2000; U.S. Geological Survey Circular 1268; USGS: Reston, VA, USA, 2004.
- Asrar, G.; Myneni, R.B.; Kanemasu, E.T. Estimation of plant canopy attributes from spectral reflectance measurements. In Theory and Applications of Optical Remote Sensing; Asrar, G., Ed.; Wiley: New York, NY, USA, 1989; pp. 252–296. [Google Scholar]
- Baret, F.; Guyot, G. Potentials and limits to vegetation indices for LAI and APAR assessments. Remote Sens. Environ. 1991, 35, 161–173. [Google Scholar] [CrossRef]
- Yang, L.; Wylie, B.K.; Tieszen, L.L.; Reed, B.C. An analysis of relationships among climate forcing and time-integrated NDVI of grasslands over the U.S. northern and central Great Plains. Remote Sens. Environ. 1998, 65, 25–37. [Google Scholar] [CrossRef]
- Reed, B.C.; Brown, J.F.; VanderZee, D.; Loveland, T.R.; Merchant, J.W.; Ohlen, D.O. Measuring phenological variability from satellite imagery. J. Veg. Sci. 1994, 5, 703–714. [Google Scholar] [CrossRef]
- Reed, B.C.; Loveland, T.R.; Tieszen, L.L. An approach for using AVHRR data to monitor US Great Plains grasslands. Geocarto Int. 1996, 11, 13–22. [Google Scholar] [CrossRef]
- Gonzalez-Alonso, F.; Merino-De-Miguel, S.; Roldan-Zamarron, A.; Garcia-Gigorro, S.; Cuevas, J.M. Forest biomass estimation through NDVI composites: The role of remotely sensed data to assess Spanish forests as carbon sinks. Int. J. Remote Sens. 2006, 27, 5409–5415. [Google Scholar] [CrossRef]
- Wessels, K.J.; Prince, S.D.; Zambatis, N.; MacFadyen, S.; Frost, P.E.; Van Zyl, D. Relationship between herbaceous biomass and 1-km2 Advanced Very High Resolution Radiometer (AVHRR) NDVI in Kruger National Park, South Africa. Int. J. Remote Sens. 2006, 27, 951–973. [Google Scholar] [CrossRef]
- Huemmrich, K.F.; Privette, J.L.; Mukelabai, M.; Myneni, R.B.; Knyazikhin, Y. Time-series validation of MODIS land biophysical products in a Kalahari woodland, Africa. Int. J. Remote Sens. 2005, 26, 4381–4398. [Google Scholar] [CrossRef]
- Wang, Q.; Adiku, S.; Tenhunen, J.; Granier, A. On the relationship of NDVI with Leaf Area Index in a deciduous forest site. Remote Sens. Environ. 2005, 94, 244–255. [Google Scholar] [CrossRef]
- Sannier, C.A.D.; Taylor, J.C.; Du Plessis, W. Real-time monitoring of vegetation biomass with NOAA-AVHRR in Etosha national park, Namibia, for fire risk assessment. Int. J. Remote Sens. 2002, 23, 71–89. [Google Scholar] [CrossRef]
- Ji, L.; Peters, A.J. Assessing vegetation response to drought in the northern Great Plains using vegetation and drought indices. Remote Sens. Environ. 2003, 87, 85–98. [Google Scholar] [CrossRef]
- Wang, J.; Rich, P.M.; Price, K.P. Temporal responses of NDVI to precipitation and temperature in the central Great Plains, USA. Int. J. Remote Sens. 2003, 24, 2345–2364. [Google Scholar] [CrossRef]
- Kawabata, A.; Ichii, K.; Yamaguchi, Y. Global monitoring of interannual changes in vegetation activities using NDVI and its relationships to temperature and precipitation. Int. J. Remote Sens. 2001, 22, 1377–1382. [Google Scholar] [CrossRef]
- Wulder, M.A.; Hall, R.J.; Coops, N.C.; Franklin, S.E. High spatial resolution remotely sensed data for ecosystem characterization. BioScience 2004, 54, 511–521. [Google Scholar] [CrossRef]
- Rundquist, B.C.; Harrington, J.A., Jr.; Goodin, D.G. Mesoscale satellite bioclimatology. Prof. Geogr. 2000, 52, 331–344. [Google Scholar] [CrossRef]
- Potter, C.S.; Brooks, V. Global analysis of empirical relations between annual climate and seasonality of NDVI. Int. J. Remote Sens. 1998, 19, 2921–2948. [Google Scholar] [CrossRef]
- Yan, H.; Fu, Y.; Xiao, X.; Huang, H.Q.; He, H.; Ediger, L. Modeling gross primary productivity for winter wheat-maize double cropping system using MODIS time series and CO2 eddy flux tower data. Agr. Ecosyst. Environ. 2009, 129, 391–400. [Google Scholar] [CrossRef]
- Wilson, T.B.; Meyers, T.P. Determining vegetation indices from solar and photosynthetically active radiation fluxes. Agr. Forest Meteorol. 2007, 144, 160–179. [Google Scholar] [CrossRef]
- Paruelo, J.M.; Jobbagy, E.G.; Sala, O.E. Current distributions of ecosystem functional types in temperate South America. Ecosystems 2001, 4, 683–698. [Google Scholar] [CrossRef]
- Wardlow, B.D.; Egbert, S.L. Large-area crop mapping using time-series MODIS 250 m NDVI data: An assessment for the US Central Great Plains. Remote Sens. Environ. 2008, 2, 1096–1116. [Google Scholar] [CrossRef]
- Aparacio, N.; Villegas, D.; Casadesus, J.; Araus, J.L.; Royo, C. Spectral vegetation indices as nondestructive tools for determining durum wheat yield. Agron. J. 2000, 92, 83–91. [Google Scholar] [CrossRef]
- Justice, C.O.; Townsend, J.R.G. Special issue on the moderate resolution imaging spectro-radiometer (MODIS): A new generation of land surface monitoring. Remote Sens. Environ. 2002, 83, 1–2. [Google Scholar] [CrossRef]
- Justice, C.O.; Vermote, E.; Townshend, J.R.G.; Defries, R.; Roy, D.P.; Hall, D.K.; Salomonson, V.V.; Privette, J.L.; Riggs, G.; Strahler, A.; Lucht, W.; Myneni, R.B.; Knyazikhin, Y.; Running, S.W.; Nemani, R.R.; Wan, Z.M.; Huete, A.R.; van Leeuwen, W.; Wolfe, R.E.; Giglio, L.; Muller, J.P.; Lewis, P.; Barnsley, M.J. The Moderate Resolution Imaging Spectroradiometer (MODIS): Land remote sensing for global change research. IEEE Trans. Geosci. Remote Sens. 1998, 36, 1228–1249. [Google Scholar] [CrossRef]
- Funk, C.; Budde, M. Phenologically-tuned MODIS NDVI-based production anomaly estimates for Zimbabwe. Remote Sens. Environ. 2009, 113, 115–125. [Google Scholar] [CrossRef]
- Chang, J.; Hansen, M.C.; Pittman, K.; Carroll, M.; DiMeceli, C. Corn and soybean mapping in the United States using MODIS time-series datasets. Agron. J. 2007, 99, 1654–1664. [Google Scholar] [CrossRef]
- Gitelson, A.A.; Wardlow, B.D.; Keydan, G.P.; Leavitt, B. An evaluation of MODIS 250-m data for green LAI estimation in crops. Geophys. Res. Lett. 2007, 34, L20403. [Google Scholar] [CrossRef]
- Doraiswamy, P.C.; Sinclair, T.R.; Hollinger, S.; Akhmedov, B.; Stern, A.; Prueger, J. Application of MODIS derived parameters for regional crop yield assessment. Remote Sens. Environ. 2005, 97, 192–202. [Google Scholar] [CrossRef]
- Sakamoto, T.; Yokozawa, M.; Toritani, H.; Shibayama, M.; Ishitsuka, N.; Ohno, H. A crop phenology detection method using time-series MODIS data. Remote Sens. Environ. 2005, 96, 366–374. [Google Scholar] [CrossRef]
- USDA-NASS. USDA-NASS Cropland Data Layer; U.S. Department of Agriculture, National Agricultural Statistics Service: Washington, DC, USA. Available online: http://www.nass.usda.gov/research/Cropland/SARS1a.htm (accessed on 03 May 2010).
- Swets, D.L.; Reed, B.C.; Rowland, J.R.; Marko, S.E. A weighted least-squares approach to temporally smoothing of NDVI. In Proceedings of the 1999 ASPRS Annual Conference, Portland, OR, USA, May 17–21, 1999.
- Evans, R.G. Center Pivot Irrigation; Research Report; USDA-Agricultural Research Service: Sidney, MT, USA, 2001.
- NOAA. Climate of August 2002; U.S. National Drought Overview; National Climatic Data Center, National Oceanic and Atmospheric Administration. Available online: http://www.ncdc.noaa.gov/oa/reports/weathervents.html (accessed on 13 February 2009).
- Lott, N.; Ross, T. Tracking and Evaluating U.S. Billion Dollar Weather Disasters, 1980–2005; National Oceanic and Atmospheric Administration’s National Climatic Data Center: Asheville, NC, USA, 2010. [Google Scholar]
- Congalton, R. A review of assessing the accuracy of classifications of remotely sensed data. Remote Sens. Environ. 1991, 37, 35–46. [Google Scholar] [CrossRef]
- Dappen, P.; Merchant, J.; Ratcliffe, I.; Robbins, C. Delineation of 2005 Land Use Patterns for the State of Nebraska; Department of Natural Resources, Final Report; Nebraska Department of Natural Resources: Lincoln, NE, USA, 2007. [Google Scholar]
- Colaizzi, P.D.; Gowda, P.H.; Marek, T.H.; Porter, D.O. Irrigation in the Texas High Plains: A brief history and potential reductions in demand. Irrig. Drain. 2008, 58, 257–274. [Google Scholar] [CrossRef]
- Smajstrla, A.G.; Clark, G.A.; Haman, D.Z.; Zazueta, F.S. Design of Agricultural Irrigation Systems in Florida; Bulletin 294; Florida Cooperative Extension Service, Institute of Food and Agricultural Sciences, University of Florida: Gainesville, FL, USA, 1994. [Google Scholar]
- Xian, G.; Homer, C.; Fry, J. Updating the 2001 national land cover database land cover classification to 2006 by using Landsat imagery change detection methods. Remote Sens. Environ. 2009, 113, 1133–1147. [Google Scholar] [CrossRef]
- Huete, A.; Didan, K.; Miura, T.; Rodriguez, E.P.; Gao, X.; Ferreira, L.G. Overview of the radiometric and biophysical performance of the MODIS vegetation indices. Remote Sens. Environ. 2002, 83, 195–213. [Google Scholar] [CrossRef]
- Irrigation in the Pacific Northwest—Washington Irrigation. Extension Irrigation Specialists for the Land Grant Universities of the Pacific Northwest States of Washington, Idaho, and Oregon. Available online: http://irrigation.wsu.edu/Secondary_Pages/Irr_Washington.php (accessed on 18 October 2009).
- Statistical Abstract of the United States: 2003; United States Bureau of the Census: Washington, DC, USA. Available online: http://www.census.gov/statab/hist/HS-01.pdf (accessed 22 October 2009).
- Census of Agriculture: 1974. United States: Summary and State Data; United States Bureau of the Census: Washington, DC, USA, 1977–1979.
- Census of Agriculture: 1969. Version 4 Irrigation; United States Bureau of the Census: Washington, DC, USA, 1971.
- Census of Agriculture: 1964. Version 3 Statistics by Subject; United States Bureau of the Census: Washington, DC, USA, 1967.
- Census of Agriculture: 1959; Final Report; United States Bureau of the Census: Washington, DC, USA, 1960.
- Census of Agriculture: 1954. Table 6: All land and irrigated land in irrigated farms according to use, summary for 20 specified states: Censuses of 1930 to 1954; United States Bureau of the Census: Washington, DC, USA, 1956–1957.
- Wickham, J.D.; Stehman, S.V.; Fry, J.A.; Smith, J.H.; Homer, C.G. Thematic accuracy of the NLCD 2001 land cover for the conterminous United States. Remote Sens. Environ. 2010, 114, 1286–1296. [Google Scholar] [CrossRef]
© 2010 by the authors; licensee MDPI, Basel, Switzerland. This article is an open access article distributed under the terms and conditions of the Creative Commons Attribution license (http://creativecommons.org/licenses/by/3.0/).
Share and Cite
Pervez, M.S.; Brown, J.F. Mapping Irrigated Lands at 250-m Scale by Merging MODIS Data and National Agricultural Statistics. Remote Sens. 2010, 2, 2388-2412. https://doi.org/10.3390/rs2102388
Pervez MS, Brown JF. Mapping Irrigated Lands at 250-m Scale by Merging MODIS Data and National Agricultural Statistics. Remote Sensing. 2010; 2(10):2388-2412. https://doi.org/10.3390/rs2102388
Chicago/Turabian StylePervez, Md Shahriar, and Jesslyn F. Brown. 2010. "Mapping Irrigated Lands at 250-m Scale by Merging MODIS Data and National Agricultural Statistics" Remote Sensing 2, no. 10: 2388-2412. https://doi.org/10.3390/rs2102388
APA StylePervez, M. S., & Brown, J. F. (2010). Mapping Irrigated Lands at 250-m Scale by Merging MODIS Data and National Agricultural Statistics. Remote Sensing, 2(10), 2388-2412. https://doi.org/10.3390/rs2102388