


Highlights
What are the main findings?
- A hierarchical unsupervised clustering strategy is proposed to efficiently segment large-scale multispectral images for cloud detection.
- Cloudy pixels are identified by spectral matching against a ground cover spectral library rather than explicit cloud spectral modeling.
What are the implications of the main findings?
- The proposed framework reduces dependency on prior scene information and labeled training samples.
- The method provides a flexible solution for cloud detection in multi-sensor and multi-resolution remote sensing imagery.
Abstract
Cloud detection is an important procedure for the processing of remote sensing images. A cloud detection scheme driven by the spectral and the temporal features is presented in this paper, where an unsupervised hierarchy clustering approach is proposed for large scale image segmentation. The potential cloudy pixels are identified by means of the spectral matching, in which the spectral data of the clustering centers are compared to the patterns in the spectral dataset of ground covers. The matched pixels are regarded as cloudless pixels, whose category can be recognized accordingly. In contrast, the bright temperatures corresponding to the unmatched pixels are used to exclude the interference of the occasional hotspots, enabling the final cloud detection result. Landsat 8 and Sentinel-2 satellite data are used in the validation to demonstrate the precision and stability of the proposed scheme for the data at different spatial resolutions.
1. Introduction
Cloud detection in optical remote sensing imagery is a critical preprocessing step for a wide range of Earth observation applications. Clouds cover approximately 60–70% of the Earth’s surface at any given time [1,2,3], and their presence significantly degrades the quality of optical satellite observations. In remote sensing images, clouds often appear either as background elements that obscure targets of interest or as disturbances that interfere with surface observation. Therefore, accurate identification of cloudy pixels is essential before further processing steps such as feature extraction, land cover classification, and quantitative analysis are performed [4,5,6].
Due to the strong scattering properties of cloud particles in optical spectral bands, clouds substantially affect the acquisition of surface information and reduce the reliability of downstream applications. In the context of remote sensing image simulation, cloud detection algorithms are usually applied first to determine the spatial distribution and coverage of clouds. Subsequently, radiative transfer models are separately established for cloud-covered and cloud-free regions to simulate their spectral response characteristics. By integrating the simulation results from both parts, synthetic remote sensing images with realistic cloud effects can be generated. Consequently, cloud detection plays a fundamental role not only in remote sensing data analysis but also in remote sensing image simulation.
Among various cloud detection methods, three types of features are commonly exploited to identify cloudy pixels in optical remote sensing images, namely spectral, temporal, and spatial features. Spectral-feature-based methods rely on the fact that clouds generally exhibit higher reflectance than most ground covers in visible and shortwave infrared (SWIR) bands, while their thermal emission is typically weaker in the medium- and long-wave infrared (MWIR and LWIR) regions. By utilizing multispectral observations with high atmospheric transmittance, cloudy pixels can be identified through spectral classification or threshold-based approaches [4,7,8]. Temporal-feature-based methods assume that the spectral and spatial characteristics of ground covers remain relatively stable over a certain period. Under this assumption, cloudy pixels can be detected as anomalies by comparing images acquired at different times over the same scene, provided that cloud-free reference images are available [5,9]. Spatial features mainly describe the geometric distribution, shape, and continuity of clouds, which are usually represented as texture patterns in remote sensing imagery. These features are often extracted through image segmentation techniques and are typically combined with spectral or temporal information to improve detection accuracy [10,11].
Although spatial features have been widely adopted in existing cloud detection studies, their extraction often requires complex modeling and high computational cost, which may limit their applicability in large-scale multispectral image processing. As clouds are highly dynamic and transient atmospheric phenomena, their spectral reflectance at a specific observation time is difficult to predict accurately. In contrast, the spectral reflectance of ground covers is relatively stable over a long period because it is mainly determined by intrinsic physical properties [12]. Therefore, it is rational to perform cloud detection by exploiting both spectral differences between clouds and ground covers and the temporal stability of ground-cover reflectance.
Based on this idea, an efficient cloud detection scheme is proposed in this paper for large-scale multispectral image processing. The proposed method primarily integrates spectral feature matching with the temporal stability assumption of ground covers. An unsupervised hierarchical clustering approach is first employed to segment large-scale multispectral images according to spectral reflectance differences. The spectral signatures of the clustering centers are then compared with a spectral dataset of typical ground covers to identify pixels that do not match known surface patterns and are thus regarded as potential cloudy pixels.
The remainder of this paper is organized as follows. Section 2 describes the proposed cloud detection scheme in detail, including the hierarchical clustering approach for large-scale image segmentation. Section 3 presents the cloud detection results and quantitative evaluations using Landsat 8 and Sentinel-2 data. Section 4 discusses the experimental results and analyzes the advantages and limitations of the proposed method. Finally, conclusions are drawn in Section 5.
2. Proposed Approach
2.1. Dataset Overview
Common multi-spectral satellite systems primarily include the MODIS [13] and Landsat series [14] from the United States, the Sentinel series [15] led by the European Space Agency (ESA), and the Gaofen series (e.g., Gaofen-1, Gaofen-2, Gaofen-6) independently developed by China [16]. These satellite systems offer complementary capabilities in terms of spatial, temporal, and spectral resolutions, providing multi-scale and high-frequency data support for Earth observation research.
Multi-spectral remote sensing data products are typically categorized based on their processing levels, with common levels including Level-0 (L0), Level-1 (L1), and Level-2 (L2). L0 products consist of unprocessed raw data; L1 products refer to data that has undergone basic corrections such as radiometric calibration; L2 products represent data that has been further processed with systematic geometric correction based on L0 or L1 data. The specific classification methods are detailed in Table 1.
Table 1.
Classification of Satellite Spectral Data.
Landsat 8 and Sentinel-2 remote sensing data were selected to validate the cloud detection results. Their characteristics are introduced below.
2.1.1. Landsat 8
Landsat 8 is an Earth observation satellite launched by NASA on 11 February 2013. The satellite carries two primary sensors: the Operational Land Imager (OLI) and the Thermal Infrared Sensor (TIRS) [17]. Landsat 8 features 11 spectral bands: Bands 1–7 and 9 have a spatial resolution of 30 m; Bands 10 and 11 have a resolution of 100 m; and Band 8 (Panchromatic) has a resolution of 15 m. Table 2 lists the band names, wavelength ranges, and spatial resolutions for Landsat 8.
Table 2.
Introduction to Landsat 8 Bands.
Landsat 8 Level-2 (L2) data provides Surface Reflectance (SR) and Surface Temperature (ST) products. The raw values provided in the Level-2 data can be converted into surface reflectance and surface temperature using Equations (1) and (2):
where is the surface reflectance, is the surface temperature, and represents the raw digital number provided in the Level-2 data.
2.1.2. Sentinel-2
Sentinel-2 is an Earth observation mission of the European Space Agency (ESA) under the Copernicus Programme, consisting of two satellites, Sentinel-2A and Sentinel-2B, designed for systematic monitoring of land surfaces. The mission is equipped with the Multispectral Instrument (MSI), which acquires imagery in 13 spectral bands spanning the visible, near-infrared, and shortwave infrared regions, with spatial resolutions of 10 m, 20 m, and 60 m and a revisit cycle of approximately five days. Owing to its high spatial resolution and rich spectral information, Sentinel-2 data have been widely used in cloud detection, land cover classification, and environmental monitoring applications. Table 3 lists the band names, wavelength ranges, and spatial resolutions for Sentinel-2.
Table 3.
Introduction to Sentinel-2 Bands.
2.1.3. Ground Object Spectral Reflectance Database
The latest version of the United States Geological Survey (USGS) Spectral Library is Version 7 [18]. This is a collection of spectral data acquired via laboratory, field, and airborne spectrometers. The database covers a wide wavelength range from ultraviolet to far-infrared, specifically from 0.2 to 200 µm. It includes spectral measurements of specific minerals, vegetation, chemical mixtures, and man-made materials. In many cases, samples were purified to ensure that the spectral properties of the materials are closely correlated with their chemical structures, forming effective spectral-chemical composition pairs, which is critical for interpreting remote sensing data. The library utilized the following four different spectrometers for measurements:
- Beckman 5270, covering 0.2–3 μm
- Analytical Spectral Devices (ASD), covering 0.35–2.5 μm
- Nicolet, covering 1.12–216 μm
- AVIRIS, covering 0.37–2.5 μm
These spectral data include not only natural mixtures of rocks, soils, and materials measured under laboratory conditions but also plant components and vegetation spectra under various background conditions, as well as forest vegetation spectra measured using airborne spectrometers.
2.2. Principal Method
Actual remote sensing imagery typically contains multiple spectral bands and covers extensive areas, resulting in massive data volumes where a single image often comprises a vast number of pixels. Adopting a pixel-by-pixel approach for cloud detection would lead to excessive computational resource consumption and low processing efficiency. Therefore, clustering is usually required as a preliminary step in the cloud detection workflow. The purpose of clustering is to group pixels with similar spectral features into the same category, thereby effectively reducing the computational complexity of subsequent processing [8]. By integrating pixels with similar spectral characteristics into unified analysis units through clustering, classification decisions can be made at the category level, significantly improving the computational efficiency of cloud detection.
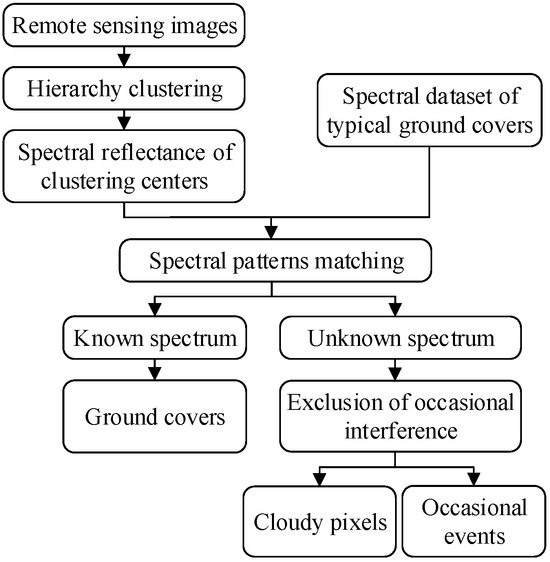
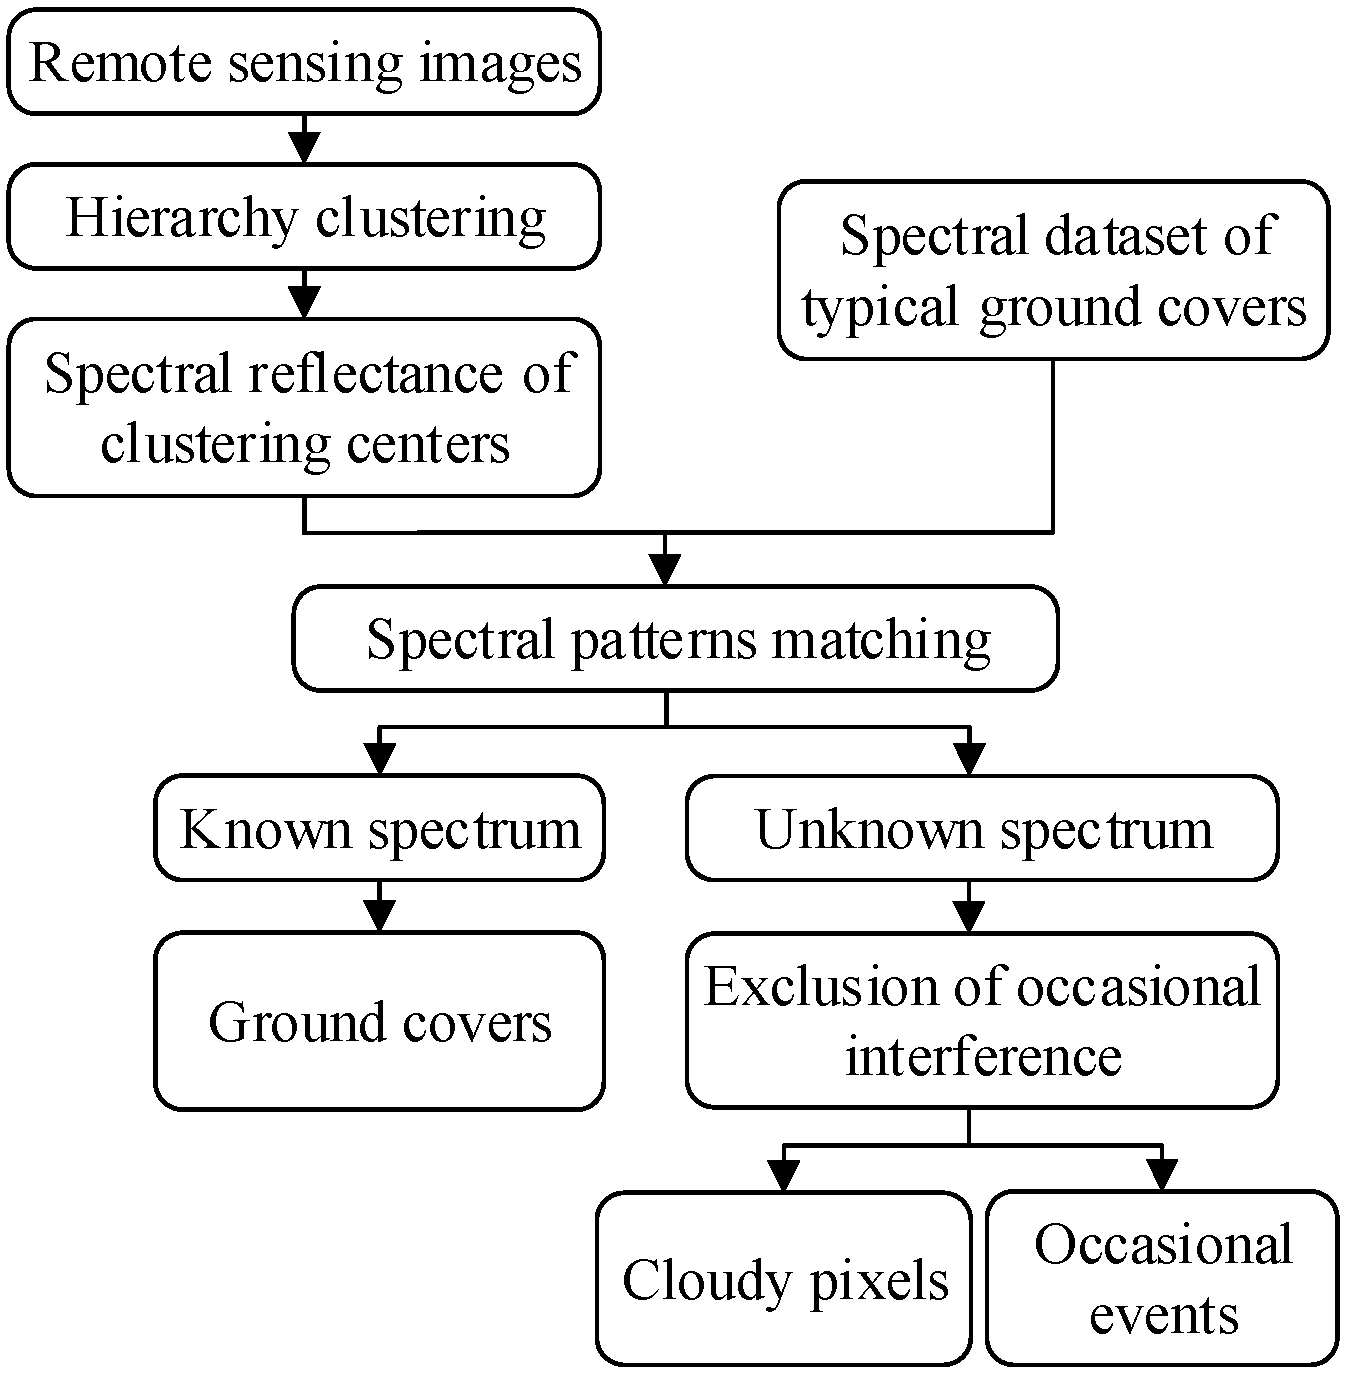
The cloud detection scheme is presented in Figure 1, where three major steps are involved, i.e., the hierarchy clustering, the identification of ground spectral pattern, and the exclusion of occasional interference. The scheme will be detailed in the following part of this section.
Figure 1.
Flowchart of cloud detection scheme.
2.2.1. Hierarchy Clustering
For the versatility of the presented scheme, we assume that the prior information of the observational scene is unavailable. Thus, an unsupervised clustering approach is required to segment multispectral remote sensing image, which probably include millions of pixels. In this situation, the size of the difference or the similarity matrix for two arbitrary pixels is large enough to overflow the memory of an ordinary computer.
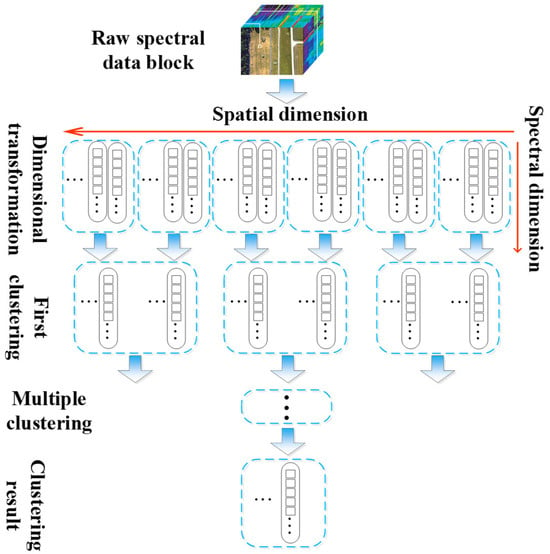
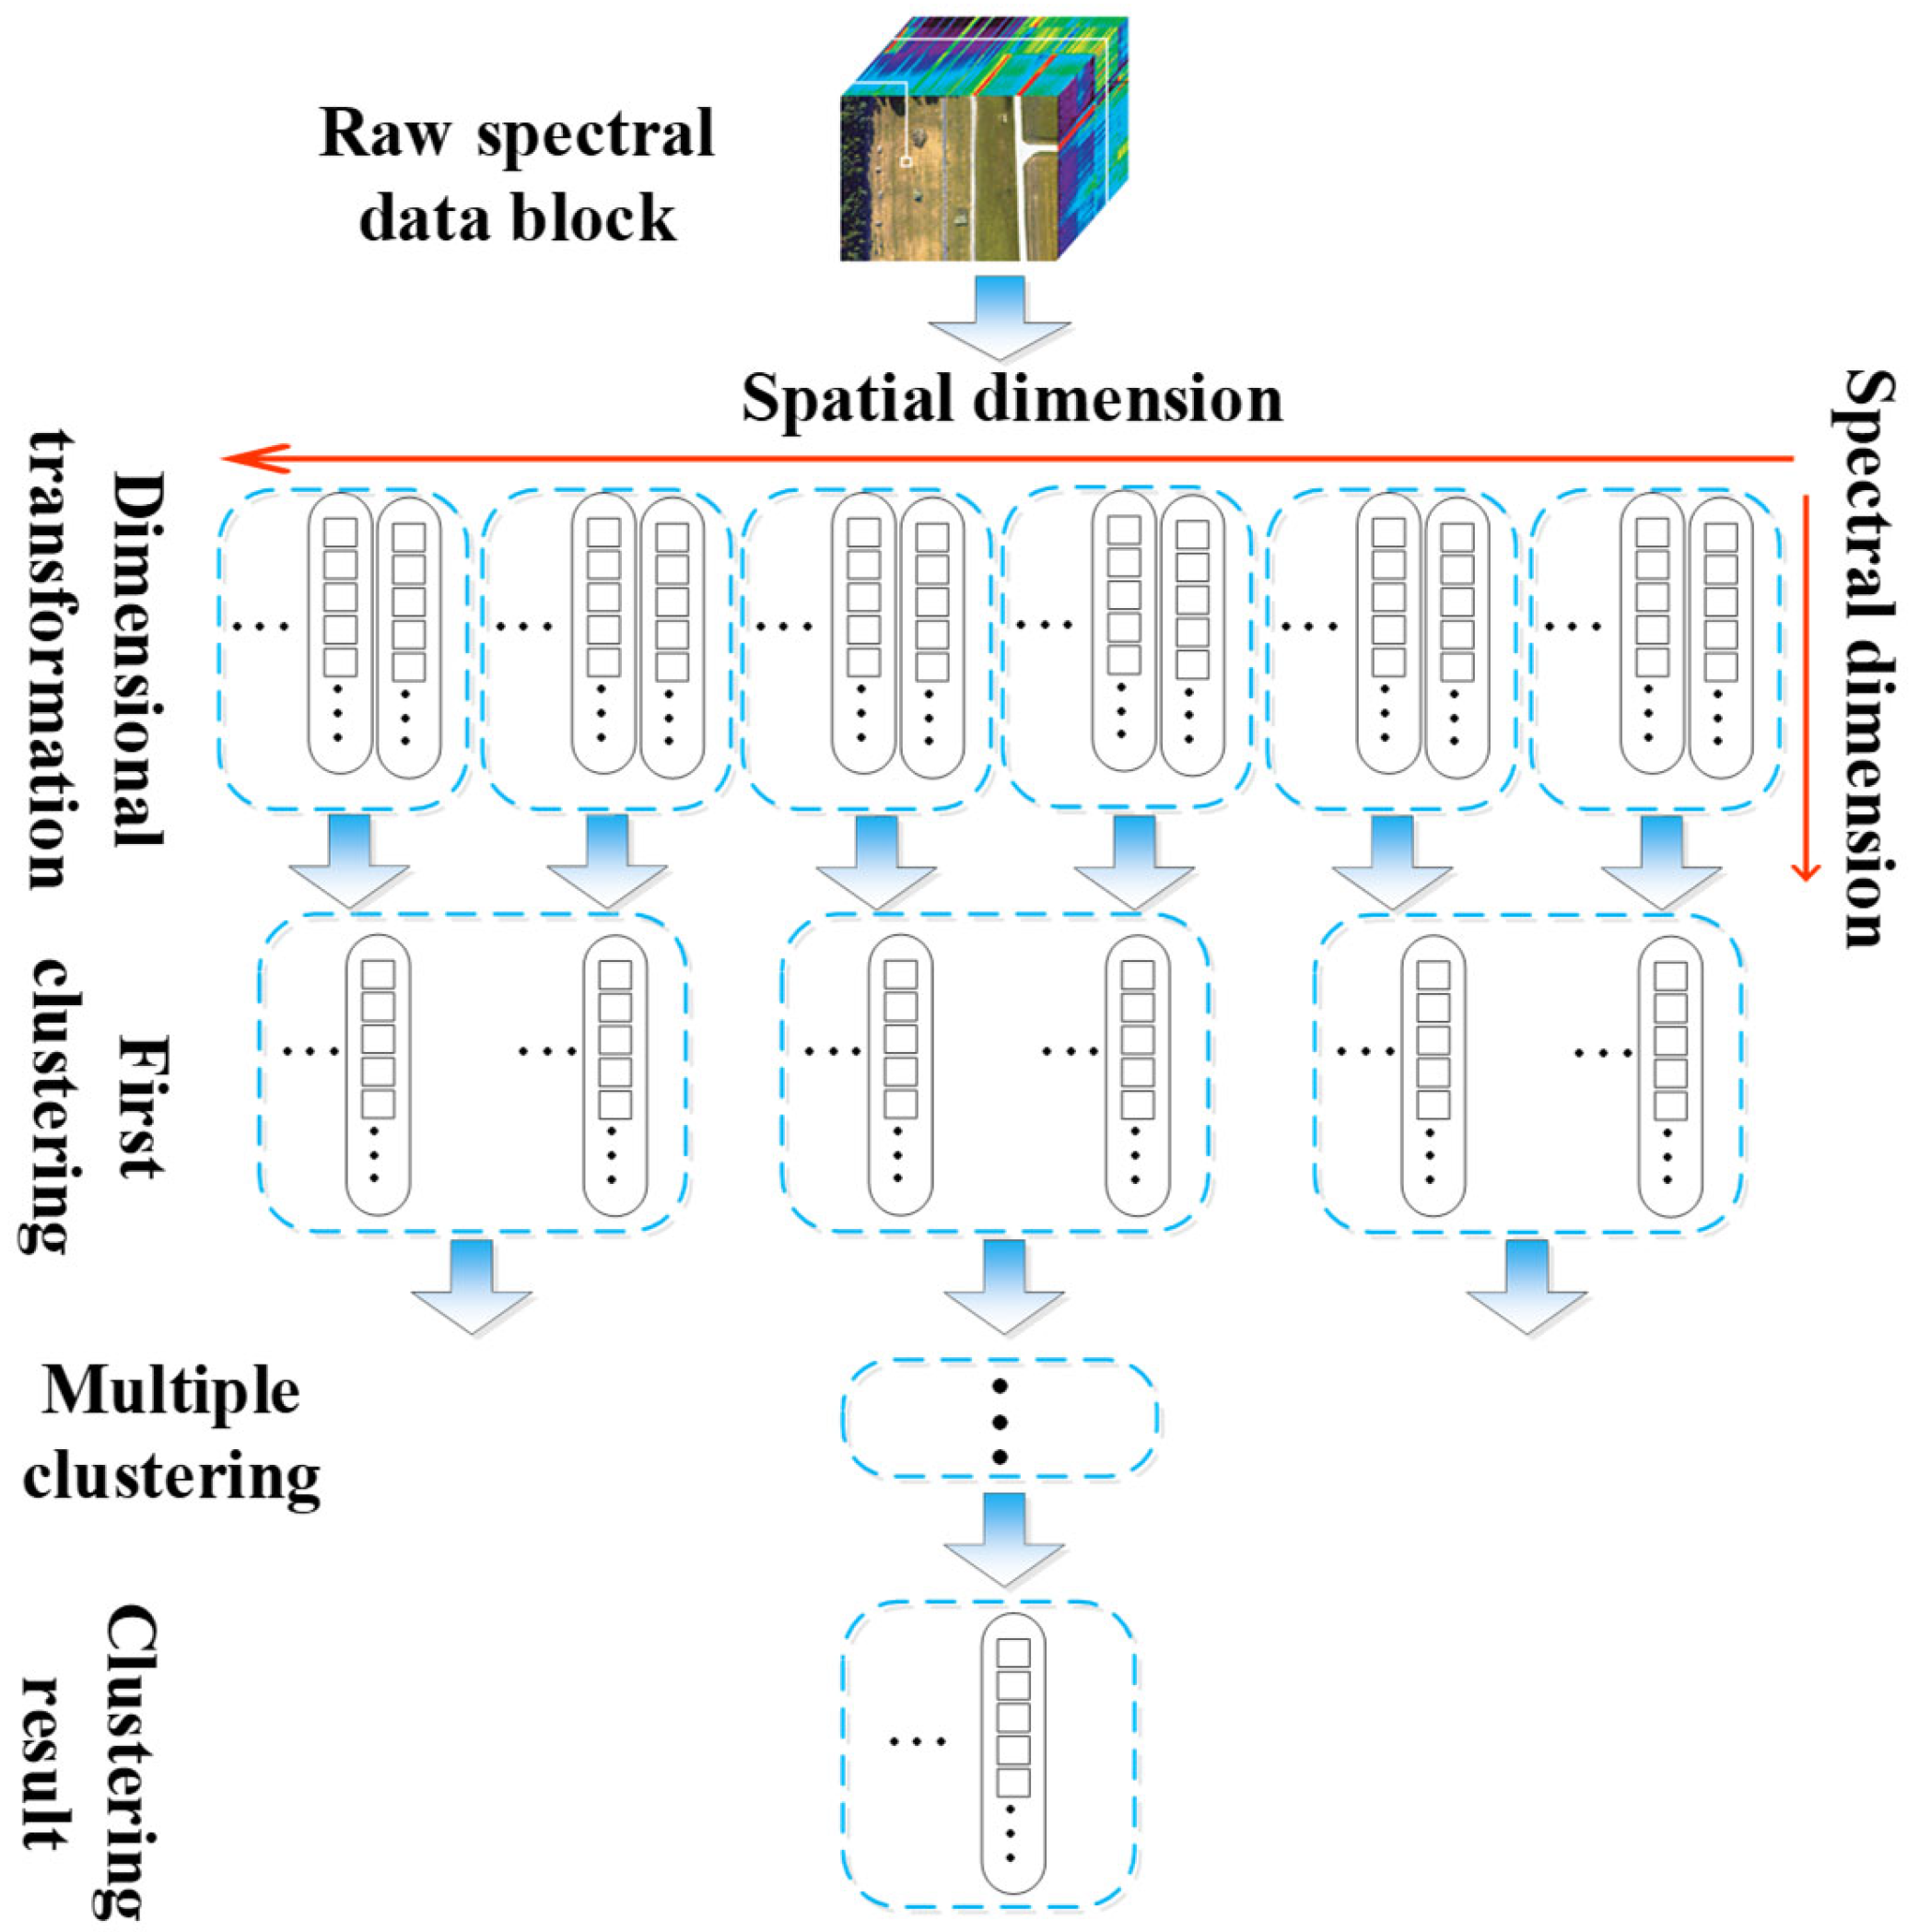
To improve the feasibility of the clustering procedure, a hierarchy clustering approach is proposed as shown in Figure 2, where the original three-dimensional multispectral data block with the size of N × M × L (i.e., NM pixels and L bands) is transformed into a two-dimensional matrix with the size of NM × L. Then, the pixels are randomly divided into number of groups, whose size is small enough for the calculation of the difference matrix in each group. The clustering centers from each group are assembled as the new dimensional matrix, which can be divided again when its size is too large for the calculation of the difference matrix for two arbitrary clustering centers. The grouping and clustering procedure are repeated several times until the spectral data in the latest assembled clustering center matrix is small enough to generate its difference matrix for the final clustering result.
Figure 2.
Schematic diagram for hierarchy clustering of spectral images.
In each clustering step, the peak density search method [19] is adopted to determine the clustering centers. The local density of an arbitrary pixel is defined as
where is the local density of the pixel i; denotes the spectral difference between the pixel i to the pixel j; represents the difference threshold for the same class decision;
And χ is the decision function, expressed as
The Euclidean distance is used to evaluate the difference and the similarity of two arbitrary spectrums, given as
where and denote the corresponding spectral data of the pixel i and the pixel j, respectively.
When the local densities of all pixels are calculated using Equation (3), they are sorted in a decreasing sequence according to the density. The first pixel in the sequence with the peak density is selected as the clustering center directly, whereas the belongings of the subsequent pixels are decided according to the minimal difference of the spectrum, which is defined as
where represent the minimal difference of the spectrum of the pixel i to the spectrums of the existing clustering center whose local density is higher than the pixel i. When the minimal difference is smaller than the difference threshold , the pixel is classified as the existing class with the update of local density. Otherwise, the pixel is selected as a new clustering center.
For the secondary and the subsequent clustering procedure, the clustering centers from the last stage are assembled and divided into a set of new groups. In each group, the local density is updated with
where denotes the local density of the clustering centers; and is the modified decision function, defined as
where is the local density of the jth clustering center, which is calculated in the last stage of the grouping and clustering procedure.
As can be seen, there are two criteria for clustering centers in the proposed approach. On one hand, the clustering centers are supposed to have a large local density, which characterizes the major component of the original image data. On the other hand, the spectrums of the clustering centers are expected to be significantly different from each other. For this reason, the candidates of the clustering center with either a small minimal difference or a low local density are excluded.
After the clustering centers of the specified image data are decided, the corresponding classified image can be generated by means of spectral matching.
2.2.2. Identification of Ground Spectral Pattern
The temporal feature is implicitly incorporated through the assumption that the spectral reflectance of ground covers remains relatively stable over time, whereas cloud spectral characteristics are transient and scene-dependent. By constructing a ground spectral dataset that represents stable surface materials, the method leverages temporal consistency of ground reflectance to indirectly distinguish cloud-contaminated pixels.
The reflectance and the emission of the clouds are related to the physical properties, including height, water content, thickness, aspect angle, etc., which can vary rapidly in a relatively short period. For this reason, scarce spectral reflectivity data of the clouds are available to build spectral patterns of the clouds for detection. Instead, the cloudless pixels in the image corresponding to the ground area, can be detected via consulting the spectral dataset of the ground covers, in which the spectral reflectivity of most types of ground covers are involved. The remainder of the cloudless pixels are marked as clouds.
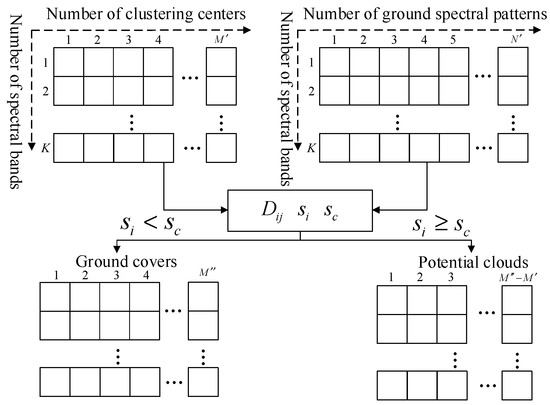
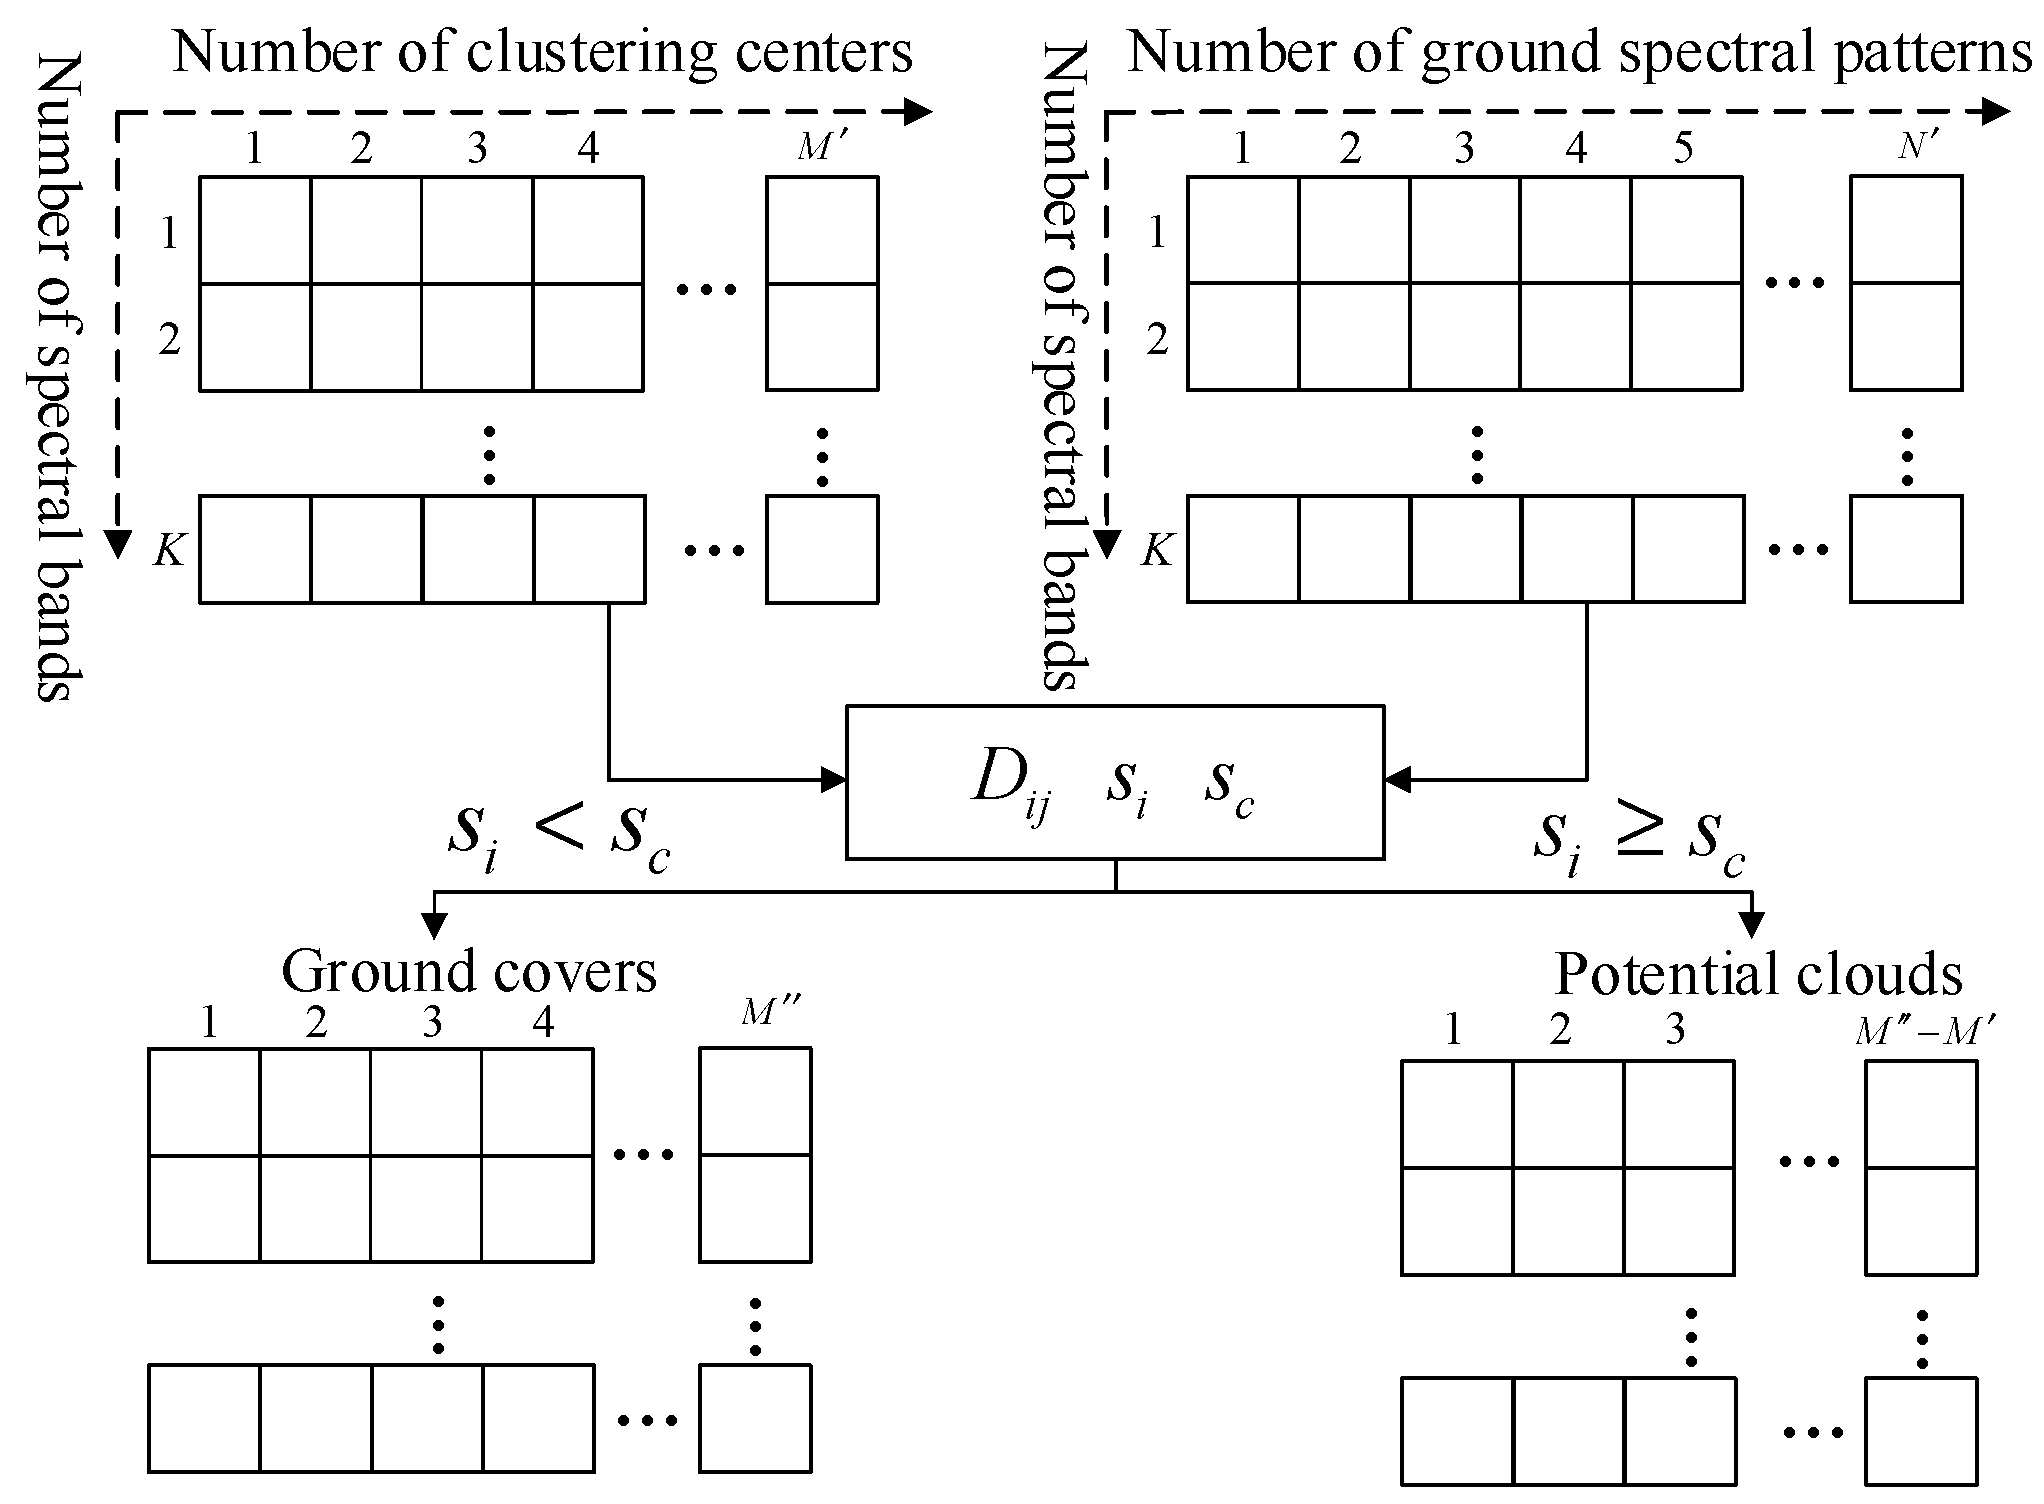
To this end, numbers of spectral reflectivity data are extracted from the U.S. Geological Survey (USGS) spectral library [18] to build a spectral dataset of the ground covers, including minerals, vegetation, chemical mixtures and man-made materials. The matching procedure is shown in Figure 3.
Figure 3.
The process of computing vector D for a certain type of data.
The spectral similarity of the clustering centers to the spectral patterns in the dataset of the ground covers can be quantified according to the Euclidean distance similar to (5), which can be expressed as
where denote the similarity of the ith clustering center to the jth spectral pattern in the dataset; represent the reflectivity of the ith clustering center in the kth spectral band; and represent the reflectivity of the jth spectral pattern in the kth spectral band.
Since the closer Euclidean distance corresponds to the higher similarity, the minimal distance of the ith clustering center to all spectral patterns in the dataset is selected as the criterion for the matching result, i.e.,
where is the minimal distance of the ith clustering center to the spectral patterns; and denotes the number of the spectral patterns in the dataset.
A threshold for the minimal distance can be set to decide whether the ith clustering center is matched, expressed as
where is the threshold for matching result decision; denote total number of the cluster centers obtained in the first part of Section 2.2; is an empirical constant describing the tolerance for unmatching, which is set as 2.6 in our experiment.
It should be noted that spectral measurements in the USGS spectral library are primarily acquired under controlled laboratory or field conditions, whereas satellite-observed spectra are influenced by atmospheric effects, sensor response functions, illumination geometry, and surface roughness. Advanced spectral feature learning methods have also been proposed to improve robustness in hyperspectral applications [20]. These factors inevitably introduce discrepancies between reference spectra and satellite measurements. To mitigate such discrepancies, an adaptive tolerance parameter is introduced in the spectral matching process (Equation (11)). This tolerance accounts for spectral variability induced by atmospheric correction residuals and observational geometry differences. In addition, spectral comparison is performed across multiple bands simultaneously, which reduces the influence of noise in any single band.
Although uncertainties cannot be completely eliminated, experimental results indicate that the matching strategy remains robust across different scenes and sensors. Future work may incorporate sensor-specific spectral response convolution and atmospheric correction uncertainty modeling to further improve matching reliability.
The decision function ξ for the spectral matching results is given as
For each matched clustering center, the type of the corresponding pixels can be identified, while the matched clustering centers indicate the possible cloudy pixels, which will be further examined to achieve the final detection result.
2.2.3. Exclusion of Occasional Interference
Since the cloud detection results depend on the completeness of the spectral dataset, occasional events corresponding to the unmatched pixels can be detected along with the clouds, including wildfire, air pollutant and rocket plume. Other available features should be adopted to alleviate the interference of the occasional events for the better performance of cloud detection.
In the field of satellite remote sensing, determining cloud temperature is a complex problem constrained by multiple factors. The results depend not only on macroscopic physical properties such as the optical thickness, cloud top height, and cloud phase, but may also be influenced by the internal microstructure of clouds and external atmospheric environmental conditions. Existing literature lacks studies that directly quantify the temperature range of clouds. The focus of this research is not to precisely define the temperature range of clouds but rather to utilize temperature information as an auxiliary discrimination feature to enhance the reliability of cloud detection.
The temperature of clouds is related to many physical properties, such as height, thickness, phase state, water and ice content, etc.
Although the dynamic temperature range of clouds is difficult to precisely define, cloud brightness temperature values are typically lower than those of the Earth’s surface and sporadic events such as wildfires and rocket plumes, and exhibit relatively lower temperature distribution characteristics across the entire remote sensing image. Based on this characteristic, by setting appropriate thresholds in the temperature imagery, cloud pixels can be effectively distinguished from sporadic event pixels, thereby further enhancing the accuracy and interference resistance of cloud detection. Similar temperature-based strategies have been incorporated in operational cloud detection frameworks such as Fmask [1,21].
The decision function for exclusion of occasional interference is given as
where denotes the bright temperature of the pth pixel in a specific LWIR spectral band; is the average bright temperature of the pixels corresponding to the ground cover, detected in the second part of Section 2.2; is a weighting coefficient, which is set as a constant of 2.0 in our experiment, and is a temperature threshold coefficient used to distinguish cloud pixels from high-temperature interference, which is set as a constant of 0.5 in our experiment.
The final detection result can be achieved after the exclusion of the pixels corresponding to the occasional events.
3. Results
3.1. Experimental Result
3.1.1. Clustering Result
Landsat 8 and Sentinel-2 data were selected to demonstrate the usefulness of the proposed scheme. For one observational scene, Landsat 8 acquire the radiant images in eleven spectral bands, in which the bands NO. 1~7 are reflectance dominant bands with a spatial resolution of 30 m. The band NO. 8 is the panchromatic band with a spatial resolution of 15 m, while the band NO. 9 is the absorption band for cirrus detection. The bands NO. 10 and 11 locate at LWIR spectrum for temperature detection with a spatial resolution of 100 m.
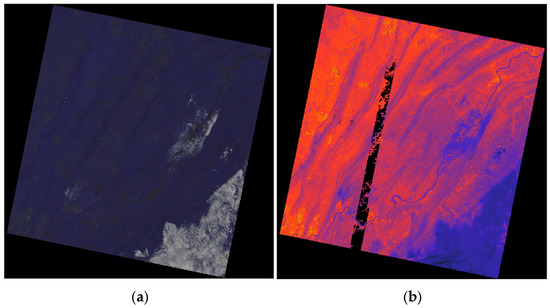
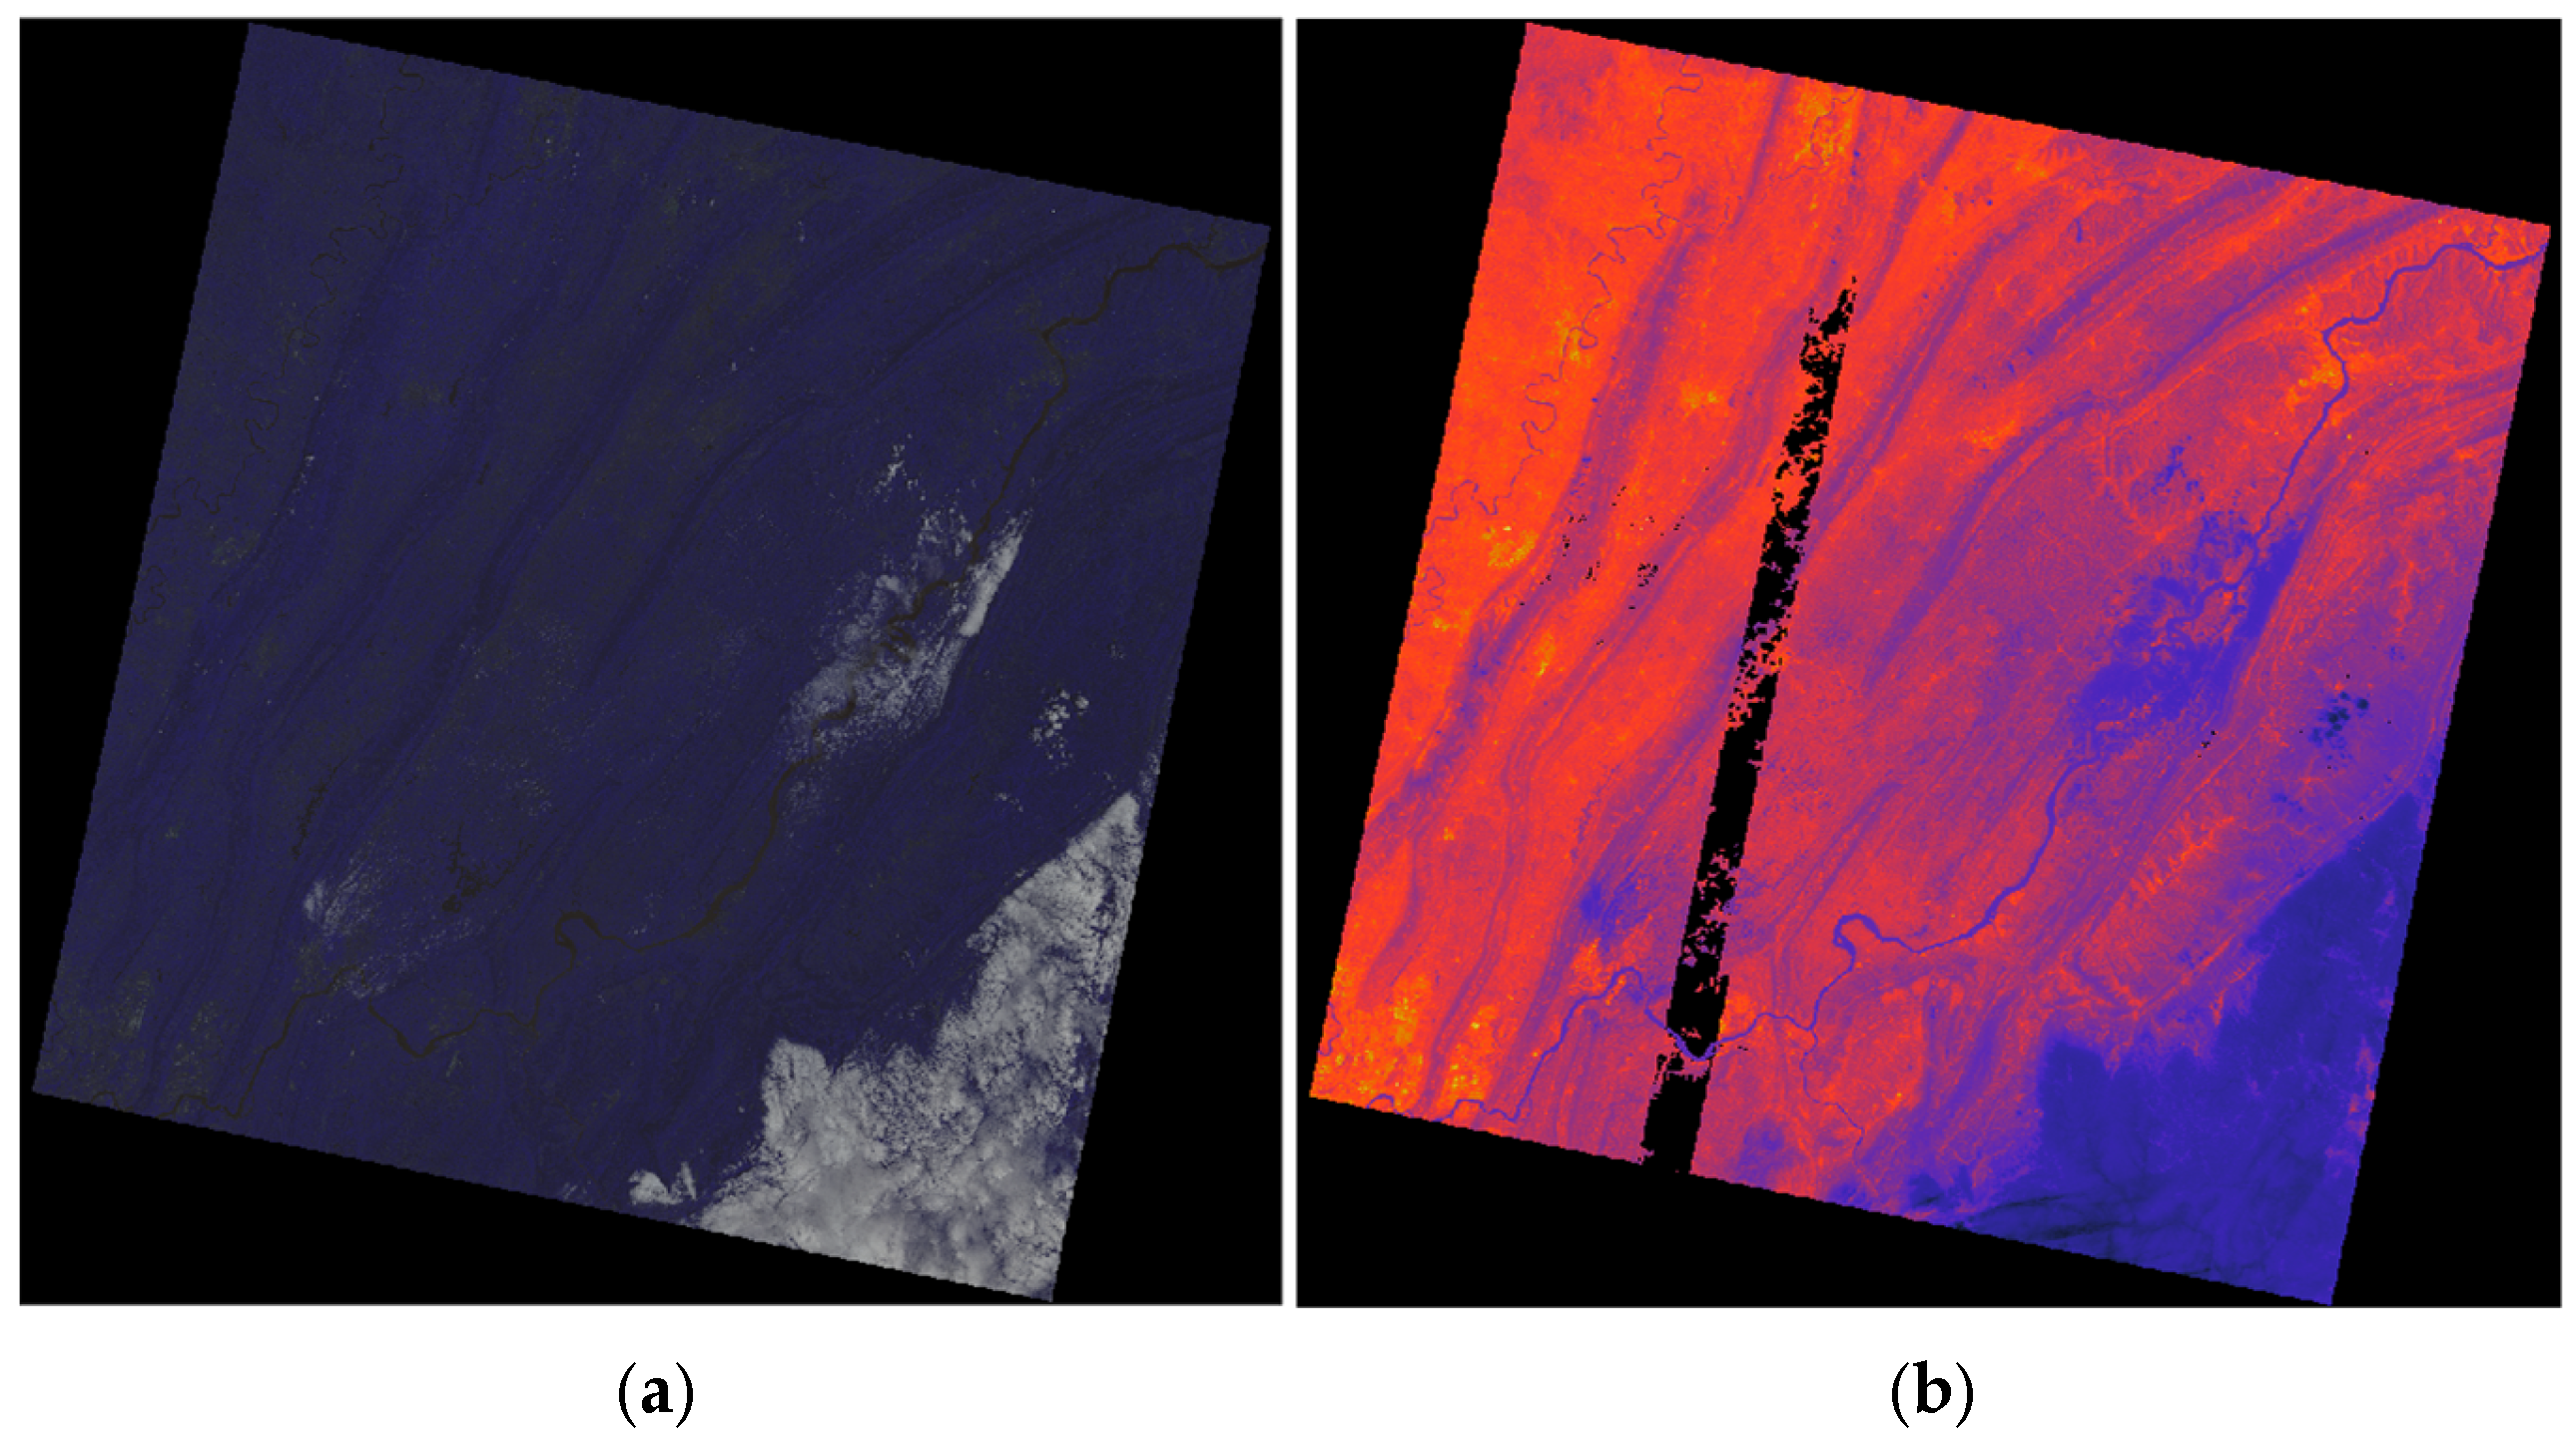
In this work, the images from the bands NO. 1~7 are used for the unsupervised hierarchy clustering, while the image from the band NO. 10 is adopted in the exclusion of the occasional interference. The pseudo-color and bright temperate images of the selected scene is shown in Figure 4.
Figure 4.
Selected test scene of Landsat 8 data. (a) Pseudo-color image synthesized with red, green, and blue bands. (b) Bright temperature image of band NO. 10, where brighter dots indicate higher temperatures and the black pixels in the middle indicate that information is missing and unavailable.
As it can be seen, the clouds covering a large area can be easily identified from either the pseudo-color image or the bright temperature image, whereas the fragmentary clouds covering a relatively small area can hardly be distinguished directly. The spectral features of the clouds are in accordance with our previous discussion, i.e., the cloudy pixels are brighter in the reflectance dominant spectral bands, while they are darker in the emission dominate spectral bands.
3.1.2. Cloud Detection Result
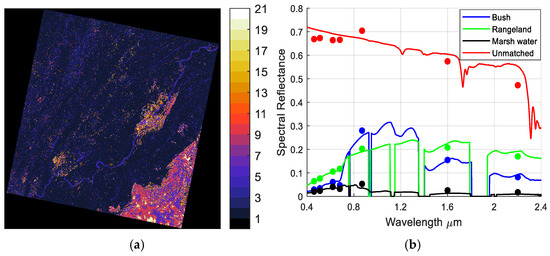
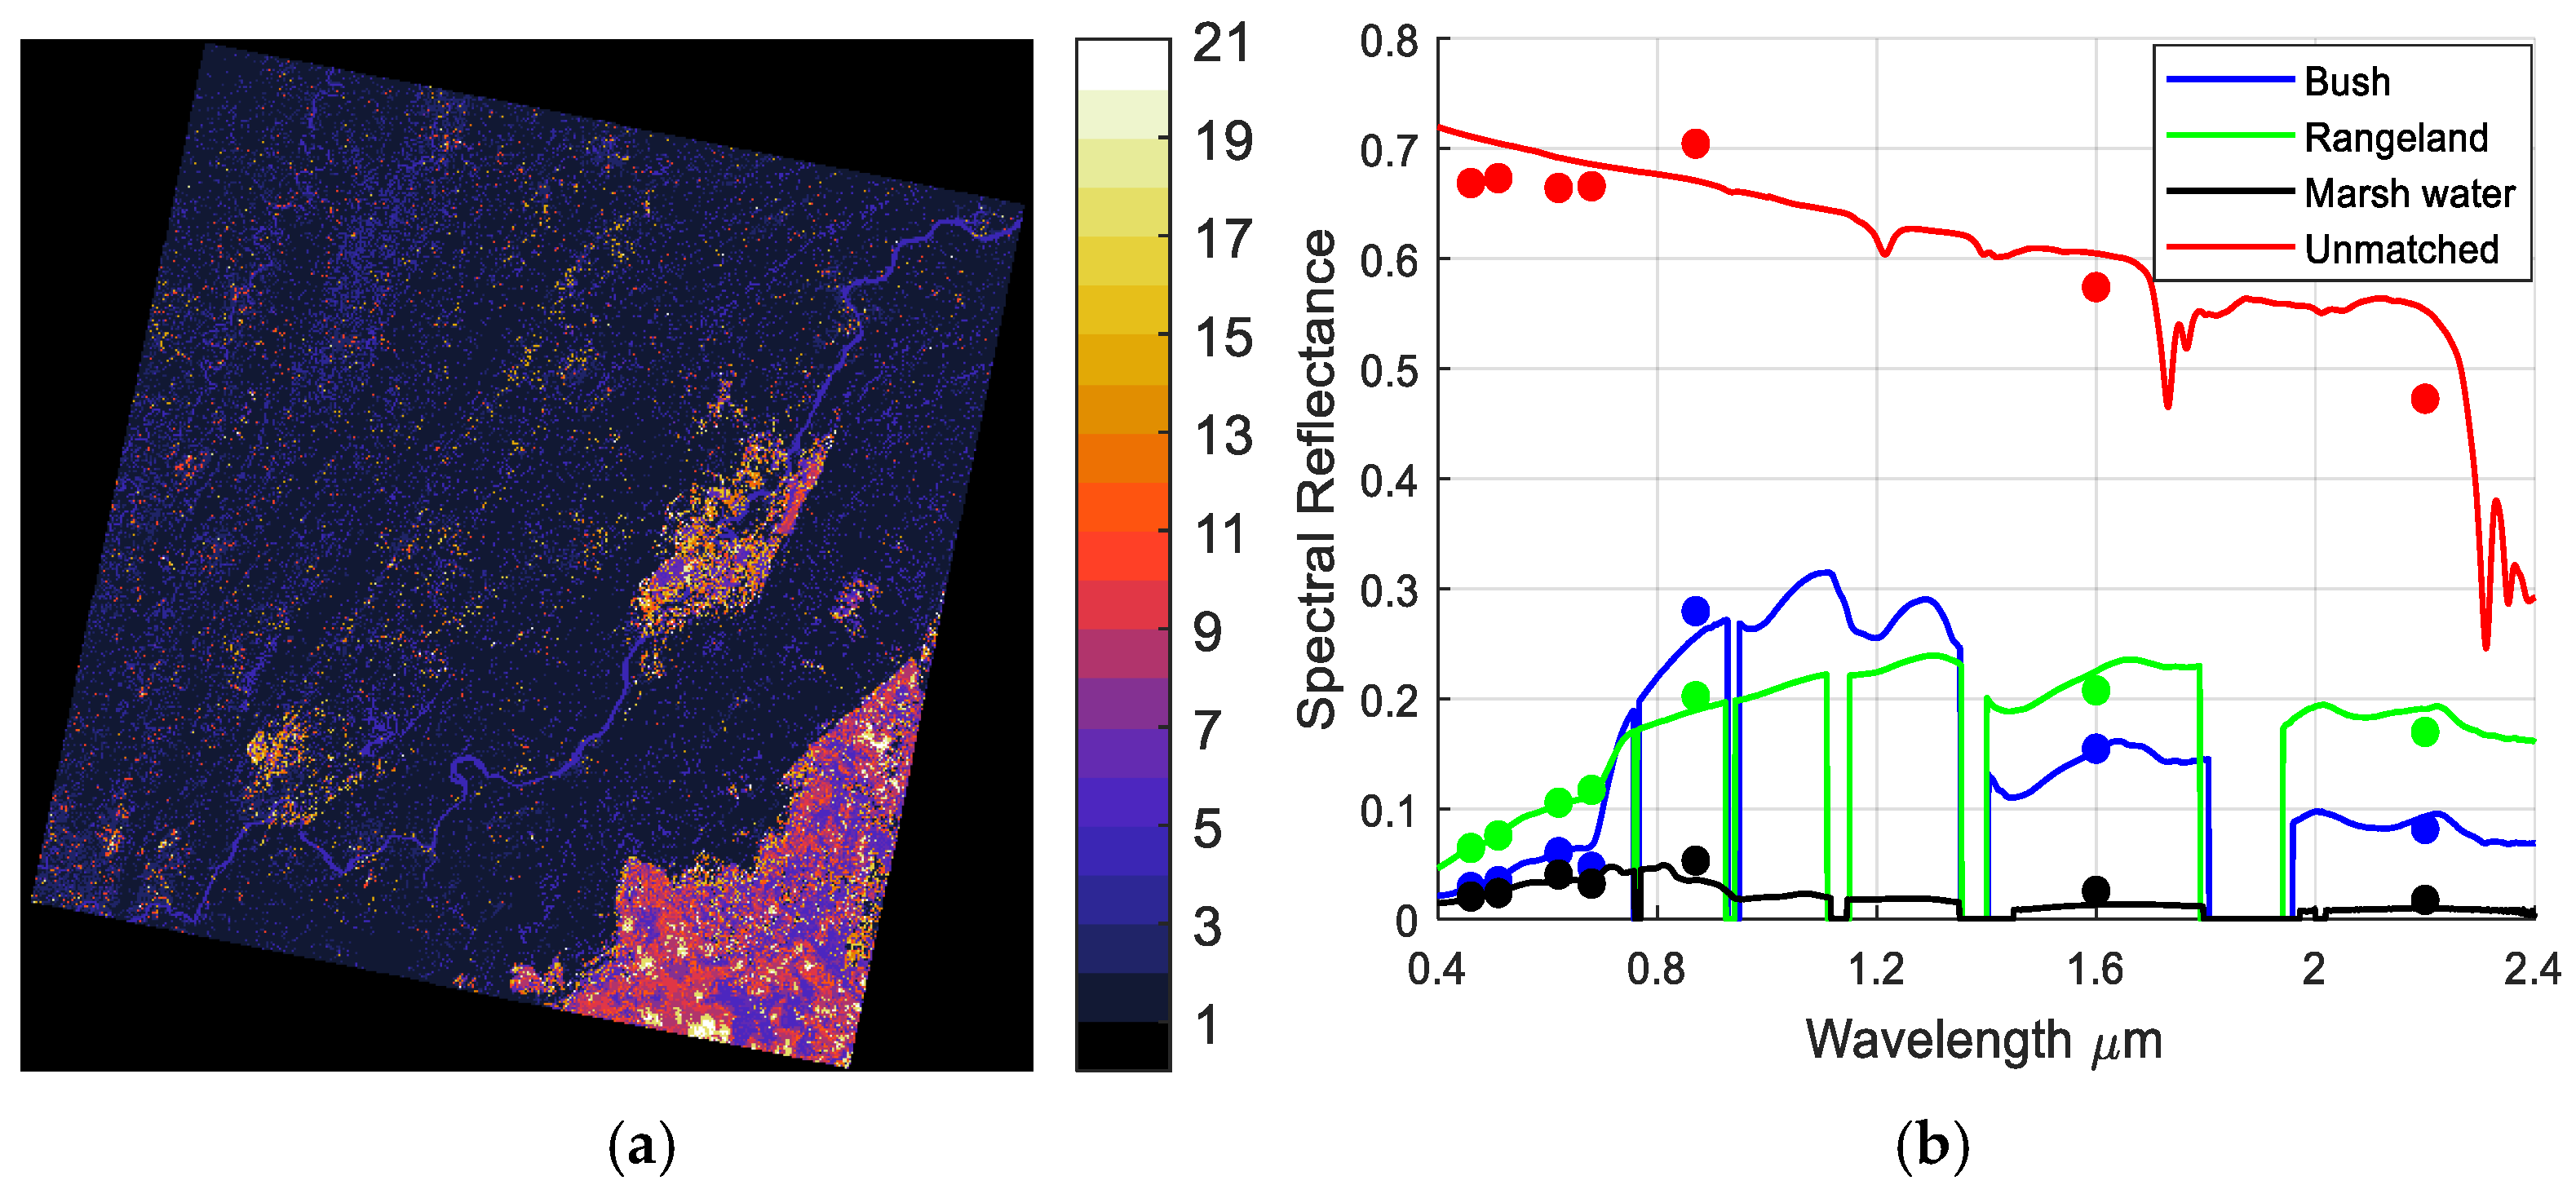
The hierarchy clustering result is given in Figure 5, where Figure 5a is the classification image, while Figure 5b shows a part of the results for the spectral matching. As it can be seen in the Figure 5a, there are 21 types of the objects in the classified image, while about 10 among them are probably clouds. The classification result validates our assumption that the spectral features of the clouds are transient and time-variant.
Figure 5.
(a) Classification image. (b) Spectral reflectivity of clustering centers and their most similar patterns in dataset. Dots represent spectral reflectivity of clustering center, while solid lines are spectral patterns in dataset.
The spectral patterns of this work are extracted from the USGS spectral library [18], which contains cloud and cloud shadow information generated by the operational Fmask-based processing chain. The selected test scenes include diverse land cover types and these scenes were selected from different acquisition dates to ensure variability in atmospheric conditions and cloud coverage patterns. The dataset includes 2455 spectral patterns in total, which covers spectrum from 0.35 μm to 2.5 μm at a resolution of 1 nm. Figure 5b shows an example of the spectral matching results, where the dots with different color denote the spectral reflectivity of the clustering centers extracted from the Landsat 8 data, while the curves with the corresponding color are the most similar pattern in the dataset.
As it can be seen in Figure 5b, when the dots of the same color distribute at the corresponding curve, the clustering center is perfectly matched. However, due to the interference of ground atmospheric effects, observational geometry and ground roughness, the dots generally distribute around the reference spectral pattern. These results demonstrate the necessity of an additional tolerance for the matching processing in Equation (9).
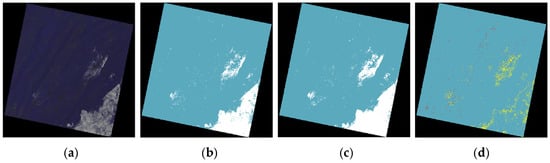
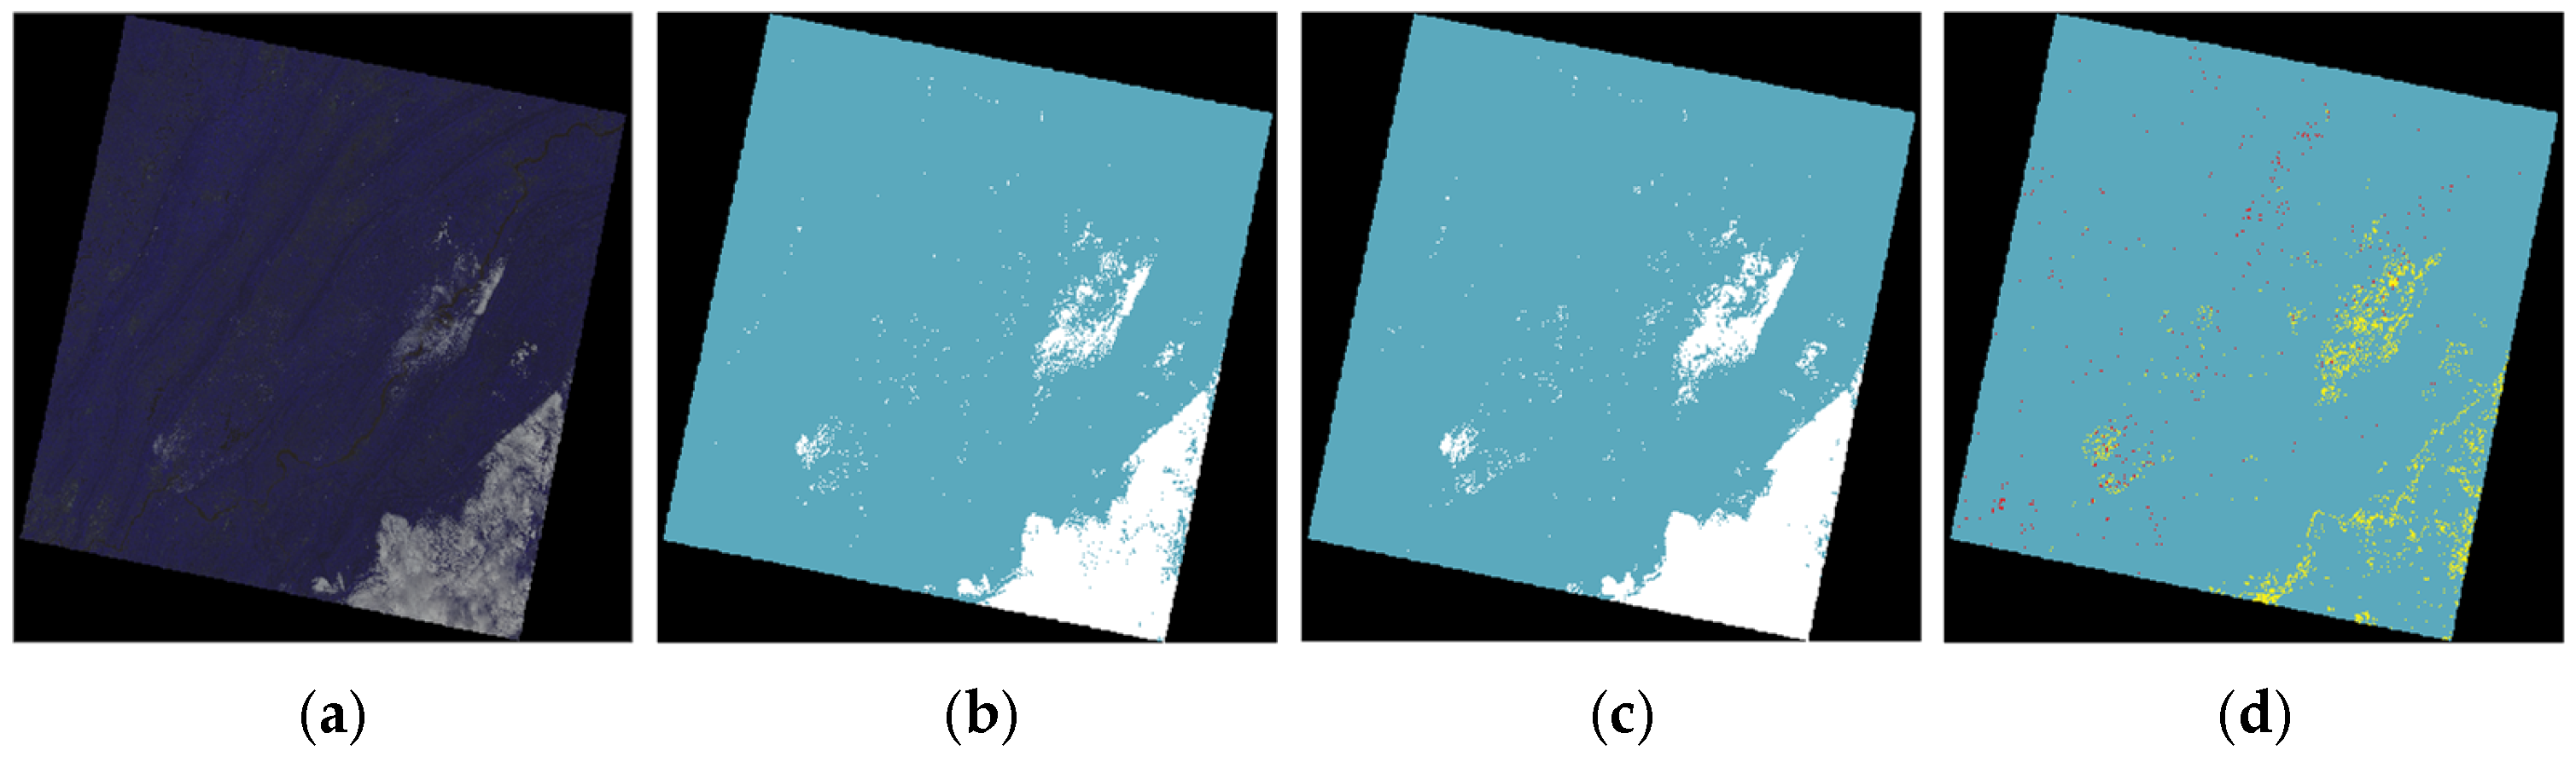
The results of the method proposed in this paper are validated using Landsat 8 data, and Figure 6 shows one set of results. Columns (a), (b), (c), and (d) are respectively the RGB images, the cloud detection results of the proposed method, the reference cloud mask, and the difference between of the reference cloud mask to the cloud detection results of the proposed method. The detection image shows the similar texture to the reference image, whereas the boundary of the clouds in the two images are different, as shown in Figure 6d.
Figure 6.
Cloud detection results. (a) RGB imagery. (b) Cloud detection results using the proposed method, where white and cyan represent cloud and clear sky, respectively. (c) Reference cloud mask. (d) Difference between (b) and (c), where red, yellow, and cyan denote false alarm pixels, false omission pixels, and correct detection results, respectively.
Although the overall cloud detection accuracy is quantitatively evaluated using standard metrics, the current study does not provide category-specific statistics for different cloud types due to the lack of cloud masks with detailed per-category annotations in the reference datasets. The differentiation of cloud types typically requires auxiliary information such as cloud optical thickness or radiative transfer modeling, which is beyond the scope of the current spectral-based framework.
Nevertheless, based on qualitative visual inspection across multiple test scenes, the detection performance varies according to cloud optical properties. Thick and optically dense clouds are detected with high reliability, as they exhibit strong reflectance contrast in visible bands and lower brightness temperature in thermal bands compared to ground surfaces. Thin and semi-transparent clouds present greater challenges because their spectral signatures partially overlap with underlying surfaces, which may lead to increased omission errors. Cloud edge regions and fragmented cloud structures also introduce classification ambiguity due to mixed pixels and gradual spectral transitions. While the hierarchical clustering framework reduces local spectral variability, boundary pixels remain more difficult to classify accurately.
Future work will focus on incorporating cloud optical thickness information or multi-temporal consistency analysis to enable more detailed per-category quantitative evaluation.
3.2. Experimental Evaluation
To quantitatively evaluate the accuracy of the cloud detection method, this chapter employs the confusion matrix method, as shown in Table 4, for analysis. Four metrics are selected to assess the accuracy and reliability of the results: Overall Accuracy (OA), Commission Error (CE), Omission Error (OE), and the Kappa coefficient.
Table 4.
Confusion Matrix for Accuracy Validation of Cloud Detection Results.
Specifically, OA represents the proportion of correctly detected cloud pixels to the total number of pixels; CE indicates the probability that a true non-cloud pixel is misclassified as a cloud pixel; OE indicates the probability that a true cloud pixel is misclassified as a non-cloud pixel; and the Kappa coefficient is used to evaluate the agreement between the cloud detection results and the reference (ground truth) image. The formulas are as follows:
In the formulas, N is the total number of pixels, i.e., N = .
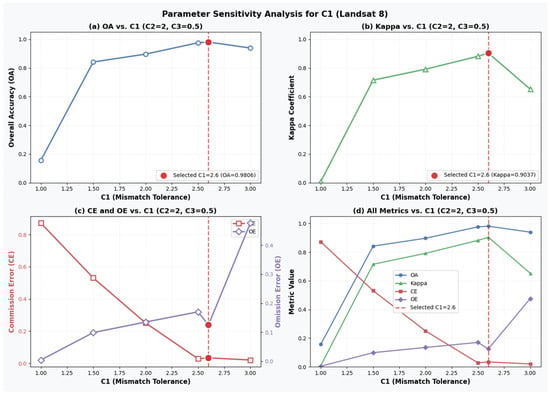
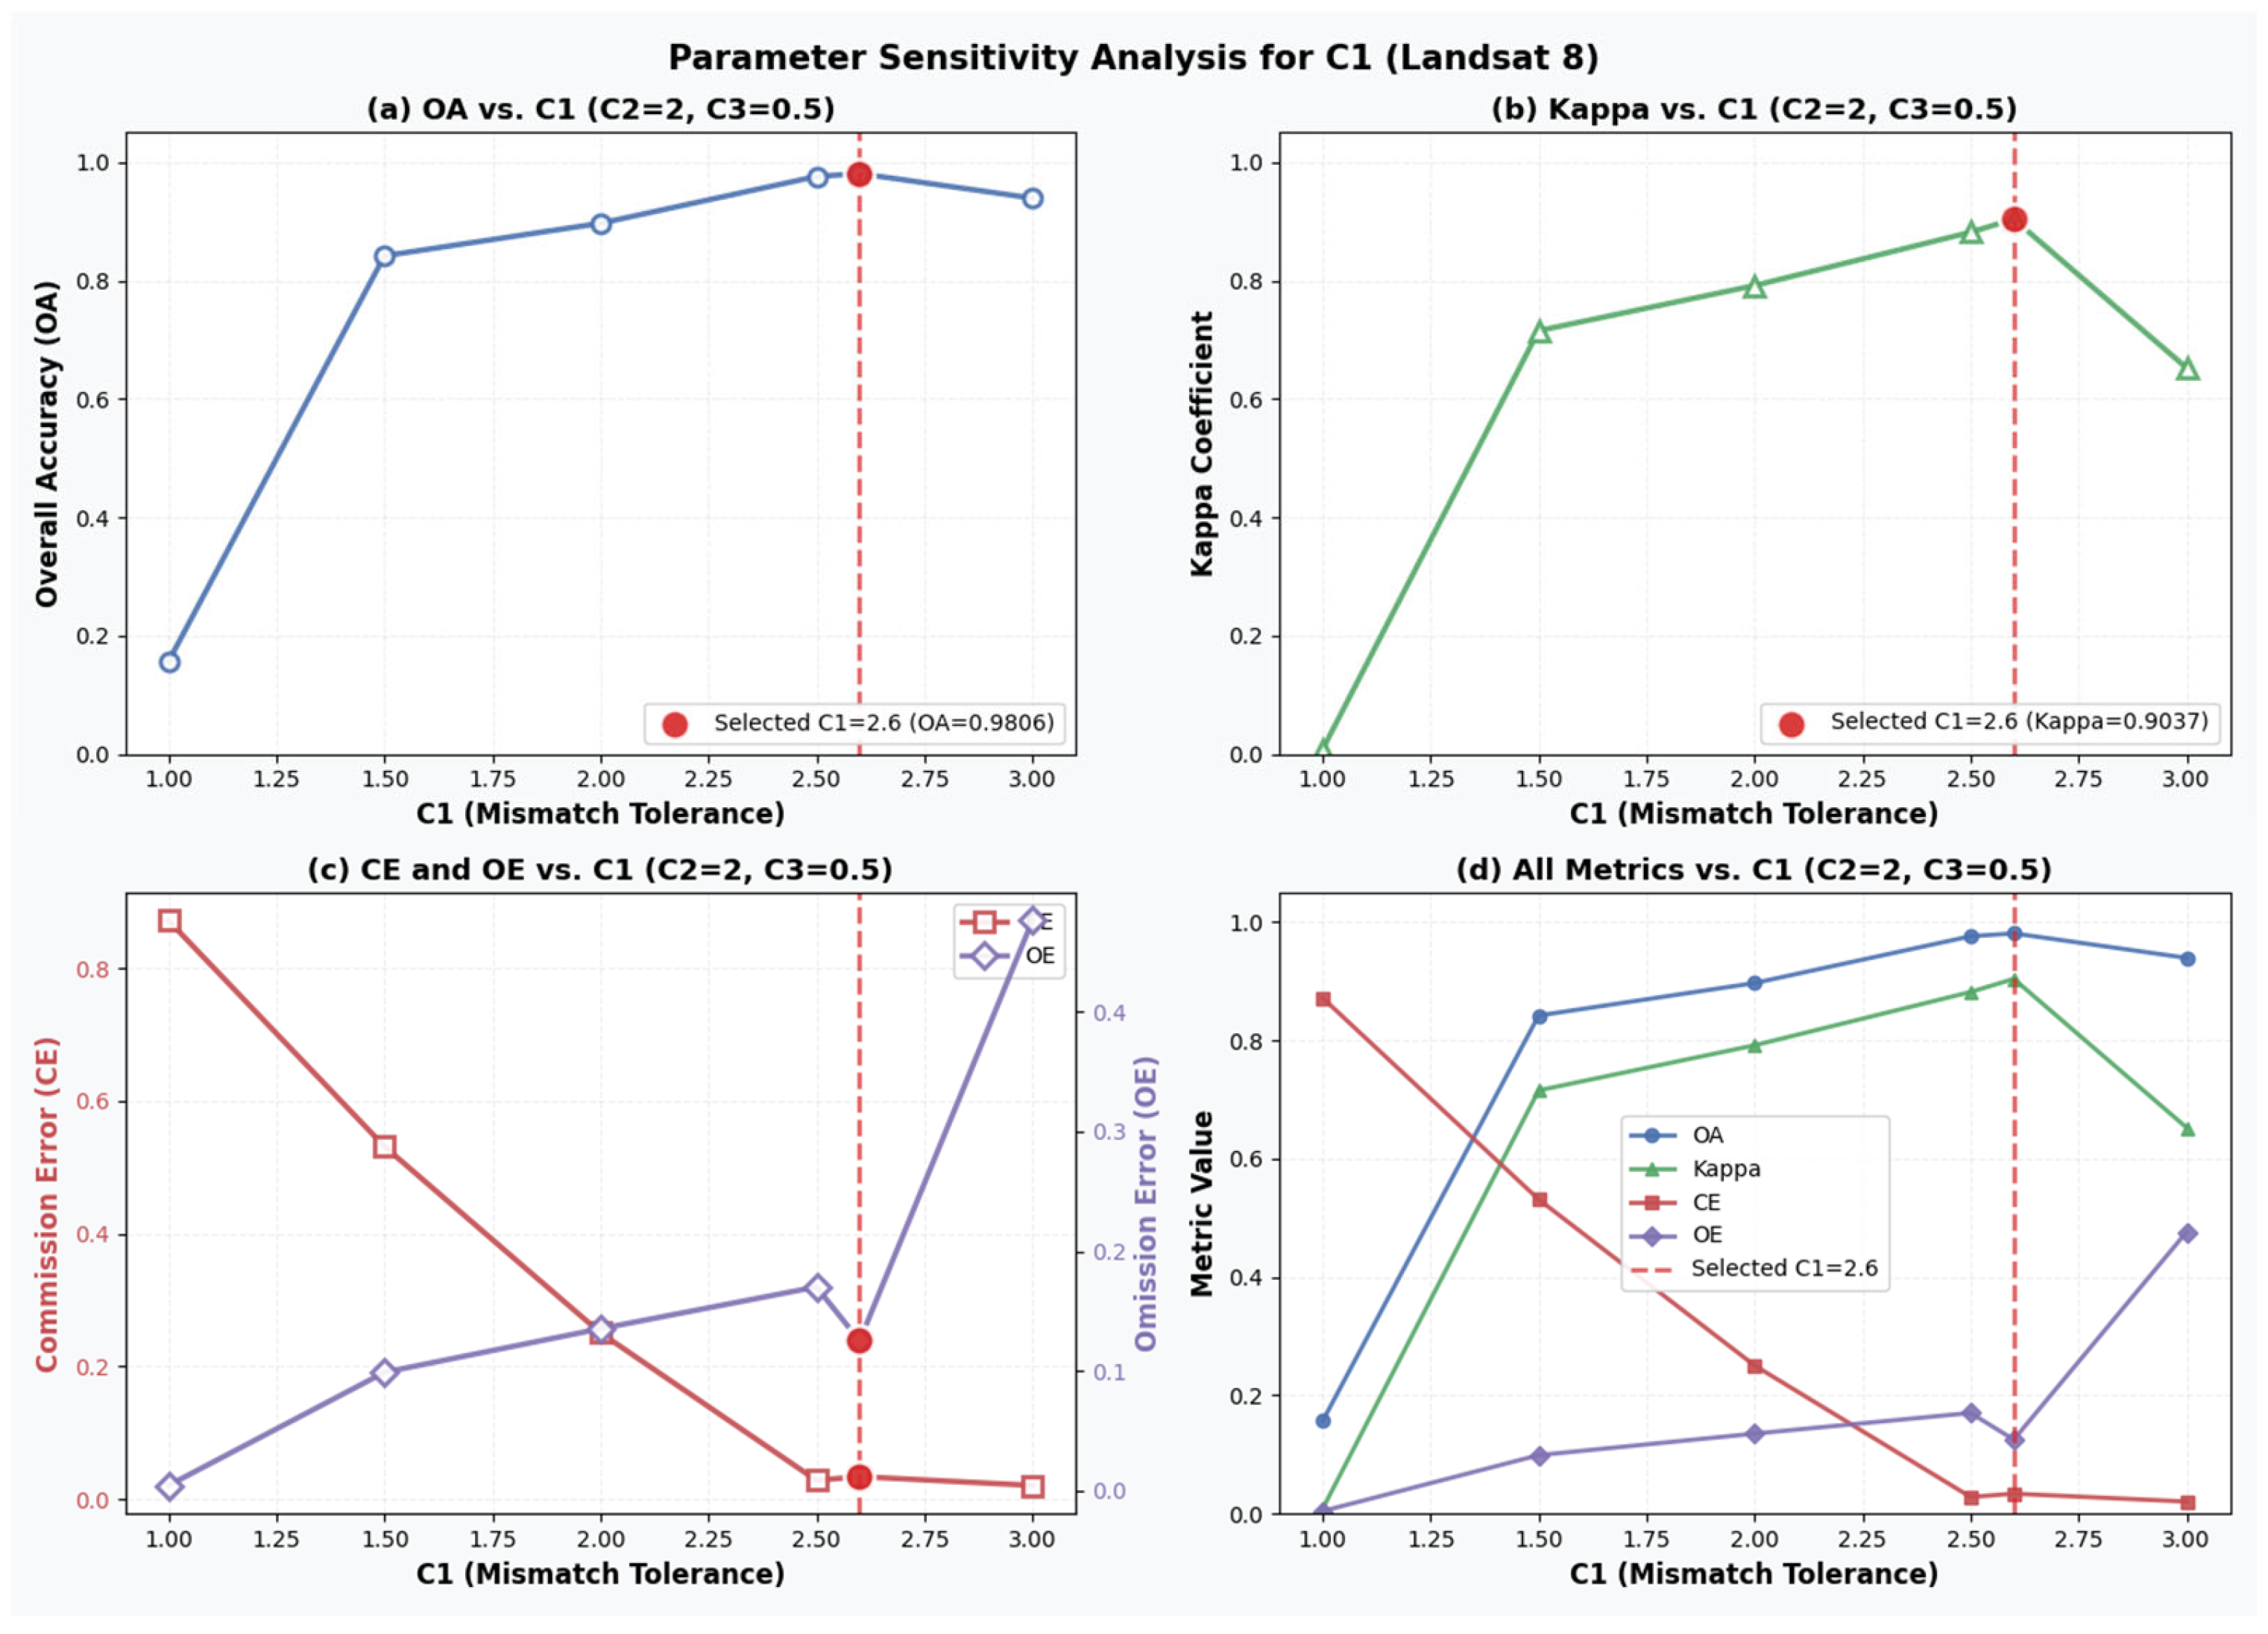
To investigate the robustness of the proposed cloud detection scheme and to justify the selection of key parameters, a parameter sensitivity analysis was conducted on Landsat 8 data. Three parameters were analyzed, including the spectral matching tolerance parameter , the temperature-related weighting coefficient , and the interference suppression parameter.
First, the sensitivity of parameter was evaluated using Landsat 8 data without excluding occasional interference. The value of was varied from 1.0 to 3.0, while other parameters were fixed. Quantitative evaluation results in terms of OA, CE, OE, and Kappa coefficient are shown in Figure 7.
Figure 7.
Sensitivity analysis of parameter on Landsat 8 data. Detection performance is evaluated using OA, CE, OE, and Kappa coefficient.
The results indicate that when is set to a small value, the spectral matching criterion becomes overly strict, leading to a large commission error. Conversely, an excessively large value results in increased omission errors due to overly relaxed matching conditions. A balanced performance is achieved when is around 2.6, where OA and Kappa reach their maximum values.
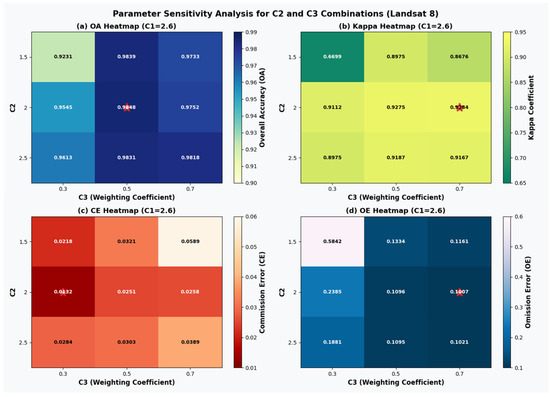
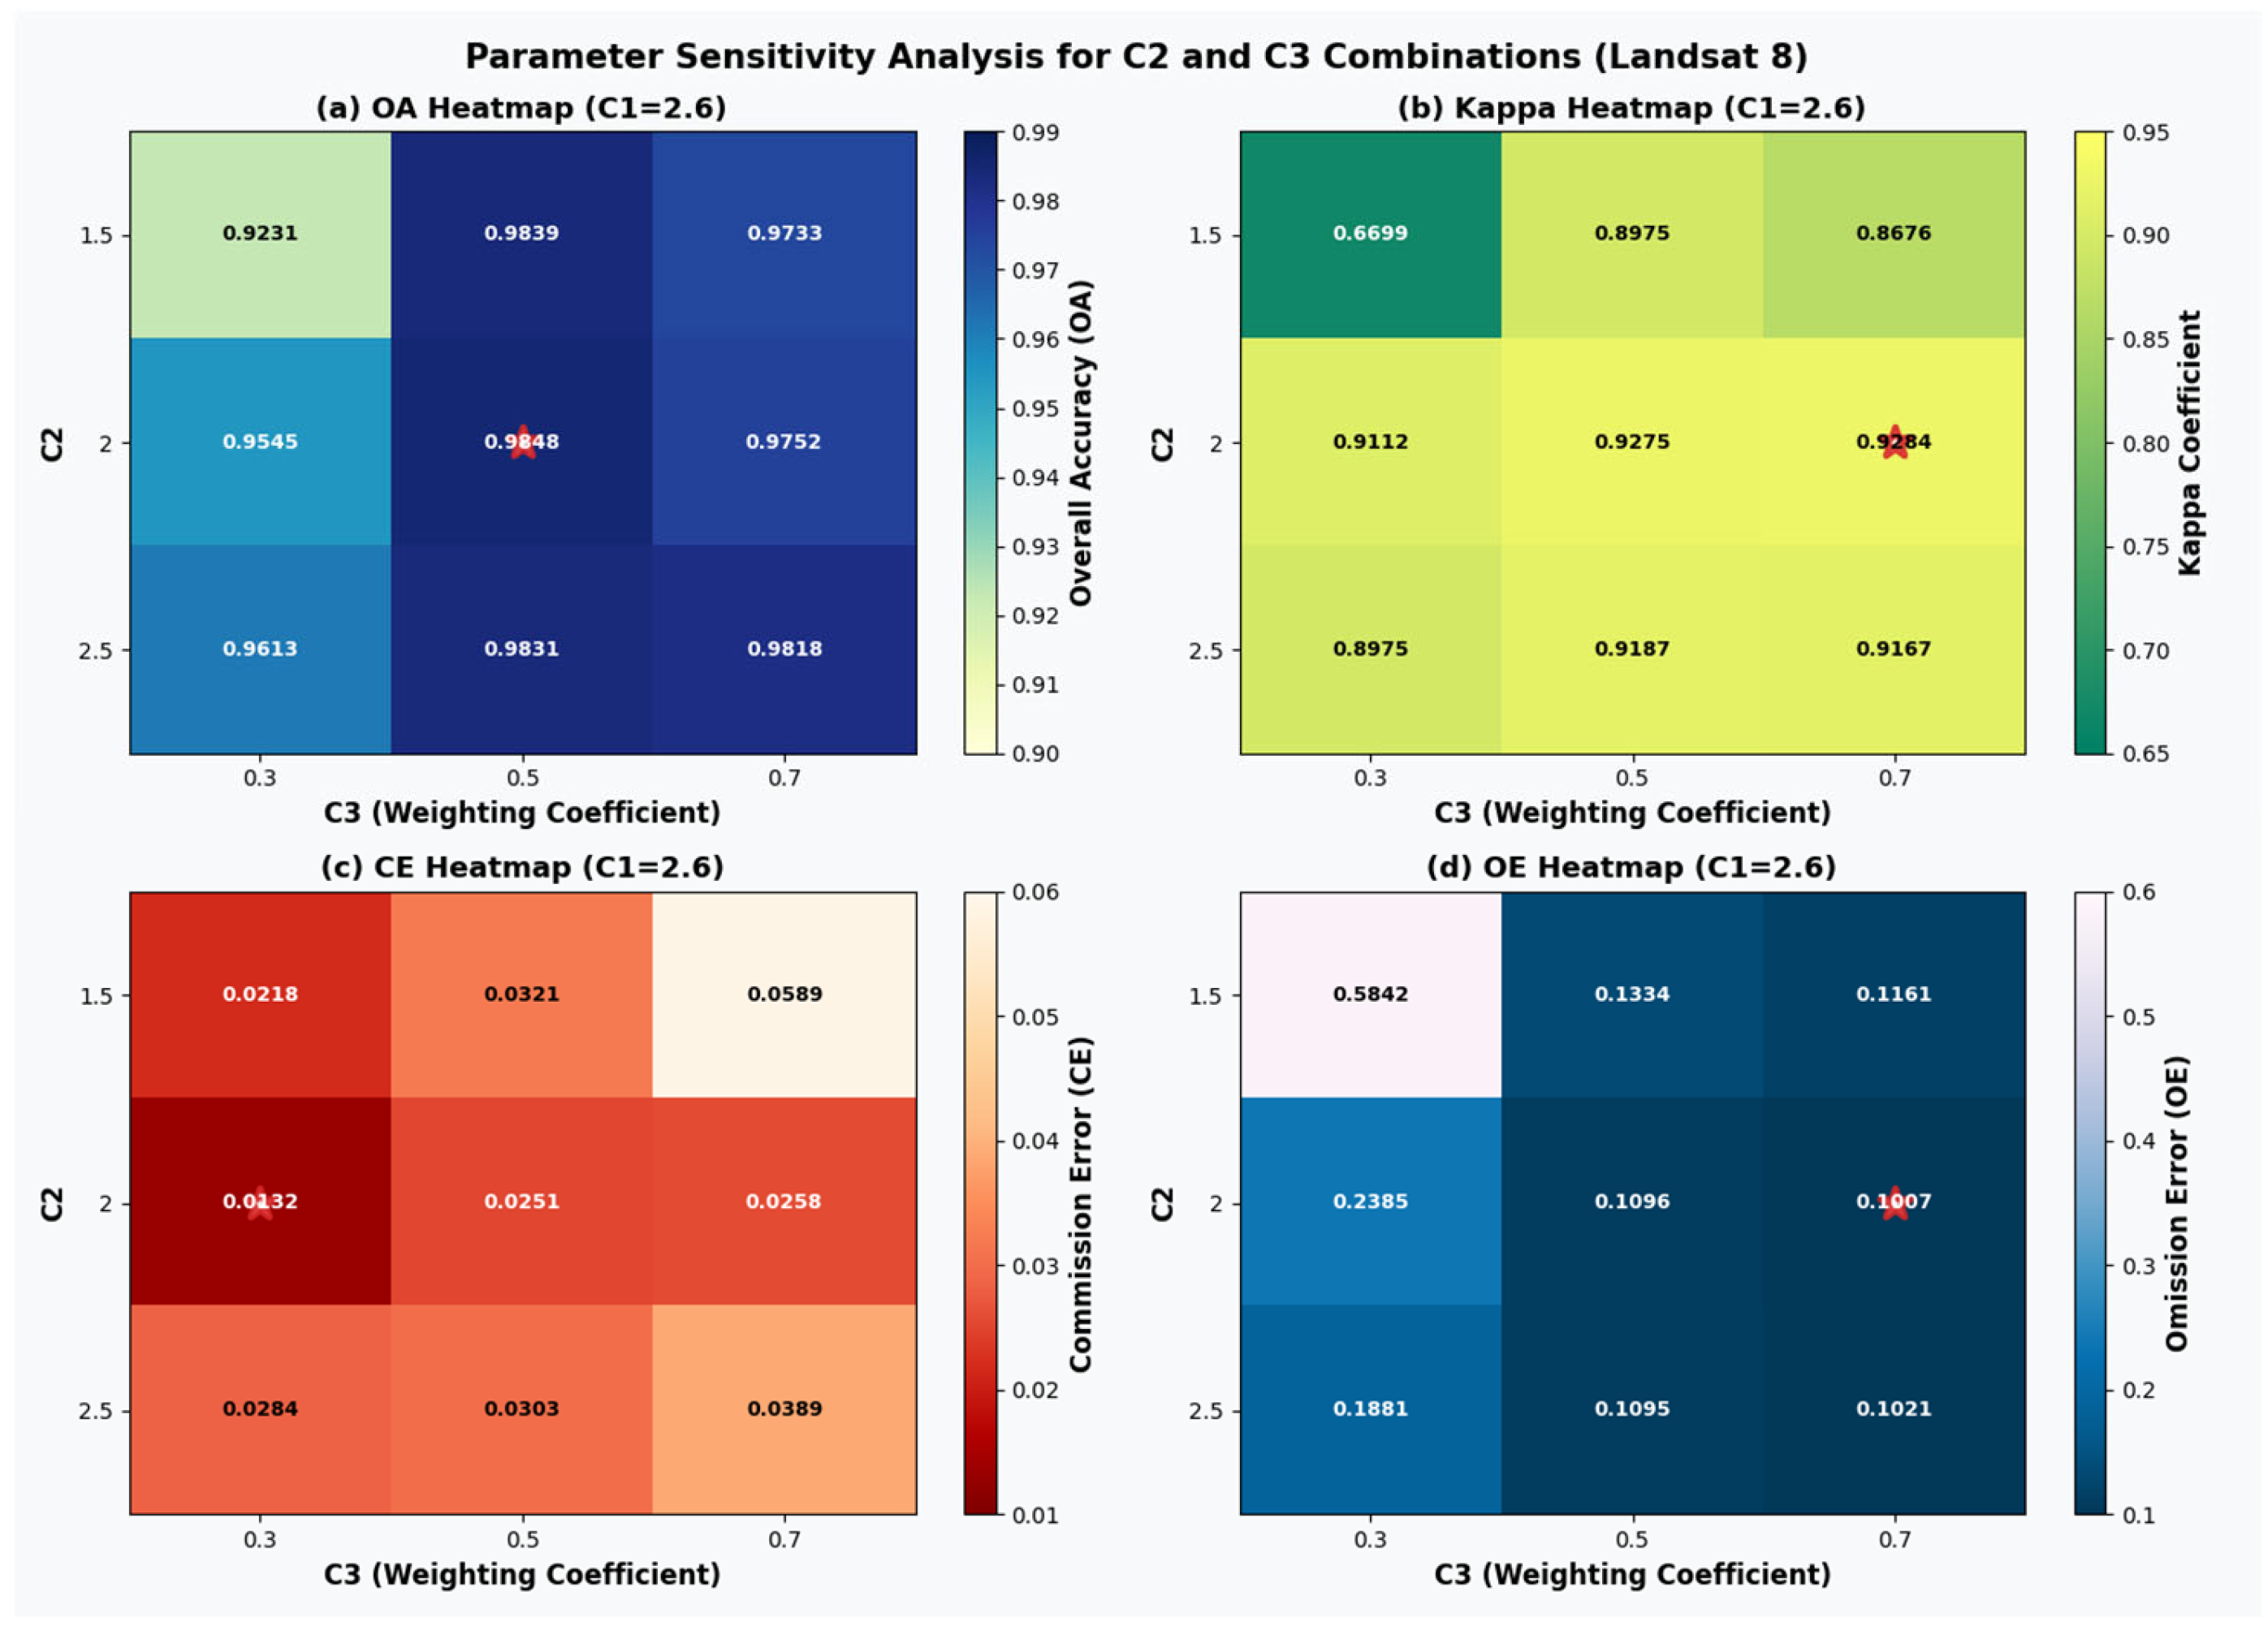
Subsequently, joint sensitivity analysis of parameter and was performed using Landsat 8 data with interference exclusion enabled, while fixing = 2.6. The values of and were varied within reasonable ranges, and the corresponding detection performance was quantitatively evaluated, and the evaluation results are shown in Figure 8. The results demonstrate that parameter combinations around = 2.0 and = 0.5 achieve a favorable trade-off between commission and omission errors. This confirms the robustness and rationality of the parameter settings adopted in this study.
Figure 8.
Joint sensitivity analysis of parameters and on Landsat 8 data in terms of OA, CE, OE, and Kappa coefficient. The red asterisk denotes the parameter setting that achieves the best overall trade-off between OA, Kappa coefficient, and error metrics.
Based on the above analysis, the parameter configuration = 2.6, = 2.0 and = 0.5 was selected for all subsequent experiments.
The evaluation metrics for the cloud detection results on a representative Landsat 8 scene are presented in Table 5. This scene was selected to assess the effectiveness of the interference exclusion strategy described in Section 2.2.3. The results show that after excluding interfering pixels, all evaluation metrics improve compared to the scenario without interference exclusion, confirming the effectiveness of the temperature-based filtering step.
Table 5.
Results before and after interference elimination.
In reference to the cloud mask product, OA, CE, OE and the kappa coefficient of the final cloud detection result are analyzed [22], as shown in Table 6. In contrast to the single-scene analysis presented in Table 5, Table 6 summarizes the averaged evaluation results over multiple independent test scenes. For Sentinel-2, the OA reaches 98.24%, while the CE is 25.82%. The relatively high CE indicates that certain clear-sky pixels are misclassified as clouds. This phenomenon is mainly observed in highly reflective surfaces such as urban areas or bright bare land, where spectral similarity to clouds may lead to over-detection. For Landsat 8, the OA is 97.94% with a CE of 0.96%, indicating stable cloud detection performance with relatively low false alarms. However, OE suggests that thin clouds and fragmented cloud boundaries remain challenging. The performance differences between Landsat 8 and Sentinel-2 may be attributed to differences in spectral band configuration, radiometric characteristics, and scene composition. Although both sensors provide relatively high spatial resolution data, variations in spectral response functions can influence the matching accuracy with the ground cover spectral database.
Table 6.
Evaluation of Cloud Detection Results.
To ensure a fair and meaningful comparison, representative cloud detection methods from three categories were selected as benchmarks: threshold-based operational methods (Fmask), deep learning-based approaches (FCNN), and multi-scale feature fusion methods (MSCFF). These methods are widely recognized and frequently adopted in cloud detection studies. The selection of these benchmark methods aims to comprehensively evaluate the performance of the proposed scheme from both traditional and learning-based perspectives.
In the cloud detection of Landsat 8 data, the FCNN method in [23] achieved an OA of 94.36%, with CE of 0.0536 and OE of 0.0591. The MSCFF method from [24] had an OA of 94.96%, CE of 0.0416, and OE of 0.0607. Fmask showed an OA of 89.59%, CE of 0.1338, and OE of 0.0699. While this method has a higher OA, its CE and OE are slightly higher than those of the other methods.
The Fmask algorithm, applicable to Landsat 4-9 and Sentinel-2 data, has become a widely recognized benchmark method for cloud detection. It was proposed by Zhu et al. [1] and has been iteratively updated. Fmask performs initial separation of cloud, cloud shadow, and snow/ice through multispectral threshold segmentation (e.g., utilizing shortwave infrared and cirrus bands) combined with morphological optimization. To provide a meaningful and representative evaluation of the proposed cloud detection method, multiple test scenes from both Landsat 8 and Sentinel-2 were selected. For Landsat 8, three Level-2 Surface Reflectance scenes were selected from different geographical regions and acquisition dates. These scenes were intentionally chosen to include varying cloud conditions such as thick clouds, thin clouds, and fragmented cloud structures. For Sentinel-2, three Level-2A scenes processed by Sen2Cor were selected under similar criteria and the Scene Classification Layer (SCL) generated by the Sen2Cor processor was used as the reference cloud mask. The Sentinel-2 Scene Classification Layer (SCL) is generated by the Sen2Cor processor [25] and has been widely adopted in cloud-related studies [26].
The scenes cover heterogeneous land cover types including urban areas, forests, bare land, water bodies, and bright reflective surfaces. The selection also considers different atmospheric conditions and cloud coverage percentages to evaluate the robustness of the proposed approach.
In total, six scenes were used for quantitative evaluation (three Landsat 8 and three Sentinel-2). The scenes were selected based on the following criteria: presence of different cloud types, including dense cloud masses and fragmented cloud structures; diversity in surface reflectance characteristics; availability of official cloud mask products for reference comparison. The selected dataset spans different geographic regions and acquisition dates, ensuring variability in illumination geometry and atmospheric conditions. By incorporating heterogeneous surface types and cloud structures, the constructed dataset provides a representative evaluation benchmark for assessing the effectiveness and robustness of the proposed approach.
Although the dataset includes a limited number of representative scenes, the diversity in land cover types and cloud conditions provides meaningful insight into the general applicability of the proposed method. Future work will extend the validation to larger-scale datasets.
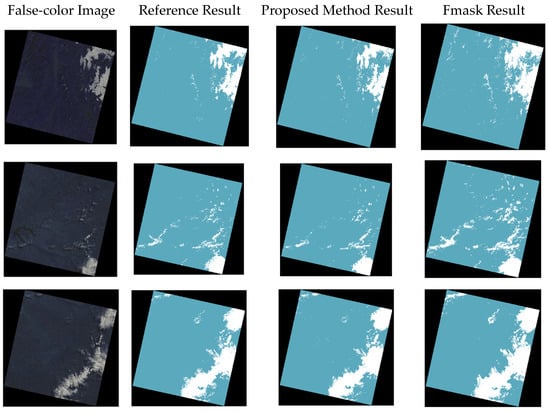
In this study, the Fmask method is adopted as a comparative benchmark to quantitatively validate the cloud detection performance of the proposed method on Landsat 8 and Sentinel-2 imagery. The cloud detection results of the proposed method and the Fmask method on selected Landsat 8 test samples are shown in Figure 9.
Figure 9.
Evaluation of the Proposed Method and the Fmask Method on Landsat 8 imagery.
The evaluation metrics for the two methods applied to images from different scenes are presented in Table 7. The results indicate that the proposed method outperforms the Fmask method in terms of OA, CE, and the Kappa coefficient, but it is slightly weaker than the Fmask method regarding OE.
Table 7.
Comparison Between the Proposed Method and Fmask on Landsat 8 imagery.
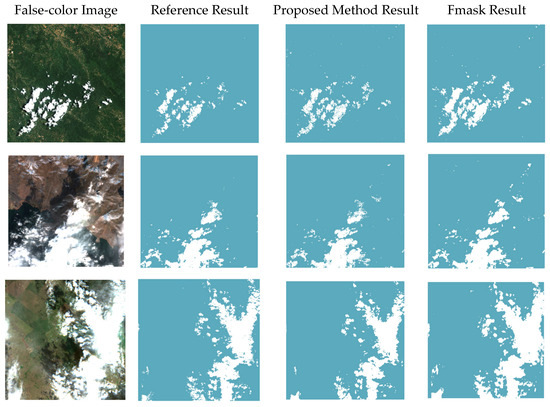
To further validate the applicability of the proposed cloud detection method to different satellite sensors, quantitative experiments were conducted on Sentinel-2 multispectral imagery. The official Sentinel-2 cloud mask product generated by the Sen2Cor processor, i.e., the Scene Classification Layer (SCL), was adopted as the reference cloud mask for evaluation. The cloud detection results of the proposed method and the Fmask method on selected Sentinel-2 test samples are shown in Figure 10.
Figure 10.
Evaluation of the Proposed Method and the Fmask Method on Sentinel-2 imagery.
Table 8 presents a quantitative comparison between the proposed method and the Fmask algorithm on three Sentinel-2 scenes, as well as their average performance. As shown in Table 8, the proposed method consistently outperforms Fmask in terms of OA and Kappa coefficient across all three scenes. The average OA of the proposed method reaches 0.9748, which is higher than that of Fmask (0.9571), indicating a more reliable overall cloud detection performance.
Table 8.
Comparison Between the Proposed Method and Fmask on Sentinel-2 imagery.
With respect to error characteristics, the proposed method achieves significantly lower CE than Fmask in all scenes. In particular, the average CE is reduced from 0.2554 for Fmask to 0.1161 for the proposed method, demonstrating its strong capability in suppressing false cloud detections. Although OE of the proposed method is generally higher than that of Fmask, the resulting increase remains within an acceptable range. On average, the OE of the proposed method is 0.1256, compared with 0.0148 for Fmask.
Overall, the higher Kappa coefficient achieved by the proposed method (0.8817 on average, compared with 0.8125 for Fmask) indicates improved consistency with the official reference cloud mask. These results demonstrate that the proposed method provides a more balanced trade-off between commission and omission errors on Sentinel-2 imagery, leading to more stable and reliable cloud detection performance across different scenes.
All evaluation metrics reported in Table 7 and Table 8 are calculated individually for each scene and then summarized to reflect overall performance trends. The selected scenes were intentionally chosen to include diverse land cover types and cloud conditions, ensuring that the reported metrics are not derived from a single favorable case but reflect performance under heterogeneous surface backgrounds and atmospheric conditions.
Although the number of test scenes is limited, each image covers a large spatial extent and contains substantial variability in surface reflectance and cloud distribution. Therefore, the evaluation provides meaningful insight into the robustness of the proposed cloud detection framework. Future work will extend the validation to larger-scale datasets to further assess statistical stability across broader geographic regions.
4. Discussion
The proposed cloud detection framework integrates spectral pattern matching, hierarchical clustering, and thermal infrared filtering to achieve scalable cloud detection in multispectral imagery. Experimental results across Landsat 8 and Sentinel-2 datasets demonstrate stable performance and cross-sensor applicability. By matching satellite-observed spectral features with a ground cover spectral database, the method effectively distinguishes cloud-contaminated pixels from cloud-free surfaces. The incorporation of thermal infrared information further suppresses interference from occasional high-temperature events, such as wildfires and other hotspots, enhancing overall robustness.
From a computational perspective, the hierarchical clustering strategy is introduced to overcome the memory limitations associated with constructing full pairwise similarity matrices for large-scale images. By partitioning images into manageable subsets and iteratively merging cluster centers, the framework significantly reduces computational burden. The dominant cost arises from spectral distance calculations during clustering and matching, which scales approximately linearly with the number of pixels and spectral bands. While operational products such as the Scene Classification Layer (SCL) benefit from highly optimized processing pipelines within the Copernicus framework, the proposed method does not aim to replace such centralized systems. Instead, it offers a flexible and physically interpretable alternative that can be deployed in research environments or applied to multisensor datasets lacking official cloud masks.
Cloud discrimination remains inherently challenging in scenarios involving spectrally similar objects. Examples include thick clouds versus snow or ice, fragmented clouds versus highly reflective urban structures, and thin clouds versus aerosols. The current framework primarily suppresses high-temperature interference using thermal thresholding, while discrimination between clouds and bright surfaces relies on spectral matching against the ground spectral database. Although this strategy effectively reduces commission errors caused by bright surfaces, misclassification may still occur under extreme reflectance or complex atmospheric conditions. These limitations reflect intrinsic difficulties of spectral-based detection approaches. Future work will incorporate additional spectral indices, spatial continuity constraints, and potentially atmospheric modeling to further address such ambiguities.
Parameter robustness is another important consideration for practical applications. Sensitivity analysis indicates that the empirical coefficients (e.g., C1 and C2) maintain relatively stable detection performance within reasonable parameter ranges. Adjustments primarily affect the balance between commission and omission errors, while overall accuracy remains consistent around the selected configuration. Although the sensitivity analysis was conducted primarily on Landsat 8 data, the tested scenes encompass diverse land cover types, including urban areas, vegetation-dominated regions, water bodies, and mixed landscapes. The observed stability suggests acceptable robustness under varying surface conditions. Nevertheless, systematic validation across broader climatic zones and seasonal variations is required to comprehensively evaluate parameter generalization capability.
Comparative analysis with existing approaches further clarifies the strengths of the proposed framework. Threshold-based algorithms such as Fmask rely on empirically defined spectral rules that may become sensitive to scene-specific reflectance variability, often leading to commission errors over bright surfaces or cloud edges. In contrast, the hierarchical clustering combined with adaptive spectral matching reduces dependence on fixed thresholds and enhances discrimination between clouds and spectrally similar ground objects. Compared with machine learning-based approaches, the proposed method does not require extensive labeled training data. While deep learning models may achieve high performance under well-represented training conditions, their generalization ability can degrade when applied to unseen environments [3,6,10,23,24,27]. By leveraging intrinsic spectral characteristics rather than purely data-driven feature learning, the proposed framework mitigates overfitting risks and maintains stable performance across heterogeneous scenes.
It is noteworthy that the proposed method exhibits a moderate increase in omission error in certain complex scenarios, particularly in thin cloud regions and fragmented cloud boundaries. This reflects an inherent trade-off between commission and omission errors. By prioritizing the reduction of false cloud detections, the framework favors more conservative cloud masks, which can be advantageous for downstream applications such as surface reflectance retrieval and time-series analysis, where cloud overestimation may significantly degrade data quality.
The experimental results also suggest that spatial resolution influences detection performance. Higher-resolution imagery from Landsat 8 and Sentinel-2 provides more homogeneous spectral information at the pixel level, reducing spectral mixing effects and benefiting spectral matching. However, challenges remain in distinguishing clouds from transient atmospheric phenomena such as smoke and aerosols under complex atmospheric conditions.
Overall, the analysis indicates that the proposed framework achieves a balanced trade-off between detection accuracy, robustness, and scalability. Expanding the ground spectral database to encompass broader environmental and seasonal variability, as well as integrating spatial texture features and advanced spectral modeling, will further enhance adaptability and performance in diverse remote sensing applications.
5. Conclusions
This study presents a cloud detection scheme that exploits the spectral and temporal differences between clouds and ground covers in multispectral satellite imagery. By combining hierarchical clustering, spectral pattern matching with a ground spectral database, and thermal infrared filtering, the proposed framework identifies cloud-contaminated pixels without relying on sensor-specific thresholds or supervised training data.
Experiments conducted on Landsat 8 and Sentinel-2 scenes demonstrate that the method achieves high overall accuracy and strong agreement with reference cloud masks across different sensors and spatial resolutions. The results indicate improved suppression of commission errors compared with conventional threshold-based approaches, while maintaining competitive overall detection performance.
The proposed framework provides a physically interpretable, scalable, and flexible solution for cloud detection in optical remote sensing applications. Future work will focus on large-scale validation, enhancement of the spectral database, and integration of spatial and atmospheric modeling techniques to further improve robustness under complex conditions.
Author Contributions
Conceptualization, S.J.; methodology, W.S. and S.J.; software, S.J.; validation, W.S. and S.J.; formal analysis, W.S. and S.J.; investigation, S.J.; resources, W.S., S.J. and X.H.; data curation, W.S. and S.J.; writing—original draft preparation, W.S. and S.J.; writing—review and editing, W.S. and T.L.; visualization, T.L. and X.H.; supervision, X.H.; project administration, X.H. All authors have read and agreed to the published version of the manuscript.
Funding
This research received no external funding.
Data Availability Statement
The Landsat8 dataset are available at: https://www.gscloud.cn/ (accessed on 17 December 2025); The Fmask data used for experimental evaluation are available at: https://github.com/GERSL/Fmask (accessed on 17 December 2025).
Acknowledgments
The authors gratefully acknowledge the providers of the datasets used in this study. We thank the data providers and the official platform for making these data publicly accessible. We also acknowledge the developers of the Fmask algorithm for providing an effective tool for cloud, cloud shadow, and snow detection in remote sensing imagery. The authors have reviewed and edited the output and take full responsibility for the content of this publication.
Conflicts of Interest
The authors declare no conflicts of interest.
References
- Qiu, S.; Zhu, Z.; He, B. Fmask 4.0: Improved cloud and cloud shadow detection in Landsats 4–8 and Sentinel-2 imagery. Remote Sens. Environ. 2019, 231, 111205. [Google Scholar] [CrossRef] [Scilit]
- Zhu, Z.; Woodcock, C.E. Object-based cloud and cloud shadow detection in Landsat imagery. Remote Sens. Environ. 2012, 118, 83–94. [Google Scholar] [CrossRef] [Scilit]
- Ma, N.; Sun, L.; He, Y.; Zhou, C.; Dong, C. CNN-TransNet: A hybrid CNN-transformer network with differential feature enhancement for cloud detection. IEEE Geosci. Remote Sens. Lett. 2023, 20, 1001705. [Google Scholar] [CrossRef] [Scilit]
- Braaten, J.D.; Cohen, W.B.; Yang, Z. Automated cloud and cloud shadow identification in landsat MSS imagery for temperate ecosystems. Remote Sens. Environ. 2015, 169, 128–138. [Google Scholar] [CrossRef] [Scilit]
- Ebel, P.; Xu, Y.; Schmitt, M.; Zhu, X.X. SEN12MS-CR-TS: A remote-sensing data set for multimodal multitemporal cloud removal. IEEE Trans. Geosci. Remote Sens. 2022, 60, 5222414. [Google Scholar] [CrossRef] [Scilit]
- Sui, S.; Sun, L. Cloud Detection Fusion Algorithm for Complex and Variable Surface Conditions. IEEE Geosci. Remote Sens. Lett. 2024, 21, 5002305. [Google Scholar] [CrossRef] [Scilit]
- Fisher, A. Cloud and cloud-shadow detection in SPOT5 HRG imagery with automated morphological feature extraction. Remote Sens. 2014, 6, 776–800. [Google Scholar] [CrossRef] [Scilit]
- Xiang, P.S. A Cloud Detection Algorithm for MODIS Images Combining K-means Clustering and Otsu Method. IOP Conf. Ser. Mater. Sci. Eng. 2018, 392, 062199. [Google Scholar] [CrossRef] [Scilit]
- Lin, C.-H.; Lai, K.-H.; Chen, Z.-B.; Chen, J.-Y. Patch-based information reconstruction of cloud-contaminated multitemporal images. IEEE Trans. Geosci. Remote Sens. 2014, 52, 163–174. [Google Scholar] [CrossRef] [Scilit]
- Chen, Y.; Weng, Q.; Tang, L.; Liu, Q.; Fan, R. An automatic cloud detection neural network for highresolution remote sensing imagery with cloud–snow coexistence. IEEE Geosci. Remote Sens. Lett. 2021, 19, 6004205. [Google Scholar]
- Hughes, M.J.; Hayes, D.J. Automated detection of cloud and cloud shadow in single-date Landsat imagery using neural networks and spatial post-processing. Remote Sens. 2014, 6, 4907–4926. [Google Scholar] [CrossRef] [Scilit]
- Xiao, Z.; Liang, S.; Wang, T.; Liu, Q. Reconstruction of satelliteretrieved land-surface reflectance based on temporally-continuous vegetation indices. Remote Sens. 2015, 7, 9844–9864. [Google Scholar] [CrossRef] [Scilit]
- Qin, Y.W.; Xiao, X.M.; Tang, H.; Dubayah, R.; Doughty, R.; Liu, D.; Liu, F.; Shimabukuro, Y.; Arai, E.; Wang, X.; et al. Annual Maps of Forest Cover in the Brazilian Amazon from Analyses of PALSAR and MODIS Images. Earth Syst. Sci. Data 2024, 16, 321–336. [Google Scholar] [CrossRef] [Scilit]
- Choate, M.J.; Rengarajan, R.; Hasan, N.; Denevan, A.; Ruslander, K. Operational Aspects of Landsat 8 and 9 Geometry. Remote Sens. 2024, 16, 133–167. [Google Scholar] [CrossRef] [Scilit]
- Pitkänen, T.P.; Balazs, A.; Tuominen, S. Automatized Sentinel-2 Mosaicking for Large Area Forest Mapping. Int. J. Appl. Earth Obs. Geoinf. 2024, 127, 103659. [Google Scholar] [CrossRef] [Scilit]
- Wang, S.T.; Kang, W.; Kong, D.M.; Wang, T.Z.; Li, R.X. GF-1 Image Fusion Based on Regression Kriging. Laser Optoelectron. Progress. 2022, 59, 523–531. [Google Scholar]
- Zhu, J.H.; Zhu, S.Y.; Yu, F.C.; Zhang, G.X.; Xu, Y.M. Downscaling of ERA5 Reanalysis Surface Temperature for Urban and Mountainous Areas. J. Remote Sens. 2021, 25, 1778–1791. [Google Scholar]
- Kokaly, R.F.; Clark, R.N.; Swayze, G.A.; Livo, K.E.; Hoefen, T.M.; Pearson, N.C.; Wise, R.A.; Benzel, W.M.; Lowers, H.A.; Driscoll, R.L.; et al. USGS Spectral Library Version 7; U.S. Geological Survey Data Series 1035; USGS: Reston, VA, USA, 2017. [Google Scholar]
- Rodriguez, A.; Laio, A. Clustering by fast search and find of density peaks. Science 2014, 344, 1492–1496. [Google Scholar] [CrossRef] [Scilit]
- Mou, L.; Zhu, X.X. Learning to pay attention on spectral domain: A spectral attention module-based convolutional network for hyperspectral image classification. IEEE Trans. Geosci. Remote Sens. 2020, 58, 110–122. [Google Scholar] [CrossRef] [Scilit]
- Zhu, Z.; Wang, S.; Woodcock, C.E. Improvement and expansion of the Fmask algorithm. Remote Sens. Environ. 2015, 159, 269–277. [Google Scholar] [CrossRef] [Scilit]
- Hossin, M.; Sulaiman, M.N. A review on evaluation metrics for data classification evaluations. Int. J. Data Min. Knowl. Manag. Process. 2015, 5, 1–11. [Google Scholar] [CrossRef] [Scilit]
- López-Puigdollers, D.; Mateo-García, G.; Gómez-Chova, L. Bench-marking deep learning models for cloud detection in Landsat-8 and Sentinel-2 images. Remote Sens. 2021, 13, 992. [Google Scholar] [CrossRef] [Scilit]
- Li, Z.; Shen, H.; Cheng, Q.; Liu, Y.; You, S.; He, Z. Deep learning based cloud detection for medium and high resolution remote sensing images of different sensors. ISPRS J. Photogramm. Remote Sens. 2019, 150, 197–212. [Google Scholar] [CrossRef] [Scilit]
- Louis, J.; Debaecker, V.; Pflug, B.; Main-Knorn, M.; Bieniarz, J.; Mueller-Wilm, U.; Cadau, E.; Gascon, F. Sentinel-2 Sen2Cor: L2A processor for users. In Proceedings of the Living Planet Symposium, Prague, Czech Republic, 9–13 May 2016. [Google Scholar]
- Cilli, R.; Monaco, A.; Amoroso, N.; Tateo, A.; Tangaro, S.; Bellotti, R. Machine learning for cloud detection of globally distributed Sentinel-2 images. Remote Sens. 2020, 12, 2355. [Google Scholar] [CrossRef] [Scilit]
- Zhu, X.X.; Tuia, D.; Mou, L.; Xia, G.-S.; Zhang, L.; Xu, F.; Fraundorfer, F. Deep learning in remote sensing: A comprehensive review and list of resources. IEEE Geosci. Remote Sens. Mag. 2017, 5, 8–36. [Google Scholar] [CrossRef] [Scilit]

Disclaimer/Publisher’s Note: The statements, opinions and data contained in all publications are solely those of the individual author(s) and contributor(s) and not of MDPI and/or the editor(s). MDPI and/or the editor(s) disclaim responsibility for any injury to people or property resulting from any ideas, methods, instructions or products referred to in the content. |
© 2026 by the authors. Licensee MDPI, Basel, Switzerland. This article is an open access article distributed under the terms and conditions of the Creative Commons Attribution (CC BY) license.