Technical Note

The Identification of Exposed Beachrocks on South China Sea Islands Based on UAV Images

1
Key Laboratory of Submarine Geosciences and Prospecting Techniques, Ministry of Education (MOE) and College of Marine Geosciences, Ocean University of China, Qingdao 266100, China
2
National Deep Sea Center, Qingdao 266237, China
3
Laboratory for Marine Mineral Resources, Qingdao Marine Science and Technology Center, Qingdao 266237, China
*
Author to whom correspondence should be addressed.
These authors contributed equally to this work.
Remote Sens. 2025, 17(9), 1647; https://doi.org/10.3390/rs17091647
Submission received: 17 January 2025 / Revised: 6 March 2025 / Accepted: 6 March 2025 / Published: 7 May 2025

Abstract

:
Beachrocks are common coastal sedimentary rocks in tropical and subtropical seas. They are widely spread especially in islands and coastal areas. These rocks are important for island geological evolution research. Research on beachrocks aids in protecting island ecosystems and enhances islands’ ability to prevent and mitigate damage from natural disasters. This study uses unmanned aerial vehicle (UAV) images and the U-Net model based on deep learning to identify beachrocks. To enhance identification accuracy, the efficient channel attention (ECA) mechanism was integrated, leading to improvements of 0.49% in overall accuracy, 1.41% in precision, 0.97% in recall, 1.10% in F1-score, and 2.09% in intersection over union (IoU) compared to the baseline U-Net model. The final results demonstrate that the model effectively identified beachrocks, achieving 97.47% accuracy, 93.27% precision, 94.73% recall, 93.95% F1-score, and 88.65% IoU. This study offers a valuable tool for island geological evolution research and supports the development of large-scale island conservation efforts.

1. Introduction

Beachrocks are sedimentary rocks commonly found on beaches and coastlines. They form through the cementation of sand, shell fragments, and other marine sediments by calcium or other minerals in seawater. They are widely distributed on islands and coastlines in tropical and subtropical regions and are an important subject of geological evolution research [1]. Research on beachrocks provides insights into the historical evolution of coastal sedimentary environments and their response mechanisms to climate change, revealing records of sea level changes and storm surges. Beachrocks also play a vital role in protecting island ecosystems. Their stable structure provides habitats for coastal organisms and prevents erosion. Systematic research on beachrocks provides a scientific basis for improving disaster prevention and mitigation on islands, including the predicting of natural disaster risks, the optimizing of resource management, and the developing of ecological protection and engineering strategies [2,3].
Beachrocks are an important component of the surface elements of islands. Current research on island surface information focuses primarily on the remote sensing analysis of coral reefs. While coral reef studies primarily focus on biogenic carbonate structures and reef ecosystem dynamics [4], beachrock research emphasizes the lithification processes of clastic sediments and their implications for coastal evolution [2]. Multispectral satellite sensors effectively detect shallow coral reefs, map their distribution, and reveal complex geomorphic structures. These images support various algorithms for extracting coral reef geomorphology and surface cover. Such methods aid in analyzing coral reef growth and development [5]. Zhou et al. [6] proposed a model and a data-hybrid-driven framework for remote sensing geomorphology information extraction under dual-scale transformation. They used medium-resolution CBERS-02B CCD images, and developed a geomorphology classification system and technical workflow for coral reefs, with the Yongle Atoll in the Xisha Islands as the study area. This framework succeeded in gaining an automated extraction of multi-objective geomorphological information of coral. Zuo et al. [7] integrated the remote sensing data from 46 coral reefs in the South China Sea and field geomorphology survey data from 15 islands to propose a unified classification standard. They developed a high-resolution geomorphology classification system for South China Sea coral reefs, highlighting key geomorphic types. Dong et al. [8] proposed a classification system for coral reef geomorphic units focusing on coral coverage. They used WorldView-2 images and applied SVM and random forest algorithms to extract coral reef geomorphic units. Deep learning techniques hold significant potential for extracting coral reef geomorphology. Fully convolutional neural networks (FCN), a pixel-level segmentation approach, are widely applied in coral reef analysis. King et al. [9] employed deep learning to classify species in underwater coral reef images and found that FCN outperformed SVM methods. Li et al. [10] used the U-Net network model and data from the Millennium Coral Reef Project to create a global coral reef probability map. González-Rivero et al. [11] evaluated CNN with global coral reef datasets and confirmed their superiority over shallow methods such as SVM. Zheng et al. [12] proposed a classification method based on the Deeplabv3+ network model to extract and classify seven geological types found on Ganquan Island. Ma et al. [13] employed the U-Net network to extract geomorphic features of the Yongle Atoll in the Xisha Islands, achieving pixel-level segmentation of remote sensing images. These studies have advanced coral reef geomorphology extraction methods and introduced new approaches for island reef research. Unmanned aerial vehicles (UAVs) have become an indispensable tool for coastal geological surveys, offering high-resolution imagery of remote and inaccessible island environments [14]. Recent studies highlight the effectiveness of UAVs in mapping coastal geomorphology, including tidal flats [15], and conducting coastal surveys [16,17,18]. These capabilities make UAVs particularly well-suited for beachrock identification. Previous attempts at automatic identification of beachrocks mainly relied on field investigation, but manual investigation and identification are time-consuming and laborious. While the previous UAV investigation of beachrocks was mostly used to observe the distribution area [19,20], beachrock identification using UAV images remains unexplored.
This study uses UAV images from islands in the South China Sea to propose an improved U-Net model for beachrock segmentation. An approach based on the U-Net framework was employed to identify exposed beachrocks in UAV images. The ECA mechanism was added to the model’s down-sampling phase to highlight key channel features, enhancing the model’s accuracy in identifying beachrocks. The results demonstrated high accuracy and effectiveness in beachrock identification.

2. Materials and Methods
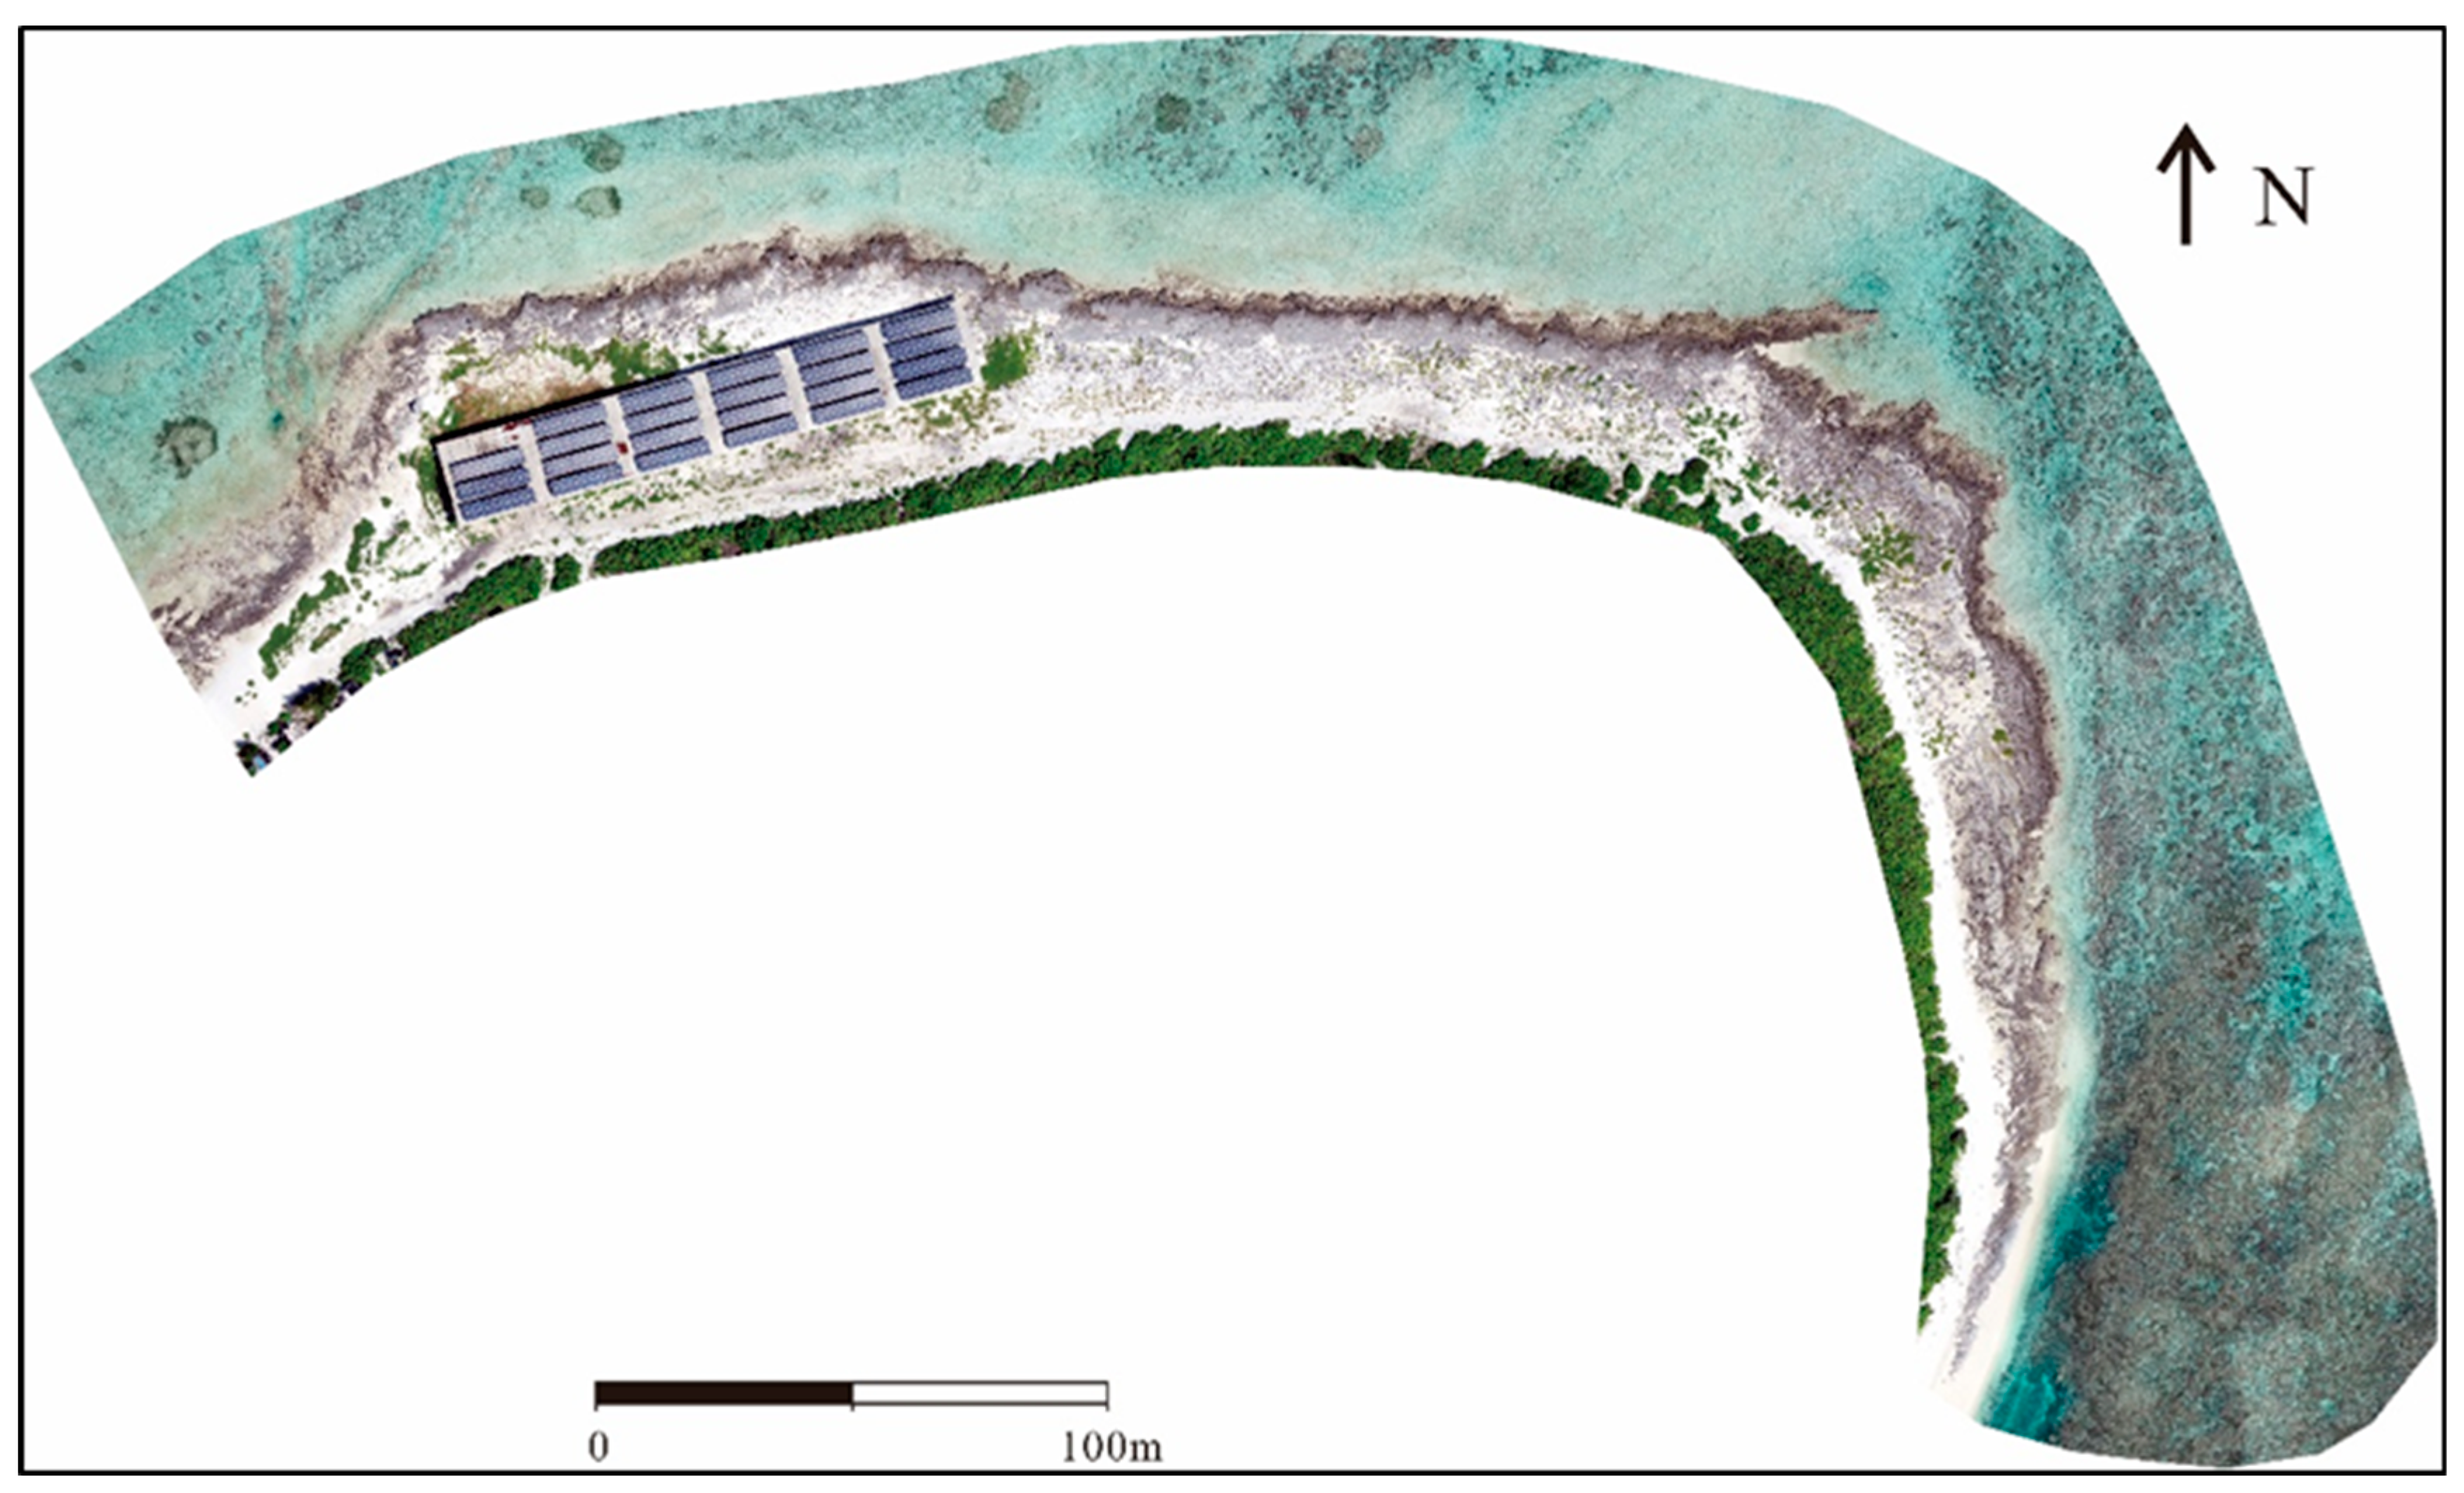
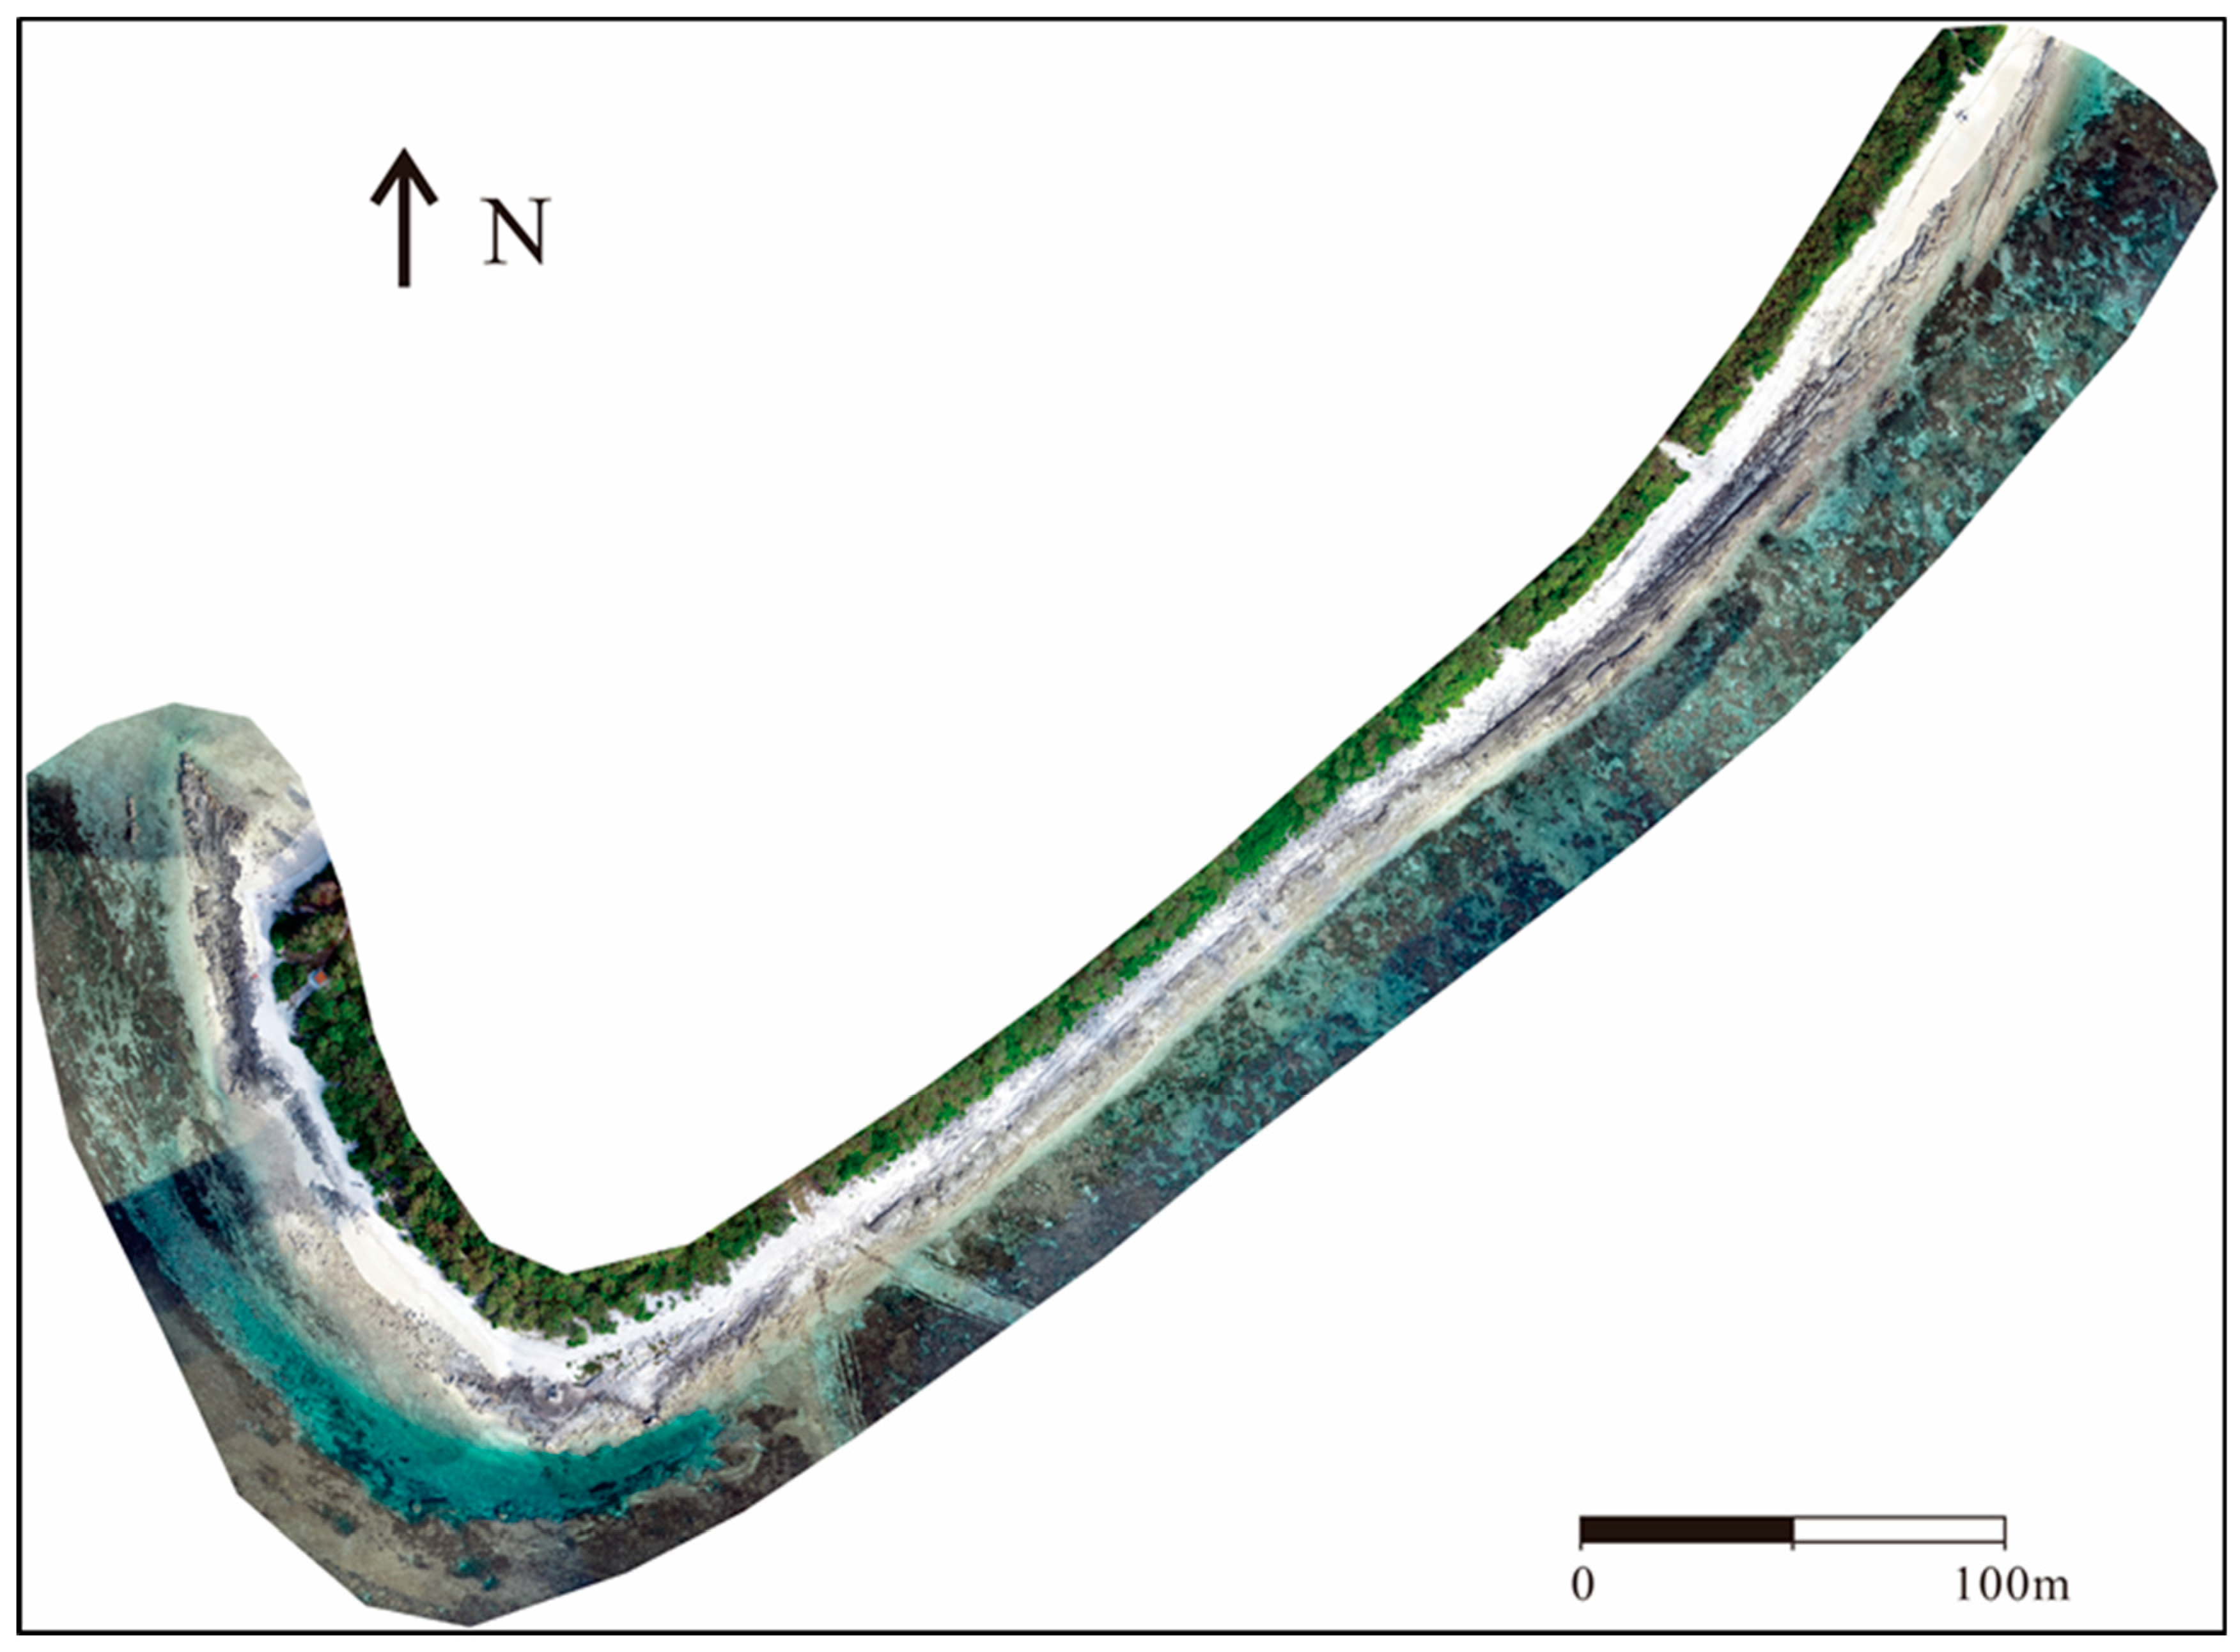
2.1. Data Sources

This experiment used UAV images of two islands in the South China Sea. Segments of the islands were extracted, as shown in Figure 1 (Island A) and Figure 2 (Island B).

2.2. Dataset Construction

The quality and quantity of deep learning samples are crucial for model accuracy. We constructed the dataset as follows: Island A was selected as the training set. To improve the model’s inference speed, the images were cropped to 512 × 512 pixels and were saved in JPG format, producing 66 images. Among them, 24 images with distinct features were annotated using Labelme software version 5.5.0. The dataset was augmented through operations such as rotation, flipping, and translation, expanding it to 240 samples. The same augmentation process was applied to the label set, producing an equal number of labeled samples. The dataset was split into training, validation, and test sets with a ratio of 8:1:1, resulting in 192 training images, 24 validation images, and 24 test images. The PASCAL VOC format was chosen for its streamlined annotation requirements, which are well-suited for binary classification tasks, and its inherent compatibility with Labelme’s export workflow, enabling efficient dataset preparation and seamless integration. By adhering to the PASCAL VOC standard, the dataset format ensured consistency and interoperability with widely used tools and frameworks, thereby enhancing the overall workflow and facilitating robust model training [21]. The training set trained the model, the validation set adjusted parameters, and the test set evaluated model performance. Finally, the trained model was applied to Island B for generalization testing. Island A was selected for training due to its representative beachrock distributions covering typical morphotypes. These include continuous shoreline outcrops, fragmented boulder fields, and submerged nearshore formations. Island B with different coastal features and wave exposure provided an ideal testbed for evaluating model generalizability across heterogeneous environments.

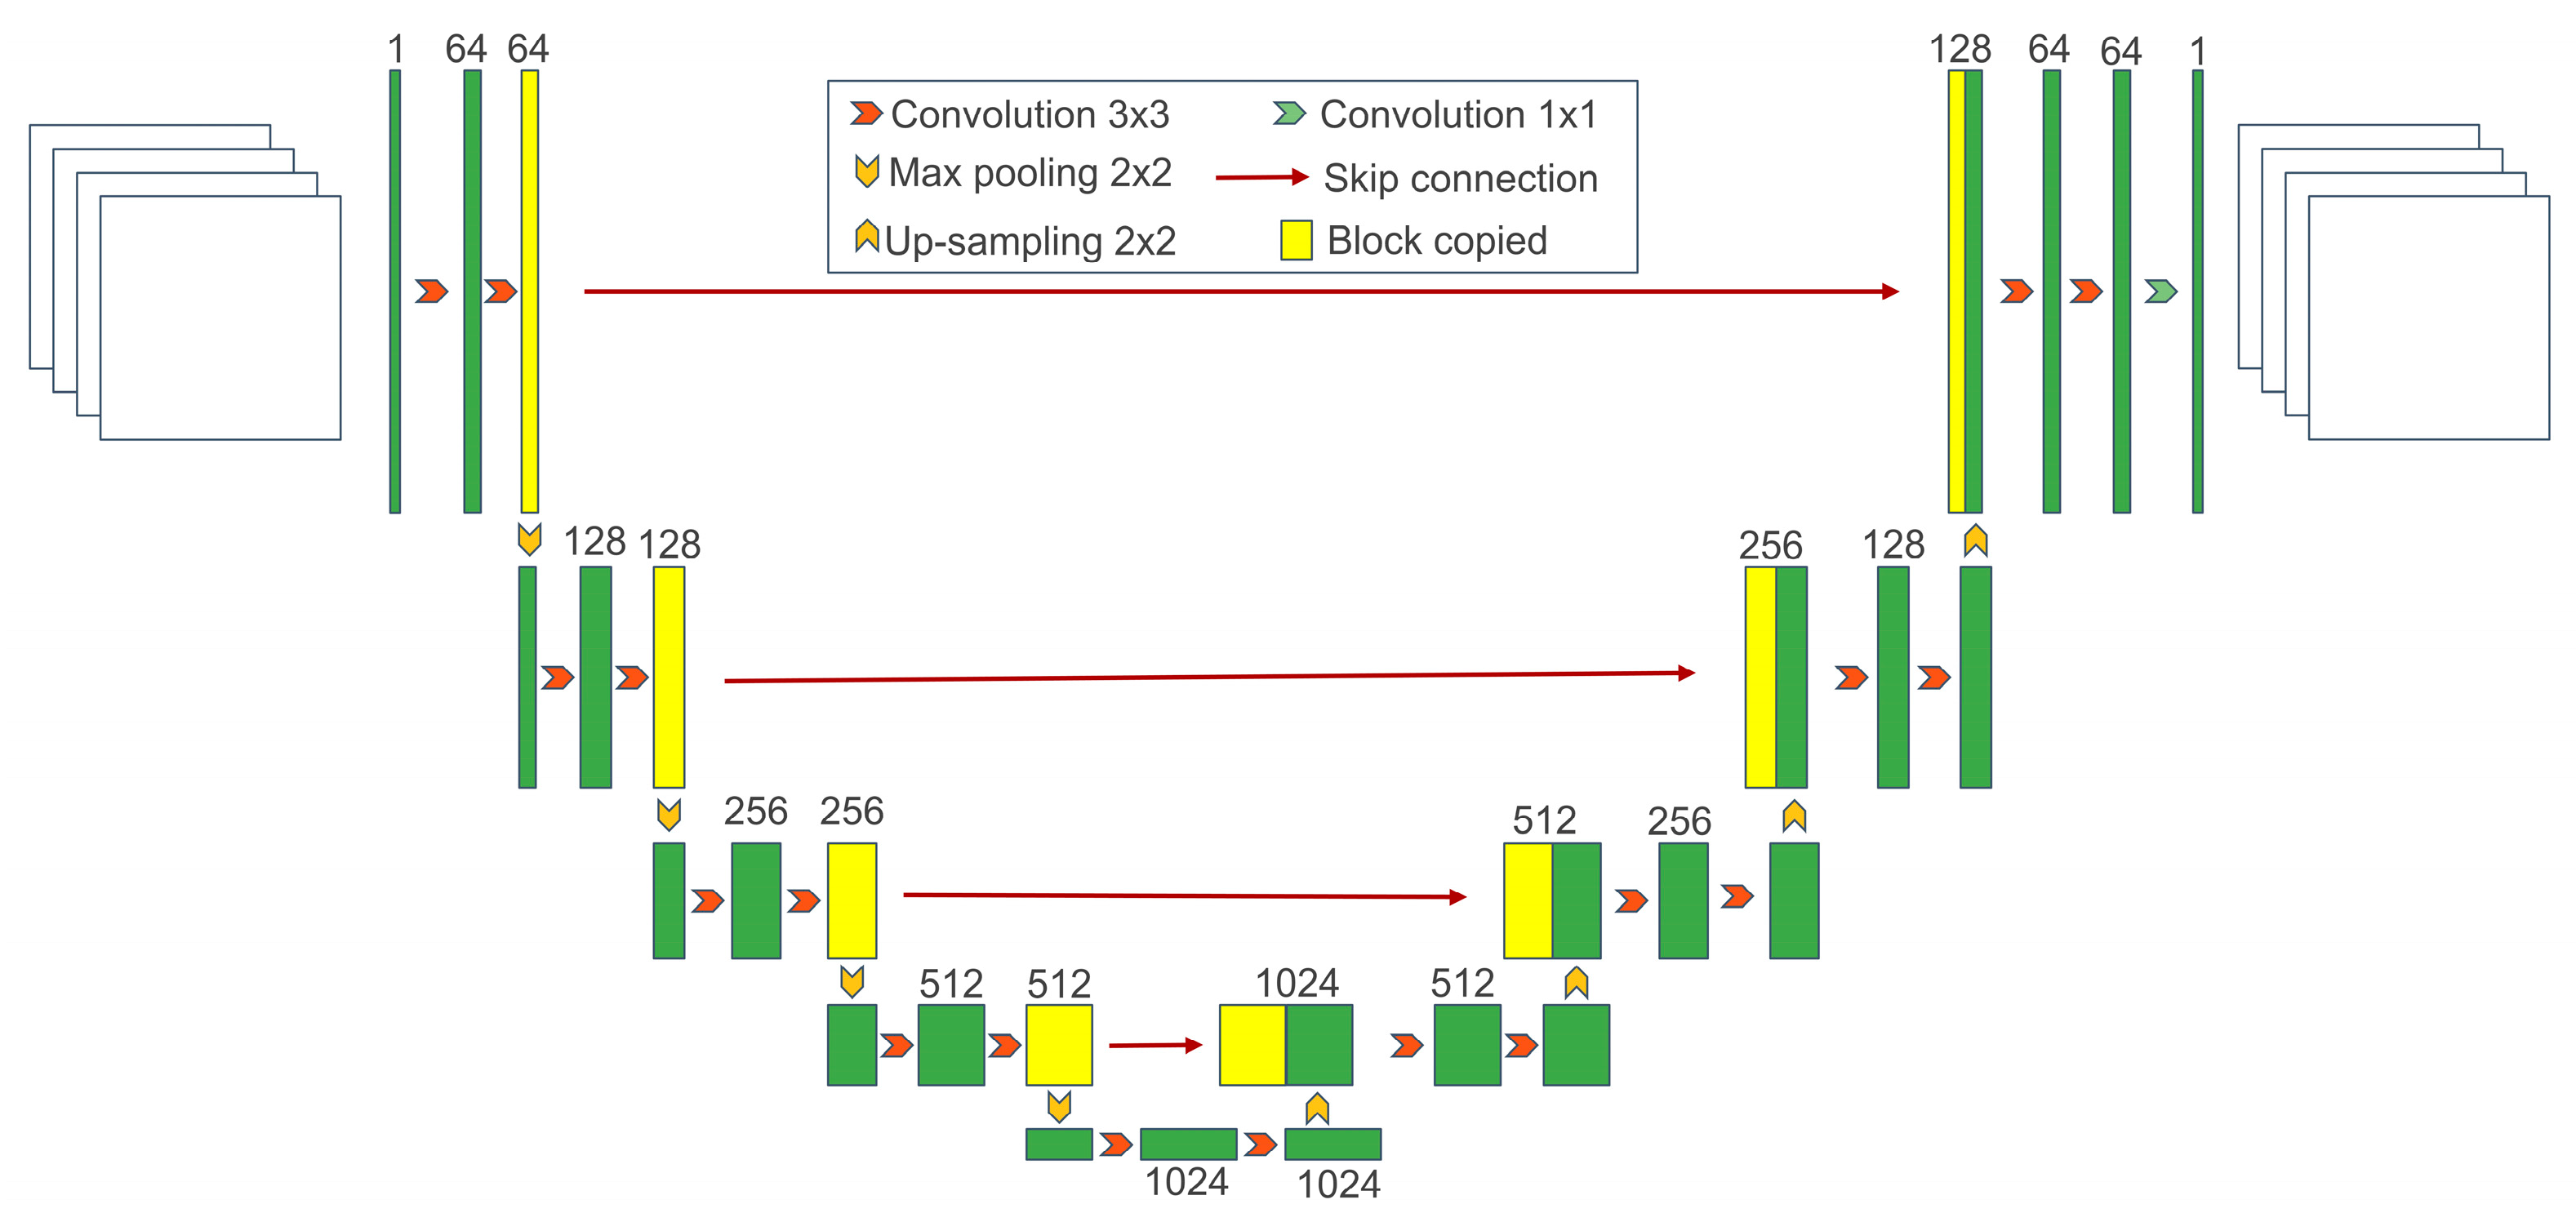
2.3. Traditional U-Net Network Model

The U-Net network model [22] as an improvement of the FCN model [23] is a network designed for small datasets. U-Net was selected over alternative architectures based on its superior performance on small training datasets, which is critical given our 240-sample dataset, and its proven effectiveness in coastal feature extraction [24]. It excels in small-sample learning, enabling efficient and precise segmentation. The U-Net model comprises three main components: an encoder, skip connections, and a decoder. The encoder contains five layers. Each layer includes two 3 × 3 convolution blocks and a max pooling operation. The encoder extracts contextual information from images through down-sampling, extracting target features layer by layer. The decoder mirrors the encoder structure. Each layer begins with a 2 × 2 transposed convolution to up-sample the feature maps, doubling their spatial dimensions while halving the channel dimensions. Two 3 × 3 convolutions follow, restoring details and feature map resolution iteratively for precise localization. Finally, a 1 × 1 convolution is applied to classify each pixel in the feature map, producing the prediction map. Additionally, the U-Net network introduces skip connection layers, which fuse the encoder feature maps and the up-sampled feature maps along the channel dimension. Figure 3 illustrates the traditional U-Net architecture.

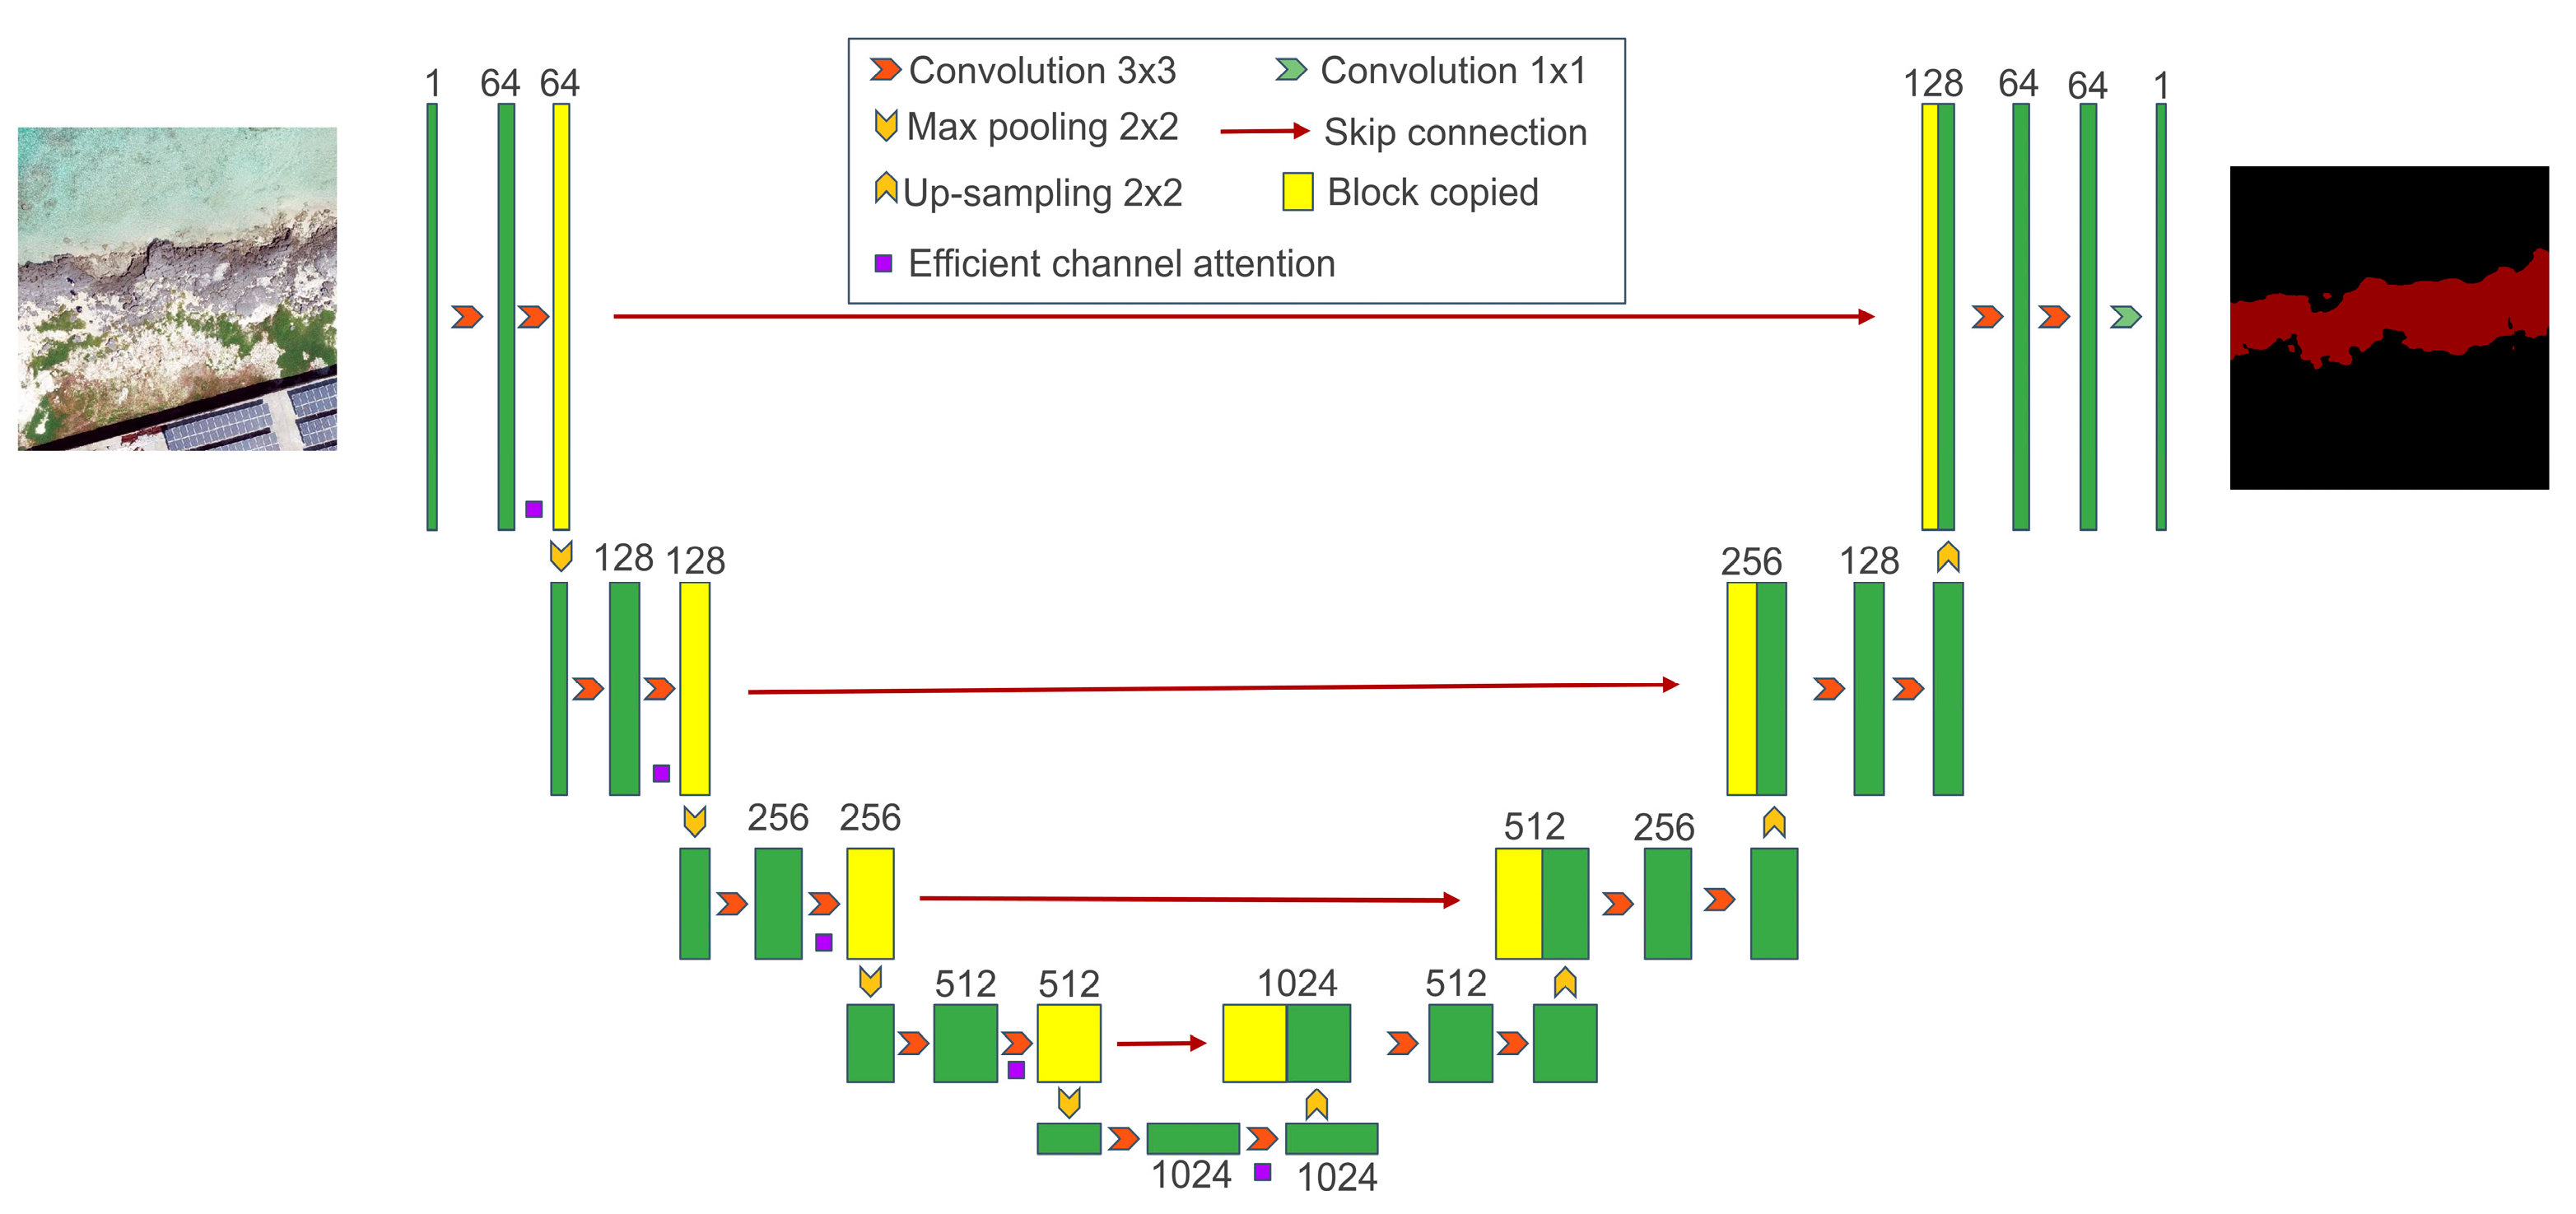
2.4. Beachrocks Semantic Segmentation Model
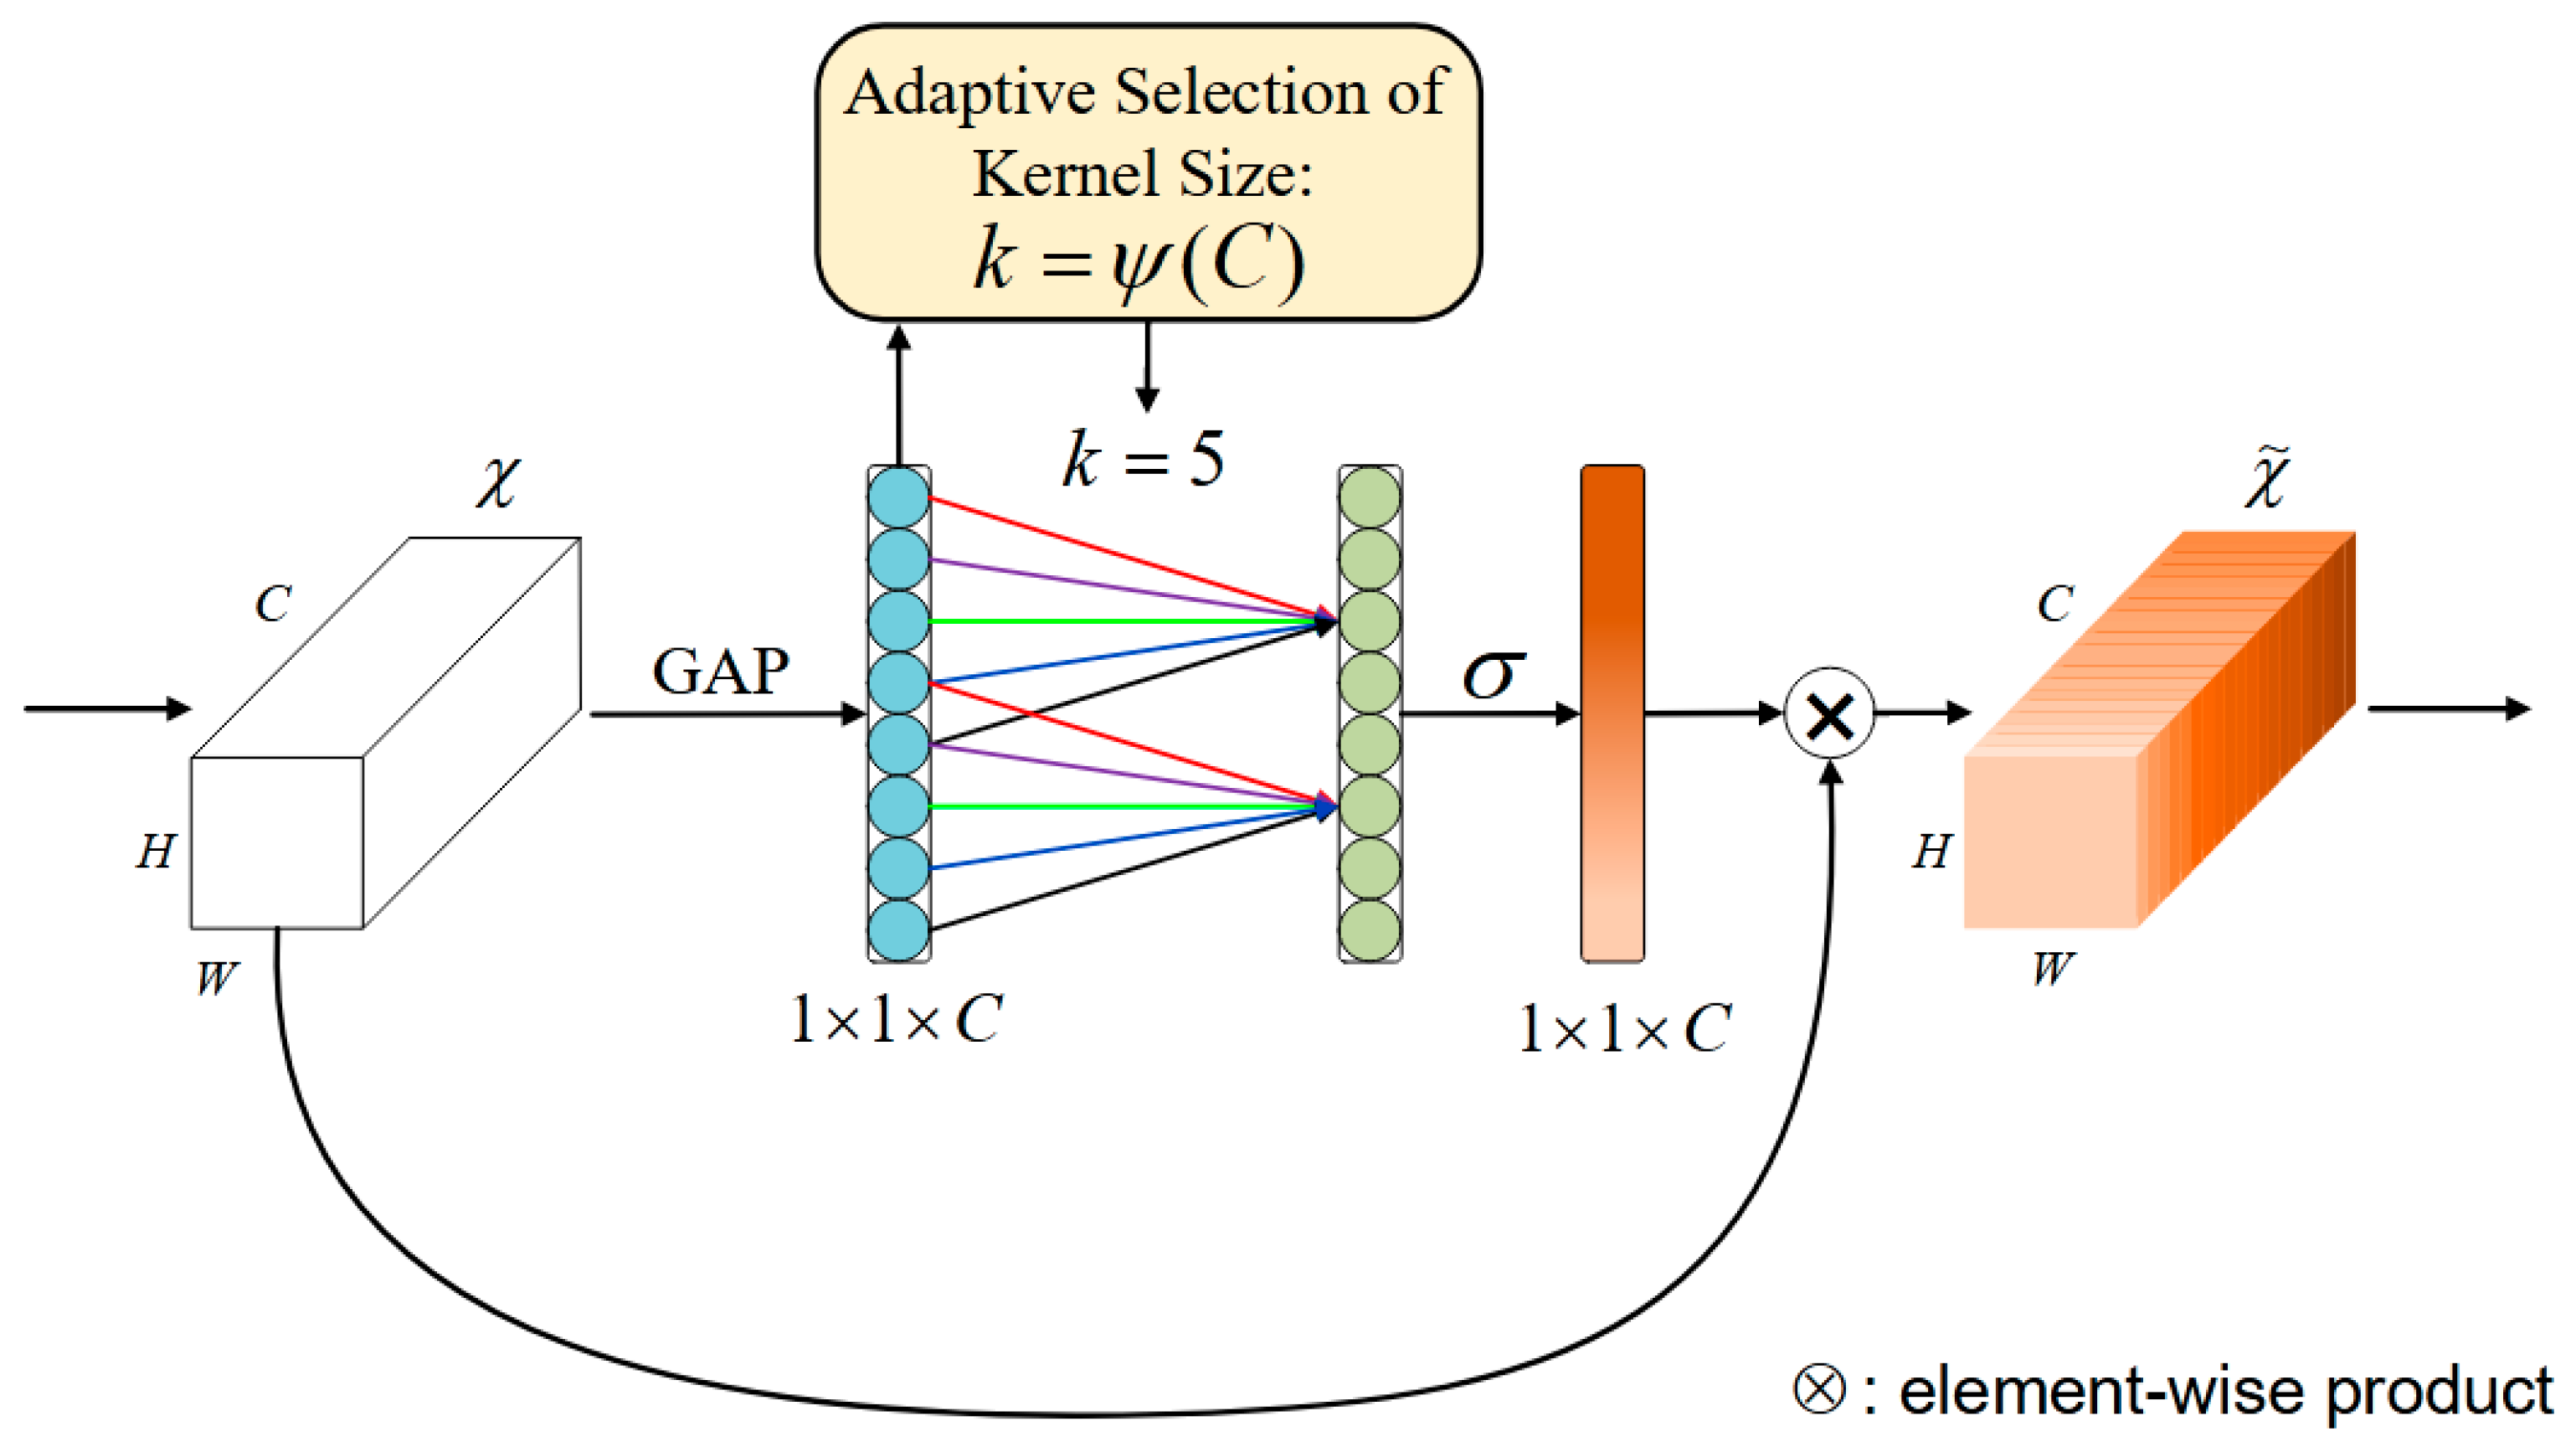
This study focuses on UAV images acquired over the South China Sea and proposes a model for beachrocks based on an improved U-Net network. The U-Net framework demonstrates substantial scalability, which means it can be flexibly combined with attention mechanism modules [25]. Modifications were made to the down-sampling component of the U-Net network. ECA mechanism was integrated into the down-sampling process. The ECA module was placed after each standard convolution block. Features updated by the ECA module were passed through the layers step by step. This enabled the model to focus on target features throughout training. Figure 4 illustrates the improved model architecture.

2.5. ECA Module

In the U-Net network model, shallow feature maps primarily capture the texture and shape details of beachrocks and their background, while deep feature maps focus on the abstract representation of beachrock regions in island images. However, the U-Net model struggles to distinguish beachrocks from sandy backgrounds with similar features. This similarity results in increased prediction errors. Incorporating an attention mechanism effectively addresses this issue. The attention mechanism is specifically designed to extract the most salient and valuable information from a complex and voluminous dataset [26]. Different categories are typically represented in separate channels of the feature maps. Assigning weights to these channels highlights their relevance to specific semantic information. Using the relationships between channel features enhances the weak semantic features. This approach strengthens the representation of specific features. It improves the model’s ability to understand the target regions [27]. Hu et al. [28] proposed SENet, which focuses on assigning weights to each channel in the input feature layer. SENet enables the network to focus on the most relevant channels. However, SENet’s use of two fully connected layers may introduce side effects in channel attention prediction and inefficiently capture dependencies across all channels. To resolve these issues, Wang et al. [29] improved SENet and proposed the ECA module. The ECA module assigns different importance weights to features along the channel dimension, enhancing the model’s feature representation capability. Figure 5 illustrates the ECA module.
The ECA module processes each channel of the feature map using global average pooling (GAP). This creates a global feature map with dimensions of 1 × 1 × C. It applies a 1-D convolution with a kernel size of k to quickly process the features. The Sigmoid activation function normalizes the output to a range between 0 and 1, generating attention weights for each channel. These weights are applied to the input feature map to enhance channel attention. Equation (1) shows the calculation of kernel size k, where C represents the number of channels in the feature map.
k = log 2 C + 1 2
The ECA module automatically focuses on key feature channels while suppressing background noise. It assigns higher feature weights to beachrock regions, enhancing the model’s ability to identify beachrock targets and improving segmentation performance.

2.6. Experimental Environment

The operating system used in the experiment was Windows 10. The programming language was Python 3.9. The environment included an AMD R5-5600 processor with 6 cores and 12 threads, 16 GB of RAM, and an NVIDIA RTX 3060 GPU with 12 GB of memory. The experiment was conducted with CUDA 11.7 and cuDNN 8.5.0. The network model was built using the PyTorch 1.7.0 framework.

2.7. Training Parameters

The experiment sets training parameters such as the loss function, optimizer, training epochs, and learning rate. Selecting an appropriate loss function is important for network performance and parameter optimization. Beachrock semantic segmentation is a binary classification task with two categories: beachrocks and background. Therefore, the experiment used cross-entropy loss. The mathematical expression is shown in Equation (2).
L CE = 1 N i N l L y i l l o g p i l
N represents the number of pixels, L represents the set of all categories, y i l represents the one-hot encoding (0 or 1) of the i-th pixel in the l-th category, and p i l represents the predicted probability of the i-th pixel in the l-th category, p i l 0 , 1 .
While the cross-entropy loss effectively measures the discrepancy between predicted probabilities and ground truth labels, it may exhibit limitations in scenarios with severe class imbalance. In the context of beachrock semantic segmentation tasks, background regions typically dominate the image composition, whereas beachrock areas are often spatially sparse and small in area. Such imbalance may lead models to over-optimize prediction accuracy for background classes while neglecting the structured capture of critical target regions. To address this issue, the introduction of Dice loss [30] as a complementary loss function presents distinct advantages. By directly optimizing the overlap between predicted masks and ground truth labels as quantified through the Dice coefficient, Dice loss demonstrates particular efficacy in mitigating class imbalance challenges. Its computational formulation is expressed in Equation (3).
L D ice = 1 2 l L i N y i l p i l + ε l L i N ( y i l + p i l ) + ε
N represents the number of pixels, L represents the set of all categories, y i l represents the one-hot encoding (0 or 1) of the i-th pixel in the l-th category, and p i l represents the predicted probability of the i-th pixel in the l-th category, p i l 0 , 1 . ε is the smoothing coefficient to prevent zero division error. In this paper, ε = 1 × 10⁻⁸. Dice loss exhibits heightened sensitivity to small-area targets, enhances the model’s capability to capture edge details and model spatial continuity patterns, and demonstrates significant effectiveness in mitigating class imbalance challenges [31]. This characteristic renders it particularly suitable for identifying fragmented or sparsely distributed beachrock formations characterized by discontinuous morphological features. In this study, cross-entropy loss and Dice loss are linearly added together as a loss function to achieve the characteristics of both.
The experiment selected the Adam optimizer, an adaptive algorithm that integrates momentum and adaptive learning rates [32]. Adam improved upon the traditional stochastic gradient descent (SGD) algorithm [33]. Adam estimated the first- and second-order moments of gradients using exponential moving averages and updated parameters accordingly. Training was conducted for 100 epochs, with the learning rate set to 0.001 after testing. To accelerate training and improve accuracy with limited samples, the experiment applied frozen training for the first 50 epochs, keeping the model’s backbone (feature extraction network) unchanged. In the next 50 epochs, the experiment performed unfrozen training, enabling all network parameters to be updated.

3. Results

3.1. Model Evaluation Metrics

This section introduces the concept of the confusion matrix, a widely used visualization tool in supervised machine learning, to provide a clearer explanation of the mathematical implications of evaluation metrics. In image classification accuracy assessment, the confusion matrix systematically compares predicted values with ground truth labels, presenting classification performance in a structured matrix format. This matrix evaluates classification model performance by categorizing outcomes into four key components: true positive (TP), false positive (FP), true negative (TN), and false negative (FN). Each row represents actual class distributions, while each column denotes predicted classifications, providing detailed per-class performance insights. The typical structure of a confusion matrix is illustrated in Table 1.
TP represents correctly classified beachrock pixels, TN represents correctly classified background pixels, FP denotes background pixels misclassified as beachrocks pixels, and FN represents beachrocks pixels misclassified as background pixels.
In order to quantify the performance of the beachrock segmentation model, more advanced classification metrics can be derived from the confusion matrix to measure the performance of the model in the verification set and the test set. Metrics included accuracy, precision, recall, F1-score, and intersection over union (IoU) [34]. Formulas (4) to (8) show these calculations.
A c c u r a c y = T P + T N T P + T N + F P + F N
P r e c i s i o n = T P T P + F P
R e c a l l = T P T P + F N
F 1 = 2 × P r e c i s i o n × R e c a l l P r e c i s i o n + R e c a l l
I ou = T P T P + F P + F N
The Matthews correlation coefficient (MCC) [35] was adopted as a balanced metric, allowing for a more comprehensive model evaluation. The mathematical expression is shown in Equation (9).
MCC = T P × T N F P × F N ( T P + F P ) ( T P + F N ) ( T N + F P ) ( T N + F N )
The MCC ranges from −1 to +1, with 0 indicating random classification performance. This coefficient quantifies the model’s balanced discriminative capability between positive and negative classes, rendering it particularly valuable for imbalanced datasets where background pixels dominate the distribution [36,37].

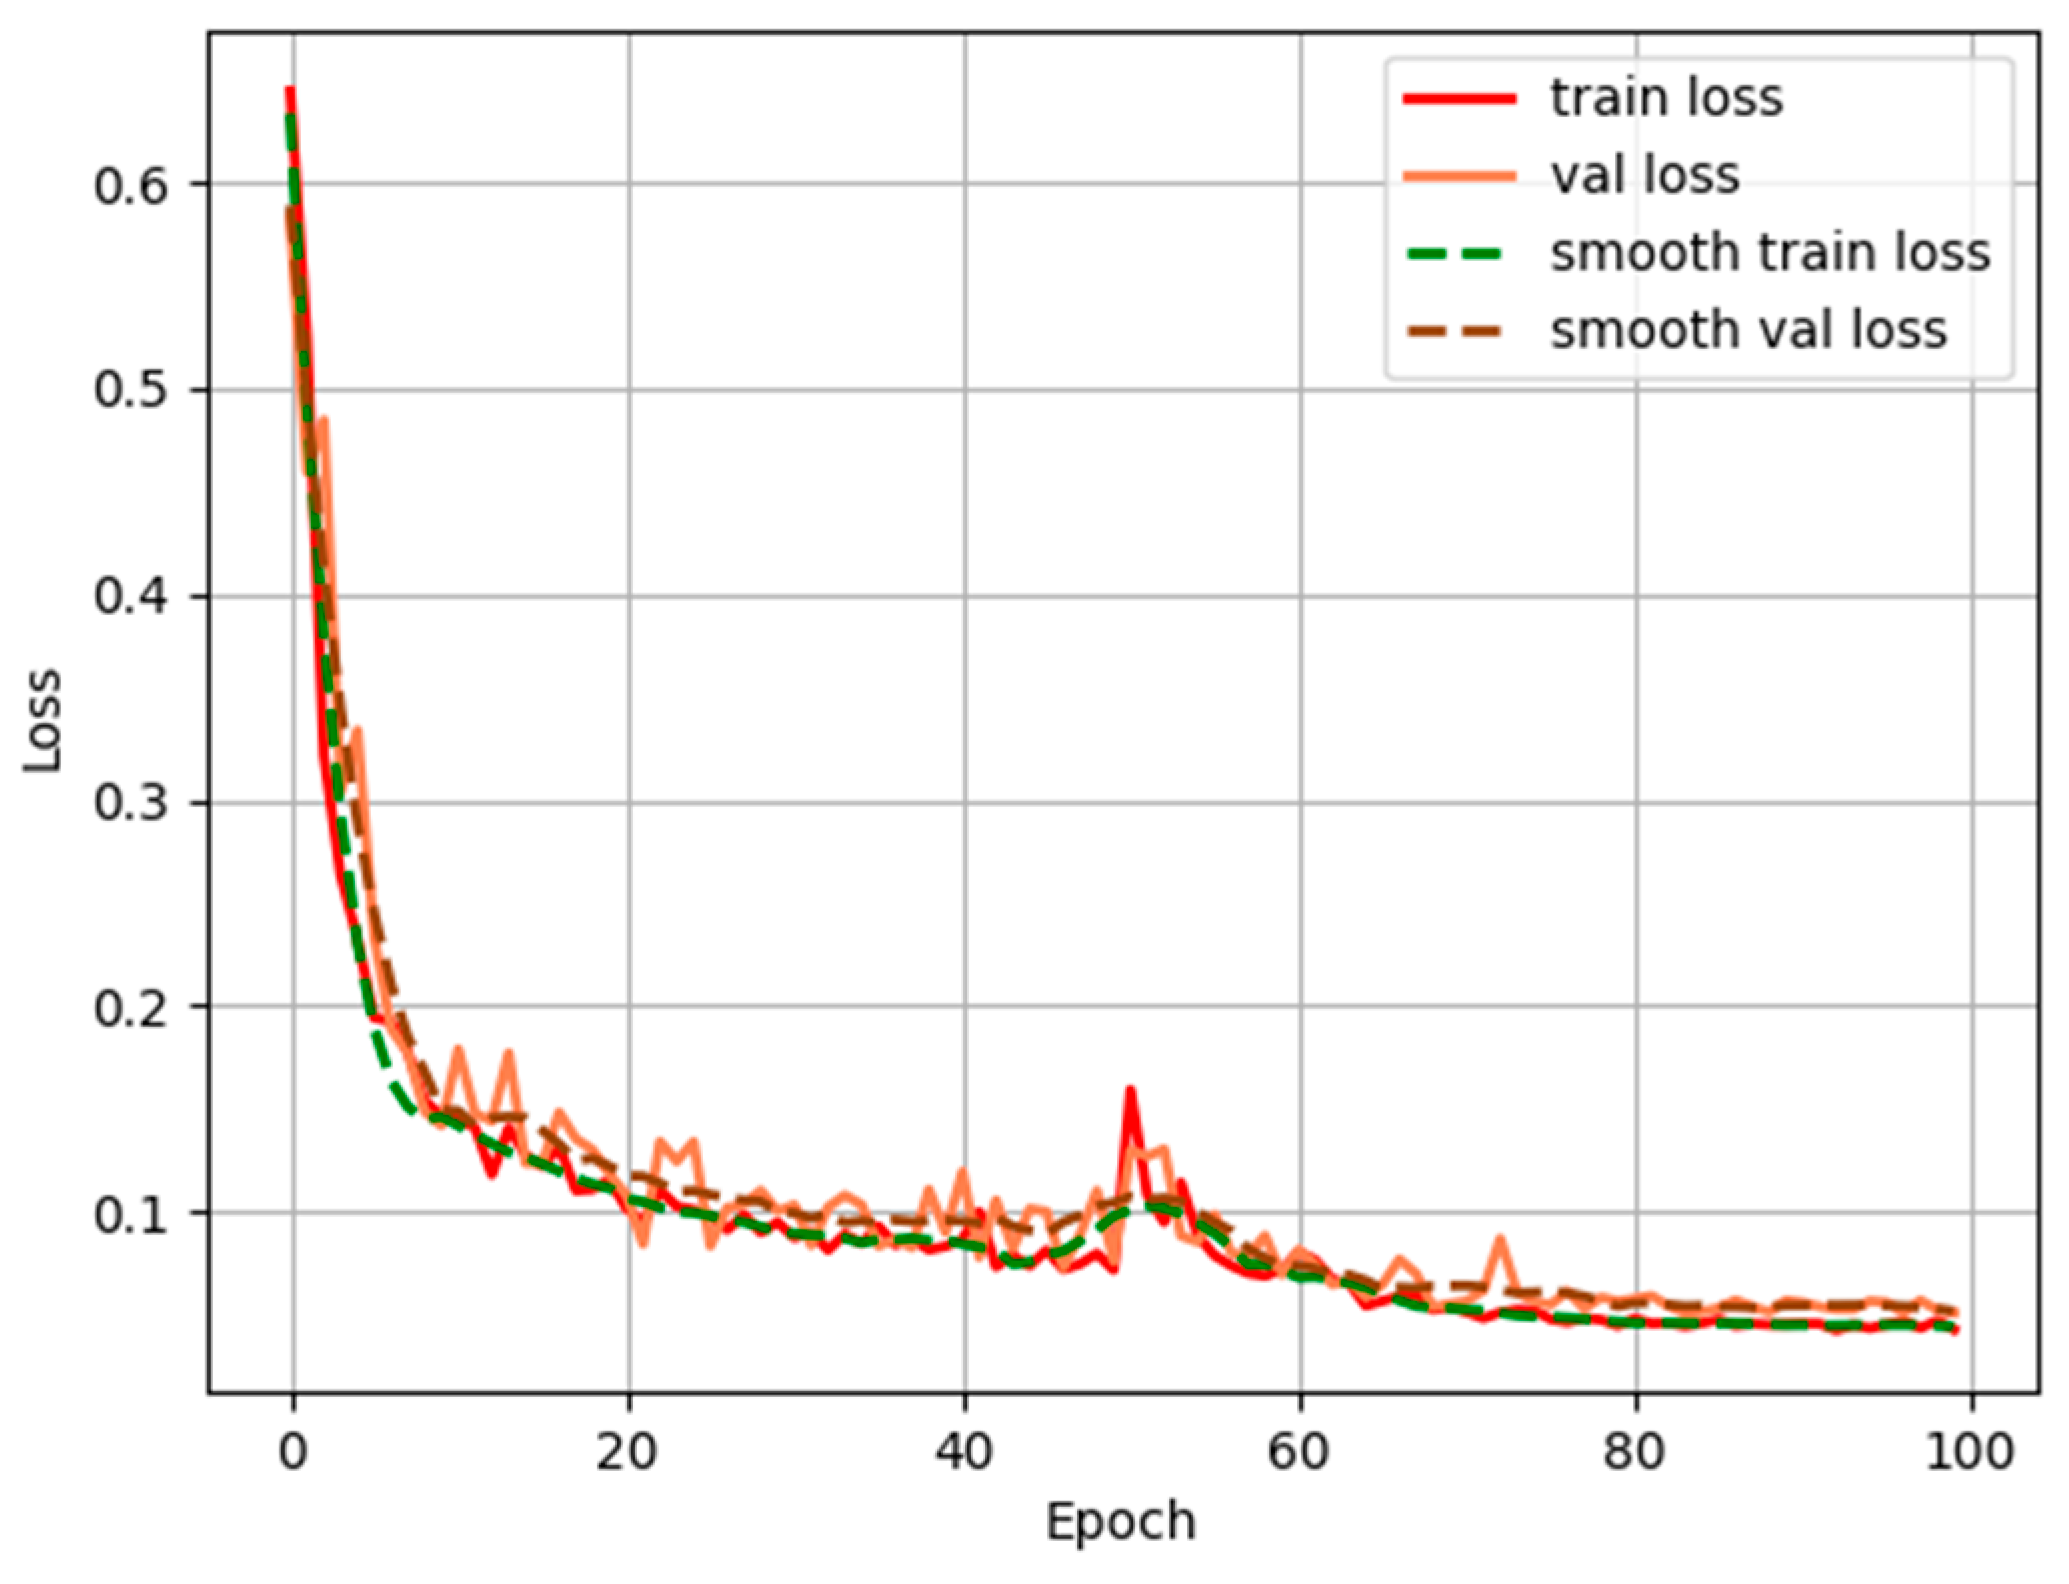
3.2. Model Performance Evaluation

Figure 6 shows the training loss. The loss decreased steadily over the first 50 rounds. In the 51st round, the loss increased slightly due to unfreezing training but quickly decreased again. The model converged at the end of training.
After 100 rounds of training, the confusion matrix of the improved model on the verification set is shown in Table 2, and the model segmentation performance indicators of the verification set are shown in Table 3. The improved U-Net model achieved 93.35% precision and 94.96% recall for beachrocks. The accuracy was 97.79%, the F1-score was 94.25%, the IoU was 88.98%, and the validation loss was 0.051. These results demonstrate the model’s high segmentation accuracy. The improved model achieved an MCC of 0.928 on the validation set, demonstrating strong agreement between predicted and actual beachrock distributions. With a false positive rate (FPR) of only 1.27%, it effectively minimized background misclassification.

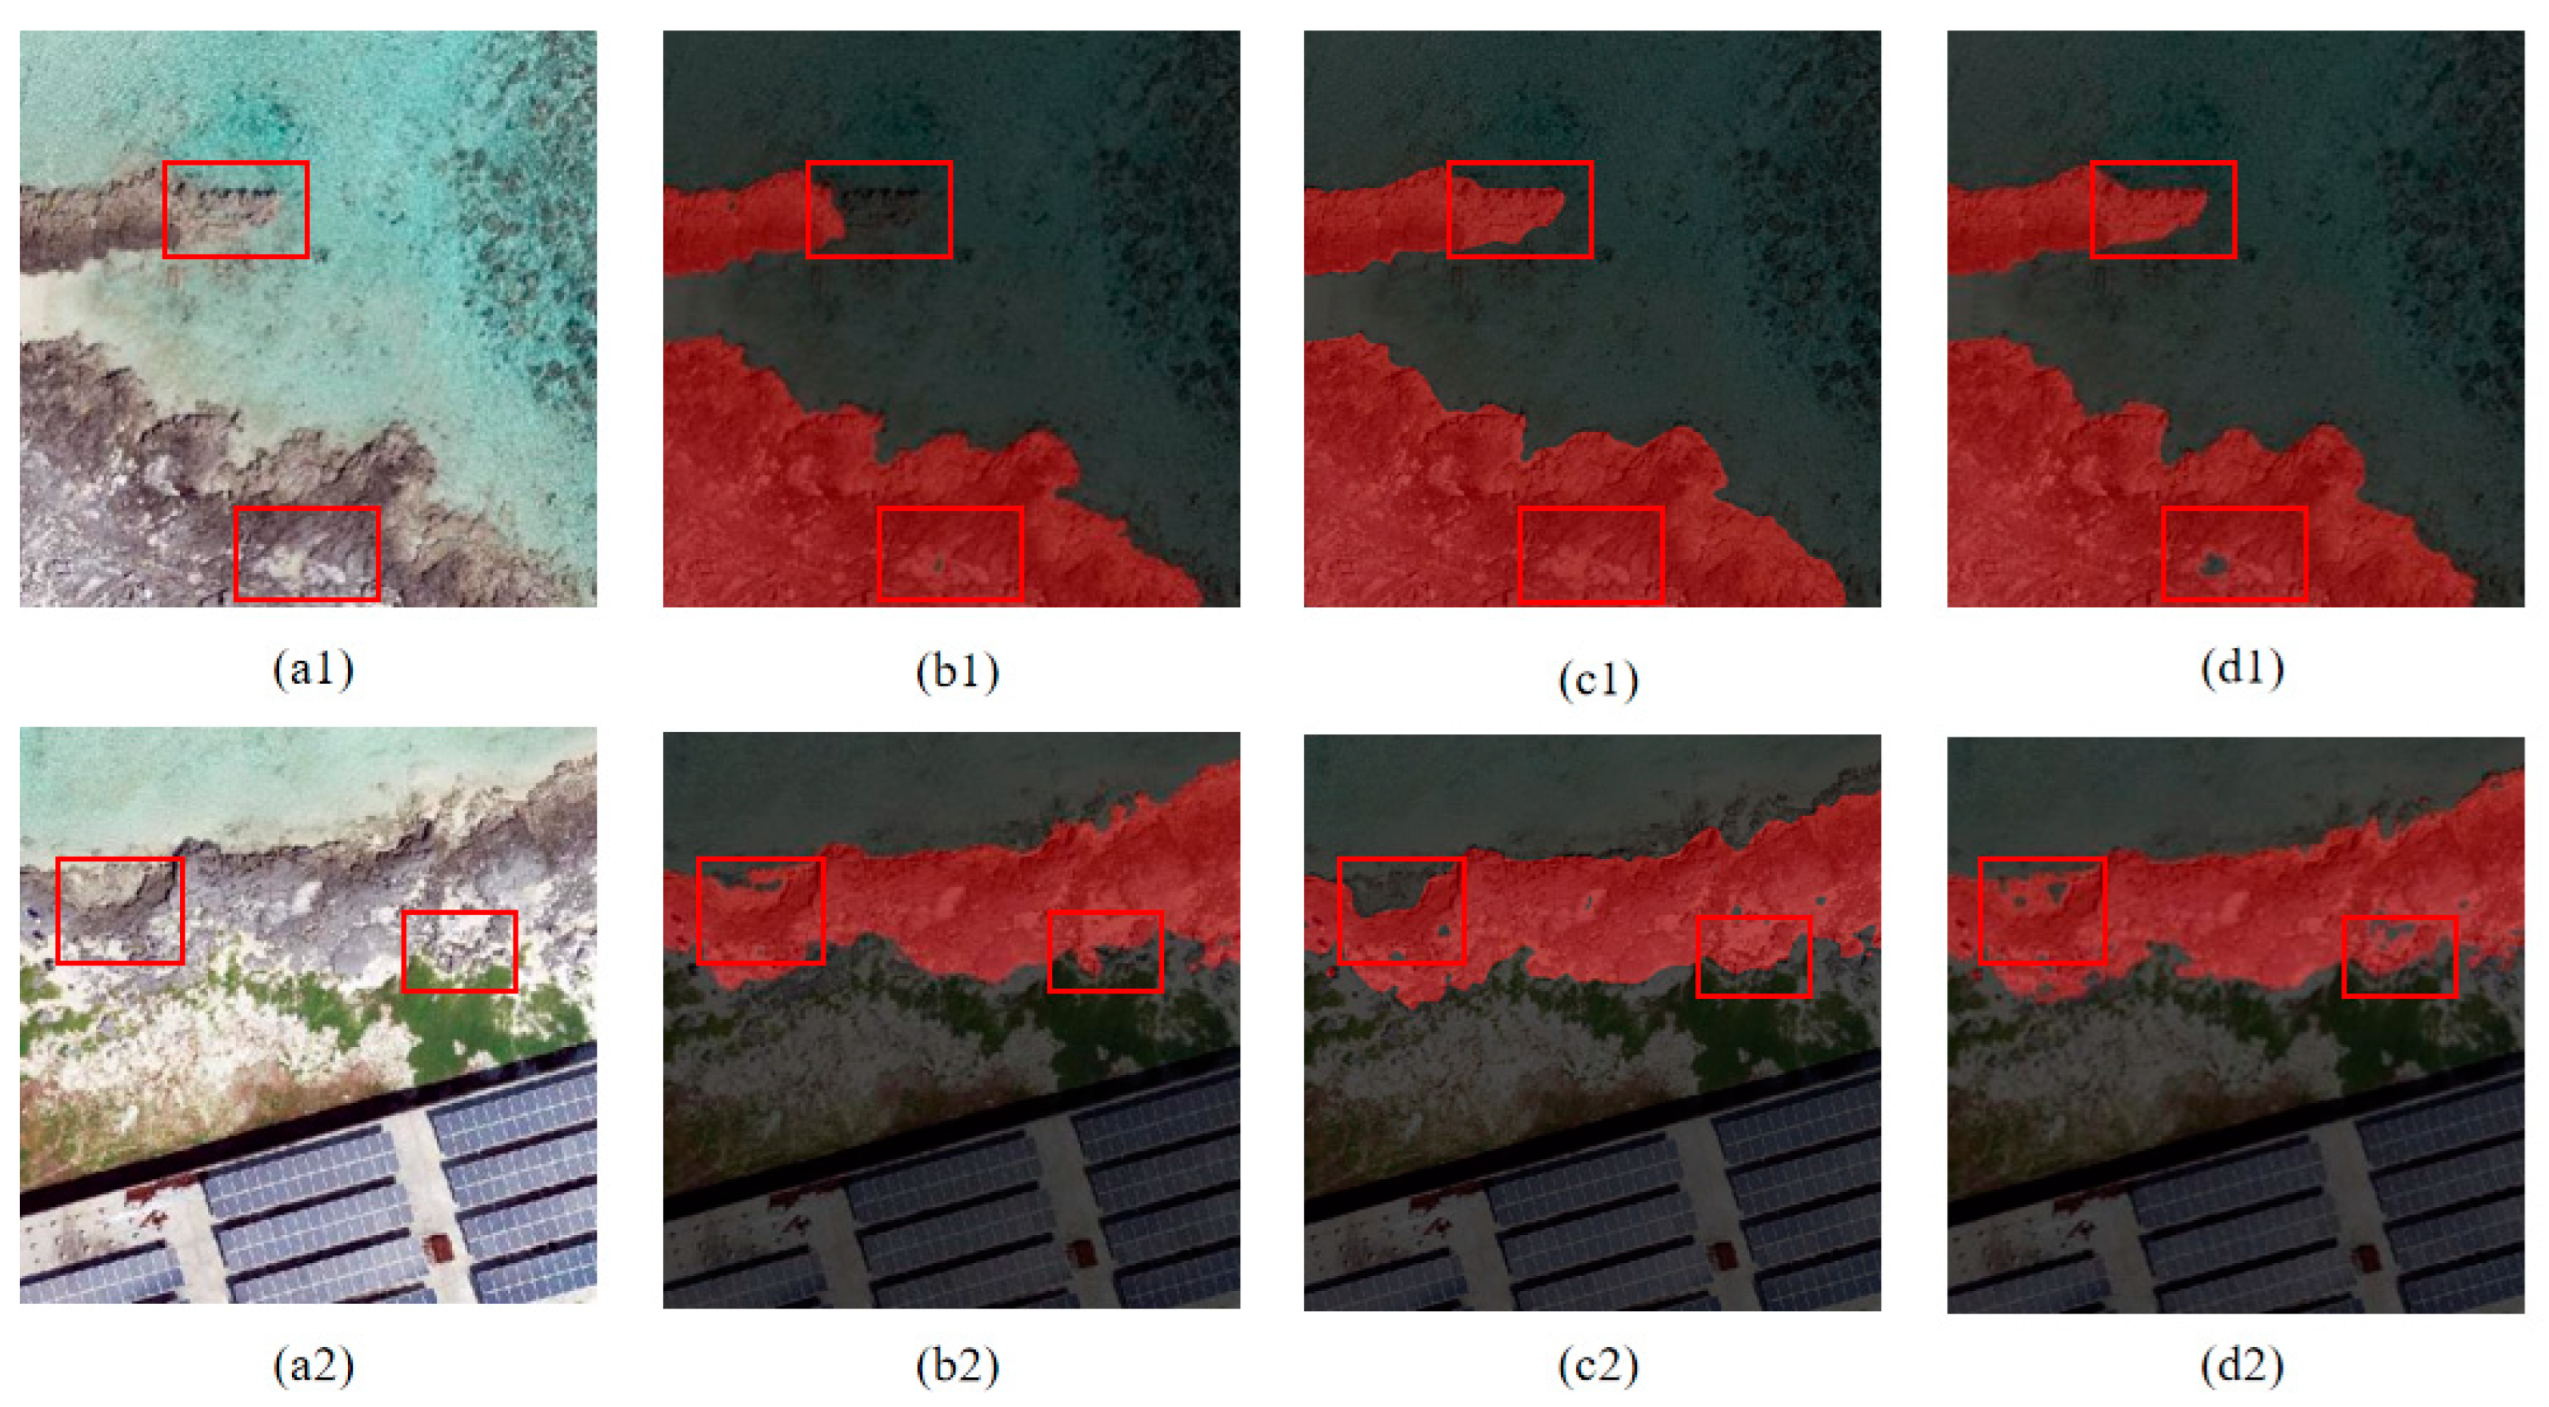
3.3. Comparison of Model Before and After Improvement

The study validated the proposed method for UAV beachrock segmentation by comparing it with the traditional U-Net model and the Deeplabv3+ model. The study used 24 test set images as input to calculate evaluation metrics for analyzing different segmentation methods. Table 4 shows the confusion matrix of the traditional U-Net model on the test set. Table 5 shows the confusion matrix of the Deeplabv3+ model on the test set. Table 6 shows the confusion matrix of the improved U-Net model on the test set. Table 7 shows the evaluation metrics for the test set of the different models.
The study analyzed the test set segmentation results shown in Figure 7 to visually compare the differences between the improved U-Net model, the traditional U-Net model, and the Deeplabv3+ model. Figure 7a1,a2 show the original data, Figure 7b1,b2 show the segmentation results of the traditional U-Net model, Figure 7c1,c2 show the segmentation results of the Deeplabv3+ model, while Figure 7d1,d2 illustrate the results of the improved U-Net model. The improved U-Net model demonstrated a better segmentation performance compared to the original U-Net model and the Deeplabv3+ model.
In the first group of Figure 7, the left red box highlights regions containing beachrocks in the original data. The traditional U-Net model failed to fully identify these beachrocks, whereas both Deeplabv3+ and the improved U-Net model achieved more complete segmentation. The right red box indicates an area without beachrocks in the original data. Deeplabv3+ completely misidentified this region as containing beachrocks, whereas both the traditional U-Net and the improved U-Net correctly recognized the absence of beachrocks, with the improved U-Net identifying a larger non-beachrock area. In the second group of Figure 7, within the left red box, the Deeplabv3+ model identified the largest area without beachrocks, the improved U-Net model identified a smaller area, while the traditional U-Net model identified the smallest area. The right red box highlights scattered beachrocks, where the improved U-Net detected more fragmented beachrocks than both the traditional U-Net and Deeplabv3+. This study reveals that identifying dispersed beachrocks remains challenging. The improved model still struggles to accurately distinguish scattered beachrocks from background information, indicating persistent limitations.

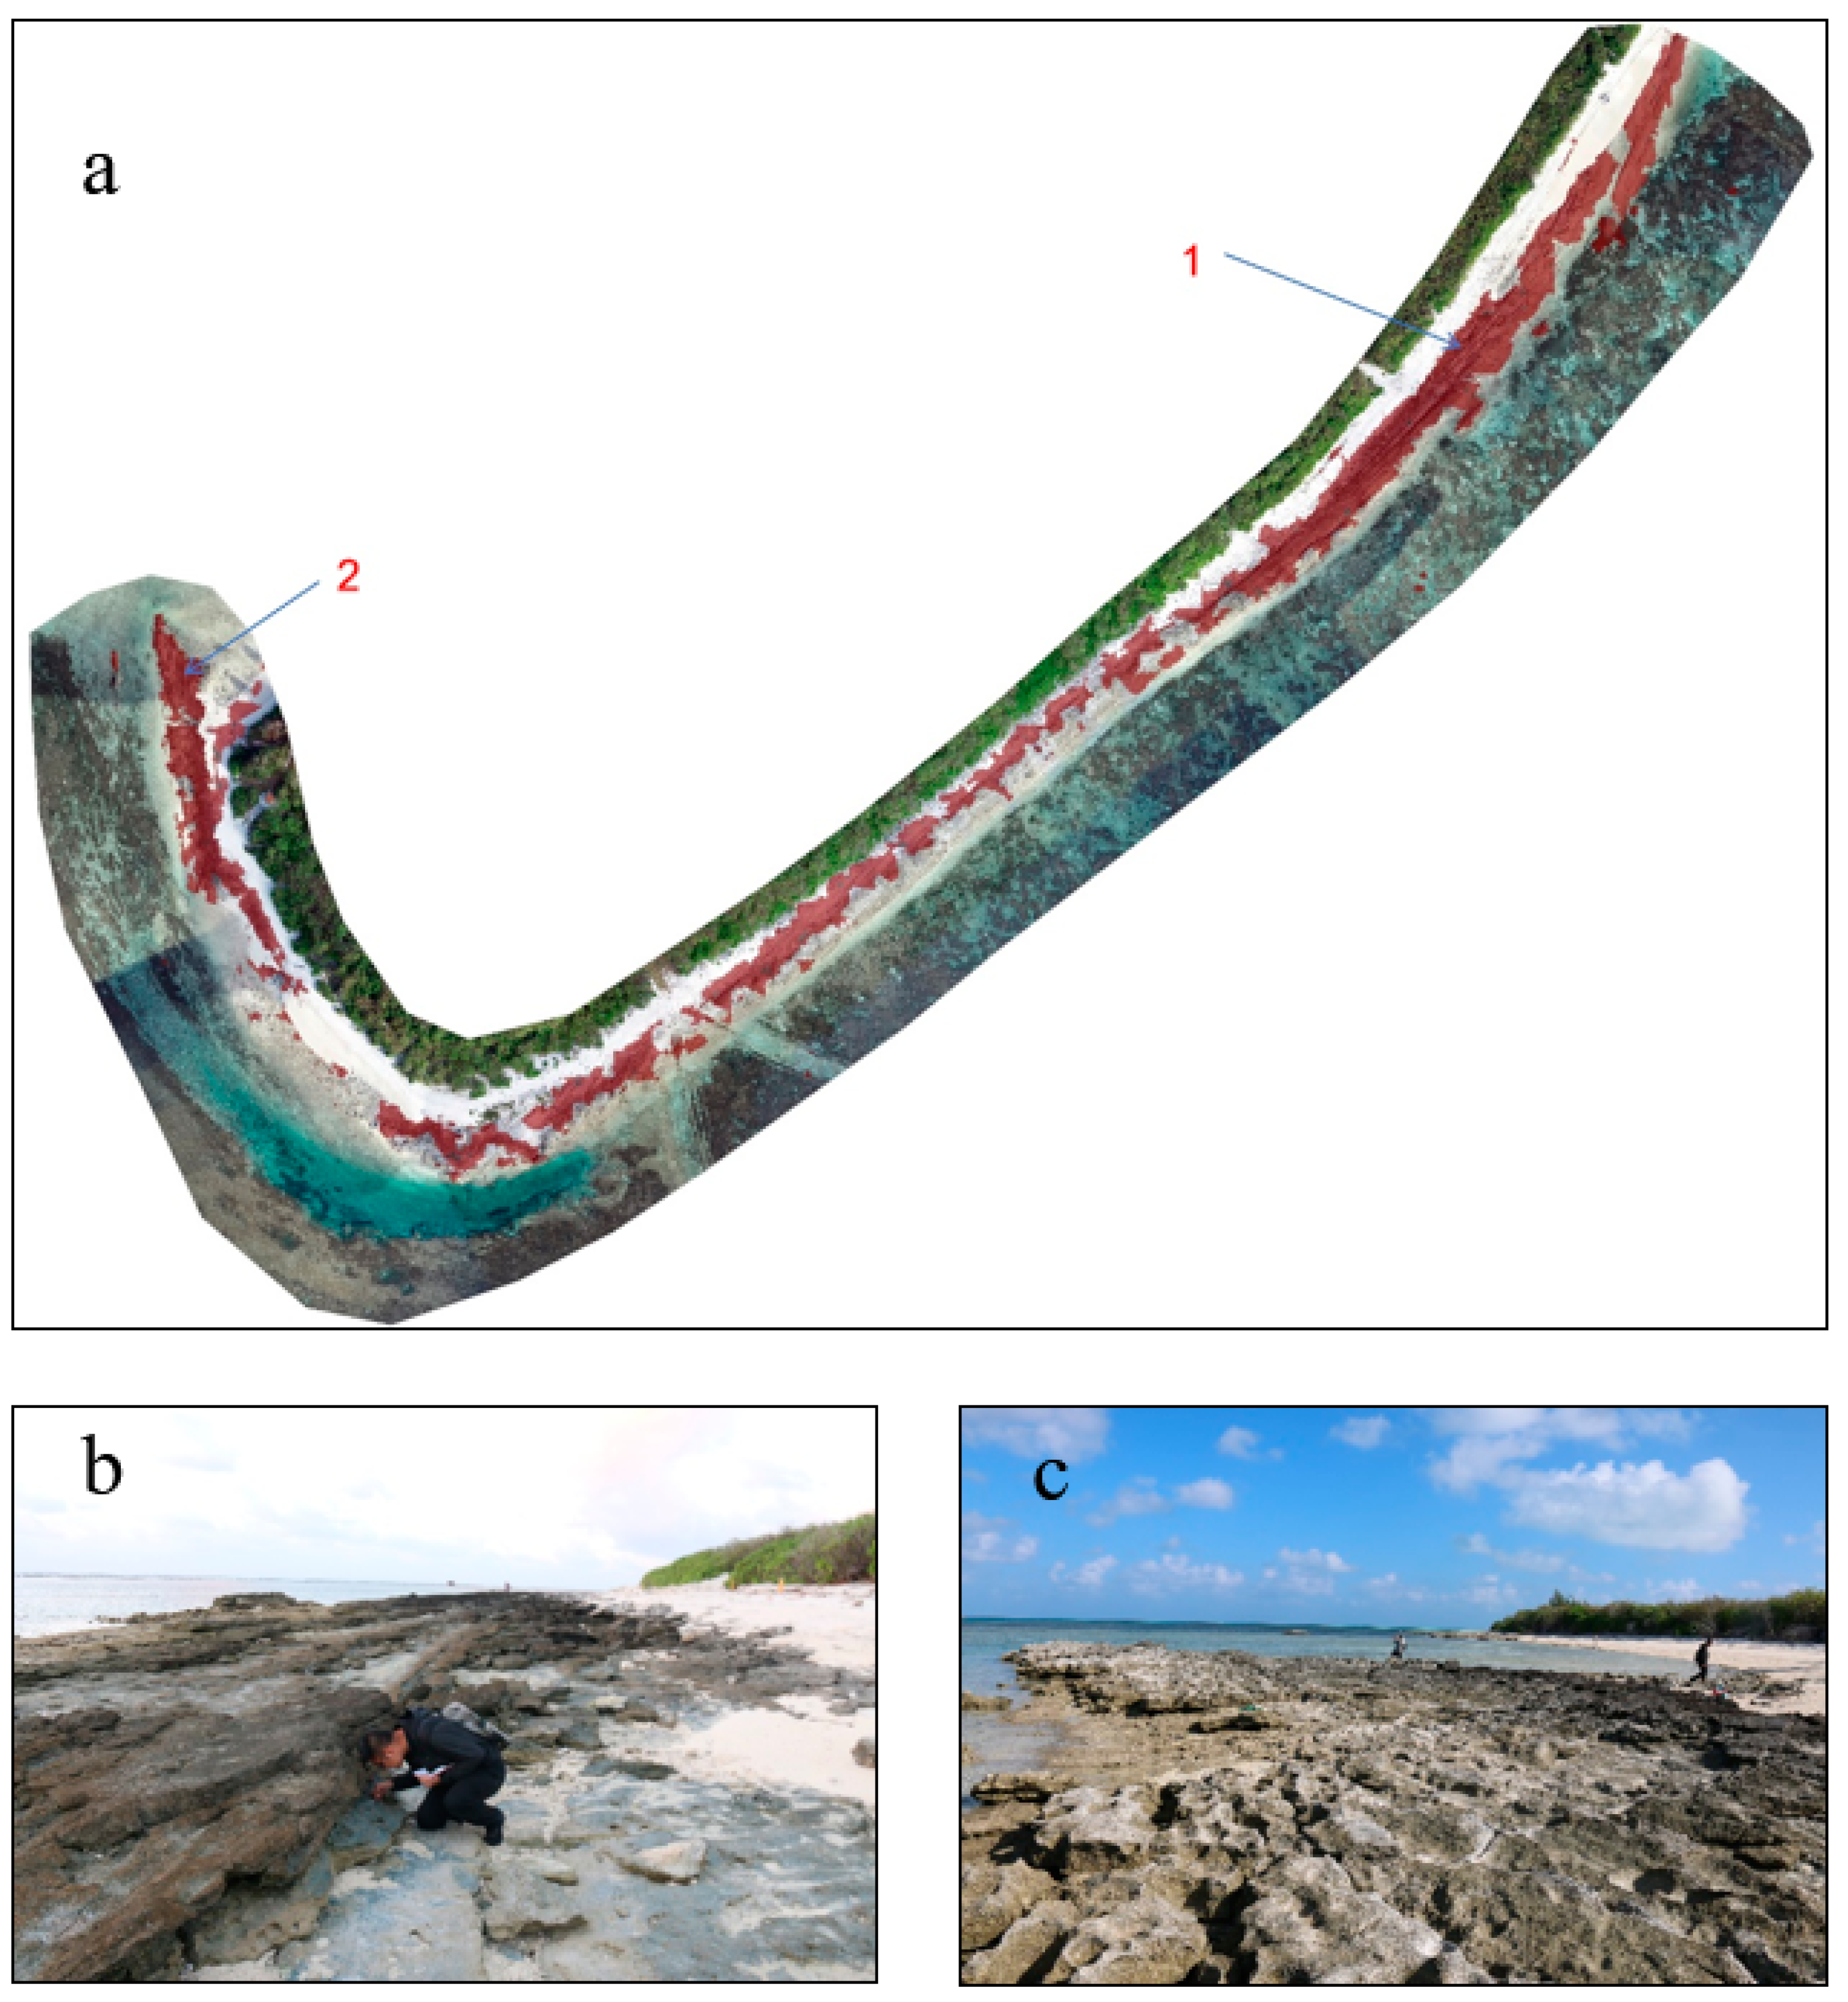
3.4. Model Application Example

The improved U-Net model, which had been trained on Island A data, was tested on Island B examples. The evaluation results are presented in Figure 8, demonstrating the model’s effectiveness in identifying the distribution of beachrock areas. Field photographs from two locations further verified the presence of beachrocks within the identified regions. This indicates that the model has generalization ability and practical value. The model also performs well for beachrock segmentation tasks in different terrains, delivering reliable results. The model struggles with the identification of scattered beachrocks or those with unclear boundaries.

4. Discussion

This study presents an advanced U-Net model incorporating the efficient channel attention (ECA) mechanism for beachrock segmentation. This approach significantly improves recognition performance, particularly in the challenging environments of the South China Sea islands. By enhancing channel-wise feature representation, the ECA mechanism effectively highlights salient features of beachrocks. Compared to the traditional U-Net model, the enhanced model achieves superior accuracy, precision, recall, F1-score, and IoU at 97.47%, 93.27%, 94.73%, 93.95%, and 88.65% levels, respectively. These results indicate that the ECA module reduces misclassification rates and improves segmentation precision in complex textured regions. Moreover, the ECA module outperforms other attention mechanisms such as SENet in terms of efficiency and cost-effectiveness, making it suitable for large-scale datasets. The ECA’s channel weighting strategy simplifies weight optimization by bypassing explicit global dependency. Experimental results demonstrate high accuracy in delineating large, continuously distributed beachrock regions, validating the model’s utility for island ecology and geological surveys. However, the model exhibits limitations in detecting boundary-blurred or sparsely distributed beachrocks, often misclassifying small, fragmented targets as background due to their spectral and textural similarity to surrounding substrates. This limitation is partially attributed to insufficient training samples of sparse targets and inadequate edge feature extraction in current architectures [38]. Although our evaluation primarily focused on comprehensive performance metrics, the absence of instance-level quantification for scattered objects limits a detailed understanding of specific failure modes. Addressing this issue in future work involves implementing object-based accuracy metrics to quantify fragmented beachrock features. Additionally, integrating multi-scale analysis could enhance the detection of small targets, while leveraging weakly supervised learning techniques may reduce reliance on exhaustive manual annotations for sparse objects. Furthermore, this experiment still has some limitations, including limited data diversity and insufficient adaptability to multi-source data [39]. Future research could explore several directions. One potential avenue is the development of adaptive attention mechanisms that dynamically adjust to wave energy conditions using LSTM modules. Another possibility is the design of hybrid models that integrate deep learning with multispectral indices, such as the Normalized Difference Sediment Index, to enhance lithology discrimination [40]. Additionally, incorporating a synthetic aperture radar (SAR) could improve beachrock detection in turbid waters through microwave penetration [41].

5. Conclusions

This study innovatively combined an improved U-Net model with the ECA mechanism to achieve high-precision recognition of beachrocks in the South China Sea islands. Experimental validation demonstrated that the improved model excelled in both accuracy and robustness, showcasing its superior performance under complex terrain conditions. The improved model achieved significant performance gains, improving overall accuracy by 0.49%, precision by 1.41%, recall by 0.97%, F1-score by 1.10%, and IoU by 2.09% compared to the traditional U-Net model, providing a novel technical pathway for the application of UAV images in island geological studies. However, the model’s limitation is its difficulty in accurately distinguishing scattered beachrocks from background information. Future research should focus on diversifying datasets and further optimizing the model for scattered beachrock feature extraction. Moreover, integrating multi-source remote sensing data with real-time monitoring technologies and developing lightweight model variants with edge computing integration will enable onboard processing for instant beachrock detection during surveys, which is particularly critical for typhoon-induced coastal change monitoring. These advancements will provide more comprehensive technical solutions for geological research and ecological protection.

Author Contributions

Conceptualization, J.X.; methodology, C.L., W.G. (Wei Gao) and J.X.; software, C.L.; validation, C.L. and J.X.; writing—original draft, C.L.; writing—review & editing, W.G. (Wei Gao), J.X. and W.G. (Wei Gong); supervision, J.X. and W.G. (Wei Gong); project administration, C.L. and J.X.; funding acquisition, J.X. All authors have read and agreed to the published version of the manuscript.

Funding

This research was funded by the Fundamental Research Funds for the Central Universities (202262012), National Key R&D Program of China (2023YFC2812905) and the National Natural Science Foundation of China (42076224).

Data Availability Statement

The data that support the findings of this study are available from the corresponding author upon reasonable request.

Conflicts of Interest

The authors declare no conflicts of interest.

References

  1. Vousdoukas, M.I.; Velegrakis, A.F.; Plomaritis, T.A. Beachrock Occurrence, Characteristics, Formation Mechanisms and Impacts. Earth-Sci. Rev. 2007, 85, 23–46. [Google Scholar] [CrossRef]
  2. Danjo, T.; Kawasaki, S. Characteristics of Beachrocks: A Review. Geotech. Geol. Eng. 2014, 32, 215–246. [Google Scholar] [CrossRef]
  3. Lin, Y.; Liang, D.; Wei, C.; Lü, Z.; Wu, D.; Huang, W.; Xu, G.; Du, J. Geochemical characteristics of Late Pleistocene beach rocks in northwest Hainan Island and their paleoenvironment implications. Sci. Technol. Eng. 2023, 23, 4079–4090. (In Chinese) [Google Scholar]
  4. Riding, R. Structure and Composition of Organic Reefs and Carbonate Mud Mounds: Concepts and Categories. Earth-Sci. Rev. 2002, 58, 163–231. [Google Scholar] [CrossRef]
  5. Li, M.; Zhang, H.; Gruen, A.; Li, D. A Survey on Underwater Coral Image Segmentation Based on Deep Learning. Geo-Spat. Inf. Sci. 2024, 1–25. [Google Scholar] [CrossRef]
  6. Zhou, M.; Liu, Y.; Li, M.; Sun, C.; Zou, W. Geomorphologic information extraction for multi-objective coral islands from remotely sensed imagery: A case study for Yongle Atoll, South China Sea. Geogr. Res. 2015, 34, 677–690. (In Chinese) [Google Scholar] [CrossRef]
  7. Zuo, X.; Su, F.; Zhao, H.; Fang, Y.; Yang, J. Development of a geomorphic classification scheme for coral reefs in the South China Sea based on high-resolution satellite images. Prog. Geogr. 2018, 37, 1463–1472. (In Chinese) [Google Scholar] [CrossRef]
  8. Dong, J.; Ren, G.; Hu, Y.; Pang, J.; Ma, Y. Construction and classification of coral reef geomorphic unit system based on high-resolution remote sensing: Using 8-band Worldview-2 Image as an example. J. Trop. Oceanogr. 2020, 39, 116–129. (In Chinese) [Google Scholar]
  9. King, A.; Bhandarkar, S.M.; Hopkinson, B.M. A Comparison of Deep Learning Methods for Semantic Segmentation of Coral Reef Survey Images. In Proceedings of the 2018 IEEE/CVF Conference on Computer Vision and Pattern Recognition Workshops (CVPRW), Salt Lake City, UT, USA, 18–22 June 2018; pp. 1475–14758. [Google Scholar]
  10. Li, J.; Knapp, D.E.; Fabina, N.S.; Kennedy, E.V.; Larsen, K.; Lyons, M.B.; Murray, N.J.; Phinn, S.R.; Roelfsema, C.M.; Asner, G.P. A Global Coral Reef Probability Map Generated Using Convolutional Neural Networks. Coral Reefs 2020, 39, 1805–1815. [Google Scholar] [CrossRef]
  11. González-Rivero, M.; Beijbom, O.; Rodriguez-Ramirez, A.; Bryant, D.E.P.; Ganase, A.; Gonzalez-Marrero, Y.; Herrera-Reveles, A.; Kennedy, E.V.; Kim, C.J.S.; Lopez-Marcano, S.; et al. Monitoring of Coral Reefs Using Artificial Intelligence: A Feasible and Cost-Effective Approach. Remote Sens. 2020, 12, 489. [Google Scholar] [CrossRef]
  12. Zheng, Z.; Yang, C.; Zhao, J.; Feng, Y. Remote Sensing Geological Classification of Sea Islands and Reefs Based on Deeplabv3 +. In Proceedings of the 2022 7th International Conference on Intelligent Computing and Signal Processing (ICSP), Virtual, 15–17 April 2022; pp. 1907–1910. [Google Scholar]
  13. Ma, Z.; Song, Y.; Zou, Y.; Zhu, H.; Cui, S. Remote sensing information extraction of coral reefs in Yongle Islands of Xisha based on deep learning. J. Appl. Oceanogr. 2022, 41, 644–654. [Google Scholar] [CrossRef]
  14. Turner, I.L.; Harley, M.D.; Drummond, C.D. UAVs for Coastal Surveying. Coast. Eng. 2016, 114, 19–24. [Google Scholar] [CrossRef]
  15. Liang, X.; Dai, Z.; Huang, H.; Wang, J.; Li, S.; Wang, R.; Pang, W. Elevation Inversion of Mangrove Tidal Flat Geomorphology Based on UAV Aerial Survey. Adv. Mar. Sci. 2024, 42, 384–399. [Google Scholar] [CrossRef]
  16. Aspragkathos, S.N.; Karras, G.C.; Kyriakopoulos, K.J. A Hybrid Model and Data-Driven Vision-Based Framework for the Detection, Tracking and Surveillance of Dynamic Coastlines Using a Multirotor UAV. Drones 2022, 6, 146. [Google Scholar] [CrossRef]
  17. Ružić, I.; Benac, Č.; Jovančević, S.D.; Radišić, M. The Application of UAV for the Analysis of Geological Hazard in Krk Island, Croatia, Mediterranean Sea. Remote Sens. 2021, 13, 1790. [Google Scholar] [CrossRef]
  18. Giordano, C.M.; Girelli, V.A.; Lambertini, A.; Tini, M.A.; Zanutta, A. UAV Data Collection Co-Registration: LiDAR and Photogrammetric Surveys for Coastal Monitoring. Drones 2025, 9, 49. [Google Scholar] [CrossRef]
  19. Nikolakopoulos, K.G.; Lampropoulou, P.; Fakiris, E.; Sardelianos, D.; Papatheodorou, G. Synergistic Use of UAV and USV Data and Petrographic Analyses for the Investigation of Beachrock Formations: A Case Study from Syros Island, Aegean Sea, Greece. Minerals 2018, 8, 534. [Google Scholar] [CrossRef]
  20. Nikolakopoulos, K.G.; Koukouvelas, I.K.; Lampropoulou, P. UAV, GIS, and Petrographic Analysis for Beachrock Mapping and Preliminary Analysis in the Compressional Geotectonic Setting of Epirus, Western Greece. Minerals 2022, 12, 392. [Google Scholar] [CrossRef]
  21. Everingham, M.; Van Gool, L.; Williams, C.K.I.; Winn, J.; Zisserman, A. The Pascal Visual Object Classes (VOC) Challenge. Int. J. Comput. Vis. 2010, 88, 303–338. [Google Scholar] [CrossRef]
  22. Ronneberger, O.; Fischer, P.; Brox, T. U-Net: Convolutional Networks for Biomedical Image Segmentation. In Medical Image Computing and Computer-Assisted Intervention—MICCAI 2015, Proceedings of the 18th International Conference, Munich, Germany, 5–9 October 2015; Navab, N., Hornegger, J., Wells, W.M., Frangi, A.F., Eds.; Springer International Publishing: Cham, Switzerland, 2015; pp. 234–241. [Google Scholar]
  23. Long, J.; Shelhamer, E.; Darrell, T. Fully Convolutional Networks for Semantic Segmentation. In Proceedings of the 2015 IEEE Conference on Computer Vision and Pattern Recognition (CVPR), Boston, MA, USA, 7–12 June 2015; pp. 3431–3440. [Google Scholar]
  24. Liu, P.; Wang, C.; Ye, M.; Han, R. Coastal Zone Classification Based on U-Net and Remote Sensing. Appl. Sci. 2024, 14, 7050. [Google Scholar] [CrossRef]
  25. Wang, Y.; Zhang, Y.; Wang, G. Impact of Physical and Attention Mechanisms on U-Net for SST Forecasting. Intell. Mar. Technol. Syst. 2024, 2, 11. [Google Scholar] [CrossRef]
  26. Li, T.; Song, J.; Song, Z.; Ablimit, A.; Chen, L. Removing Nonrigid Refractive Distortions for Underwater Images Using an Attention-Based Deep Neural Network. Intell. Mar. Technol. Syst. 2024, 2, 25. [Google Scholar] [CrossRef]
  27. Guo, M.-H.; Xu, T.-X.; Liu, J.-J.; Liu, Z.-N.; Jiang, P.-T.; Mu, T.-J.; Zhang, S.-H.; Martin, R.R.; Cheng, M.-M.; Hu, S.-M. Attention Mechanisms in Computer Vision: A Survey. Comp. Visual Media 2022, 8, 331–368. [Google Scholar] [CrossRef]
  28. Hu, J.; Shen, L.; Sun, G. Squeeze-and-Excitation Networks. In Proceedings of the 2018 IEEE/CVF Conference on Computer Vision and Pattern Recognition, Salt Lake City, UT, USA, 18–23 June 2018; pp. 7132–7141. [Google Scholar]
  29. Wang, Q.; Wu, B.; Zhu, P.; Li, P.; Zuo, W.; Hu, Q. ECA-Net: Efficient Channel Attention for Deep Convolutional Neural Networks. In Proceedings of the 2020 IEEE/CVF Conference on Computer Vision and Pattern Recognition (CVPR), Seattle, WA, USA, 13–19 June 2020; pp. 11531–11539. [Google Scholar]
  30. Milletari, F.; Navab, N.; Ahmadi, S.-A. V-Net: Fully Convolutional Neural Networks for Volumetric Medical Image Segmentation. In Proceedings of the 2016 Fourth International Conference on 3D Vision (3DV), Stanford, CA, USA, 25–28 October 2016; pp. 565–571. [Google Scholar]
  31. Yeung, M.; Sala, E.; Schönlieb, C.-B.; Rundo, L. Unified Focal Loss: Generalising Dice and Cross Entropy-Based Losses to Handle Class Imbalanced Medical Image Segmentation. Comput. Med. Imaging Graph. 2022, 95, 102026. [Google Scholar] [CrossRef]
  32. Kingma, D.P.; Ba, J. Adam: A Method for Stochastic Optimization. arXiv 2014, arXiv:1412.6980. [Google Scholar]
  33. Ruder, S. An Overview of Gradient Descent Optimization Algorithms. arXiv 2016, arXiv:1609.04747. [Google Scholar]
  34. Lei, J.; Liu, X.; Yang, H.; Zeng, Z.; Feng, J. Dual Hybrid Attention Mechanism-Based U-Net for Building Segmentation in Remote Sensing Images. Appl. Sci. 2024, 14, 1293. [Google Scholar] [CrossRef]
  35. Matthews, B.W. Comparison of the Predicted and Observed Secondary Structure of T4 Phage Lysozyme. Biochim. Biophys. Acta (BBA)—Protein Struct. 1975, 405, 442–451. [Google Scholar] [CrossRef]
  36. Chicco, D.; Jurman, G. The Advantages of the Matthews Correlation Coefficient (MCC) over F1 Score and Accuracy in Binary Classification Evaluation. BMC Genom. 2020, 21, 6. [Google Scholar] [CrossRef]
  37. Chicco, D.; Tötsch, N.; Jurman, G. The Matthews Correlation Coefficient (MCC) Is More Reliable than Balanced Accuracy, Bookmaker Informedness, and Markedness in Two-Class Confusion Matrix Evaluation. BioData Min. 2021, 14, 13. [Google Scholar] [CrossRef]
  38. Cheng, J.; Deng, C.; Su, Y.; An, Z.; Wang, Q. Methods and Datasets on Semantic Segmentation for Unmanned Aerial Vehicle Remote Sensing Images: A Review. ISPRS J. Photogramm. Remote Sens. 2024, 211, 1–34. [Google Scholar] [CrossRef]
  39. Ahmed, S.A.; Desa, H.; Easa, H.K.; Hussain, A.-S.T.; Taha, T.A.; Salih, S.Q.; Hasan, R.A.; Ahmed, O.K.; Ng, P.S.J. Advancements in UAV Image Semantic Segmentation: A Comprehensive Literature Review. Multidiscip. Rev. 2024, 7, 2024118. [Google Scholar] [CrossRef]
  40. Osco, L.P.; Junior, J.M.; Ramos, A.P.M.; de Castro Jorge, L.A.; Fatholahi, S.N.; de Andrade Silva, J.; Matsubara, E.T.; Pistori, H.; Gonçalves, W.N.; Li, J. A Review on Deep Learning in UAV Remote Sensing. Int. J. Appl. Earth Obs. Geoinf. 2021, 102, 102456. [Google Scholar] [CrossRef]
  41. Huang, L.; Meng, J.; Fan, C.; Zhang, J.; Yang, J. Shallow Sea Topography Detection from Multi-Source SAR Satellites: A Case Study of Dazhou Island in China. Remote Sens. 2022, 14, 5184. [Google Scholar] [CrossRef]
Figure 1. UAV image of Island A.
Remotesensing 17 01647 g001
Figure 2. UAV image of Island B.
Remotesensing 17 01647 g002
Figure 3. Traditional U-Net network model. Each box indicates a multi-channel feature map, with the channel number noted above. Yellow boxes are copied feature maps, and arrows represent operations.
Remotesensing 17 01647 g003
Figure 4. The network structure of the beachrocks semantic segmentation model with the incorporated ECA module. Purple blocks show the ECA module locations, added after two convolutional layers and before the max pooling layer.
Remotesensing 17 01647 g004
Figure 5. ECA module. ECA calculates channel weights using a fast 1D convolution of size k, which is adaptively determined based on the channel dimension C [29].
Remotesensing 17 01647 g005
Figure 6. The loss value of the training process.
Remotesensing 17 01647 g006
Figure 7. Comparison of beachrock identification performance before and after improvement. (a1,a2) Original data; (b1,b2) segmentation results using the traditional U-Net model; (c1,c2) segmentation results using the Deeplabv3+ model; (d1,d2) segmentation results using the improved U-Net model. The red box indicates areas with noticeable changes.
Remotesensing 17 01647 g007
Figure 8. Identification result of Island B. (a) Identification results for Island B, with (1) and (2) indicating the locations of field sampling points. (b) Field photograph of Point 1; (c) field photograph of Point 2.
Remotesensing 17 01647 g008
Table 1. Confusion matrix structure.
Predicted PositivePredicted Negative
Actual PositiveTrue PositiveFalse Negative
Actual NegativeFalse PositiveTrue Negative
Table 2. The confusion matrix of the improved U-Net model on the verification set.
Predicted PositivePredicted Negative
Actual PositiveTP = 1,122,515FN = 59,497
Actual NegativeFP = 79,849TN = 5,029,595
Table 3. Performance evaluation of the improved U-Net model on the validation set.
MetricsValue
Accuracy (CCR)/%97.79
Precision (PRE)/%93.35
Recall/%94.96
F1-score/%94.25
IoU/%88.98
MCC0.928
Loss0.051
Table 4. The confusion matrix of the traditional U-Net model on the test set.
Predicted PositivePredicted Negative
Actual PositiveTP = 1,221,179FN = 81,184
Actual NegativeFP = 108,324TN = 4,880,769
Table 5. The confusion matrix of the Deeplabv3+ model on the test set.
Predicted PositivePredicted Negative
Actual PositiveTP = 1,242,143FN = 79,524
Actual NegativeFP = 91,322TN = 4,874,467
Table 6. The confusion matrix of the improved U-Net model on the test set.
Predicted PositivePredicted Negative
Actual PositiveTP = 1,253,127FN = 65,239
Actual NegativeFP = 86,873TN = 4,895,217
Table 7. Performance comparison of the different models on the test set (mean ± std over 5 runs).
MetricsValue
Traditional U-Net Deeplabv3+ Improved U-Net
Accuracy (CCR)/%96.98 ± 0.2997.28 ± 0.2597.47 ± 0.27
Precision (PRE)/%91.86 ± 0.3393.16 ± 0.2993.27 ± 0.29
Recall/%93.76 ± 0.4193.94 ± 0.4494.73 ± 0.39
F1-score/%92.85 ± 0.3893.68 ± 0.3193.95 ± 0.34
IoU/%86.56 ± 0.4787.93 ± 0.4288.65 ± 0.41
MCC0.909 ± 0.0150.926 ± 0.0120.924 ± 0.011
Disclaimer/Publisher’s Note: The statements, opinions and data contained in all publications are solely those of the individual author(s) and contributor(s) and not of MDPI and/or the editor(s). MDPI and/or the editor(s) disclaim responsibility for any injury to people or property resulting from any ideas, methods, instructions or products referred to in the content.

