Article

An Assembled Feature Attentive Algorithm for Automatic Detection of Waste Water Treatment Plants Based on Multiple Neural Networks

1
State Key Laboratory of Remote Sensing and Digital Earth, Aerospace Information Research Institute, Chinese Academy of Sciences, Beijing 100094, China
2
School of Information Engineering, China University of Geosciences (Beijing), Beijing 100083, China
3
Beiqi Foton Motor Co., Ltd., Beijing 102206, China
4
Guangxi Key Laboratory of Karst Ecological Processes and Services, Institute of Subtropical Agriculture, Chinese Academy of Sciences, Changsha 410125, China
*
Author to whom correspondence should be addressed.
Remote Sens. 2025, 17(9), 1645; https://doi.org/10.3390/rs17091645
Submission received: 13 March 2025 / Revised: 24 April 2025 / Accepted: 4 May 2025 / Published: 6 May 2025

Abstract

:
Wastewater treatment plants (WWTPs) play a vital role in controlling wastewater discharge and promoting recycling. Accurate WWTP identification and spatial analysis are crucial for environmental protection, urban planning, and sustainable development. However, the diverse shapes and scales of WWTPs and their key facilities pose challenges for traditional detection methods. This study employs a Multi-Attention Network (MANet) for WWTP extraction, integrating channel and spatial feature attention. Additionally, a Global-Local Feature Modeling Network (GLFMN) is introduced to segment key facilities, specifically sedimentation and secondary sedimentation tanks. The approach is applied to Beijing, utilizing geographic data such as WWTP locations, treatment capacities, and surrounding residential and water distributions. Results indicate that MANet achieves 80.1% accuracy with a 90.4% recall rate, while GLFMN significantly improves the extraction of key facilities compared to traditional methods. The spatial analysis reveals WWTP distribution characteristics, offering insights into treatment capacity and geographic influences. These findings contribute to emission regulation, water quality supervision, and enterprise management of WWTPs in Beijing. This research provides a valuable reference for optimizing wastewater treatment infrastructure and supports decision-making in environmental governance and sustainable urban development.

1. Introduction

The global acceleration of industrialization and urbanization has profoundly impacted water resources, necessitating the critical role of Waste Water Treatment Plants (WWTPs) in mitigating water pollution, and improving water environments [1,2,3]. However, traditional methods for identifying WWTPs face limitations due to uneven geographical distribution and information disparities [4,5,6]. Recent advancements in remote sensing technology and deep learning have provided opportunities for the identification and analysis of WWTPs [7,8], especially in regions like China facing severe water scarcity exacerbated by untreated agricultural, domestic, and industrial waste water [9,10,11]. Despite achievements in water resource development, challenges persist in utilization and management, including inadequate comprehensive utilization, excessive groundwater exploitation, resource wastage, water scarcity in northern cities, and pervasive water pollution.
WWTPs play a crucial role in mitigating China’s water pollution issues, serving as indicators of regional compliance with waste water discharge regulations and water quality standards. The implementation of water pollution prevention aligns with the United Nations’ Sustainable Development Goals (SDGs). Challenges remain in waste water treatment, including unauthorized discharge of industrial waste water, indiscriminate release of domestic waste water, and improper disposal of rural waste water, necessitating new technologies for automated WWTP identification. Deep learning, as a novel branch in machine learning, has shown promise in autonomously learning feature representations from remote sensing images, enhancing recognition accuracy and processing efficiency.
At current stage, in the domain of remote sensing identification, deep learning technology can autonomously learn feature representations from remote sensing images, thereby enhancing recognition accuracy and processing efficiency [12,13,14,15,16,17,18]. Deep learning models, particularly convolutional neural networks, excel in achieving high precision and real-time object detection tasks in remote sensing identification [19,20,21]. Researching WWTP extraction using deep learning object detection algorithms holds the potential to significantly improve the efficiency and automation level of WWTP identification. This approach leverages the capabilities of deep learning to automatically learn and recognize relevant features in remote sensing imagery, offering a promising avenue for advancing the effectiveness of WWTP recognition [22,23,24].
This study employs multi-attention network to identify WWTPs within the Beijing municipality using high-resolution data of the GF-1 and GF-2 satellites. Furthermore, to address the extraction of key facilities in WWTPs, a Global-Local Feature Segmentation Network is introduced in this research. Ultimately, leveraging the established sample repository and neural network, the study seeks to achieve automatic identification of WWTPs and their key facilities in Beijing. This comprehensive analysis involves integrating information on water bodies, residential areas, and processing capacity to understand the spatial distribution and processing capabilities of WWTPs in Beijing. Our research objectives include: (1) WWTP identification using multi-attention mechanism neural network; (2) implementation of WWTP key facility segmentation using a Global-Local feature module; (3) identification of WWTPs and key facilities in Beijing.

2. Related Works

2.1. Object Detection Based on Deep Learning

The challenge of detecting multiscale and variably shaped remote sensing land objects has prompted the development of sophisticated deep learning models that incorporate multiscale information fusion, attention mechanisms, and adaptive anchor strategies. The Feature Pyramid Network (FPN) by Lin et al. (2017) and Yang et al. (2018) retains multiscale information, while Yan et al. (2019) focus on balancing training weights for different scales [25,26,27]. The introduction of Transformer models with self-attention mechanisms by Vaswani et al. (2017) has been adapted for multiscale object detection, as demonstrated by Zhu et al. (2021) in enhancing YOLOv5’s prediction network [28,29]. Addressing shape variations, strategies involve adjusting anchor boxes [30,31] and employing deformable convolutions [32,33,34], though these add complexity and hinder model training [35,36,37,38]. While key point-based detection models [39,40,41,42,43] offer an alternative, they still lag in accuracy, signaling a need for improvement. This study integrates attention mechanisms and advanced feature extraction techniques within the RetinaNet framework [44,45,46,47], targeting the nuanced challenges of WWTP detection in remote sensing imagery.

2.2. Semantic Segmentation Based on Deep Learning

Attention mechanisms, crucial for extracting global features beyond the reach of traditional convolutional neural networks (CNNs), have seen rapid advancements in deep learning. Initially spotlighted by Mnih et al. (2014) for text analysis, these mechanisms were quickly adapted to visual tasks [48]. Jaderberg et al. (2015) and Hu et al. (2020) introduced spatial and channel attention mechanisms, respectively, enhancing feature extraction across spatial and channel dimensions [49,50]. Dosovitskiy et al. (2017) further leveraged self-attention for visual tasks, achieving breakthrough results on the ImageNet classification challenge [51]. The integration of attention mechanisms into deep learning models, such as U-Net by Guo et al. (2020) for building extraction and a dual attention model by Wan et al. (2021) for road extraction from remote sensing images, underscores their effectiveness in land feature analysis [52,53]. These developments, along with advances in semantic segmentation [54,55,56,57,58], have significantly improved the extraction of land features from remote sensing imagery, showcasing the potent synergy between attention mechanisms and semantic segmentation in the domain of remote sensing.

2.3. Extraction Methods for WWTPs

Recent advancements in deep learning have revolutionized object detection [59,60,61]. However, traditional supervised learning methods face challenges in remote sensing applications due to data limitations and time constraints. Zhang et al. (2019) proposed a training-free, one-shot geographical spatial object detection framework inspired by human learning [62]. Sun et al. (2021) introduced Partial-based Convolutional Neural Networks (PBNet) for detecting complex targets, including WWTPs [63]. Their dataset covered seven cities in the Yangtze River Basin, showcasing PBNet’s superior performance [64]. These innovations address the complexities of WWTP detection, offering effective solutions for remote sensing tasks with limited data.
However, current WWTP recognition research often focuses solely on individual plant identification, lacking comprehensive analysis and failing to address diverse plant shapes [65,66]. Existing algorithms struggle with sample quantity and lack integrated geographical analysis. To tackle these shortcomings, this study introduces a multi-attention mechanism-based WWTP recognition network, leveraging high-resolution remote sensing data. It incorporates a spatial-scale attention module and a global-local feature segmentation network to extract key facility information. Statistical analysis of WWTPs, including treatment capacity relative to area and geographical factors, provides a holistic understanding of water distribution and residential areas [65,66].

3. Methodology

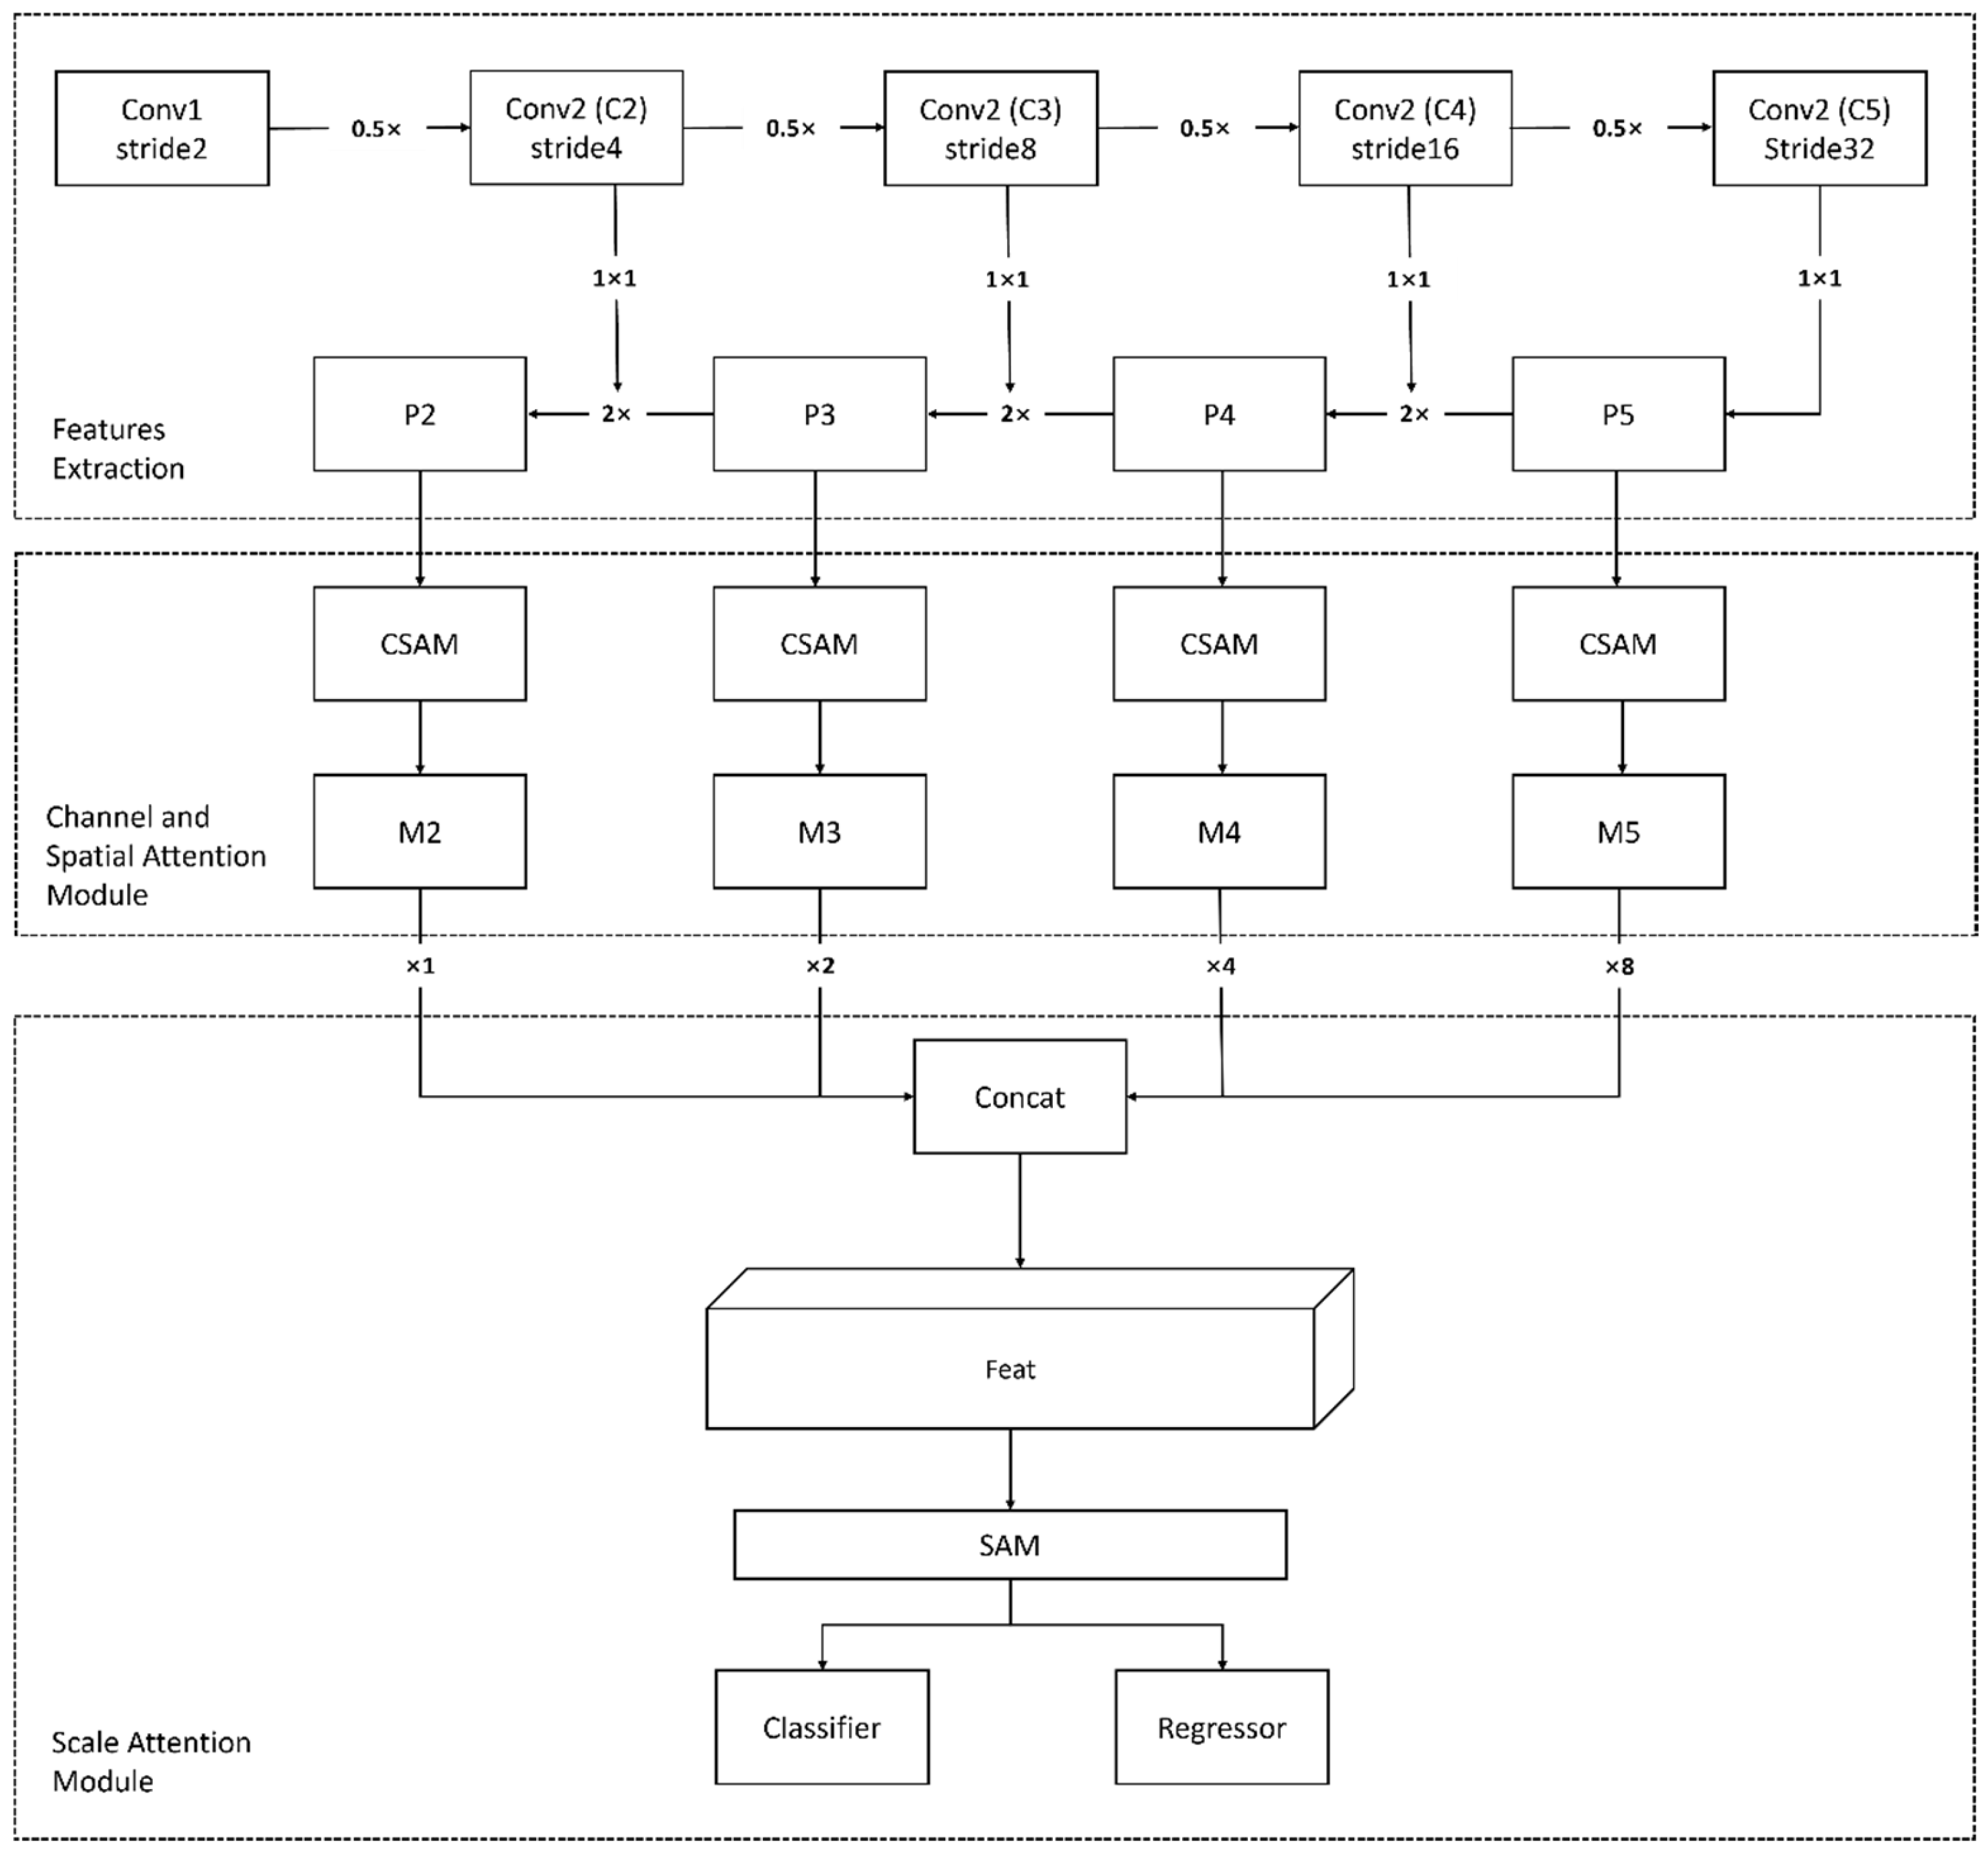
3.1. Multi-Attention Network

To achieve accurate extraction of WWTPs in Beijing, we conducted experiments utilizing the multi-attention network (MANet) proposed by Shuai et al. (2023), based on labeled samples from GF-1 and GF-2 satellite data [3]. The overall structure of MANet is illustrated in Figure 1 and consists of three primary components: (1) A feature extraction module, which employs a backbone to generate multi-scale feature maps; (2) A channel-spatial attention module, which includes both spatial attention and channel attention sub-modules, focusing on capturing optimal target features across spatial and channel dimensions; and (3) A scale attention module, which operates exclusively in the feature layer dimension, determining the relative significance of different semantic layers and boosting features at the appropriate scale of the object.
In MANet, the feature extraction process utilizes ResNet50 combined with an FPN structure to capture low-resolution features from RGB images of dimensions H × W × 3, while generating multi-scale feature maps through various stage strides (S = 4, 8, 16, 32). The attention mechanism in MANet includes two key components: the channel-spatial attention module (CSAM) and the scale attention module (SAM). The channel attention and spatial attention modules gather spatial and channel information from the feature maps using pooling operations, producing the final attention-enhanced feature maps for both spatial and channel dimensions. The scale attention module adaptively integrates features from different scales, based on semantic information, to generate the scale-aware feature maps.

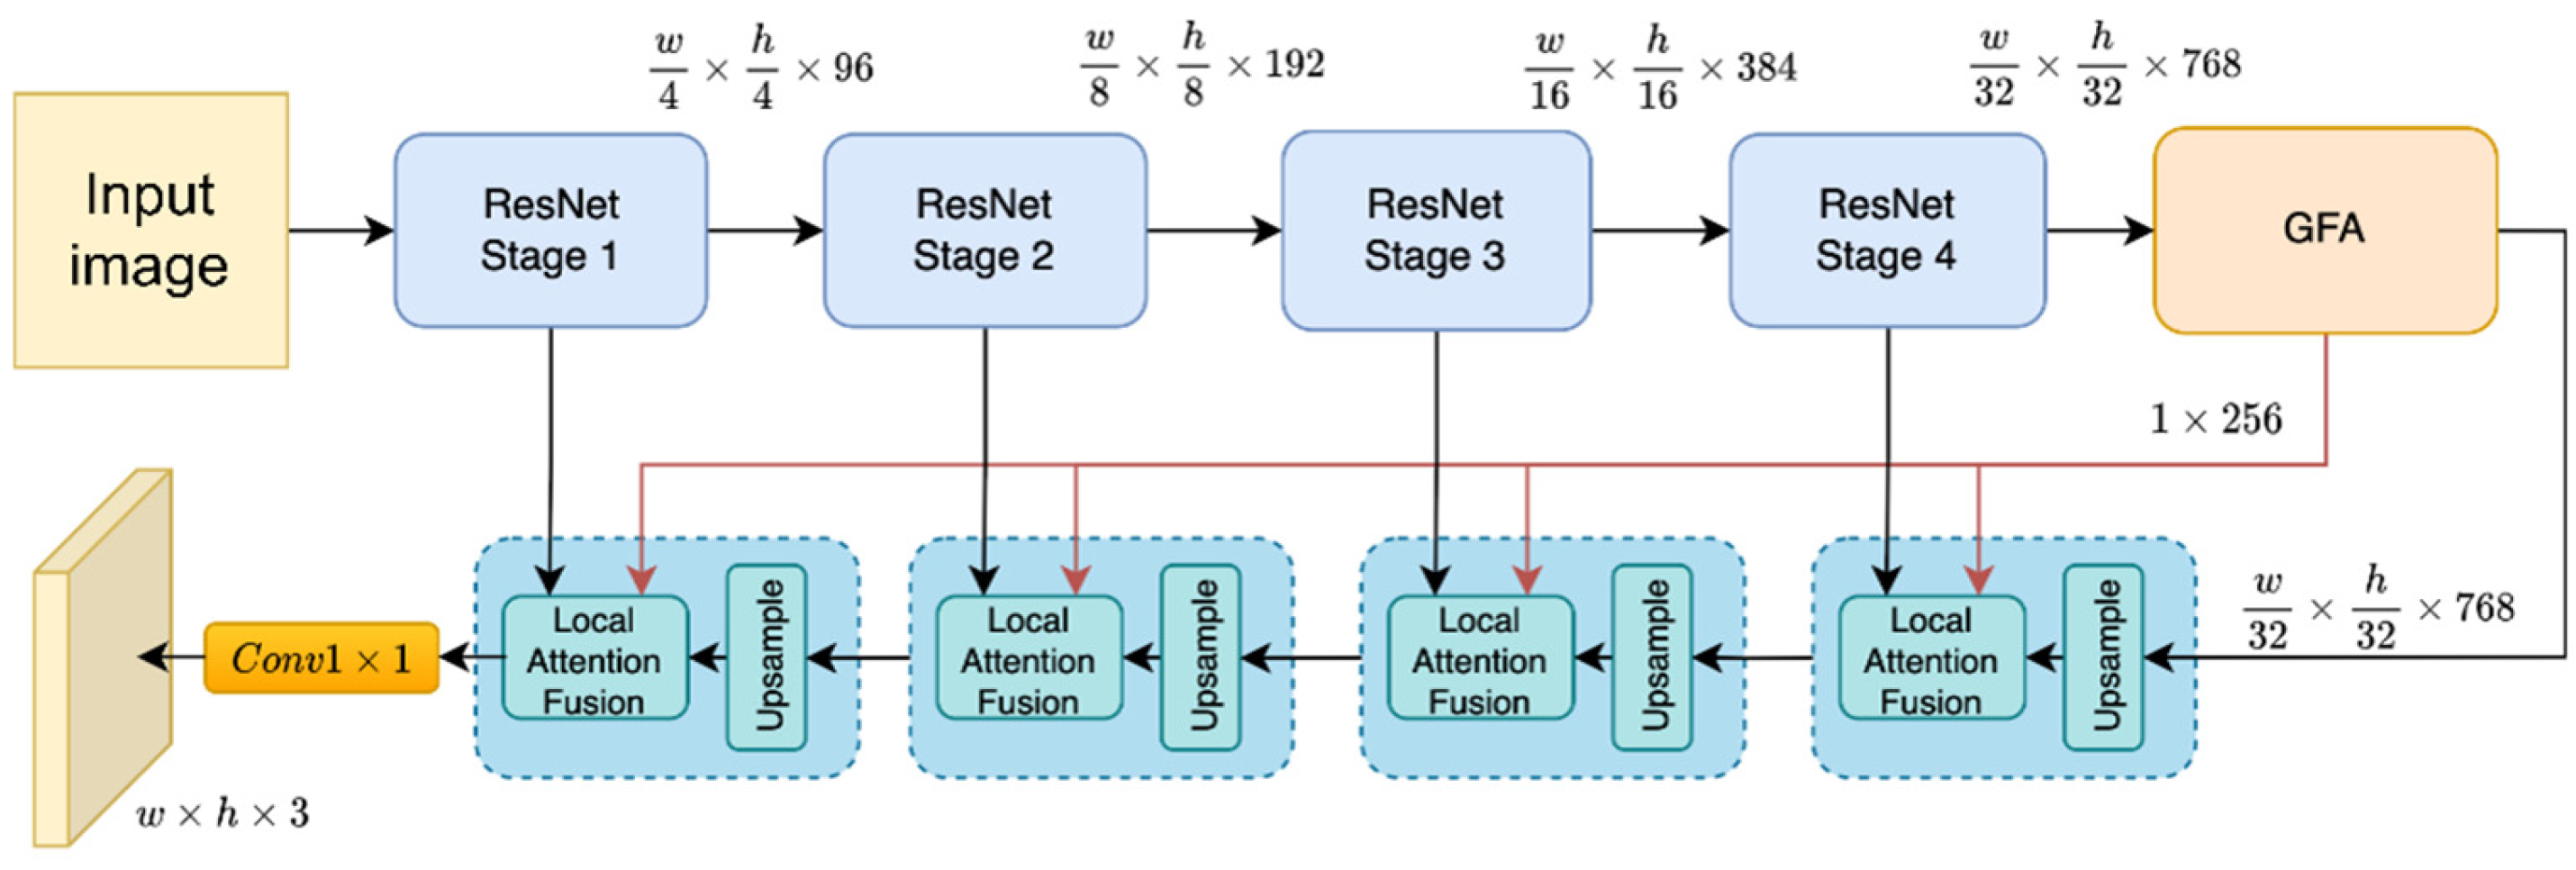
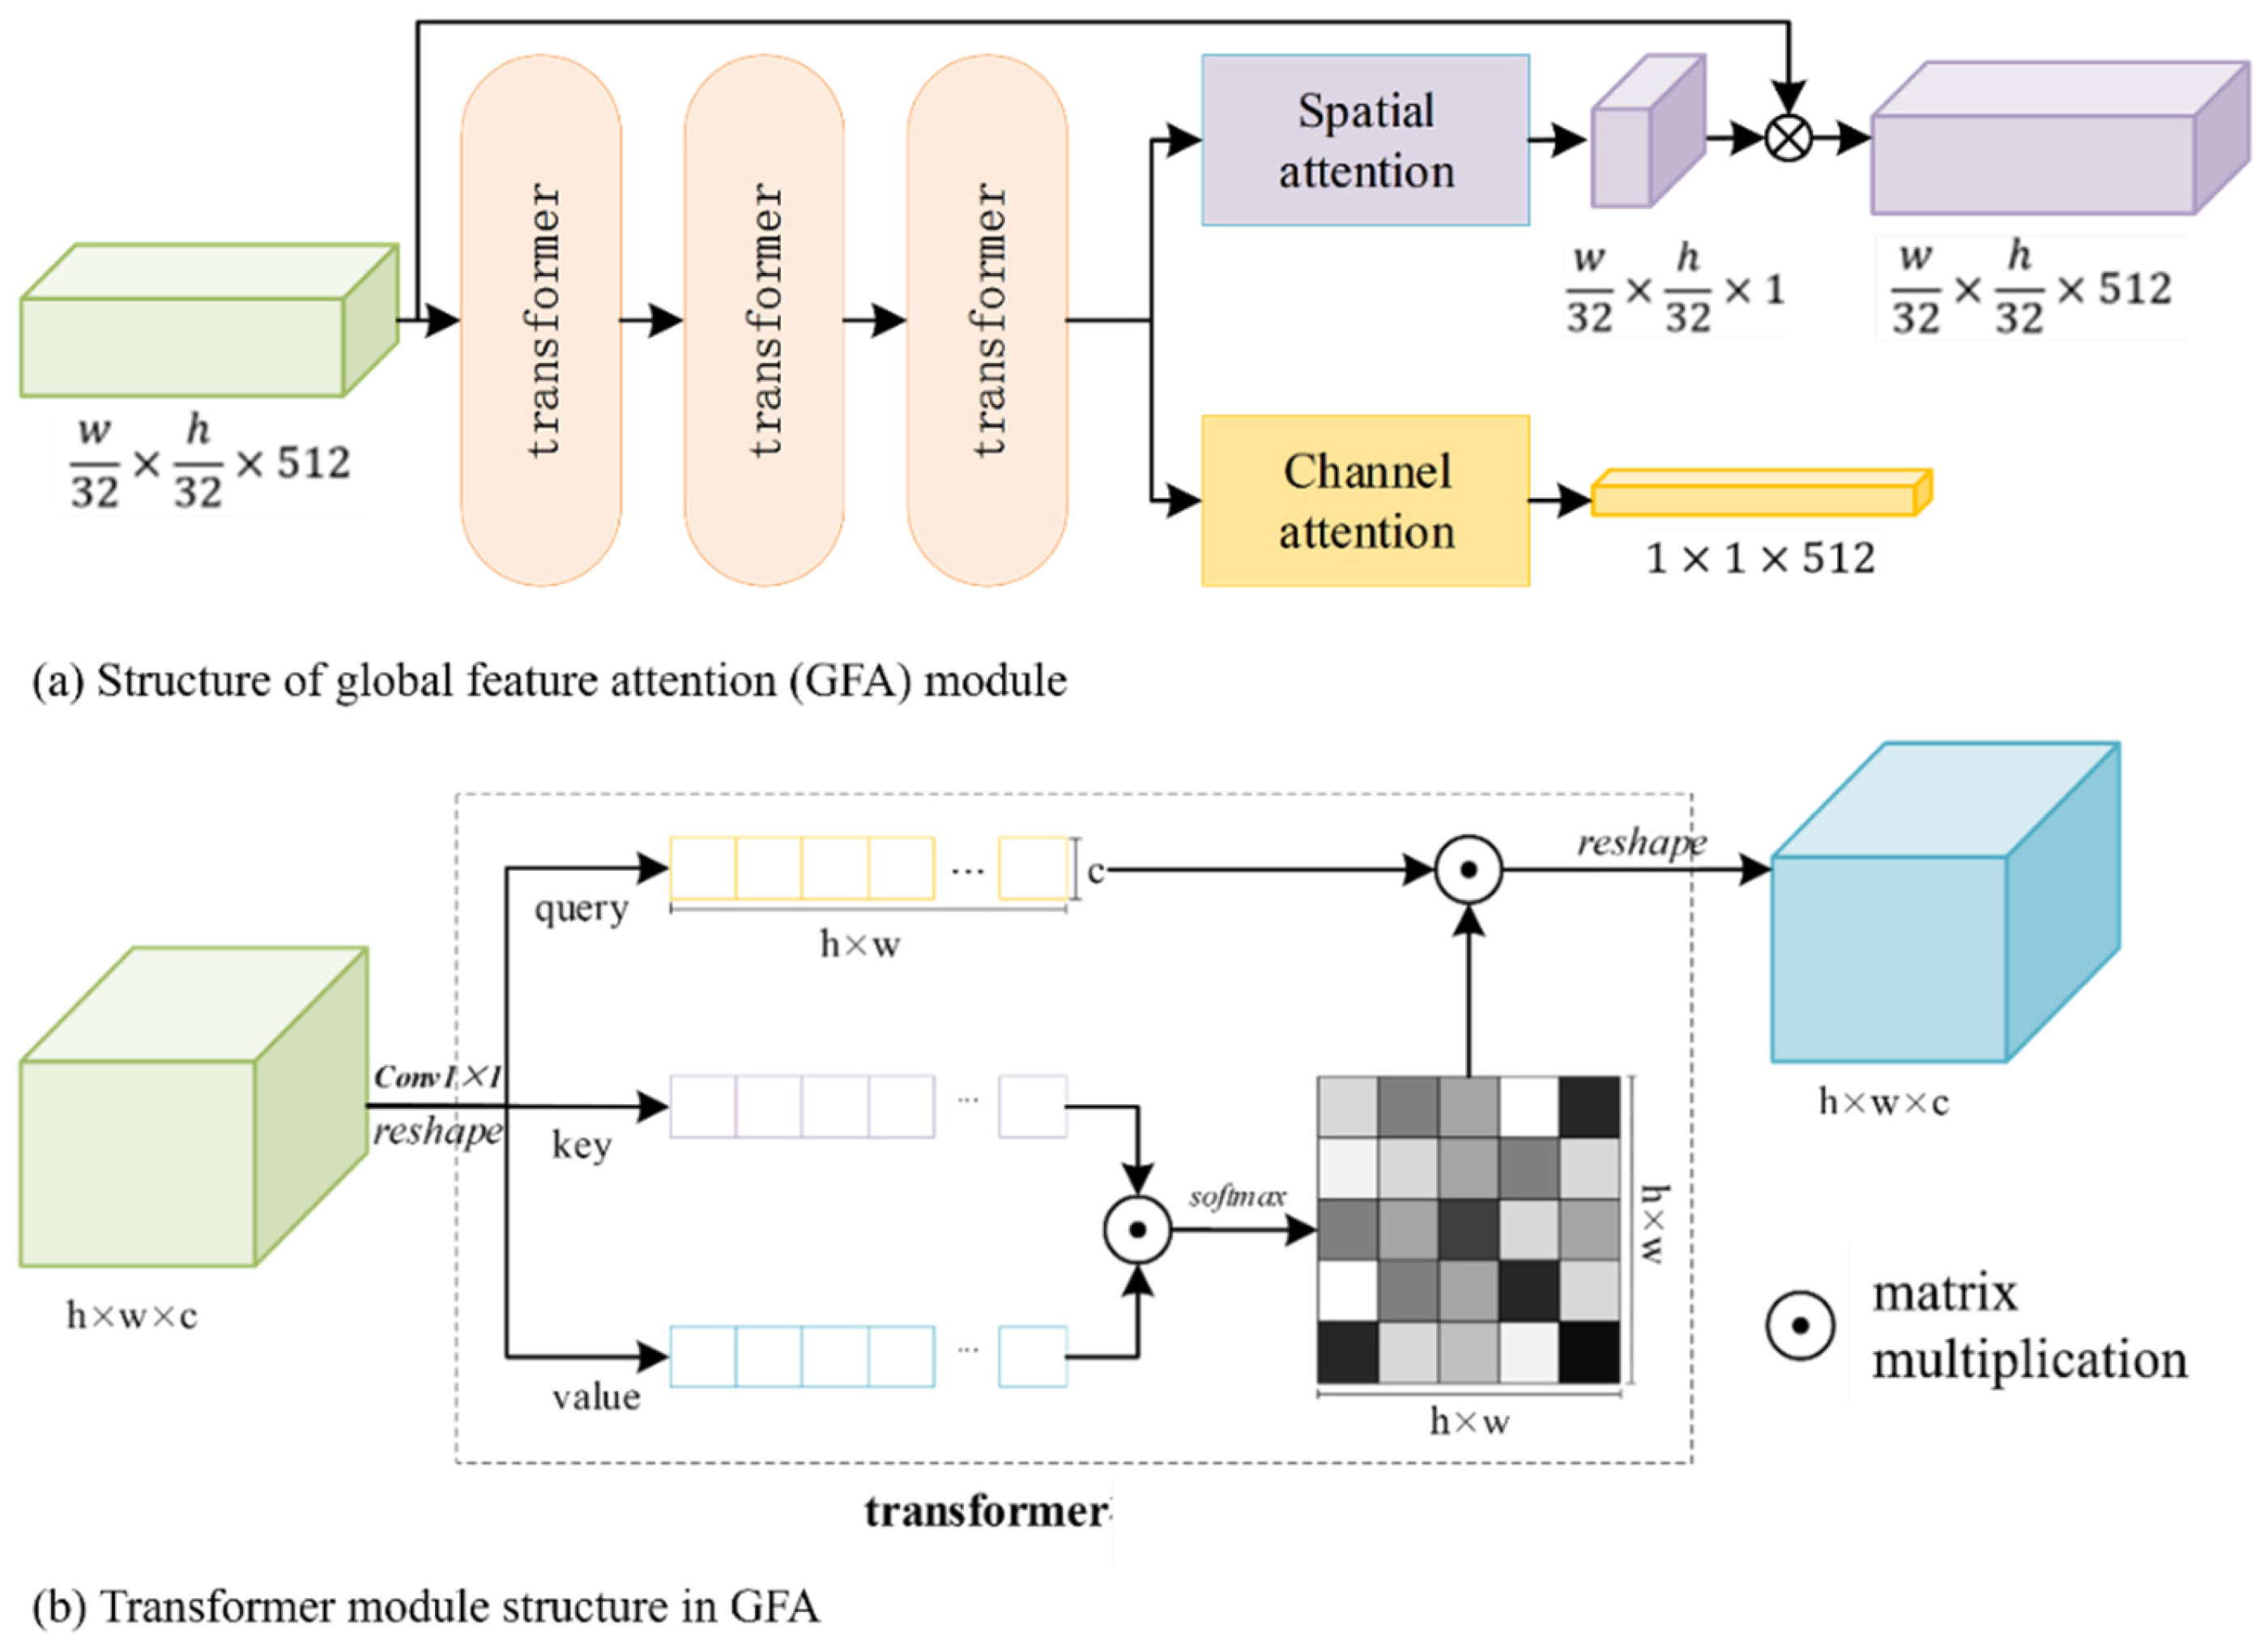
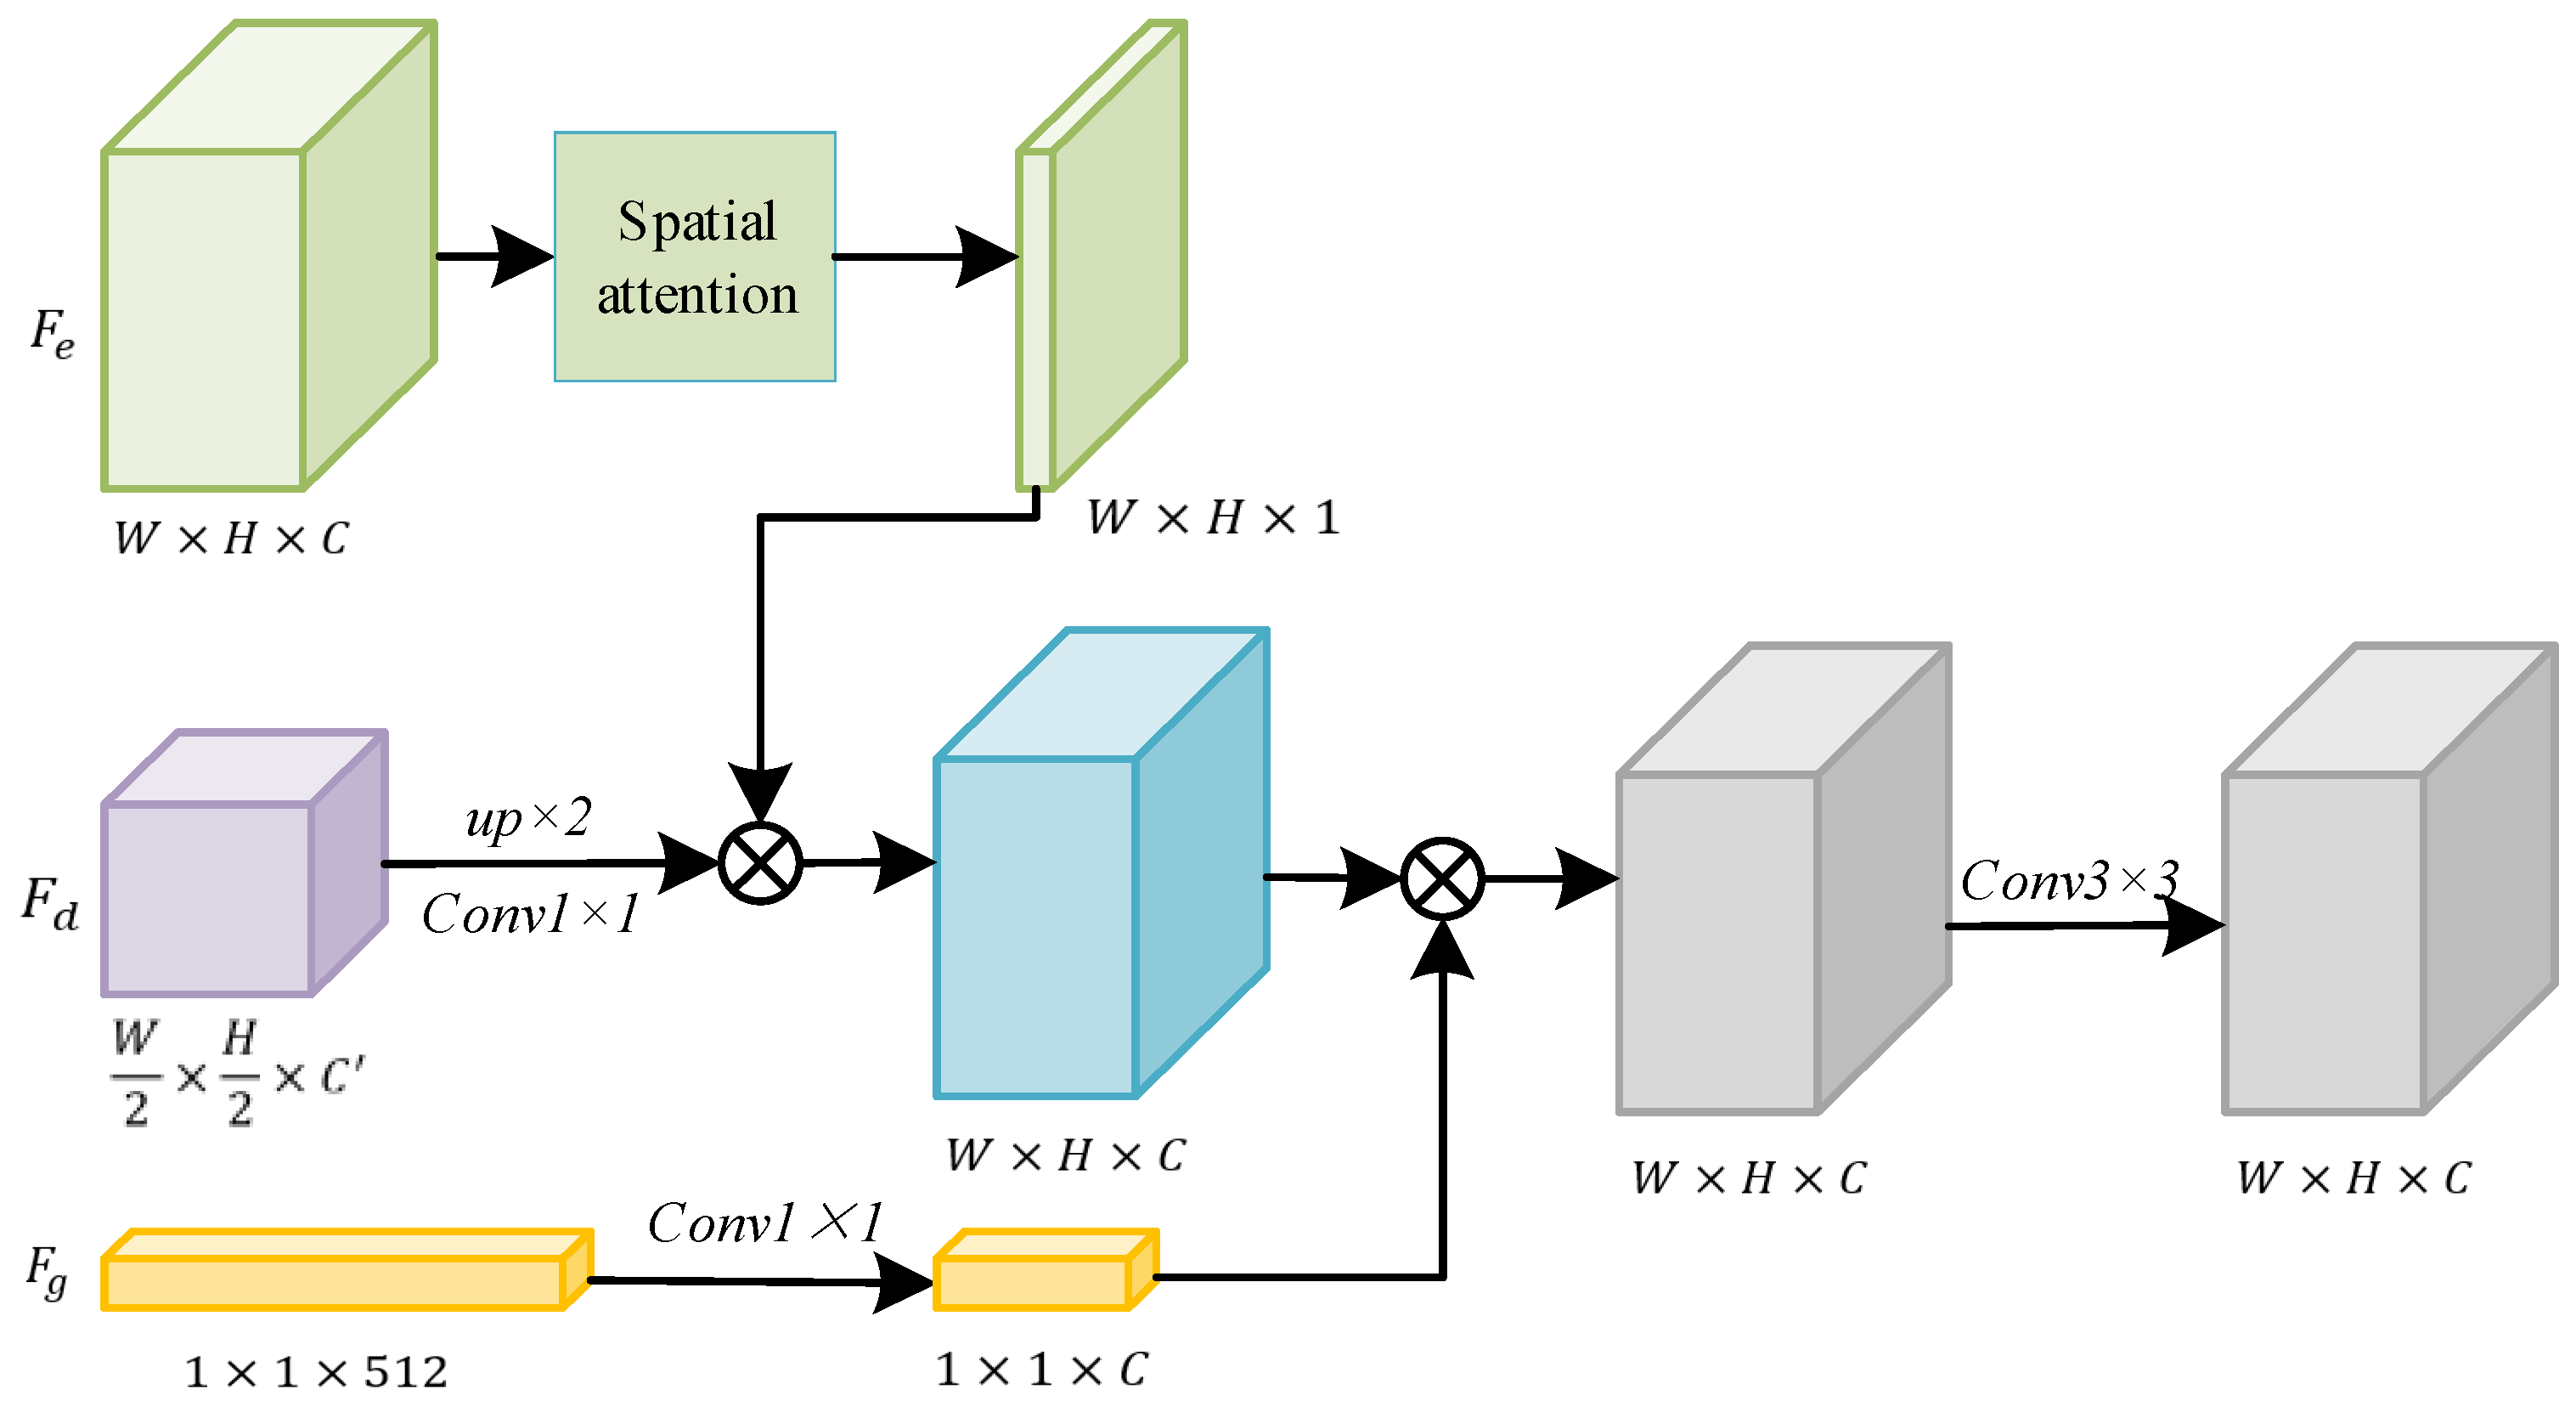
3.2. Global-Local Feature Modelling Network

The overall structure of the Global-Local Feature Modeling Network (GLMFN) employed in this study is illustrated in Figure 2. The network adopts a common encoder-decoder architecture. Image slices are fed into the ResNet-34 [67] encoder to extract multi-level features, obtaining deep features at four different levels. The shapes of these features are w 4 , h 4 , 64 , w 8 , h 8 , 128 , w 16 , h 16 , 256 , w 32 , h 32 , 512 , where w and h represent the height and width of the input image, respectively. After feature extraction by the encoder, this study first employs a Global Feature Attention Module (GFA) on the deepest feature level to compute global feature dependencies and crucial feature channel information, acquiring information about the overall distribution of objects in the scene. Subsequently, deep features along with global features are input into a decoder based on cascaded local attention guidance (Local Feature Attention Decoder, LFA). Layer by layer, deep features, shallow features, and global features are combined, ultimately completing the decoding of features. The terminal features of the decoder are processed through a simple semantic segmentation head to produce probability maps of key facilities. The probability maps undergo normalization using the Softmax function, where each channel represents the probability of belonging to a specific land cover class.
The GFA Module is designed for the complex key facilities of wastewater treatment plants. It utilizes transformer modules to extract features based on a global receptive field and enhances spatially effective features and channel-wise effective features through spatial and channel attention modules under the global receptive field. As shown in Figure 3, three transformer modules are first used to obtain the global receptive field. After passing through the spatial attention and channel attention modules, spatial and channel weight features are obtained for the subsequent decoding process. The transformer module used in this study employs a self-attention mechanism, constructing queries, keys, and values from input features. It calculates the correlation of each feature vector in spatial positions through matrix operations, enhances features of similar objects, and obtains global receptive field information.
In the decoding stage of GLFMN, a cascaded LFA is designed (Figure 4). LFA takes the deep features output by GFA and progressively fuses them with encoder features and global features. The encoder features are treated as skip connections in the network, aiding in the recovery of lost spatial detail information in the deep features.
In Figure 4, F e represents encoder features, F d represents decoder features, and F g represents spatial global features output by the channel attention module of GFA. During the decoding process, deep features are first upsampled and processed with 1 × 1 convolutions to match the shape of the encoder features. For the encoder features F e , they first undergo spatial attention module to obtain spatial attention maps based on local receptive fields. Subsequently, the spatial attention maps are multiplied with F d to obtain decoded features with enhanced spatial information. Meanwhile, the global features F g are initially processed with 1 × 1 convolutions to unify the channel numbers with the other two branch features. Then, they are multiplied with each position of the same channel, completing channel enhancement based on global features. Finally, F d is directly output after undergoing simple 3 × 3 convolutions as the output of the current level. In the decoding stage, after four LFA modules, deep features gradually recover spatial information and eventually output the extracted results through a simple segmentation head. This process is expressed as follows:
F d = C o n v 1 × 1 ( f ( F d , 2 ) )
F d = F d × f s p a t i a l ( F e )
F d = F d × C o n v 1 × 1 ( F g )
where C o n v 1 × 1 denotes a 1 × 1 convolution; f , 2 represents 2× upsampling of the input feature; f s p a t i a l represents the spatial attention module.
In terms of the loss function, we use a combination of focal loss [25,67] and dice loss [35], and apply class weighting for different label categories. Focal loss is essentially a loss function that addresses the issues of class imbalance and difficulty in classification in classification problems. Dice loss is a loss function directly constrained by the dice coefficient, which can be used to address the problem of classifier bias towards dominant classes caused by differences in pixel proportions between different classes. In addition, to enhance the constraint on the primary settling tank and counteract the abundance of easily confused objects, we introduce class weights of w = { 0.7 , 0.3 } into the calculation of the loss functions for different categories. The two functions and the overall loss function expression are as follows:
F L i = a l p h a i 1 p i g a m m a log ( p i )
d i c e i = 1 2 × X i Y i X i + Y i
l o s s = i = 0 0 , 1 w i × ( F L i + d i c e i )
where p i represents the probability of a certain pixel belonging to the i-th category, a l p h a i and g a m m a are parameters; X i and Y i respectively denote the predicted results and labels for the i-th category, and denotes the intersection operation between labels and predicted results. When considering the land degradation and land restoration based on those land cover maps, large differences can be found within the two phases.
The 0.7 to 0.3 weight ratio was set to address the imbalance between the target and background in the samples, as well as the features of objects that are prone to confusion. In the task of extracting key facilities from sewage treatment plants, there are numerous easily confusable objects, and there are significant differences in difficulty across different types of facilities. Among the two key facilities, the primary sedimentation tank has more complex morphological structures and confusable objects compared to the secondary sedimentation tank, which requires more attention during the loss function calculation. The 0.7 to 0.3 weight ratio was determined based on existing data and extensive pre-experiments. This configuration effectively improves the model’s accuracy in recognizing key facilities in sewage treatment plants, while maintaining a high recall rate, especially in addressing the class imbalance issue (e.g., the significant difference in sample proportions between the target and the background). Specifically, through comparative experiments, we found that setting a higher weight (0.7) for the target category to enhance its influence and a lower weight (0.3) for the background to reduce unnecessary interference resulted in an ideal balance between Average Precision (AP) and Average Recall (AR) metrics. This weight combination demonstrated good convergence and stability during network training, and the current results sufficiently confirm the rationality of this configuration.

4. Experiments

4.1. Study Area

Beijing is located in northern China (115.7–117.4°E, 39.4–41.6°N), with a total area of 16,410.54 km2 (Figure 5). As China’s capital, it has a distinctive urban layout following a “ring-axis-cluster” pattern, radiating outward in concentric circles. The majority of WWTPs are concentrated around urban regions, reflecting the city’s spatial structure. Beijing’s diverse topography and unique urban arrangement contribute to its varied geographical features. Gaining an understanding of Beijing’s geographical context and analyzing the relationship between the distribution of WWTPs and the city’s physical characteristics are essential for research in this field.

4.2. Data Acquisition

  • Remote Sensing Data: For this research, we utilized GF-2 satellite data as the basic source of remote sensing imagery, which offers high spatial, temporal, and radiometric resolution. To ensure the WWTPs are clearly identifiable in high-resolution imagery, we employed 2-m resolution products from China’s domestically developed GF-2 satel-lite to create the WWTP sample dataset. The remote sensing data consisted of 1-m and 2-m resolution images from GF-1 (2020) and 2-m resolution images from GF-2 (2019). A total of 110 images from a single year were selected to cover the entire study area. Ad-ditionally, the chosen data had minimal cloud cover, reducing cloud interference in in-terpreting the remote sensing images.;
  • Waste Water Treatment Facility Data: The information from the 2020 “The National List of Centralized Waste Water Treatment Facilities”, published by the Ministry of Ecology and Environment, was sourced from the China Urban Water Association’s official website (https://www.cuwa.org.cn/, accessed on 12 December 2023). The statistical data were gathered in 2019. Centralized wastewater treatment plants are essential infrastructure for reducing water pollution. Based on the data released by the Ministry, the second batch of the “The National List of Centralized Waste Water Treatment Facilities”, which includes plants with a design capacity of 500 tons/day or more, shows that Beijing has 176 urban WWTPs in total.;
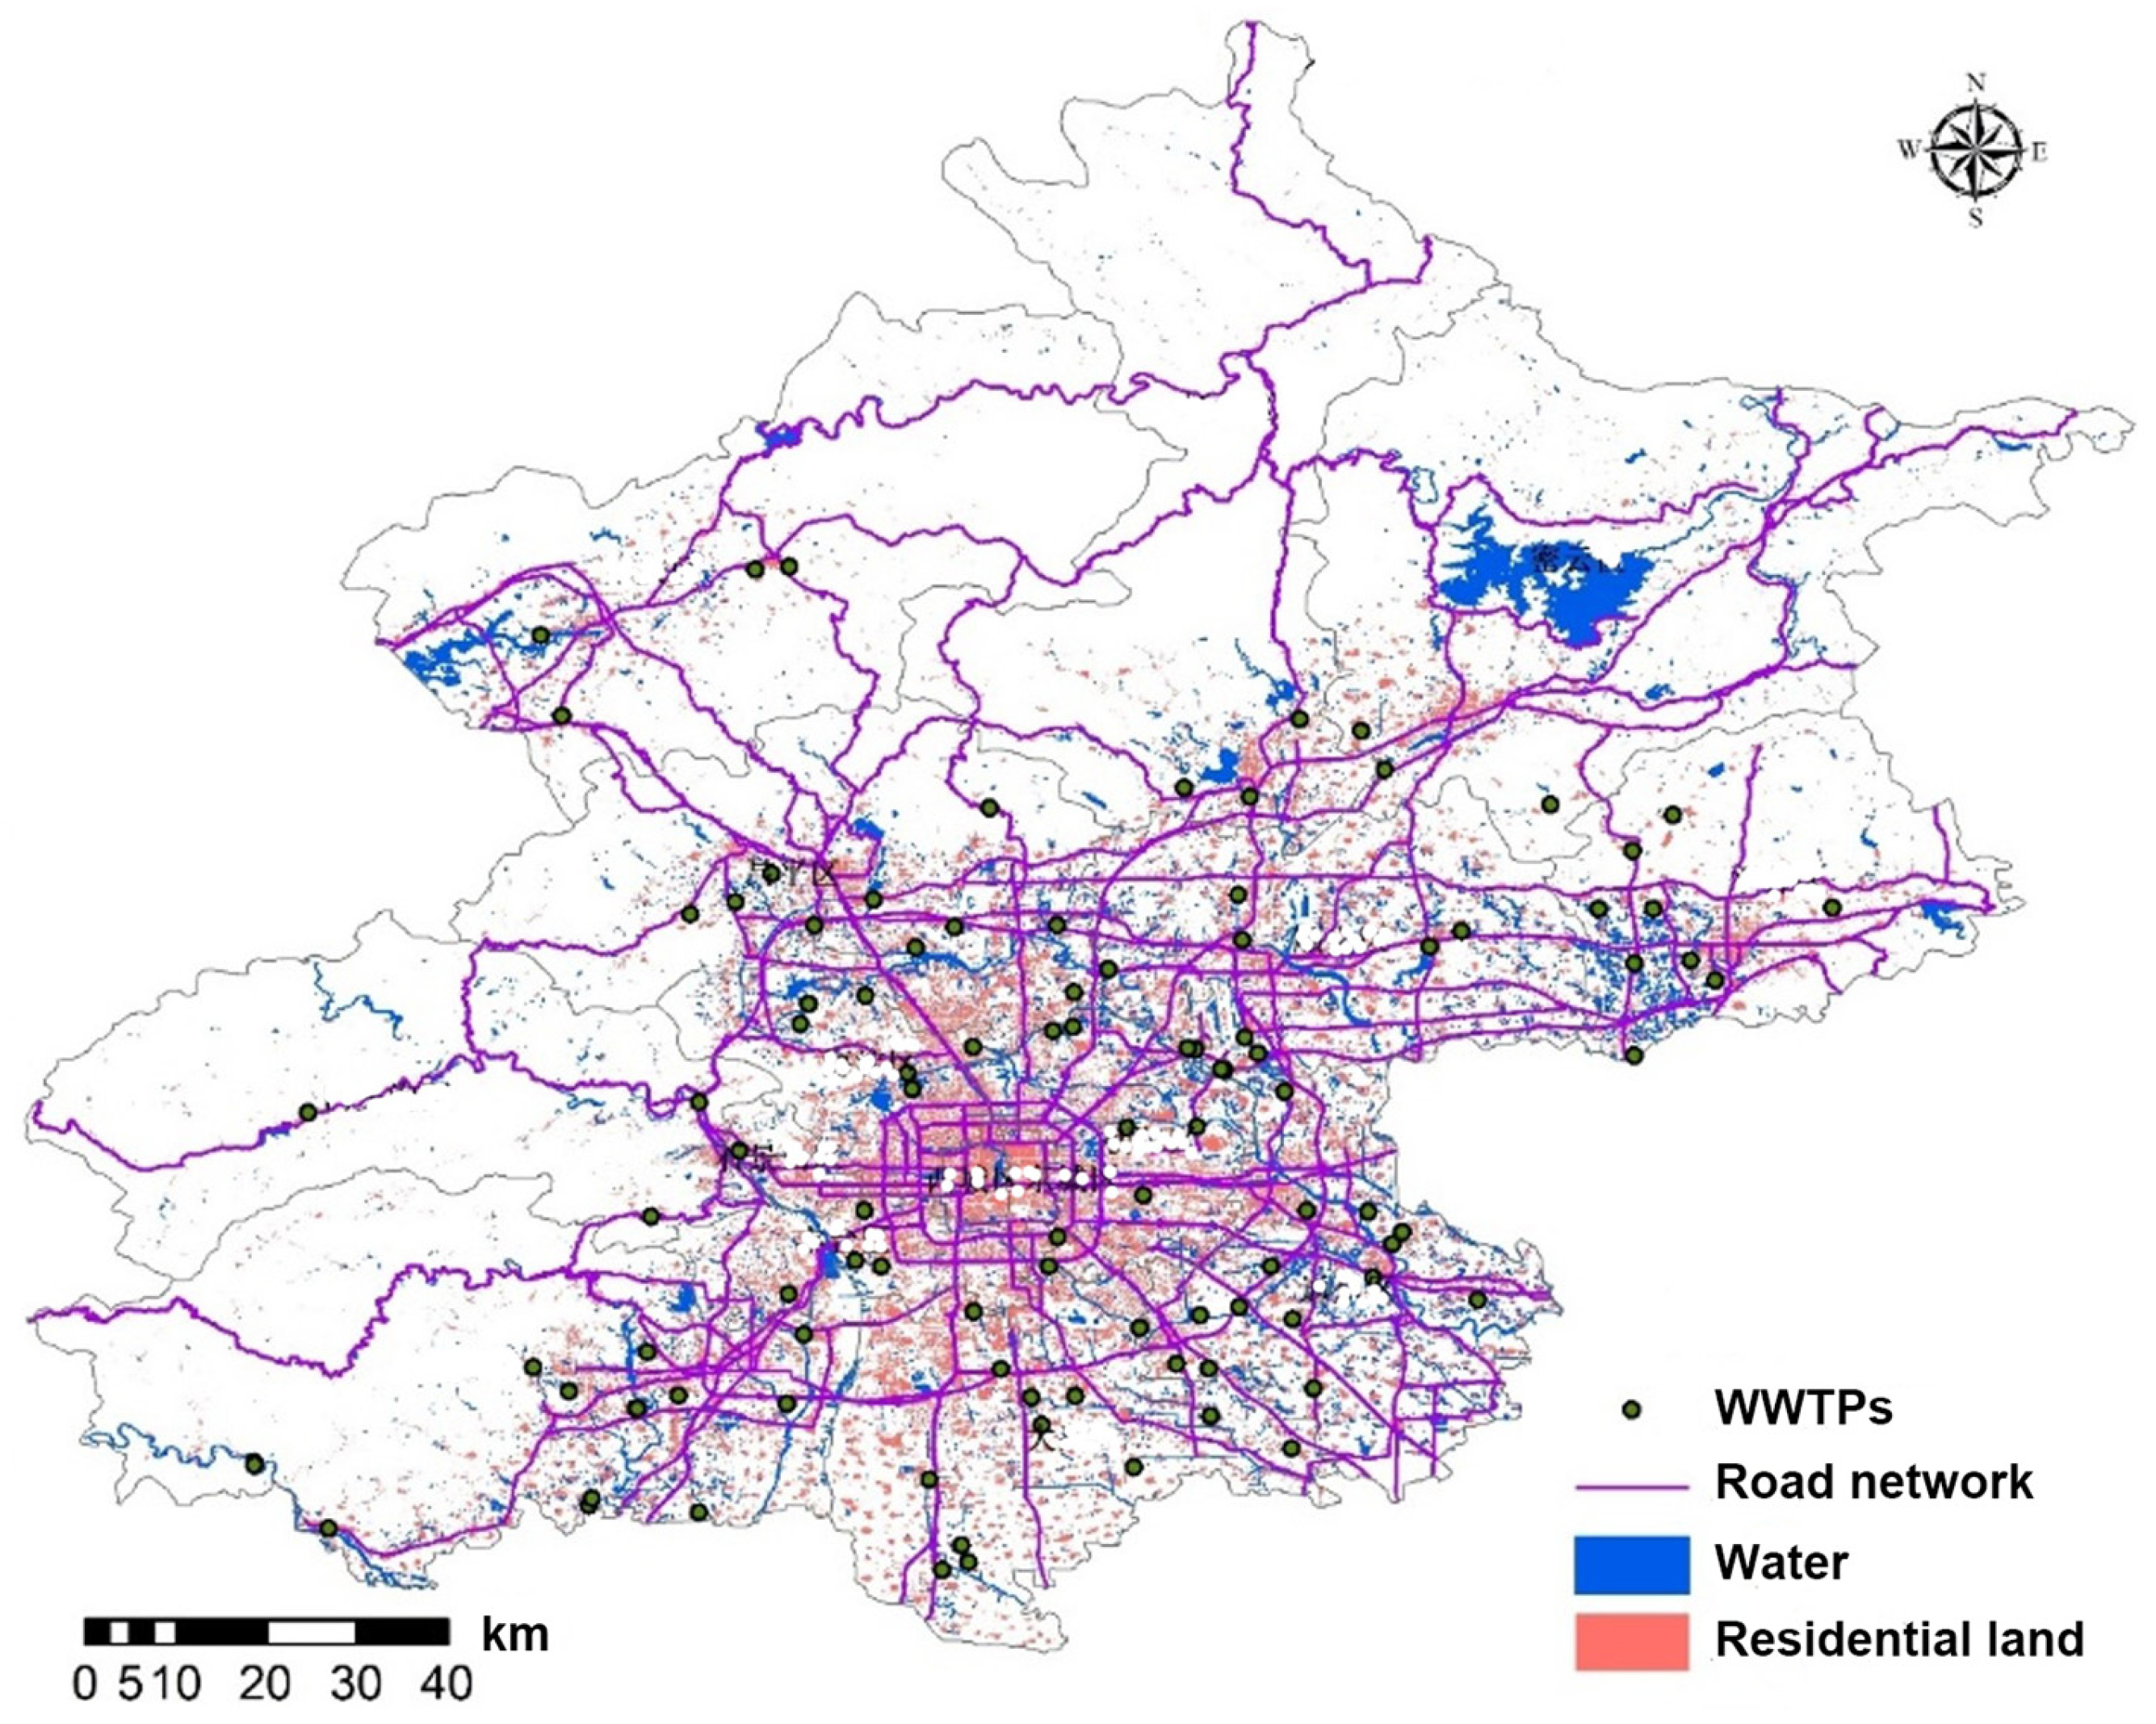
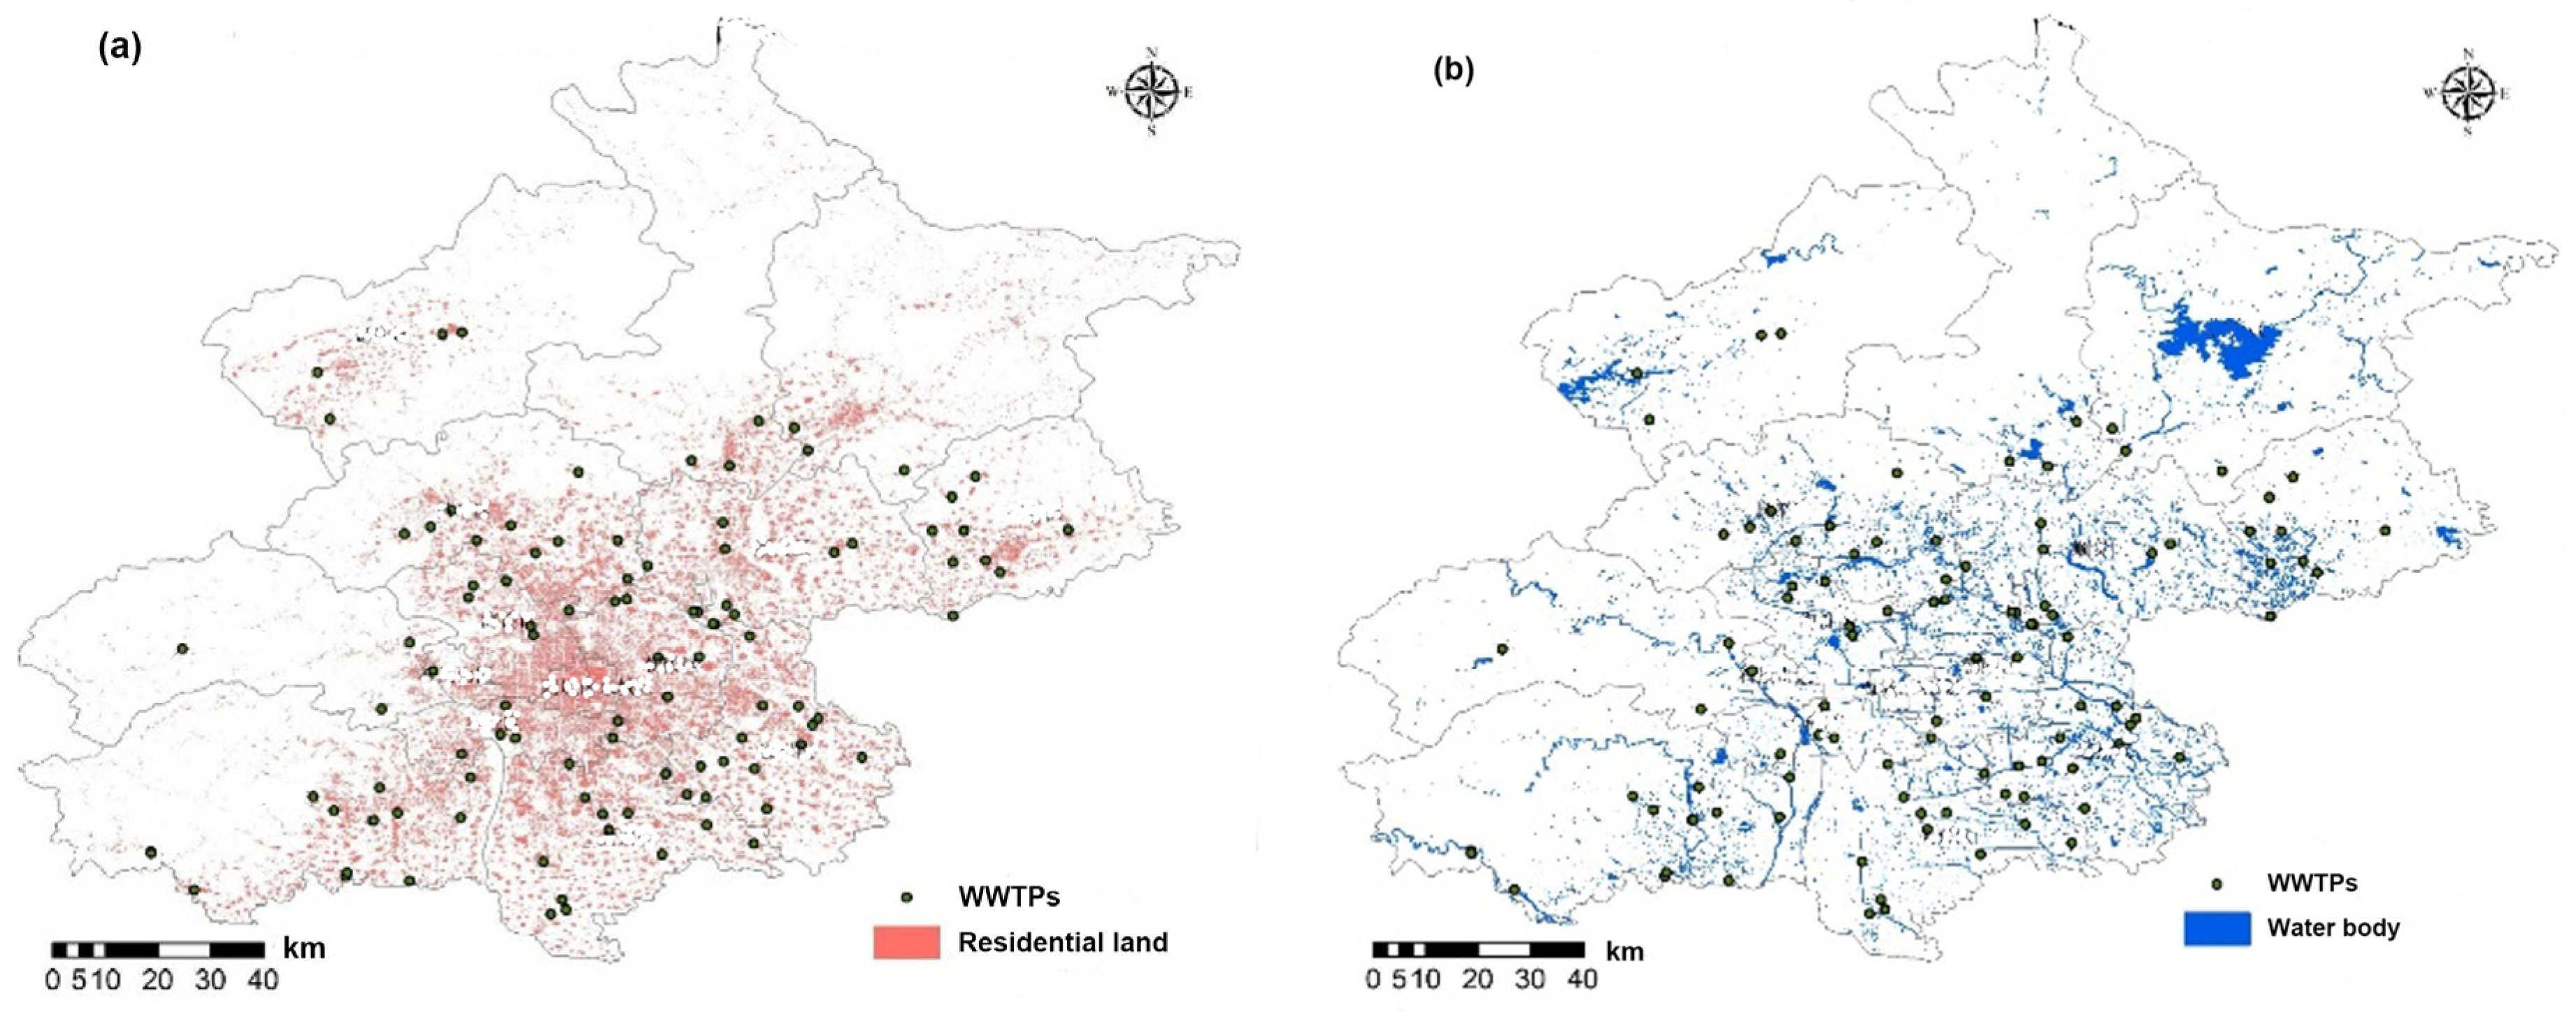
  • Distribution of Residential Land and Water in Beijing: In this study, residential land and water of Beijing were accurately extracted through the integration of high-resolution satellite remote sensing imagery data and advanced deep learning methods.

4.3. Dataset Production of WWTPs

Prior to model training, to enhance the clarity, contrast, and positional accuracy of the original images, we subjected the acquired remote sensing images to adaptive histogram linear stretching and orthorectification based on an improved rational polynomial function, ultimately employing panchromatic sharpening to process the multispectral images. Additionally, to amass a sufficient dataset for the precise identification of wastewater treatment plants, we manually collected point slice images of 2000 wastewater treatment plants from regions including Guangdong, Jiangsu, Sichuan-Chongqing, and Beijing to generate training samples. In the process of sample annotation, we established a marking method tailored for wastewater treatment plant targets, centering on circular and rectangular sedimentation tanks, and drew the smallest area horizontal boundary rectangles.

4.4. Experimental Setup and Sample Training

The experimental environment was conducted on an Ubuntu 16.04.7 LTS system, using an RTX 3090 GPU with 24 GB VRAM. All models were implemented in the PyTorch 2.0 framework, and the model parameters remained consistent during the training and prediction stages. The experiment was conducted for a total of 12 epochs. According to the network requirements, a pre-trained model was used. The training used a stochastic gradient descent (SGD) optimizer with an initial learning rate of 0.01. To enhance the optimization effect, the momentum parameter was set to 0.9 and the weight decay parameter was set to 0.0001, which helped convergence and data fitting. In order to improve the generalization ability of the model under different conditions, we used standard data augmentation techniques, such as random flipping, resizing, and cropping of images.
Before inputting the samples into the network, we first applied data-augmentation operations to improve the model’s ability to extract WWTPs under varying scenarios. We began with common augmentation strategies—random rotation and random scaling. To further increase sample complexity, we then adopted a copy-and-paste augmentation strategy and an object-level semantic-segmentation augmentation strategy. In the copy-and-paste approach, target objects in the training set are duplicated and pasted into other images, combining information from multiple scenes to effectively broaden the range of contexts in which each object appears. The object-level pipeline proceeds as follows: using semantic labels, each image is split into object and background layers; traditional augmentations (scaling, translation, rotation) are applied exclusively to the object layer; and the augmented objects are finally recombined with their original backgrounds. This object-level augmentation not only enriches the diversity of the training data but also ensures that the model can robustly recognize targets of varying shapes against the same background.
Because the training samples vary in size, we standardized them before training. Any image whose width or height was under 256 pixels was padded by mirroring its edges. From each padded image, we then randomly cropped a 256 × 256 patch for network training. During inference, we apply the same mirror-padding and random-crop preprocessing to each sample.

4.5. Results and Analysis

4.5.1. The Efficiency of MANet

Following the methodology from Shuai et al. (2023) [3], a confusion matrix was employed to assess the accuracy of MANet in detecting WWTPs in Beijing. The matrix’s key metrics, including true positives (TP), false positives (FP), false negatives (FN), and true negatives (TN), were used to compute precision (AP) and recall (AR), which served as the final evaluation measures for identifying WWTPs. Specifically, AP refers to the proportion of correctly identified wastewater treatment plant patches among the total predicted patches, while AR measures the proportion of correctly identified patches against the total target patches.
To assess the practical effectiveness of MANet, the trained model was applied to detect WWTPs using 2-m resolution GF-2 satellite images in real-world conditions. The extracted results were compared with manually counted actual values, and the detection performance was evaluated using a confusion matrix. Detection was conducted at thresholds of 0.5, 0.6, 0.7, 0.8, and 0.9, with the results shown in Table 1. The actual WWTP count was based on official data from the centralized treatment facility list in Beijing, excluding a few smaller indoor WWTPs after a thorough analysis of the remote sensing data. At a threshold of 0.5, the model detected 143 WWTPs, but with a high number of false positives, leading to the lowest precision of 60.9% and a recall of 94.7%. On the other hand, when the threshold was increased to 0.9, the number of predicted WWTPs was lower, but precision improved to 71.5%, with a recall of 81.4%.
We selected some WWTP targets from the detection results to assist in illustration, as shown in Figure 6. It can be observed that MANet can effectively overcome the challenges posed by the varying shapes, scales, and inconsistent local features of WWTPs. With good generalization performance, it achieves accurate detection of WWTPs.

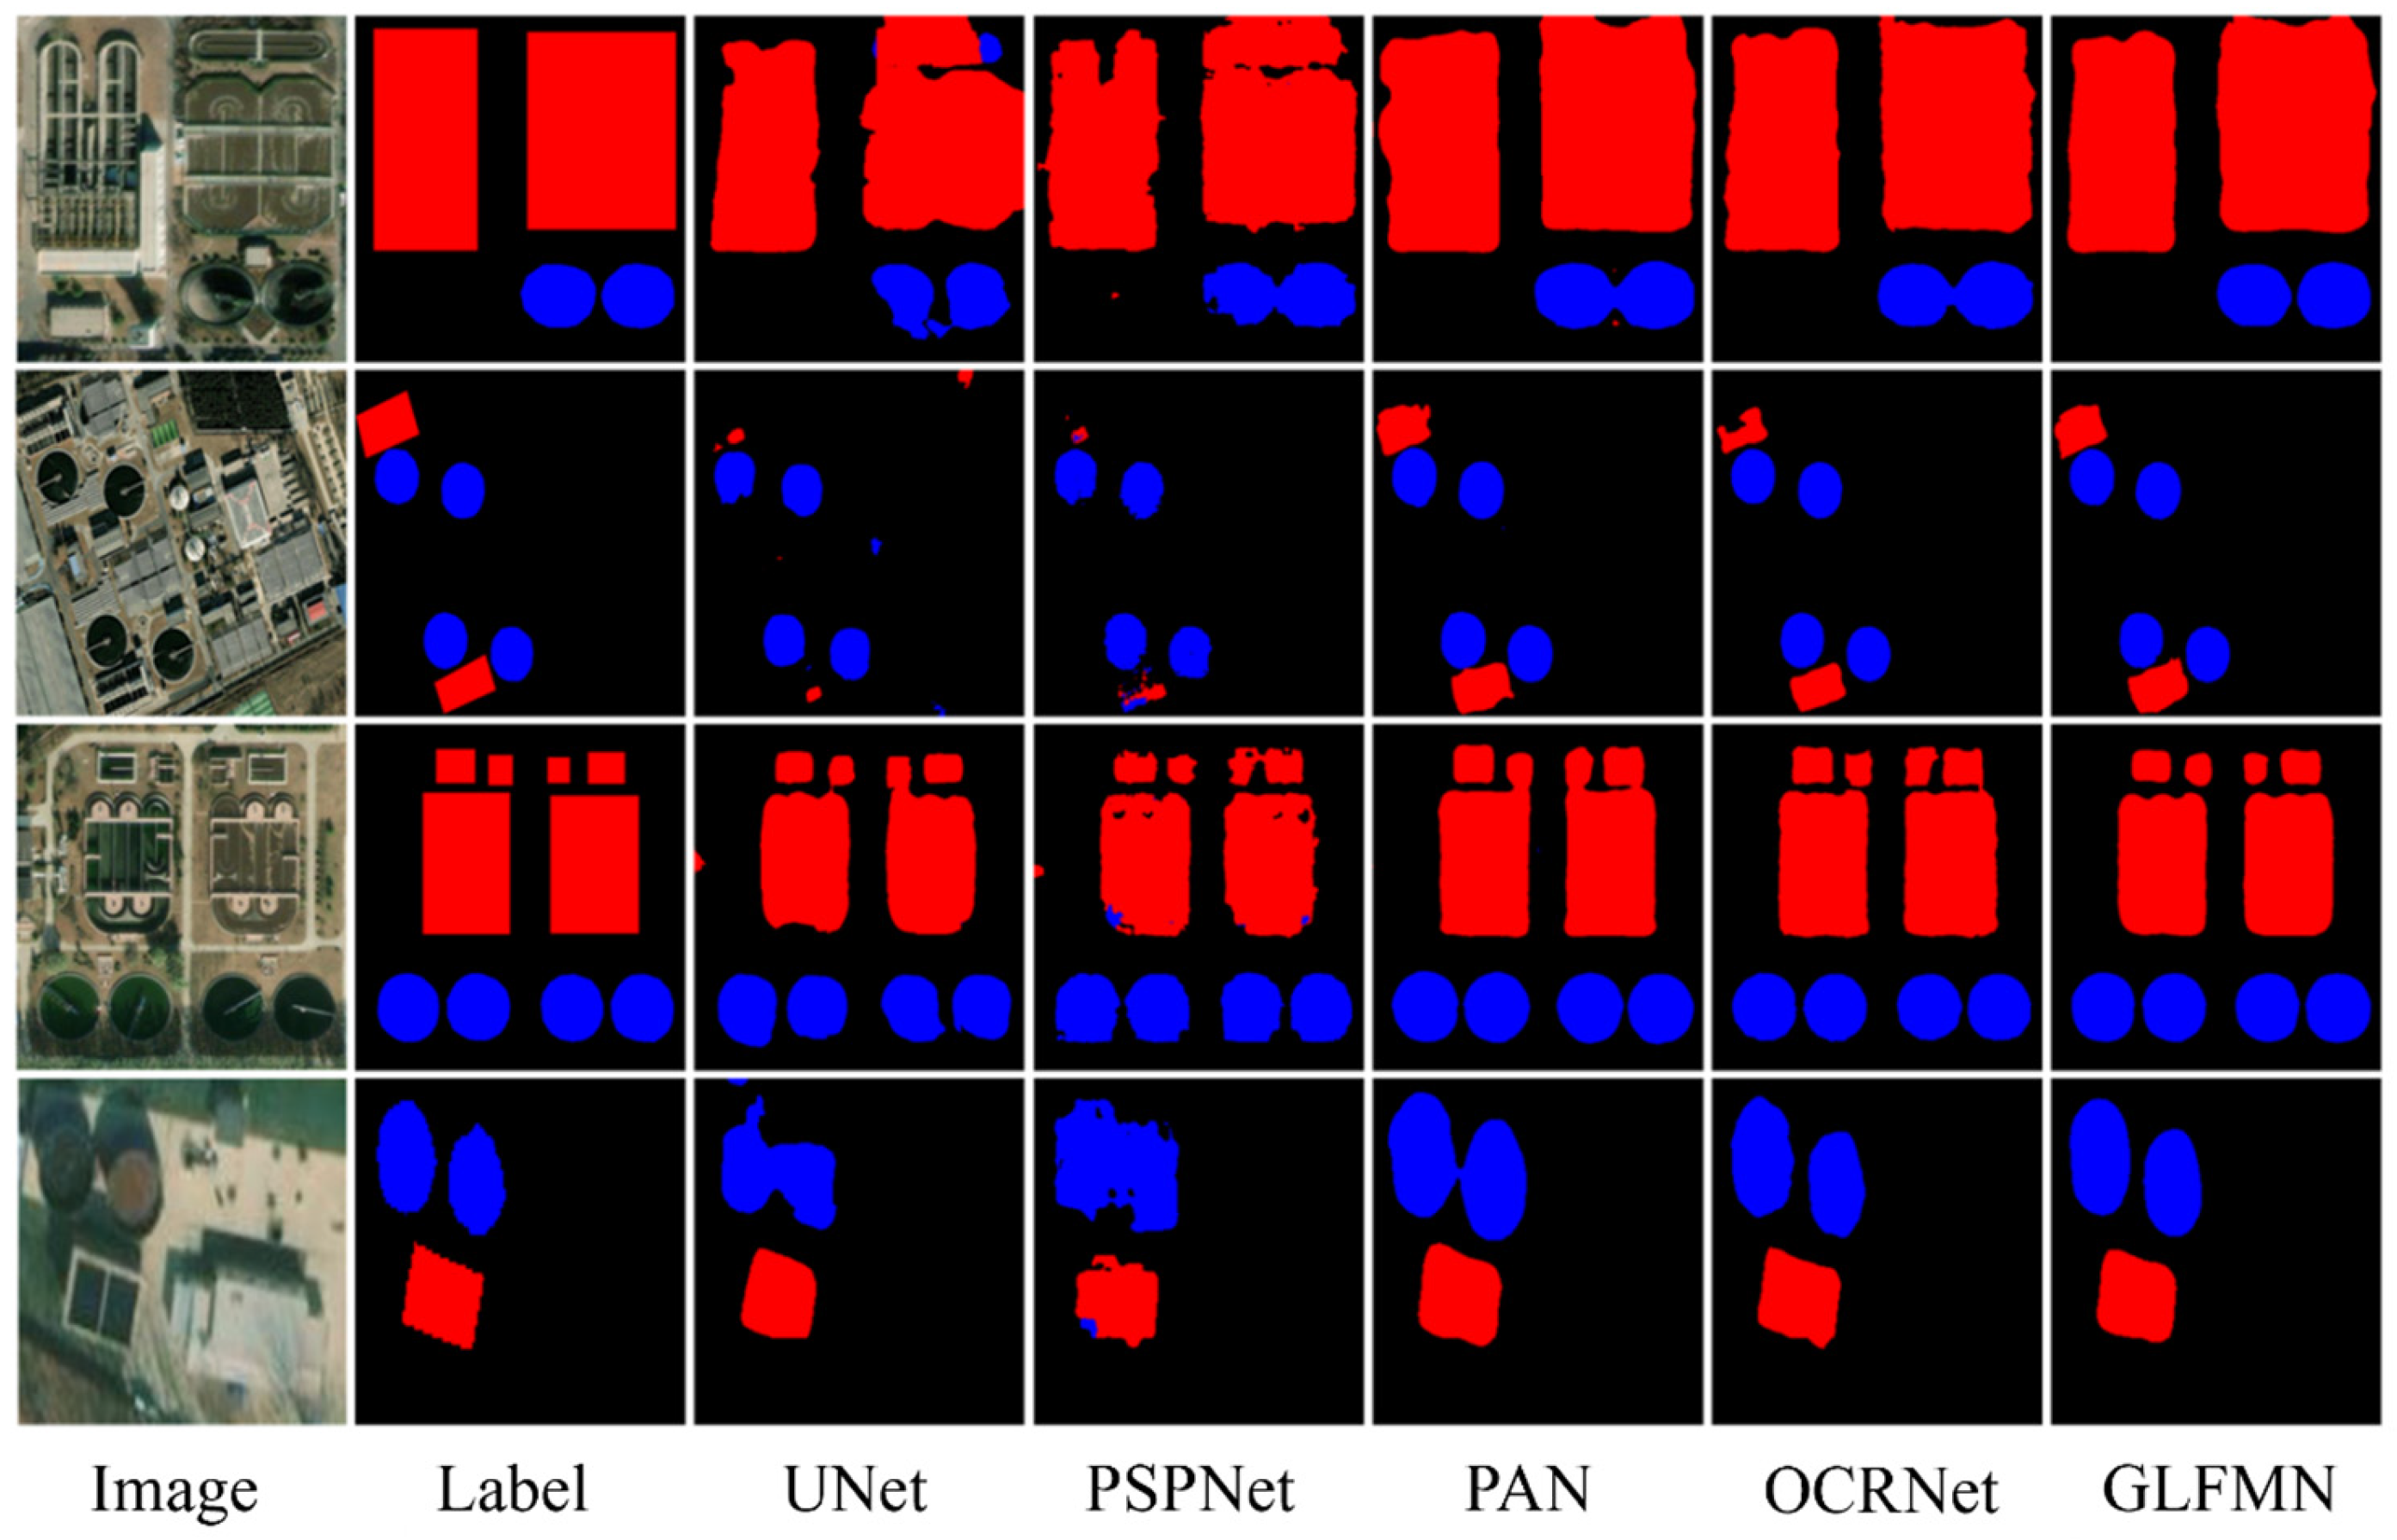
4.5.2. The Efficiency of GLFMN

The quantitative analysis in this study relies on three main metrics: Overall Accuracy (OA), Intersection over Union (IoU), and the F1 score. These metrics are computed individually for the two key facilities, and their averages are used to represent overall performance. Widely adopted in semantic segmentation, these metrics provide accuracy measures, where values range from 0 to 1, with values closer to 1 indicating better accuracy. By incorporating correct, false positive, and false negative pixel counts, these metrics minimize the influence of class size discrepancies. The specific formulas for these calculations are outlined below:
O A = T P + T N T P + F P + T N + F N
I o U = p r e c i s i o n × r e c a l l r e c i s i o n + r e c a l l p r e c i s i o n × r e c a l l
F 1 = 2 × p r e c i s i o n × r e c a l l p r e c i s i o n + r e c a l l
Table 2 demonstrates the performance metrics of GLMFN and other semantic segmentation methods on the test set. From the accuracy values in the table, it is evident that GLMFN has a significant performance advantage compared to existing popular semantic segmentation methods. In terms of IoU, GLMFN outperforms other comparative methods by at least 2.1%, and in F1, GLMFN has a 1.6% advantage over other comparative methods. Although GLMFN does not exhibit a clear advantage in OA compared to PAN, considering that the OA metric is influenced by the proportion of background pixels, the high OA of PAN indicates a significant number of false positives introduced by PAN, as reflected by the IoU and F1 metrics.
Figure 7 illustrates the inference results of comparative methods and GLFMN on the test set. In the figure, red pixels represent settling tanks, while blue pixels represent secondary settling tanks. The visualization includes images, labels, UNet predictions [68], PSPNet predictions [69], PAN predictions [70], OCRNet predictions [71], and GLFMN predictions from left to right. From the results in the figure, it can be observed that GLFMN, with the integration of global-local feature modeling, performs the best in terms of detection accuracy and facility boundary precision. In the first row, due to the introduction of a local feature modeling encoder, GLFMN exhibits the best separation for secondary settling tanks with almost no false detection patches. In the second row, GLFMN, benefiting from global-local modeling, performs the best in terms of patch integrity and false detection/miss detection. In the third and fourth rows, GLFMN shows the best object distinctiveness, and the edge of the secondary settling tank is particularly well-defined. Overall, considering all experimental results, the proposed GLFMN achieves the expected performance in both quantitative and qualitative analyses.

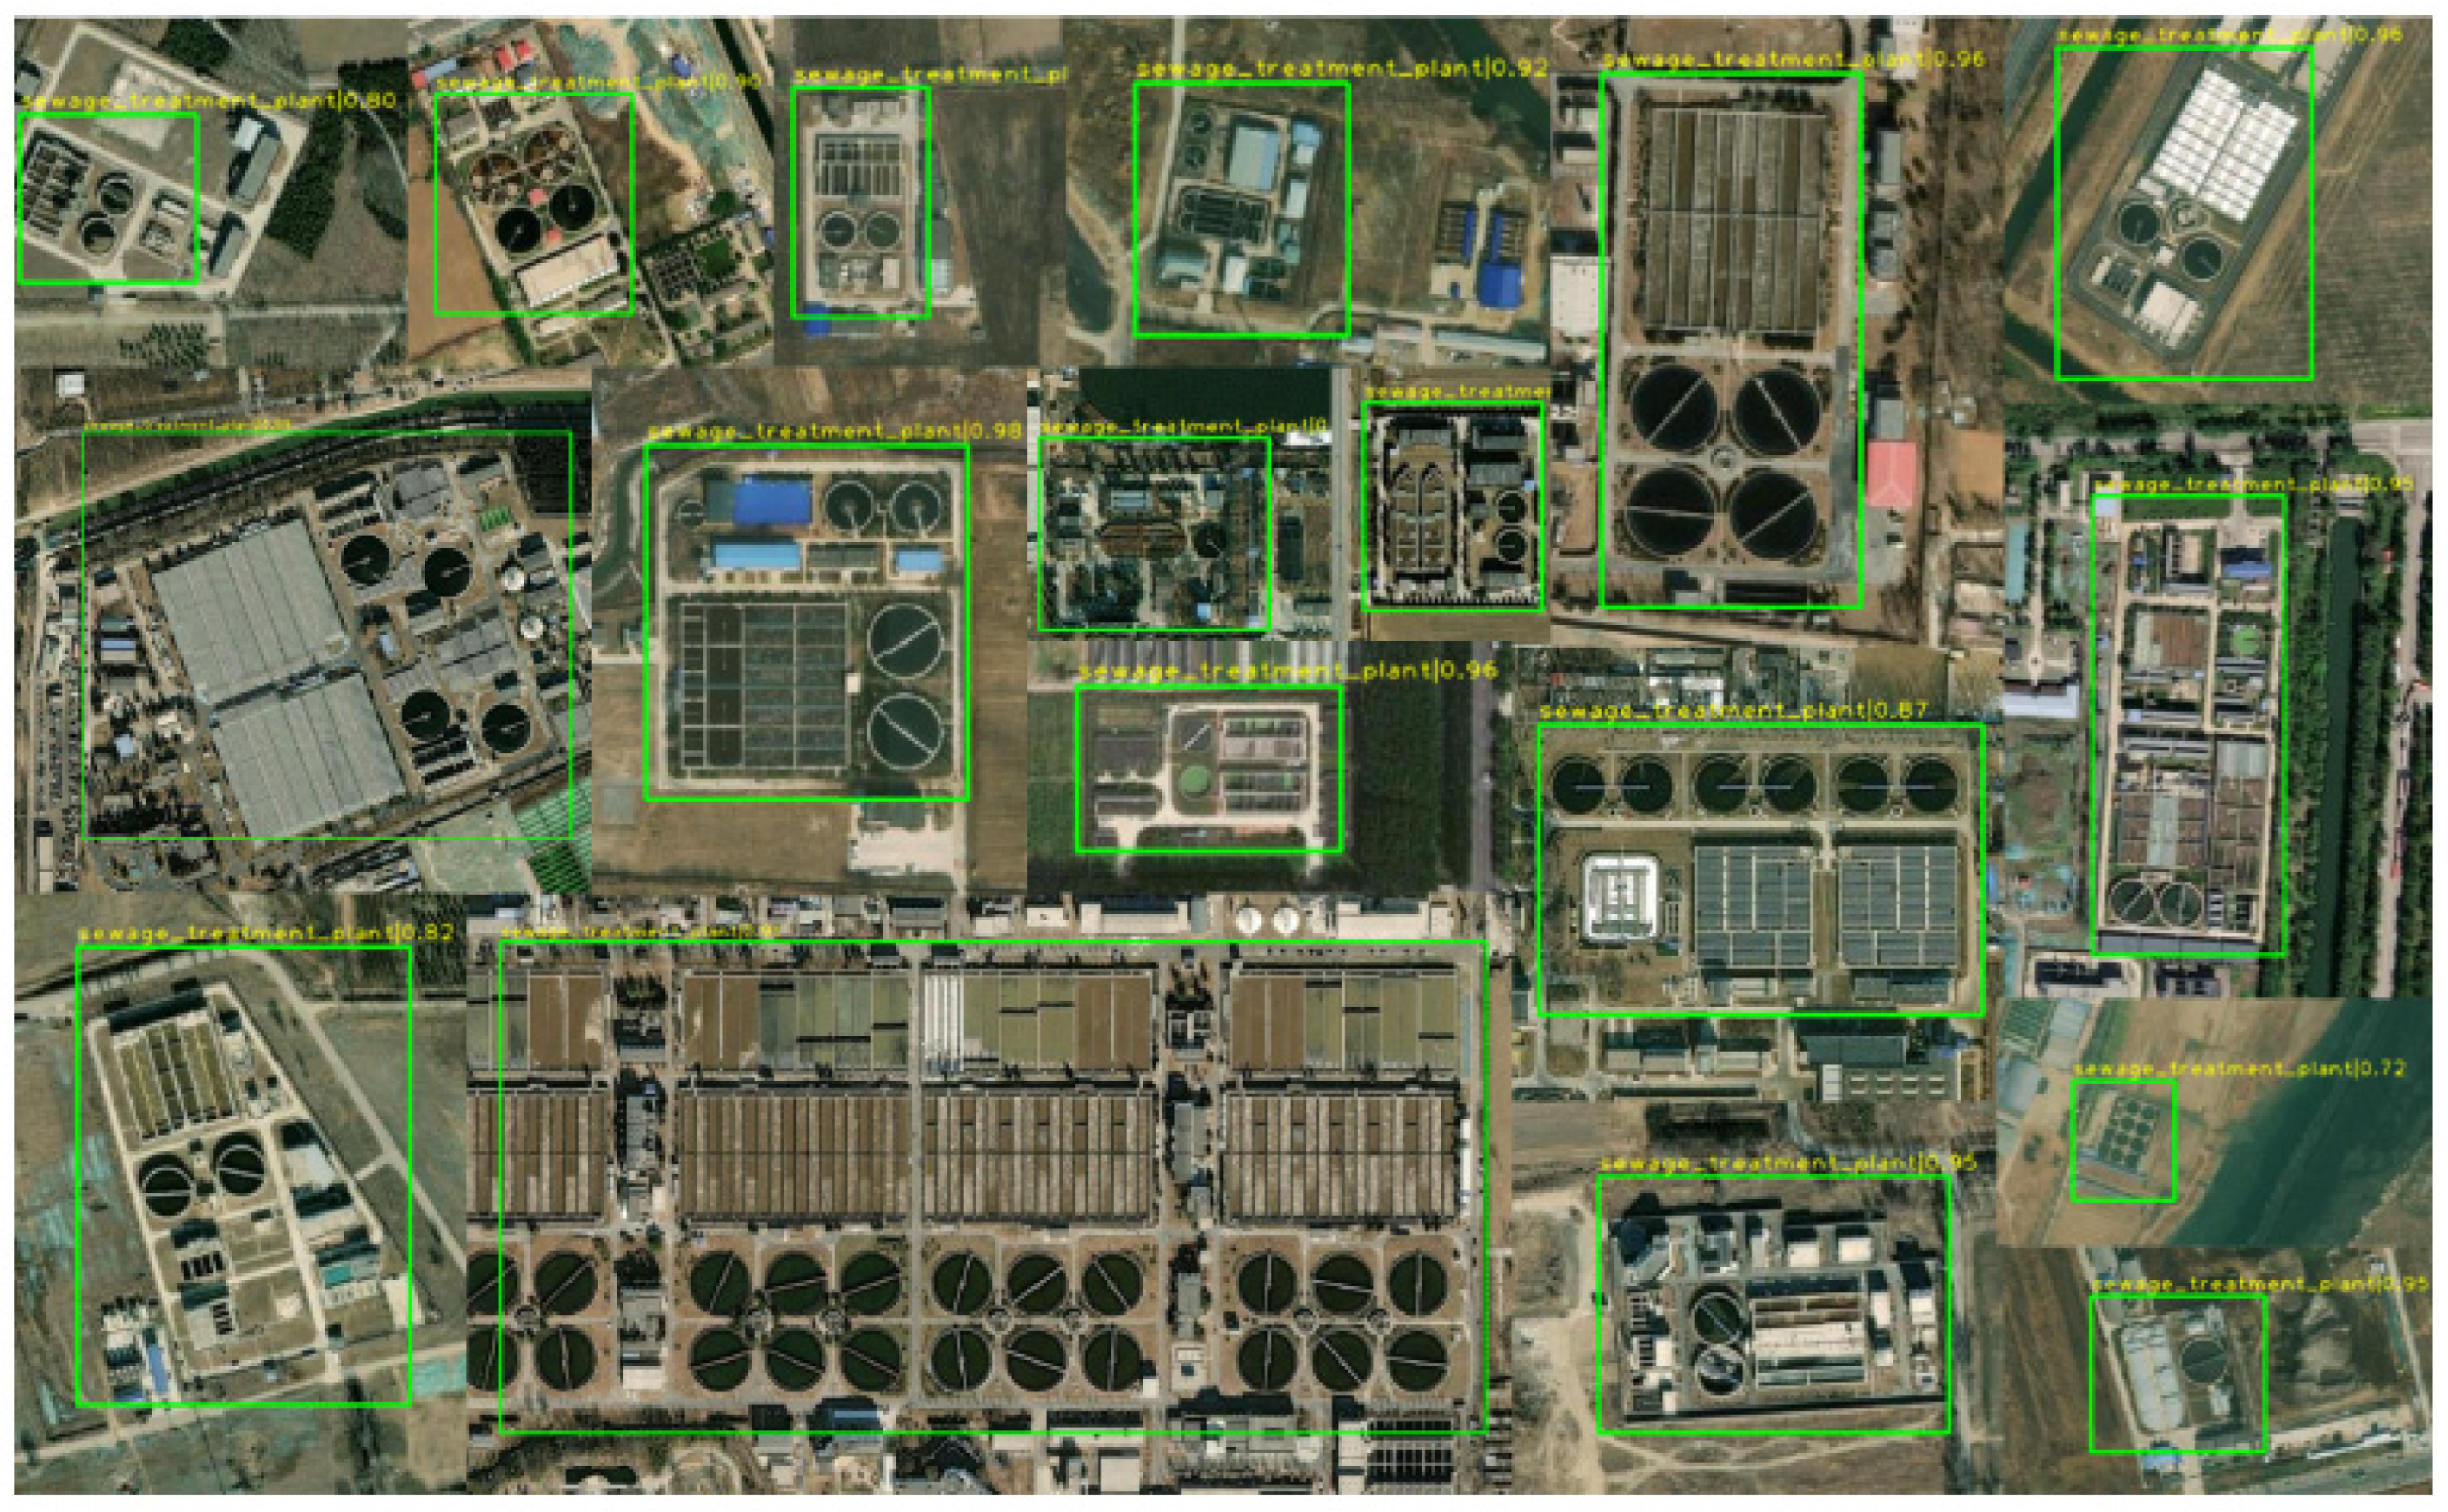
4.5.3. Detection Result of WWTPs in Beijing

Through further processing of the detection results, we obtained the number and spatial distribution of WWTPs in the Beijing area. To address the two-stage task of WWTP identification and key facility segmentation in Beijing, we selected detection results with higher precision and filtered out indoor WWTPs that did not contain sedimentation tanks. According to the detection results, a total of 122 WWTPs were identified in Beijing (Figure 8). This number is somewhat lower than the 176 WWTPs reported in the 2020 statistical data. The discrepancy can be attributed to repeated counts of different phases of the same WWTP in the statistical data, as well as the presence of a small number of indoor mini WWTPs. Overall, the detection results effectively cover all waste water treatment facilities in Beijing that exhibit identifiable features in remote sensing imagery. The final extracted point distribution map of WWTPs in Beijing is shown below.
Among all districts, Fangshan has constructed the most WWTPs, totaling 20. Following closely is Tongzhou District, which has established 19 WWTPs. Ranking third is Daxing District, with a total of 16 WWTPs. All three districts are located south of the main urban area of Beijing, featuring extensive plains and abundant water systems, making them suitable for the construction of WWTPs. Additionally, these regions have developed agriculture and industry, coupled with a high population density, resulting in a significant consumption for water and the need for numerous WWTPs to ensure water quality. In contrast, among all districts, Dongcheng and Xicheng District have not constructed any WWTPs. The main reason is the early development and high population density in these urban areas, making them unsuitable for the conditions required for WWTP construction.
To reveal the relationship between the scale of WWTPs and their treatment capacity, we conducted a correlation analysis between the area of key facilities and the daily waste water treatment volume using Pearson’s correlation coefficient, based on remote sensing object detection results of the WWTPs and their key affiliated facilities. The analysis yielded a Pearson’s R = 0.8769 (p < 0.001), indicating a significant correlation between the area of key facilities and waste water treatment capacity. Considering data availability, and in order to simplify the subsequent spatial analysis of waste water treatment capacity in relation to environmental factors, this study uses the area of key facilities as a proxy for waste water treatment capacity, which is more difficult to obtain.
Figure 9a illustrates the relationship between the distribution of WWTPs in Beijing and residential areas. From the positions of WWTPs in the figure, it can be observed that these plants are distributed around residential clusters while avoiding the central core areas. Consequently, a considerable number of WWTPs are located near the Sixth Ring Road in Beijing. These plants receive waste water from the central urban area of Beijing and discharge treated waste water into the surrounding regions. Additionally, several WWTPs serve peripheral districts such as Pinggu, Miyun, and Yanqing. In Figure 9b, the relationship between WWTPs and water bodies in Beijing is depicted. By observing the distribution of WWTP locations, it becomes apparent that these plants are generally situated around water bodies to accommodate the discharge of treated waste water. Water bodies such as Qinghe River, Yongding River, and Wenyu River serve as outlets for the treated waste water from multiple large WWTPs.
Figure 10a–c respectively shows the waste water treatment capacity per unit area of administrative districts in Beijing, the waste water treatment capacity allocated per unit area of residential land, and the waste water treatment capacity supported per unit area of water bodies. These three indicators are calculated as follows: the first is the ratio of the total area of key facilities in WWTPs to the total area of each district; the second is the ratio of the area of key waste water treatment facilities to the residential land area; and the third is the ratio of the total area of key waste water treatment facilities to the total area of water bodies within each district. As shown in the figures, Chaoyang District demonstrates the highest waste water treatment capacity per unit area (0.0916% key facility coverage), attributed to its compact administrative area containing five treatment plants with total key facilities spanning 0.852 km2, including a mega-plant with 1-million-ton daily capacity. Following closely, Haidian District ranks second (0.0531%) with seven major plants servicing core urban areas, while Daxing District, though third in area coverage (0.043%), possesses the largest absolute key facility area (0.089 km2) jointly undertaking southern urban wastewater management with Fengtai District. Notably, these three districts also lead in per-unit-area treatment capacity metrics-Chaoyang (0.2777%), Daxing (0.2158%), and Haidian (0.1907%)-reflecting strategic infrastructure planning to accommodate high population density and industrial activities in central urban zones. Particularly critical is Daxing’s water system bearing the heaviest treated effluent load (5.222% water area ratio), compounded by its limited 8.53 km2 aquatic resources compared to Chaoyang’s 12.12 km2, as visualized in Figure 5, Figure 6 and Figure 7, explaining why both districts exhibit disproportionately high hydraulic pressure despite spatial constraints.
We further quantified the waste water treatment capacity of each Beijing administrative district for comparison (Table 3). The results show that neither Dongcheng nor Xicheng District hosts local treatment plants, yielding zeros across unit-area, per-residential-area, and per-water-body capacity metrics and underscoring their reliance on external facilities. Among districts with in-situ plants, Daxing—despite possessing the city’s largest total key-facility area (0.45 km2) and highest water-body load index (5.22%)—exhibits a low unit-area capacity (0.04%) owing to its extensive land area. In contrast, Chaoyang District achieves the highest unit-area (0.09%) and per-residential-area (0.28%) capacities, reflecting an efficient concentration of treatment resources within its relatively compact footprint. Haidian and Fengtai occupy the mid-range with unit-area capacities of 0.05% and 0.04%, respectively, servicing dense research and industrial zones. Suburban districts such as Tongzhou, Shunyi, and Changping—though home to 9–19 plants—demonstrate modest unit-area capacities (~0.02%) due to their larger jurisdictions. More remote districts (Huairou, Pinggu, Miyun, Yanqing) exhibit markedly lower values across all metrics, revealing infrastructure–population–hydrology imbalances. Overall, a district’s administrative extent, water-body resources, and plant count jointly determine its spatial service efficiency, and a greater number of facilities does not necessarily equate to higher density of coverage.

5. Conclusions and Future Works

This study first constructed a dataset of WWTPs in Beijing using high-resolution remote sensing imagery and statistical data. Then, leveraging deep learning-based object detection techniques, an automatic identification approach was developed, proposing a WWTP recognition network based on multi-attention mechanisms. Subsequently, a global-local feature-based key facility segmentation network was introduced to extract key facilities within the WWTPs. Finally, based on the constructed dataset and the recognition and segmentation networks, the waste water treatment capacity of Beijing’s WWTPs was analyzed. Using a data-driven approach, and integrating relevant factors such as waterbody data and population distribution in Beijing, the study assessed the spatial distribution and regional carrying capacity of WWTPs, providing references for discharge regulation, water quality monitoring, and enterprise management.
The following three aspects represent potential directions for future research: (1) Due to limitations in experimental resources and research time, this study expanded the spatial range of sample acquisition only during the construction phase of the WWTP and affiliated facility recognition models, MANet and GLFMN. Samples from different regions of China were used to assist training and enhance the models’ feature diversity and generalization ability under varying terrain and climatic conditions. Future research will focus on exploring the models’ performance in densely built-up areas, particularly in addressing interference from surrounding features with similar characteristics (e.g., small buildings, open spaces). In addition, considering the potential occlusion issues in satellite imagery under cloudy conditions, future work will introduce imagery from more time phases to improve model robustness in such environments. Field investigations and multi-source data fusion will also be conducted to analyze the types of interpretation errors. (2) Considering the availability and labeling accuracy of high-resolution remote sensing data, the GF series imagery used in this study mainly comes from 2020 and 2019. In the future, multi-temporal remote sensing imagery—including seasonal data from spring, summer, autumn, and winter—will be used for training to enhance the model’s adaptability to the appearance of WWTPs across different seasons and time points. At the same time, transfer learning techniques will be applied to fine-tune the model using imagery from different time periods, thereby improving its stability and accuracy over long temporal spans. (3) The training data for both models primarily rely on remote sensing features of completed WWTPs. In future research, auxiliary data (such as urban planning information and construction plans) will be incorporated to support the model in making reasonable predictions about facilities under construction. A weakly supervised learning approach will be adopted, using partially labeled data (e.g., partial images of unfinished buildings) to train the model, thereby further improving its ability to recognize WWTPs under construction.

Author Contributions

Conceptualization, C.L. and Z.C.; methodology, Y.S.; software, J.Z.; validation, C.L., Z.C. and S.W.; formal analysis, Z.H.; investigation, Y.S.; resources, Z.C.; data curation, Y.S.; writing—original draft preparation, C.L.; writing—review and editing, X.Q.; visualization, Z.H.; supervision, Z.C.; project administration, S.W.; funding acquisition, S.W. All authors have read and agreed to the published version of the manuscript.

Funding

This research was funded by the National Key Research and Development Program of China, grant number 2021YFB3901202; the Natural Science Foundation of Hainan Province of China, grant number E3D1HN03; the talent introduction program Youth Project of the Chinese Academy of Sciences, grant number E43302020D, E2Z10501; Henan Zhongmu County Research Project, grant number E3C1050101; Remote Sensing Big data Analytics Project, grant number E3E2051401; and the Beijing Chaoyang District Collaborative Innovation Project, grant number E2DZ050100.

Data Availability Statement

The original data source of the article can be found in the main text. Further inquiries can be directed to the corresponding author.

Conflicts of Interest

Shuai Yue was employed by Beiqi Foton Motor Co., Ltd. The remaining authors declare that the research was conducted in the absence of any commercial or financial relationships that could be construed as a potential conflict of interest.

References

  1. Sun, D.Z.; Yang, W. Genetic algorithm solution of a gray nonlinear water environment management model developed for the liming river in Daqing, China. J. Environ. Eng. 2007, 133, 287–293. [Google Scholar] [CrossRef]
  2. Feng, Y.; Feng, J.K.; Lee, J.H.; Lu, C.C.; Chiu, Y.H. Undesirable output in efficiency: Evidence from wastewater treatment plants in China. Appl. Ecol. Environ. Res. 2019, 17, 9279–9290. [Google Scholar] [CrossRef]
  3. Shuai, Y.; Xie, J.; Lu, K.X.; Chen, Z.C. Multi-Attention Network for Sewage Treatment Plant Detection. Sustainability 2023, 15, 5880. [Google Scholar] [CrossRef]
  4. Wang, S.P.; Liu, X.A.; Zheng, Q.; Yang, Z.L.; Zhang, R.X.; Yin, B.H. Characteristics and feasibility study of sewage sludge for landscaping application in Xi’an, China. Environ. Eng. Manag. J. 2013, 12, 1515–1520. [Google Scholar] [CrossRef]
  5. Yao, L.M.; He, L.H.; Chen, X.D. Scale and process design for sewage treatment plants in airports using multi-objective optimization model with uncertain influent concentration. Environ. Sci. Pollut. Res. 2019, 26, 14534–14546. [Google Scholar] [CrossRef]
  6. Wang, Y.; Sheng, L.X.; Li, K.; Sun, H.Y. Analysis of present situation of water resources and countermeasures for sustainable development in China. J. Water Resour. Water Eng. 2008, 3, 10–14. (In Chinese) [Google Scholar]
  7. Liao, Z.L.; Hu, T.T.; Roker, S.A.C. An obstacle to China’s WWTPs: The COD and BOD standards for discharge into municipal sewers. Environ. Sci. Pollut. Res. 2015, 22, 16434–16440. [Google Scholar] [CrossRef]
  8. Long, S.; Zhao, L.; Shi, T.T.; Li, J.C.; Yang, J.Y.; Liu, H.B.; Mao, G.Z.; Qiao, Z.; Yang, Y.K. Pollution control and cost analysis of wastewater treatment at industrial parks in Taihu and Haihe water basins, China. J. Clean. Prod. 2018, 172, 2435–2442. [Google Scholar] [CrossRef]
  9. Wang, D.; Ye, W.L.; Wu, G.X.; Li, R.Q.; Guan, Y.R.; Zhang, W.; Wang, J.X.; Shan, X.L.; Hubacek, K. Greenhouse gas emissions from municipal wastewater treatment facilities in China from 2006 to 2019. Sci. Data 2022, 9, 317. [Google Scholar] [CrossRef]
  10. Wang, C.; Guo, Z.H.; Li, Q.S.; Fang, J. Study on layout optimization of sewage outfalls: A case study of wastewater treatment plants in Xiamen. Sci. Rep. 2021, 11, 18326. [Google Scholar] [CrossRef]
  11. Yuan, F.; Zhao, H.; Sun, H.B.; Sun, Y.J.; Zhao, J.H.; Xia, T. Investigation of microplastics in sludge from five wastewater treatment plants in Nanjing, China. J. Environ. Manag. 2022, 301, 113793. [Google Scholar] [CrossRef] [PubMed]
  12. Hong, D.F.; Zhang, B.; Li, H.; Li, Y.X.; Yao, J.; Li, C.Y.; Werner, M.; Chanussot, J.; Zipf, A.; Zhu, X.X. Cross-city matters: A multimodal remote sensing benchmark dataset for cross-city semantic segmentation using high-resolution domain adaptation networks. Remote Sens. Environ. 2023, 299, 113856. [Google Scholar] [CrossRef]
  13. Li, H.; Zech, J.; Hong, D.F.; Ghamisi, P.; Schultz, M.; Zipf, A. Leveraging OpenStreetMap and Multimodal Remote Sensing Data with Joint Deep Learning for Wastewater Treatment Plants Detection. Int. J. Appl. Earth Obs. Geoinf. 2022, 110, 102804. [Google Scholar] [CrossRef] [PubMed]
  14. Du, P.J.; Bai, X.Y.; Tan, K.; Xue, Z.H.; Samat, A.; Xia, J.S.; Li, E.Z.; Su, H.J.; Liu, W. Advances of Four Machine Learning Methods for Spatial Data Handling: A Review. J. Geovisualization Spat. Anal. 2020, 4, 13. [Google Scholar] [CrossRef]
  15. Quartulli, M.; Olaizola, I.G. A review of EO image information mining. ISPRS J. Photogramm. Remote Sens. 2013, 75, 11–28. [Google Scholar] [CrossRef]
  16. Hinton, G.E.; Osindero, S.; Teh, Y.W. A fast learning algorithm for deep belief nets. Neural Comput. 2006, 18, 1527–1554. [Google Scholar] [CrossRef]
  17. Qin, H.; Wang, J.Z.; Mao, X.; Zhao, Z.A.; Gao, X.Y.; Lu, W.J. An Improved Faster R-CNN Method for Landslide Detection in Remote Sensing Images. J. Geovisualization Spat. Anal. 2024, 8, 2. [Google Scholar] [CrossRef]
  18. Zhong, E.S. Deep mapping–A critical engagement of cartography with neuroscience. Geomat. Inf. Sci. Wuhan Univ. 2022, 47, 1988–2002. (In Chinese) [Google Scholar]
  19. Hong, D.F.; Hu, J.L.; Yao, J.; Chanussot, J.; Zhu, X.X. Multimodal remote sensing benchmark datasets for land cover classification with a shared and specific feature learning model. ISPRS J. Photogramm. Remote Sens. 2021, 178, 68–80. [Google Scholar] [CrossRef]
  20. Hong, D.F.; Yokoya, N.; Xia, G.S.; Chanussot, J.; Zhu, X.X. X-ModalNet: A semi-supervised deep cross-modal network for classification of remote sensing data. ISPRS J. Photogramm. Remote Sens. 2020, 167, 12–23. [Google Scholar] [CrossRef]
  21. Ghasemloo, N.; Matkan, A.A.; Alimohammadi, A.; Aghighi, H.; Mirbagheri, B. Estimating the agricultural farm soil moisture using spectral indices of Landsat 8, and Sentinel-1, and artificial neural networks. J. Geovisualization Spat. Anal. 2022, 6, 19. [Google Scholar] [CrossRef]
  22. Yu, N.J.; Ren, H.H.; Deng, T.M.; Fan, X.B. Stepwise locating bidirectional pyramid network for object detection in remote sensing imagery. IEEE Geosci. Remote Sens. Lett. 2023, 20, 6001905. [Google Scholar] [CrossRef]
  23. Mamandipoor, B.; Majd, M.; Sheikhalishahi, S.; Modena, C.; Osmani, V. Monitoring and detecting faults in wastewater treatment plants using deep learning. Environ. Monit. Assess. 2020, 192, 148. [Google Scholar] [CrossRef] [PubMed]
  24. Martinez, J.S.; Fernandez, Y.B.; Leinster, P.; Casado, M.R. Combining unmanned aircraft systems and image processing for wastewater treatment plant asset inspection. Remote Sens. 2020, 12, 1461. [Google Scholar] [CrossRef]
  25. Lin, T.Y.; Dollar, P.; Girshick, R.; He, K.M.; Hariharan, B.; Belongie, S. Feature pyramid networks for object detection. In Proceedings of the IEEE Conference on Computer Vision and Pattern Recognition (CVPR), Honolulu, HI, USA, 21–26 July 2017. [Google Scholar]
  26. Yang, X.; Sun, H.; Fu, K.; Yang, J.; Sun, X.; Yan, M.; Guo, Z. Automatic ship detection of remote sensing images from Google Earth in complex scenes based on multi-scale rotation dense feature pyramid networks. Remote Sens. 2018, 10, 132. [Google Scholar] [CrossRef]
  27. Yan, J.Q.; Wang, H.Q.; Yan, M.L.; Diao, W.H.; Sun, X.; Li, H. IoU-adaptive deformable R-CNN: Make full use of IoU for multi-class object detection in remote sensing imagery. Remote Sens. 2019, 11, 286. [Google Scholar] [CrossRef]
  28. Vaswani, A.; Shazeer, N.; Parmar, N.; Uszkoreit, J.; Jones, L.; Gomez, A.N.; Kaiser, L.; Polosukhin, I. Attention is all you need. arXiv 2017. [Google Scholar] [CrossRef]
  29. Zhu, X.K.; Lyu, S.C.; Wang, X.; Zhao, Q. TPH-YOLOv5: Improved YOLOv5 based on transformer prediction head for object detection on drone-captured scenarios. In Proceedings of the IEEE International Conference on Computer Vision Workshops (ICCVW), Montreal, BC, Canada, 11–17 October 2021. [Google Scholar]
  30. Long, H.; Chung, Y.N.; Liu, Z.B.; Bu, S.H. Object detection in aerial images using feature fusion deep networks. IEEE Access 2019, 7, 30980–30990. [Google Scholar] [CrossRef]
  31. Yang, X.; Yang, J.R.; Yan, J.C.; Zhang, Y.; Zhang, T.F.; Guo, Z.; Sun, X.; Fu, K. SCRDet: Towards more robust detection for small, cluttered and rotated objects. In Proceedings of the IEEE International Conference on Computer Vision (ICCV), Seoul, Republic of Korea, 27 October–2 November 2019. [Google Scholar]
  32. Dai, J.F.; Qi, H.Z.; Xiong, Y.W.; Li, Y.; Zhang, G.D.; Hu, H.; Wei, Y.C. Deformable convolutional networks. In Proceedings of the IEEE International Conference on Computer Vision (ICCV), Venice, Italy, 22–29 October 2017. [Google Scholar]
  33. Zhu, J.; Fang, L.Y.; Ghamisi, P. Deformable convolutional neural networks for hyperspectral image classification. IEEE Geosci. Remote Sens. Lett. 2018, 15, 1254–1258. [Google Scholar] [CrossRef]
  34. Ding, P.; Zhang, Y.; Deng, W.J.; Jia, P.; Kujiper, A. A light and faster regional convolutional neural network for object detection in optical remote sensing images. ISPRS J. Photogramm. Remote Sens. 2018, 141, 208–218. [Google Scholar] [CrossRef]
  35. Li, S.; Xu, Y.L.; Zhu, M.M.; Ma, S.P.; Tang, H. Remote sensing airport detection based on end-to-end deep transferable convolutional neural networks. IEEE Geosci. Remote Sens. Lett. 2019, 16, 1640–1644. [Google Scholar] [CrossRef]
  36. Wang, J.L.; Cui, Z.Y.; Zang, Z.P.; Meng, X.J.; Cao, Z.J. Absorption pruning of deep neural network for object detection in remote sensing imagery. Remote Sens. 2022, 14, 6245. [Google Scholar] [CrossRef]
  37. Zhang, S.J.; Mu, X.D.; Kou, G.J.; Zhao, J.Y. Object Detection Based on Efficient Multiscale Auto-Inference in Remote Sensing Images. IEEE Geosci. Remote Sens. Lett. 2021, 18, 1650–1654. [Google Scholar] [CrossRef]
  38. Yu, Q.X.; Wei, W.B.; Pan, Z.K.; He, J.F.; Wang, S.H.; Hong, D.F. GPF-Net: Graph-Polarized Fusion Network for Hyperspectral Image Classification. IEEE Trans. Geosci. Remote Sens. 2023, 61, 5519622. [Google Scholar] [CrossRef]
  39. Papageorgiou, C.P.; Oren, M.; Poggio, T. A general framework for object detection. In Proceedings of the 6th International Conference on Computer Vision, Bombay, India, 4–7 January 1998. [Google Scholar]
  40. Lowe, D.G. Distinctive image features from scale-invariant keypoints. Int. J. Comput. Vis. 2004, 60, 91–110. [Google Scholar] [CrossRef]
  41. Viola, P.; Jones, M. Rapid object detection using a boosted cascade of simple features. In Proceedings of the IEEE Conference on Computer Vision and Pattern Recognition, Kauai, HI, USA, 8–14 December 2001. [Google Scholar]
  42. Freund, Y.; Schapire, R.E. A desicion-theoretic generalization of on-line learning and an application to boosting. In Proceedings of the European Conference on Computational Learning Theory, Barcelona, Spain, 13–15 March 1995. [Google Scholar]
  43. Dalal, N.; Triggs, B. Histograms of Oriented Gradients for Human Detection. In Proceedings of the IEEE Conference on Computer Vision and Pattern Recognition, San Diego, CA, USA, 20–26 June 2005. [Google Scholar]
  44. Yin, W.X.; Diao, W.H.; Wang, P.J.; Gao, X.; Li, Y.; Sun, X. PCAN-Part-Based Context Attention Network for Thermal Power Plant Detection in Remote Sensing Imagery. Remote Sens. 2021, 13, 1243. [Google Scholar] [CrossRef]
  45. Liu, N.Q.; Celik, T.; Li, H.C. Gated Ladder-Shaped Feature Pyramid Network for Object Detection in Optical Remote Sensing Images. IEEE Geosci. Remote Sens. Lett. 2022, 19, 1–5. [Google Scholar] [CrossRef]
  46. Tian, Z.Z.; Zhan, R.H.; Hu, J.M.; Wang, W.; He, Z.Q.; Zhuang, Z.W. Generating Anchor Boxes Based on Attention Mechanism for Object Detection in Remote Sensing Images. Remote Sens. 2020, 12, 2416. [Google Scholar] [CrossRef]
  47. Fan, L.; Chen, X.Y.; Wan, Y.; Dai, Y.S. Comparative Analysis of Remote Sensing Storage Tank Detection Methods Based on Deep Learning. Remote Sens. 2023, 15, 2460. [Google Scholar] [CrossRef]
  48. Mnih, V.; Heess, N.; Graves, A.; Kavukcuoglu, K. Recurrent Models of Visual Attention. arXiv 2014. [Google Scholar] [CrossRef]
  49. Jaderberg, M.; Simonyan, K.; Zisserman, A. Spatial transformer networks. arXiv 2015. [Google Scholar] [CrossRef]
  50. Hu, J.; Shen, L.; Albanie, S.; Sun, G.; Wu, E.H. Squeeze-and-Excitation Networks. IEEE Trans. Pattern Anal. Mach. Intell. 2020, 42, 2011–2023. [Google Scholar] [CrossRef] [PubMed]
  51. Dosovitskiy, A.; Springenberg, J.T.; Tatarchenko, M.; Brox, T. Learning to Generate Chairs, Tables and Cars with Convolutional Networks. IEEE Trans. Pattern Anal. Mach. Intell. 2017, 39, 692–705. [Google Scholar] [CrossRef] [PubMed]
  52. Guo, M.Q.; Liu, H.; Xu, Y.Y.; Huang, Y. Building Extraction Based on U-Net with an Attention Block and Multiple Losses. Remote Sens. 2020, 12, 1400. [Google Scholar] [CrossRef]
  53. Wan, J.; Xie, Z.; Xu, Y.Y.; Chen, S.Q.; Qiu, Q.J. DA-RoadNet: A Dual-Attention Network for Road Extraction from High Resolution Satellite Imagery. IEEE J. Sel. Top. Appl. Earth Obs. Remote Sens. 2021, 14, 6302–6315. [Google Scholar] [CrossRef]
  54. Shotton, J.; Winn, J.; Rother, C.; Criminisi, A. TextonBoost: Joint appearance, shape and context modeling for multi-class object recognition and segmentation. Eur. Conf. Comput. Vis. (ECCV) 2006, 3951, 1–15. [Google Scholar]
  55. Everingham, M.; Van Gool, L.; Williams, C.K.I.; Winn, J.; Zisserman, A. The Pascal Visual Object Classes (VOC) Challenge. Int. J. Comput. Vis. 2010, 88, 303–338. [Google Scholar] [CrossRef]
  56. Lin, T.Y.; Maire, M.; Belongie, S.; Hays, J.; Perona, D.; Ramanan, P.; Dollar, P.; Zitnick, C.L. Microsoft COCO: Common Objects in Context. Eur. Conf. Comput. Vis. (ECCV) 2014, 8693, 740–755. [Google Scholar]
  57. Mottaghi, R.; Chen, X.J.; Liu, X.B.; Cho, N.G.; Lee, S.W.; Fidler, S.; Urtasun, R.; Yuille, A. The Role of Context for Object Detection and Semantic Segmentation in the Wild. In Proceedings of the IEEE Conference on Computer Vision and Pattern Recognition (CVPR), Columbus, OH, USA, 23–28 June 2014. [Google Scholar]
  58. Shi, J.B.; Malik, J. Normalized Cuts and Image Segmentation. IEEE Trans. Pattern Anal. Mach. Intell. 2000, 22, 888–905. [Google Scholar]
  59. Lafferty, J.; Mccallum, A.; Pereira, F.; Fields, R.D. Probabilistic Models for Segmenting and Labeling Sequence Data. In Proceedings of the 18th International Conference on Machine Learning, Williamstown, MA, USA, 28 June–1 July 2001. [Google Scholar]
  60. Shelhamer, E.; Long, J.; Darrell, T. Fully Convolutional Networks for Semantic Segmentation. IEEE Trans. Pattern Anal. Mach. Intell. 2017, 39, 640–651. [Google Scholar] [CrossRef]
  61. Badrinarayanan, V.; Kendall, A.; Cipolla, R. SegNet: A Deep Convolutional Encoder-Decoder Architecture for Image Segmentation. IEEE Trans. Pattern Anal. Mach. Intell. 2017, 39, 2481–2495. [Google Scholar] [CrossRef] [PubMed]
  62. Zhang, T.F.; Sun, X.; Zhang, Y.; Yan, M.L.; Wang, Y.L.; Wang, Z.R.; Fu, K. A Training-free, One-shot Detection Framework for Geospatial Objects in Remote Sensing Images. In Proceedings of the IEEE International Symposium on Geoscience and Remote Sensing IGARSS, Yokohama, Japan, 28 July–2 August 2019. [Google Scholar]
  63. Sun, X.; Wang, P.J.; Wang, C.; Liu, Y.F.; Fu, K. PBNet: Part-Based Convolutional Neural Network for Complex Composite Object Detection in Remote Sensing Imagery. ISPRS J. Photogramm. Remote Sens. 2021, 173, 50–65. [Google Scholar] [CrossRef]
  64. Zheng, Y.C.; Li, Y.J.; Yang, S.; Lu, H.M. Global-PBNet: A Novel Point Cloud Registration for Autonomous Driving. IEEE Trans. Intell. Transp. Syst. 2022, 23, 22312–22319. [Google Scholar] [CrossRef]
  65. Girshick, R.; Donahue, J.; Darrell, T.; Malik, J. Rich Feature Hierarchies for Accurate Object Detection and Semantic Segmentation. In Proceedings of the IEEE Conference on Computer Vision and Pattern Recognition, Columbus, OH, USA, 23–28 June 2014. [Google Scholar] [CrossRef]
  66. Bengio, Y.; Delalleau, O. On the Expressive Power of Deep Architectures. In Proceedings of the 22nd International Conference on Algorithmic Learning Theory (ALT 2011), Espoo, Finland, 5–7 October 2011. [Google Scholar] [CrossRef]
  67. He, K.M.; Zhang, X.Y.; Ren, S.Q.; Sun, J. Deep Residual Learning for Image Recognition. In Proceedings of the IEEE Conference on Computer Vision and Pattern Recognition, Las Vegas, NV, USA, 27–30 June 2016. [Google Scholar] [CrossRef]
  68. Ronneberger, O.; Fischer, P.; Brox, T. U-Net: Convolutional Networks for Biomedical Image Segmentation. Lect. Notes Artif. Intell. 2015, 9351, 234–241. [Google Scholar]
  69. Zhao, H.S.; Shi, J.P.; Qi, X.J.; Wang, X.G.; Jia, J.Y. Pyramid Scene Parsing Network. In Proceedings of the IEEE Conference on Computer Vision and Pattern Recognition, Honolulu, HI, USA, 21–26 July 2017. [Google Scholar] [CrossRef]
  70. Li, H.; Xiong, P.; An, J.; Wang, L. Pyramid Attention Network for Semantic Segmentation. arXiv 2018, arXiv:1805.10180. [Google Scholar] [CrossRef]
  71. Wang, J.; Chen, X.; Chen, X.; Yuan, Y. Segmentation Transformer: Object-Contextual Representations for Semantic Segmentation. arXiv 2019, arXiv:1909.11065. [Google Scholar]
Figure 1. Structure of MANet.
Remotesensing 17 01645 g001
Figure 2. Structure of GLFMN.
Remotesensing 17 01645 g002
Figure 3. Structure of GFA and its transformer module.
Remotesensing 17 01645 g003
Figure 4. Local attention fusion module.
Remotesensing 17 01645 g004
Figure 5. Location of the study area.
Remotesensing 17 01645 g005
Figure 6. Extraction results of WWTPs.
Remotesensing 17 01645 g006
Figure 7. Comparison of experiment results. Red represents settling tanks, and blue represents secondary settling tanks.
Remotesensing 17 01645 g007
Figure 8. Distribution of WWTP distribution point in Beijing.
Remotesensing 17 01645 g008
Figure 9. The relationship between WWTPs and the distribution of residential area (a) and water (b) in Beijing.
Remotesensing 17 01645 g009
Figure 10. Waste water treatment capacity per unit area of each district (a), residential land (b), and water body (c) in Beijing.
Remotesensing 17 01645 g010
Table 1. Evaluation of WWTPs test results in real-world scenarios.
ThresholdActual AmountPredicted AmountTPFPFNAPAR
0.515123514392860.994.7
0.6224138861361.691.4
0.7196132641967.387.4
0.8184129552270.185.4
0.9172123492871.581.4
Table 2. Display of ablation learning accuracy.
OA (%)IoU (%)F1 (%)
UNet85.5356.4171.20
PSPNet83.0253.6666.22
PAN91.9372.3083.77
OCRNet90.4573.4784.49
GLFMN91.9775.5986.12
Table 3. Statistic of waste water treatment capability in each district of Beijing.
DistrictArea (km2)Area of Residential Land (km2)Area of Water (km2)Proportion of Residential Land (%)Proportion of Water (%)Number of WWTPsArea of Key Facilities (km2)Waste Water Treatment Capability per Area (%)Waste Water Treatment Capability per Area of Residential Land (%)Waste Water Treatment Cpability per Area of Water (%)
Dongcheng41.9227.481.0065.562.4000.000.000.000.00
Xicheng50.3531.001.9361.583.8400.000.000.000.00
Chaoyang465.19153.4012.1132.972.6050.430.090.283.52
Fengtai305.9898.728.8432.262.8960.130.040.131.44
Shijingshan84.3324.952.6629.583.1510.010.010.030.26
Haidian428.89119.519.6427.862.2470.230.050.192.36
Mentougou1450.0826.957.911.850.5430.010.000.040.12
Fangshan1997.90161.9026.598.101.33200.240.010.150.90
Tongzhou904.40178.6136.7919.744.06190.180.020.100.50
Shunyi1009.16173.6421.9117.232.1790.200.020.120.92
Changping1343.64158.8517.4811.821.30120.210.020.131.20
Daxing1033.98206.468.5319.960.82160.450.040.225.22
Huairou2119.8658.6312.842.760.6040.040.000.060.29
Pinggu947.5077.0417.538.131.8590.080.010.110.48
Miyun2223.9681.9397.213.684.3750.150.010.180.15
Yanqing1997.3359.3860.802.973.0450.050.000.080.08
Disclaimer/Publisher’s Note: The statements, opinions and data contained in all publications are solely those of the individual author(s) and contributor(s) and not of MDPI and/or the editor(s). MDPI and/or the editor(s) disclaim responsibility for any injury to people or property resulting from any ideas, methods, instructions or products referred to in the content.

