Article

Mapping the Spatiotemporal Evolution of Cropland-Related Soil Erosion in China over the Past Four Decades

1
Jixian National Forest Ecosystem Observation and Research Station, Chinese National Ecosystem Research Network (CNERN), School of Soil and Water Conservation, Beijing Forestry University, Beijing 100083, China
2
School of Geographical Sciences, Hebei Normal University, Shijiazhuang 050024, China
3
State Key Laboratory of Earth Surface Processes and Resource Ecology, Beijing Normal University, Beijing 100875, China
*
Author to whom correspondence should be addressed.
These authors contributed equally to this work.
Remote Sens. 2025, 17(9), 1611; https://doi.org/10.3390/rs17091611
Submission received: 14 March 2025 / Revised: 17 April 2025 / Accepted: 24 April 2025 / Published: 1 May 2025
(This article belongs to the Section Environmental Remote Sensing)

Abstract

:
China’s croplands are facing serious threats from soil erosion, calling for long-term and spatially explicit assessment to safeguard food security and promote sustainable land use management. Yet limited attention has been directed to examining high-resolution spatial cropland-related soil erosion in China over an extended time span, especially across diverse agricultural regions and different crop types. Therefore, this study applied high-resolution remote sensing datasets to investigate the spatially explicit dynamics of crop-specific soil erosion in China from 1980 to 2018 at a 30 m resolution based on the RUSLE model. Our results showed slight erosion has consistently been the major erosion type over the past 40 years, which was primarily observed in northern areas as compared to high cropland soil erosion intensity found in southern regions. Severe erosion occurring in the Loess Plateau area was found to have decreased since 1980 due to the implementation of ecological conservation practices. While soil erosion acreage remained stable in most agricultural zones, a notable decrease was observed in the Yangtze River and Huang-Huai-Hai Plain Regions, and increases were found in the Northern Arid and Semi-arid Region and the Qinghai-Tibet Plateau Region. In addition, grains showed the highest erosion rates, whereas fiber crops were revealed with the lowest erosion rates. By unveiling the temporal-spatial evolution patterns of China’s crop-specific soil erosion together with a 30 m resolution dataset produced across a 40-year time span, this study is fully supportive of promoting soil and water conservation in sloping croplands and safeguarding stable food supply and sustainable agricultural practices.

1. Introduction

Cropland soil plays a fundamental role in food production, which provides essential nutrients, moisture, and ecological conditions for crop growth. As a primary threat to the agroecological system, soil erosion removes surface nutrients, damages soil structure, and accelerates the loss of fertile topsoil, thus reducing both soil fertility and moisture content [1]. These changes can greatly jeopardize soil quality and lead to a high risk of land degradation [2].
With the growing global population and rising food demand, there has been a tendency to increase crop yields through extensive deforestation and expansion of agricultural lands [3,4,5,6]. Nevertheless, these practices have in the meanwhile resulted in widespread cropland-related soil erosion [7,8]. While croplands comprise only 11% of the world’s surface, they contribute to a striking 50% of the world’s soil erosion [9,10,11]. Over the past 40 years, soil erosion has depleted one-third of the world’s agricultural lands, with annual losses ranging from 0.5 to 400 tons per hectare. On average, this is equivalent to 30 tons of soil loss per hectare annually [12]. Moreover, approximately 85% of global lands are undergoing various forms of degradation, and 33% of soils are faced with moderate to severe degradation [13].
China is among the nations that are heavily impacted by cropland-related soil erosion [14]. More than 60% of China’s land experiences different forms of soil degradation, particularly by erosion [15,16]. As early as the 1990s, 28% of China’s croplands were lightly eroded, while 37% of croplands faced severe erosion [17]. Annually, China loses more than 5 billion tons of topsoil, with 62% attributed to erosion in croplands [18]. Since 2000, China has witnessed an annual reduction of 1.45 million hectares in croplands. Consequently, cropland-related soil erosion may greatly impede China’s efforts towards promoting environmental sustainability and sustainable agricultural activities.
In this context, safeguarding cropland acreage and monitoring cropland-related soil erosion are imperative for improving the ecological environment conducive to agricultural production [19]. To address this issue, Liu et al. [20] established experimental plots across China so as to directly measure soil erosion, which yields precise data that objectively represents the actual conditions of the sampled areas and provides essential insights for national soil and water conservation. Nevertheless, it is noteworthy that China’s croplands are scattered across a vast area of territory and are characterized by different topographical and climatic conditions. Apart from that, the types of crop cultivation and the mix of crops vary significantly across different regions. The complexities of topographical, meteorological, and land cover and management factors, which are key determinants of soil erosion, pose big challenges for estimating cropland-related soil erosion across China. Additionally, on-site measurements prove inadequate for effectively capturing long-term changes in soil erosion and the spatial heterogeneity across regions, which complicates the implementation of targeted crop planting strategies and soil erosion control policies [21,22].
Owing to the continuous development in geographic information systems and improved accuracy of remote sensing data, soil erosion models that are conventionally utilized for field measurements have now evolved to efficiently assess cropland-related soil erosion at the regional scale across long timespans [23,24,25]. The Revised Universal Soil Loss Equation (RUSLE) is a widely used empirical model developed to estimate long-term average annual rates of sheet and rill erosion from agricultural fields based on rainfall pattern, soil type, topography, crop system, and management practices [23]. Despite its empirical characteristic, RUSLE remains the most frequently applied erosion model worldwide due to its modest data requirements and flexibility for regional to global applications [26]. It offers a practical compromise between data availability and spatial modeling capacity, particularly in large-scale assessments [27]. Nonetheless, it is important to acknowledge that RUSLE is empirical and is not designed to simulate more complex forms of erosion such as gully formation, bank erosion, or sediment deposition processes, which are more accurately captured by process-oriented models such as WEPP or SWAT [28,29,30,31]. Given the limited availability of comprehensive national datasets for process-based modeling, RUSLE provides a practical and effective framework for assessing cropland erosion dynamics over extended time periods and large spatial scales. Furthermore, sheet and rill erosion are the dominant forms of water erosion in regions where a substantial proportion of China’s cropland is concentrated [32]. Since RUSLE was specifically designed to quantify these types of erosion [33], it proves to be an appropriate tool for characterizing and quantifying the erosion pressures associated with agricultural land in China. However, existing studies on RUSLE-based soil erosion assessment in China are primarily restricted to the provincial level [34,35,36,37]. Although a coarse picture of cropland-related soil erosion may be roughly obtained by combining soil erosion data for various areas as reported in existing studies, the methodological differences, regional heterogeneity, and data variations among different research may largely compromise the reliability and accuracy of a broad national-scale assessment [38,39,40,41,42].
A national-scale assessment would bring a deeper understanding of soil erosion related to China’s croplands. Moreover, by combining national crop-specific planting data with spatiotemporal variations in cropland-related soil erosion, the mix of plantation could be optimized to achieve positive effects in soil erosion mitigation, which has nevertheless been generally neglected in existing studies. Borrelli et al. [43] have for the first time conducted an overall estimation of global cropland soil erosion in 2019 using the RUSLE model at a 100 m resolution, which provides valuable knowledge for illustrating an overall picture of global soil erosion. While this study gave due consideration to the heterogeneity across different nations in terms of soil erosion, it directed insufficient attention to the cropland-related soil erosion within each country, especially for vast nations like China, thus calling for a more precise evaluation of China’s cropland soil erosion on a high-resolution spatial scale. Liu et al. [44] conducted another assessment that focused on soil erosion of China’s sloping cropland, which serves as a representative cropland type in China. Similarly, soil erosion assessments were also conducted for different land types in China, and these studies mainly utilized statistical data, the Normalized Difference Vegetation Index (NDVI), or existing research findings to calculate the land cover and management factors [23,45,46,47]. Nevertheless, compared to estimates from gridded harvested data covering different crop types [9], these studies exhibit limitations in representing the spatially explicit variations of land cover and management factors related to various crops in China, thus affecting the accuracy of mapping the heterogeneity of cropland-related soil erosion across different regions.
In this study, we apply high-resolution remote sensing datasets to assess cropland soil erosion by crop types in China from 1980 to 2018 at a 30 m resolution based on the RUSLE model. The spatial and temporal patterns of cropland-related soil erosion of different agricultural regions are demonstrated, and crop-specific erosion characteristics are identified. Moreover, we delved into the driving forces of erosion changes by analyzing the spatial patterns of influencing factors in the RUSLE model. Our study produced a long-term, spatially explicit dataset of cropland soil erosion in China at a fine spatial resolution, which effectively supports evaluating soil conservation practices and provides essential implications for alleviating environmental degradation risks and promoting sustainable agricultural management.

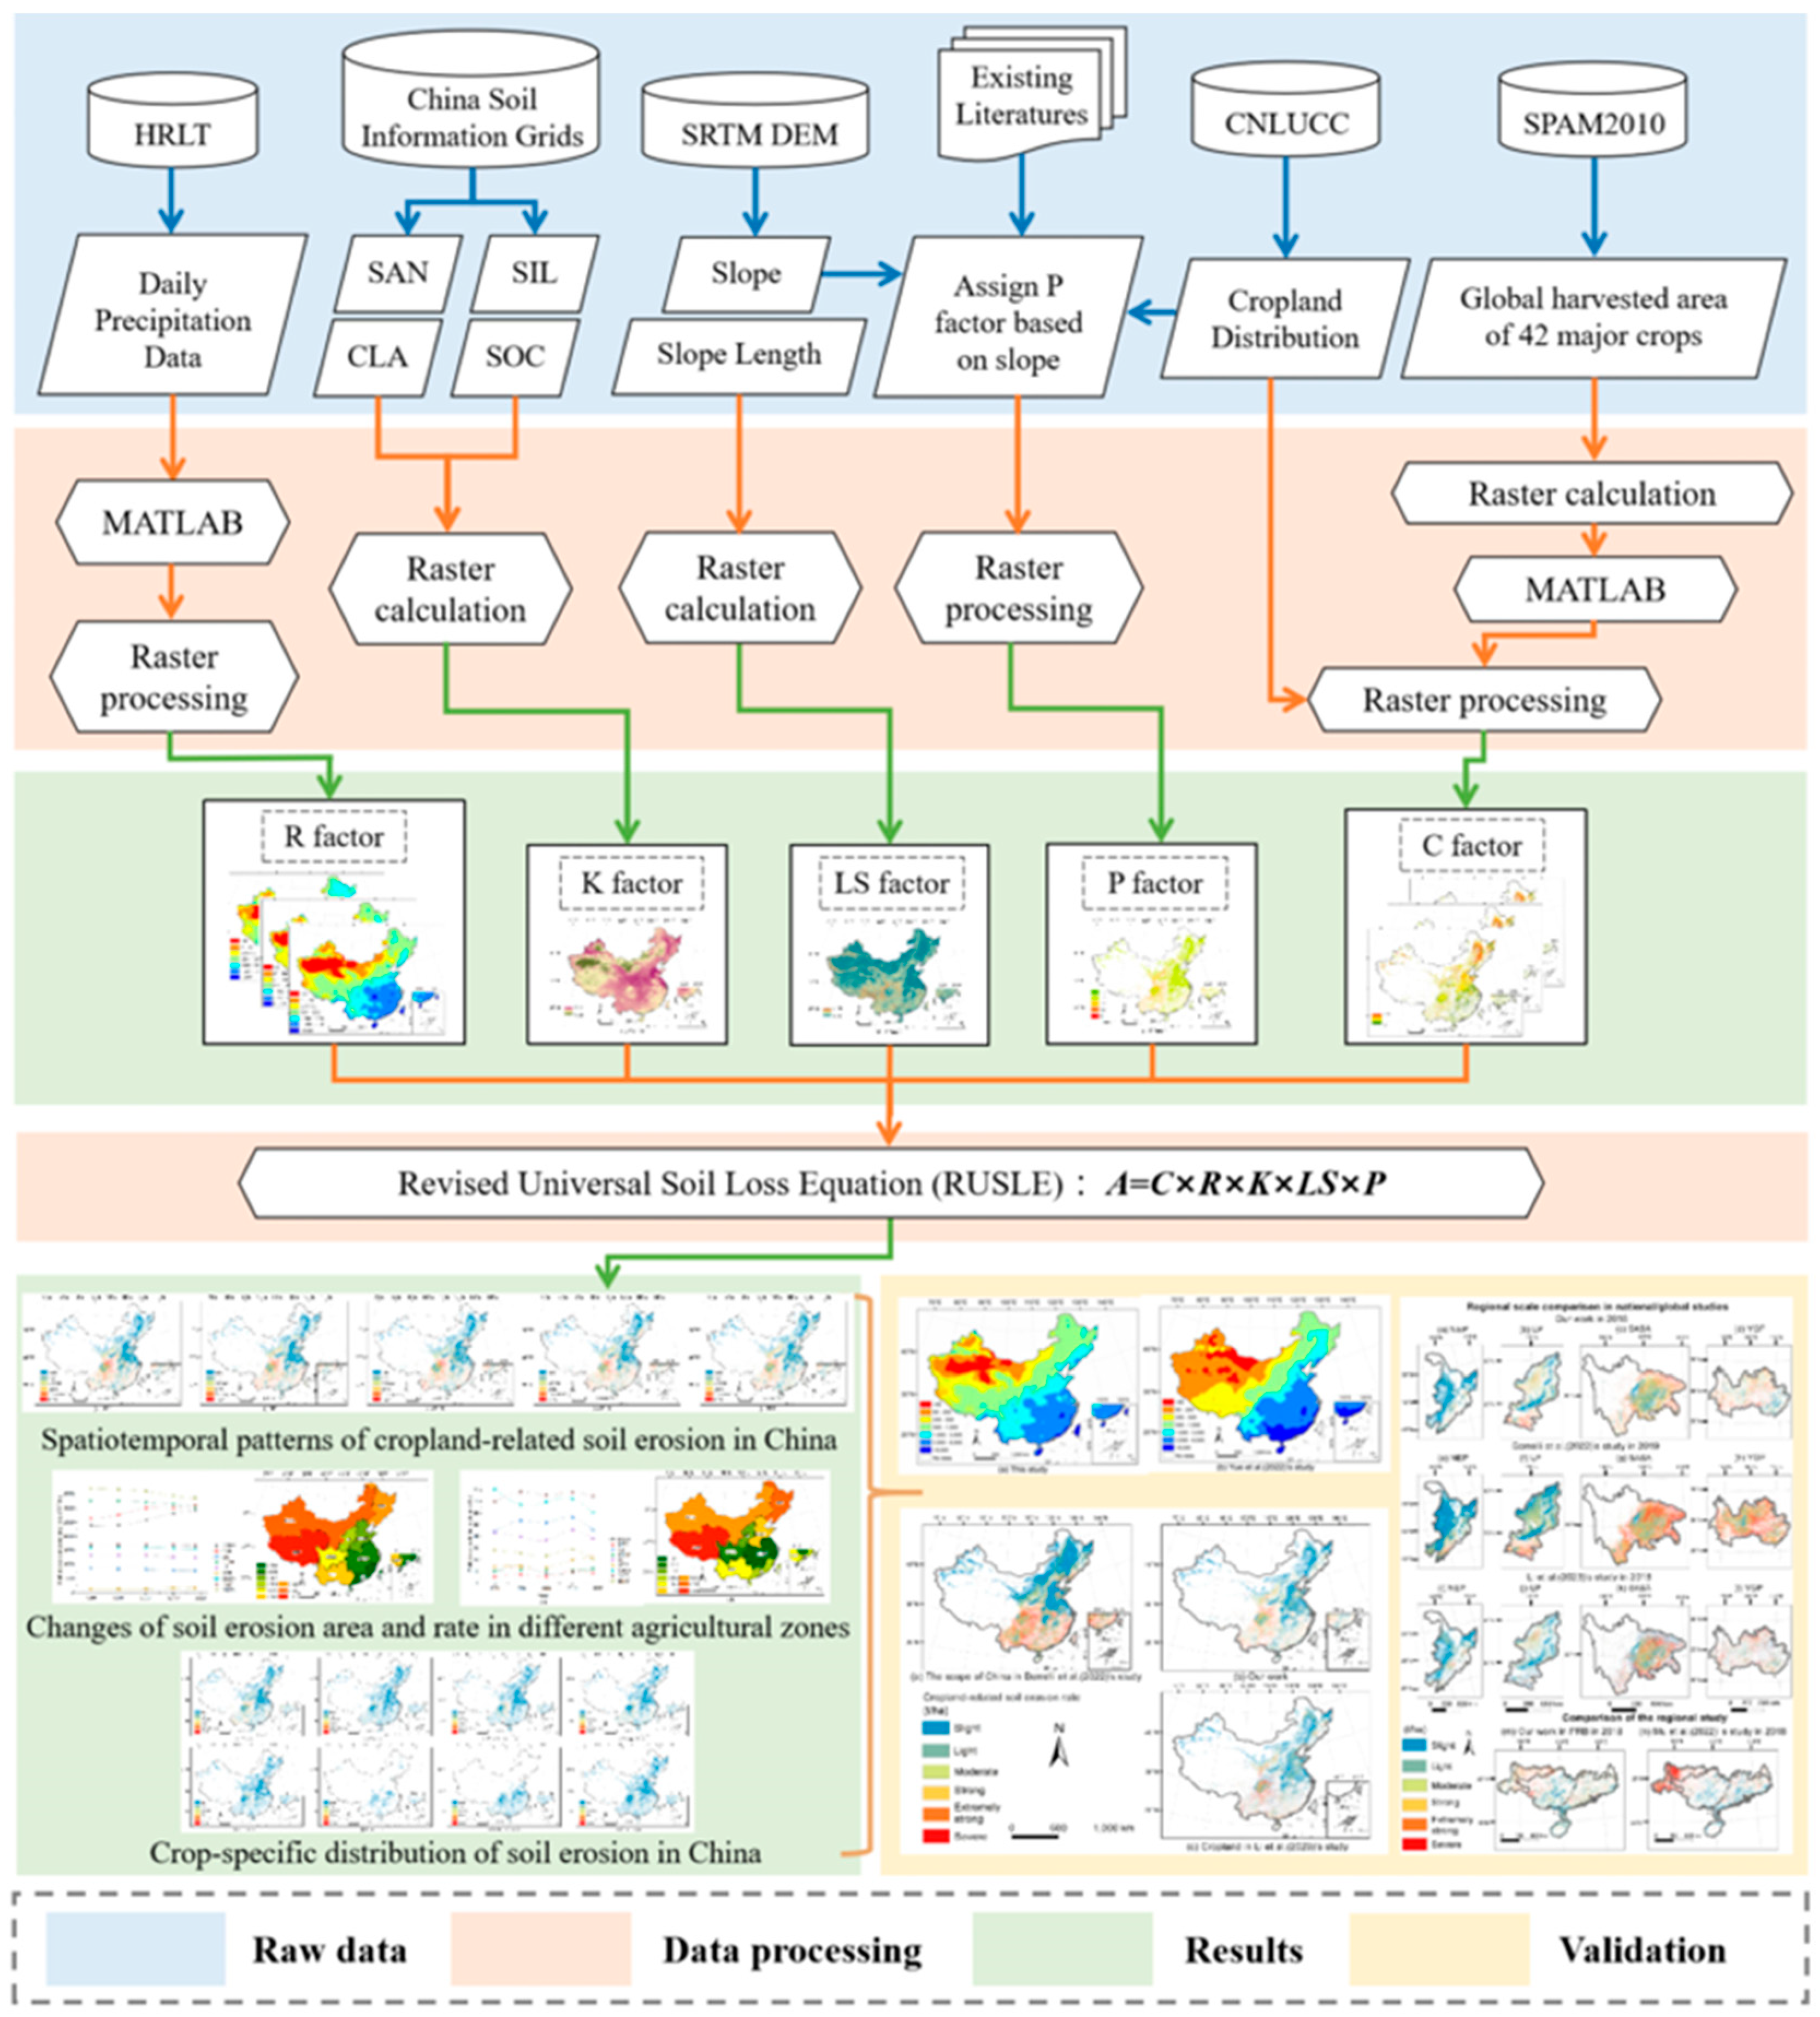
2. Materials and Methods

2.1. Soil Erosion Estimation

This study utilizes the Revised Universal Soil Loss Equation (RUSLE) [48] to calculate the cropland-related soil erosion in China. We selected the RUSLE model for this study due to its suitability for large-scale, long-term estimation of soil erosion under varying land cover and topographic conditions. Process-based models generally require explicitly detailed temporal and spatial input data and are applied at a given spatial scale (ranging from plot to basin) and event temporal scale, while RUSLE allows for efficient integration of multi-temporal land cover data with available datasets of climatic, soil, and topographic factors. The formulation of the RUSLE model is given below:
A = C × R × K × L S × P ,
where A (t·ha−1·a−1) represents the annual soil erosion rate, measured in tons per hectare per year; C (dimensionless) represents the land cover and management factor, which is a dimensionless multiplier that reflects the impact of land cover and management practices on erosion rates (see Section 2.1.1 for details); and R (MJ·mm·h·ha−1·a−1) is identified as the rainfall erosivity factor, expressed in megajoules per millimeter per hectare per year. It quantifies the impact of rainfall events on soil erosion (see Section 2.1.2 for details); K (t·h·MJ−1·mm−1) is the soil erodibility factor, measured in tons per hectare per megajoule per millimeter. This factor indicates the susceptibility of the soil to erosion based on its physical properties and texture (see Section 2.1.3 for details); LS (dimensionless) represents the topography factor, where L is the slope length factor and S is the slope steepness factor (see Section 2.1.4 for details); P (dimensionless) is the support practices factor, which reflects the effect of soil conservation practices on erosion (see Section 2.1.5 for details).
The research flowchart is shown in Figure 1. The raw data used for calculating the RUSLE factors are listed in Table 1, and the spatial distribution of the raw data is depicted in Figure 2. To ensure spatially explicit assessment of cropland soil erosion, we selected datasets primarily derived from satellite remote sensing or fused products integrating statistical data with remote sensing observations (refer to the caption of Table 1 for details). For data processing, MATLAB (v2024) was used to preprocess the land cover and management factors, as well as the rainfall erosivity. Raster processing and calculations were then conducted in ArcMap 10.7 to compute the RUSLE factors and cropland-related soil erosion across China. This enabled the examination of spatiotemporal changes in soil erosion areas and rates across different agricultural zones. Additionally, the results were validated by comparisons with existing literature and regional-scale studies.

2.1.1. Land Cover and Management Factor for Cropland (C Factor)

With full consideration of China’s agricultural conditions [23] and the FAO crop classification standards [49], this study categorized the 42 major crops from the 2010 Global Spatially Disaggregated Crop Production Statistics 2.0 [50] into 8 types. This classification was adjusted according to the C factor assignment method for different crops proposed by Panagos et al. [51], which has been widely used in global and China-based soil erosion studies [9,23,46,52,53], to better reflect the specific characteristics of crop cultivation in China (see Table 2). The land cover and management factors for China’s cropland are calculated as below:
C C R O P = n = 1 8 C C R O P n · % R e g i o n C R O P n ,
where CCROP is the C factor value weighted average for the crop type n; CCROPn represents the C factor for the crop type n; [%] Region CROPn indicates the proportion of harvested area for crop type n relative to the total harvested area for all crops. The land cover and management factors of cropland in China are then matched with the spatial distribution pattern of cropland in different years obtained from China’s multi-period remote sensing monitoring dataset for land use and land cover [54], which helps ultimately yield the spatial patterns of the land cover and management factors for China’s croplands across years. Using crop-specific harvested area data from 2010 to represent the entire study period may introduce a temporal mismatch with land use data and therefore cannot fully capture the dynamic changes in cropping patterns that occurred during China’s agricultural reforms. However, high-precision, spatiotemporally continuous datasets across all crop types are currently unavailable. In that case, we adopted uniform crop harvested area grid data to distinguish the harvested area proportions of different crops across years, which is consistent with previous global and regional soil erosion studies [9,23,46]. Furthermore, this study has partially accounted for the impact of China’s ecological policies (such as the Grains for Green Program) through cropland changes across different years. Therefore, while this approach has certain limitations, it remains a practical and acceptable method given the current data availability. It provides a solid foundation for assessing cropland-related soil erosion and offers a feasible solution for studies at large scales and long temporal spans.

2.1.2. Rainfall Erosivity Factor (R Factor)

This study utilized the empirical model developed by Xie et al. [55] (Equation (3)) for calculating rainfall erosivity from daily precipitation. This model has proven to be robust and accurate in estimating rainfall erosivity within China [56]. For model inputs, the study used daily rainfall data from the HRLT database. When compared with other datasets such as CMFD, CLDAS, and ISIMIP3a, the daily precipitation data in the HRLT dataset are noted for their higher accuracy and more detailed spatial resolution [57].
R i = α j = 1 k P d 1.7265 ,
where Ri (MJ·mm·h·ha−1·a−1) represents the half-monthly rainfall erosivity for j = 1, 2, …, k, with k being the count of erosive rainfall days within that half-month period. The month is divided into two intervals: the first spans from the 1st to the 15th day, and the second covers the rest of the days of the month. Pd is the erosive daily precipitation, which is the amount of rainfall on any given day that meets or exceeds 10 mm. The parameter α is set to 0.3937 during the warmer months (May to September) and 0.3101 during the colder months (October to April). This seasonal distinction captures the higher erosivity of warm-season rainfall dominated by monsoons and convective storms, whereas cold-season rainfall is typically less intense but more prolonged [55]. The validity of this parameterization has been further confirmed by large-scale applications in China [56,58,59]. The annual rainfall erosivity is calculated by summing the half-monthly rainfall erosivity values derived using Equation (3).

2.1.3. Soil Erodibility Factor (K Factor)

The soil erodibility factor indicates the sensitivity of soil to erosion, which is primarily affected by the proportions of sand, clay, silt, and soil organic carbon [60]. Therefore, this study employed the EPIC model [61] to estimate the soil erodibility factor (Equations (4) and (5)) based on the high-resolution China Soil Information Grids data, with spatial resolution aggregated from 90 m to 250 m [62].
K = 0.137 × { 0.2 + 0.3 × exp 0.0256 × S A N 1 S I L 100 } × S I L C L A + S I L 0.3 × 1 0.25 × C C + exp 3.72 2.95 × C × 1 0.7 × S N 1 S N 1 + exp 5.51 + 22.9 × S N 1 ,
S N 1 = 1 S A N 100 ,
where SAN, SIL, and CLA represent the respective percentage contents of sand, silt, and clay; C refers to the percentage content of soil organic carbon. The K factor was assumed to remain constant throughout the study period based on the established approach commonly used in soil erosion modeling [9,43]. Although land management practices can influence the K factor, the lack of time-series soil property data at the national scale prevents us from incorporating dynamic changes in the K factor. Therefore, we considered the K factor to be static as a simplification, which is widely adopted in existing regional and global long-term soil erosion assessments [23,46,63,64].

2.1.4. Topography Factor (LS Factor)

In this study, 30 m resolution DEM data from the Shuttle Radar Topography Mission (SRTM) were processed to derive slope values for China. The topography factor was calculated using the following equations [33,65,66,67]:
L = ( γ / 22.3 ) m ,
m = β 1 + β ,
  β = sin θ 0.0896 3.0 × sin θ 0.8 + 0.56 ,
S =   10.8 sin θ + 0.03   θ 5 °   16.8 sin θ 0.50                       5 ° < θ 10 ° 21.97 sin θ 0.96     θ > 10 ° ,
where the horizontal projection length of the slope surface (γ) is directly replaced by the grid length (30 m) [46]; m represents the slope length factor index; β denotes the fraction of rill erosion compared to topsoil erosion [68]; θ is the value of slope.

2.1.5. Support Practices Factor (P Factor)

The P factor reflects the effectiveness of support practices adopted by humans to control soil erosion. However, due to its complex relationship with land use and land cover types, slope gradients, and the specific soil and water conservation measures employed [69], the effectiveness of the support practices can currently only be determined through field experiments at small scales within runoff plots. As a result, it is difficult to obtain large-scale gridded data on the effectiveness of soil and water conservation measures. Therefore, at a macro scale, soil erosion assessments are mainly based on literature analysis, which can only provide statistical data without capturing temporal changes [70,71,72] or ignoring the influence of support practices [9]. Even with the use of extensive field-measured data to model support practices at the grid level, Panagos et al. [69] ultimately relied on a single constant value to represent their effectiveness across the whole of Europe.
This study adopted a widely used method for evaluating the P factor of Chinese cropland [23,46]. Considering both slope and crop type, areas where rice is grown on flat land are assigned a P factor value of 0.2. This assignment reflects the consideration that the water coverage and controlled irrigation associated with paddy fields can significantly reduce soil erosion. The P factor for the remaining cropland is determined based on the terrain’s slope (see Table 3). The above method is primarily derived from a meta-analysis of the impact of global soil conservation practices on erosion control, summarizing the differences in P values across various slopes and conservation practices [70,71,72]. Moreover, this method has been proven effective by numerous studies evaluating soil erosion in China [52,53].

3. Results

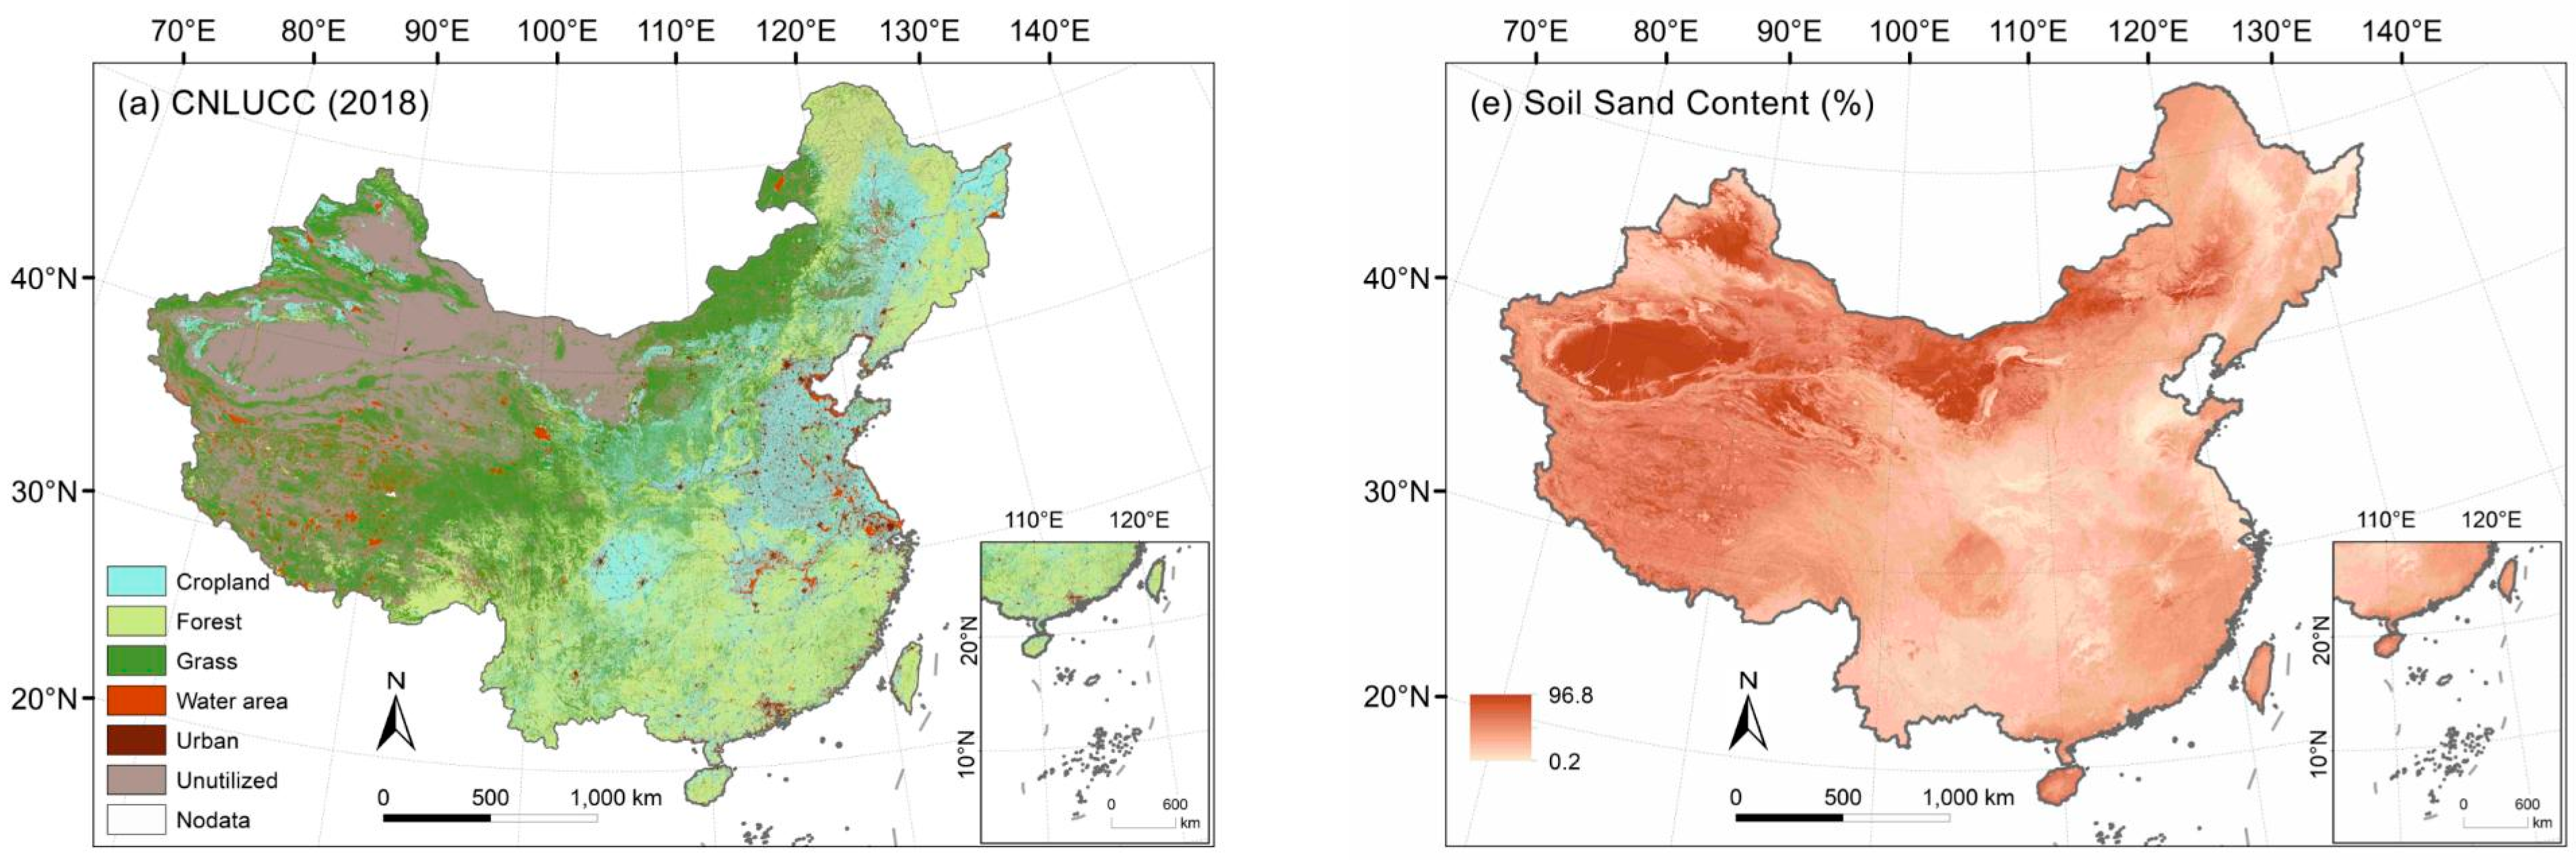
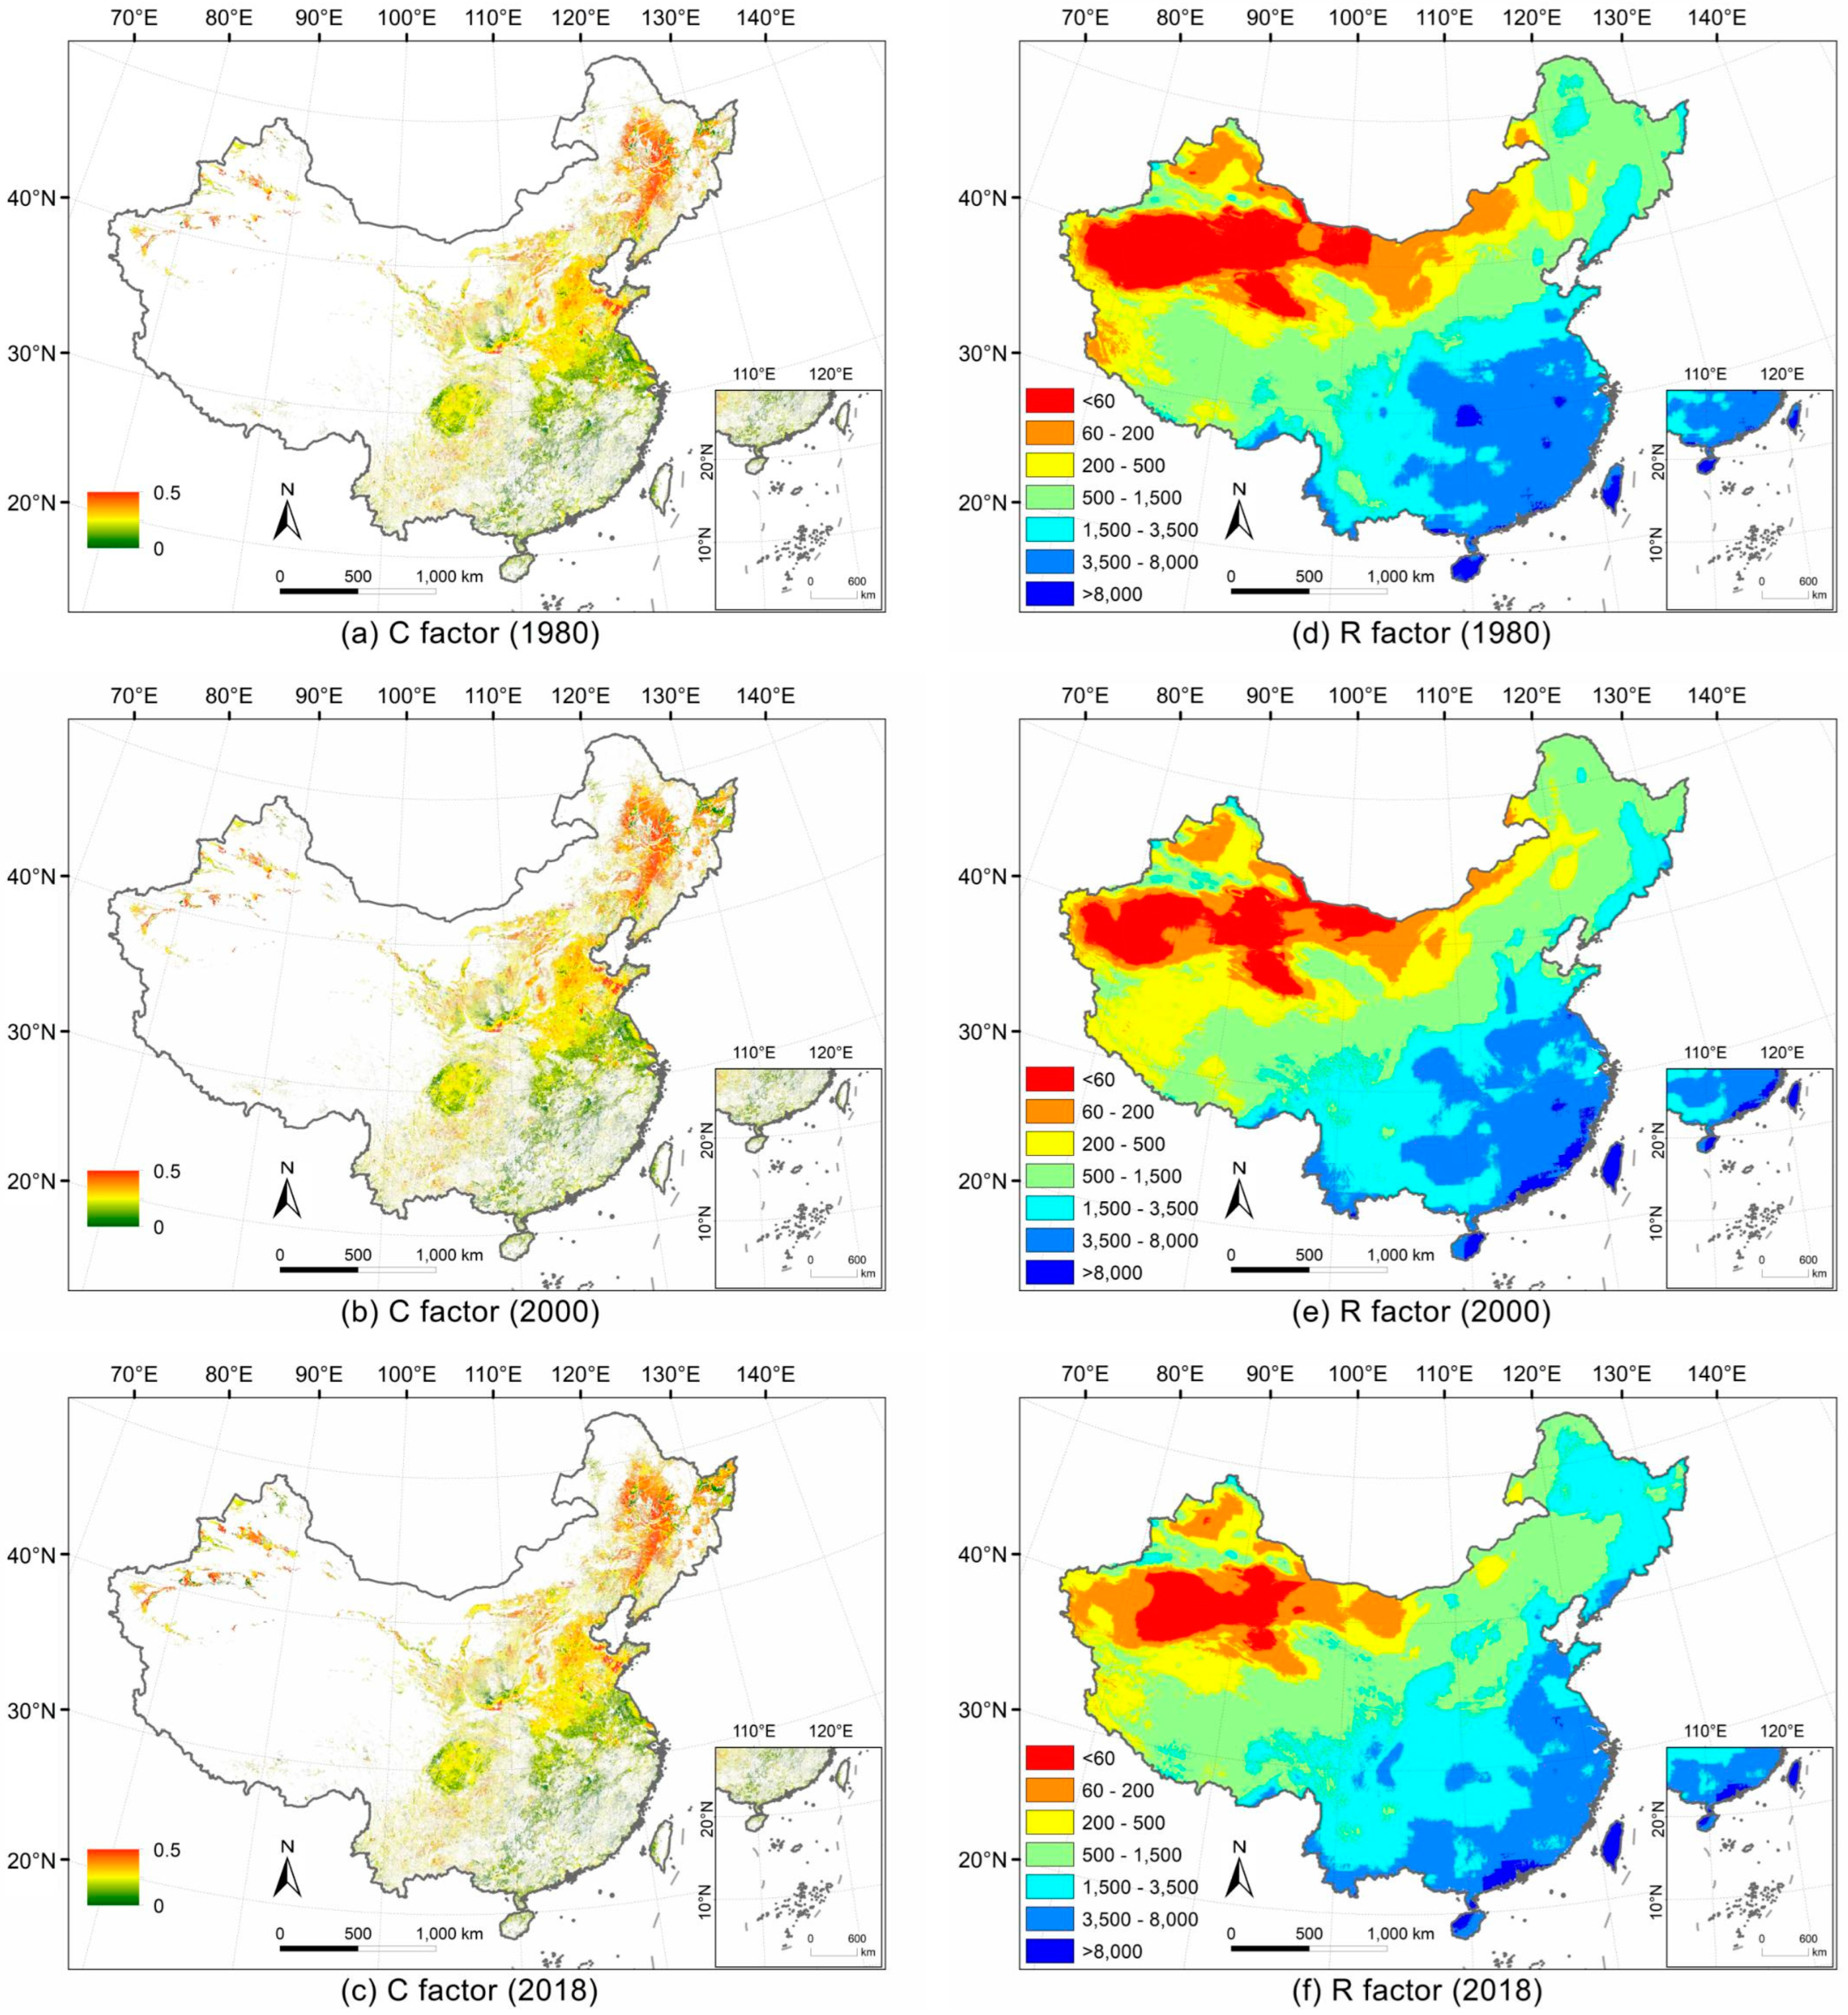
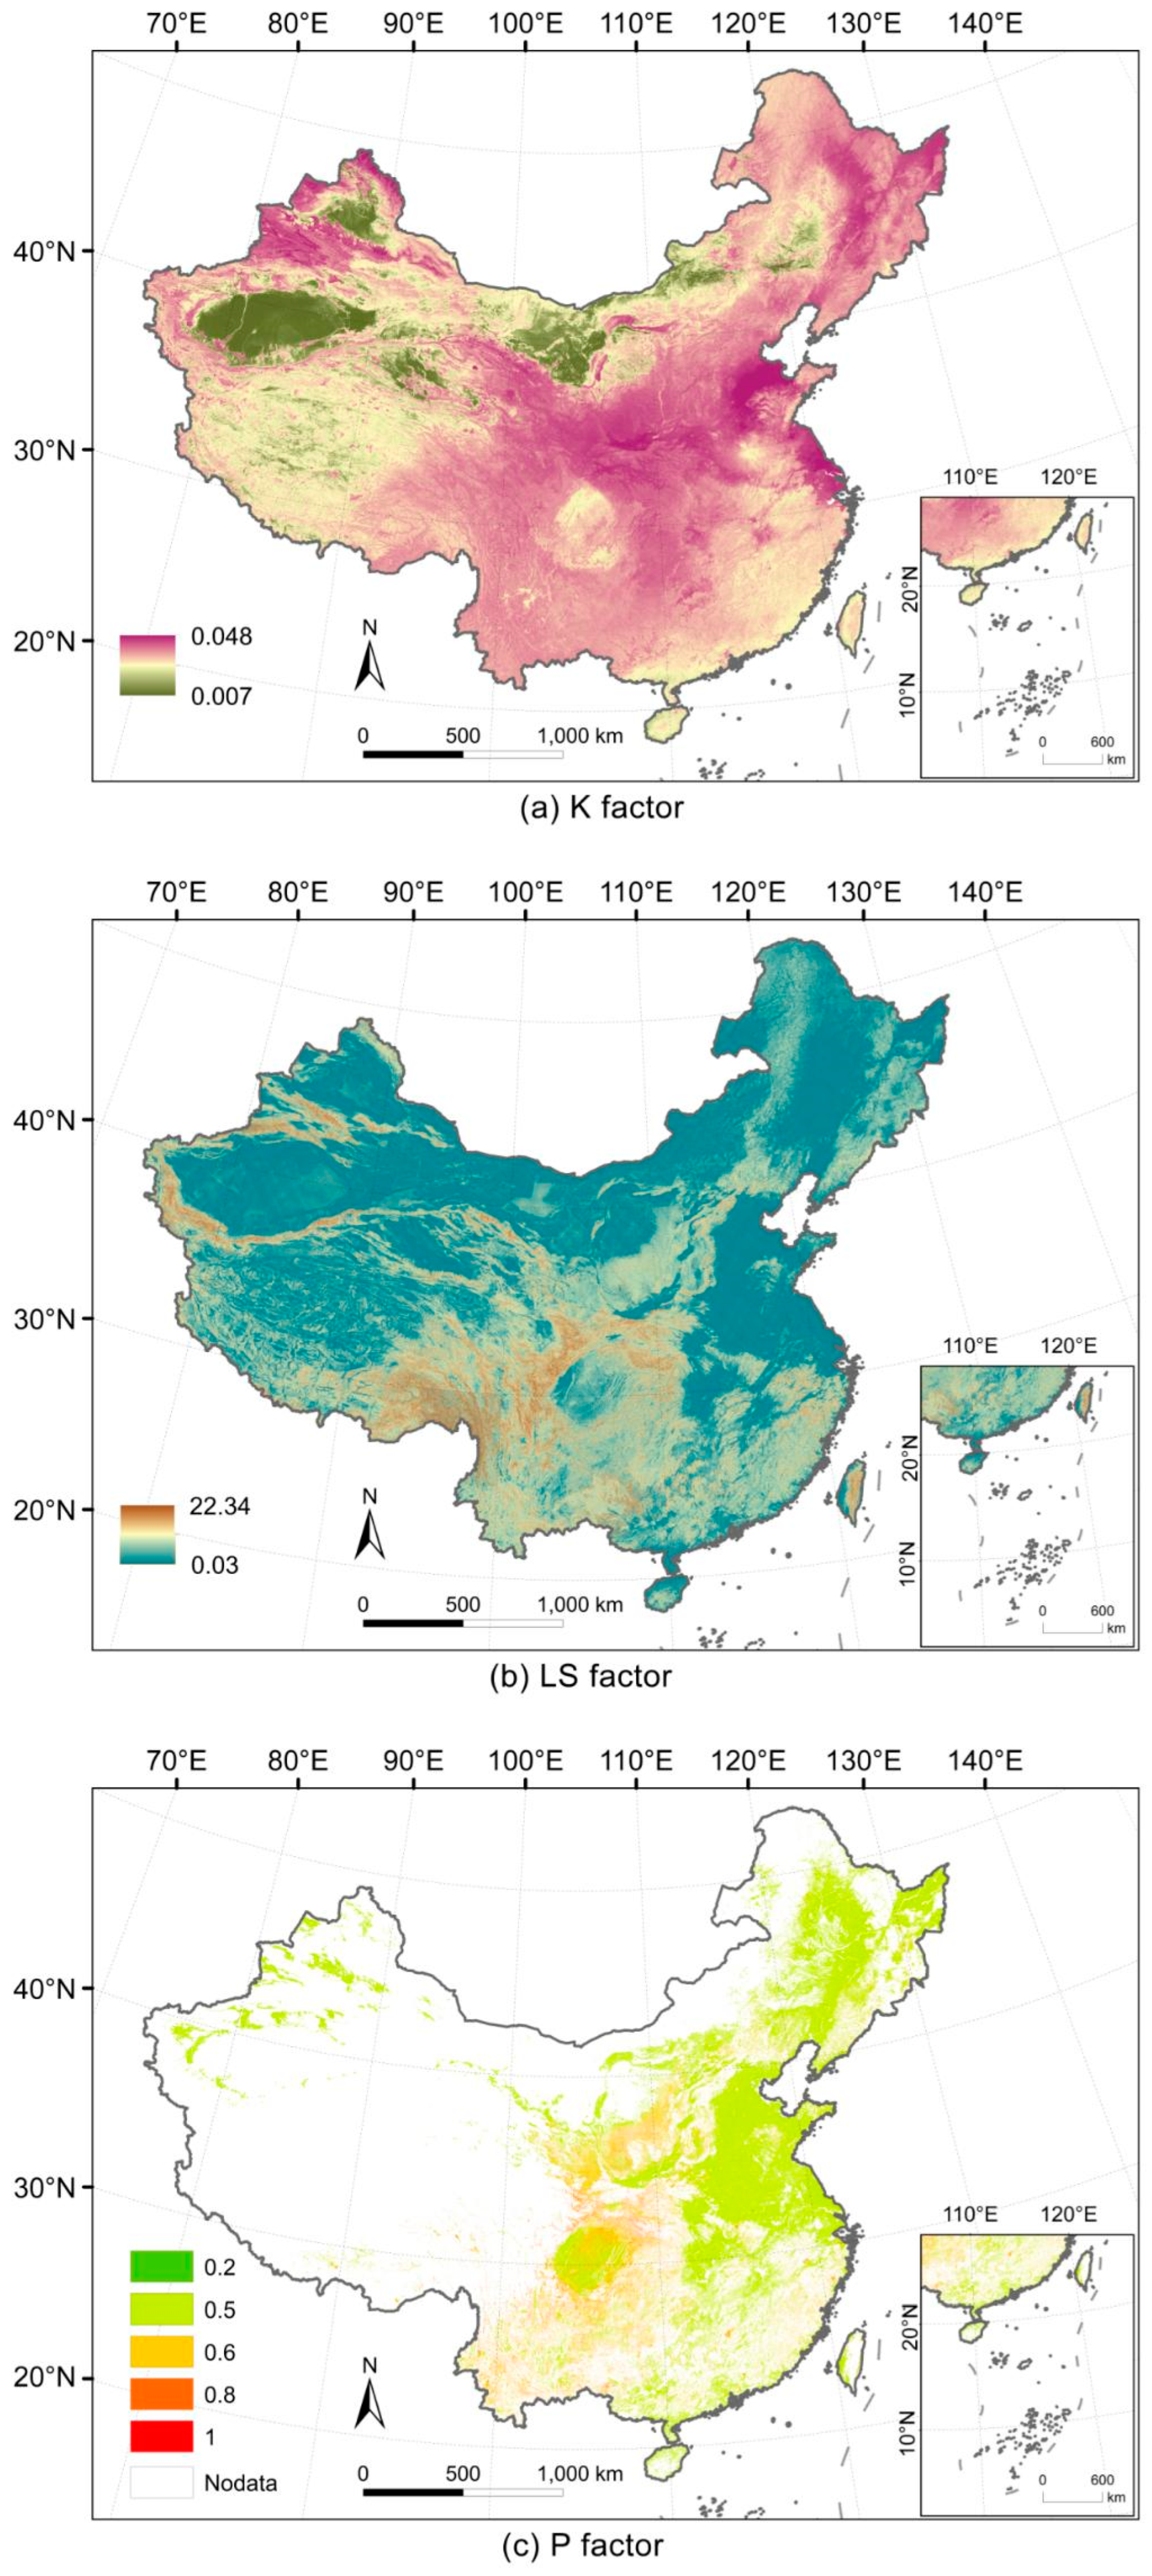
3.1. The Spatial Distribution of Physical Factors in the RUSLE Model

Over the past four decades, land cover and management factors and rainfall erosivity factors have exhibited dynamic temporal and spatial patterns. The mean values of land cover and management factors in the years 1980, 1990, 2000, 2010, and 2018 were 0.259, 0.261, 0.266, 0.265, and 0.265, respectively. In 2018, there was a 2.10% increase compared to 1980, likely attributable to expanded cropland areas (as shown in Table S1 of Supplementary Materials). This expansion resulted in a larger harvested area, subsequently influencing the land cover and management factors. Figure 3a–c reveal China’s cropland land cover and management factors are primarily concentrated in the northeast, while more scattered in the northwest and southwest, and lower in the southeast. In general, the result aligns well with the distribution of China’s key grain production areas.
Regarding rainfall erosivity, the annual average values for the years 1980, 1990, 2000, 2010, and 2018 were 9202 MJ·mm·h·ha−1·a−1, 9924 MJ·mm·h·ha−1·a−1, 8999 MJ·mm·h·ha−1·a−1, 10,538 MJ·mm·h·ha−1·a−1, and 9666 MJ·mm·h·ha−1·a−1, respectively. Figure 3d–f illustrate that the rainfall erosivity factors exhibit a general decline from the southeast to the northwest, with values spanning from over 8000 MJ·mm·h·ha−1·a−1 to less than 60 MJ·mm·h·ha−1·a−1. However, during 1980–2018, most areas experienced an increase in rainfall erosivity, except for a decrease in the middle-lower Yangtze River Plain. Notably, the northwestern regions and the Northeast China Plain showed significant increases. This pattern indicates an elevated risk of soil erosion, driven by intensified rainfall erosivity during this period.
While factors like soil erodibility, the slope length and slope steepness, and support practices are often considered constant over the long term, they still lead to a notable contribution to soil erosion. Regarding the soil erodibility factor, the central Northeast Plain, the northern section of the middle-lower Yangtze River Plain, and the middle part of the Huang-Huai-Hai Plain show high soil erodibility, which is likely due to the higher clay and silt contents in these areas (as shown in Figure 2e–g). Although soils that contain a considerable amount of clay and silt generally have high density, an excessive proportion of these components can lead to soil compaction, which may impede water infiltration and intensify surface runoff, thereby exacerbating soil erosion. Additionally, as shown in Figure 2h, cropland soils often have lower organic carbon content, which might result in a more porous and unstable structure, thus reducing the soil’s resistance to erosion. However, in regions such as the Northeast Plain and the Loess Plateau, where conservation tillage has been implemented, organic amendments have increased soil organic carbon content and enhanced the resistance to soil erosion. The assumption of a static K factor may lack the capability to capture the actual decrease in the K factor, which may result in an overestimation of soil erosion in croplands.
Regarding topography factors, regions such as the Sichuan Basin with its surrounding areas and the Yunnan-Guizhou Plateau show higher values due to local steep terrains that are prone to water erosion. The effect of topography on soil erosion suggests that the implementation of conservation practices on sloping croplands becomes increasingly difficult and less effective as the slope increases. As shown in Figure 4b,c, and Table 3, regions with steeper slopes are assigned P factor values closer to 1, reflecting that soil and water conservation measures in these areas are assumed to work less effectively. However, it is worth noting that this approach estimates the P factor indirectly based on slope and crop type, without accounting for regional variations in conservation practices. This simplification may introduce inaccuracies in regions where local conservation practices are particularly effective. For example, Figure 4c shows that high P factor values are concentrated in the Loess Plateau, the Sichuan Basin and its surrounding areas, and the Yunnan-Guizhou Plateau, mainly due to the steep terrain in these regions. However, with the implementation of the sloping cropland conversion efforts, much of the sloping cropland in these areas has been transformed into terraced fields. It is well known that terracing is effective in mitigating soil erosion, suggesting that the P factor values in these regions may be overestimated to some extent. Conversely, in the Northeast China Plain, the croplands generally show low P factor values in Figure 4c, which is consistent with the study’s assumption that areas with gentler slopes have more effective soil conservation. However, the widespread practice of ridge tillage in this region often aligns ridge direction with slope direction, which tends to accelerate surface runoff and significantly increase soil erosion. This indicates that the low slope in this region may not necessarily guarantee effective erosion control, and thus the P factor values here may be somewhat underestimated. Since the P factor is assigned based on slope values in this study, the accuracy of these estimates largely depends on the precision of the DEM data in capturing terrain characteristics. Nevertheless, high-resolution topographic data utilized in this study still provide a solid foundation for mapping high-resolution spatial cropland soil erosion in China.

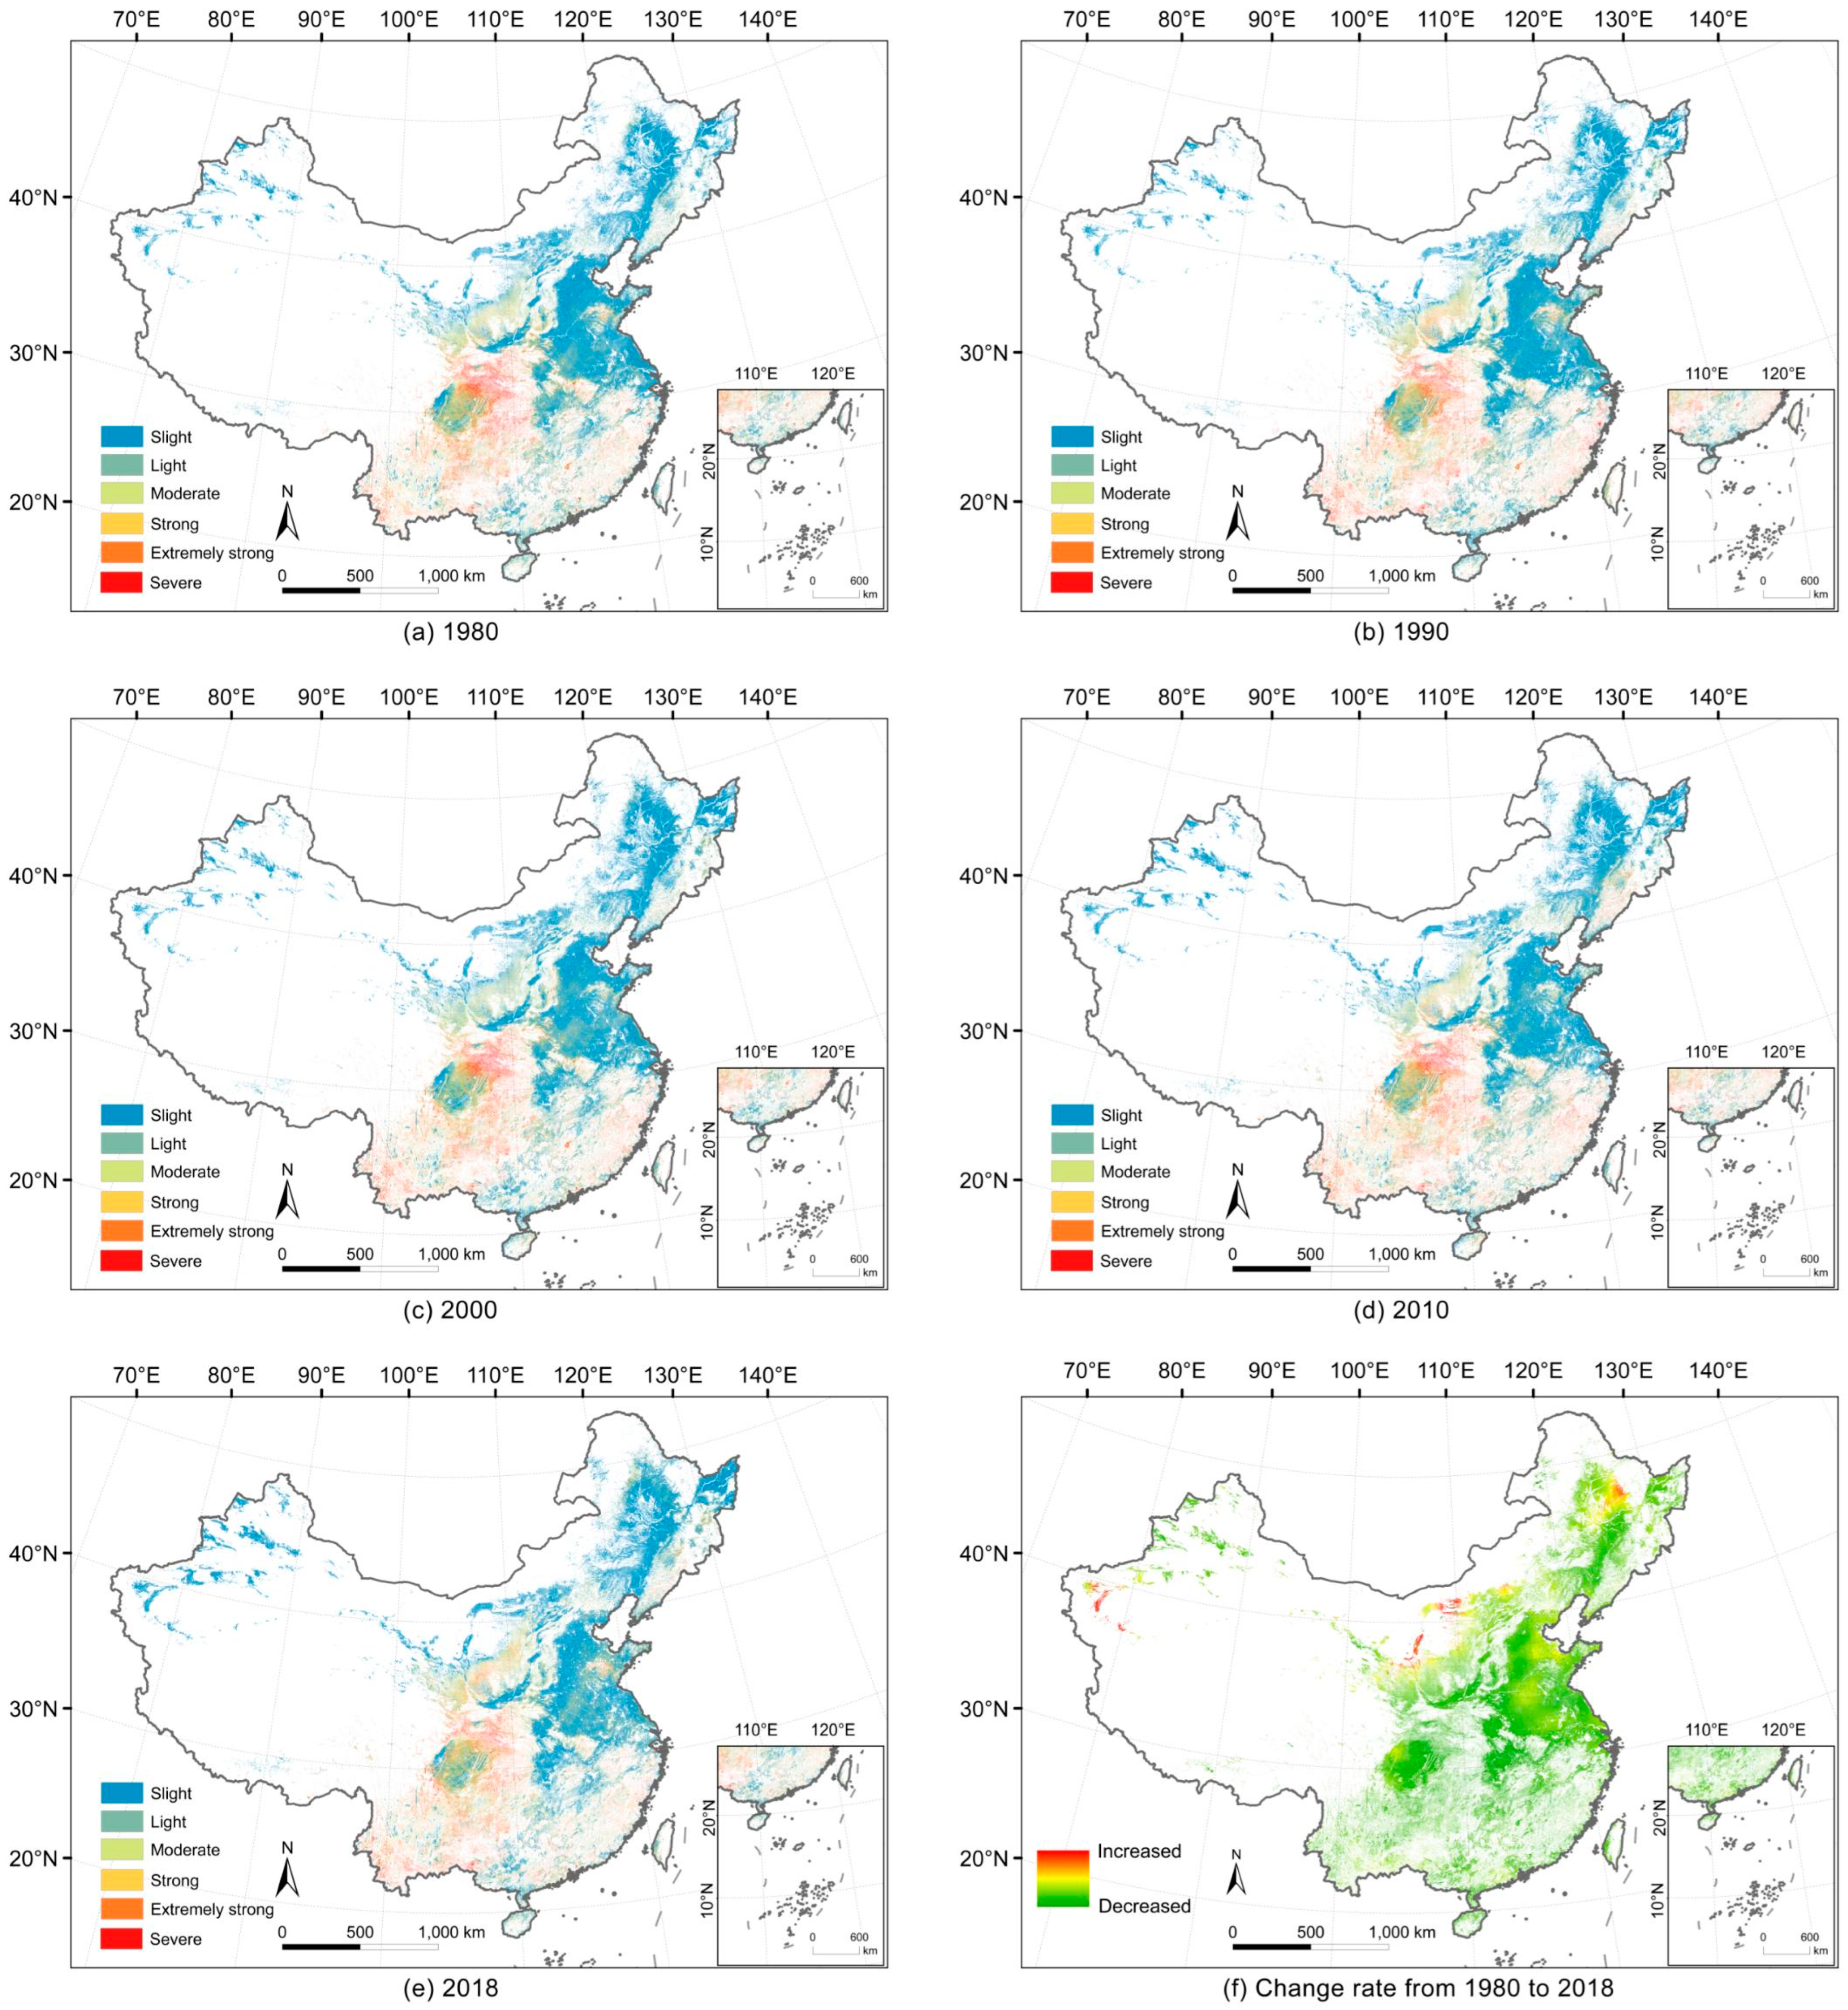
3.2. Temporal and Spatial Patterns of Cropland-Related Soil Erosion in China

3.2.1. Overview of Cropland-Related Soil Erosion in China

After resampling all factors to a 30 m resolution, annual cropland-related soil erosion rates in China were generated with the RUSLE model. Specifically, the erosion rates for the years 1980, 1990, 2000, 2010, and 2018 were 29.63 t·ha−1, 29.59 t·ha−1, 27.24 t·ha−1, 30.23 t·ha−1, and 26.39 t·ha−1, respectively. According to the Grading Standard [73], annual soil erosion rates were categorized into six intensity levels: slight, light, moderate, strong, extremely strong, and severe. Figure S1 (see Supplementary Materials for details) illustrates the soil erosion rates by different intensity levels, with the spatiotemporal distribution shown in Figure 5a–e. It is observed from Figure S1 that croplands undergoing slight erosion predominated during 1980–2018, comprising approximately 60% of China’s annual total soil erosion. Furthermore, when considering the shifts of cropland soil erosion area across China between 1980 and 2018 (as depicted in Table S1), the relatively stable proportion of the six erosion levels over the past forty years reveals a trend of early growth followed by a later decline in the area of these erosion levels.
Figure 5a–f illustrates the spatiotemporal distribution and variations in cropland-related soil erosion intensity in China between 1980 and 2018. Southern provinces, notably Sichuan, Yunnan, and Guizhou, are predominantly characterized by extremely strong and severe erosion. By comparing the distribution of croplands with topography, it is demonstrated that croplands in Sichuan, Yunnan, and Guizhou are mainly located on steeper slopes. These regions are characterized by abundant rainfall and are highly prone to soil erosion. In contrast, northern croplands generally experience slight erosion, especially in Heilongjiang, Shandong, Henan, Hebei, and the northwestern part of Xinjiang. It is also noted that although the Northeast Plain and the Huang-Huai-Hai Plain are primarily flat plains in topography, the extensive areas affected by erosion contribute to significant soil and water losses. In the northwestern Xinjiang region, especially those close to cities such as Urumqi and Kashgar, the burgeoning population and rising food demand have driven the conversion of fragile non-agricultural lands into croplands, thus exacerbating soil erosion. The northern areas with strong or extremely strong erosion are mainly located around the Loess Plateau. This is because the fine-particle and high-erodibility nature of Loess Plateau soil increases the susceptibility of croplands to erosion, which is further exacerbated by excessive exploitation and unsustainable land management practices.
Figure 5f reveals a declining trend in cropland-related soil erosion intensity across most regions in China during the past forty years, notably across regions such as the Loess Plateau, the Southwest Hilly Area, and the Northeast Plain. Conversely, areas experiencing a notable increase in erosion intensity were primarily located in central Heilongjiang, western Inner Mongolia, central and northern Ningxia, and northwestern Xinjiang. This reflects China’s agricultural shift towards the northwest and northeast regions, prompted by the economic growth in the southern regions, which resulted in the transformation of non-agricultural lands into croplands and increased the cultivated variety and harvested area. Consequently, the soil erosion rates have been intensified in these newly cultivated croplands.

3.2.2. Temporal and Spatial Changes of Cropland Soil Erosion in Different Agricultural Zones

Temporal and spatial changes of cropland soil erosion in different agricultural zones were analyzed in this section, which serves as a crucial tool for guiding and managing agricultural production. In China, there are multiple classifications of agricultural zoning based on different methodologies to group the varied agricultural landscapes. In this study, we adopted the classification from China’s Comprehensive Agricultural Zoning [74], which divides China into nine agricultural regions: the Huang-Huai-Hai Plain Region, the Loess Plateau Region, the Middle and Lower Reaches of the Yangtze River Region, the Northern Arid and Semi-Arid Region, the Northeast Plain Region, the Qinghai-Tibet Plateau Region, the Sichuan Basin and Surrounding Areas Region, the South China Region, and the Yunnan-Guizhou Plateau Region.
Figure 6 shows the trends and changes in soil erosion acreage and rates in nine agricultural regions from 1980 to 2018. Over the past forty years, while the erosion acreage in most agricultural regions has relatively remained stable, the Huang-Huai-Hai Plain Region and the Middle and Lower Yangtze River Region have exhibited a noticeable decrease due to continuing economic growth and urban expansion. Nevertheless, these regions maintain a prominent position in terms of cropland acreage, as they encompass coverage of several crucial grain-producing provinces in China, such as Henan, Shandong, and Jiangsu. In contrast, there is a substantial increase in erosion acreage in the Northern Arid and Semi-arid Region, the Northeast Plain Region, and the Qinghai-Tibet Plateau Region. The increase in erosion acreage of the first two regions could be attributed to the elevated national demand for food production [75]. For the Qinghai-Tibet Plateau Region, the growth in erosion acreage may be attributable to the socio-economic development and agricultural expansion [76]. In comparison, the Sichuan Basin and Surrounding Areas Region and the Yunnan-Guizhou Plateau Region have consistently featured high soil erosion rates due to the complex topography and abundant precipitation. However, in the past few years, efforts to restore unsuitable cropland and manage the sloping land in these regions have significantly reduced soil erosion intensity. The Loess Plateau, characterized by increasing conflicts between the fragile ecological environment and socioeconomic development, stands as one of the regions in China most severely impacted by soil erosion. The erosion control initiatives, including the Grains for Green Program and Soil and Water Conservation Project implemented in the Loess Plateau, have remarkably contributed to reducing soil erosion since 1980 and guaranteeing food production at the same time.

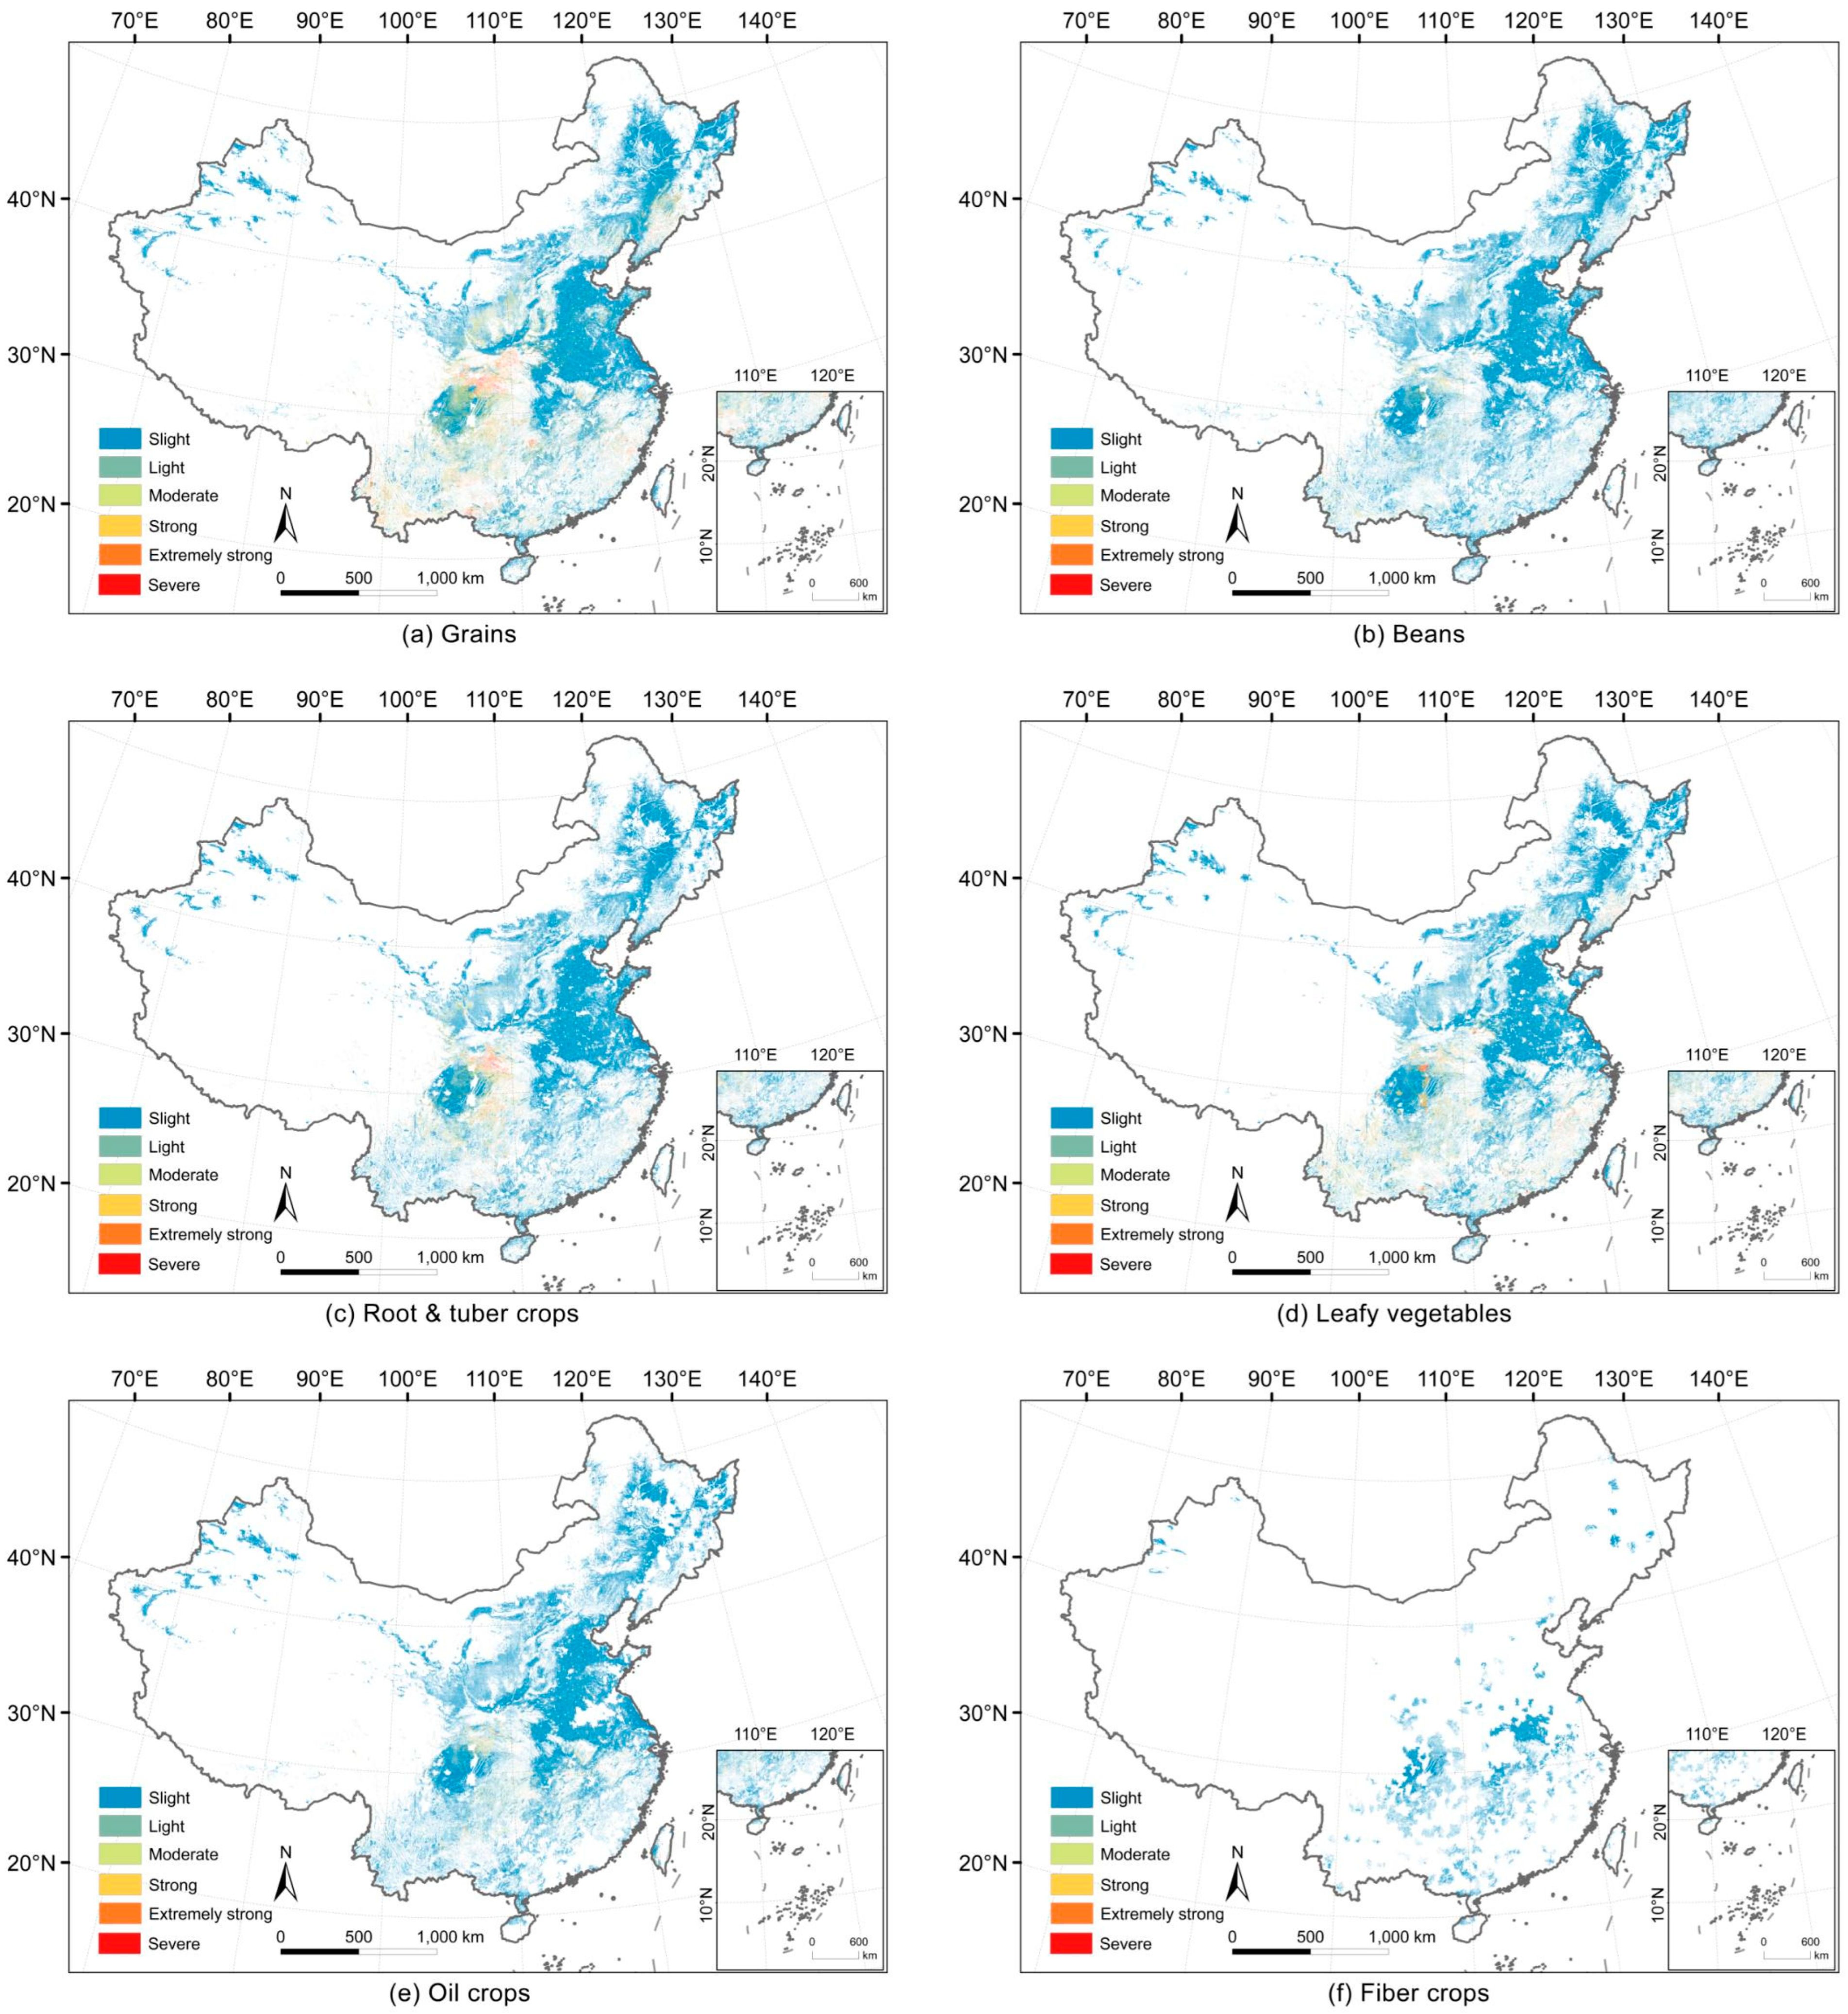
3.2.3. Crop-Specific Distribution of Soil Erosion

Noticeable spatial variations and magnitude differences in soil erosion rates categorized by different crop types were further observed. Considering the data availability and the accuracy for obtaining land cover and management factors, we employed the most comprehensive crop harvested area data, which was obtained from the Global Spatially-Disaggregated Crop Production Statistics Data Version 2.0 [50]. As illustrated in Figure 7a–h, we categorized the soil erosion rates for various crop types in 2010 into erosion intensity levels based on the Grading Standard. The intensities of soil erosion for these crops are generally ranked in descending order as follows: grains > leafy vegetables > root and tuber crops > beans > other crops > oil crops > shrubs, herbs, and spices > fiber crops (as shown in Table S2 of Supplementary Materials). High erosion rates in grain cultivation are primarily attributed to the extensive harvested area of grains, longer growth cycles with insufficient early-stage soil cover, and the use of traditional farming practices. In China, the harvest of grains is generally more prominent than that of other crop types [77]. Grains such as rice, wheat, and corn are the main food crops in China, with area and total production consistently ranking first among all crops [78,79]. Since the harvested area of crops directly influences soil erosion rates in this study, grains exhibit the highest soil erosion rates in croplands. Additionally, grain crops typically have a longer growth cycle, and during the early stages, insufficient soil cover may lead to prolonged exposure, making the soil more susceptible to erosion [80,81]. Furthermore, grain cultivation often relies on traditional farming practices such as plowing, which can compromise soil structure and increase its susceptibility to erosion [82,83]. In the northeastern part of Sichuan, notable increases in soil erosion are observed for grains, leafy vegetables, and root and tuber crops. Conversely, regions cultivating beans and oil crops predominantly exhibit low soil erosion intensity, with concentrations observed in Shandong, Henan, as well as the north and northeastern provinces. Soil erosion related to fiber crops and shrubs, herbs, and spices is concentrated in the southern regions, while it is rarely observed in the north.
Variations in the annual total cropland soil erosion are also widely observed across different agricultural zones. We calculated the annual total erosion for each crop type and categorized the results according to the classification from China’s Comprehensive Agricultural Zoning, as illustrated in Figure S2a–h. Taking grains, oil crops, and shrubs, herbs, and spices as examples, the Yunnan-Guizhou Plateau Region experienced the highest rates and annual total erosion for grains among all the nine regions. Soil erosion rates in this region were seven times higher than those in the Huang-Huai-Hai Plain Region, and the annual total erosion was 24 times higher than that in the Qinghai-Tibet Plateau (see Table S3 in Supplementary Materials). In terms of oil crops, the Middle and Lower Reaches of the Yangtze River Region has the highest annual total erosion for oil crops, while the Sichuan Basin and Surrounding Areas Region exhibits higher soil erosion rates. Additionally, annual average erosion rates for oil crops in the South China Region are second only to those in the Sichuan Basin and Surrounding Areas Region, yet they contributed only 23% to the annual total erosion in comparison (see Table S3). There are also noteworthy disparities in rates and annual total erosion for shrubs, herbs, and spices crops. Although the Yunnan-Guizhou Plateau Region records the highest annual total erosion for this crop type, its soil erosion rates are significantly lower than those in the Northern Arid and Semi-arid Region. This could be due to the extensive cultivation of shrub, herb, and spice crops (such as Hippophae rhamnoides, Astragalus membranaceus, and Angelica sinensis) in the Northern Arid and Semi-arid Region.

4. Discussion

4.1. Underlying Causes of Soil Erosion Changes

The implementation of agricultural policies has a notable effect on the soil erosion rates. Specifically, in 1999, the implementation of the Grains for Green Program has directly contributed to the reduction in cropland area. Since the implementation of this policy, agricultural development and activities in ecologically vulnerable regions have been reduced to some extent, with the conversion of croplands into afforestation and reforestation areas to restore and expand forest resources. Therefore, the observed decline in cropland soil erosion area after the peaking point in 2000 can be partially attributed to the implementation of this policy. Additionally, the crop types also contribute remarkably to both the rates and annual total soil erosion in cropland. For instance, grains have higher erosion rates compared to beans and oil crops, illustrating how different crops impact soil structure and erosion resistance. Consequently, the establishment of a rational crop planting structure is crucial for effectively mitigating soil erosion.
Land use development and resource utilization also serve as critical factors influencing soil erosion. Economic growth and urbanization have driven the transformation of cropland into urban areas in some regions, which has directly reduced the extent of cropland susceptibility to soil erosion. However, socioeconomic development could simultaneously exacerbate the occurrence of soil erosion. For instance, agricultural production is gradually shifting from economically prosperous southern regions to the northwest and northeast regions. The shift implies the conversion of more non-agricultural land into croplands in these areas.
Along with anthropogenic factors, the close correlation between climatic conditions and soil erosion rates should also be recognized. For example, the Sichuan Basin and Surrounding Areas Region and the Yunnan-Guizhou Plateau Region have exposed croplands to prolonged and elevated risks of soil erosion, attributed to the distinctive climate characteristics and topography. However, during the last few years, the execution of targeted erosion control initiatives has led to a significant reduction in soil erosion rates in these regions. This further indicates soil erosion could be comprehensively shaped by both agricultural policies and the natural environment.

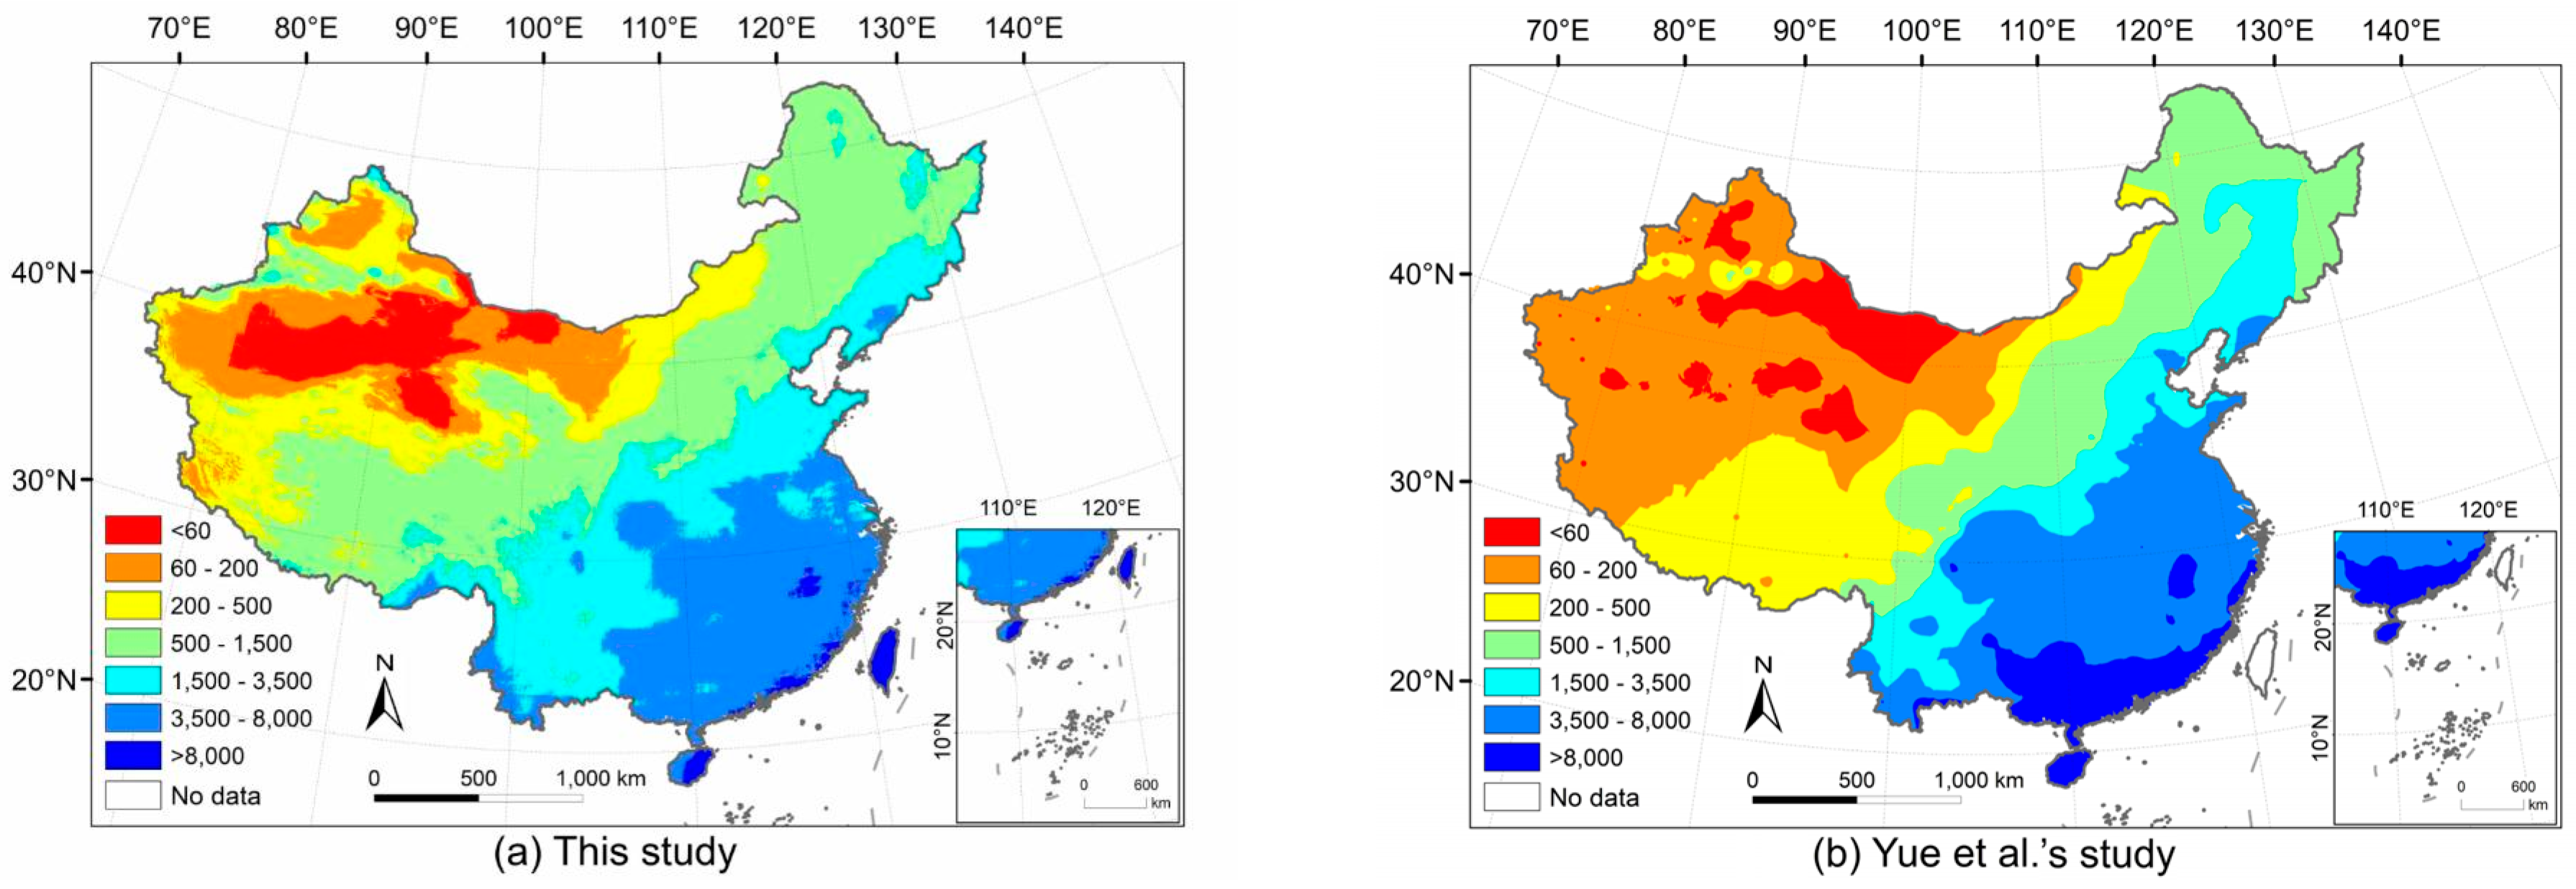
4.2. Comparison with Other Studies

Given the absence of dynamic spatiotemporal observational data, the national gridded-level soil erosion obtained from the RUSLE model should be validated from multiple aspects by combining both empirical data and existing assessments [53]. As demonstrated in existing studies, rainfall is the key factor driving soil erosion, and climate-induced changes in rainfall erosivity have shown a trend of precipitating the soil erosion [46,84]. Since the annual variations in cropland-based soil erosion are demonstrated in this study to be largely attributable to the spatial and temporal changes of rainfall erosivity, the accuracy of the rainfall erosivity factors is firstly validated, followed by testing the accuracy of soil erosion acreage and distribution.
Currently, China’s rainfall erosivity map developed by Yue et al. [85] exhibits a comparatively high level of reliability, both in terms of algorithm precision and the temporal resolution of rainfall data, which is therefore adopted in this study for comparison. In their study, the daily rainfall-derived erosivity was assessed against the actual erosivity derived from 1-min interval data, revealing underestimation for values exceeding 10,000 MJ·mm·h·ha−1·a−1 and overestimation for those under 2000 MJ·mm·h·ha−1·a−1. When contrasted with Yue et al.’s work [85] (shown in Figure 8), our study shows that R factors exhibit underestimation when exceeding 8000 MJ·mm·h·ha−1·a−1 and a slight overestimation when falling below 1500 MJ·mm·h·ha−1·a−1. The differences in results are caused by the diverse data employed: our study estimated rainfall erosivity based on daily rainfall grid data provided by Qin et al. [57], while Yue et al. [85] mainly relied on daily rainfall data collected from meteorological stations. Nevertheless, the ranges of underestimation and overestimation in this study align with those calculated by Yue et al. [85] (see Table S4). Therefore, the rainfall erosivity obtained in this study demonstrates a comparably reliable accuracy.
The cropland-related soil erosion was then validated as below by comparison with the results obtained from existing studies. At the national scale, we extracted the data for China for the year 2019 based on the GloSEM Version 1.3 dataset [43]. Both the soil erosion map by Borrelli et al. [43] (Figure 7a) and that by our study (Figure 9b) show similar spatial distribution characteristics, with primary erosion hotspots concentrated in the Yunnan-Guizhou Plateau Region, the Loess Plateau Region, the Northeast Plain Region, and the Sichuan Basin and Surrounding Areas Region. However, it is worth noting the cropland area, according to Borrelli et al. [43], is larger than that in our work. This might be attributed to Borrelli et al. [43] utilizing the Copernicus Global Land Service land use data derived from the European Space Agency (ESA) [86]. This data provides a broader distribution of cropland compared to China’s multi-period land use remote sensing monitoring dataset [54] utilized in our study. Thus, the erosion is notably prominent in the southwest and south, as shown in the study by Borrelli et al. [43] (Figure 9a).
Furthermore, we compared our results with the cropland-related soil erosion extracted from the soil erosion map for all land use types in China on a 300 m spatial resolution provided by Li et al. [23]. Our results demonstrate a strong alignment with the findings of Li et al. [23] (see Figure 9c), who validated their soil erosion simulation results by comparison with field measurements. Their results indicated that the simulations for croplands were close to the observed values. This further validates the reliability of our results and supports the accuracy of the factor calculation method used in our study. However, our results showed an underestimation in the southwestern area compared to Li et al.’s work [23]. This difference might be due to the fact that our study applied the same empirical relationship model for rainfall erosivity across different regions, while Li et al. [23] selected a rainfall erosivity model that better aligns with the geological layout of the southwestern region, leading to a more accurate representation in some areas.
The results of this study were also validated at the regional scale, for which we selected the Pearl River Basin for comparison by referring to the study by Mu et al. [87] (as depicted in Figure 10m,n). The Pearl River Basin is characterized by abundant arable land resources, complex terrain, and concentrated precipitation, which makes the region susceptible to severe soil erosion. By comparison, it is demonstrated that the soil erosion rates in our study may appear to be higher than Mu et al.’s study [87], which is mainly because Mu et al. [87] primarily utilized NDVI for calculating land cover and management factors and monthly rainfall data for the rainfall erosivity factor. Moreover, to further validate our results, we conducted regional-scale comparisons in terms of hotspots for cropland-related soil erosion (as shown in Figure 10a–l), such as the Yunnan-Guizhou Plateau Region, the Loess Plateau Region, the Northeast Plain Region, and the Sichuan Basin and Surrounding Areas Region, which are obtained from the national or global scale studies mentioned in Figure 9. Hence, the accuracy of our results is robustly validated by these comparisons.
Given the scarcity of studies exclusively focusing on cropland-related soil erosion, we further conducted numerical comparisons with existing regional-scale research that primarily pays attention to regions predominantly impacted by cropland-related erosion. From 1980 to 2010, the calculated average soil erosion rate in the Loess Plateau was 41.30 t·ha−1·a−1 (see Table S5 in Supplementary Materials), aligning closely with the previously reported 34.01 t·ha−1·a−1 for 1980–2009 from Li et al. [88]. For the Qinghai-Tibet Plateau, our study computed the average soil erosion rate of 18.37 t·ha−1·a−1 from 2000 to 2018 (see Table S5), which differs from Teng et al.’s [39] results obtained for 2002–2016. Possible explanations for this difference include variations in land use and land cover types considered and distinctions in the geographical coverage of the study areas. In addition, Yin et al. [89] noted that the western parts of the Yin Mountains and the Helan Mountains in the Yellow River Basin have emerged as new erosion hotspots, which corresponds to the north-central region of Ningxia, where our results reveal a notable increase in soil erosion intensity from 1980 to 2018 (see Figure 5f). These findings thus further consolidate the reliability of our results.

4.3. Limitations

The limitations of this study are summarized below. While RUSLE offers a practical approach for regional-scale assessments, we acknowledge its limitations in capturing the comprehensive erosion process. Specifically, RUSLE estimates are limited to sheet and rill erosion. They do not account for gully erosion, sediment deposition, or the lateral connectivity of flow paths, all of which can impact sediment redistribution and landscape evolution. Given these limitations, the erosion rates presented in this study should be interpreted with caution, particularly in areas where more complex erosion processes are predominant. However, previous studies suggest that when at broader scales, the performance of RUSLE is comparable to that of more complex models like WEPP, and the simplicity of RUSLE facilitates harmonized assessments across time and space [90,91,92]. To better capture deposition dynamics and spatial connectivity in data-rich regions, RUSLE outputs can be integrated with sediment transport models or coupled with process-based approaches in future studies. In addition, advances in remote sensing and high-resolution datasets would help to improve the parameterization of process-based models, thereby extending their applicability in large-scale studies.
The method used in this study to calculate RUSLE factors still has limitations, one of which lies in the temporal mismatch between the crop-specific harvested area data and the land use data spanning 1980–2018. Given China’s agricultural reforms during this period, it is likely that crop patterns and harvested areas may have changed significantly. However, using crop harvested area data from 2010 to represent the entire study period may not fully capture the dynamic changes in cropping patterns that occurred during China’s agricultural reforms. Although this approach has been widely used in global and regional soil erosion assessments, and we have also accounted for cropland changes across different years, it may introduce inaccuracies when extrapolating harvested area data across long periods. In the future, it would be beneficial to develop more continuous, high-resolution datasets for crop areas to better represent the dynamic characteristics of cropping systems over time.
The use of a static K factor restricts the ability to capture soil dynamics due to the data limitations. It overlooks long-term degradation processes and the spatial heterogeneity introduced by sustainable management practices, such as organic amendments and conservation tillage, which can alter soil erosion sensitivity at the field scale. Although most global and national soil erosion assessments face these limitations due to current data constraints, novel approaches that combine dynamic soil models with advanced remote sensing technologies for soil property monitoring offer a promising way to address these challenges in future research.
It is also important to acknowledge that the P factor in this study is indirectly estimated based on land slope and crop type, following a method widely used in large-scale assessments of soil erosion in China [23,46,52]. While this approach provides a practical means of parameterization given the lack of high-resolution, region-specific data on conservation practices, it does not capture local variations in the type, intensity, and effectiveness of soil and water conservation measures. Such simplification may lead to inaccuracies in representing the actual effectiveness of support practices, particularly in regions where well-developed, localized conservation strategies have been implemented. Despite this limitation, the derived P factor in this study still reflects the general tendency of a decline in conservation efficiency with increasing slope. Nevertheless, the development of high-resolution datasets that capture the spatial and temporal dynamics of soil conservation practices would significantly improve the capacity to conduct more rigorous sensitivity assessments of the P factor, thereby enabling more precise evaluations of the effectiveness of region-specific conservation measures over time.
Moreover, the adoption of criteria for categorizing crop types or geographic regions may have a notable impact on the results. In this study, we adopted a classification based on the influence of crops on soil cover, as outlined by Borrelli et al. [9] and Panagos et al. [51]. However, for crops like cotton, which could be classified as either an oil crop or a fiber crop, we designated it as an oil crop in our classification (see Table S6 in the Supplementary Materials). This classification was based on the crop harvest area data that were derived from a combination of FAOSTAT, national agricultural censuses, and remote sensing data [49,50]. In the process of generating this dataset, cotton was classified as an oil crop, meaning that the harvest area for cotton reflects the portion cultivated for oil extraction, excluding the fiber-producing portion. Although cotton is commonly categorized as a fiber crop in China, the integration of inconsistent statistical criteria could lead to potential errors. Therefore, we classified cotton as an oil crop. This introduces variations in obtaining the corresponding land cover and management factors, potentially leading to inaccuracies in the regional analysis of soil erosion rates or total soil erosion for different crops. Once new crop harvest area datasets that could more accurately reflect China’s agricultural production become available, they can be integrated into the modeling framework to assess the spatiotemporal patterns of crop-induced soil erosion with greater precision.
Regarding geographical delineations, our study differs from traditional regional divisions by using the classification from China’s Comprehensive Agricultural Zoning, such as the Loess Plateau Region, the Qinghai-Tibet Plateau Region, and the Southern China Region. As a result, certain disparities may appear when comparing the results with previous studies. Therefore, it is essential to conduct further comparisons of the applicability of different datasets and algorithms and to seek standards for agricultural zoning that better align with the current state of agriculture in China. This will enhance the capability to accurately identify evolution patterns in cropland soil erosion changes across the country.

4.4. Policy Implications

Soil erosion is a pressing challenge for agricultural sustainability in China due to significant variations across crop types and regions. To mitigate soil erosion in China, it is essential to implement targeted policies that take into account regional and crop-specific factors.
A feasible strategy to address soil erosion is promoting conservation farming practices tailored to different crop types. For crops like grains and leafy vegetables, which exhibit high erosion rates, adopting soil conservation measures such as cover cropping, mulching, and reduced tillage can significantly reduce soil disturbance and improve ground cover. These practices not only help in erosion control but also enhance soil fertility over time. Another key approach to preserving soil is to encourage agricultural diversification. In regions like the Sichuan basin where soil erosion is severe, promoting crop rotation is another viable solution. Rotating high-erosion crops, such as grains, with low-erosion crops like legumes can help mitigate soil erosion and enhance soil health. Additionally, integrating tree planting and agroforestry systems can stabilize the soil (particularly in erosion-prone areas) and reduce the impacts of runoff during heavy rains.
Developing advanced soil erosion monitoring technologies, along with remote sensing and GIS tools, can support the generation of long-term, high-precision datasets on crop harvest, soil properties, and support practices. These datasets will enable real-time tracking of soil erosion in vulnerable areas. The data-driven approach can provide tailored recommendations for governments and farmers on how to effectively manage soil erosion risks. To support these efforts, government policies should include subsidies for adopting conservation practices. Financial incentives can encourage farmers to implement erosion control techniques for crops with high erosion rates. Based on the high-resolution spatial crop-specific soil erosion maps from this study, China is revealed to have great potential to significantly reduce soil erosion, enhance agricultural sustainability, and ensure long-term food security through implementing the above policies and strategies.

5. Conclusions

This study depicted an overall picture of 30 m × 30 m crop-specific soil erosion in China from 1980 to 2018 by utilizing the RUSLE model and high-resolution spatiotemporal remote sensing datasets. The results revealed significant spatial variations in cropland-related soil erosion, along with cropland land cover and management factors and rainfall erosivity factors over the past four decades.
Over the past four decades, cropland-related soil erosion was found to be primarily characterized by slight intensity. Regions with strong and severe erosion intensity were predominantly located in the southern provinces, particularly in Sichuan, Yunnan, and Guizhou provinces. In northern regions, croplands were mainly marked by slight erosion, while severe erosion was concentrated in the Loess Plateau. Focusing on the trajectory for soil erosion intensity, most regions showed a decreasing trend influenced by agricultural policy implementations, agricultural shifts, and variations in crop planting patterns. However, there has been an intensification of erosion observed in central Heilongjiang, western Inner Mongolia, central and northern Ningxia, and the northwest side of Xinjiang. In terms of agricultural zoning, cropland-related soil erosion acreage remained stable in most agricultural regions over the past four decades. Nevertheless, there was a declining trend in the Huang-Huai-Hai Plain Region and the Middle and Lower Reaches of the Yangtze River Region, while notable increases were observed in the Northern Arid and Semi-arid Region and the Qinghai-Tibet Plateau Region. With the introduction of the Grains for Green Program and Soil and Water Conservation Project, the Loess Plateau Region, among the regions most severely affected by soil erosion across China, has experienced reduced erosion intensity since 1980. Moreover, different crop types exhibited distinct spatial patterns in the cropland-related soil erosion rates, with noticeable differences in magnitudes. Overall, grains exhibit the highest erosion intensity, while fiber crops have the lowest.
Based on the results of this study, it is considered imperative to enhance dynamic soil erosion monitoring in regions where cropland-related erosion shows an upward trend. In addition, conservation measures for soil and water resources should be consistently strengthened and expanded across these areas. Furthermore, given the heterogeneous impacts of different crops on soil erosion, it is crucial to optimize crop planting patterns or promote diversified cultivation in erosion hotspot regions for the purpose of mitigating soil erosion. Overall, this study analyzed the spatiotemporal evolution characteristics of cropland-related soil erosion in China and potential influencing factors, which can provide a solid foundation for combating environmental degradation and promoting sustainable land management.

Supplementary Materials

The following supporting information can be downloaded at: https://www.mdpi.com/article/10.3390/rs17091611/s1, Figure S1: The proportion of cropland area affected by different soil erosion intensities in China from 1980 to 2018; Figure S2: Soil erosion rates (the size of the rectangle area*) and annual total erosion (the color intensity of the rectangle*) of different crops in different agricultural regions of China in 2010; Table S1: Statistics of cropland and soil erosion in China from 1980–2018; Table S2: Soil erosion rates of different crops in 2010; Table S3: Soil erosion rates (t·ha−1) and annual total erosion (Mt) of different crops from different agricultural regions in 2010; Table S4: Comparison between this study and Yue et al.’s [85] study on rainfall erosivity; Table S5: Soil erosion rates (t·ha−1) and erosion acreage (104 ha) in different agricultural regions from 1980 to 2018; Table S6: The classification of 42 major crops from the Global Spatially-Disaggregated Crop Production Statistics Data for 2010 Version 2.0 [50] based on Borrelli et al. [9]’s classification standard.

Author Contributions

Conceptualization, X.W.; methodology, T.Z.; validation, Y.X.; formal analysis, Y.X., T.Z. and X.W.; investigation, Y.X.; data curation, Y.X.; writing—original draft preparation, Y.X.; writing—review and editing, T.Z., Z.Z. and X.W.; visualization, Y.X. and T.Z.; supervision, X.W.; project administration, X.W.; funding acquisition, X.W. All authors have read and agreed to the published version of the manuscript.

Funding

The Young Talent Promotion Project of China Association for Science and Technology (No. 2020-2022QNRC002) and the Research Fellowship provided by Alexander von Humboldt Foundation (Recipient: Xudong Wu) and the Project Supported by Science Foundation of Hebei Normal University (No: L2025B29).

Data Availability Statement

The output dataset is available in https://doi.org/10.57760/sciencedb.23854, which includes both the RUSLE factors and the soil erosion rate gridded data for China’s croplands (1980–2018) differentiated by crop types at a resolution of 30 m. It contains gridded data for RUSLE factors (‘C_year.tif’, ‘R_year.tif’, ‘K_factor.tif’, ‘LS_factor.tif’, ‘P_factor.tif’), and the soil erosion rate for China’s croplands from 1980 to 2018 (‘A_year.tif’) as well as that for different crop types (‘A_cn.tif’). Here, ‘year’ specifies the specific year corresponding to the data, while ‘n’ refers to various crop types. The MATLAB code that is used to preprocess the land cover and management factors, as well as the rainfall erosivity, is available in https://github.com/YettimXie/Spatiotemporal-evolution-of-cropland-related-soil-erosion-in-China-over-the-past-four-decades.git (accessed on 21 April 2025).

Conflicts of Interest

The authors declare no conflict of interest.

References

  1. Food and Agriculture Organization of the United Nations. Status of the World’s Soil Resources. 2015. Available online: http://www.fao.org/3/a-i5199e.pdf (accessed on 25 October 2023).
  2. Hou, L. Soil Degradation in China: Implications for Agricultural Sustainability, Food Security and the Environment. Ph.D. Thesis, Colorado State University, Fort Collins, CO, USA, 2005. Available online: https://api.mountainscholar.org/server/api/core/bitstreams/fd753e65-10ff-4164-907d-a284bff3bc8c/content (accessed on 5 September 2023).
  3. Kan, S.; Chen, B.; Han, M.; Hayat, T.; Alsulami, H.; Chen, G. China’s forest land use change in the globalized world economy: Foreign trade and unequal household consumption. Land Use Policy 2021, 103, 105324. [Google Scholar] [CrossRef]
  4. Montanarella, L.; Pennock, D.J.; McKenzie, N.; Badraoui, M.; Chude, V.; Baptista, I.; Mamo, T.; Yemefack, M.; Aulakh, M.S.; Yagi, K.; et al. World’s soils are under threat. Soil 2016, 2, 79–82. [Google Scholar] [CrossRef]
  5. Wei, C.; Liu, X.; Zhang, L.; Wan, Y.; Huang, G.; Lu, Y.; Zhang, X. Resilience analysis of global agricultural trade. Environ. Plan. B Urban Anal. City Sci. 2024, 51, 1003–1006. [Google Scholar] [CrossRef]
  6. Zhang, Y.; Guan, C.; Chen, B.; Zeng, L.; Zhang, B. Tracking embodied water uses and GHG emissions along Chinese supply chains. J. Clean. Prod. 2021, 288, 125590. [Google Scholar] [CrossRef]
  7. Ge, D.; Long, H.; Zhang, Y.; Ma, L.; Li, T. Farmland transition and its influences on grain production in China. Land Use Policy 2018, 70, 94–105. [Google Scholar] [CrossRef]
  8. Montgomery, D.R. Soil erosion and agricultural sustainability. Proc. Natl Acad. Sci. USA 2007, 104, 13268–13272. [Google Scholar] [CrossRef]
  9. Borrelli, P.; Robinson, D.A.; Fleischer, L.R.; Lugato, E.; Ballabio, C.; Alewell, C.; Meusburger, K.; Modugno, S.; Schütt, B.; Ferro, V.; et al. An assessment of the global impact of 21st century land use change on soil erosion. Nat. Commun. 2017, 8, 2013. [Google Scholar] [CrossRef]
  10. Pradhan, P.; Kropp, J.P. Interplay between diets, health, and climate change. Sustainability 2020, 12, 3878. [Google Scholar] [CrossRef]
  11. Van, O.K.; Quine, T.A.; Govers, G.; De Gryze, S.; Six, J.; Harden, J.W.; Ritchie, J.C.; McCarty, G.W.; Heckrath, G.; Kosmas, C.; et al. The impact of agricultural soil Erosion on the global carbon cycle. Science 2007, 318, 626–629. [Google Scholar] [CrossRef]
  12. Panditharathne, D.L.D.; Abeysingha, N.S.; Nirmanee, K.G.S.; Mallawatantri, A. Application of Revised Universal Soil Loss Equation (RUSLE) Model to assess soil erosion in “Kalu Ganga” river basin in Sri Lanka. Appl. Environ. Soil Sci. 2019, 2019, 4037379. [Google Scholar] [CrossRef]
  13. United Nations Environment Programme. Annual Report 2021. Available online: https://www.unep.org/resources/annual-report-2021 (accessed on 7 November 2023).
  14. Wang, J.; Wang, Z.; Li, K.; Li, C.; Wen, F.; Shi, Z. Factors affecting phase change in coupling coordination between population, crop yield, and soil erosion in China’s 281 cities. Land Use Policy 2023, 132, 106761. [Google Scholar] [CrossRef]
  15. Heilig, G.K. RAPS-China: A Regional Analysis and Planning System; International Institute for Applied Systems Analysis: Laxenburg, Austria, 2004. [Google Scholar] [CrossRef]
  16. Teng, H.; Hu, J.; Zhou, Y.; Zhou, L.; Shi, Z. Modelling and mapping soil erosion potential in China. J. Integr. Agric. 2019, 18, 251–264. [Google Scholar] [CrossRef]
  17. Feng, X.; Suo, Y.; Zeng, X. Soil erosion in China based on the 2000 national remote sensing survey. J. Geogr. Sci. 2002, 12, 435–442. [Google Scholar] [CrossRef]
  18. Guo, Y. The present situation, problems and countermeasures of cultivated land resources in China. J. Pet. Educ. Inst. Xinjiang 2002, 6. (In Chinese) [Google Scholar]
  19. General Office of the State Council of China. The Opinions of the General Office of the State Council on Effectively Strengthening the Construction of High-Standard Farmland and Enhancing the National Food Security Guarantee Capability; General Office of the State Council of China: Beijing, China, 2019. Available online: https://www.gov.cn/xinwen/2019-11/21/content_5454258.htm (accessed on 11 November 2023).
  20. Liu, B.; Xie, Y.; Li, Z.; Liang, Y.; Zhang, W.; Fu, S.; Yin, S.; Wei, X.; Zhang, K.; Wang, Z.; et al. The assessment of soil loss by water erosion in China. Int. Soil Water Conserv. Res. 2020, 8, 430–439. [Google Scholar] [CrossRef]
  21. García-Ruiz, J.M. The effects of land uses on soil erosion in Spain: A review. Catena 2010, 81, 1–11. [Google Scholar] [CrossRef]
  22. Kassam, A.; Friedrich, T.; Shaxson, F.; Pretty, J. The spread of conservation agriculture: Justification, sustainability and uptake. Int. J. Agric. Sustain. 2009, 7, 292–320. [Google Scholar] [CrossRef]
  23. Li, J.; He, H.; Zeng, Q.; Chen, L.; Sun, R. A Chinese soil conservation dataset preventing soil water erosion from 1992 to 2019. Sci. Data 2023, 10, 319. [Google Scholar] [CrossRef]
  24. Wei, C.; Blaschke, T.; Kazakopoulos, P.; Taubenböck, H.; Tiede, D. Is Spatial Resolution Critical in Urbanization Velocity Analysis? Investigations in the Pearl River Delta. Remote Sens. 2017, 9, 80. [Google Scholar] [CrossRef]
  25. Zhang, T.; Cheng, C.; Wu, X. Mapping the spatial heterogeneity of global land use and land cover from 2020 to 2100 at a 1 km resolution. Sci. Data 2023, 10, 748. [Google Scholar] [CrossRef]
  26. Kumar, M.; Sahu, A.P.; Sahoo, N.; Dash, S.S.; Raul, S.K.; Panigrahi, B. Global-scale application of the RUSLE model: A comprehensive review. Hydrol. Sci. J. 2022, 67, 806–830. [Google Scholar] [CrossRef]
  27. Risse, L.M.; Nearing, M.A.; Laflen, J.M.; Nicks, A.D. Error assessment in the universal soil loss equation. Soil Sci. Soc. Am. J. 1993, 57, 825. [Google Scholar] [CrossRef]
  28. Borrelli, P.; Alewell, C.; Alvarez, P.; Anache, J.A.A.; Baartman, J.; Ballabio, C.; Bezak, N.; Biddoccu, M.; Cerdà, A.; Chalise, D.; et al. Soil erosion modelling: A global review and statistical analysis. Sci. Total Environ. 2021, 780, 146494. [Google Scholar] [CrossRef] [PubMed]
  29. Batista, P.V.; Davies, J.; Silva, M.L.; Quinton, J.N. On the evaluation of soil erosion models: Are we doing enough? Earth-Sci. Rev. 2019, 197, 102898. [Google Scholar] [CrossRef]
  30. Arnold, J.G.; Srinivasan, R.; Muttiah, R.S.; Williams, J.R. Large area hydrologic modeling and assessment part I: Model development 1. JAWRA J. Am. Water Resour. Assoc. 1998, 34, 73–89. [Google Scholar] [CrossRef]
  31. Golkarian, A.; Khosravi, K.; Panahi, M.; Clague, J.J. Spatial variability of soil water erosion: Comparing empirical and intelligent techniques. Geosci. Front. 2023, 14, 101456. [Google Scholar] [CrossRef]
  32. Zhu, T.; Xu, X. Sheet and Rill Erosion. In Watershed Erosion Processes. Geography of the Physical Environment; Springer: Cham, Switzerland, 2021. [Google Scholar]
  33. Wischmeier, W.H.; Smith, D.D. Predicting Rainfall Erosion Losses: A Guide to Conservation Planning; Science and Education Administration, United States Department of Agriculture: Washington, DC, USA, 1978. [Google Scholar]
  34. Chuenchum, P.; Xu, M.; Tang, W. Predicted trends of soil erosion and sediment yield from future land use and climate change scenarios in the Lancang–Mekong River by using the modified RUSLE model. Int. Soil Water Conserv. Res. 2020, 8, 213–227. [Google Scholar] [CrossRef]
  35. Gao, F.; Wang, Y.; Yang, J. Assessing soil erosion using USLE model and MODIS data in the Guangdong, China. IOP Conf. Ser. Earth Environ. Sci. 2017, 74, 12007. [Google Scholar] [CrossRef]
  36. Rao, W.; Shen, Z.; Duan, X. Spatiotemporal patterns and drivers of soil erosion in Yunnan, Southwest China: RULSE assessments for recent 30 years and future predictions based on CMIP6. Catena 2023, 220, 106703. [Google Scholar] [CrossRef]
  37. Wu, D.; Peng, R.; Huang, L.; Cao, W.; Huhe, T. Spatio-temporal analysis and driving factors of soil water erosion in the three-river headwaters region, China. Water 2022, 14, 4127. [Google Scholar] [CrossRef]
  38. Lu, R.; Dai, E.; Wu, C. Spatial and temporal evolution characteristics and driving factors of soil conservation services on the Qinghai-Tibet Plateau. Catena 2023, 221, 106766. [Google Scholar] [CrossRef]
  39. Teng, H.; Liang, Z.; Chen, S.; Liu, Y.; Viscarra Rossel, R.A.; Chappell, A.; Yu, W.; Shi, Z. Current and future assessments of soil erosion by water on the Tibetan Plateau based on RUSLE and CMIP5 climate models. Sci. Total Environ. 2018, 635, 673–686. [Google Scholar] [CrossRef] [PubMed]
  40. Wang, S.; Xu, X.; Huang, L. Spatial and temporal variability of soil erosion in Northeast China from 2000 to 2020. Remote Sens. 2022, 15, 225. [Google Scholar] [CrossRef]
  41. Xie, Y.; Lin, H.; Ye, Y.; Ren, X. Changes in soil erosion in cropland in northeastern China over the past 300 years. Catena 2019, 176, 410–418. [Google Scholar] [CrossRef]
  42. Zhu, X.; Zhang, R.; Sun, X. Spatiotemporal dynamics of soil erosion in the ecotone between the Loess Plateau and Western Qinling Mountains based on RUSLE modeling, GIS, and remote sensing. Arab. J. Geosci. 2021, 14, 1–12. [Google Scholar] [CrossRef]
  43. Borrelli, P.; Ballabio, C.; Yang, J.; Robinson, D.A.; Panagos, P. GloSEM: High-resolution global estimates of present and future soil displacement in croplands by water erosion. Sci. Data 2022, 9, 406. [Google Scholar] [CrossRef]
  44. Liu, X.; Xin, L.; Lu, Y. National scale assessment of the soil erosion and conservation function of terraces in China. Ecol. Indic. 2021, 129, 107940. [Google Scholar] [CrossRef]
  45. Cao, Z.; Chen, G.; Zhang, S.; Huang, S.; Wu, Y.; Dong, F.; Guo, Y.; Wang, J.; Jiang, F. An assessment of soil loss by water erosion in no-tillage and mulching, China. Water 2023, 15, 2821. [Google Scholar] [CrossRef]
  46. Li, J.; Sun, R.; Xiong, M.; Yang, G. Estimation of soil erosion based on the RUSLE model in China. Acta Ecol. Sin. 2020, 40, 3473–3485. (In Chinese) [Google Scholar]
  47. Weng, X.; Zhang, B.; Zhu, J.; Wang, D.; Qiu, J. Assessing Land Use and Climate Change Impacts on Soil Erosion Caused by Water in China. Sustainability 2023, 15, 7865. [Google Scholar] [CrossRef]
  48. Renard, K.G.; Foster, G.R.; Weesies, G.A.; Mccool, D.K.; Yoder, D.C. Predicting Soil Erosion by Water: A Guide to Conservation Planning with the Revised Universal Soil Loss Equation (RUSLE). In Agriculture Handbook No. 703; United States Department of Agriculture: Washington, DC, USA, 1997. [Google Scholar]
  49. Yu, Q.; You, L.; Wood-Sichra, U.; Ru, Y.; Joglekar, A.K.B.; Fritz, S.; Xiong, W.; Lu, M.; Wu, W.; Yang, P. A cultivated planet in 2010—Part 2: The global gridded agricultural-production maps. Earth Syst. Sci. Data 2020, 12, 3545–3572. [Google Scholar] [CrossRef]
  50. International Food Policy Research Institute. Global Spatially-Disaggregated Crop Production Statistics Data for 2010 Version 2.0. Harvard Dataverse, V4. 2019. Available online: https://dataverse.harvard.edu/dataset.xhtml?persistentId=doi:10.7910/DVN/PRFF8V (accessed on 3 July 2023).
  51. Panagos, P.; Borrelli, P.; Meusburger, K.; Alewell, C.; Lugato, E.; Montanarella, L. Estimating the soil erosion cover-management factor at the European scale. Land Use Policy 2015, 48, 38–50. [Google Scholar] [CrossRef]
  52. Li, K.; Yang, J.; Wang, J.; Wang, Z.; Zeng, Y.; Borrelli, P.; Hubacek, K.; Hu, Y.; Xu, B.; Fang, N.; et al. Human-altered soil loss dominates nearly half of water erosion in China but surges in agriculture-intensive areas. One Earth 2024, 7, 2008–2018. [Google Scholar] [CrossRef]
  53. Yan, H. Impact of Agricultural Product Trade on Global Cropland Soil Erosion. Master’s Thesis, Huazhong Agricultural University, Wuhan, China, 2021. [Google Scholar]
  54. Xu, X.; Liu, J.; Zhang, S.; Li, R.; Yan, C.; Wu, S. China’s Multi-Period Land Use Land Cover Remote Sensing Monitoring Data Set (CNLUCC); Resource and Environment Data Cloud Platform: Beijing, China, 2018. [Google Scholar] [CrossRef]
  55. Xie, Y.; Yin, S.; Liu, B.; Nearing, M.A.; Zhao, Y. Models for estimating daily rainfall erosivity in China. J. Hydrol. 2016, 535, 547–558. [Google Scholar] [CrossRef]
  56. Chen, Y.; Xu, M.; Wang, Z.; Gao, P.; Lai, C. Applicability of two satellite-based precipitation products for assessing rainfall erosivity in China. Sci. Total Environ. 2021, 757, 143975. [Google Scholar] [CrossRef] [PubMed]
  57. Qin, R.; Zhao, Z.; Xu, J.; Ye, J.; Li, F.; Zhang, F. HRLT: A high-resolution (1 d, 1 km) and long-term (1961–2019) gridded dataset for surface temperature and precipitation across China. Earth Syst. Sci. Data 2022, 14, 4793–4810. [Google Scholar] [CrossRef]
  58. Yin, S.; Xue, X.; Yue, T.; Xie, Y.; Gao, G. Spatiotemporal distribution and return period of rainfall erosivity in China. Trans. Chin. Soc. Agric. Eng. 2019, 35, 105–113. [Google Scholar] [CrossRef]
  59. Teng, H.; Ma, Z.; Chappell, A.; Shi, Z.; Liang, Z.; Yu, W. Improving rainfall erosivity estimates using merged TRMM and gauge data. Remote Sens. 2017, 9, 1134. [Google Scholar] [CrossRef]
  60. Wang, B.; Zheng, F.; Guan, Y. Improved USLE-K factor prediction: A case study on water erosion areas in China. Int. Soil Water Conserv. Res. 2016, 4, 168–176. [Google Scholar] [CrossRef]
  61. Sharpley, A.N.; Williams, J.R. EPIC-Erosion/Productivity Impact Calculator: 1. Model Documentation: 1768; United States Department of Agriculture: Washington, DC, USA, 1990. [Google Scholar]
  62. Liu, F.; Zhang, G. Basic Soil Property Dataset of High-Resolution China Soil Information Grids (2010–2018); Big Earth Data Platform for Three Poles: Nanjing, China, 2021. [Google Scholar] [CrossRef]
  63. Wuepper, D.; Borrelli, P.; Finger, R. Countries and the global rate of soil erosion. Nat. Sustain. 2020, 3, 51–55. [Google Scholar] [CrossRef]
  64. Panagos, P.; Borrelli, P.; Poesen, J.; Ballabio, C.; Lugato, E.; Meusburger, K.; Montanarella, L.; Alewell, C. The new assessment of soil loss by water erosion in Europe. Environ. Sci. Policy 2015, 54, 438–447. [Google Scholar] [CrossRef]
  65. Mccool, D.K.; Foster, G.R.; Mutchler, C.K.; Meyer, L.D. Revised slope length factor for the Universal Soil Loss Equation. Trans. ASABE 1989, 30, 1387–1396. [Google Scholar] [CrossRef]
  66. Desmet, P.J.J.C.; Gobers, G. A GIS procedure for automatically calculating the USLE LS factor on topographically complex landscape units. J. Soil Water Conserv. 1996, 51, 427–433. [Google Scholar] [CrossRef]
  67. Liu, B.; Zhang, K.; Yun, X. An empirical soil loss equation. In Proceedings of the 12th ISCO Conference, Beijing, China, 26–31 May 2002. [Google Scholar]
  68. Panagos, P.; Borrelli, P.; Meusburger, K. A new European slope length and steepness factor (LS-Factor) for modeling soil erosion by water. Geosciences 2015, 5, 117–126. [Google Scholar] [CrossRef]
  69. Panagos, P.; Borrelli, P.; Meusburger, K.; van der Zanden, E.H.; Poesen, J.; Alewell, C. Modelling the effect of support practices (P-factor) on the reduction of soil erosion by water at European scale. Environ. Sci. Policy 2015, 51, 23–34. [Google Scholar] [CrossRef]
  70. Xiong, M.; Sun, R.; Chen, L. Effects of soil conservation techniques on water erosion control: A global analysis. Sci. Total Environ. 2018, 645, 753–760. [Google Scholar] [CrossRef]
  71. Xiong, M.; Sun, R.; Chen, L. Global analysis of support practices in USLE-based soil erosion modeling. Prog. Phys. Geogr. Earth Environ. 2019, 43, 391–409. [Google Scholar] [CrossRef]
  72. Jia, L.; Zhao, W.; Zhai, R.; Liu, Y.; Kang, M.; Zhang, X. Regional differences in the soil and water conservation efficiency of conservation tillage in China. Catena 2019, 175, 18–26. [Google Scholar] [CrossRef]
  73. Ministry of Water Resources of China. Soil Erosion Classification and Grading Standards. 2008. Available online: http://www.dgsbhj.com/UploadFiles/2015-12-07/14494781261644590.pdf (accessed on 9 November 2023).
  74. Comprehensive agricultural zoning of China. Natl. Agric. Zoning Comm. China 1985, 6, 19. (In Chinese)
  75. Li, K.; Wang, L.; Wang, Z.; Hu, Y.; Zeng, Y.; Yan, H.; Xu, B.; Li, C.; Cui, H.; Yu, S.; et al. Multiple perspective accountings of cropland soil erosion in China reveal its complex connection with socioeconomic activities. Agric. Ecosyst. Environ. 2022, 337, 108083. [Google Scholar] [CrossRef]
  76. Wang, Y.; Liao, J.; He, Y.; Chen, P. Evolution and ecological implications of land development and conservation patterns on the Qinghai-Tibet Plateau. Land 2022, 11, 1797. [Google Scholar] [CrossRef]
  77. Wei, X.; Zhang, Z.; Wang, P.; Tao, F. Recent patterns of production for the main cereal grains: Implications for food security in China. Reg. Environ. Change 2017, 17, 105–116. [Google Scholar] [CrossRef]
  78. Li, X.; Liu, N.; You, L.; Ke, X.; Liu, H.; Huang, M.; Waddington, S.R. Patterns of cereal yield growth across China from 1980 to 2010 and their implications for food production and food security. PLoS ONE 2016, 11, e0159061. [Google Scholar] [CrossRef] [PubMed]
  79. Feng, Z.; Yang, Y.; Zhang, Y.; Zhang, P.; Li, Y. Grain-for-green policy and its impacts on grain supply in West China. Land Use Policy 2005, 22, 301–312. [Google Scholar] [CrossRef]
  80. Quinton, J.N.; Fiener, P. Soil erosion on arable land: An unresolved global environmental threat. Prog. Phys. Geogr. Earth Environ. 2024, 48, 136–161. [Google Scholar] [CrossRef]
  81. Blanco-Canqui, H.; Shaver, T.M.; Lindquist, J.L.; Shapiro, C.A.; Elmore, R.W.; Francis, C.A.; Hergert, G.W. Cover crops and ecosystem services: Insights from studies in temperate soils. Agron. J. 2015, 107, 2449–2474. [Google Scholar] [CrossRef]
  82. Seitz, S.; Goebes, P.; Puerta, V.L.; Pereira, E.I.P.; Wittwer, R.; Six, J.; van Der Heijden, M.G.; Scholten, T. Conservation tillage and organic farming reduce soil erosion. Agron. Sustain. Dev. 2018, 39, 4. [Google Scholar] [CrossRef]
  83. Strauss, P.; Swoboda, D.; Blum, W.E.H. How effective is mulching and minimum tillage to control runoff and soil loss?—A literature review. In Proceedings of the International Conference on “25 Years Assessment of Erosion”, Ghent, Belgium, 22–26 September 2003; Volume 25, pp. 545–550. [Google Scholar]
  84. Stefanidis, S.; Alexandridis, V.; Chatzichristaki, C.; Stefanidis, P. Assessing soil loss by water erosion in a typical Mediterranean ecosystem of northern Greece under current and future rainfall erosivity. Water 2021, 13, 2002. [Google Scholar] [CrossRef]
  85. Yue, T.; Yin, S.; Xie, Y.; Yu, B.; Liu, B. Rainfall erosivity mapping over mainland China based on high-density hourly rainfall records. Earth Syst. Sci. Data 2022, 14, 665–682. [Google Scholar] [CrossRef]
  86. Buchhorn, M.; Smets, B.; Bertels, L.; Roo, B.D.; Lesiv, M.; Tsendbazar, N.; Herold, M.; Fritz, S. Copernicus Global Land Service: Land Cover 100 m: Collection 3: Epoch 2019: Globe. Zenodo 2020. [Google Scholar] [CrossRef]
  87. Mu, X.; Qiu, J.; Cao, B.; Cai, S.; Niu, K.; Yang, X. Mapping soil erosion dynamics (1990–2020) in the Pearl River Basin. Remote Sens. 2022, 14, 5949. [Google Scholar] [CrossRef]
  88. Li, P.; Chen, J.; Zhao, G.; Holden, J.; Liu, B.; Chan, F.K.S.; Hu, J.; Wu, P.; Mu, X. Determining the drivers and rates of soil erosion on the Loess Plateau since 1901. Sci. Total Environ. 2022, 823, 153674. [Google Scholar] [CrossRef] [PubMed]
  89. Yin, Z.; Chang, J.; Huang, Y. Multiscale Spatiotemporal Characteristics of Soil Erosion and Its Influencing Factors in the Yellow River Basin. Water 2022, 14, 2658. [Google Scholar] [CrossRef]
  90. Tiwari, A.K.; Risse, L.M.; Nearing, M.A. Evaluation of WEPP and its comparison with USLE and RUSLE. Trans. ASAE 2000, 43, 1129–1135. [Google Scholar] [CrossRef]
  91. Kinnell, P.I.A. Event soil loss, runoff and the Universal Soil Loss Equation family of models: A review. J. Hydrol. 2010, 385, 384–397. [Google Scholar] [CrossRef]
  92. Stolpe, N.B. A comparison of the RUSLE, EPIC and WEPP erosion models as calibrated to climate and soil of south-central Chile. Acta Agric. Scand. Sect. B Soil Plant Sci. 2005, 55, 2–8. [Google Scholar] [CrossRef]
Figure 1. Flowchart of the methodological framework of this work.
Remotesensing 17 01611 g001
Figure 2. Spatial distribution of raw data used in this study. CNLUCC: China’s Multi-Period Land Use Land Cover Remote Sensing Monitoring Dataset. Agricultural regions: the Huang-Huai-Hai Plain Region (HHHP), the Loess Plateau Region (LP), the Middle and Lower Reaches of the Yangtze River Region (MLRY), the Northern Arid and Semi-Arid Region (NASA), the Northeast Plain Region (NEP), the Qinghai-Tibet Plateau Region (QTP), the Sichuan Basin and Surrounding Areas Region (SASA), the South China Region (SC), the Yunnan-Guizhou Plateau Region (YGP). HRLT: A high-resolution (1 day, 1 km) and long-term (1961–2019) gridded dataset for temperature and precipitation across China.
Remotesensing 17 01611 g002aRemotesensing 17 01611 g002b
Figure 3. The spatiotemporal patterns of the land cover and management factor for cropland (C factor) and the rainfall erosivity factor (R factor).
Remotesensing 17 01611 g003
Figure 4. The spatial distribution patterns of soil erodibility factor (K factor), topography factor (LS factor), and support practices factor (P factor).
Remotesensing 17 01611 g004
Figure 5. Spatial distribution and change rates of cropland-related soil erosion intensity in China during 1980–2018.
Remotesensing 17 01611 g005
Figure 6. Soil erosion area (a) and its change rate (b), and soil erosion rate (c) and its change rate (d) in China’s nine agricultural regions (1980–2018).
Remotesensing 17 01611 g006aRemotesensing 17 01611 g006b
Figure 7. Soil erosion intensity distribution for different crops across China in 2010.
Remotesensing 17 01611 g007aRemotesensing 17 01611 g007b
Figure 8. Comparison of R factor between this study (a) and Yue et al.’s study [85] (b).
Remotesensing 17 01611 g008
Figure 9. Comparison with existing studies on cropland-related soil erosion rates at national scales.
Remotesensing 17 01611 g009
Figure 10. Comparison with existing studies on cropland-related soil erosion rates at regional scales. (al) compared our results on cropland soil erosion rates to those of Borrelli et al. [43] and Li et al. [23] in terms of the spatial distribution of cropland soil erosion rates in the NEP, LP, SASA, and YGP regions of China. (m,n) compared our results on the spatial distribution of cropland soil erosion rates in the PRB region to the results of Mu et al. [87], which specifically focused on soil erosion rates in the PRB region.
Remotesensing 17 01611 g010
Table 1. Raw data and the sources for this study. CNLUCC was mainly based on Landsat series satellite images; SPAM 2010 v2.0 was generated by integrating data from FAOSTAT, national agricultural censuses, and remote sensing products, such as MODIS and Landsat; HRLT was derived from daily observations of over 2400 China Meteorological Administration stations, combined with DEM, NDVI, and land use data for spatial interpolation; China Soil Information Grids integrates more than 9000 soil profiles from national surveys with environmental covariates; the SRTM DEM dataset was acquired by NASA’s Space Shuttle Endeavour in 2000 using C/X-band radar interferometry.
Dataset NameSpatial ResolutionFormatDataset Production MethodsSource
China’s Multi-Period Land Use Land Cover Remote Sensing Monitoring Dataset (CNLUCC)30 mTIFFRemote sensinghttps://doi.org/10.12078/2018070201 (accessed on 17 March 2023)
SPAM 2010 v2.0 Global Data10 kmTIFFData fusionhttps://dataverse.harvard.edu/dataset.xhtml?persistentId=doi:10.7910/DVN/PRFF8V (accessed on 3 July 2023)
HRLT: a high-resolution (1 d, 1 km) and long-term (1961–2019) gridded dataset for surface temperature and precipitation across China1 kmNetCDFData fusionhttps://doi.org/10.5194/essd-14-4793-2022 (accessed on 5 April 2023)
Basic soil property dataset of high-resolution China Soil Information Grids (2010–2018)250 mTIFFData fusionhttps://doi.org/10.11666/00073.ver1.db (accessed on 23 June 2023)
SRTM DEM Data30 mTIFFRemote sensinghttps://earthexplorer.usgs.gov (accessed on 16 June 2023)
China’s nine major agricultural regions data/SHPStatistic analysishttps://www.resdc.cn (accessed on 2 May 2023)
Table 2. Land cover and management factors for different crop types.
NCrop TypesCrop ClassificationCCROPn
1Grainsrice0.15
maize0.38
various0.20
2Beansvarious0.32
3Root and tuber cropsvarious0.34
4Leafy vegetablestobacco0.50
various0.27
5Oil cropscotton0.40
various0.25
6Fiber cropsfiber crops0.28
7Shrubs, herbs, and spicescoffee0.20
various0.15
8Other cropsvarious0.15
Table 3. The values of the P factor for cropland.
Slope ValuesP Factor
<10°0.5
10~25°0.6
25~45°0.8
>45°1
Disclaimer/Publisher’s Note: The statements, opinions and data contained in all publications are solely those of the individual author(s) and contributor(s) and not of MDPI and/or the editor(s). MDPI and/or the editor(s) disclaim responsibility for any injury to people or property resulting from any ideas, methods, instructions or products referred to in the content.

