4.1. Experimental Settings
We conduct experiments on a Tesla V100 GPU with 32 GB memory. The code was implemented based on the MMRotate framework [
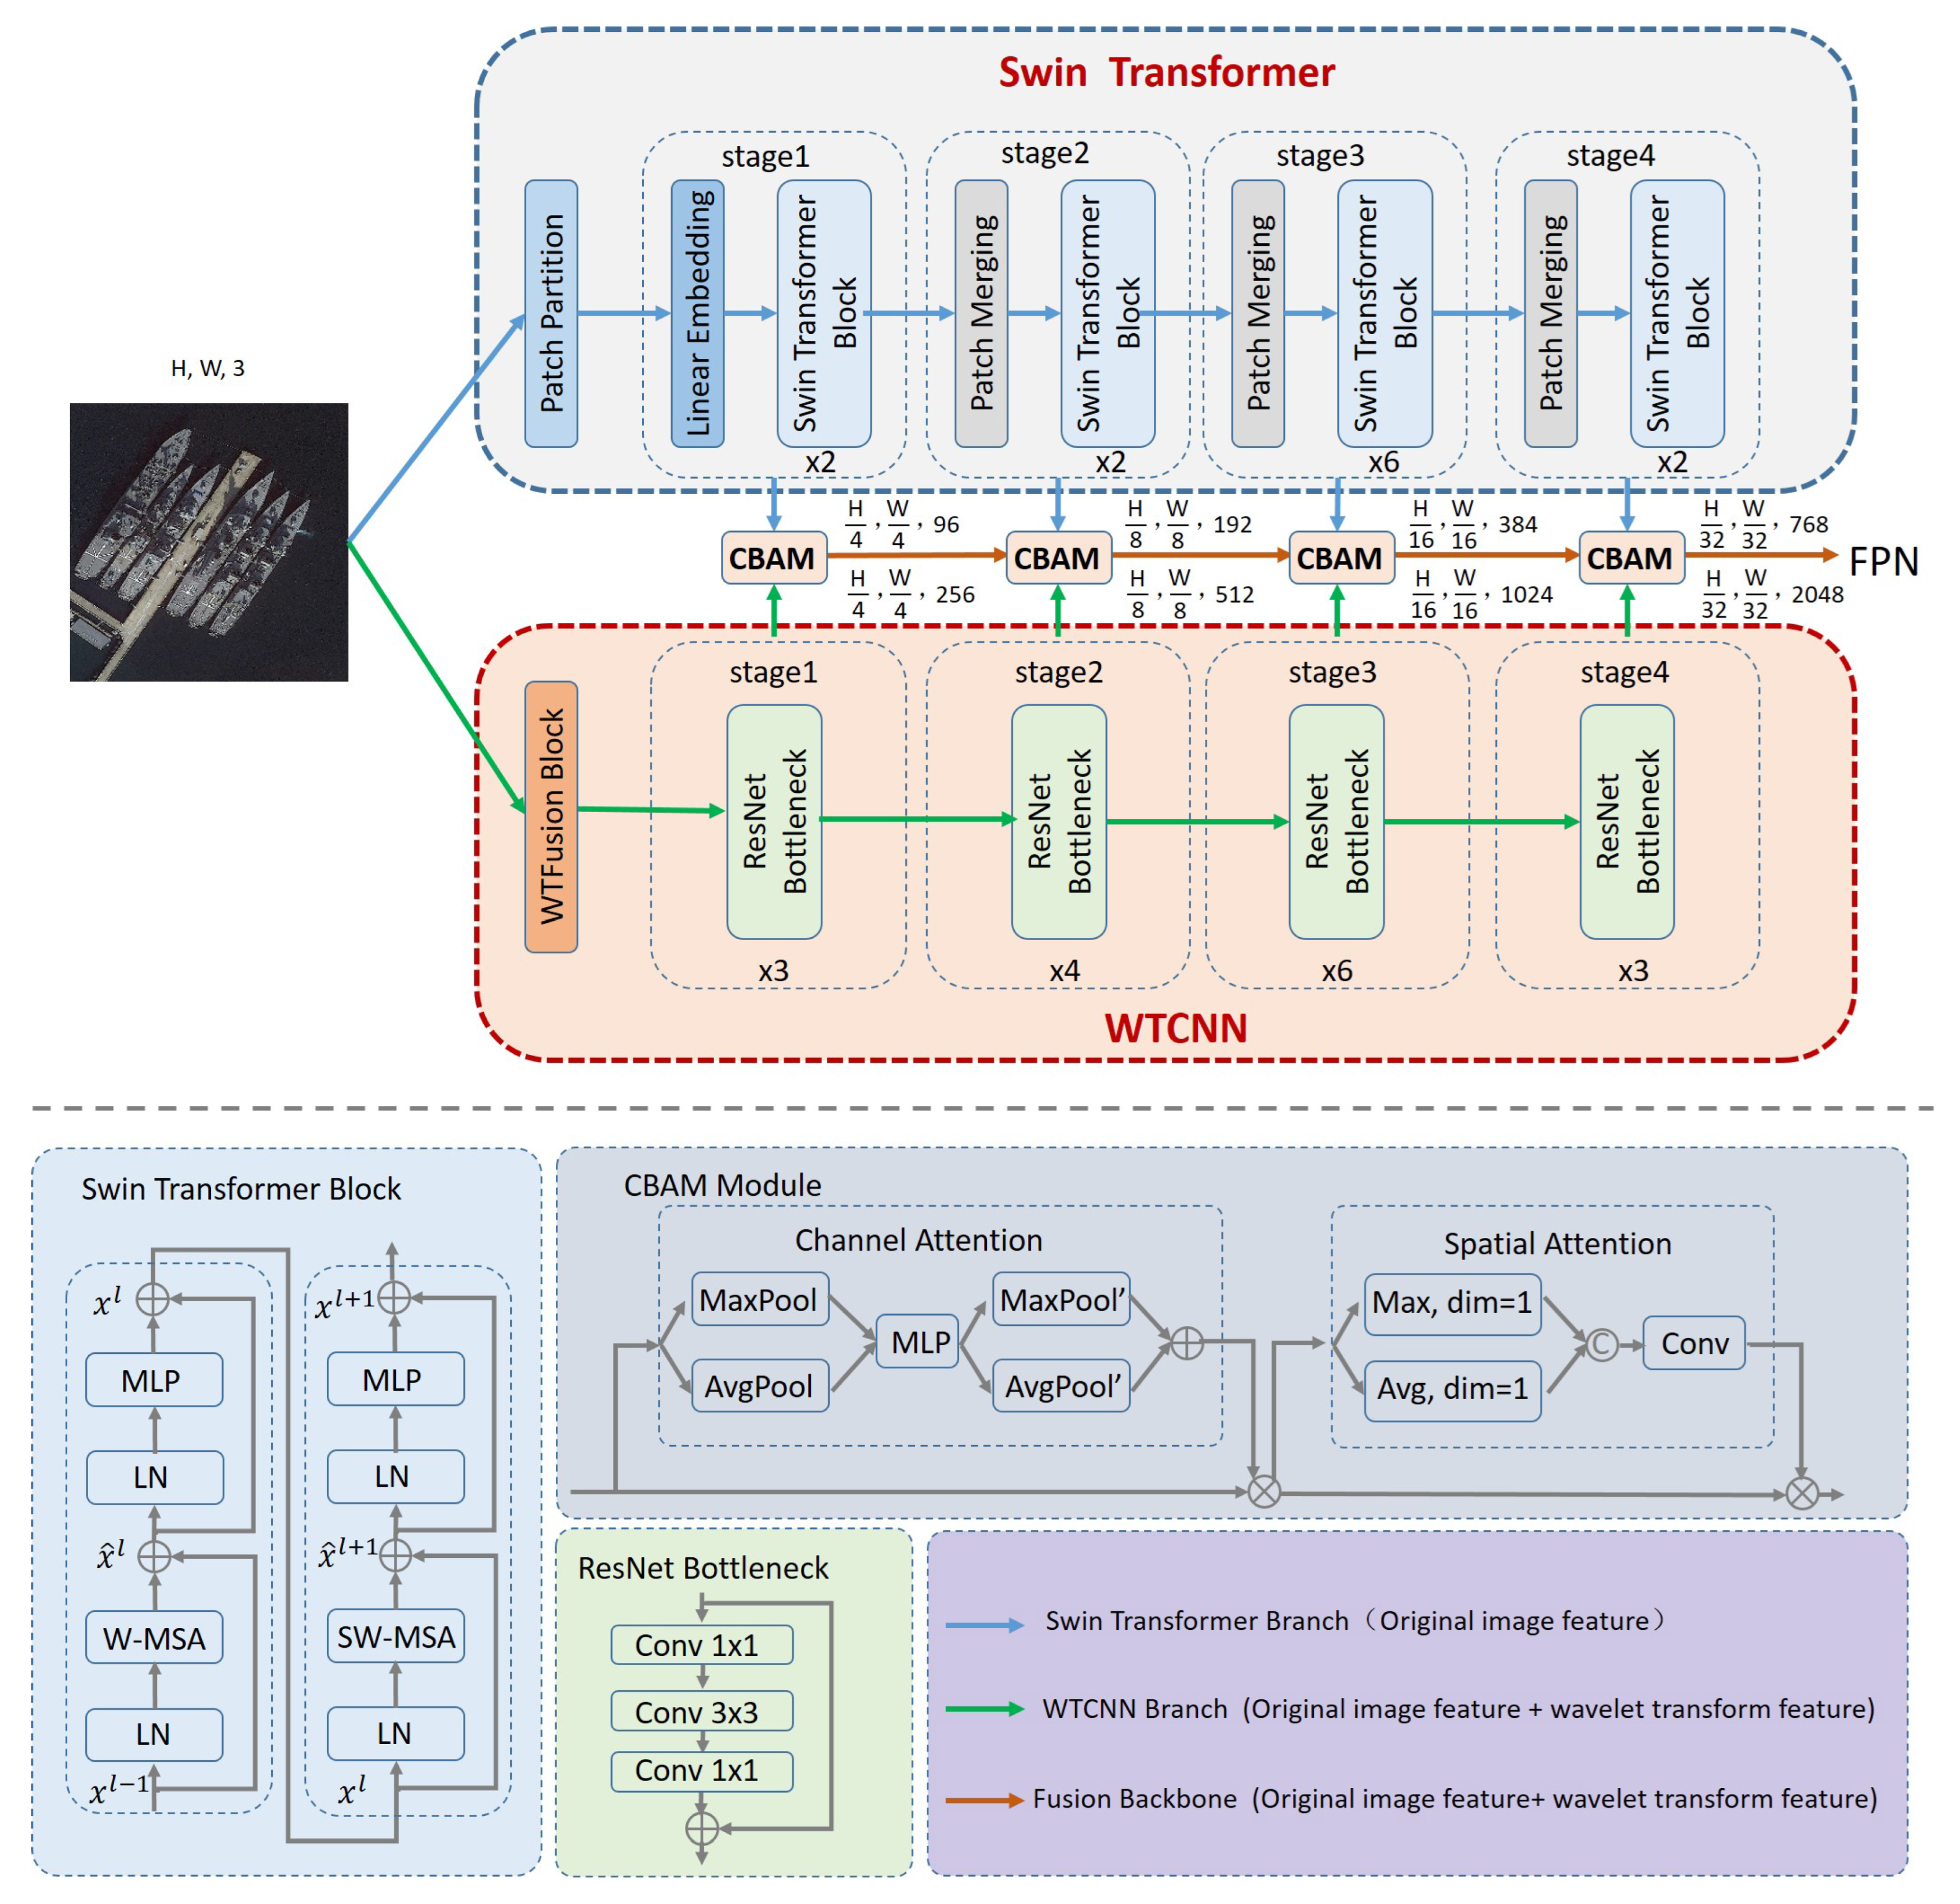
40]. The Transformer branch was based on the pre-trained Swin Transformer Tiny (Swin-T) model on ImageNet. We resized the input image to 1024 × 1024 pixels, and then divided it into 256 × 256 patches, with each patch having a size of 4 × 4 pixels. The linear embedding layer’s dimension is 96, which is implemented using a 4 × 4 convolutional layer with 3 input channels, 96 output channels, and a stride of 4. The local window has a dimension of 7 × 7, and the number of Swin Transformer modules in each stage is set to 2, 2, 6, and 2, respectively. Here, “Merge n × n” refers to the patch merging of n × n neighboring features within a patch. The CNN branch employed the ResNet50 model, with the number of modules in each stage configured as 3, 4, 6, and 3. The Daubechies-2 (db2) wavelet was chosen as the basis function for the wavelet transform.
Table 1 shows the specific model parameters.
During training, we used a 3× learning schedule with 36 epochs. AdamW was employed as the optimizer, with the initial learning rate set to 0.0001, the weight decay to 0.05, and the momentum parameters to (0.9, 0.999). For experiments on the HRSC2016 and ShipRSImageNet datasets, random flipping was applied as a data augmentation strategy. To ensure a fair comparison, additional random photometric distortion was introduced for the experiments on the HRSC2016-A dataset to enhance the generalization ability of both the comparison models and the proposed model.
4.2. Evaluation Metrics
This paper employs Average Precision (AP), a comprehensive measure of the model’s detection capability, as the primary evaluation metric. AP is calculated as the average of precision values at multiple Intersection over Union (IoU) thresholds, ranging from 0.50 to 0.95 in steps of 0.05. In addition, and are reported as supplementary metrics.
To provide a more comprehensive evaluation of the model’s overall performance, we assessed both inference speed and network complexity. Inference speed is measured by frames per second (FPS), while network complexity is quantified by the number of parameters (Param.).
4.3. Comparative Experiments
To evaluate the effectiveness and robustness of the proposed method, this section compares WTDBNet with four mainstream oriented object detection approaches, including Gliding Vertex, S2ANet, RoI Transformer, and Oriented R-CNN, on three datasets: HRSC2016, ShipRSImageNet, and HRSC2016-A.
As shown in
Table 2, the experimental results on the HRSC2016 dataset demonstrate that the proposed method achieves the highest mAP of 53.95%, with improvements of 31.38, 32.08, 29.21, and 3.32 percentage points over the compared methods, respectively. Similarly, the results on the ShipRSImageNet dataset, as shown in
Table 3, indicate that our method achieves the best mAP of 55.87%, outperforming the other methods by 25.45, 25.32, 17.47, and 4.04 percentage points, respectively. On the HRSC2016-A dataset, as shown in
Table 4, the proposed method again achieves the highest mAP of 48.16%, with improvements of 28.16, 27.99, 27.11, and 4.52 percentage points over the baselines. Moreover, consistent improvements in
and
are also observed across all three datasets.
The experimental results indicate that traditional oriented object detection algorithms still have considerable room for improvement in detection accuracy, primarily due to their lack of consideration for the specific characteristics of fine-grained ship detection and their limited adaptability to certain challenging scenarios such as varying illumination and image resolution. In contrast, the proposed method achieves superior performance by jointly modeling global context and local detail features, and effectively integrating wavelet transform with traditional image processing techniques. These advantages contribute to its state-of-the-art performance and strong robustness across multiple datasets.
4.4. Ablation Experiment
Ablation studies were conducted on three datasets—HRSC2016, ShipRSImageNet, and HRSC2016-A—to validate each component’s contribution in the proposed method.
Table 5 presents the ablation results for the HRSC2016 dataset. Compared with the baseline model, Oriented R-CNN (ResNet50), introducing the WTFusion Block significantly boosts the mAP from 50.63% to 53.26%, achieving an improvement of 2.63 percentage points. Additionally,
and
are increased by 1.9 and 2.2 percentage points, respectively, demonstrating that the wavelet transform enhances the extraction of fine-grained image features, thereby improving ship detection performance. Replacing the backbone with Swin Transformer leads to a further mAP increase of 1.56 percentage points, indicating that, compared with ResNet, Swin Transformer is more effective in capturing visual representations through its hierarchical and cross-window attention mechanisms. Finally, by employing the dual-stream backbone network WTDBNet, which integrates wavelet transform, CNN, and Transformer, the model achieves the best detection performance with mAP,
and
, reaching 53.95%, 74.1%, and 67.53%, respectively. These represent improvements of 3.32, 2.7, and 4.13 percentage points over the baseline. These results validate that the synergistic integration of wavelet transform, CNN, and Transformer can significantly enhance feature representation capabilities, making the proposed method particularly advantageous for fine-grained ship detection tasks.
We further validated the effectiveness of the proposed method on the ShipRSImageNet dataset, and the results are presented in
Table 6. Compared with the baseline model, the introduction of the WTCNN module led to a 1.15 percentage points improvement in mAP. Replacing the backbone with Swin Transformer further increased the mAP by 1.89 percentage points. When employing the WTDBNet, the model achieved mAP,
and
values of 55.87%, 75.11%, and 68.35%, respectively, which represent improvements of 4.04, 3.1, and 6.31 percentage points over the baseline model.
Finally, the ablation study results on the HRSC2016-A dataset are presented in
Table 7. Compared with the baseline model, the WTCNN module improved the mAP by 2.33 percentage points, while replacing the backbone with the Swin Transformer led to a 2.21 percentage points gain. When adopting the WTDBNet, the model achieved an mAP of 48.16%,
of 66.4%, and
of 57.6%, which represent improvements of 4.52, 3.4, and 4.7 percentage points over the baseline, respectively. These results further demonstrate the robustness and generalization ability of each component of the proposed method under varying environmental conditions and imaging resolutions, offering a promising approach to enhancing ship detection performance in complex scenarios.
To more intuitively and clearly illustrate the contribution of each component of the proposed method to fine-grained ship detection accuracy, we compared the classification confusion matrices of the baseline model (ResNet50), the improved WTCNN model, the model using Swin Transformer as the backbone, and the final proposed WTDB model on the HRSC2016-A dataset, considering only categories with at least 10 instances, as shown in
Figure 11.
As observed from the confusion matrices, the WTCNN model outperforms the baseline in overall accuracy, with particularly noticeable improvements in categories such as Perry (56% vs. 63%), Container (42% vs. 51%), and Submarine (79% vs. 88%). The model with the Swin Transformer backbone further improves the performance, demonstrating the superior capability of Transformer structures in capturing global contextual information. Among all models, WTDB achieves the best performance, with significantly improved classification accuracy across most categories. Notably, it exhibits considerable gains in classes such as Arleigh Burke (67% vs. 76%), Whidbey Island (43% vs. 57%), Perry (56% vs. 70%), and San Antonio (45% vs. 59%). These results validate the effectiveness of integrating wavelet transform, CNN, and Transformer for enhancing fine-grained feature representation in ship detection tasks.
From the above analysis, the visualized confusion matrix results clearly demonstrate the contribution of each component of the model to fine-grained object recognition. The proposed WTDB model not only maintains overall recognition stability but also effectively reduces misclassifications among highly similar categories, thereby exhibiting strong robustness and discriminative capability.


