Article

Unveiling the Spatial Variation in Ecosystem Services Interactions and Their Drivers Within the National Key Ecological Function Zones, China

by
Tingjing Zhang
1,2,
Quanqin Shao
1,2,* and
Haibo Huang
1
1
Key Laboratory of Land Surface Pattern and Simulation, Institute of Geographic Sciences and Natural Resources Research, Chinese Academy of Sciences, Beijing 100101, China
2
University of Chinese Academy of Sciences, Beijing 100049, China
*
Author to whom correspondence should be addressed.
Remote Sens. 2025, 17(9), 1559; https://doi.org/10.3390/rs17091559
Submission received: 17 March 2025 / Revised: 17 April 2025 / Accepted: 25 April 2025 / Published: 27 April 2025

Abstract

:
Understanding the spatial differentiation of ecosystem service (ES) interactions and their underlying driving mechanisms is crucial for effective ecosystem management and enhancing regional landscape sustainability. However, comprehensive analyses of the effects of key influencing factors on ES interactions remains limited, especially regarding the nonlinear driving mechanisms of factors and their regional heterogeneity. We assessed and validated five key ES in the National Key Ecological Function Zones (NKEFZs) of China—net primary productivity (NPP), soil conservation (SC), sandstorm prevention (SP), water retention (WR), and biodiversity maintenance (BM). By integrating the optimal parameter geographical detector with constraint line methods, we further explored the complex responses of ES interactions to driving factors across different functional zones. The results showed that most ES exhibited significant spatial synergistic clustering. In contrast, widespread spatial trade-off clustering was detected in ES pairs related to WR, mainly distributed in the Tibetan Plateau, northeast China, and the Southern Hills region. Due to the improvement in ES, the overall synergies of ES enhanced from 2000 to 2020. The dominant factors in different functional zones influenced ES interactions in a non-stationary manner, with the same factors potentially showing diverse effect types in different sub-regions. Additionally, we detected the dominant role of landscape configuration factors in sub-regions for specific interaction types (e.g., WR-NPP interaction in the SP zones), suggesting the potential for achieving multi-ES synergies through landscape planning without altering landscape composition. This research provides valuable insights into understanding ES interactions and offers a scientific foundation for the implementation of ecological protection and restoration plans.

Graphical Abstract

1. Introduction

Ecosystem services (ES) refer to the benefits that human societies derive from the natural environment [1]. ES serve as a pivotal link between socioeconomic systems and ecosystems, and are fundamental to human well-being, providing essential goods and services that support ecological balance and socioeconomic development [2]. In recent decades, under the dual pressures of climate change and anthropogenic activities, ecosystem structures and functions have been increasingly altered, leading to the degradation of ES in many regions [3,4]. The decline of ES not only poses severe risks to the stability of ecosystems but also has a significant impact on human livelihoods and economic development, underlining the urgent need for better management and restoration strategies [5,6]. Especially, different types of ES displayed complex interactions since they rely on the same ecological processes or can be influenced by the same external drivers [7]. Considering only a few ES can lead to the deterioration of others, jeopardizing the supply of the targeted ES through negative feedback [8,9]. Despite significant efforts, achieving a comprehensive understanding of ES interactions and their diverse driving mechanisms continues to pose a great challenge for sustainable resource management and environmental policy-making [10,11].
ES interactions often manifest as synergies, where multiple ES benefit simultaneously, or trade-offs, where the enhancement of one service leads to the degradation of another [12]. So far, great progress has been made in assessing ES trade-offs and synergies [13,14,15]. In the past few decades, increasing studies have taken into account the feedback between ES and their natural and socio-economic drivers. Studies commonly employ approaches such as scenario simulation, spatial autocorrelation, redundancy analysis, and geographically weighted regression to reveal the driving mechanisms of ES [16,17,18,19]. However, relevant studies have primarily focused on the biophysical supplies of ES, rather than their interactions [20]. Furthermore, recent studies have started to address the complex nonlinear responses of ES to driving forces. Nevertheless, they always fail to provide a holistic analysis of the various influencing factors, and nonlinear mechanisms of key factors have not been well identified [21,22]. To address these issues, we employ the geographical detector (GD) and constraint line method to quantify the contribution of each driving factor to ES interactions and identify the nonlinear responses of ES interactions to key driving factors. At present, the GD model has been increasingly used for detecting spatial heterogeneity and identifying key drivers influencing the distribution of ES [23,24]. While the traditional GD model is effective in detecting the explanatory power of factors, it has faced challenges in accurately discretizing explanatory variables, which can lead to variability in results. To address this limitation, the optimal parameter-based geographical detector (OPGD) method was developed [25]. The OPGD method improves the discretization process by utilizing adaptive optimization strategies, thus enhancing the model’s capacity to detect spatial heterogeneity and the interactions between explanatory factors more accurately. The constraint line method illustrates the limiting effects of constraint variables on corresponding variables within complex ecosystems and has been used to characterize the nonlinear interactions among ES [26,27].
The NKEFZs are regarded as the critical areas providing vital ES such as water retention, soil conservation, sandstorm prevention, and maintenance of biodiversity for regional ecological security [28]. Within the NKEFZs, development activities, such as urban and farmland expansion, are strictly limited, and the Chinese government has implemented transfer payments for the NKEFZs since 2008. As of 2020, the total payment had exceeded CNY 500 billion. The NKEFZs are the hotspot areas for ES provision in China. Investigating the interactions among ES within these regions is fundamental and plays a crucial role in supporting effective ecosystem management. However, ES research within the NKEFZs is still lacking. The limited number of previous studies have mainly focused on the assessment of ecological restoration status and ecosystem quality dynamics [29], with limited attention to the complexity of ES interactions—thus warranting more in-depth investigation.
In this study, we focused on the NKEFZs, using multi-source data and models to evaluate and visualize five key ES: namely NPP, WR, SC, BM, and SP. Our research specifically aims to (1) analyze the spatiotemporal evolution characteristics of the five ES from 2000 to 2020, (2) reveal the spatial heterogeneity of the trade-offs and synergies between paired ES, and (3) explore the nonlinear impacts of key natural and socio-economic drivers on ES interactions using the OPGD and constraint line method. Our study seeks to offer theoretical insights for optimizing ES management, fostering a balanced relationship between humans and nature, and promoting sustainable landscape management.

2. Materials and Methods

2.1. Study Area

The NKEFZs are the areas that undertake important ES such as water retention, soil conservation, sandstorm prevention, and maintenance of biodiversity, with the aim of maintaining and enhancing the supply capacity of ecological products (Figure 1). In this study, we selected the NKEFZs as our research area, involving 27 provinces, 676 counties/districts, and the total area of the NKEFZs is about 5.09 × 10⁶ km2, accounting for 53% of the total terrestrial area of China. Grassland, forest, and desert are the predominant ecosystem types in the NKEFZs, accounting for 40.1%, 24.4%, and 23.7% of the total area of the NKEFZs, respectively. There are four types of NKEFZs: soil conservation (SC zones), water retention (WR zones), biodiversity maintenance (BM zones), and sandstorm prevention (SP zones). In SC zones, key ecological protection and restoration measures involve developing water-saving agriculture, prohibiting grazing, and restoring mined areas. In WR zones, primary strategies involve the protection of natural forests and grasslands, reforestation, and controlling soil and water loss. In BM zones, actions such as prohibiting the over-exploitation of wild animals and plants, restricting human disturbances, and protecting natural ecosystems have been conducted. In SP zones, the main actions include controlling livestock carrying capacity to prevent grassland degradation, restoring grassland vegetation, and limiting the development of water-intensive industries.

2.2. Data Sources

The data mainly used in this study include land use/land cover data, meteorological data, NPP data, and other remote sensing and statistical data. The land use/cover data from 2000–2020 with a spatial resolution of 500 m were obtained from the MODIS Land Cover Type Yearly Global dataset (MCD12Q1) (https://modis.gsfc.nasa.gov/, accessed on 10 January 2025). Meteorological station observational data were obtained from the Chinese Meteorological Data Network China Ground Climate Data Daily Dataset (V3.0; http://data.cma.cn/, accessed on 10 January 2025), and professional meteorological interpolation software Anusplin (Version. 4.3) was used to generate annual temperature and precipitation datasets with a space resolution of 1 km2 from 2000–2020. The 1 km resolution potential evapotranspiration data from 2000–2020 was obtained from the National Tibetan Plateau Data Center (https://data.tpdc.ac.cn/, accessed on 10 January 2025). NPP data were from the dataset of the Global Land Surface Satellite (GLASS) product (http://www.glass.umd.edu/, accessed on 10 January 2025), with a temporal resolution of 1 year and a spatial resolution of 500 m, and data mosaicking, projection transformation, and resampling were conducted in sequence to generate an NPP dataset with 1 km2 spatial resolution from 2000 to 2020. The 1:1,000,000 soil data were from the Resource and Environment Data Center of Chinese Academy of Sciences (https://www.resdc.cn/, accessed on 10 January 2025). The 90 m resolution SRTM digital elevation model (DEM) data were from the United States Geological Survey (USGS) (https://cgiarcsi.community/data/srtm-90m-digital-elevation-database-v4-1/, accessed on 10 January 2025). All spatial data were resampled to a resolution of 1 km using the aggregate mean method. The data used in this study all came from publicly released data that underwent strict quality control, and their accuracy and reliability met the requirements of this study. All raster layers with 500 m resolution were resampled to 1 km resolution using the mean aggregation method.

2.3. Methods

2.3.1. Ecosystem Services Assessment

Five key ES were selected for assessing and mapping in this study, including NPP, WR, SC, SP, and BM. As an essential element within the terrestrial carbon cycle, NPP serves not only as a direct indicator of the production capacity of plant communities under ambient environmental conditions but also as a pivotal metric for evaluating the quality of terrestrial ecosystems [30]. In this study, NPP provides a general indication of the provisioning capacity of ecosystems. Furthermore, the other four types of ES have been deemed crucial for the NKEFZs [28]. Consequently, we ultimately selected five ES for evaluation.
(1)
Net primary productivity (NPP)
NPP refers to the amount of organic matter produced by photosynthetic organisms in an ecosystem after accounting for the energy used in respiration, which is an effective indicator to reflect ecosystem productivity. The 500 m resolution GLASS NPP dataset from 2000–2020 was applied in this study. The relative error of this dataset falls below 25%, and its notable efficacy has been evidenced in accurately simulating the spatiotemporal dynamics of global and regional vegetation productivity [31].
(2)
Water retention
Water retention refers to the water remaining in ecosystems for a specific time. The revised water yield equation of the Integrated Valuation of Ecosystem Services and Trade-offs (InVEST) model was applied to estimate the total volume and distribution of water retention in the study region. The annual amount of water retention for each pixel on the landscape (x) was used to indicate the water retention service, and was calculated as follows:
Q w r ,   x = P E T R = 1 E T P × P u × P
where Q w r ,   x is water retention (mm), P is the precipitation (mm), R is the surface runoff (mm), E T is the actual evapotranspiration (mm), and u is the runoff coefficient. The detailed methods are provided in Text S1 in the Supplementary Materials.
(3)
Soil conservation
The Revised Universal Soil Loss Equation (RUSLE) was used to estimate soil conservation service. The difference between the amount of potential soil erosion and actual soil erosion was calculated to represent the amount of soil conservation. The formula is as follows:
S C = R × K × L S × ( 1 C × P )
where S C is the amount of soil conservation, R is the rainfall erosivity factor, K is the soil erodibility factor, L S is the slope length and slope gradient factor, C is the vegetation cover factor, and P is the factor of soil and water conservation measures. L S , C , and P are dimensionless. The detailed methods are provided in Text S1 in the Supplementary Materials.
(4)
Biodiversity maintenance
In this study, we utilized habitat quality as a proxy for biodiversity maintenance service. Habitat quality has been proven to be a valuable surrogate for biodiversity, facilitating dynamic research over time in this study [32]. Habitat quality denotes the ecosystem’s capacity to furnish conditions conducive to both individual and population persistence, and is determined through an assessment of the inherent attributes of the habitat and the extent of habitat degradation induced by external threats such as farmland cultivation and urban expansion. The InVEST model was used for the evaluation of habitat quality, and the main formulas are as follows:
Q x j = H j 1 D x j z D x j z + k z
where Q x j is the habitat quality index, H j is the habitat suitability of LULC type j, D x j is the total threat level in parcel x of LULC type j, k is the half-saturation constant set to 0.5, and z is a normalized constant. The detailed methods are provided in Text S1 in the Supplementary Materials.
(5)
Sandstorm prevention
Sandstorm prevention refers to the sand remaining in ecosystems for a specific time. The Revised Wind Erosion Equation (RWEQ) was used to estimate sandstorm prevention service. The difference between the amount of potential wind erosion and actual wind erosion was calculated to represent the amount of sandstorm prevention. The formula is as follows:
S P = S L P S L
where S L P is the potential wind erosion modulus and S L is the actual wind erosion modulus. The detailed methods are provided in Text S1 in the Supplementary Materials.
(6)
Technical validation
For different ES types, we collectively employed two methods to validate the credibility of our assessment results: (1) to compare results in this study with accessible datasets by creating uniformly distributed random points for validation [33,34]; (2) to compare values extracted from published articles with other simulations and field-measured data within the NKEFZs to verify whether our results were in a reliable range [35,36,37,38,39,40]. The high agreement in these comparisons underscored the robustness of our results. The detailed validation methods are provided in Text S2 in the Supplementary Materials.

2.3.2. Statistical Analysis Methods

(1)
Time series trend analysis
In this study, the Sen-trends method was used to explore the changes in the ES over time at a pixel level. Then, the Mann–Kendall test was applied to assess the significance of the time series trends. Compared to linear regression, this method makes no assumptions about the distribution of data and is less sensitive to outliers, thereby providing more robust results [41]. The formulas are provided below.
β = Median x j x i j i , 1 i n , 1 j n , j > i
S = k = 1 n 1   j = k + 1 n   S g n X j X k
where β is the Sen’s slope, M e d i a n is the median function, and S is the test statistic. The time series trend analysis was conducted at the 1 km2 granular level. The criteria for Sen-trends classification are shown in detail in Table 1.
(2)
ES interactions assessment
The Pearson correlation analysis method was then applied to conduct the spatial and temporal correlation analysis between paired ES, with a confidence level of 0.05, at both regional and raster scales. The value range of the correlation coefficient (R) was −1 to 1. The formula for the Pearson correlation coefficient is as follows:
R = ( x x ¯ ) ( y y ¯ ) ( x x ¯ ) 2 ( y y ¯ ) 2
where R is the correlation coefficient and x and y are the values of variables x and y. A positive value of R (>0) indicates a synergistic interaction, whereas a negative value (<0) indicates a trade-off interaction. In this study, R software (Version. 4.2.3) was used to perform correlation analysis at the county scale. The use of administrative boundaries has been advocated as relevant for multi-ES studies [20,42]. Especially, county-scale analysis can provide useful information for ecological protection within the NKEFZs, as their management is implemented at the county level.
(3)
Optimal parameter-based geographical detector model
Drawing on previous research, we selected 16 potential drivers to conduct the driving force analysis [19,43]. These drivers included (1) 4 landscape composition factors and 4 landscape configuration factors, (2) 5 topographic and climatic factors, (3) 2 socioeconomic factors, and (4) 1 vegetation factor. Table 2 provides an overview of the drivers examined in this study. The landscape indices at the county scale were calculated using the Fragstats 4.2.1 software.
We employed the OPGD model to identify and quantify the key driving factors affecting the interactions between paired ES and their spatial heterogeneity. The calculation formula for the core indicator q of the model are as follows:
q = 1 i = 1 L N i σ i 2 N σ 2
where q represents the explanatory power of potential driving factors on the spatial differentiation of ES interaction, which varies from 0 to 1; a larger value stands for stronger explanatory power; i = 1, …, L, is the strata (i.e., classification or partitioning) of the variable Y or factor X; N i and N are the number of counties in stratum i and in the whole study area, respectively; and σ i 2 and σ 2 are the variance of ES interactions in stratum i and in the whole study area, respectively. Specifically, four discretization methods were tested: equal interval, natural breaks, quantile, and geometric progression. To determine the most appropriate grouping, discretization intervals ranging from 3 to 10 were specified, enabling the model to optimize the number of classes under each method. Interaction detection was further conducted to evaluate the extent to which the interaction between two driving factors explains the dependent variable the spatial differentiation of ES interaction.
(4)
Constraint line method
The constraint line method was employed to reveal the nonlinear responses of ES interactions to key driving factors, which were defined based on the results of the OPGD. The top three factors with the highest q values were considered as key driving factors. First, simple regression analysis was used to determine the average response of ES interactions to the driving factors. For each scatter plot, five fitting models (i.e., linear, quadratic, logarithmic, exponential, and power models) were compared, and the model with the highest R2 value was selected for fitting. If R2 was less than 0.25, constraint lines were further extracted. The selection of thresholds was based on prior research [44], which helped reveal the response of ES interactions to a single driving factor from the perspective of constraint effects when regression effects were not sufficiently clear. This study used a segmented quantile regression method to extract constraint lines. Segmented quantile regression method has been proven to be one of the most effective approaches for capturing constraint relationships among ecological variables [45] and it involved three steps: (1) segmenting the data based on the values of the X-axis variable; (2) selecting the 5% and/or 95% quantile points in each segment as the lower and upper boundary points, respectively; (3) finally, fitting the boundary points to obtain the constraint lines. The fitting method for the constraint lines was consistent with the simple regression. The above analysis was performed based on R software (Version. 4.2.3).

3. Results

3.1. Spatial and Temporal Patterns of Ecosystem Services

Analysis of the spatial distributions of the 5 ES from 2000 to 2020 indicated that, except for sandstorm prevention service, the other four ES exhibited a distribution pattern of higher values in the southeast and lower values in the northwest. The high-value areas of wind erosion were primarily located in regions with extensive deserts/sandy lands (Figure 2). During 2000–2020, all five ES showed an increasing trend despite the non-significant trend for WR. Note that the wind erosion modulus was used as a representation of SP, and a reduction in wind erosion implied an increase in SP. Specifically, there was a significant and widespread increase in NPP across the NKEFZs, with the increasing area accounting for 44.6% (Table 3). The trend of SC was characterized by enhancement in the southeast, stability in the northwest, and localized deterioration in certain areas. For WR, the increasing areas were mainly concentrated in the eastern parts of the Qinghai–Tibet Plateau and northeastern China. For SP, the areas with a notable decreasing trend of wind erosion modulus were widely distributed, with the decreasing area accounting for 36.1% of the study area.

3.2. Interactions Between Ecosystem Services

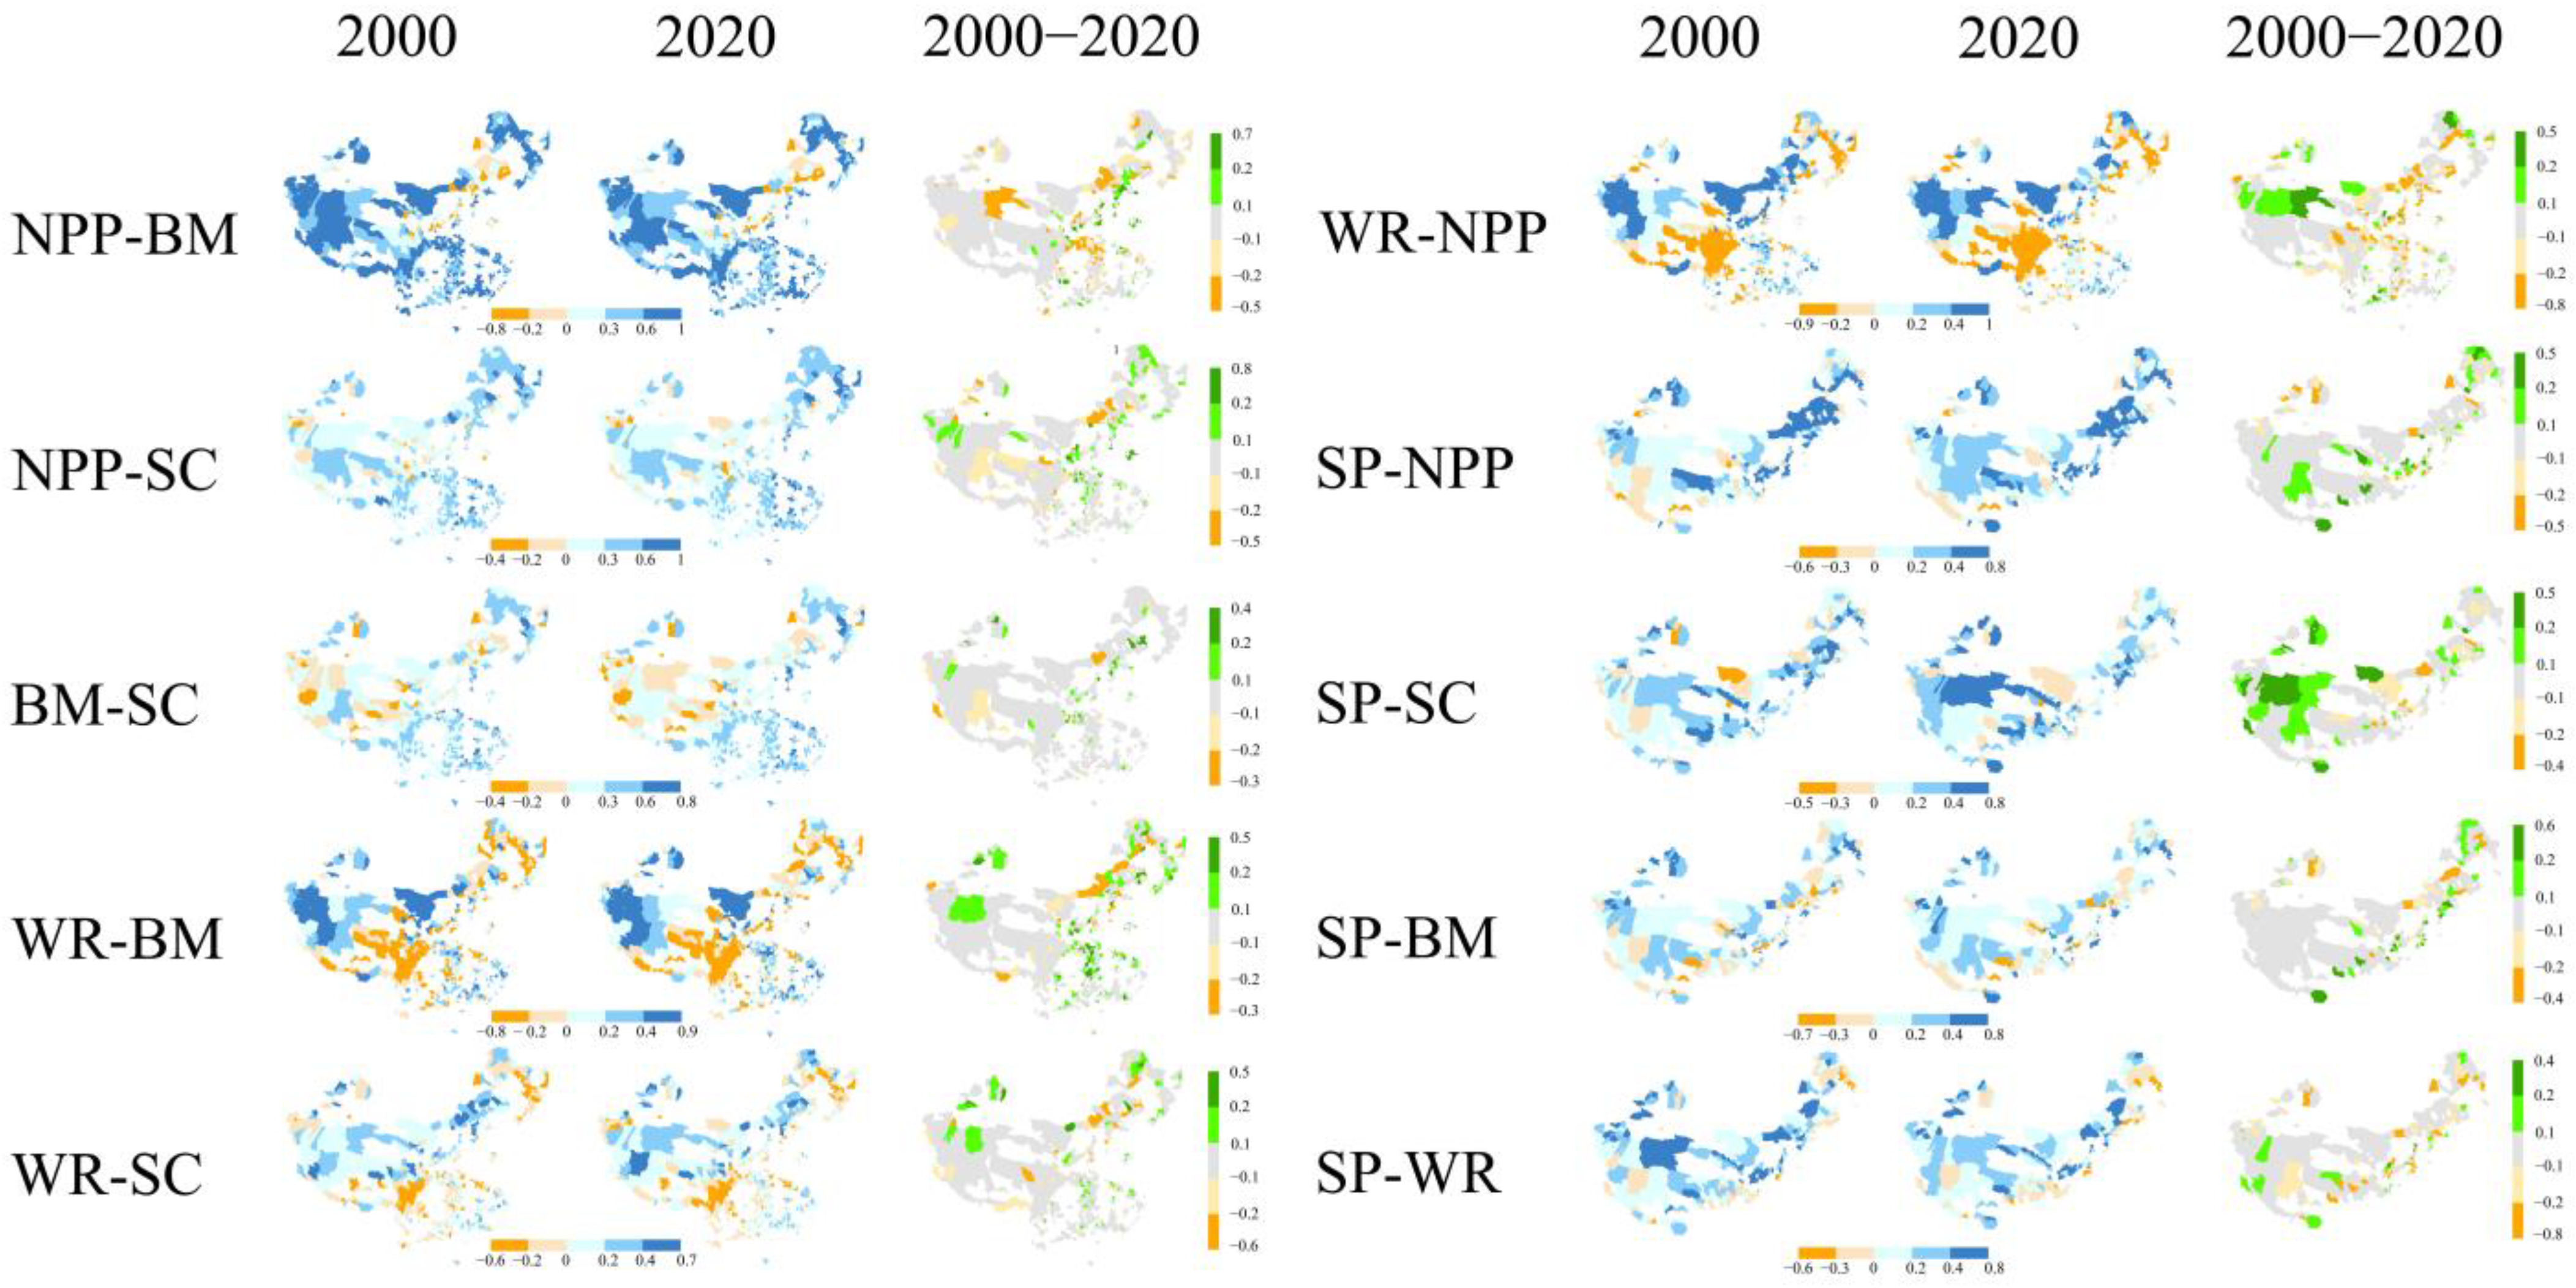
Based on the correlation analysis at the county scale, we examined the spatial heterogeneity of interactions between the pairwise ES at the NKEFZs (Figure 3). Results showed that, among the seven pairs of ES interactions (i.e., NPP-BM, NPP-SC, BM-SC, SP-NPP, SP-SC, SP-BM, and SP-WR), synergistic interactions dominated, while trade-offs were primarily distributed in some regions of the Qinghai–Tibet Plateau and northeastern China. In addition, pronounced clusters of ES trade-offs were mainly observed in the interactions related to WR. The spatial distribution pattern of ES interactions remained generally consistent from 2000 to 2020, primarily characterized by changes in the strength of the interactions. As for the direction of ES interactions, it was reflected in the increase in the number of counties with synergies for most of interaction types. The changes in ES interactions exhibited significant spatial heterogeneity. Notably, an increase in synergies between multiple ES pairs was observed in the Loess Plateau, as well as northeast and northwest China. The regions where ES trade-offs increased were more dispersed.

3.3. Driving Factors and Their Constraints

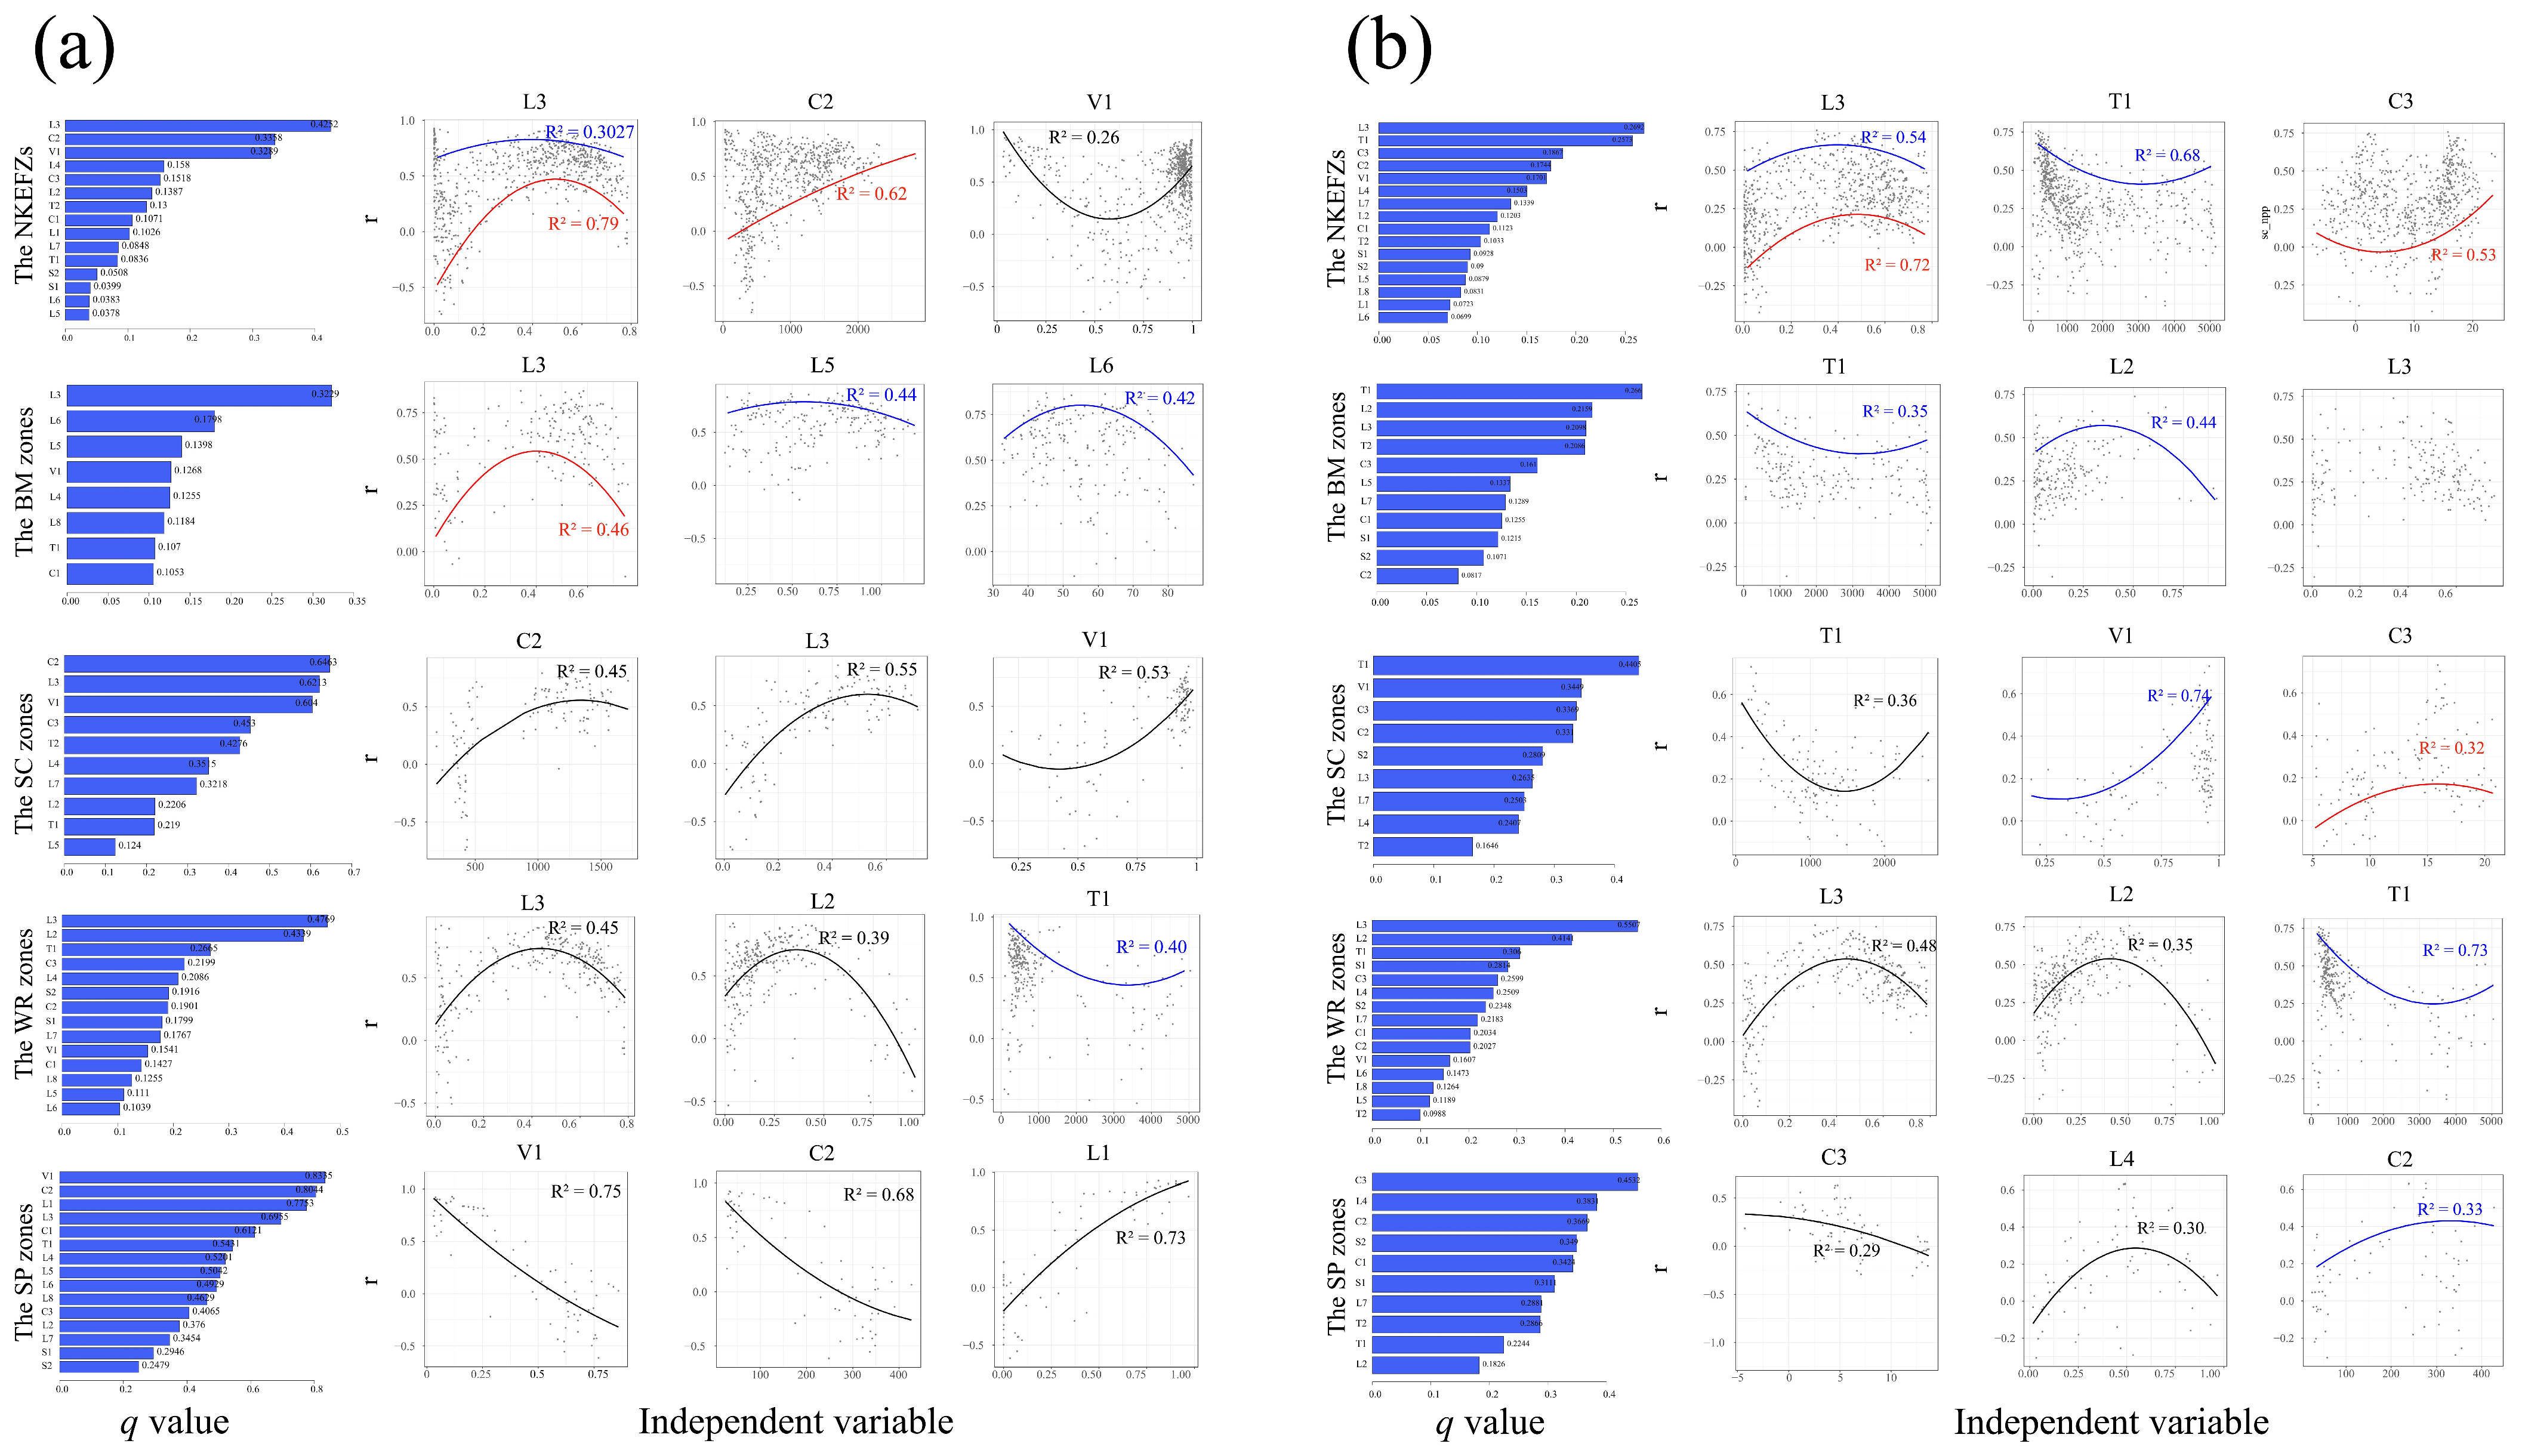
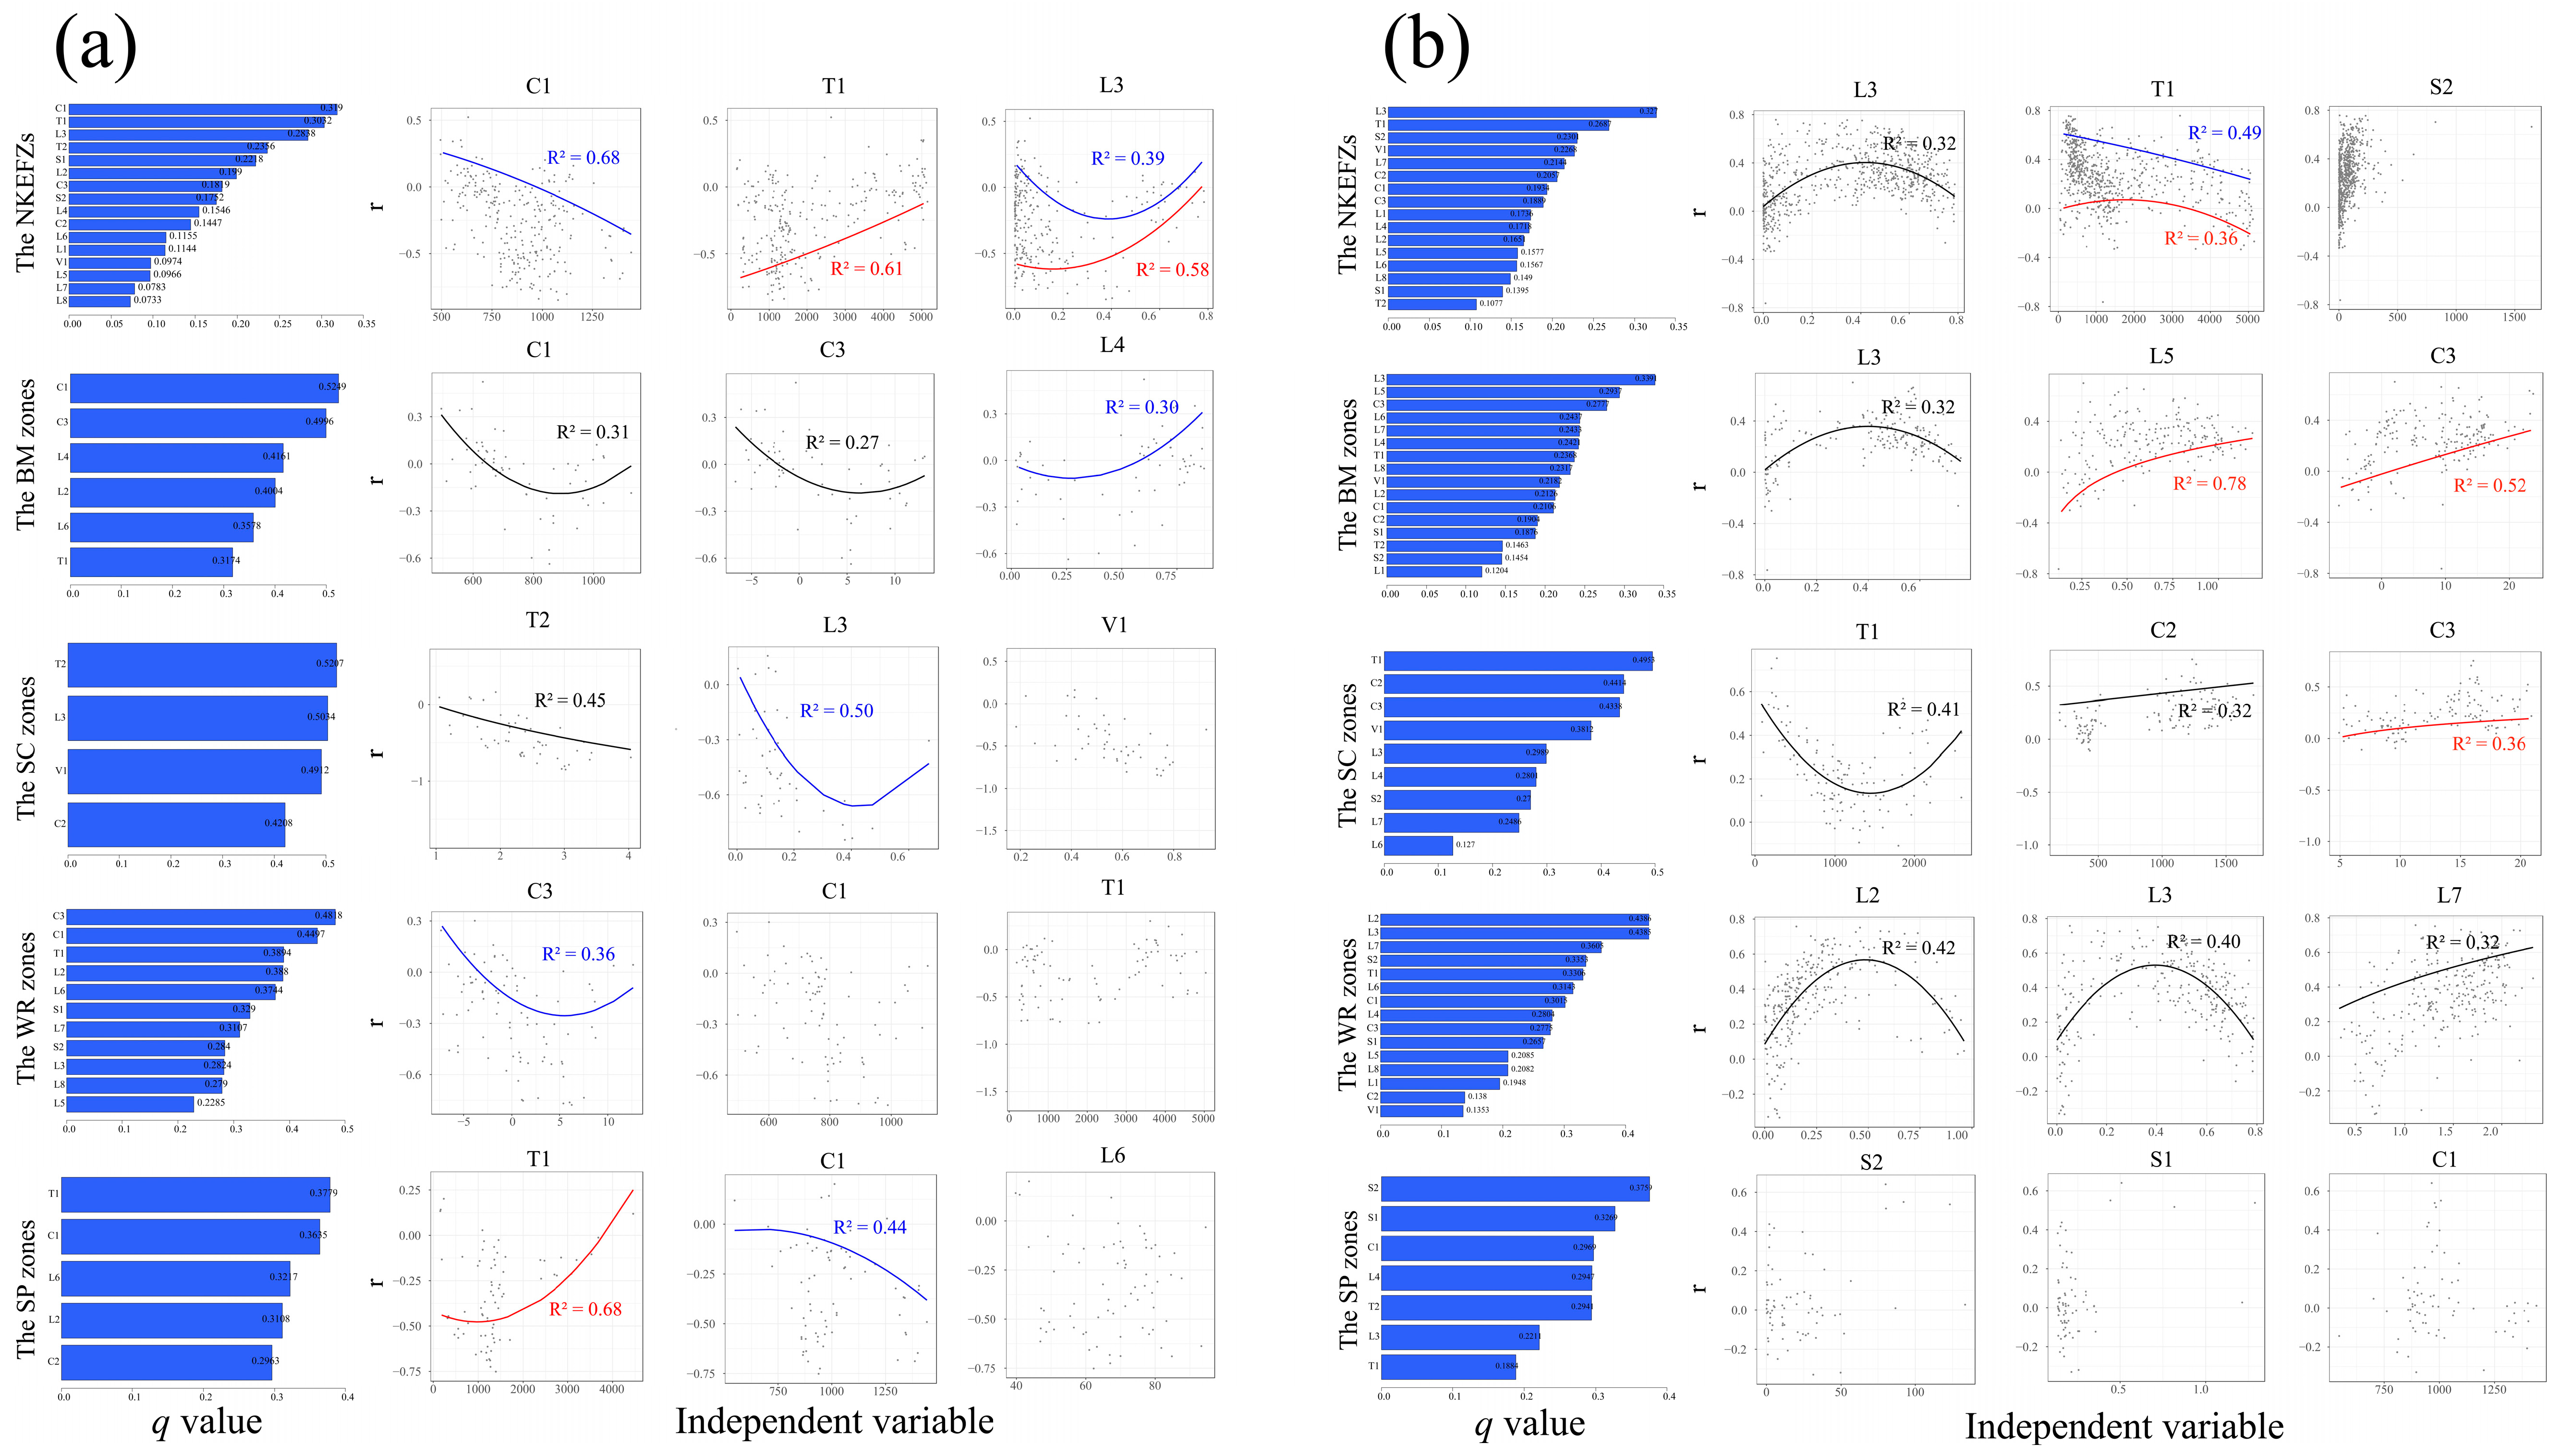
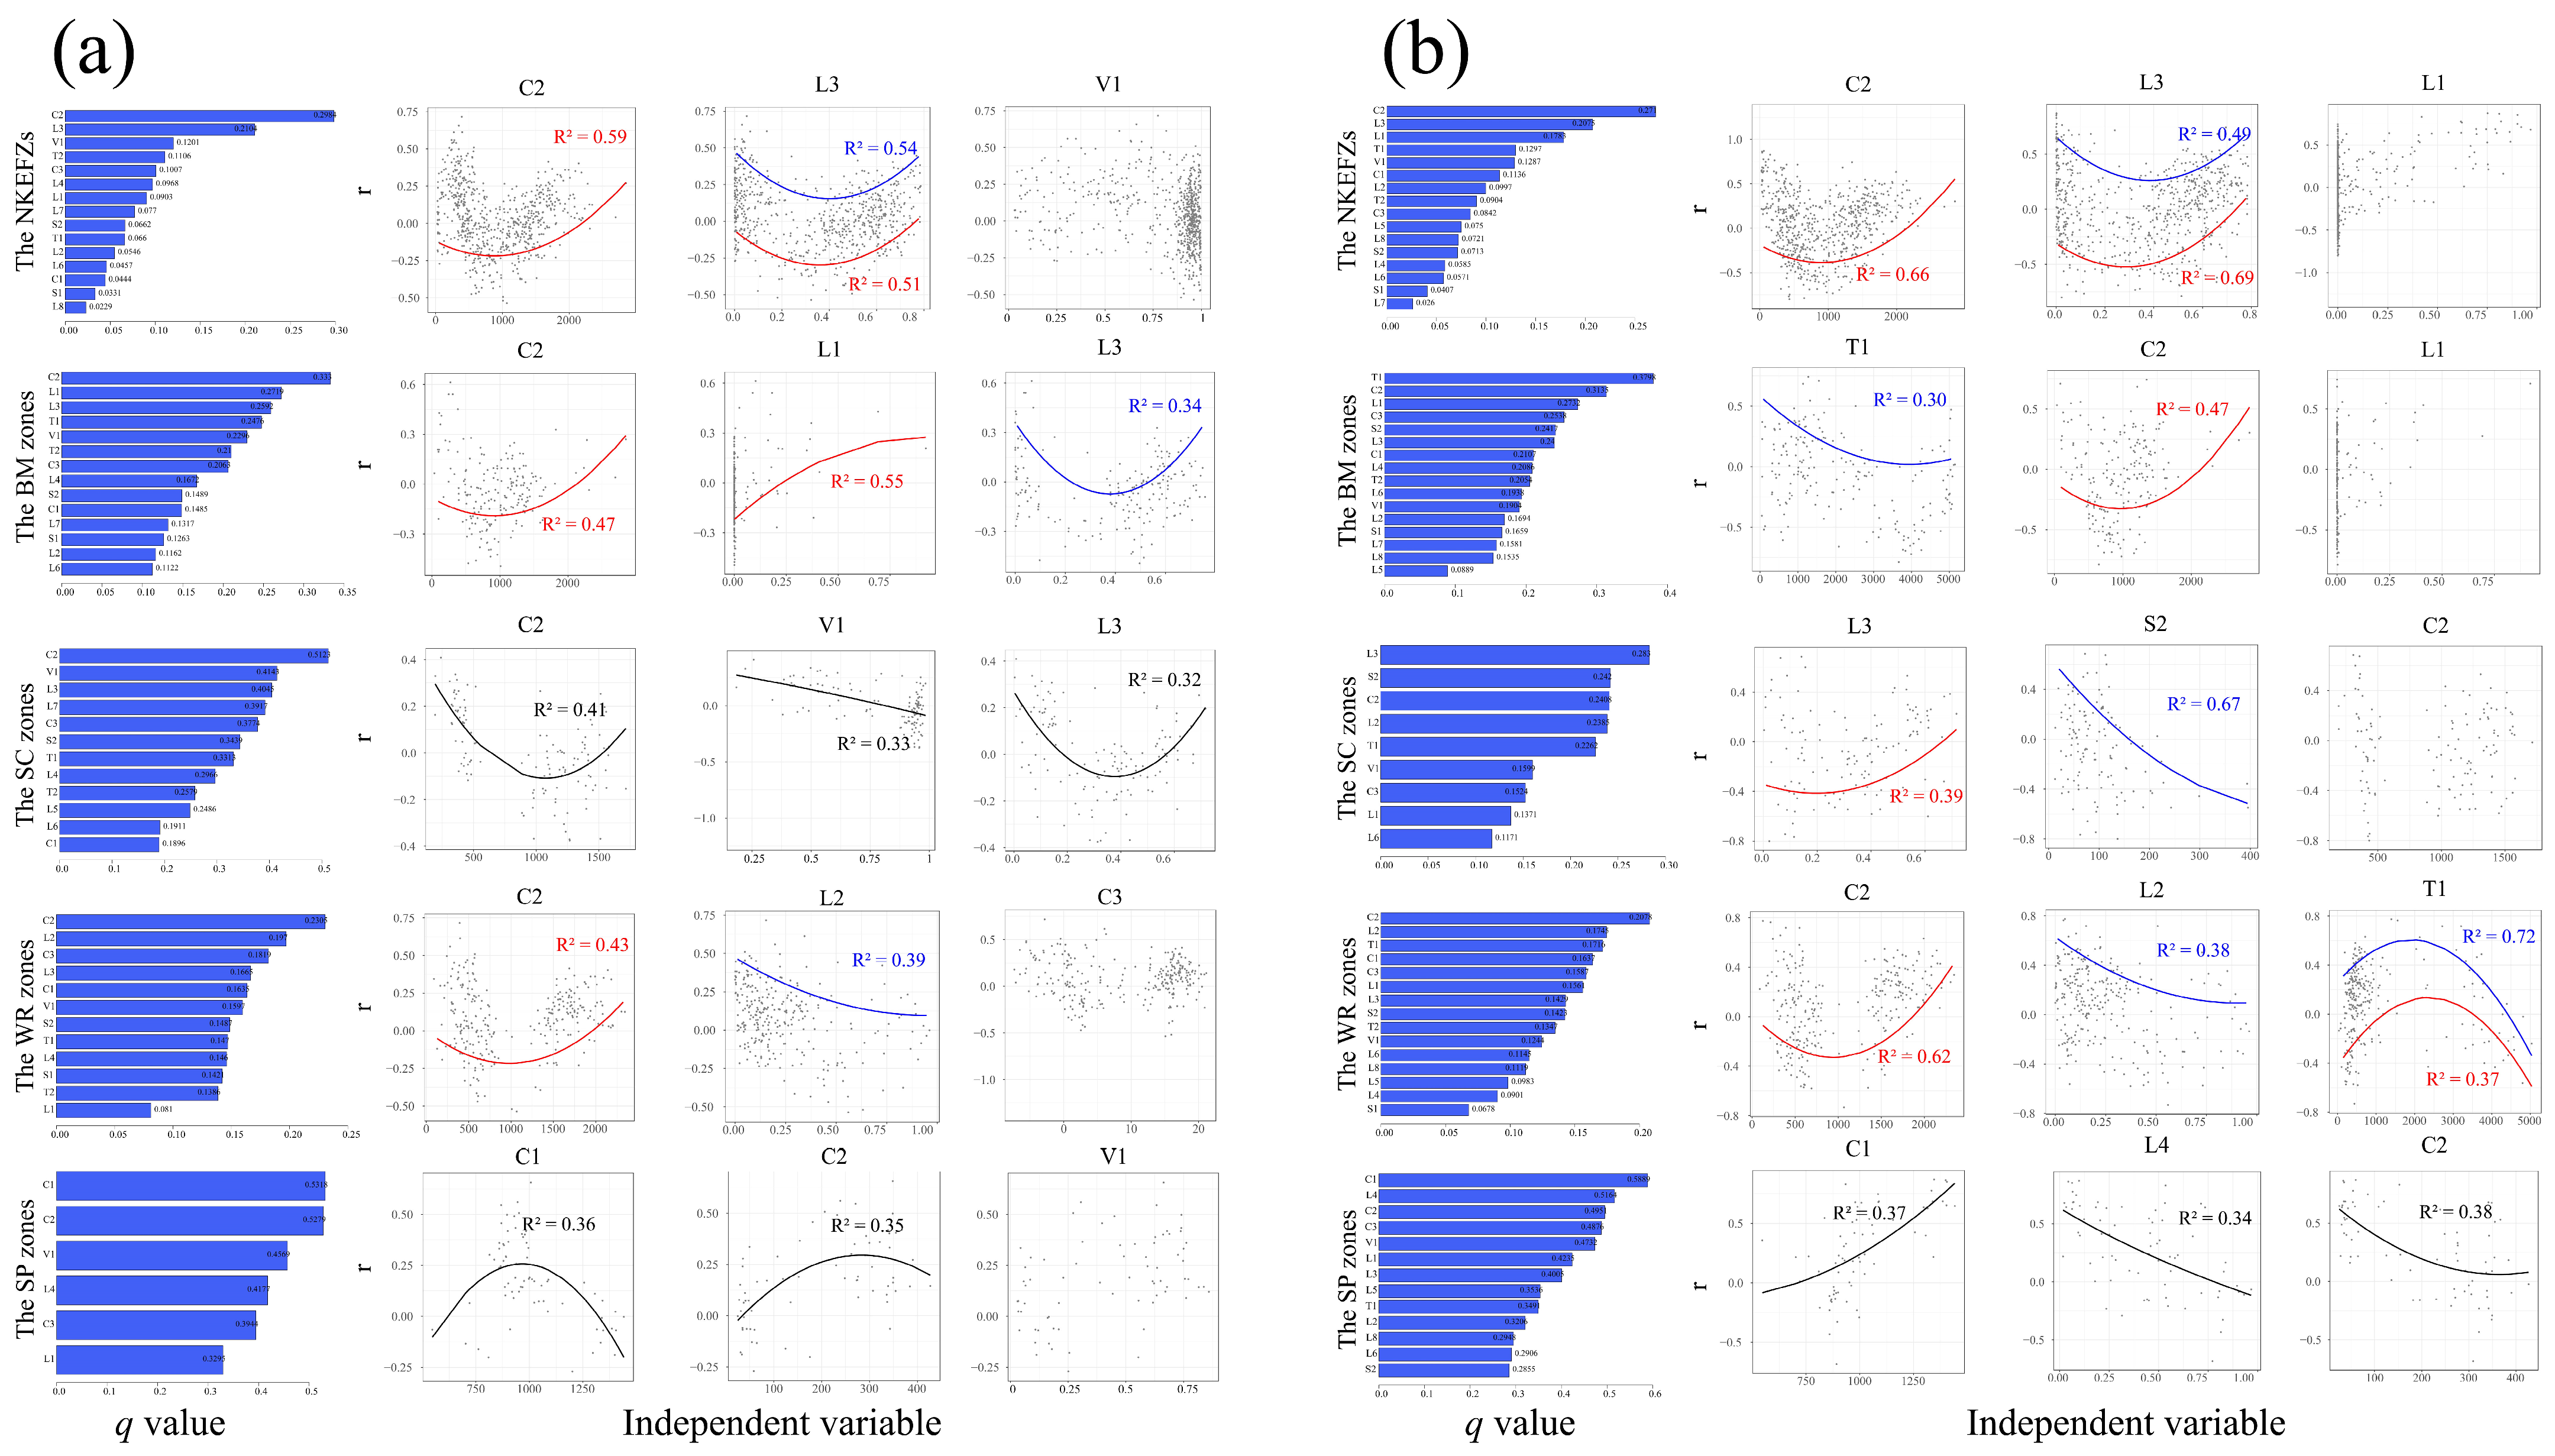
Based on the OPGD and constraint line approach, we next examined the impacts of key natural and socioeconomic drivers on the ES interactions (Figure 4, Figure 5, Figure 6, Figure 7 and Figure 8). Our results revealed complex nonlinear responses of ES interactions to multiple drivers. Across the NKEFZs, the proportion of forest lands, NDVI, climatic variables, and DEM emerged as dominant drivers regulating ES interactions. Notably, landscape configuration metrics (e.g., patch density) and non-forest land cover components became significant predictors in specific sub-regions, whereas socioeconomic factors showed minimal explanatory power. Furthermore, constraint line analysis identified four characteristic response patterns: (1) U-shaped, (2) hump-shaped, (3) logarithmic, and (4) linear/quasi-linear relationships. Threshold effects were particularly evident in U-shaped, hump-shaped, and logarithmic responses, where ES interactions exhibited marked shifts in response magnitude or direction post-threshold.
For the NPP-BM interactions, the proportion of forest land, precipitation, and NDVI were the dominant factors (Figure 4). Except for the SP zones, landscape composition factors exhibited a hump-shaped constraint/regression effect, while NDVI and DEM displayed a U-shaped constraint. For the NPP-SC interactions, the proportion of forest land, DEM, and temperature were the dominant factors. Landscape composition factors generally exhibited a hump-shaped constraint/regression effect, whereas DEM showed a U-shaped constraint. In addition, temperature demonstrated varying effects across different regions (i.e., U-shaped constraint in the NKEFZs, hump-shaped constraint in the SC zones, linear constraint in the SP zones). In the SC zones, NDVI exhibited a quasi-linear constraint.
For the NPP-SP interactions, potential evapotranspiration was the most dominant factor (Figure 5). Landscape composition factors generally exhibited a U-shaped constraint effect. Climatic factors exhibited an enhanced linear upper constraint in the NKEFZs and SP zones, while showing a U-shaped constraint in other sub-regions. For the BM-SC interactions, the proportion of forest land, and DEM were the dominant factors. Landscape composition factors generally exhibited a hump-shaped regression effect, while landscape configuration, temperature, and precipitation showed a linear constraint/regression effect. Moreover, DEM showed varying effects across different regions (i.e., U-shaped constraint in the SC zones, linear constraint in the NKEFZs).
For the BM-SP interactions, proportion of forest land, potential evapotranspiration and DEM were the dominant factors (Figure 6). Most landscape composition and configuration factors exhibited a U-shaped constraint/regression effect. The responses of BM-SP interactions to climatic factors varied across different regions, demonstrating hump-shaped, U-shaped, and linear patterns. Additionally, DEM showed a lower constraint effect in the NKEFZs. For the SP-SC interactions, slope, proportion of forest land and precipitation were the dominant factors. Landscape composition exhibited a linear/quasi-linear constraint/regression effect in the NKEFZs and sub-regions, while Shannon’s diversity index showed a hump-shaped regression effect in the SC zones.
For the SP-WR interactions, DEM, NDVI, and proportion of forest land were the dominant factors (Figure 7). The proportion of forest exhibited hump-shaped lower constraint and linear regression effect in the NKEFZs and SC zones, respectively. In contrast, the contagion index showed a U-shaped lower constraint effect in the BM and SP zones. In addition, NDVI and DEM showed a U-shaped constraint/regression effect in the NKEFZs and sub-regions. For the WR-NPP interactions, precipitation and DEM were the dominant factors. The effects of DEM and precipitation were consistent across all regions, manifesting as linear and U-shaped constraints/regression, respectively. Temperature exhibited different constraint effects in various sub-regions.
For the WR-SC interactions, precipitation and proportion of forest were the dominant factors (Figure 8). Precipitation exhibited a hump-shaped regression in the SP zones, while displaying a U-shaped constraint/regression in the NKEFZs and other sub-regions. The proportion of forest land showed a U-shaped constraint/regression across all regions. In addition, potential evapotranspiration demonstrated a hump-shaped regression effect. For the WR-BM interactions, precipitation and the proportion of forest land were the dominant factors. Precipitation exhibited a U-shaped constraint in the NKEFZs, BM zones, and WR zones, while showing a linear regression effect in the SP zones. DEM demonstrated a quasi-linear constraint in the BM zone and a hump-shaped constraint in the WR zone. The proportion of forest area exhibited a U-shaped constraint in both the NKEFZs zone and SC zones.
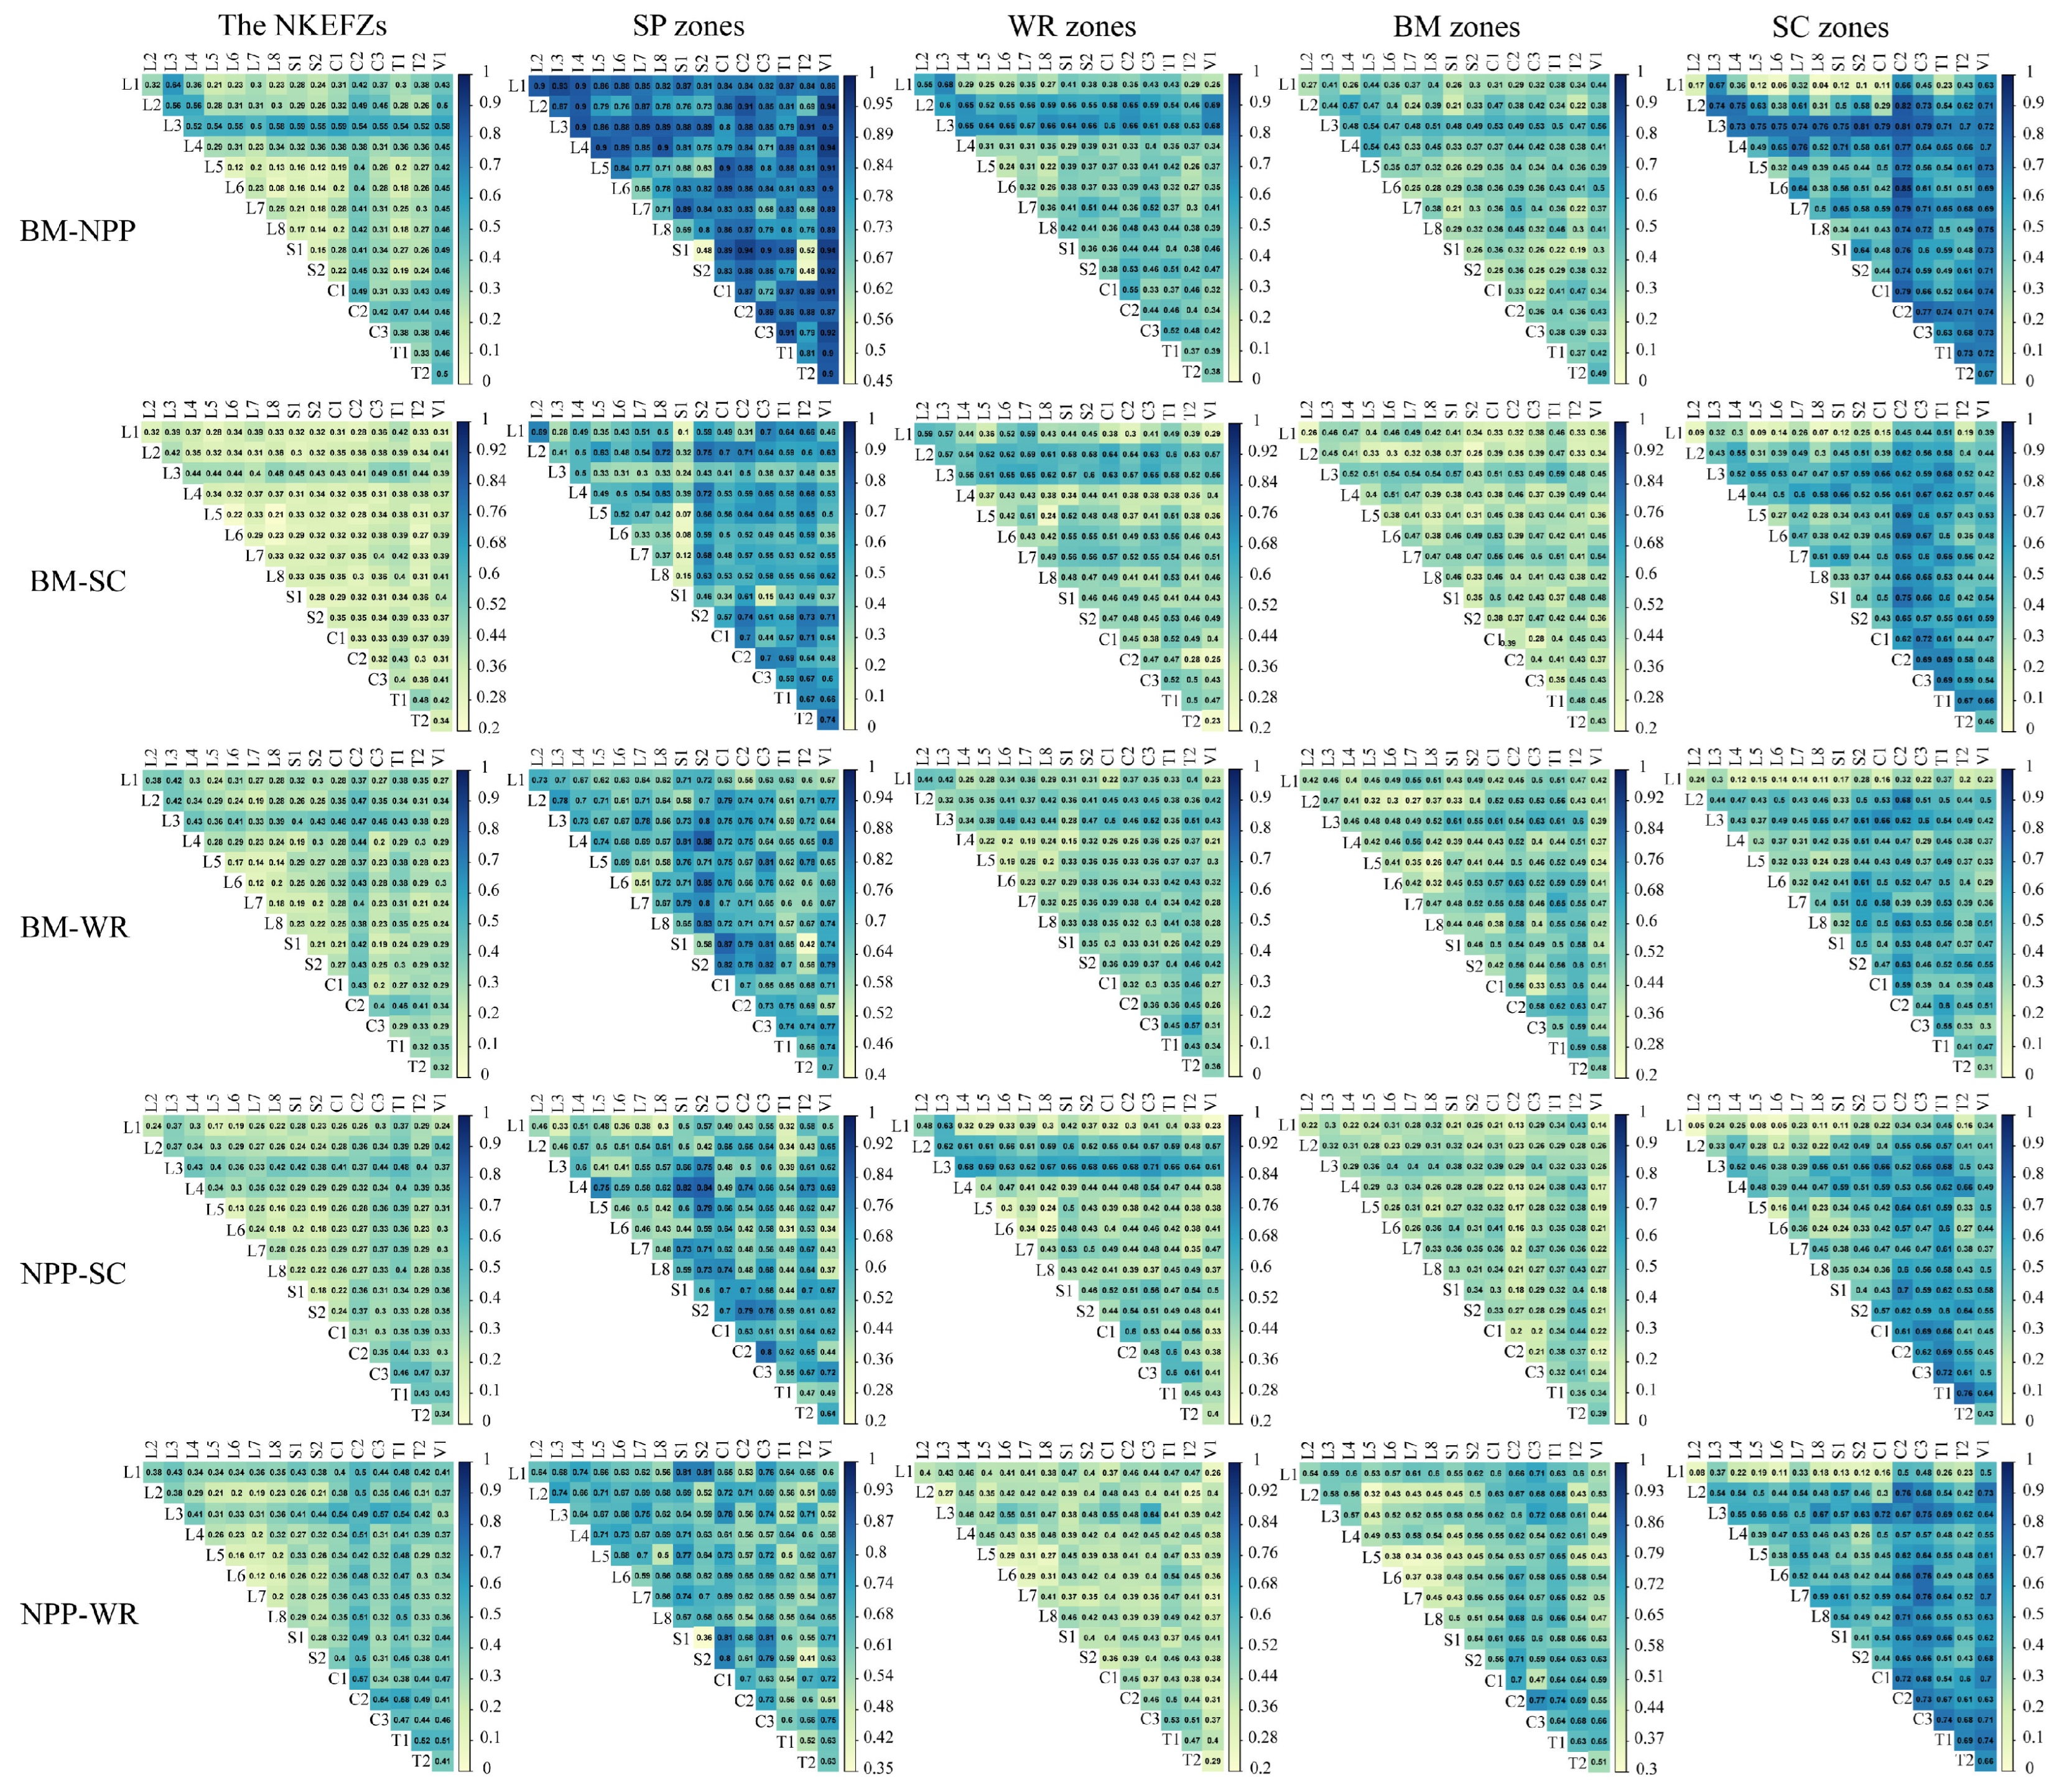
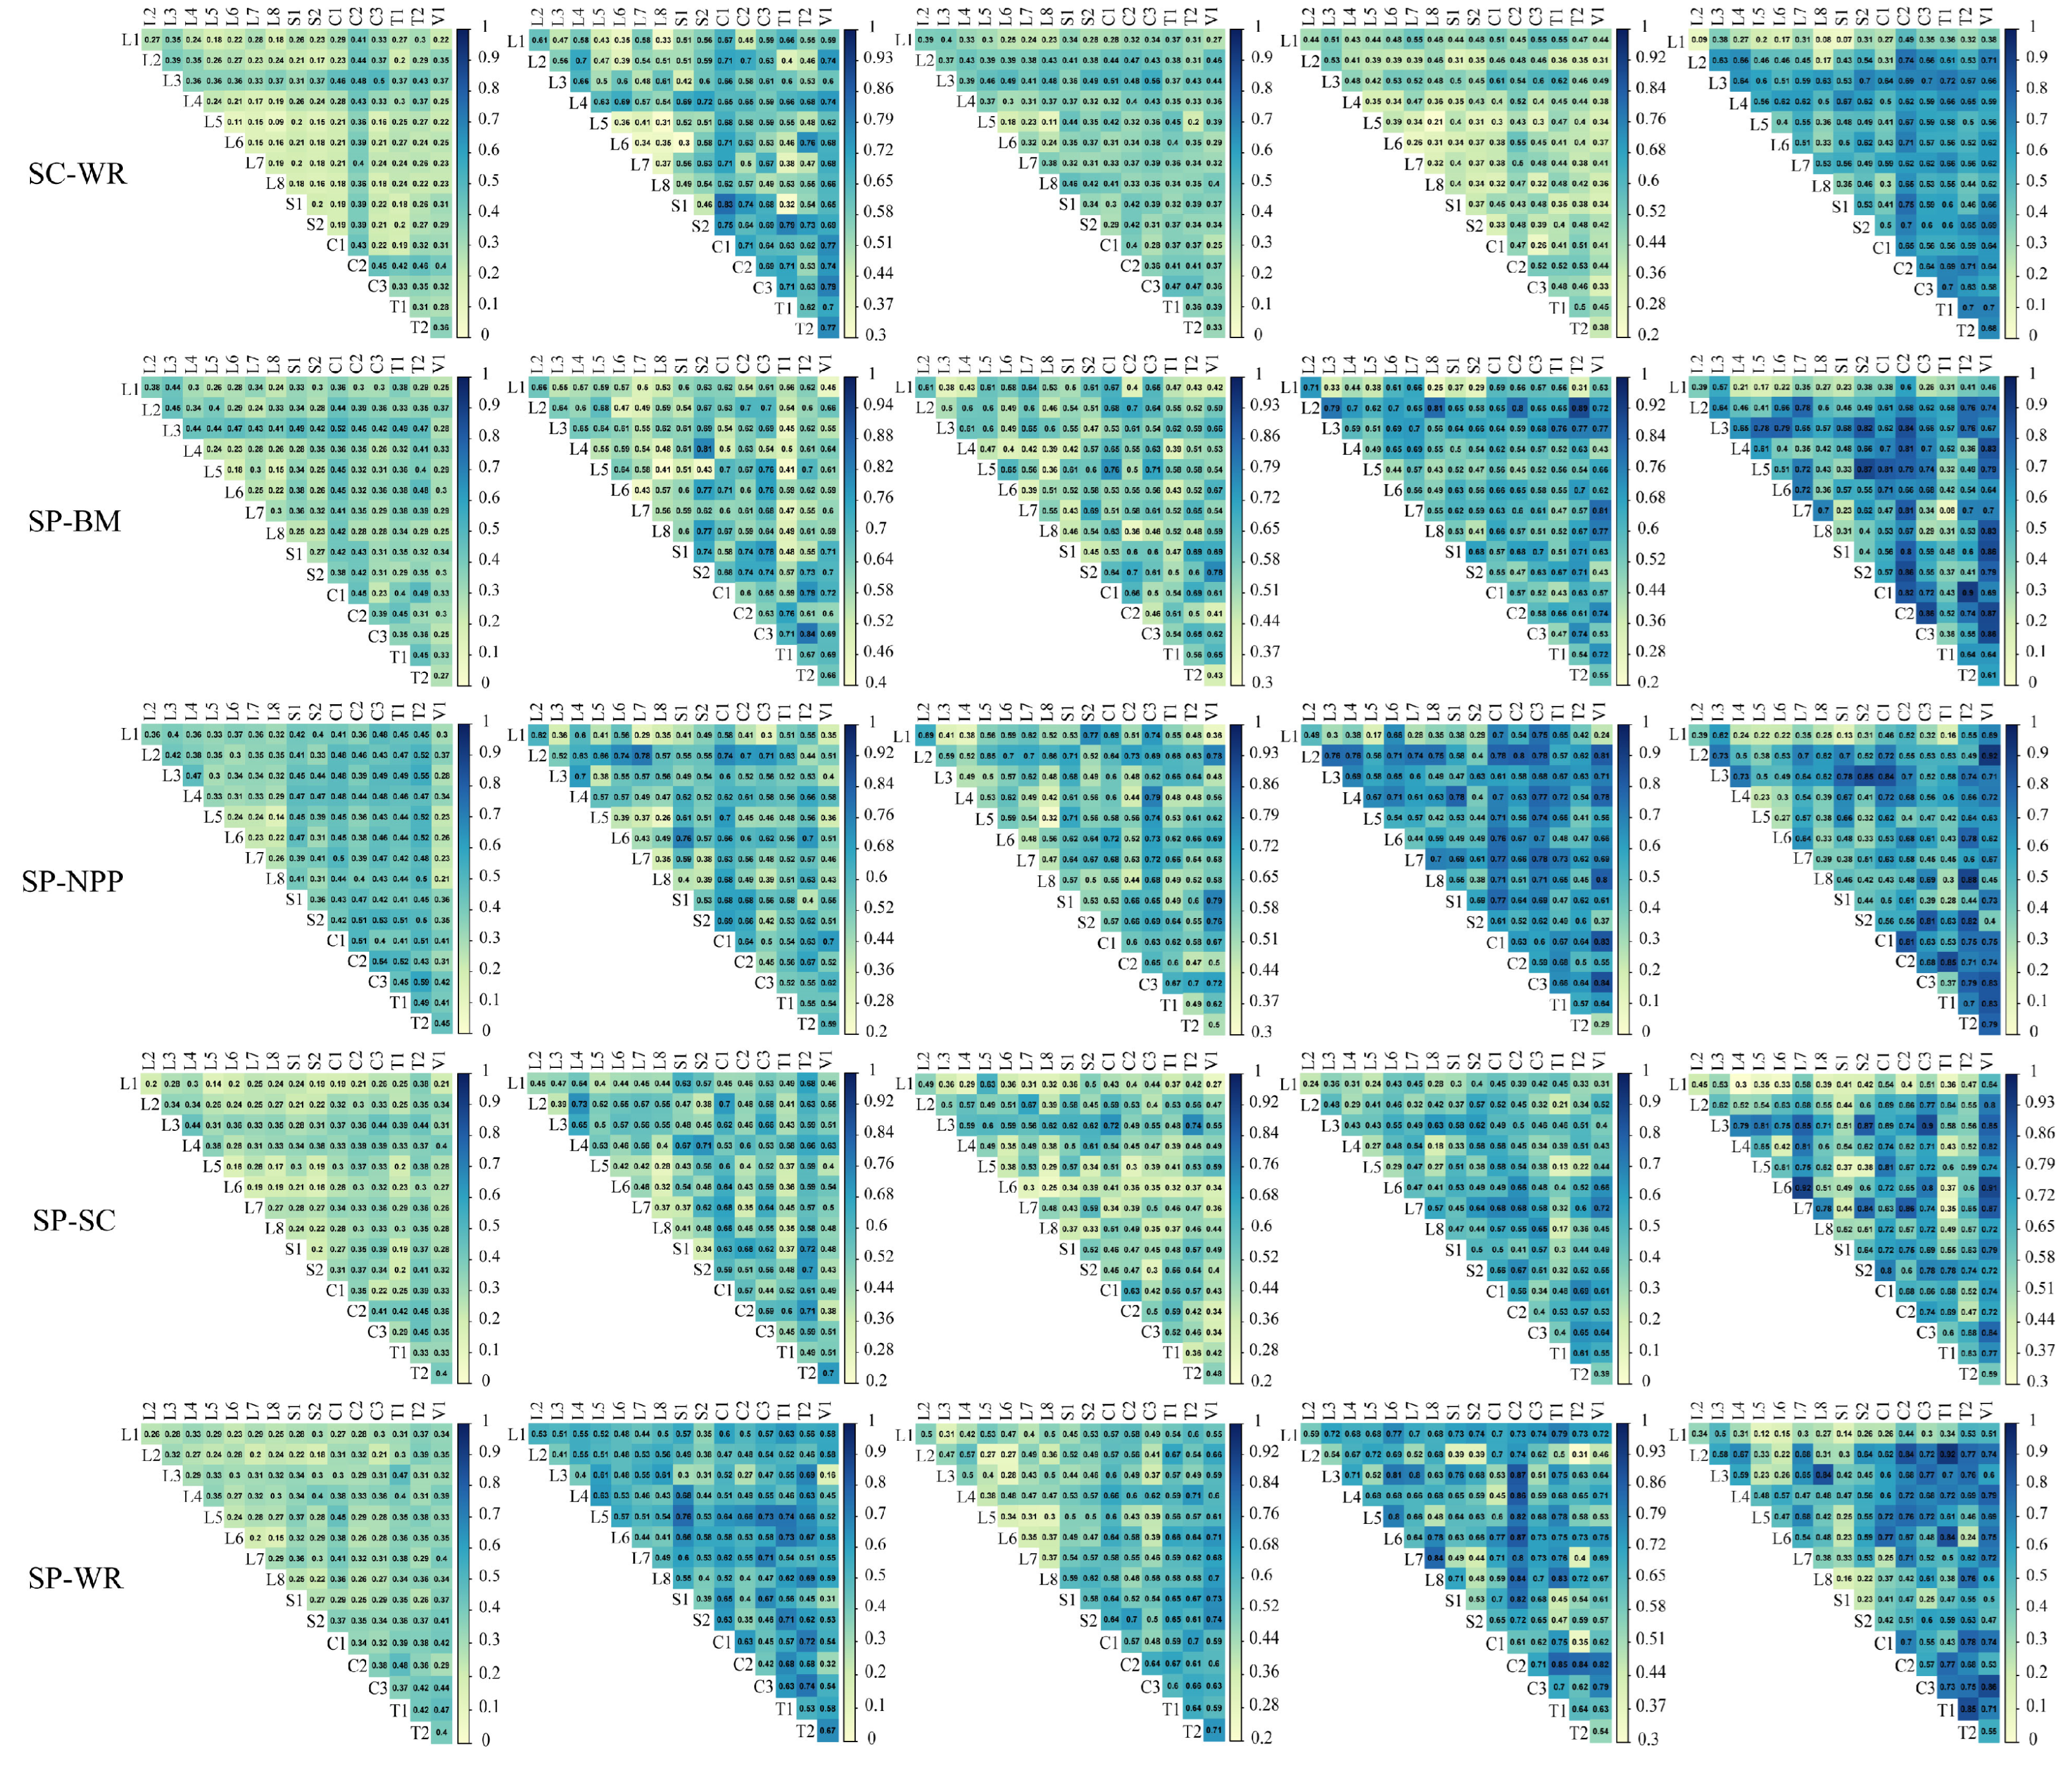
As shown in Figure 9, the interaction between any two factors more significantly influenced the spatial distribution of ES interactions compared to a single factor. In the NKEFZs, the interactions between landscape composition factors, topographic, and climate factors generally exhibited higher explanatory power. In contrast, interactions related to landscape configuration and socio-economic factors had lower explanatory power.

4. Discussion

4.1. Spatiotemporal Dynamics of Ecosystem Services

Over the past two decades, the five key ES in the NKEFZs generally improved, which is consistent with findings of national-scale research conducted in China [34,39,46]. However, a study found a significant decline in BM in China, contrary to the results of our study [47]. This difference was because, in the NKEFZs, human development activities such as urban expansion have been significantly restricted, which had a relatively minor negative impact on the local ecosystems, and the conflicting conclusions implied the effectiveness of ecological protection in the NKEFZs. Specifically, we detected a significant upward trend of NPP in the NKEFZs, which may be driven by a combination of factors, such as elevated atmospheric CO2 concentrations, shifts in precipitation patterns, and ecological protection and restoration projects [48,49,50]. In this study, an overall increasing trend in the fluctuations of water retention was discerned, despite the significant spatial heterogeneity. According to the principle of water balance, precipitation and evapotranspiration were the dominant factors in the spatiotemporal dynamics of water retention. A recent global study showed that during the study period from 2000 to 2020, precipitation was the primary controlling factor of water availability in humid and semi-humid regions, while in arid and semi-arid regions, both precipitation and evapotranspiration jointly dominated water availability [51]. In line with previous studies at the regional level [52,53], our findings also indicated that precipitation and potential evapotranspiration played a crucial role in regulating the interactions between water-related ES in the NKEFZs and sub-regions. It is generally agreed that wind speed fundamentally impacts sand fixation and determines potential wind erosion. Relevant studies revealed a significant decrease in surface wind speed in China over the past 50 years, attributed to climate change, especially in the northwestern region of China [54,55]. On the other hand, the implementation of ecological restoration projects such as The Three-North Shelterbelt Program in the northwestern region of China has promoted vegetation recovery and played a crucial role in reducing actual wind erosion. These factors have collectively contributed to a substantial decrease in the wind erosion modulus since 2000. This also explained why our study, along with other related research conducted in the Beijing–Tianjin Sand Source Region and Inner Mongolia, exhibited similar temporal variation trends of wind erosion [38,40]. According to the RUSLE, the R factor and C factor are the most important factors that impact the dynamics of soil conservation over time. Although the reduction in the C factor and the increase in the R factor can both enhance soil conservation, the latter is undesirable in ecosystem management practices. Therefore, we further used the actual soil water erosion modulus to characterize the current state of soil erosion, and a decrease in the water erosion modulus indicated an increase in soil conservation service. We found an increasing trend of the water erosion modulus despite not being significant. The increased rainfall erosivity caused by climate change was the dominant factor for this upward trend, while the reduction in the C factor due to vegetation recovery significantly mitigated the negative impacts of climate change (Figure S1). The finding is consistent with previous research conducted at the scale of China [34]. As human-induced development is strictly restricted, the impact of urbanization was far smaller than that of other factors in the NKEFZs.
It is worth mentioning that accurately simulating the spatiotemporal dynamics of ES is crucial to understanding ES interactions [56,57]. In this research, multi-source field measurements and literature-based statistical data were used to compare and validate ES simulation results, thereby enhancing the credibility of the analysis in terms of ecosystem decision-making (Figures S2–S8). Moreover, using counties as the basic unit for evaluating ES interactions not only revealed the spatial differentiation of ES interactions but also minimized the impact of uncertainties in ES grid-scale assessments on the identification of ES interactions. It is worth noting that the ES calculations in this study may be subject to uncertainties arising from differences in data sources, model parameterizations, and spatial resampling processes. County-scale analysis overlooks the spatial heterogeneity of ecological processes within counties. While validation efforts were conducted, further work is needed to quantify and reduce these uncertainties based on approaches such as scenario analysis, especially in data-scarce regions.

4.2. Ecosystem Services Interactions and Potential Driving Mechanisms

To achieve a more nuanced understanding of ES interactions within the NKEFZs, we integrated the OPGD with constraint line methods to examine the spatial heterogeneity of driving factors for ES interactions at the county scale and their nonlinear impacts. Widespread spatial synergies between most pairs of the ES were discovered, which was consistent with most previous studies, particularly at large spatial scales [58,59]. For instance, a study conducted in the hilly regions of southern China revealed widespread spatial synergies among soil conservation, habitat quality, and carbon storage in pairwise combinations [18]. Driving forces analysis indicated that these results were mainly attributed to climate conditions, terrain characteristics, and landscape composition. In the humid and semi-humid southeastern regions of the NKEFZs with favorable hydrothermal conditions and rich biodiversity, forests are widely distributed. On one hand, forests, as the primary carbon sequestration entities of terrestrial ecosystems, have an NPP generally higher than that of other ecosystems. On the other hand, forests intercept precipitation through their canopy and litter layer, effectively reducing surface runoff, increasing soil infiltration, enhancing the ecosystem’s water conservation capacity, and lowering the risk of soil erosion. Additionally, forest canopies can significantly reduce near-surface wind speeds, thereby decreasing wind erosion [42]. Tree and grass planting activities driven by ecological restoration projects have directly promoted the enhancement of multiple ES benefits and their synergies. In addition, natural regeneration without intensified human disturbances—such as grazing bans—may have also played a significant role in the synergistic improvement of ES in certain regions. However, high precipitation in mountainous areas with significant terrain undulation is more likely to exacerbate soil erosion, reducing the ecosystem’s ability to provide SC and BM. In arid and semi-arid regions, the expansion of forested areas is likely to lead to increased evapotranspiration, soil desiccation, and a drop in groundwater levels, which in turn affects the restoration of natural vegetation and socio-economic development [60,61]. This may be the reason why we observed widespread clusters of trade-offs between water-related ES in the Tibetan Plateau, Southern Hills, and northeast arid regions. The relatively low explanatory power of socioeconomic factors (e.g., GDP, population density) may be attributed to the aggregated spatial resolution of the analysis (county scale), which may smooth out local heterogeneity in socioeconomic conditions. Moreover, the limited human activity allowed within the NKEFZs due to strict ecological protection policies may have further reduced the influence of these factors on ES interactions. Similar findings have been reported in other ecologically sensitive or protected regions, where natural and landscape variables tend to play a more dominant role [62].
Previous research has shown that constraint lines approach serves as an effective tool for capturing the constraint effects of individual driving factors on ES under the integrated influence of multiple interacting variables [63]. Therefore, the shape of the constraint line can be used to infer the influence characteristics of a specific factor, particularly its threshold effect. In this study, four types of constraint effects were identified. Among them, U-shaped, logarithmic, and hump-shaped relationships exhibited clear threshold behaviors. When the threshold is exceeded, the direction of the factor’s effect shifts. Identifying such thresholds is valuable for effective ecosystem management and the implementation of ecological protection policies. This is especially important in water-limited regions, where clarifying the threshold of vegetation restoration is crucial to prevent unintended ecological consequences [64]. For example, our results showed that for multiple pairs of ES, the proportion of forest land exhibited a hump-shaped constraint relationship, with a threshold ranging between 0.4 and 0.6. This suggests that beyond this threshold, achieving synergies in multiple ES might become more difficult.
The results of the constraint lines analysis showed that there was a nonlinear relationship between ES interactions and different driving factors, indicating that ES interactions depended on complex multi-factor interactions. For example, precipitation generally promoted ES synergies, exhibiting linear/quasi-linear regression or constraint effects (Figure 4, Figure 5, Figure 6, Figure 7 and Figure 8). This aligns with the study by Yu et al. (2023) in the Qinling Mountains, China, which reported an upper quasi-linear constraint imposed by precipitation on the overall supply of ES, indicating that higher precipitation levels elevated the upper boundary of ES provision [65]. However, in the WR-NPP and WR-SC interactions, we detected an increasing constraint effect with increasing precipitation in the SC zones. This may be because the SC zones were primarily located in the Loess Plateau and Southern Hills regions. The Loess Plateau has loose soil and poor erosion resistance, with numerous gullies, so increased precipitation easily led to soil erosion [66]. Although the Southern Hills region has dense vegetation and strong erosion resistance, excessive precipitation exacerbated soil erosion, leading to trade-offs between SC and other ESs. This is consistent with previous studies [21,67]. Additionally, in the NPP-BM, NPP-SC, and BM-SC interactions, we detected an apparent threshold effect of forest proportion on ES interactions, which exhibited a hump-shaped constraint/regression in both the NKEFZs and the sub-regions. This may have been because, once the forest area proportion exceeded a certain threshold, water availability became the main limiting factor for the synergistic growth of ES [68,69]. Additionally, socio-economic factors (i.e., population density) exhibited a significant constraint effect on the WR-BM interaction only in the SC zones, where an increase in population density led to a linear decrease in the maximum of synergies. This implied the effectiveness of ecological protection in the NKEFZs. However, during landscape decision-making, attention must still be paid to the potential negative impacts of human activities (such as agricultural expansion and ecotourism) on the synergistic protection of ES. Note that the same driving factor can exhibit different effects in different regions. For example, in the case of the NPP-BM interaction, NDVI showed a U-shaped relationship in the overall NKEFZs, whereas a negative linear relationship was observed in the SP zones. This suggests that the response of ES interactions to driving factors may be shaped by multiple contextual variables, which is consistent with previous research [45,70]. In the SP zone, the increased trade-offs with rising NDVI may be attributed to water limitations. In contrast, in the broader NKEFZs, where water availability is relatively higher, synergies tend to concentrate in areas with high NDVI values.
Consistent with previous research [71], we revealed the importance of landscape configuration factors for ES interactions, especially in the sub-regions of the NKEFZs. Landscape configuration influences ES and their trade-offs and synergies by affecting spatial source–sink processes, inter-species dependencies, and physical connectivity [72]. For instance, landscape fragmentation, reflected by patch density, is often negatively correlated with ES and their interactions, possibly because fragmentation hinders the flow of biota and materials across space [73]. Landscape aggregation and the contagion index tend to promote synergies between ES, possibly due to the increased landscape connectivity that enhances the supply efficiency of multiple ES [74]. A higher landscape diversity index indicates the presence of more ecosystem types, enhancing the ecosystem’s resistance and adaptability and thereby improving the overall benefits of multiple ES supplies. However, some studies have pointed out that complex topography and ecosystem types are detrimental to the cohesive development of ES, leading to widespread spatial trade-offs [21,43]. A recent study in the Xiangjiang River Basin showed that the impact of the same landscape configuration factors on ES interactions was generally similar [75]. However, our study indicated that in the NKEFZs, ES interactions exhibited complex nonlinear responses to landscape configuration factors for different sub-regions. Significant constraint/regression effects of landscape configuration factors were detected for NPP-BM, BM-SC, SP-SC, SP-WR, and WR-NPP in sub-regions, which appeared as U-shaped, hump-shaped, or linear constraints/regressions in different regions and for different ES interaction types. This complex response may be due to the diversified climate and ecosystem types in the NKEFZs. For example, in patches with farmland as the matrix, embedding forest or grassland patches can effectively enhance the regional ES supply capacity, even though patch density increases. In contrast, the aggregation of cropland patches is likely to have negative effects on multiple ES, such as BM and SC [76].
The interaction detection results of driving factors indicated that the interaction effects of nearly all factors were higher than those of individual driving factors, which was consistent with previous research [9,77]. Furthermore, in different NKEFZs and across various types of ES interactions, the patterns of the interaction matrix of driving factors were complex and varied, further reflecting the complexity of ES interactions and ecosystem management.

4.3. Implications

Our work presents several key implications for ecosystem management. In ecologically fragile areas with complex landform types, such as the Qinghai–Tibet Plateau, the spatial trade-offs between ES may be a crucial factor limiting the effectiveness of ecological restoration [78,79]. In future project implementations, it is necessary to conduct continuous meteorological, hydrological, and vegetation monitoring in targeted project areas based on the identified trade-off clusters, thereby determining future strategies for ecological restoration and climate change adaptation. Moreover, in water-limited arid and semi-arid regions like the Loess Plateau, selecting afforestation species that match local water conditions is essential for ecological restoration, which may efficiently enhance the synergies between WR and other ES. Furthermore, due to direct land use conflicts, provisioning services such as crop production frequently exhibit significant spatial trade-offs with ES such as BM. Management practices such as conservation tillage, terracing, and the application of organic fertilizers can enhance crop yields while simultaneously improving erosion control and promoting soil conservation [7]. In addition, although most trade-offs primarily occurred between water-related ES in our study, considering that WR often provides benefits to downstream areas in the form of ES flows (e.g., providing clean water resources, reducing flood peaks), focusing solely on the synergies between related ES may be problematic. Research that identifies and protects key supply areas for WR based on ES flows could be a promising approach to achieving ES synergies at larger scales [76,80]. It is worth noting that the response of ES interactions to landscape configuration and its threshold should be given more attention, especially in the NKEFZs. Due to policy impacts or restrictions, it seems difficult to change landscape composition. In areas where landscape configuration has a significant influence and the landscape composition is relatively complex, promoting the synergies of ES through adjusting landscape configuration without altering composition can be considered an effective approach [75]. For example, appropriately designing ecological corridors in forest and grassland patches or enhancing landscape connectivity through well-planned vegetation restoration can be viable solutions. However, such adjustments need to be considered with trade-offs based on local conditions and response thresholds. In this study, the definition of constraint lines to some extent reveals the potential for promoting the synergistic conservation of ES, which has positive implications for guiding regional ecological protection. Therefore, special attention should be paid to the threshold effects of key driving factors in order to enhance the effectiveness of ecological conservation decision-making. In summary, our study proposes a promising approach to provide scientific support for multi-ES conservation, and enhances the understanding of the nonlinear driving mechanisms of multiple factors on ES interactions. The proposed framework—encompassing ES interaction quantification, identification of key driving forces, and analysis of driving mechanisms—is not only applicable to large-scale ES research, but can also be adapted to other spatial scales, provided that appropriate data are available.
There are several limitations in our study. First, due to the complexity of biodiversity and issues related to the availability of spatiotemporal data, we chose habitat quality as an alternative indicator for representing BM, which may not fully reflect the biodiversity conservation needs such as species diversity and genetic diversity of the NKEFZs. Moreover, although we validated the reliability of the spatiotemporal trends in the ES evaluation results based on existing data and references, there remains uncertainty in regions lacking relevant verification data. Therefore, when applying the methodology regionally, it should be validated as much as possible with field data. While the county-scale approach is valuable, it may introduce uncertainties when comparing water retention with other ES. In such cases, watershed-scale analysis might be more appropriate for water-related ES. In addition, we used Pearson correlation to identify ES interactions, which overlooked the complex nonlinear interactions between ES within counties. Nevertheless, the combination of OPGD and constraint line methods revealed the complex responses of ES interactions to driving factors, contributing to a deeper understanding of the mechanisms of ES interactions.

5. Conclusions

Understanding ES interactions is crucial for achieving regional sustainable development. This study explored the spatial differentiation characteristics of ES interactions at the county scale in the NKEFZs and revealed the driving mechanisms of ES interactions in different types of functional zones by combining OPGD and constraint line methods. The results showed that spatial synergies dominated in most ES interaction types, with widespread spatial trade-offs observed only in water-related ES interaction types (i.e., WR-NPP, WR-BM, and WR-SC), primarily concentrated in the central and southern parts of the Qinghai–Tibet Plateau, the Southern Hills regions, and northeastern China. From 2000 to 2020, due to the overall improvement in ES, the synergies between ES strengthened. The driving mechanism analysis indicated that for the entire NKEFZs, the proportion of forest lands, NDVI, climatic variables, and DEM emerged as the dominant drivers regulating ES interactions, while their influence was highly context-dependent. Other landscape composition factors, landscape configuration factors, and slope had high explanatory power in specific interaction types and sub-regions. Furthermore, this study identified four types of response curves, including U-shaped, hump-shaped, logarithmic, and linear/quasi-linear effects. The same factors exhibited diverse or even opposite nonlinear effects (e.g., U-shaped and hump-shaped) in different sub-regions and ES interaction types, reflecting the complexity and context-dependency of ES interactions. In specific regional ecosystem planning, it is essential to identify key driving factors and their potential impact thresholds based on key conservation objectives in order to avoid unnecessary ES trade-offs and ecological losses.

Supplementary Materials

The following supporting information can be downloaded at: https://www.mdpi.com/article/10.3390/rs17091559/s1, Text S1: Detailed methods to evaluate ecosystem services; Text S2: Detailed methods for validation; Text S3: Detailed results for the interaction detection of driving factors; Figures S1–S8; Table S1: The sensitivity and habitat suitability table for the habitat quality model; Table S2: The basic information of other studies of measurements and simulations for wind erosion modulus; refs. [81,82,83,84,85,86,87,88].

Author Contributions

Conceptualization, T.Z. and Q.S.; Data curation, T.Z.; Formal analysis, T.Z., and Q.S.; Investigation, T.Z. and H.H.; Methodology, T.Z.; Software, T.Z.; Supervision, Q.S.; Validation, T.Z.; Writing—original draft, T.Z.; Writing—review and editing, T.Z. All authors have read and agreed to the published version of the manuscript.

Funding

This study was supported by National Key Research and Development Program of China (No. 2023YFF1303703), National Key Research and Development Program of China (No. 2017YFC0506501), and Strategic Priority Research Program of the Chinese Academy of Sciences (No. XDA23100203).

Data Availability Statement

The data that support the findings of this study are available from the corresponding author upon reasonable request.

Conflicts of Interest

The authors declare no conflicts of interest.

References

  1. Millennium Ecosystem Assessment (MEA). Ecosystems and Human WellBeing: Synthesis; Island Press: Washington, DC, USA, 2005. [Google Scholar]
  2. Costanza, R.; de Groot, R.; Braat, L.; Kubiszewski, I.; Fioramonti, L.; Sutton, P.; Farber, S.; Grasso, M. Twenty Years of Ecosystem Services: How Far Have We Come and How Far Do We Still Need to Go? Ecosyst. Serv. 2017, 28, 1–16. [Google Scholar] [CrossRef]
  3. Díaz, S.; Pascual, U.; Stenseke, M.; Martín-López, B.; Watson, R.T.; Molnár, Z.; Hill, R.; Chan, K.M.A.; Baste, I.A.; Brauman, K.A.; et al. Assessing Nature’s Contributions to People. Science 2018, 359, 270–272. [Google Scholar] [CrossRef] [PubMed]
  4. Brauman, K.A.; Garibaldi, L.A.; Polasky, S.; Aumeeruddy-Thomas, Y.; Brancalion, P.H.S.; DeClerck, F.; Jacob, U.; Mastrangelo, M.E.; Nkongolo, N.V.; Palang, H.; et al. Global Trends in Nature’s Contributions to People. Proc. Natl. Acad. Sci. USA 2020, 117, 32799–32805. [Google Scholar] [CrossRef] [PubMed]
  5. Carpenter, S.R.; Mooney, H.A.; Agard, J.; Capistrano, D.; DeFries, R.S.; Diaz, S.; Dietz, T.; Duraiappah, A.K.; Oteng-Yeboah, A.; Pereira, H.M.; et al. Science for Managing Ecosystem Services: Beyond the Millennium Ecosystem Assessment. Proc. Natl. Acad. Sci. USA 2009, 106, 1305–1312. [Google Scholar] [CrossRef]
  6. Costanza, R.; de Groot, R.; Sutton, P.; van der Ploeg, S.; Anderson, S.J.; Kubiszewski, I.; Farber, S.; Turner, R.K. Changes in the Global Value of Ecosystem Services. Glob. Environ. Change 2014, 26, 152–158. [Google Scholar] [CrossRef]
  7. Bennett, E.M.; Peterson, G.D.; Gordon, L.J. Understanding Relationships among Multiple Ecosystem Services: Relationships among Multiple Ecosystem Services. Ecol. Lett. 2009, 12, 1394–1404. [Google Scholar] [CrossRef]
  8. Lee, H.; Lautenbach, S. A Quantitative Review of Relationships between Ecosystem Services. Ecol. Indic. 2016, 66, 340–351. [Google Scholar] [CrossRef]
  9. Zhang, H.; Liu, S. Exploring the Spatial–Temporal Patterns of Urban Ecosystem Service Relationships and Their Driving Mechanisms: A Case Study of Wuhu City, China. Ecol. Indic. 2024, 167, 112726. [Google Scholar] [CrossRef]
  10. Dade, M.C.; Mitchell, M.G.E.; McAlpine, C.A.; Rhodes, J.R. Assessing Ecosystem Service Trade-Offs and Synergies: The Need for a More Mechanistic Approach. Ambio 2019, 48, 1116–1128. [Google Scholar] [CrossRef]
  11. Zhang, Y.; Wu, T.; Song, C.; Hein, L.; Shi, F.; Han, M.; Ouyang, Z. Influences of Climate Change and Land Use Change on the Interactions of Ecosystem Services in China’s Xijiang River Basin. Ecosyst. Serv. 2022, 58, 101489. [Google Scholar] [CrossRef]
  12. Ndong, G.O.; Therond, O.; Cousin, I. Analysis of Relationships between Ecosystem Services: A Generic Classification and Review of the Literature. Ecosyst. Serv. 2020, 43, 101120. [Google Scholar] [CrossRef]
  13. Anderson, B.J.; Armsworth, P.R.; Eigenbrod, F.; Thomas, C.D.; Gillings, S.; Heinemeyer, A.; Roy, D.B.; Gaston, K.J. Spatial Covariance between Biodiversity and Other Ecosystem Service Priorities. J. Appl. Ecol. 2009, 46, 888–896. [Google Scholar] [CrossRef]
  14. Qiu, J.; Turner, M.G. Spatial Interactions among Ecosystem Services in an Urbanizing Agricultural Watershed. Proc. Natl. Acad. Sci. USA 2013, 110, 12149–12154. [Google Scholar] [CrossRef]
  15. Luo, K.; Wang, H.; Yan, X.; Ma, C.; Zheng, X.; Wu, J.; Wu, C. Study on Trade-Offs and Synergies of Rural Ecosystem Services in the Tacheng-Emin Basin, Xinjiang, China: Implications for Zoning Management of Rural Ecological Functions. J. Environ. Manag. 2024, 363, 121411. [Google Scholar] [CrossRef] [PubMed]
  16. Yang, M.; Gao, X.; Siddique, K.H.M.; Wu, P.; Zhao, X. Spatiotemporal Exploration of Ecosystem Service, Urbanization, and Their Interactive Coercing Relationship in the Yellow River Basin over the Past 40 Years. Sci. Total Environ. 2023, 858, 159757. [Google Scholar] [CrossRef]
  17. Xue, C.; Xue, L.; Chen, J.; Tarolli, P.; Chen, X.; Zhang, H.; Qian, J.; Zhou, Y.; Liu, X. Understanding Driving Mechanisms behind the Supply-Demand Pattern of Ecosystem Services for Land-Use Administration: Insights from a Spatially Explicit Analysis. J. Clean. Prod. 2023, 427, 139239. [Google Scholar] [CrossRef]
  18. Wang, M.; Wang, X.; Shi, W. Exploring the Response of Trade-Offs and Synergies among Ecosystem Services to Future Land Use Changes in the Hilly Red Soil Region of Southern China. J. Environ. Manag. 2024, 372, 123283. [Google Scholar] [CrossRef]
  19. Xue, C.; Chen, X.; Xue, L.; Zhang, H.; Chen, J.; Li, D. Modeling the Spatially Heterogeneous Relationships between Tradeoffs and Synergies among Ecosystem Services and Potential Drivers Considering Geographic Scale in Bairin Left Banner, China. Sci. Total Environ. 2023, 855, 158834. [Google Scholar] [CrossRef]
  20. Raudsepp-Hearne, C.; Peterson, G.D.; Bennett, E.M. Ecosystem Service Bundles for Analyzing Tradeoffs in Diverse Landscapes. Proc. Natl. Acad. Sci. USA 2010, 107, 5242–5247. [Google Scholar] [CrossRef]
  21. Liu, Y.; Zhang, C.; Zeng, H. Constraint Effects among Several Key Ecosystem Service Types and Their Influencing Factors: A Case Study of the Pearl River Delta, China. Ecol. Indic. 2023, 146, 109883. [Google Scholar] [CrossRef]
  22. Yu, H.; Jiang, J.; Gu, X.; Cao, C.; Shen, C. Using Dynamic Bayesian Belief Networks to Infer the Effects of Climate Change and Human Activities on Changes in Regional Ecosystem Services. Ecol. Indic. 2025, 170, 113023. [Google Scholar] [CrossRef]
  23. Li, J.; Xie, B.; Gao, C.; Zhou, K.; Liu, C.; Zhao, W.; Xiao, J.; Xie, J. Impacts of Natural and Human Factors on Water-Related Ecosystem Services in the Dongting Lake Basin. J. Clean. Prod. 2022, 370, 133400. [Google Scholar] [CrossRef]
  24. Liu, J.; Pei, X.; Liao, B.; Zhang, H.; Liu, W.; Jiao, J. Scale Effects and Spatial Heterogeneity of Driving Factors in Ecosystem Services Value Interactions within the Tibet Autonomous Region. J. Environ. Manag. 2024, 351, 119871. [Google Scholar] [CrossRef]
  25. Song, Y.; Wang, J.; Ge, Y.; Xu, C. An Optimal Parameters-Based Geographical Detector Model Enhances Geographic Characteristics of Explanatory Variables for Spatial Heterogeneity Analysis: Cases with Different Types of Spatial Data. GISci. Remote Sens. 2020, 57, 593–610. [Google Scholar] [CrossRef]
  26. Lester, S.E.; Costello, C.; Halpern, B.S.; Gaines, S.D.; White, C.; Barth, J.A. Evaluating Tradeoffs among Ecosystem Services to Inform Marine Spatial Planning. Mar. Policy 2013, 38, 80–89. [Google Scholar] [CrossRef]
  27. Yang, M.; Chen, Y.; Yang, Y.; Yan, Y. Nonlinear Relationship and Threshold-Based Zones between Ecosystem Service Supply-Demand Ratio and Land Use Intensity: A Case Study of the Beijing-Tianjin-Hebei Region, China. J. Clean. Prod. 2024, 481, 144148. [Google Scholar] [CrossRef]
  28. Zhang, X.; Shao, Q.; Wang, B.; Niu, X.; Ning, J.; Chen, M.; Zhang, T.; Liu, G.; Liu, S.; Niu, L.; et al. Spatiotemporal Analysis of Ecosystem Status in China’s National Key Ecological Function Zones. Remote Sens. 2023, 15, 4641. [Google Scholar] [CrossRef]
  29. Zhang, M.; Zhang, L.; He, H.; Ren, X.; Lv, Y.; Niu, Z.; Chang, Q.; Xu, Q.; Liu, W. Improvement of Ecosystem Quality in National Key Ecological Function Zones in China during 2000–2015. J. Environ. Manag. 2022, 324, 116406. [Google Scholar] [CrossRef] [PubMed]
  30. Tilman, D.; Knops, J.; Wedin, D.; Reich, P.; Ritchie, M.; Siemann, E. The Influence of Functional Diversity and Composition on Ecosystem Processes. Science 1997, 277, 1300–1302. [Google Scholar] [CrossRef]
  31. Zheng, Y.; Shen, R.; Wang, Y.; Li, X.; Liu, S.; Liang, S.; Chen, J.; Ju, W.; Zhang, L.; Yuan, W. Improved Estimate of Global Gross Primary Production for Reproducing Its Long-Term Variation, 1982–2017. Earth Syst. Sci. Data 2020, 12, 2725–2746. [Google Scholar] [CrossRef]
  32. Terrado, M.; Sabater, S.; Chaplin-Kramer, B.; Mandle, L.; Ziv, G.; Acuña, V. Model Development for the Assessment of Terrestrial and Aquatic Habitat Quality in Conservation Planning. Sci. Total Environ. 2016, 540, 63–70. [Google Scholar] [CrossRef] [PubMed]
  33. Zhang, L.; Xiao, Y.; Zheng, H.; Xu, W.; Lu, F.; Jiang, L.; Rao, E.; Xiao, Y.; Wu, B.; Zeng, Y.; et al. A spatial dataset of ecosystem services in China (2010). Sci. Data Bank 2017, 3, 11–23. [Google Scholar] [CrossRef]
  34. Li, J.; He, H.; Zeng, Q.; Chen, L.; Sun, R. A Chinese Soil Conservation Dataset Preventing Soil Water Erosion from 1992 to 2019. Sci. Data 2023, 10, 319. [Google Scholar] [CrossRef] [PubMed]
  35. Gong, S.; Xiao, Y.; Zheng, H.; Xiao, Y.; Ouyang, Z. Spatial patterns of ecosystem water conservation in China and its impact factors analysis. Acta Ecol. Sin. 2017, 37, 2455–2462. (In Chinese) [Google Scholar] [CrossRef]
  36. Huang, B.; Lu, F.; Wang, X.; Wu, X.; Zheng, H.; Su, Y.; Yuan, Y.; Ouyang, Z. The Impact of Ecological Restoration on Ecosystem Services Change Modulated by Drought and Rising CO2. Glob. Change Biol. 2023, 29, 5304–5320. [Google Scholar] [CrossRef]
  37. Yin, L.; Wang, X.; Wang, Y. 1-km Resolution Dataset of Water Yield in the National Ecological Barrier Zone (2000–2015). J. Glob. Change Data Discov. 2020, 4, 332–337. (In Chinese) [Google Scholar] [CrossRef]
  38. Zhang, H.; Fan, J.; Cao, W.; Harris, W.; Li, Y.; Chi, W.; Wang, S. Response of Wind Erosion Dynamics to Climate Change and Human Activity in Inner Mongolia, China during 1990 to 2015. Sci. Total Environ. 2018, 639, 1038–1050. [Google Scholar] [CrossRef]
  39. Zhang, C.; Fan, N.; Liu, C.; Xie, G. Spatio-temporal pattern and evolution of ecosystem water conservation in China from 1990 to 2018. Acta Ecol. Sin. 2023, 43, 5536–5545. (In Chinese) [Google Scholar] [CrossRef]
  40. Zhao, Y.; Chi, W.; Kuang, W.; Bao, Y.; Ding, G. Ecological and Environmental Consequences of Ecological Projects in the Beijing–Tianjin Sand Source Region. Ecol. Indic. 2020, 112, 106111. [Google Scholar] [CrossRef]
  41. Meng, X.; Gao, X.; Li, S.; Lei, J. Spatial and temporal characteristics of vegetation NDVI changes and the driving forces in Mongolia during 1982–2015. Remote Sens. 2020, 12, 603. [Google Scholar] [CrossRef]
  42. Spake, R.; Lasseur, R.; Crouzat, E.; Bullock, J.M.; Lavorel, S.; Parks, K.E.; Schaafsma, M.; Bennett, E.M.; Maes, J.; Mulligan, M.; et al. Unpacking Ecosystem Service Bundles: Towards Predictive Mapping of Synergies and Trade-Offs between Ecosystem Services. Glob. Environ. Change-Hum. Policy Dimens. 2017, 47, 37–50. [Google Scholar] [CrossRef]
  43. Qiao, J.; Deng, L.; Liu, H.; Wang, Z. Spatiotemporal Heterogeneity in Ecosystem Service Trade-Offs and Their Drivers in the Huang-Huai-Hai Plain, China. Landsc. Ecol. 2024, 39, 42. [Google Scholar] [CrossRef]
  44. Liu, L.; Wu, J. Ecosystem Services-Human Wellbeing Relationships Vary with Spatial Scales and Indicators: The Case of China. Resour. Conserv. Recycl. 2021, 172, 105662. [Google Scholar] [CrossRef]
  45. Qiao, J.; Yu, D.; Cao, Q.; Hao, R. Identifying the Relationships and Drivers of Agro-Ecosystem Services Using a Constraint Line Approach in the Agro-Pastoral Transitional Zone of China. Ecol. Indic. 2019, 106, 105439. [Google Scholar] [CrossRef]
  46. Ouyang, Z.; Zheng, H.; Xiao, Y.; Polasky, S.; Liu, J.; Xu, W.; Wang, Q.; Zhang, L.; Xiao, Y.; Rao, E.; et al. Improvements in Ecosystem Services from Investments in Natural Capital. Science 2016, 352, 1455–1459. [Google Scholar] [CrossRef]
  47. Chen, X.; Yu, L.; Du, Z.; Xu, Y.; Zhao, J.; Zhao, H.; Zhang, G.; Peng, D.; Gong, P. Distribution of Ecological Restoration Projects Associated with Land Use and Land Cover Change in China and Their Ecological Impacts. Sci. Total Environ. 2022, 825, 153938. [Google Scholar] [CrossRef]
  48. Chen, C.; Park, T.; Wang, X.; Piao, S.; Xu, B.; Chaturvedi, R.K.; Fuchs, R.; Brovkin, V.; Ciais, P.; Fensholt, R.; et al. China and India Lead in Greening of the World through Land-Use Management. Nat. Sustain. 2019, 2, 122–129. [Google Scholar] [CrossRef]
  49. Cheng, K.; Yang, H.; Tao, S.; Su, Y.; Guan, H.; Ren, Y.; Hu, T.; Li, W.; Xu, G.; Chen, M.; et al. Carbon Storage through China’s Planted Forest Expansion. Nat. Commun. 2024, 15, 4106. [Google Scholar] [CrossRef] [PubMed]
  50. Xu, Y.; Lu, Y.; Zou, B.; Xu, M.; Feng, Y. Unraveling the Enigma of NPP Variation in Chinese Vegetation Ecosystems: The Interplay of Climate Change and Land Use Change. Sci. Total Environ. 2024, 912, 169023. [Google Scholar] [CrossRef]
  51. Zhang, Y.; Li, C.; Chiew, F.H.S.; Post, D.A.; Zhang, X.; Ma, N.; Tian, J.; Kong, D.; Leung, L.R.; Yu, Q.; et al. Southern Hemisphere Dominates Recent Decline in Global Water Availability. Science 2023, 382, 579–584. [Google Scholar] [CrossRef]
  52. Wang, Z.; Tang, Q.; Wang, D.; Xiao, P.; Xia, R.; Sun, P.; Feng, F. Attributing Trend in Naturalized Streamflow to Temporally Explicit Vegetation Change and Climate Variation in the Yellow River Basin of China. Hydrol. Earth Syst. Sci. 2022, 26, 5291–5314. [Google Scholar] [CrossRef]
  53. Chen, G.; Zuo, D.; Xu, Z.; Wang, G.; Han, Y.; Peng, D.; Pang, B.; Abbaspour, K.C.; Yang, H. Changes in Water Conservation and Possible Causes in the Yellow River Basin of China during the Recent Four Decades. J. Hydrol. 2024, 637, 131314. [Google Scholar] [CrossRef]
  54. Zheng, J.; Li, B.; Chen, Y.; Chen, Z.; Lian, L. Spatiotemporal Variation of Upper-Air and Surface Wind Speed and Its Influencing Factors in Northwestern China during 1980–2012. Theor. Appl. Climatol. 2018, 133, 1303–1314. [Google Scholar] [CrossRef]
  55. Ding, Y.; Li, X.; Li, Q. Advances of surface wind speed changes over China under global warming. J. Appl. Meteorol. Sci. 2020, 31, 1–12. (In Chinese) [Google Scholar] [CrossRef]
  56. Grêt-Regamey, A.; Sirén, E.; Brunner, S.H.; Weibel, B. Review of Decision Support Tools to Operationalize the Ecosystem Services Concept. Ecosyst. Serv. 2017, 26, 306–315. [Google Scholar] [CrossRef]
  57. Hamel, P.; Bryant, B.P. Uncertainty Assessment in Ecosystem Services Analyses: Seven Challenges and Practical Responses. Ecosyst. Serv. 2017, 24, 1–15. [Google Scholar] [CrossRef]
  58. Xu, H.; Zhao, C.; Chen, S.; Shan, S.; Qi, X.; Chen, T.; Wang, X. Spatial Relationships among Regulating Ecosystem Services in Mountainous Regions: Nonlinear and Elevation-Dependent. J. Clean. Prod. 2022, 380, 135050. [Google Scholar] [CrossRef]
  59. Zhang, T.; Zhang, S.; Cao, Q.; Wang, H.; Li, Y. The Spatiotemporal Dynamics of Ecosystem Services Bundles and the Social-Economic-Ecological Drivers in the Yellow River Delta Region. Ecol. Indic. 2022, 135, 108573. [Google Scholar] [CrossRef]
  60. Xiao, L.; Li, G.; Zhao, R.; Zhang, L. Effects of Soil Conservation Measures on Wind Erosion Control in China: A Synthesis. Sci. Total Environ. 2021, 778, 146308. [Google Scholar] [CrossRef]
  61. Xue, C.; Zhang, H.; Wu, S.; Chen, J.; Chen, X. Spatial-Temporal Evolution of Ecosystem Services and Its Potential Drivers: A Geospatial Perspective from Bairin Left Banner, China. Ecol. Indic. 2022, 137, 108760. [Google Scholar] [CrossRef]
  62. Lü, Y.; Wang, Y.; Yin, L.; Lü, D.; Wang, X. Climate and Scale Are Critical for Illustrating the Links between Carbon and Water Services across Qinghai-Tibet Plateau. Catena 2023, 231, 107379. [Google Scholar] [CrossRef]
  63. Hao, R.F.; Yu, D.Y.; Wu, J.G.; Guo, Q.F.; Liu, Y.P. Constraint line methods and the applications in ecology. Chin. J. Plant Ecol. 2016, 40, 1100–1109. (In Chinese) [Google Scholar] [CrossRef]
  64. Chen, Y.; Wang, K.; Fu, B.; Wang, Y.; Tian, H.; Wang, Y.; Zhang, Y. 65% Cover Is the Sustainable Vegetation Threshold on the Loess Plateau. Environ. Sci. Ecotechnol. 2024, 22, 100442. [Google Scholar] [CrossRef]
  65. Yu, F.; Li, C.; Yuan, Z.; Luo, Y.; Yin, Q.; Wang, Q.; Hao, Z. How Do Mountain Ecosystem Services Respond to Changes in Vegetation and Climate? An Evidence from the Qinling Mountains, China. Ecol. Indic. 2023, 154, 110922. [Google Scholar] [CrossRef]
  66. Wang, Y.; Wang, H.; Zhang, J.; Liu, G.; Fang, Z.; Wang, D. Exploring Interactions in Water-Related Ecosystem Services Nexus in Loess Plateau. J. Environ. Manag. 2023, 336, 117550. [Google Scholar] [CrossRef]
  67. He, L.; Xie, Z.; Wu, H.; Liu, Z.; Zheng, B.; Wan, W. Exploring the Interrelations and Driving Factors among Typical Ecosystem Services in the Yangtze River Economic Belt, China. J. Environ. Manag. 2024, 351, 119794. [Google Scholar] [CrossRef]
  68. Ding, X.; Jian, S. Synergies and Trade-Offs of Ecosystem Services Affected by Land Use Structures of Small Watershed in the Loess Plateau. J. Environ. Manag. 2024, 350, 119589. [Google Scholar] [CrossRef]
  69. Li, X.; Li, X.; Li, X.; Dong, Z.; Chen, X.; Guo, J.; Liu, H. Spatiotemporal Heterogeneity of Ecosystem Service Interactions and Their Determining Thresholds across Distinct Climate Zones in the Temperate Desert Steppe of Northern China. Ecol. Indic. 2025, 170, 113099. [Google Scholar] [CrossRef]
  70. Medinski, T.V.; Mills, A.J.; Esler, K.J.; Schmiedel, U.; Jürgens, N. Do Soil Properties Constrain Species Richness? Insights from Boundary Line Analysis across Several Biomes in South Western Africa. J. Arid Environ. 2010, 74, 1052–1060. [Google Scholar] [CrossRef]
  71. Ran, P.; Hu, S.; Frazier, A.E.; Yang, S.; Song, X.; Qu, S. The Dynamic Relationships between Landscape Structure and Ecosystem Services: An Empirical Analysis from the Wuhan Metropolitan Area, China. J. Environ. Manag. 2023, 325, 116575. [Google Scholar] [CrossRef]
  72. Wang, L.; Zheng, H.; Wen, Z.; Liu, L.; Robinson, B.E.; Li, R.; Li, C.; Kong, L. Ecosystem Service Synergies/Trade-Offs Informing the Supply-Demand Match of Ecosystem Services: Framework and Application. Ecosyst. Serv. 2019, 37, 100939. [Google Scholar] [CrossRef]
  73. Mitchell, M.G.E.; Suarez-Castro, A.F.; Martinez-Harms, M.; Maron, M.; McAlpine, C.; Gaston, K.J.; Johansen, K.; Rhodes, J.R. Reframing Landscape Fragmentation’s Effects on Ecosystem Services. Trends Ecol. Evol. 2015, 30, 190–198. [Google Scholar] [CrossRef] [PubMed]
  74. Duarte, G.T.; Santos, P.M.; Cornelissen, T.G.; Ribeiro, M.C.; Paglia, A.P. The Effects of Landscape Patterns on Ecosystem Services: Meta-Analyses of Landscape Services. Landsc. Ecol. 2018, 33, 1247–1257. [Google Scholar] [CrossRef]
  75. Huang, J.; Xia, Z.; Liu, L. Impacts of Landscape Configurations on Ecosystem Services and Their Trade-Offs across Different Landscape Compositions. Ecosyst. Serv. 2024, 70, 101666. [Google Scholar] [CrossRef]
  76. Assis, J.C.; Hohlenwerger, C.; Metzger, J.P.; Rhodes, J.R.; Duarte, G.T.; Da Silva, R.A.; Boesing, A.L.; Prist, P.R.; Ribeiro, M.C. Linking Landscape Structure and Ecosystem Service Flow. Ecosyst. Serv. 2023, 62, 101535. [Google Scholar] [CrossRef]
  77. Chen, S.; Liu, X.; Yang, L.; Zhu, Z. Variations in Ecosystem Service Value and Its Driving Factors in the Nanjing Metropolitan Area of China. Forests 2023, 14, 113. [Google Scholar] [CrossRef]
  78. Li, L.; Zhang, Y.; Wu, J.; Li, S.; Zhang, B.; Zu, J.; Zhang, H.; Ding, M.; Paudel, B. Increasing Sensitivity of Alpine Grasslands to Climate Variability along an Elevational Gradient on the Qinghai-Tibet Plateau. Sci. Total Environ. 2019, 678, 21–29. [Google Scholar] [CrossRef]
  79. Jia, Z.; Wang, X.; Feng, X.; Ma, J.; Wang, X.; Zhang, X.; Zhou, J.; Sun, Z.; Yao, W.; Tu, Y. Exploring the Spatial Heterogeneity of Ecosystem Services and Influencing Factors on the Qinghai Tibet Plateau. Ecol. Indic. 2023, 154, 110521. [Google Scholar] [CrossRef]
  80. Sun, S.; Lue, Y.; Fu, B. Relations between Physical and Ecosystem Service Flows of Freshwater Are Critical for Water Resource Security in Large Dryland River Basin. Sci. Total Environ. 2023, 857, 159549. [Google Scholar] [CrossRef]
  81. Bai, Y.; Wong, C.P.; Jiang, B.; Hughes, A.C.; Wang, M.; Wang, Q. Developing China’s Ecological Redline Policy Using Ecosystem Services Assessments for Land Use Planning. Nat. Commun. 2018, 9, 3034. [Google Scholar] [CrossRef]
  82. Fang, L.; Wang, L.; Chen, W.; Sun, J.; Cao, Q.; Wang, S.; Wang, L. Identifying the Impacts of Natural and Human Factors on Ecosystem Service in the Yangtze and Yellow River Basins. J. Clean. Prod. 2021, 314, 127995. [Google Scholar] [CrossRef]
  83. Gao, S.; Zhang, C.; Zou, X. Benefits of Beijing-Tianjin Sand Source Control Engineering; Science Press: Beijing, China, 2008. (In Chinese) [Google Scholar]
  84. Hu, Y.; Zhang, Y. Using ~(137)Cs and ~(210)Pb_(ex) to Investigate the Soil Erosion and Accumulation Moduli on the Southern Margin of the Hunshandake Sandy Land in Inner Mongolia. Acta Geogr. Sin. 2019, 74, 1890–1903. [Google Scholar] [CrossRef]
  85. Jia, W.; Li, Q.; Li, X.; Xie, B.; Wang, C. The Spatial and Temporal Variation of Soil Wind Erosion Modulus in the Baishan Region of Hebei Province from 2000 to 2018. J. Desert Res. 2024, 44, 130–141. (In Chinese) [Google Scholar]
  86. Li, Q.; Zhou, N.; Wang, S.; Li, T.; Wang, R.; Wang, J. Quantitative Assessment the Impacts of Climate Change and Human Actives on Wind Erosion: A Case Study of Inner Mongolia Autonomous Region. J. Desert Res. 2024, 44, 178–188. (In Chinese) [Google Scholar]
  87. Liu, J.; Qi, Y.; Shi, H.; Zhuang, D.; Hu, Y. 137Cs Tracing Analysis of Soil Wind Erosion Rate in the Taryat-Xilin Gol Transect of the Mongolian Plateau. Chin. Sci. Bull. 2007, 52, 2785–2791. (In Chinese) [Google Scholar]
  88. Williams, J. The Erosion-Productivity Impact Calculator (EPIC) Model—A Case History. Philos. Trans. R. Soc. B Biol. Sci. 1990, 329, 421–428. [Google Scholar] [CrossRef]
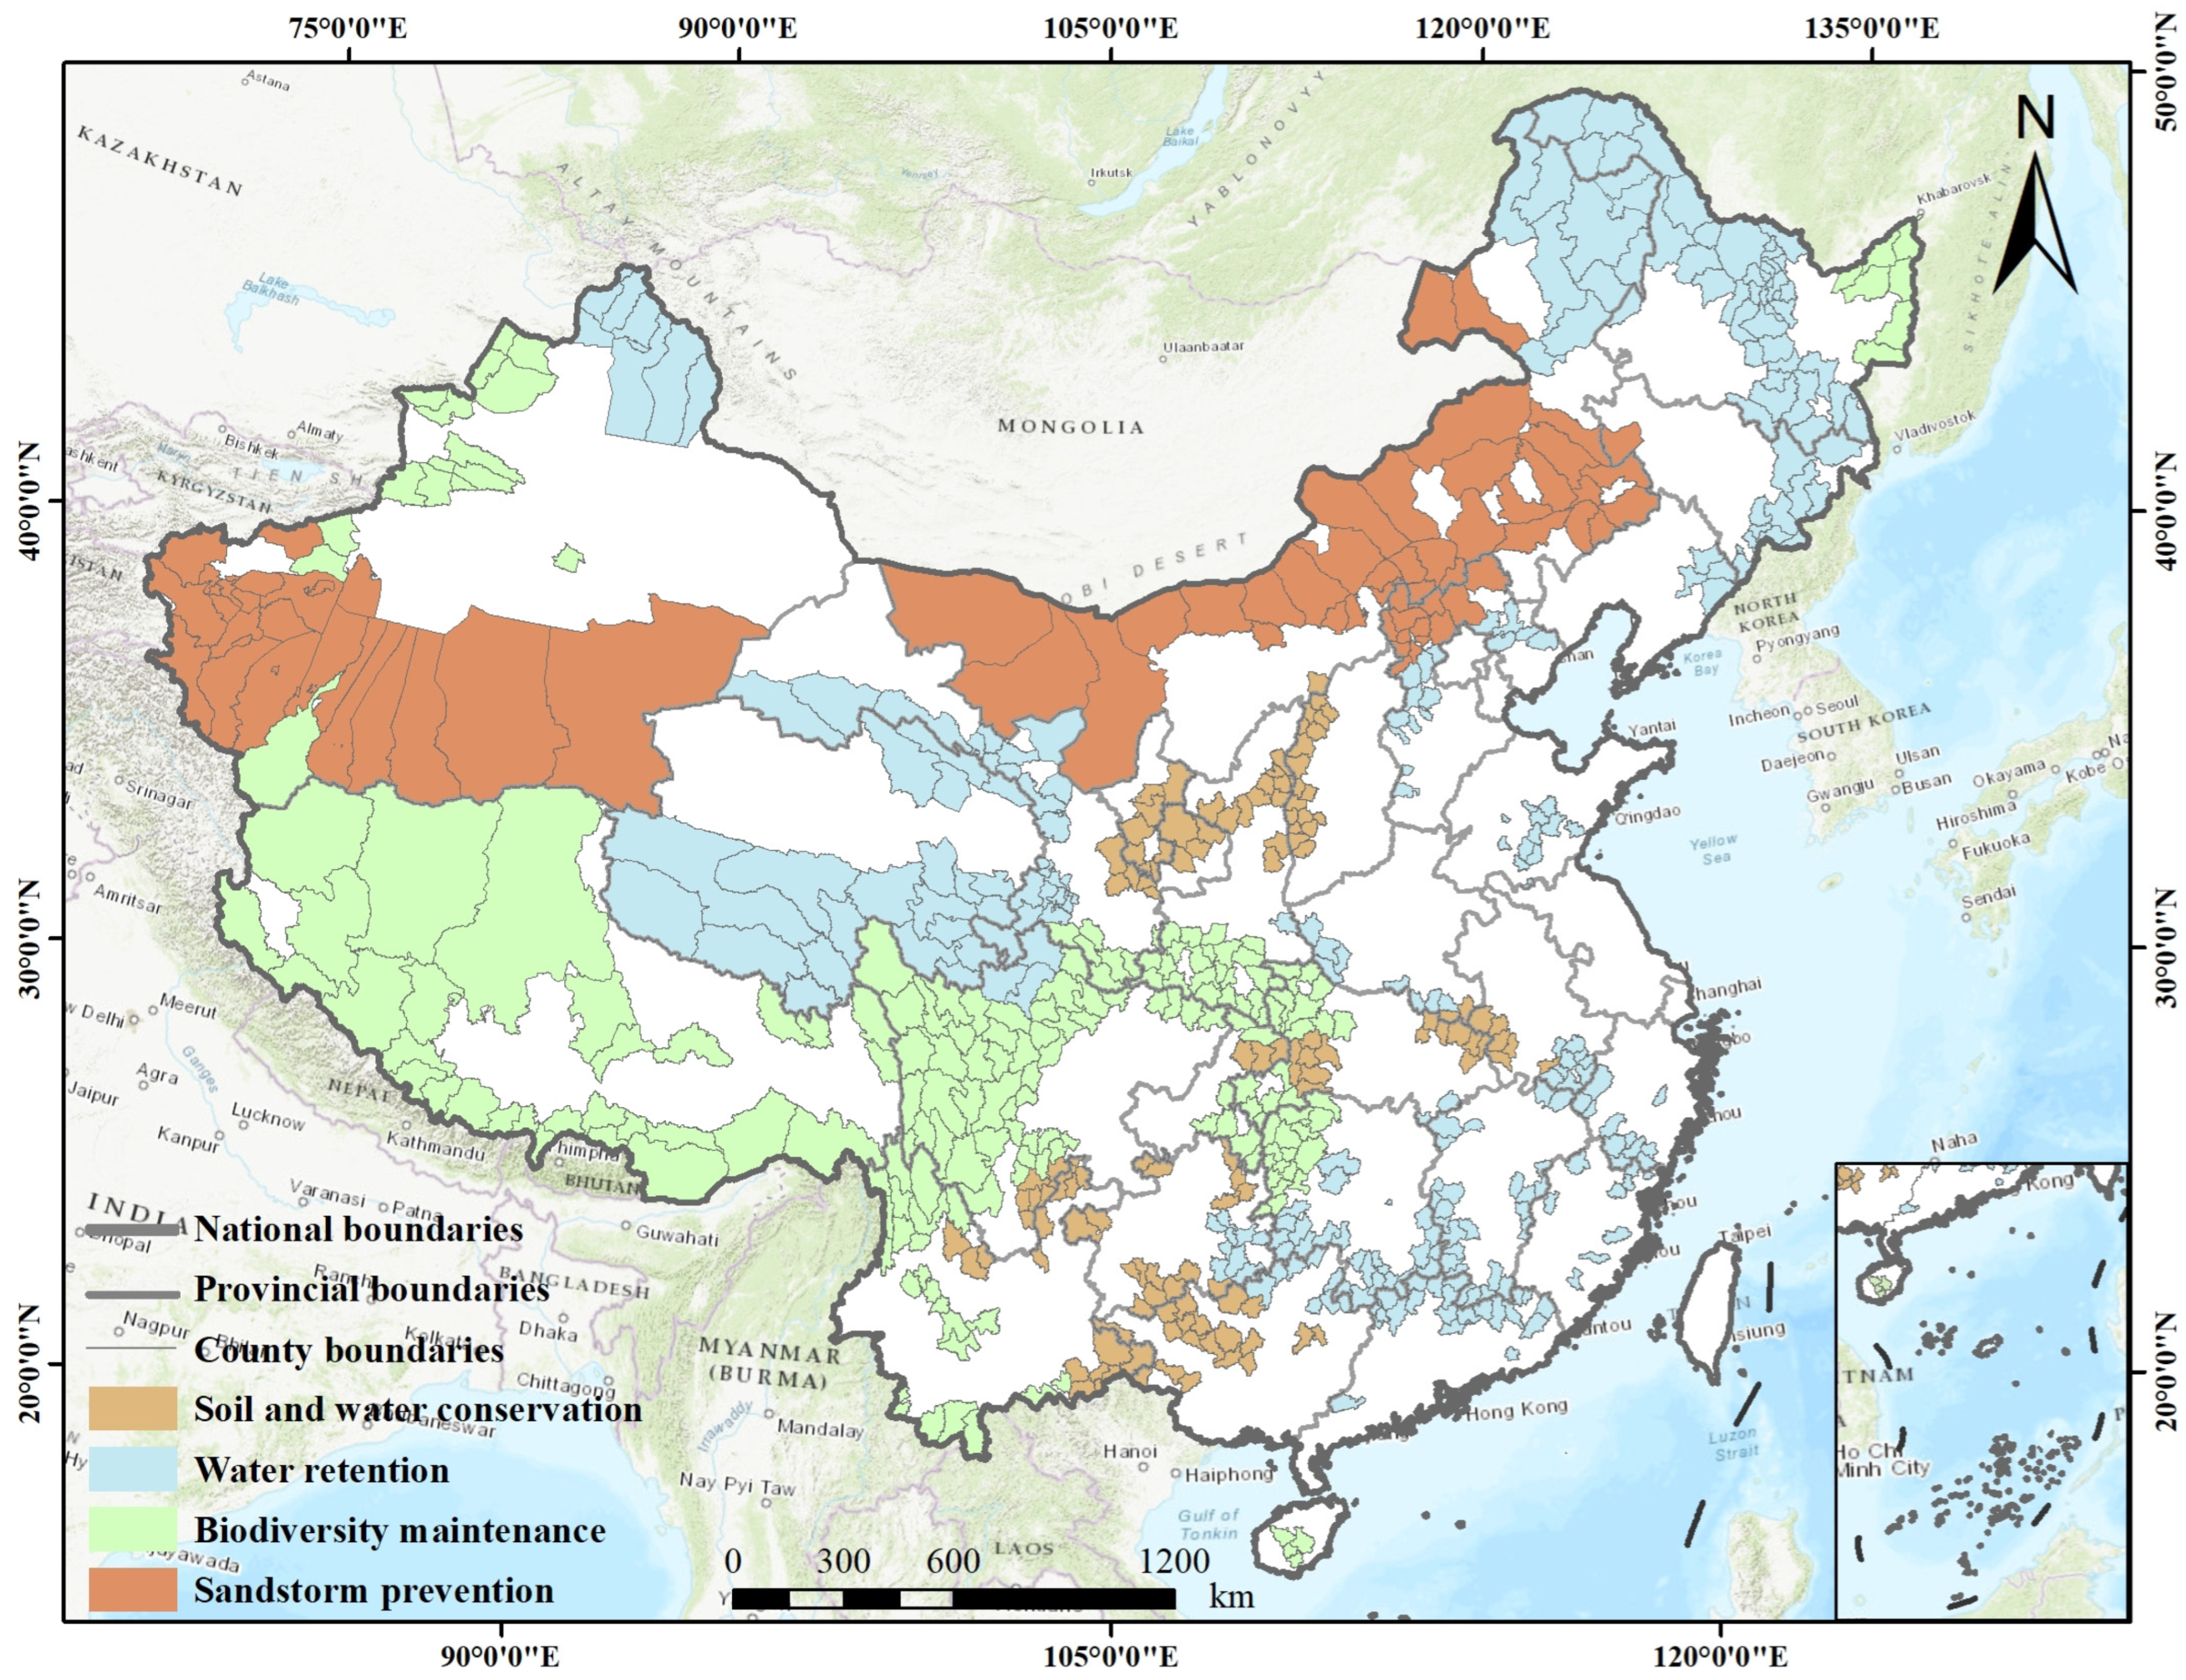
Figure 1. Spatial distribution of National Key Ecological Function Zones of China.
Remotesensing 17 01559 g001
Figure 2. Spatial distribution and trends over time of ecosystem services in National Key Ecological Function Zones of China.
Remotesensing 17 01559 g002
Figure 3. Spatial distribution of ecosystem services interactions in 2000, 2020, and differences between 2000 and 2020. (BM: biodiversity maintenance; SC: soil conservation; SP: sandstorm prevention; WR: water retention).
Remotesensing 17 01559 g003
Figure 4. Constraint effect of driving factors on (a) NPP-BM and (b) NPP-SC interactions. Black lines represent simple regression lines, while blue and red lines correspond to the 5% and 95% quantile regression lines, respectively.
Remotesensing 17 01559 g004
Figure 5. Constraint effect of driving factors on (a) NPP-SP and (b) BM-SC interactions. Black lines represent simple regression lines, while blue and red lines correspond to the 5% and 95% quantile regression lines, respectively.
Remotesensing 17 01559 g005
Figure 6. Constraint effect of driving factors on (a) BM-SP and (b) SP-SC interactions. Black lines represent simple regression lines, while blue and red lines correspond to the 5% and 95% quantile regression lines, respectively.
Remotesensing 17 01559 g006
Figure 7. Constraint effect of driving factors on (a) SP-WR and (b) WR-NPP interactions. Black lines represent simple regression lines, while blue and red lines correspond to the 5% and 95% quantile regression lines, respectively.
Remotesensing 17 01559 g007
Figure 8. Constraint effect of driving factors on (a) WR-SC and (b) WR-BM interactions. Black lines represent simple regression lines, while blue and red lines correspond to the 5% and 95% quantile regression lines, respectively.
Remotesensing 17 01559 g008
Figure 9. Interaction detection results for driving factors of ecosystem services interactions.
Remotesensing 17 01559 g009aRemotesensing 17 01559 g009b
Table 1. Basis for judging trends of ecosystem services.
NumberSen-Trends ClassificationJudgement
1Significant increaseβ > 0, Z > 2.58
2Relatively significant increaseβ > 0, 1.96 < Z ≤ 2.58
3Non-significant change|Z| ≤ 1.96
4Relatively significant decreaseβ < 0, −2.58 ≤ Z < −1.96
5Significant decreaseβ < 0, Z < −2.58
Table 2. Overview of social–economic–ecological drivers.
CodeDescriptionUnit
L1Proportion of bare lands/
L2Proportion of croplands/
L3Proportion of forest lands/
L4Proportion of grasslands/
L5Patch density/
L6Contagion/
L7Shannon’s diversity index/
L8Aggregation index/
T1DEMm
T2Slope%
V1NDVI/
S1GDPUSD
S2Population density%
C1Annual potential evapotranspirationmm
C2Annual precipitationmm
C3Annual average temperature°C
Table 3. Statistical table listing trends of ecosystem services.
TypeNPP Area Ratio (%)Biodiversity Maintenance Area Ratio (%)Soil Conservation Area Ratio (%)Water Retention Area Ratio (%)Sandstorm Prevention Area Ratio (%)
Significant increase32.83.67.42.725.0
Relatively significant increase11.80.15.29.911.1
Non-significant change54.794.484.284.060.6
Relatively significant decrease0.40.12.42.51.8
Significant decrease0.31.80.80.91.5
Disclaimer/Publisher’s Note: The statements, opinions and data contained in all publications are solely those of the individual author(s) and contributor(s) and not of MDPI and/or the editor(s). MDPI and/or the editor(s) disclaim responsibility for any injury to people or property resulting from any ideas, methods, instructions or products referred to in the content.