Article

Unraveling Aerosol and Low-Level Cloud Interactions Under Multi-Factor Constraints at the Semi-Arid Climate and Environment Observatory of Lanzhou University

by
Qinghao Li
,
Jinming Ge
*,
Yize Li
,
Qingyu Mu
,
Nan Peng
,
Jing Su
,
Bo Wang
,
Chi Zhang
and
Bochun Liu
Key Laboratory for Semi-Arid Climate Change of the Ministry of Education, College of Atmospheric Sciences, Lanzhou University, Lanzhou 730000, China
*
Author to whom correspondence should be addressed.
Remote Sens. 2025, 17(9), 1533; https://doi.org/10.3390/rs17091533
Submission received: 4 March 2025 / Revised: 11 April 2025 / Accepted: 21 April 2025 / Published: 25 April 2025

Abstract

:
The response of low-level cloud properties to aerosol loading remains ambiguous, particularly due to the confounding influence of meteorological factors and water vapor availability. We utilize long-term data from Ka-band Zenith Radar, Clouds and the Earth’s Radiant Energy System, Modern-Era Retrospective analysis for Research and Applications Version 2, and European Centre for Medium-Range Weather Forecasts Reanalysis v5 to evaluate aerosol’s effects on low-level clouds under the constrains of meteorological conditions and liquid water path (LWP) over the Semi-Arid Climate and Environment Observatory of Lanzhou University during 2014–2019. To better constrain meteorological variability, we apply Principal Component Analysis to derive the first principal component (PC1), which strongly correlates with cloud properties, thereby enabling more accurate assessment of aerosol–cloud interaction (ACI) under constrained meteorological conditions delineated by PC1. Analysis suggests that under favorable meteorological conditions for low-level cloud formation (low PC1) and moderate LWP levels (25–150 g/m2), ACI is characterized by a significantly negative ACI index, with the cloud effective radius (CER) increasing in response to rising aerosol concentrations. When constrained by both PC1 and LWP, the relationship between CER and the aerosol optical depth shows a distinct bifurcation into positive and negative correlations. Different aerosol types show contrasting effects: dust aerosols increase CER under favorable meteorological conditions, whereas sulfate, organic carbon, and black carbon aerosols consistently decrease it, even under high-LWP conditions.

1. Introduction

Clouds, covering about 70% of the planet’s surface, play a crucial role in regulating the Earth’s climate system energy balance by reflecting incoming solar radiation and trapping outgoing thermal radiation [1,2]. They are also integral to the hydrological cycle, contributing to precipitation that replenishes freshwater resources and supports ecosystems [3,4]. Low-level clouds, which constitute up to 41% of the total cloud fraction, have a significant impact on the Earth’s energy balance and the global water cycle due to their unique properties [5,6,7,8]. These clouds are characterized by their high albedo, which cools the Earth’s surface by reflecting a substantial portion of incoming sunlight [9,10]. The physical characteristics of low-level clouds, such as droplet size and number, exert a significant influence on the climate system. Even minor changes in these properties can significantly alter their radiative effect and impact regional and global climate patterns. Therefore, the presence and behavior of low-level clouds are key factors in shaping climate patterns, highlighting their importance for accurate climate modeling [11].
Aerosol–cloud interaction (ACI) further complicates the accurate representation of low-level clouds in climate models. An increase in the hygroscopic aerosol concentration, including sulfate and organic aerosols, leads to the formation of smaller but more numerous cloud droplets. This change increases the cloud fraction and cloud albedo for a constant cloud liquid water path (LWP), enhancing the reflection of sunlight known as the “Twomey effect” [12]. Additionally, the reduction in cloud droplet size can decrease the efficiency of droplet collision and coalescence, delaying precipitation and extending cloud lifetime [13,14]. This process, known as the “Albrecht effect”, represents a rapid adjustment in ACI [15]. The ACI has been extensively investigated through various observational datasets, including ground-based measurements [16,17,18], satellite observations [19,20,21,22], and airborne in situ detections [23,24,25]. However, despite this wealth of observational evidence, accurately quantifying ACI remains challenging due to the confounding influence of various meteorological factors and water vapor supply conditions. Changes in aerosol concentrations frequently coincide with variations in cloud dynamics and other environmental factors [26], making it difficult to isolate purely aerosol-driven effects from meteorological influences. Understanding and effectively constraining meteorological conditions and moisture levels are crucial for obtaining reliable ACI assessments, which form the central focus of our investigation.
The cloud droplet effective radius (CER) is essential in various cloud physical and dynamical procedures. It can significantly affect cloud lifetime, precipitation efficiency, and radiative effect through condensation and coalescence processes. Thus, a critical aspect of ACI is the relationship between CER and aerosol concentration. However, the aerosol concentration and composition influence their ability to act as cloud condensation nuclei (CCN) [27,28,29]. Variations in these aerosol features associated with meteorological conditions can lead to both positive and negative correlations between CER and aerosol loading across different regions [30]. For example, opposite correlations between AOD and CER exist over the marine region under various aerosol loading [31]. Zhang et al. [32] observed different magnitudes of ACI for four different aerosol types (i.e., black carbon, organic carbon, sulfate, and dust) over the Eastern China Sea. Some aircraft and ground-based measurements have shown that increased aerosol loading can result in higher cloud droplet number concentration and lower CER, indicating a negative correlation between AOD and CER [22,33,34]. Meanwhile, others have reported positive correlations in some land regions with high anthropogenic aerosol concentrations, such as the Southeastern United States and Eastern China [31,35,36].
These complex ACIs are further compounded by meteorological factors, such as relative humidity (RH), wind shear, and stability. For instance, aerosol impacts on cloud microphysical properties and precipitation are negligible in dry air (RH: 40%) but become more pronounced in humid air (RH: 60–70%) [37]. Increased aerosol can enhance deep convective clouds in environments with weak wind shear and high RH while suppressing them under strong wind shear in dry conditions [38]. Engström and Ekman [39] found that wind speed can significantly affect the correlation between aerosol optical depth and cloud fraction. Mauger and Norris [40] emphasize that accounting for variations in lower tropospheric stability (LTS) is crucial for accurately assessing aerosol effects on cloud forcing, as controlling LTS can reduce the dependence of the cloud fraction on AOD by at least 24%. Kim et al. [41] also demonstrated that stability is a key factor that governs the amplification or reduction of ACI.
Cloud formation results from the coordinated interplay of multiple meteorological factors and aerosols. It is essential to consider multiple factors together when accurately assessing ACIs and their impacts on climate. The former mentioned regional differences underscore the need for detailed and region-specific studies to fully comprehend the effects of aerosols on cloud properties and, consequently, on our climate system under both meteorological and aerosol constraints.
The Semi-Arid Climate and Environment Observatory of Lanzhou University (SACOL) site is located in a semi-arid zone [42,43], where aerosol concentrations are high [44,45]. Studies on ACI in this specific region are relatively scarce [46], which limits the improvement in model representations of clouds in this area. This study utilizes long-term, continuous cloud observations from a Ka-band Zenith Radar (KAZR), combined with cloud microphysical data from the Clouds and the Earth’s Radiant Energy System (CERES) satellite observations, aerosol data from the Modern-Era Retrospective Analysis for Research and Applications Version 2 (MERRA-2) reanalysis dataset, and meteorological variables from the European Centre for Medium-Range Weather Forecasts Reanalysis v5 (ERA5) dataset, to statistically analyze ACI. Instead of using a single meteorological factor to constrain environment as widely used in previous studies, we employ Principal Component Analysis (PCA) to combine multiple meteorological factors and extract the largest variation of meteorology represented by the first principal component (PC1). PC1 retains the comprehensive changes in meteorological conditions compared to individual meteorological factors. The LWP also significantly influences low-level cloud development. We examine the relationship between aerosols and the micro- and macro-physical properties of low-level clouds under the constraints of both PC1 and LWP. Additionally, the impacts of various aerosol components, such as black carbon, dust, organic carbon, and sulfate, on low-level clouds are investigated. Section 2 outlines the data collection and methodologies employed in the study. Section 3 presents the findings derived from the analysis. Section 4 offers a discussion, while conclusions are summarized in Section 5.

2. Materials and Methods

2.1. Materials

The KAZR is a zenith-pointing dual-polarization cloud radar set up at the SACOL site. It operates at 35 GHz with a peak power of 2.2 kW. The KAZR possesses a limited antenna bandwidth of 0.33°, along with notable temporal and vertical resolutions of 4.27 s and 30 m, respectively [47]. Due to its exceptional hardware parameters, the KAZR demonstrates not only excellent cloud penetration but also good sensitivity to small cloud droplet particles. In this study, we mainly use 6-year radar observed return power and reflectivity data from January 2014 through December 2019 to characterize low-level cloud boundary height, geometric thickness, and occurrence frequency. The discrimination of radar echoes produced by clouds from ambient noise is accomplished through the utilization of an enhanced hydrometeor detection technique [48] and an improved clutter distribution algorithm [49], which have been demonstrated to offer benefits in the identification of weak cloud signals and maintain a minimal rate of false detections. Based on the accurate cloud mask data [48,49], low-level clouds are further distinguished by height criteria: the average cloud bottom height of the cloud mass should be lower than 2 km above ground level (AGL). The hourly occurrence frequency of low-level cloud (CF) is computed by dividing the number of radar profiles containing low-level clouds by the total number of radar profiles available during one-hour observational periods. Cloud top height (CTH) and cloud bottom height (CBH) are assigned by the altitudes of the upper and lower boundaries of the clouds. Cloud geometric thickness (CGT) is then calculated as the height difference between CBH and CTH.
The low-level cloud microphysical properties are obtained from CERES SYN1deg-Ed4.1A product [50,51], including CER, top of the atmosphere albedo (Albedo), LWP, and cloud optical depth (COD). The SYN1deg-Ed4.1A dataset has hourly temporal resolution and 1° × 1° spatial resolution. The most important feature of this dataset is that it provides global all-day observations via geostationary satellites while incorporating observations from polar-orbiting satellites, improving the cloud property retrievals. In order to align the cloud characteristics observed by satellites with those observed by KAZR instruments, this study utilizes the nearest four grids (35.5–36.5°N, 103.5–104.5°E) of the SYN1deg-Ed4.1A data corresponding to the observational location and times when low-level clouds are detected by the KAZR.
MERRA-2 reanalysis data are produced by an upgraded version of the Goddard Earth Observing System Model, Version 5 (GEOS-5) data assimilation system [52]. The MEERA-2 system assimilates aerosol data obtained from ground-based Aerosol Robotic NETwork (AERONET) and space-borne aerosol datasets derived from instruments such as the Advanced Very High-Resolution Radiometer (AVHRR), Multi-angle Imaging Spectro Radiometer (MISR), and Moderate-resolution Imaging Spectroradiometer (MODIS) [53,54]. In this study, we use hour-by-hour 0.5° × 0.625° M2T1NXAER dataset from MERRA-2 spanning the same time period, with the variable of the total aerosol extinction optical thickness at 550 nm, different types aerosol extinction optical thickness at 550 nm (i.e., black carbon, dust, organic carbon, and sulfate), total aerosol scattering optical thickness at 550 nm, and Ångström exponent (AE) derived by 470 nm and 870 nm channels. Due to the proximity of the grid point of the MERRA-2 data to the SACOL site, we specifically select the grid point (36°N, 104.375°E) that is nearest to the observational location.
The meteorological data are from the fifth generation of European Centre for Medium-Range Weather Forecasts (ECMWF) reanalysis data ERA5 [55]. The ERA5 is generated through the utilization of 4D-Var data assimilation and model forecasts within the CY41R2 version of the ECMWF Integrated Forecast System (IFS). The model incorporates 137 hybrid sigma/pressure levels in the vertical dimension, with the highest level situated at 0.01 hPa. Hourly ERA5 data, featuring a spatial resolution of 0.125° × 0.125° and 37 pressure levels, are employed. In this study, the point (36°N, 104.125°E) nearest to SACOL is selected to characterize the meteorological conditions at the SACOL site. Here, the meteorological variables that we select to characterize the atmospheric dynamic and thermodynamic conditions for low-level cloud formation included zonal wind (U), meridional wind (V), vertical velocity (ω), RH, temperature (T), and geopotential (φ) at 8 levels (500 hPa, 550 hPa, 600 hPa, 650 hPa, 700 hPa, 750 hPa, 775 hPa, and 800 hPa), 2-meter temperature (T2m), and 2-meter dewpoint temperature (Td2m). Horizontal wind speed (HWS) is calculated as HWS = U 2 + V 2 . Wind shear ( H W S Z ) is the variation of horizontal wind speed with elevation. This meteorological parameter plays a crucial role in cloud development and the vertical distribution of atmospheric properties. The potential temperature (θ), derived from the ERA5 temperature and pressure data, represents theoretical temperature that would result when an unsaturated air parcel undergoes adiabatic adjustment to the standard 1000 hPa pressure level. The height of lifting condensation level (LCL) is a key parameter related to low-level cloud cover [56], representing the altitude at which an air parcel reaches saturation if lifted adiabatically. LCL is calculated as LCL ≈ 123 (T2m − Td2m) [57].

2.2. Methods

To reduce the complexity of high-dimensional meteorological data while preserving key patterns, we apply PCA. Prior to its application, standardization of variables is performed to prevent scale-dependent bias, as meteorological parameters are measured in different units. This preprocessing step ensures each variable contributes equally to the analysis, enabling accurate pattern detection in the multivariate meteorological fields. The standardized data are organized into a matrix with dimensions “time × variables”, where each row corresponds to a time point and each column represents a standardized meteorological variable. PCA simplifies the complexity of high-dimensional data by transforming it into a smaller set of uncorrelated principal components, which are hierarchically ordered based on the amount of variance they explain. PC1, which accounts for the maximum variance in the data, represents dominant temporal modes of meteorological variability across the study period.
Based on the correlations between various meteorological factors and cloud properties, we selected four meteorological parameters including the height of LCL, RH, T and H W S Z at 775 hPa. The method of selection is described in Section 3.2. The PC1 derived from these variables effectively captures the dominant pattern of atmospheric variability, which is notably amplified during cloudy conditions compared to clear sky scenarios. Moreover, this PC1 demonstrates stronger comprehensive associations with low-level cloud properties than any individual meteorological variable [58,59], making it an effective metric for constraining meteorological conditions in ACI studies.

3. Results

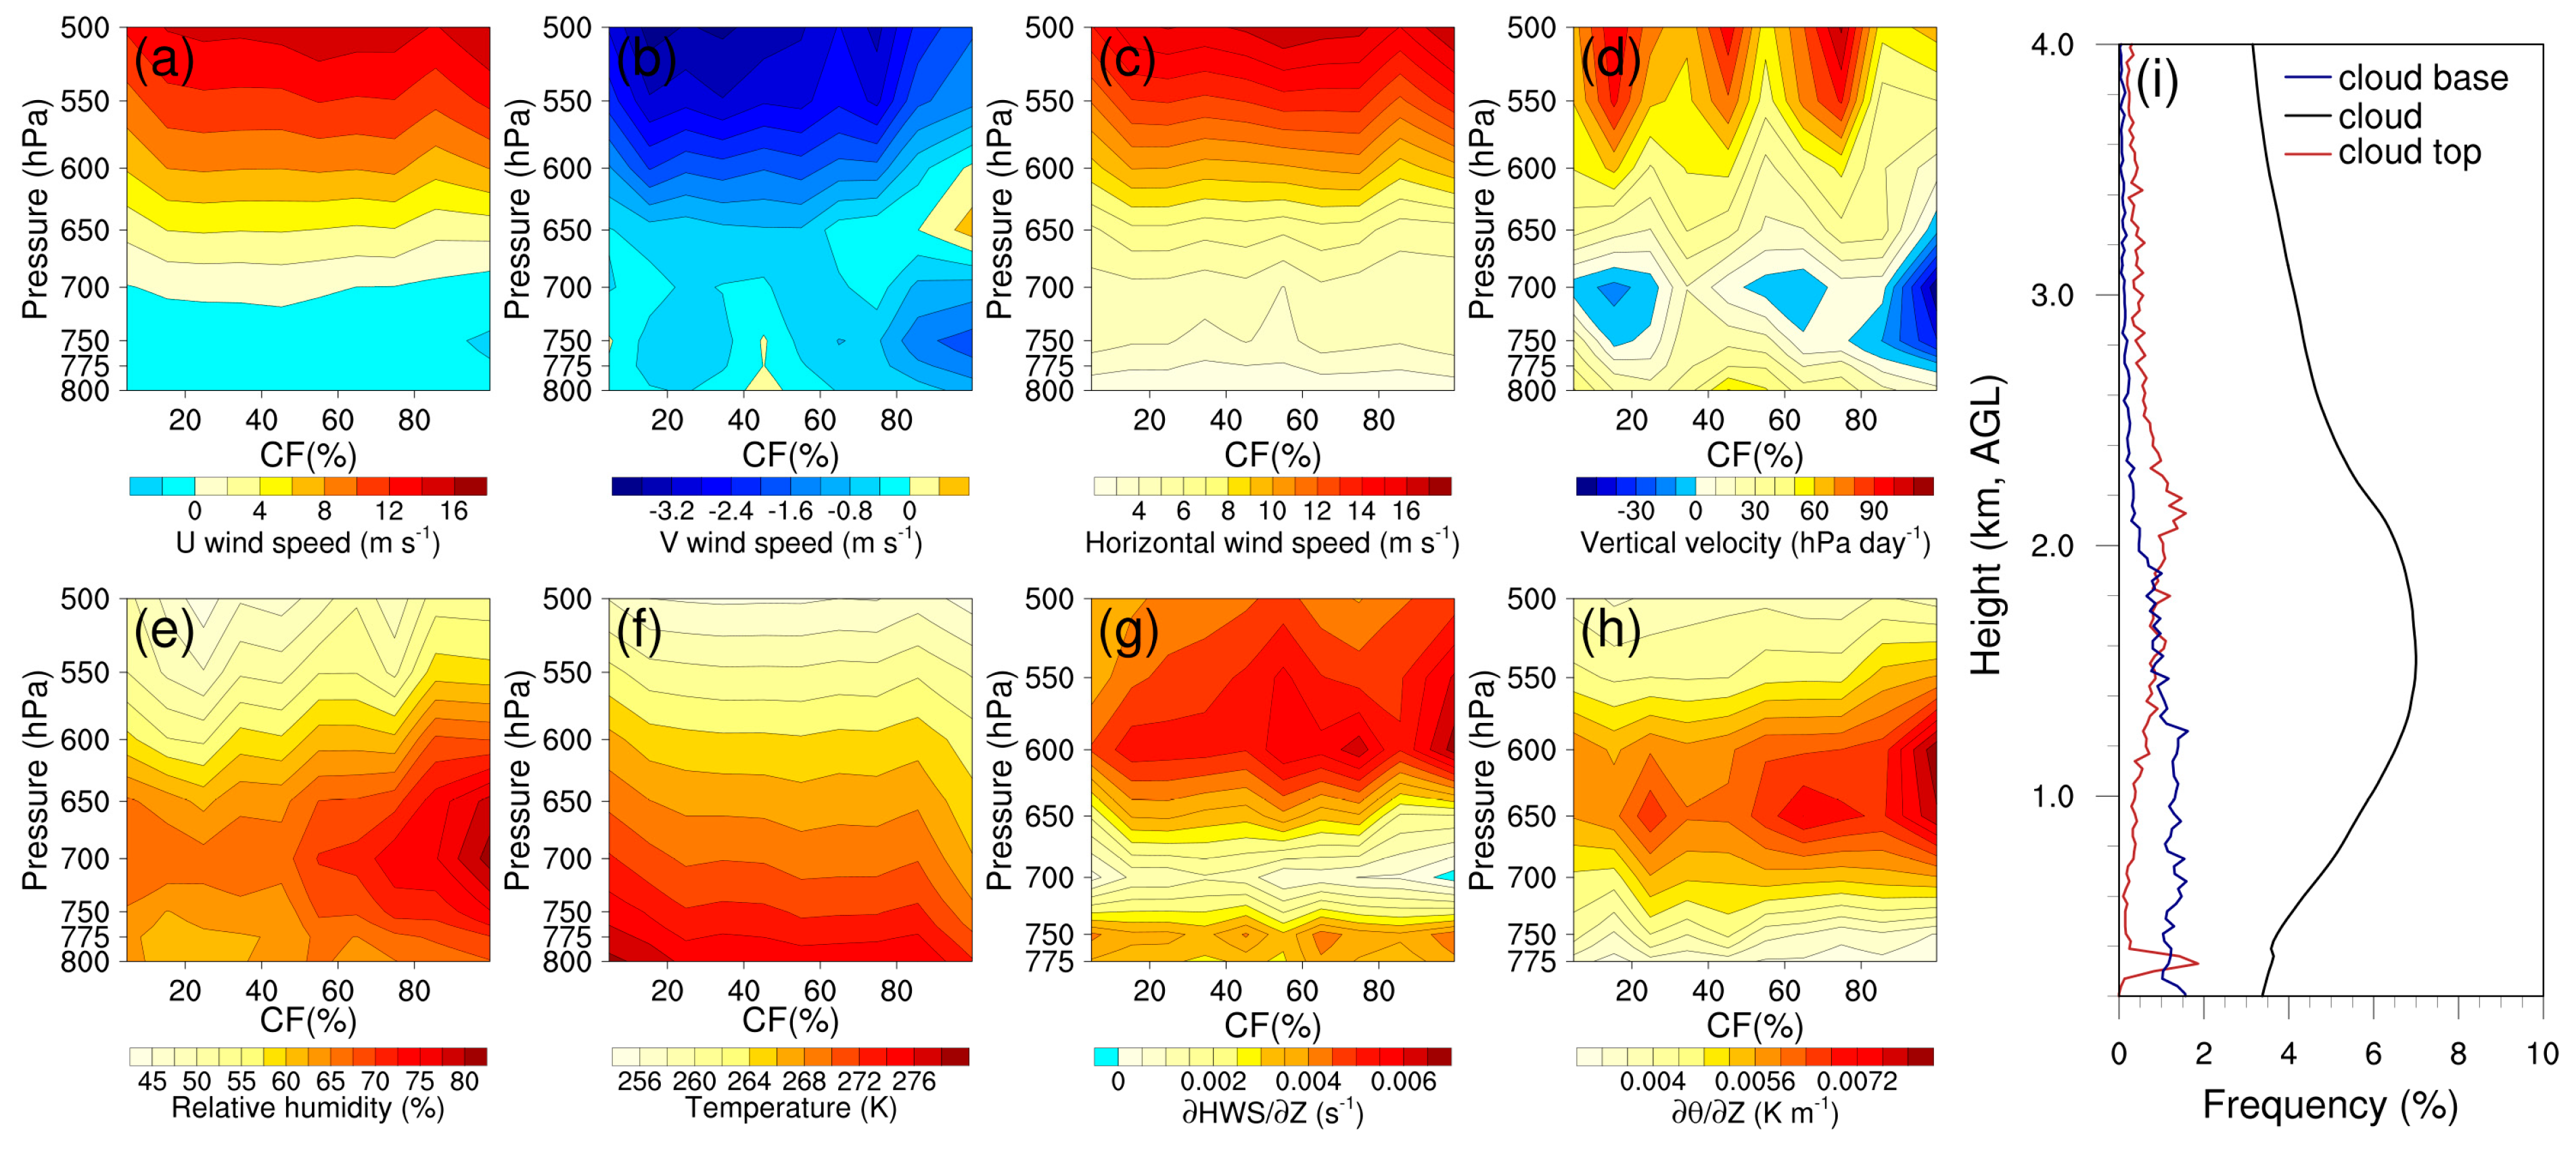
3.1. Vertical Distribution of Meteorological Factors and Low-Level Clouds

The formation, development, and extinction of low-level clouds are closely linked to local meteorological conditions. To investigate these relationships, we analyzed the influence of various meteorological factors on low-level cloud formation and examine the vertical distribution of low-level clouds over the SACOL site. Figure 1 presents the relationships between CF and eight meteorological factors, including U, V, HWS, ω, RH, T, H W S Z , and the potential temperature lapse rate ( θ Z ). CF serves as an indicator of low-level cloud formation, with its increase reflecting meteorological conditions more favorable for low-level cloud occurrence. All meteorological factors are examined at eight pressure levels from 500 to 800 hPa, except for H W S Z and θ Z , which are only available from 500 to 775 hPa. Among these factors, U and HWS show no significant variation with changes in CF (Figure 1a,c), suggesting that these factors have a limited impact on cloud formation at the SACOL site. V at 650 hPa is positively correlated with CF, indicating that southerly warm and moist air transport favors low-level cloud formation (Figure 1b). ω demonstrates an upward motion in lower layers coupled with subsidence aloft, which promotes low-level cloud development (Figure 1d). RH is identified as the most influential factor [60], typically explaining the majority of CF variability (Figure 1e), while T plays a critical role in cloud droplet condensation (Figure 1f). Dynamic factor H W S Z exhibit a strong positive correlation with CF, suggesting that enhanced upper-level wind shear supports low-level cloud formation (Figure 1g). Lastly, a larger θ Z is associated with increased atmospheric instability, which is conducive to cloud development (Figure 1h). The vertical distribution of low-level clouds over SACOL is shown in Figure 1i, where the cloud top and base height occurrence frequencies reveal a prominent peak at approximately 2.2 km AGL for cloud top and 1.2 km AGL for cloud base, corresponding to the 600–680 hPa pressure range. Additionally, a stronger peak below 0.2 km AGL is observed in the red line, which may be associated with shallow fog or low stratus clouds forming near the surface.

3.2. Relationship Between Meteorological Factors and Cloud Properties

We further identify four factors most relevant to low-level cloud formation through correlation analysis. Table 1’s first eight columns show the mean absolute correlation coefficients between low-level cloud macro-microphysical properties and the meteorological factors across eight pressure levels (500–800 hPa). The mean of the absolute correlation coefficients (MACC) values in Table 1’s last column represents the average of eight mean absolute correlation coefficients for each meteorological factor. The height of LCL, RH, and T exhibits the strongest correlation with cloud properties comprehensively, with MACC values greater than or equal to 0.8. The determination of the fourth meteorological factor requires the analysis of the correlation between the PC1, derived from the height of LCL, RH, and T, with one of remaining six variables (U, HWS, V, θ Z , ω, and H W S Z ) and the low-level cloud properties. As shown in Table 2, the MACC between PC1 (each time combined with a different fourth variable) and eight cloud physical properties are calculated at 500–800 hPa pressure levels. The combination, including wind shear at 775 hPa, yields the highest MACC value of 0.9, indicating a strong association with cloud properties and supporting its selection as the fourth meteorological factor. The PC1, generated from the combination of RH, T, and H W S Z at 775 hPa and the height of LCL, explains 57% of the total variance and captures the dominant patterns of atmospheric variability. It shows a stronger comprehensive correlation with low-level cloud properties compared to any individual meteorological factor (Table 3). Specifically, RH, T, and H W S Z at 775 hPa do not pass the 95% significance test in their correlations with CTH, CGT, and COD, respectively, and the height of LCL shows weaker correlations with CF and CGT than PC1. Lower PC1 values are associated with more favorable conditions for low-level cloud formation due to their significant negative correlation with CF (Table 3).
Figure 2 illustrates the variation in four key meteorological parameters (LCL, RH, T, and H W S Z at 775 hPa) as a function of PC1. Each box plot captures the distribution of values for each variable across different PC1 bins. As PC1 shifts from positive to negative, the height of LCL gradually decreases from 2.5 km to near the surface (Figure 2a), while RH at 775 hPa increases from 20% to near-saturation (Figure 2b). T decreases from 290 K to 250 K (Figure 2c), and H W S Z moderately increases as PC1 moves from positive to negative values (Figure 2d). These systematic variations demonstrate that the combination of low LCL, high RH, cool T, and strong H W S Z provide a favorable environment for low-level cloud formation and maintenance.

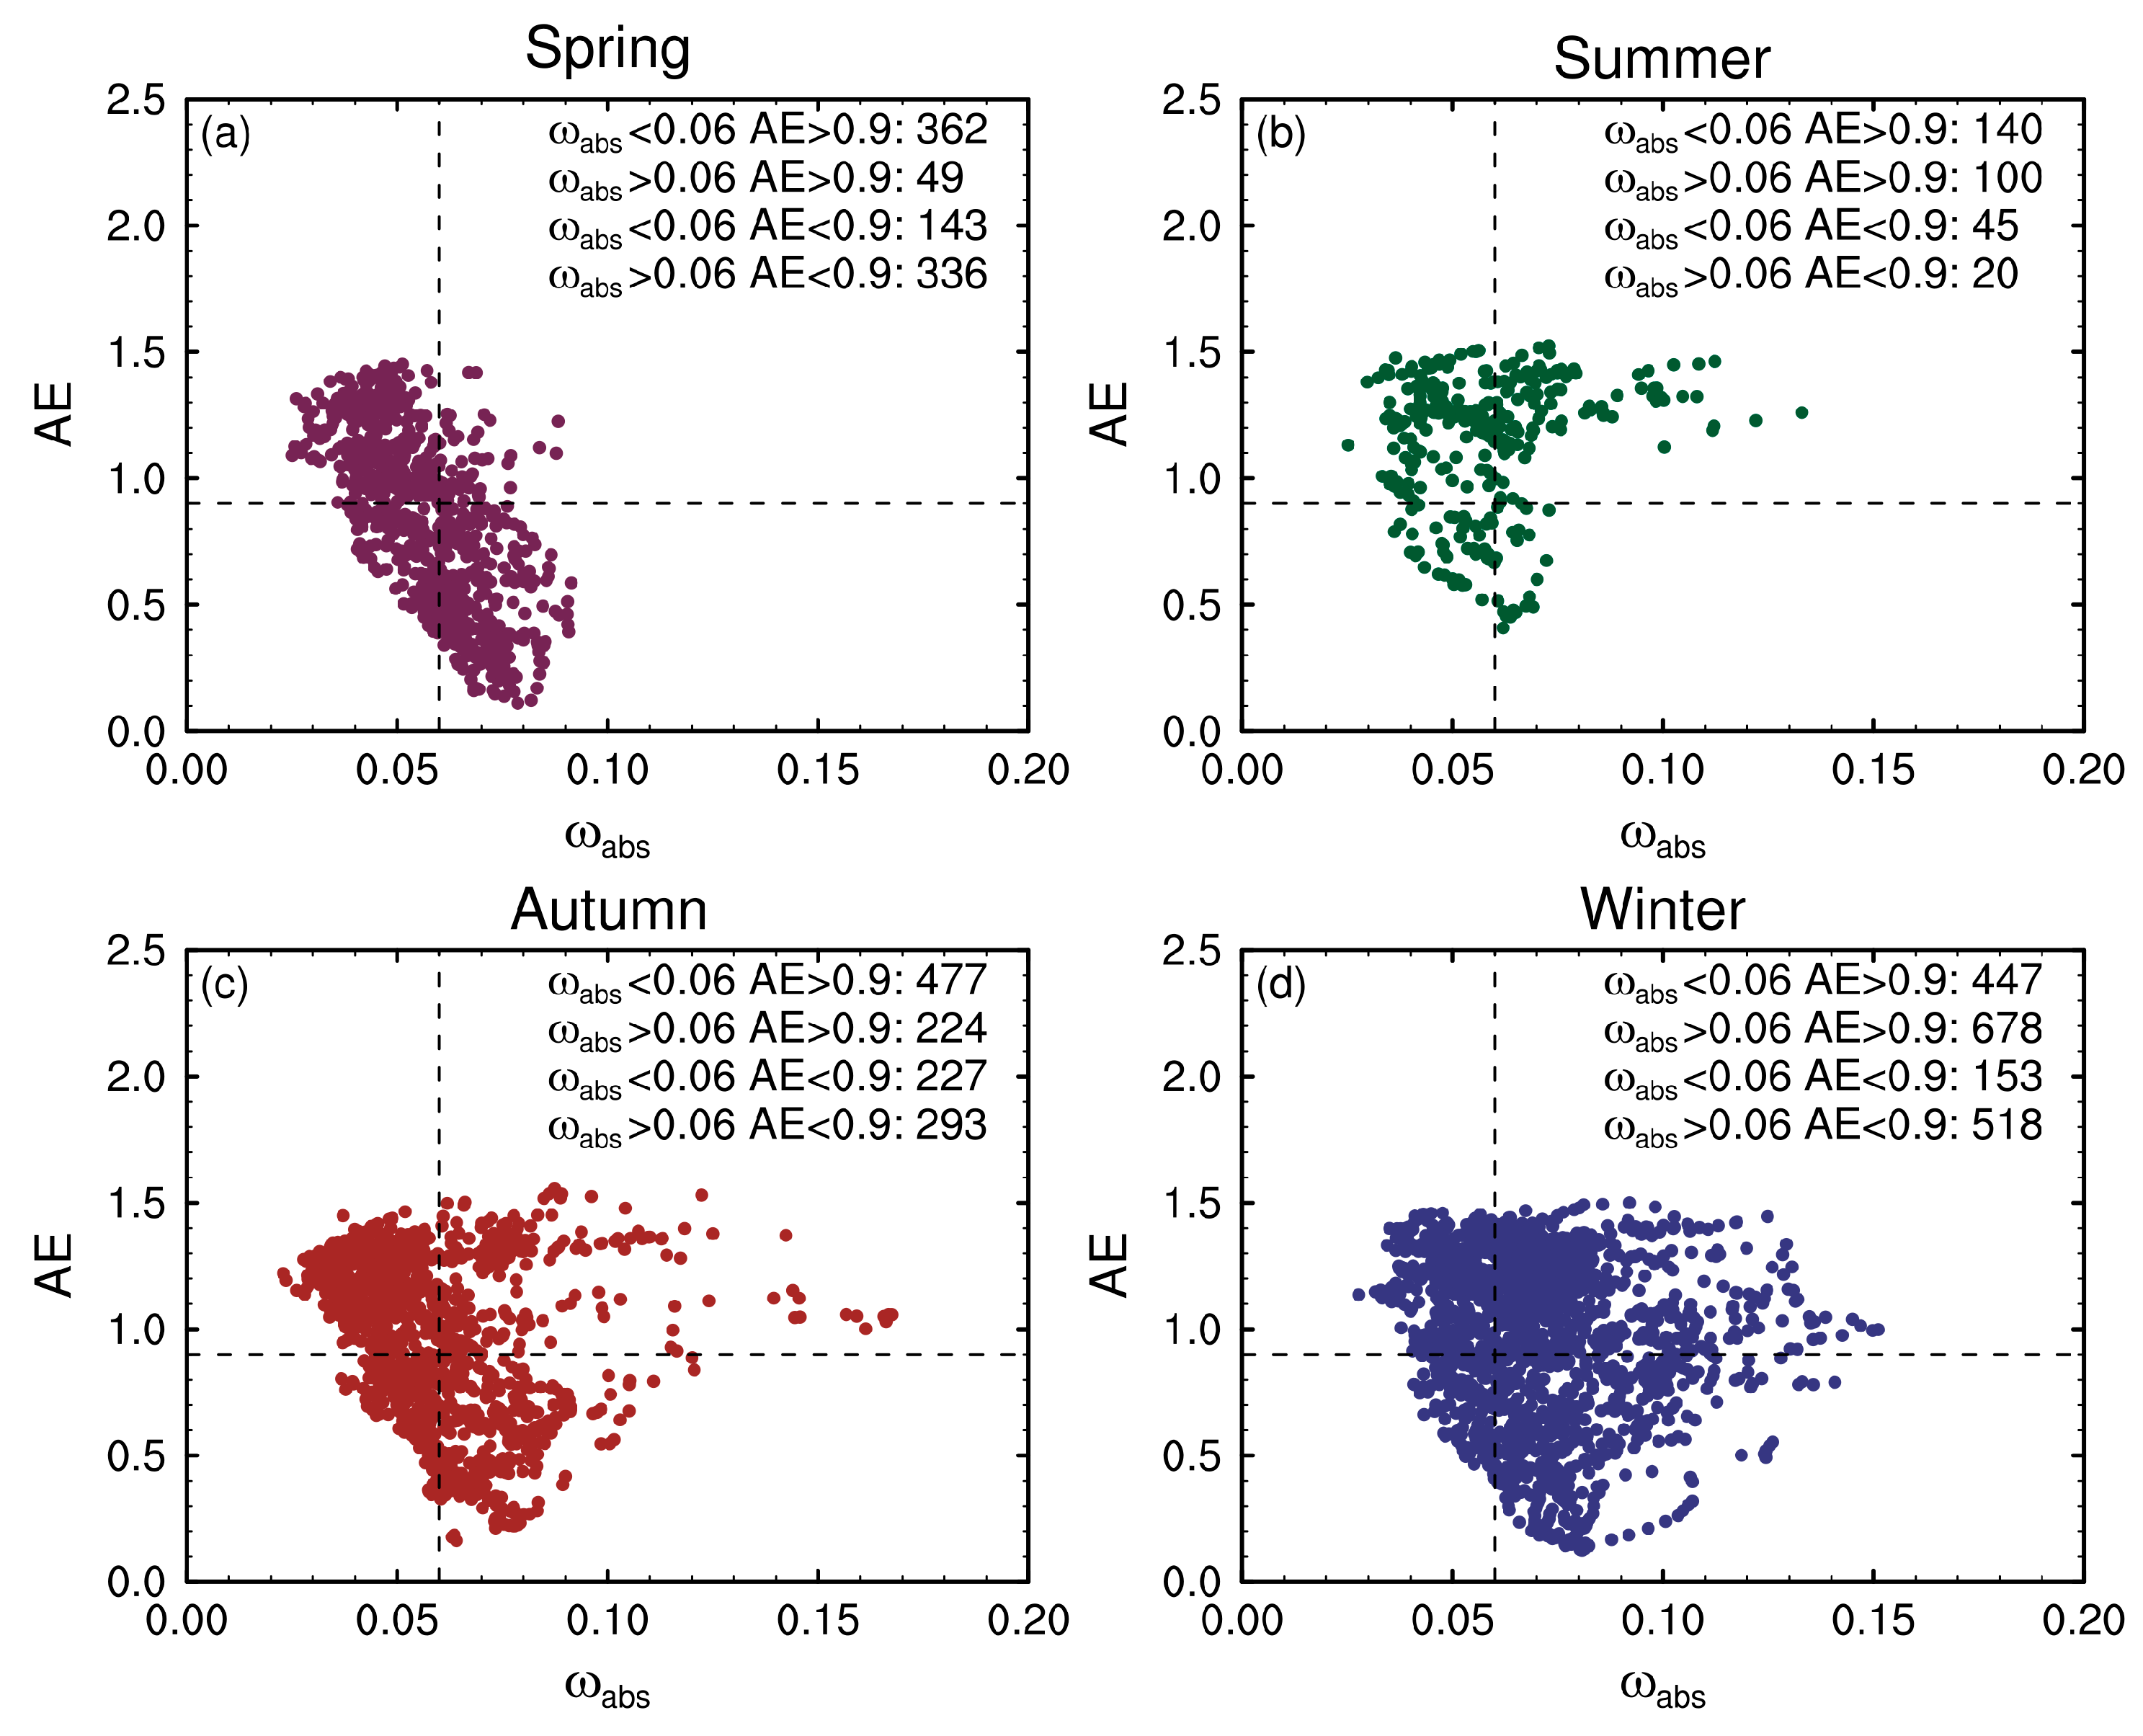
3.3. Seasonal Variations in Aerosol Physical and Optical Properties

In addition to the meteorological factors influencing the formation and dissipation of low-level clouds, aerosols can significantly impact cloud properties. The effects of aerosols on low-level clouds through ACI vary among aerosol types. Highly absorbing aerosols, such as black carbon, warm the surrounding air, which can enhance atmospheric stability and promote cloud evaporation, thereby reducing cloud formation. In contrast, weakly absorbing aerosols, such as sulfate aerosols, scatter solar radiation, leading to surface cooling and potentially promoting cloud formation by enhancing the availability of CCN.
To further understand the influence of different aerosol types on cloud properties, it is necessary to investigate the physical and optical characteristics of aerosol particles, including the AE and the ratio of the aerosol absorption coefficient ( σ a b s ) to the total extinction coefficient ( σ a b s + σ s c a t ), where σ s c a t is the aerosol scattering coefficient. This ratio is calculated as ω a b s = σ a b s / ( σ a b s + σ s c a t ) [61,62]. AE is crucial for characterizing the aerosol size distribution, with AE > 0.9 indicating fine-mode aerosols and AE < 0.9 indicating coarse-mode aerosols. ω a b s , which is more sensitive to light absorption than scattering, provides a better estimate of the aerosol composition, with ω a b s > 0.06 for strongly absorbing aerosols and ω a b s < 0.06 for weakly absorbing aerosols. These thresholds are determined using the cumulative probability density analyses of AE and ω a b s .
Figure 3 shows distinct seasonal patterns in aerosol’s physical and optical properties at SACOL. Spring exhibits a unique pattern with predominantly coarse-mode particles (AE < 0.9) and weakly absorbing characteristics ( ω a b s < 0.06), reflecting the dominant influence of non-spherical dust aerosols transported from the Taklimakan and Gobi Deserts (Figure 3a) [63,64]. Summer and autumn share similar distributions, characterized by weakly absorbing and fine-mode aerosols (Figure 3b,d), suggesting different emission sources during these seasons. In the winter, fine-mode particles (AE > 0.9) dominate with predominantly strongly absorbing aerosols ( ω a b s > 0.06), resulting from the mixture of dust and anthropogenic black carbon aerosols from both local combustion and long-range transport (Figure 3d) [43]. The clear demarcation between winter and other seasons indicates a strong seasonal cycle in both the aerosol size distribution and absorption properties, likely driven by the interplay between dust transport patterns, local emission sources, and seasonal meteorological conditions.

3.4. Cloud Properties Under Different Aerosol Absorption Regimes

Cloud microphysical and macrophysical properties exhibit systematic variations between strongly and weakly absorbing aerosol regimes (Figure 4). Under strongly absorbing conditions, low-level clouds show reduced liquid water path (LWP < 37.5 g/m2), COD, and CGT (Figure 4a,d,f), suggesting thinner clouds with limited vertical development. This regime also features a smaller cloud droplet effective radius (CER < 7.5 μm) due to reduced water vapor supply [65], though some instances of larger droplets (CER > 11.25 μm) occur more frequently than in weakly absorbing conditions (Figure 4b). CF shows lower values (CF < 87.5%) under strongly absorbing aerosols, accompanied by lower CBH (Figure 4e,g). The reduced CTH in strongly absorbing conditions correspond to decreased Albedo values (Figure 4h,c), as the extended path length for reflected solar radiation enhances light attenuation.

3.5. ACI Under Individual Constraint

To accurately assess aerosol impacts on cloud properties, it is essential to constrain various factors influencing the ACI. Previous studies have shown that meteorological conditions and LWP can significantly affect ACI [66,67,68,69]. To quantitatively evaluate these relationships, we examined ACI under two key constraints: meteorological conditions (through PC1) and water vapor content (via LWP). The data were first binned based on PC1 and LWP. Within each bin, the data were further subdivided into 10 equally spaced sub-bins according to LWP values. The ACI index was calculated separately for each LWP sub-bin, and the final ACI index value for a given PC1 or LWP bin was determined by averaging the ACI indices across all 10 corresponding sub-bins. The ACI index is defined as follows [17]:
  A C I = 1 10 i = 1 10 ln C E R ln A O D L W P i ,
A positive ACI index indicates that CER decreases with increasing AOD, while a negative value suggests the opposite relationship.

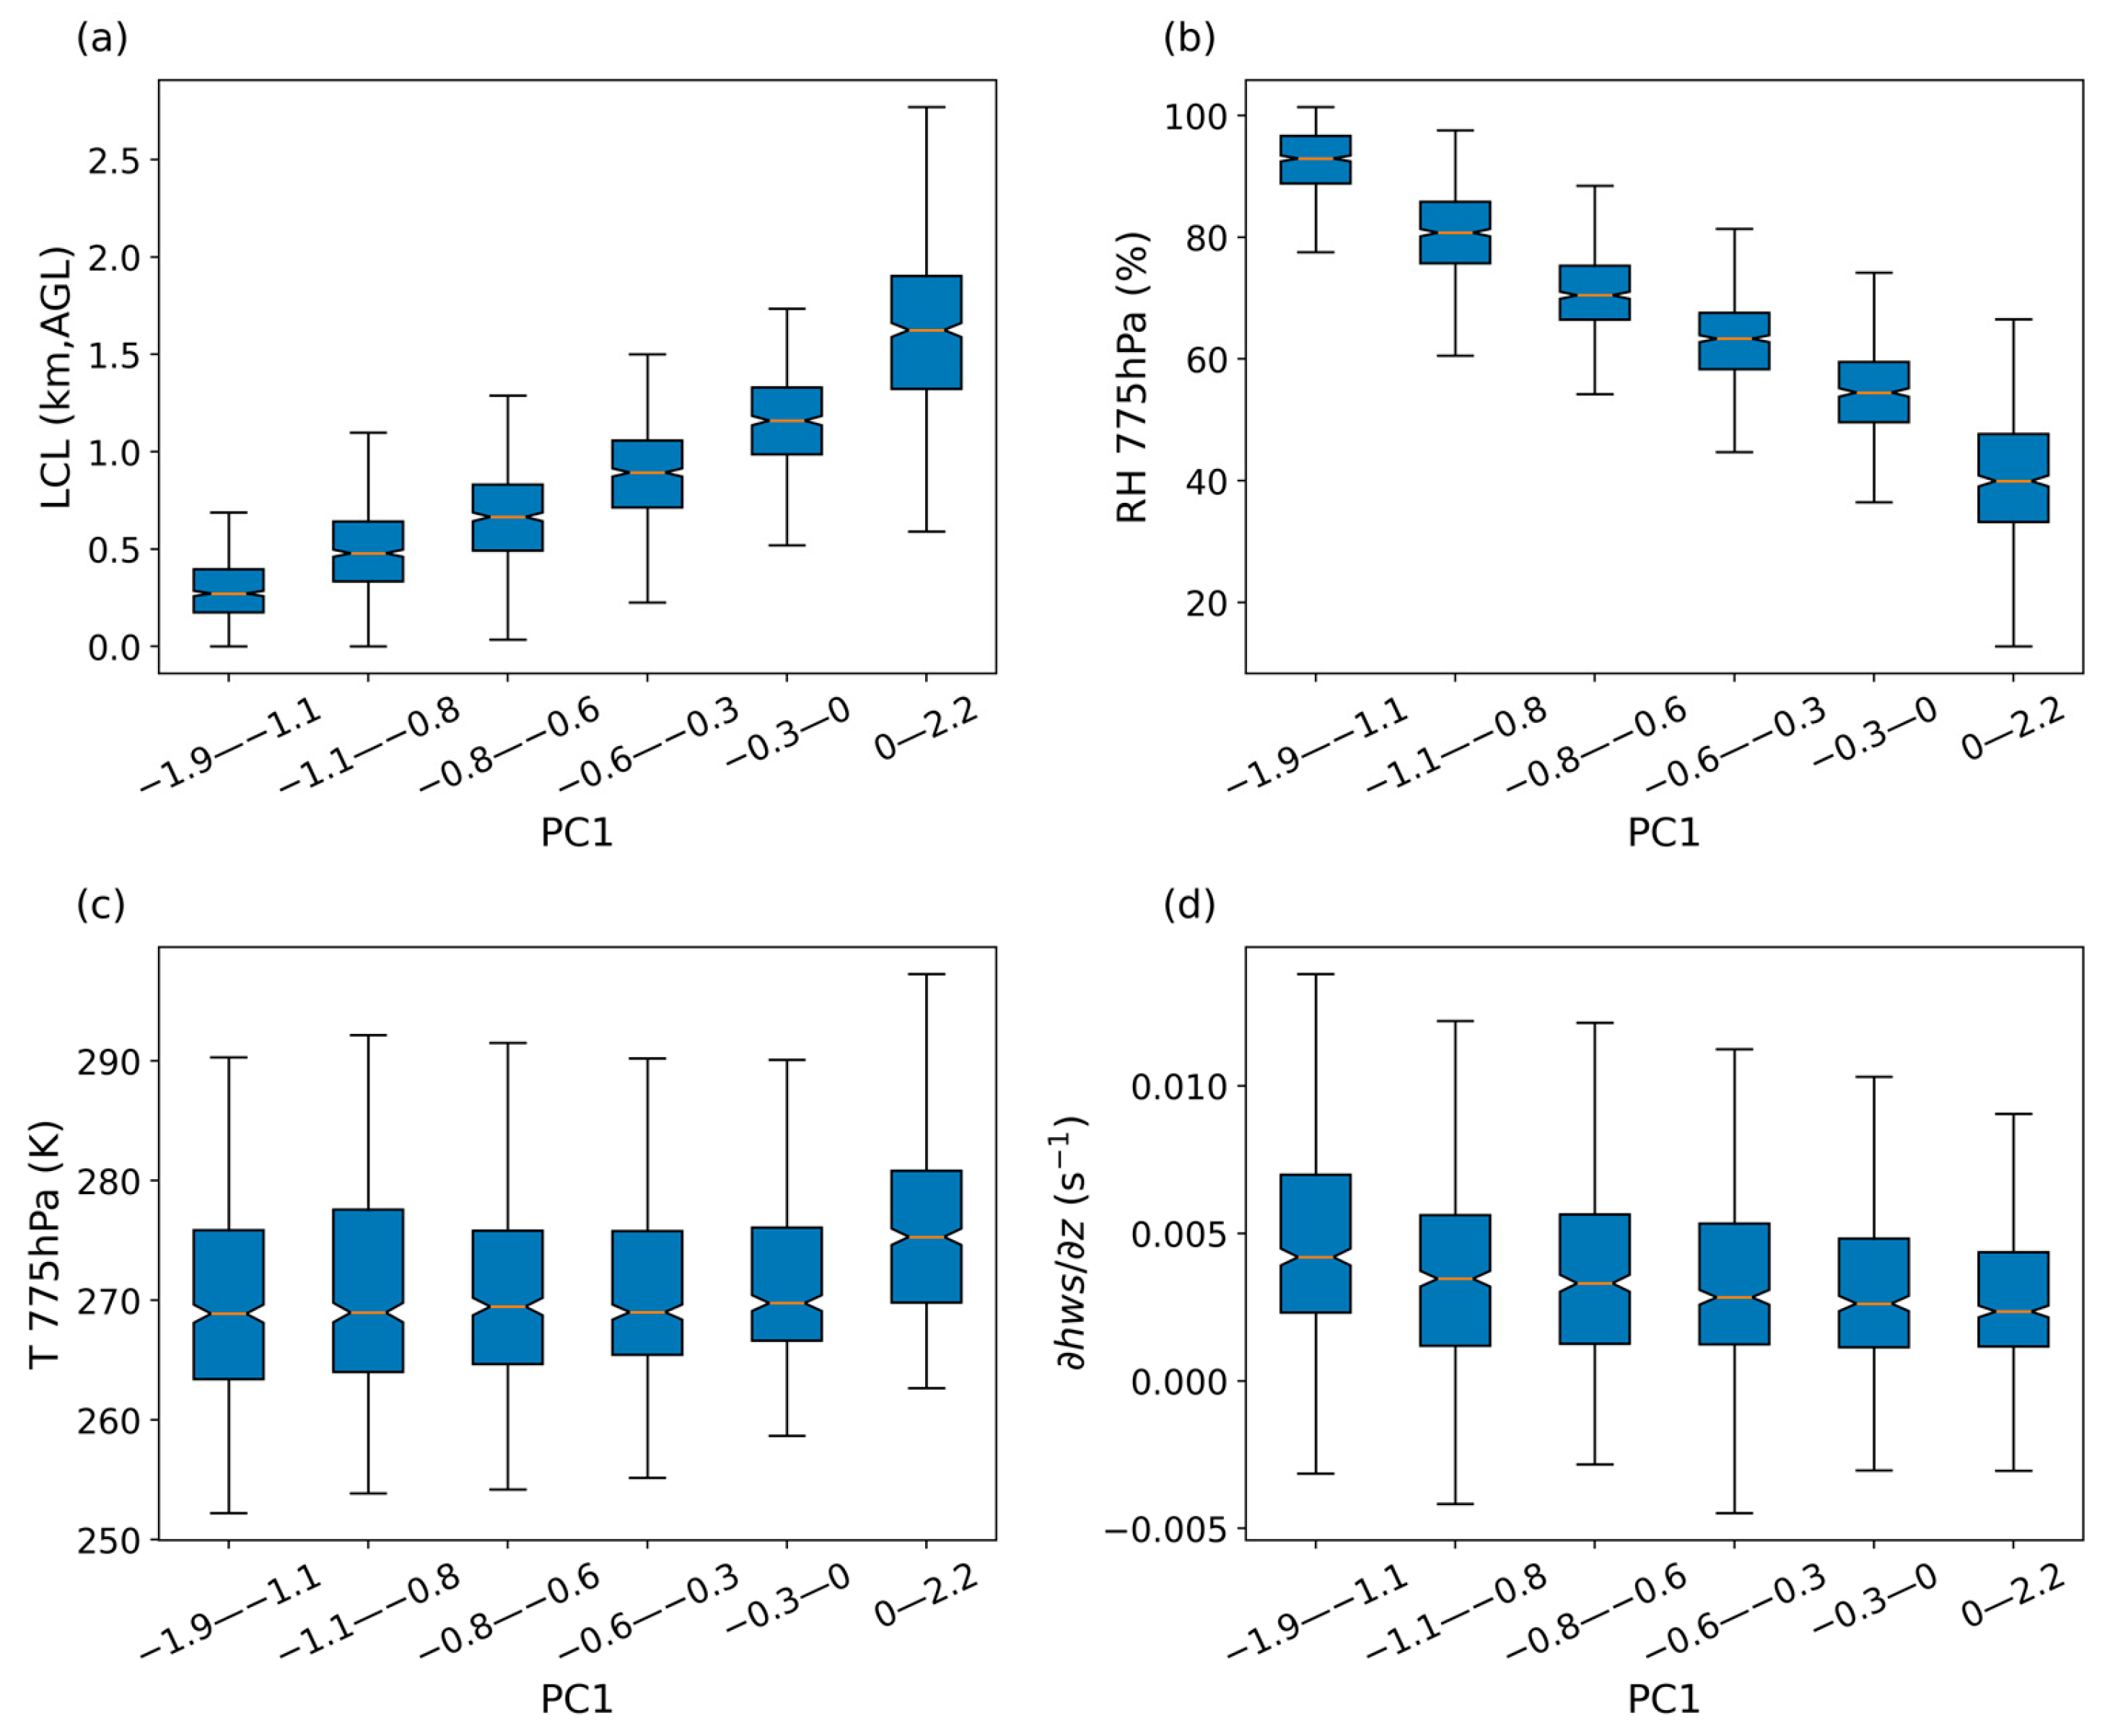
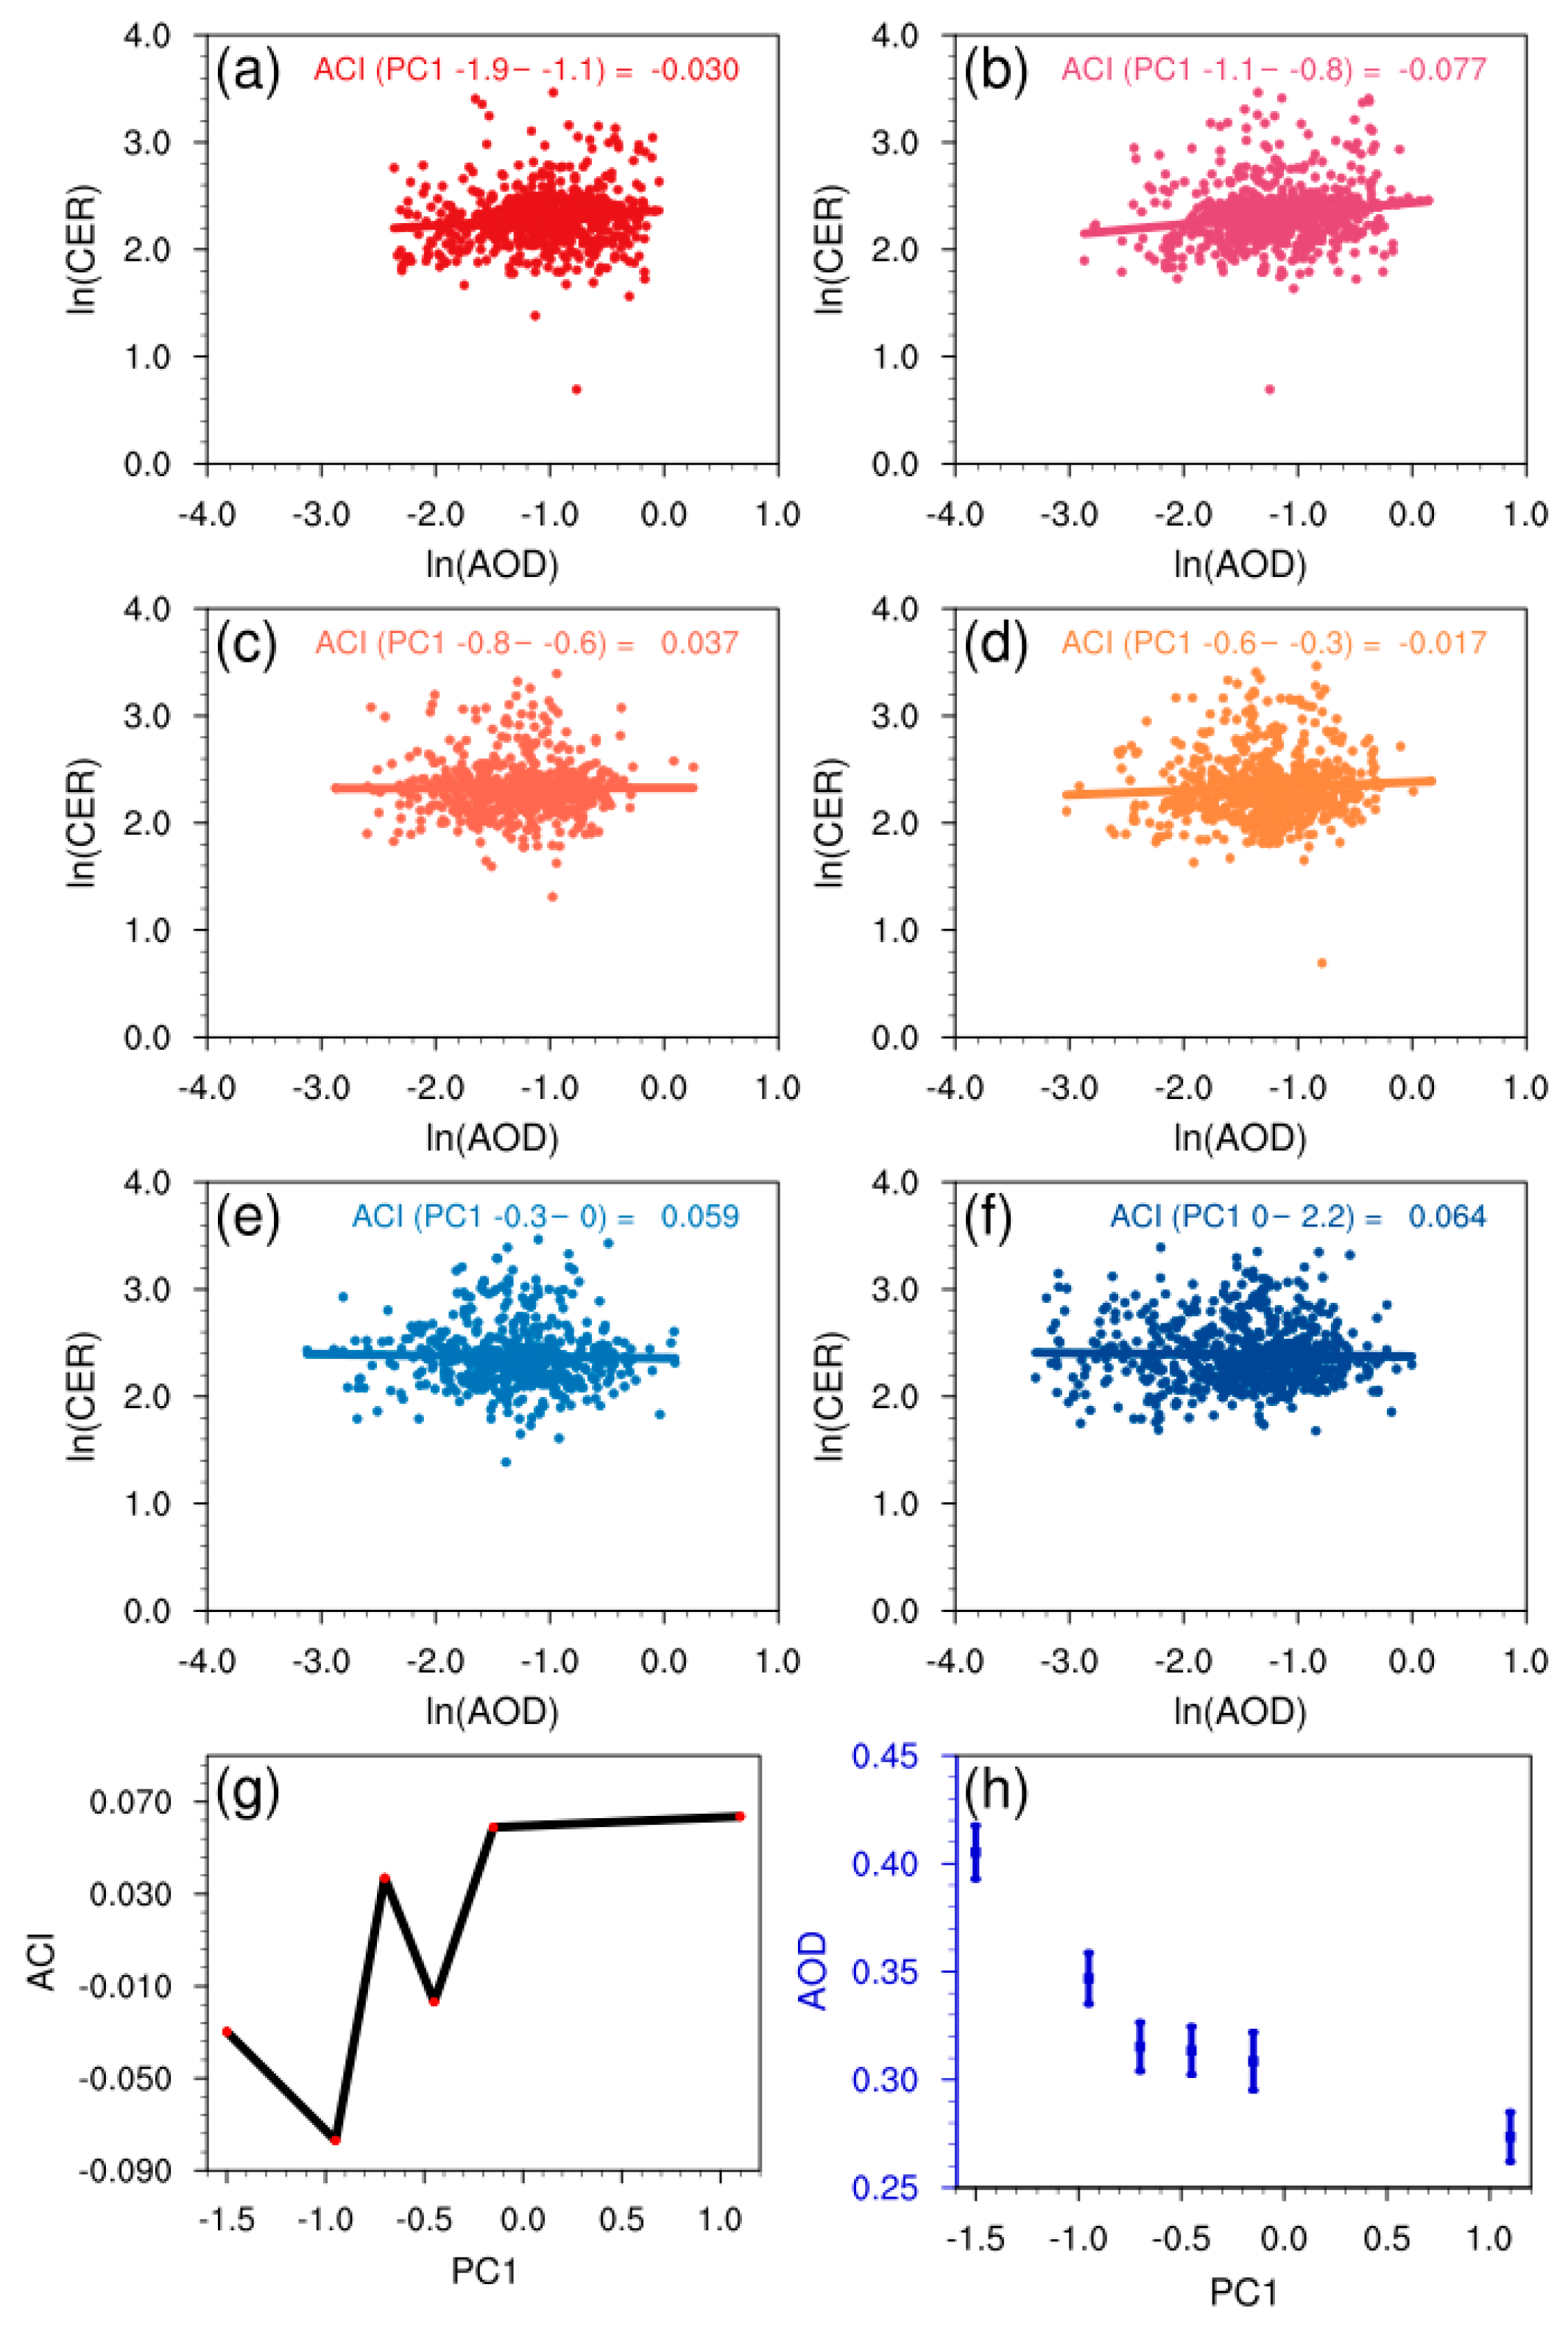
3.5.1. ACI Under PC1 Constraint

Six PC1 bins range from −1.9 to 2.2 based on the same sample size within each bin, which can be divided into six intervals: −1.9–−1.1, −1.1–−0.8, −0.8–−0.6, −0.6–−0.3, −0.3–0, and 0–2.2. As shown in Figure 5a–f, the relationship between CER and AOD exhibits distinct patterns across different PC1 ranges. Under favorable meteorological conditions for low-level cloud formation (−1.9 < PC1 < −0.8, Figure 5a,b), sufficient water supply and lower temperatures facilitate cloud droplet growth through condensation and collision–coalescence processes, leading to negative ACI index values. Conversely, under unfavorable meteorological conditions, positive ACI index values are observed (−0.3 < PC1 < 2.2, Figure 5e,f). Under these conditions, characterized by limited water vapor, high ambient temperatures, and weak wind shear, increased aerosol loading leads to competition for available water vapor among newly activated CCN and existing cloud droplets. This competition, combined with enhanced evaporation due to higher temperatures, results in smaller cloud droplets. The comprehensive analysis in Figure 5g reveals a systematic trend: ACI index values increase with increasing PC1, ranging from −0.077 to 0.064, while AOD shows a marked decrease. This pattern suggests that meteorological conditions fundamentally modulate the ACI sensitivity. Under meteorological conditions favorable to low-level cloud formation, the CER increases even if more aerosols enter the cloud, whereas under unfavorable meteorological conditions, a smaller amount of aerosol causes a decrease in the CER (Figure 5h).

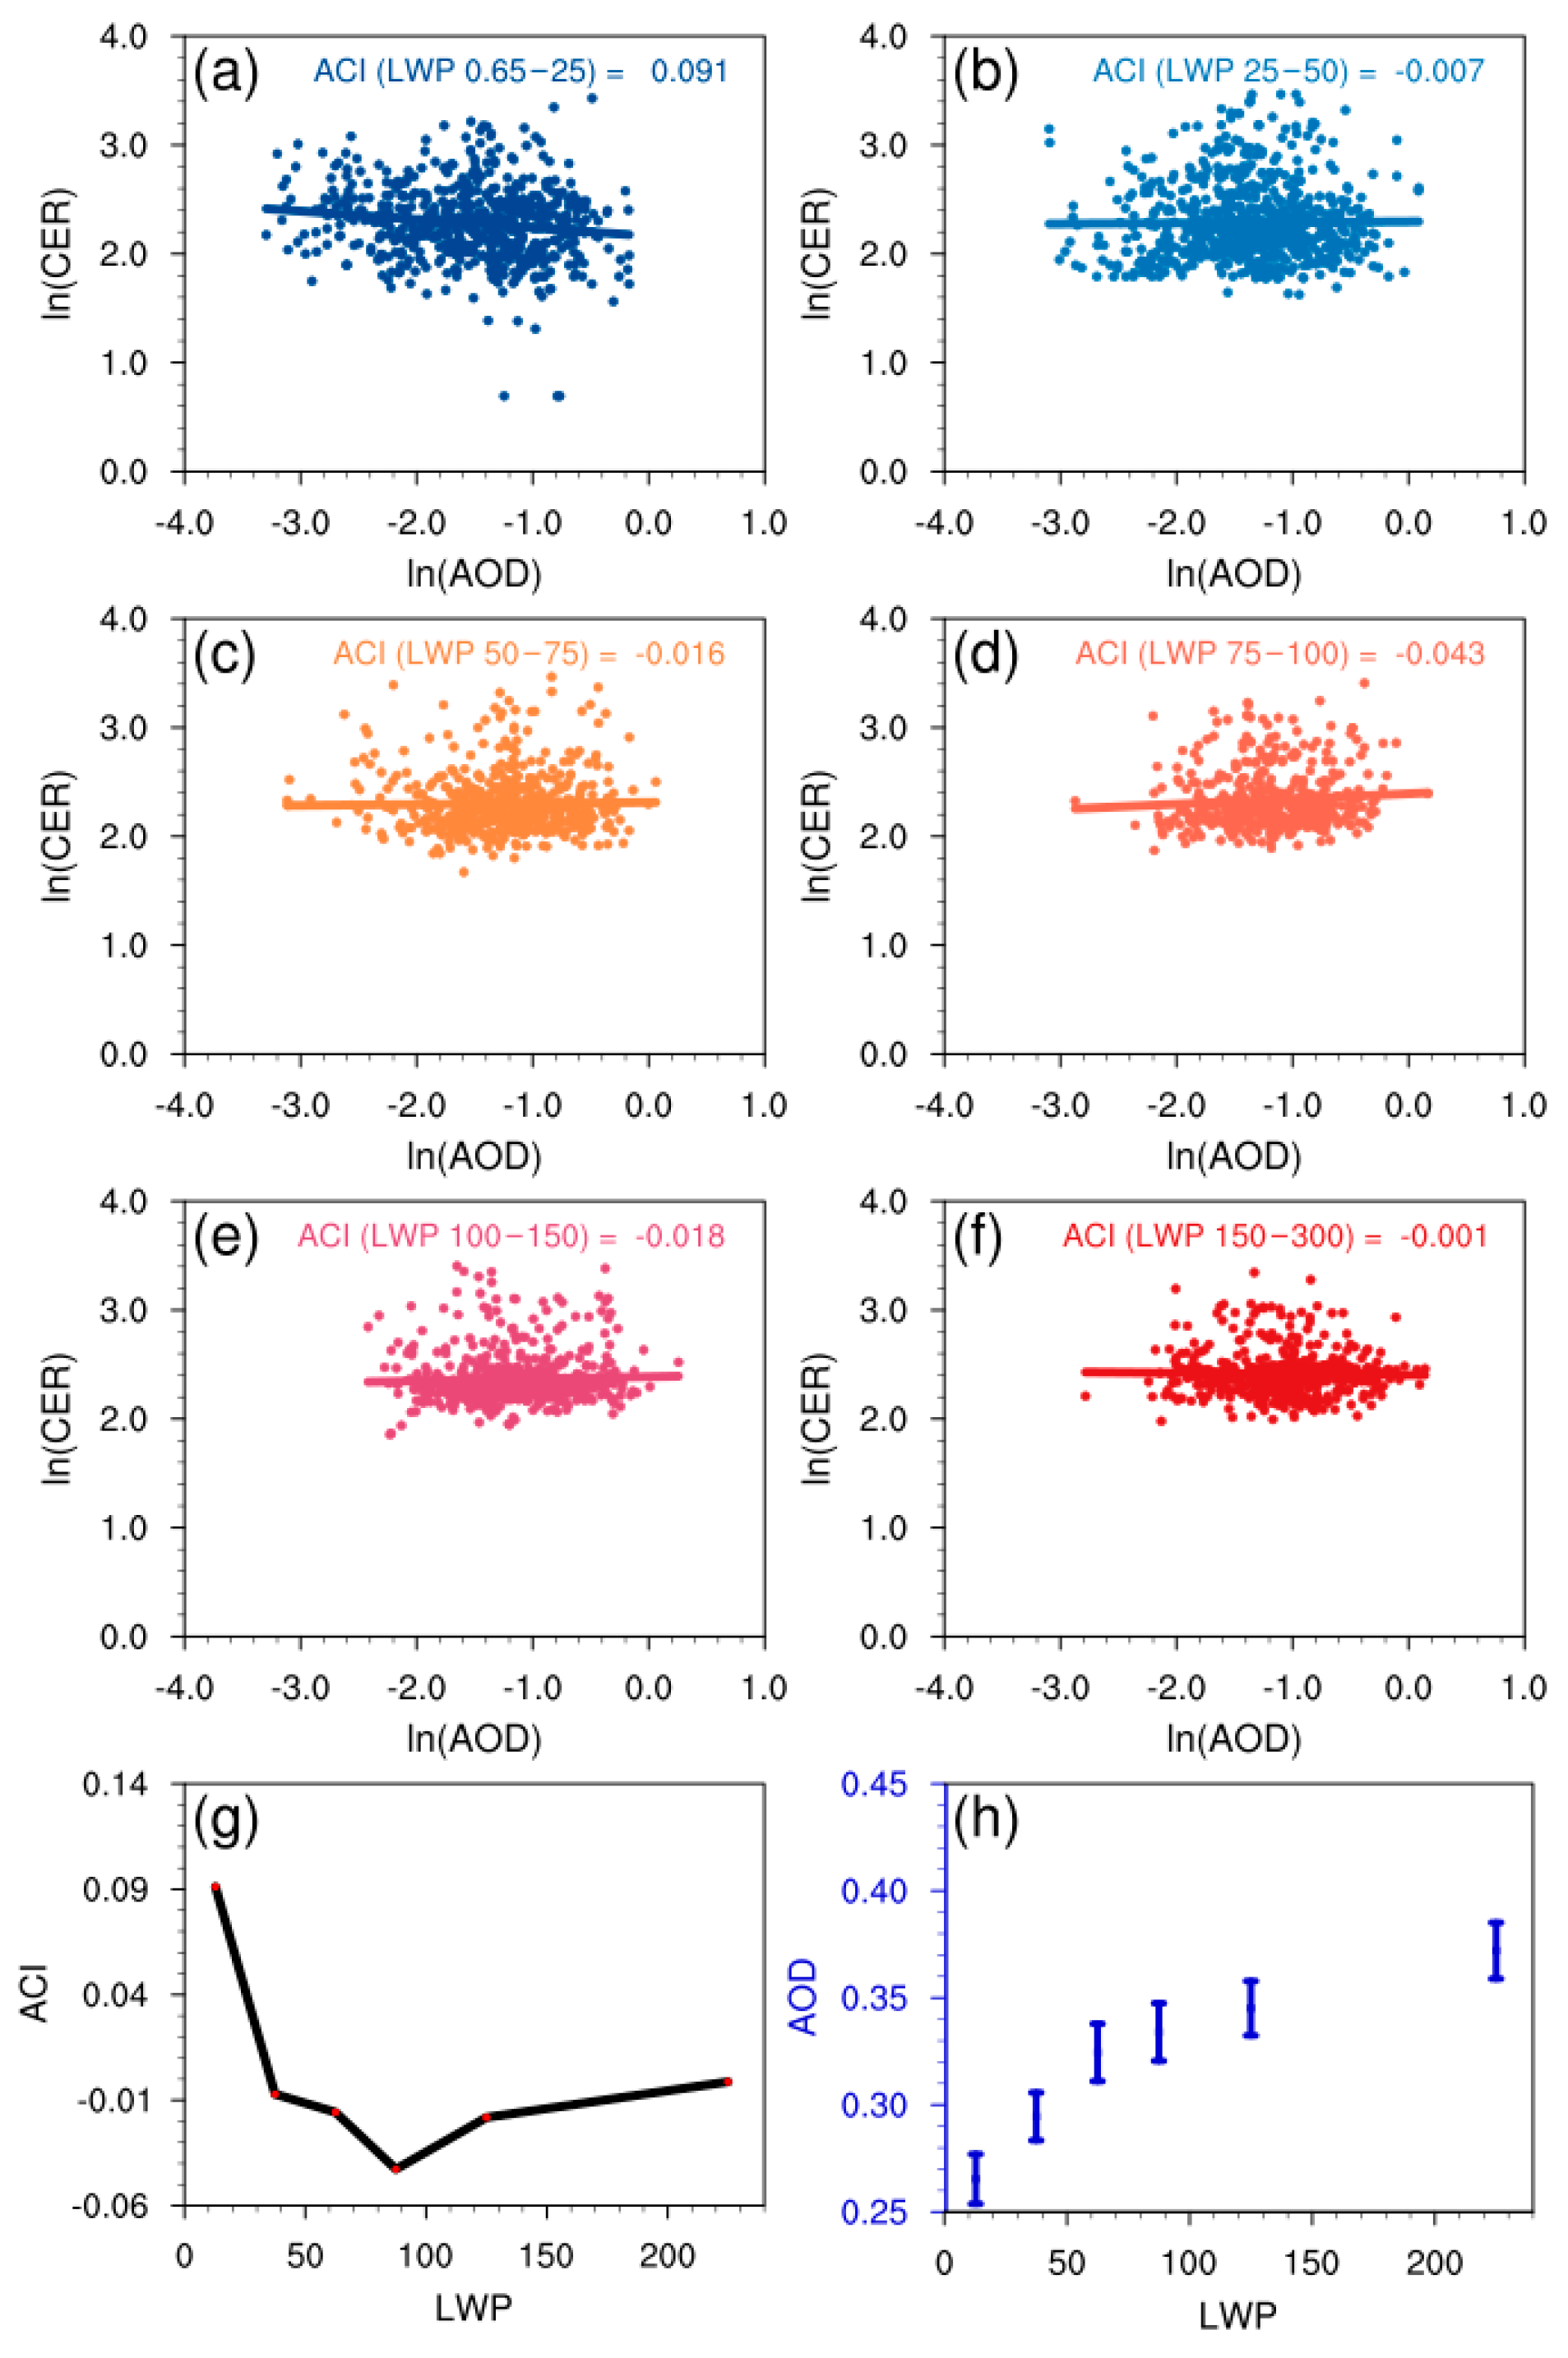
3.5.2. ACI Under LWP Constraint

We divided the six LWP bins by sample size, including 0.65–25 g/m2, 25–50 g/m2, 50–75 g/m2, 75–100 g/m2, 100–150 g/m2, and 150–300 g/m2. The analysis reveals distinct patterns of ACI across three different LWP regimes (Figure 6). Under a low-LWP regime (0.65–25 g/m2), positive ACI index values indicate that increased aerosol loading leads to smaller cloud droplets due to competition for limited water vapor (Figure 6a). As LWP increases, the ACI index values become negative, suggesting that increased aerosol loading promotes cloud droplet growth due to the increased availability of water vapor. This effect is weak at 25–50 g/m2 (ACI = −0.007, Figure 6b) but strengthens in the 50–75 g/m2 range (ACI = −0.016, Figure 6c) and peaks at 75–100 g/m2 (ACI = −0.043, Figure 6d). ACI values remain negative but weaken in the 100–150 g/m2 range (ACI = −0.018, Figure 6e). However, in high-LWP conditions (150–300 g/m2), ACI index values return to near zero (ACI = −0.001), as the collision–coalescence process becomes dominant (Figure 6f). This process leads to cloud droplets growing large enough to break away from the cloud, offsetting the increase in CER caused by hygroscopic growth. The relationship between ACI and LWP shows a quasi-U-shaped pattern in Figure 6g, with AOD exhibiting a steady increase with LWP in Figure 6h. This complex relationship highlights the crucial role of water vapor availability in determining the nature of ACI.

3.5.3. Changes in Cloud Micro- and Macrophysical Properties

Figure 7 and Figure 8 illustrate the influence of aerosol loading on various cloud micro- and macrophysical properties under different PC1 and LWP constraints. Under favorable meteorological conditions, characterized by low PC1 values, increasing aerosol concentrations lead to an initial rapid rise in CER, which subsequently stabilizes, accompanied by a slight inverse relationship with Albedo. Additionally, COD and LWP exhibit modest increases, while CGT and CF are enhanced due to reduced precipitation efficiency. In contrast, under unfavorable conditions with high PC1, the response patterns differ notably. CER decreases with rising aerosol loading, while Albedo demonstrates a strong positive correlation with aerosol concentration, with a fitting curve index of approximately 1.12. COD and LWP, initially minimal, exhibit increasing trends, and overall, the macrophysical properties of clouds are enhanced despite the unfavorable initial conditions.
Further analysis using LWP as a constraint reveals similarly complex yet distinct patterns, particularly under low LWP, where limited water vapor results in significant CER reductions and pronounced Albedo increases (fitting index equal 1.39). LWP strongly constrains COD, with a minimal aerosol impact on both of them within LWP bins. Higher aerosol loading reduces the collision and coalescence rate of droplets, suppressing precipitation formation, prolonging cloud lifetimes, and thickening the cloud layer. Notably, the systematic trends observed under PC1 binning suggest that PC1 provides a more effective framework for constraining ACI than LWP. This is reflected in the more coherent responses of cloud properties under varying aerosol loading within the PC1 framework.

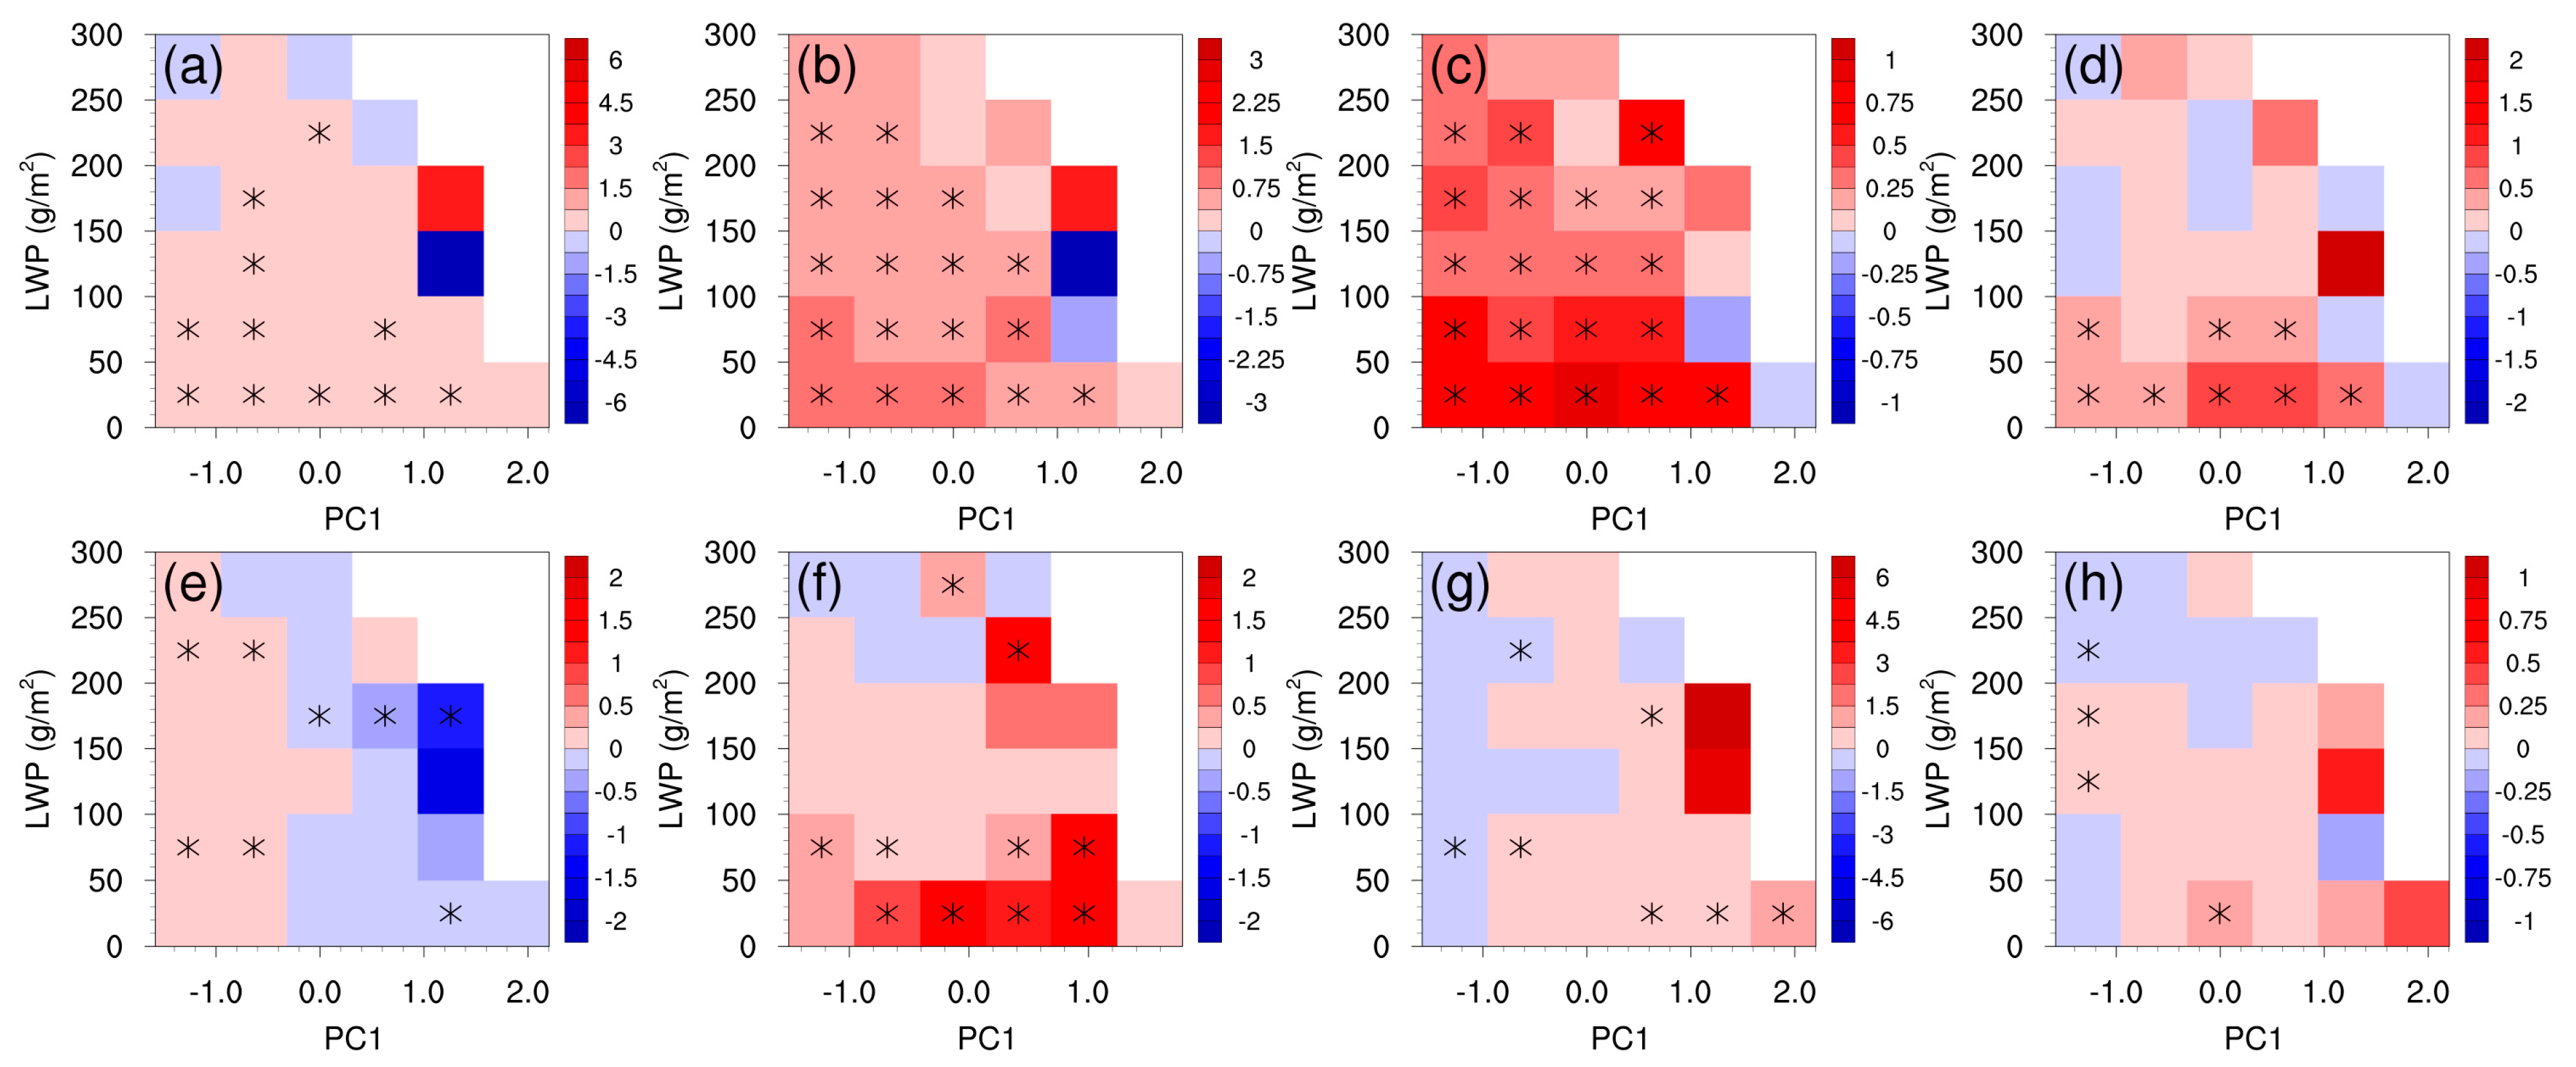
3.6. ACI Under Dual Constraints of PC1 and LWP

The single-constraint analysis of either PC1 or LWP reveals fluctuations in the relationships between aerosols and cloud properties, suggesting that individual constraints may not fully capture the complexity of ACI. To address this limitation, we examined ACI under the combined constraints of PC1 and LWP.
Figure 9 displays the correlation coefficients between the low-level cloud macro-microphysical properties and the AOD under different intervals of PC1 and LWP. The correlation coefficients of CER and AOD exhibit a clear division between positive and negative, with positive coefficients primarily distributed in PC1 < −0.3 (Figure 9e). The strength of these positive correlations further enhances as LWP increases. This pattern suggests that under favorable meteorological conditions (low PC1) with sufficient water vapor supply (high LWP), increased aerosol loading promotes cloud droplet growth. Conversely, negative correlations prevail when PC1 > −0.3, particularly under low-LWP conditions, indicating that increased aerosols lead to smaller cloud droplets due to competition for limited water vapor. The correlation patterns show stronger variations along the PC1 axis compared to the LWP axis, indicating that meteorological conditions exert a more dominant influence on ACI than water vapor availability alone. This highlights the crucial role of meteorological conditions in modulating ACI. Albedo shows predominantly positive correlations with AOD across most conditions, except for regions with low PC1 and high LWP (Figure 9f). The COD and LWP exhibit similar correlation patterns with AOD (Figure 9g,h), characterized by stronger negative correlations under conditions of low PC1 and high LWP, transitioning to stronger positive correlations in the opposite scenario. The macrophysical properties of low-level clouds (CF, CGT, and CTH) generally maintain positive correlations with AOD across different constraint combinations. However, CBH presents a unique pattern, showing negative correlations with AOD under conditions of low PC1 and high LWP (Figure 9d), suggesting that aerosol loading may promote the formation of lower clouds under favorable meteorological conditions.
To quantify these relationships more precisely, we performed linear regression analysis on the logarithmic values of cloud properties and AOD within each PC1-LWP bin (Figure 10). The regression coefficient between ln(CER) and ln(AOD) shows the most pronounced transition, with regression coefficients ranging from strongly positive (when PC1 < −0.3) to strongly negative (minimum value of −1.64) as meteorological conditions become less favorable (Figure 10e). The regression coefficient between ln(Albedo) and ln(AOD) is negative only when LWP > 200 g/m2 (Figure 10f). In contrast, the positive regression coefficients of ln(Albedo) and ln(AOD) increase with higher PC1 and lower LWP, reaching a maximum value of 1.51. The regression coefficients of ln(COD), ln(LWP), and ln(AOD) have similar distributions, with maximum positive coefficients of 6.21 and 0.53, respectively, under high-PC1 conditions, indicating enhanced cloud optical thickness and water content with increased aerosol loading. However, these maximum coefficients do not pass the 95% significance test, indicating that while a positive relationship exists, the statistical confidence is limited. The regression coefficients between the logarithms of cloud macrophysical properties and AOD are predominantly positive and statistically significant at the 95% confidence level, suggesting a consistent enhancement of cloud macrophysical properties with increased aerosol loading across most conditions.
This dual-constraint analysis reveals the complex interplay between meteorological conditions and water vapor in determining the nature and strength of ACI. These findings emphatically demonstrate that a comprehensive understanding of aerosol effects on cloud properties necessitates simultaneous consideration of both meteorological conditions and water vapor as key modulating factors.

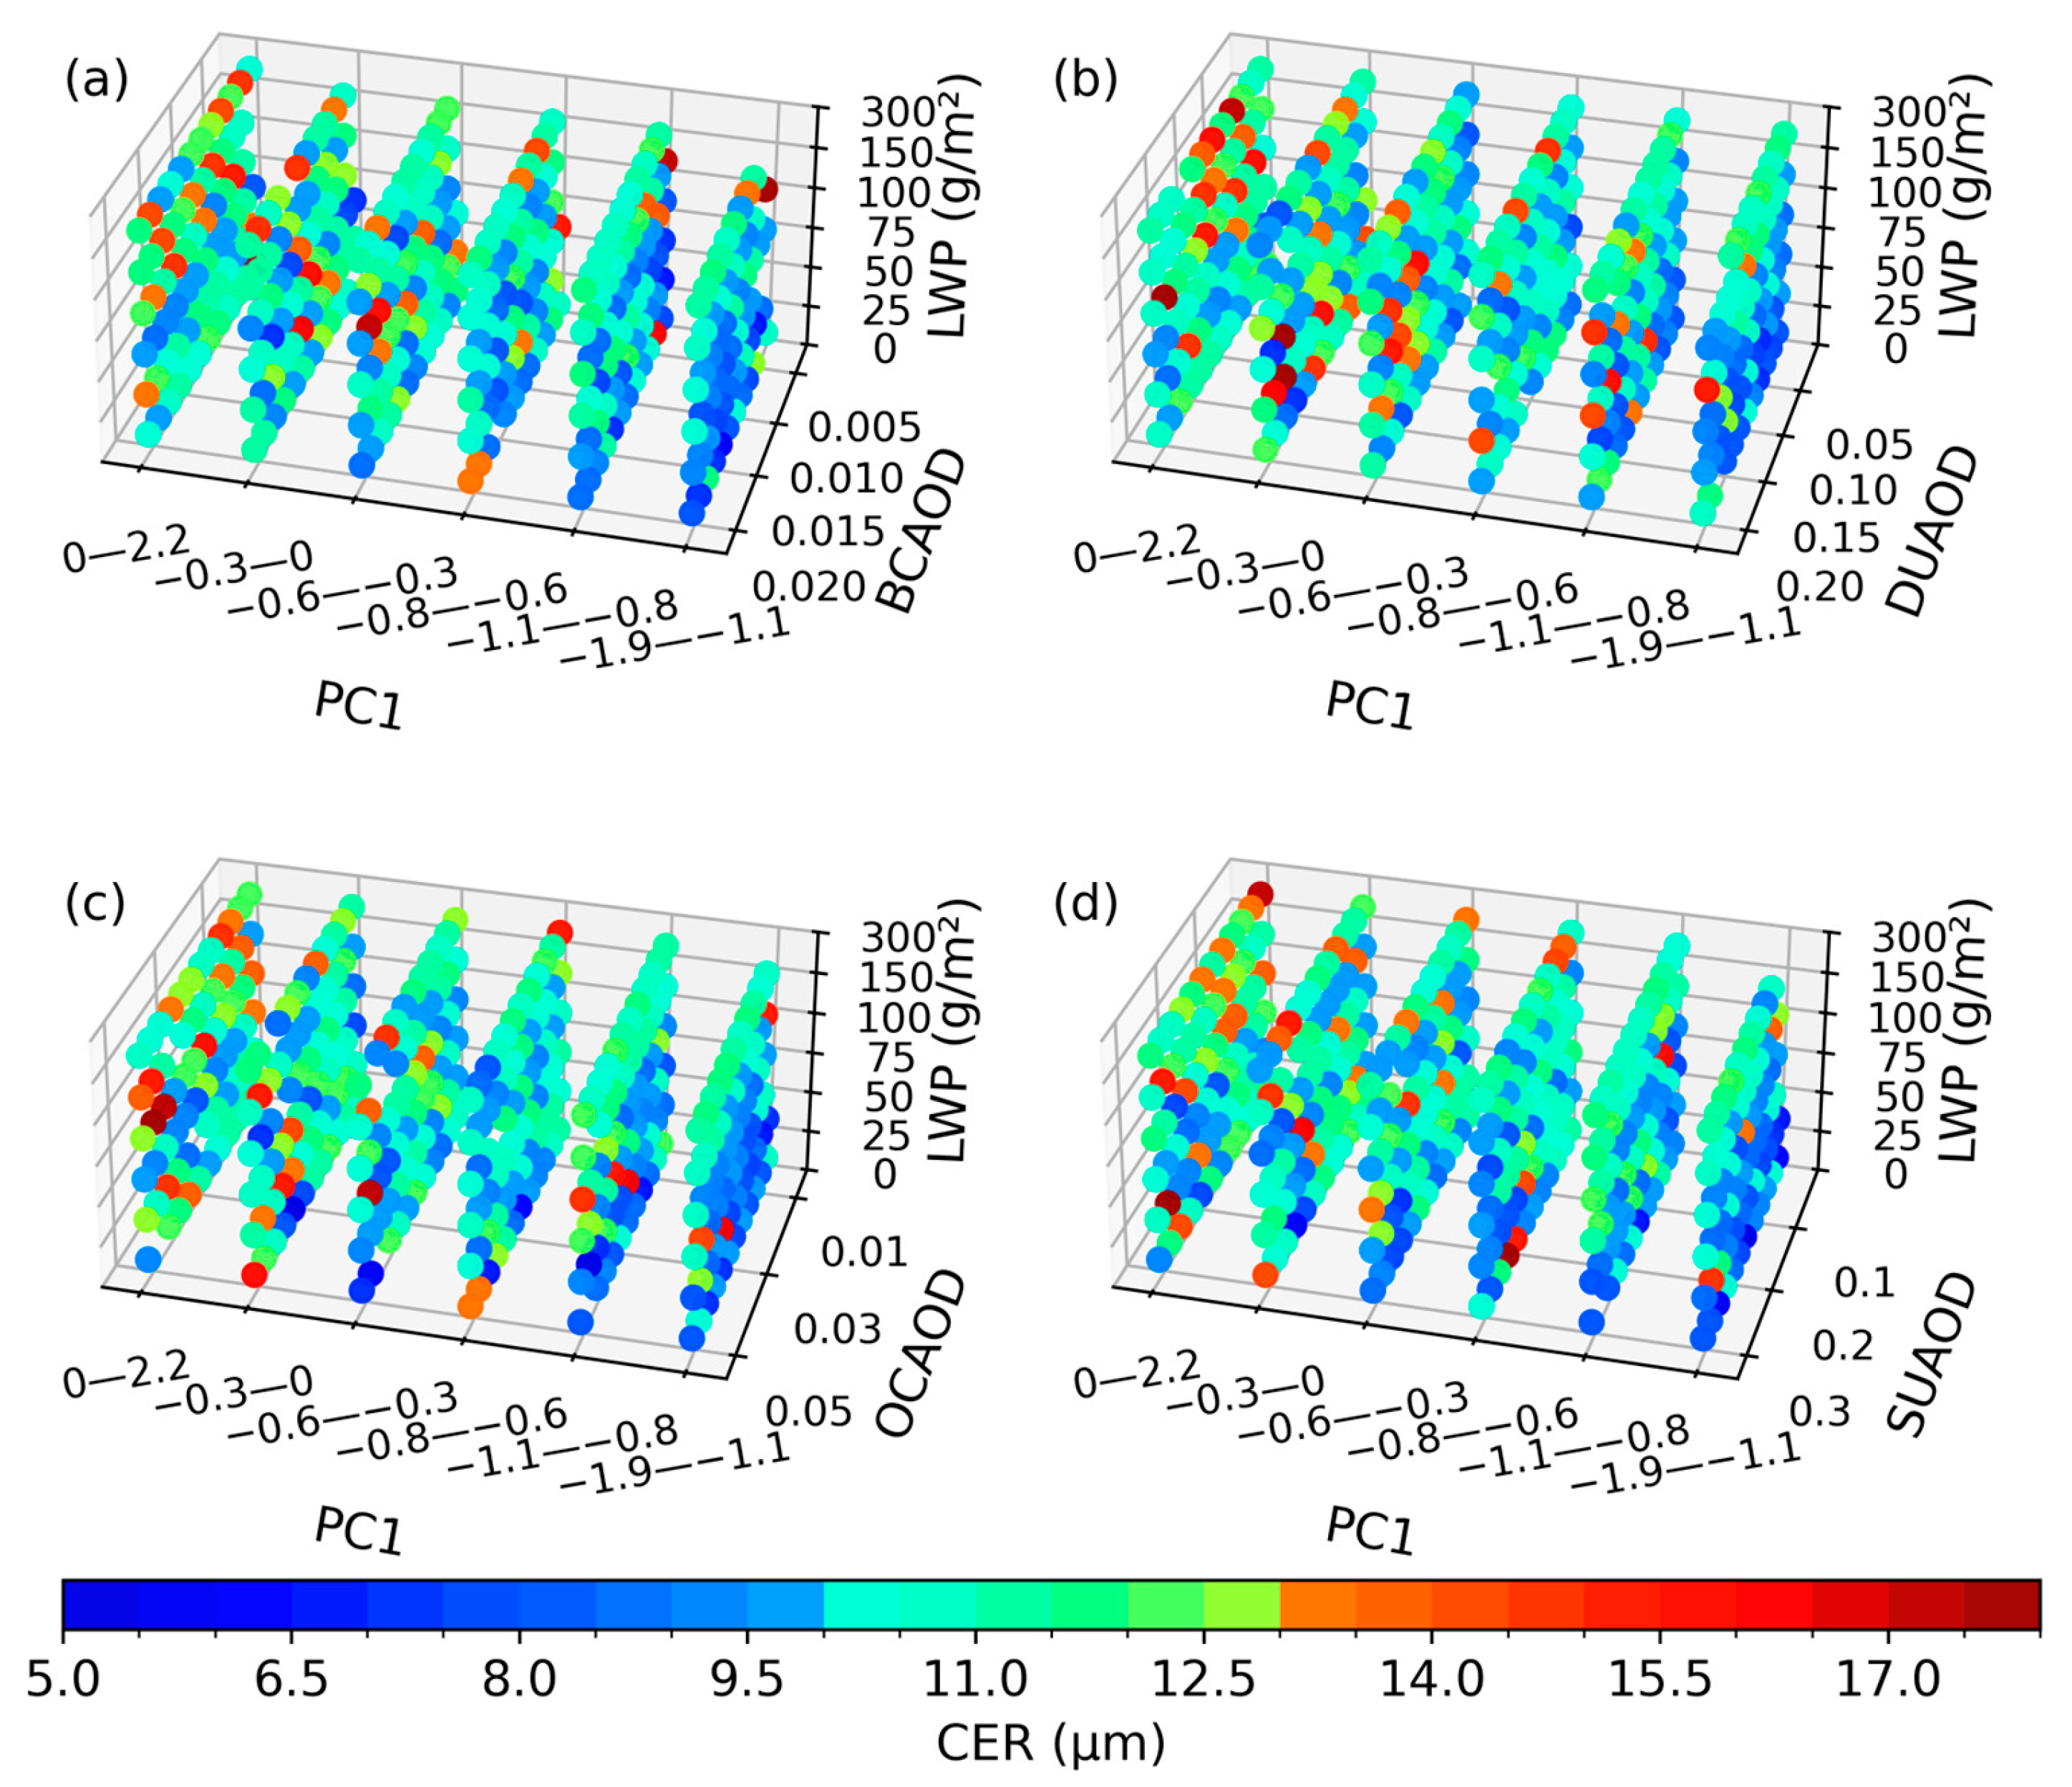
3.7. Impact of Aerosol Type on ACI Under Dual Constraints

Aerosol type, an important factor affecting cloud development, should be considered in the relationship between aerosol and low-level cloud properties. There are four aerosol types: black carbon and organic carbon, which highly absorb sunlight; dust aerosols with large particle sizes; and sulfate, which reflects incoming sunlight and acts as cloud condensation nuclei, seeding clouds. CER is a key variable in influencing cloud microphysical processes. As mentioned above, the relationship between CER and AOD becomes more evident under the dual constraints of PC1 and LWP. Therefore, we analyzed the variations in CER across different PC1, LWP, and different aerosol types of AOD, as illustrated in Figure 11. Across all aerosol types, lower PC1 values correspond to smaller CER, indicating atmospheric conditions that favor low-level cloud formation but result in smaller droplets. Additionally, LWP exhibits a positive correlation with CER, as greater liquid water availability enables the formation of larger cloud droplets through condensation.
However, each aerosol type exhibits distinct effects on cloud properties:
  • Black carbon (Figure 11a): Even under high-LWP conditions, CER remains relatively small at peak black carbon aerosol optical depth (BCAOD) values, suggesting that black carbon inhibits droplet growth despite sufficient water vapor, likely due to enhanced droplet evaporation.
  • Dust aerosols (Figure 11b): Under favorable meteorological conditions, an increased dust aerosol optical depth (DUAOD) correlates with larger CER values, suggesting that dust particles may serve as effective ice nuclei that promote droplet growth through heterogeneous freezing processes [70]. However, in unfavorable meteorological conditions, dust appears to reduce CER, suggesting that the impact of meteorological conditions may outweigh the effects of dust.
  • Organic carbon (Figure 11c): Similar to black carbon, higher organic carbon aerosol optical depth (OCAOD) values correspond to lower CER, especially when PC1 ranges from −0.6 to −0.3. Organic carbon can be activated as CCN, resulting in more numerous but smaller droplets.
  • Sulfate aerosols (Figure 11d): A higher sulfate aerosol optical depth (SUAOD) correlates with smaller droplet sizes, particularly at low LWP, indicating that sulfate aerosols generate numerous smaller droplets by acting as CCN, thereby inhibiting droplet growth due to competition for limited water vapor.
These findings highlight that while absorbing aerosols (black carbon and organic carbon) and sulfate tend to reduce CER, dust aerosols may enhance it. These varying impacts underscore the complex nature of aerosol–cloud interactions, which are further modulated by meteorological conditions and water vapor availability. Future research should examine additional aerosol effects on clouds, particularly regarding radiation and precipitation, within the context of these restrictive conditions.

4. Discussion

Compared to previous studies that constrained individual meteorological parameters [71,72], our use of PCA-derived PC1 more effectively captures the covariation structure among key meteorological variables, which improves the representation of atmospheric conditions. The stronger systematic responses of cloud properties to aerosol variations observed under PC1 constraints compared to LWP constraints further emphasize that meteorological conditions may play a more deterministic role in influencing ACI than previously recognized [17,73]. Our findings regarding aerosol absorption regimes provide critical insights into how aerosol radiative properties affect cloud formation. Strongly absorbing aerosols suppress low-level cloud development through atmospheric heating, consistent with the “semi-direct effect” described in previous studies [74,75]. Our observation of a quasi-U-shaped relationship between the ACI index and LWP reconciles seemingly contradictory results in the previous literature. Feingold et al. [73] reported positive ACI values in water-limited environments, while Tang et al. [31] found negative values in water-abundant scenarios.
In conclusion, our study highlights the critical importance of simultaneously constraining meteorological conditions and water vapor availability when investigating aerosol–cloud interactions. The complex dependence of ACI on these factors suggests that much of the uncertainty in current climate projections may stem from oversimplified representations of these relationships. Future research should focus on developing more sophisticated parameterizations that capture these dependencies across diverse atmospheric conditions and water vapor availability, which are critical for regional weather systems and climate feedbacks.

5. Conclusions

This study quantitatively investigates the dependence of low-level cloud macro- and micro-physical properties on aerosol loading at the SACOL site. The analysis utilizes long-term continuous observation from KAZR to select low-level cloud cases and derive their macrophysical properties, while CERES data are used to obtain cloud microphysical properties concurrently. To better account for the complex meteorological influences on ACI, PCA is applied to derive PC1, which represents the primary mode of variability in meteorological conditions. By constraining both PC1 and LWP in our analysis, we effectively minimize meteorological interference and isolate the water vapor effects when examining the impact of aerosols on cloud properties.
Low-level clouds at the SACOL site primarily concentrate between 1.2 and 2.2 km altitudes. Cloud formation is significantly influenced by relative humidity, temperature, wind shear at 775 hPa, and the height of LCL, which can be combined into a single PC1 variable through PCA. Lower PC1 values (characterized by lower LCL, higher humidity, lower temperature, and stronger wind shear) create more favorable conditions for low-level cloud formation. Moreover, PC1 shows a stronger comprehensive correlation with low-level cloud properties than any individual meteorological parameter, which enables us to better constrain meteorological effects when investigating ACI.
Seasonal aerosol properties analysis shows predominantly fine-mode, weakly absorbing particles year-round, except during spring (more coarse-mode dust aerosols) and winter (increased absorbing carbonaceous aerosols). Cloud properties vary significantly between absorption regimes. Strongly absorbing aerosols heat the atmosphere and suppress low-level cloud development, resulting in decreased LWP, CER, and COD while also reducing CF, CGT, and CTH. Reduced CTH ultimately lowers cloud albedo as solar radiation experiences greater atmospheric attenuation.
Meteorological conditions and water vapor availability fundamentally modulate the magnitude and sensitivity of ACI. Under favorable meteorological conditions (low PC1: −1.9 to −0.8), CER increases despite higher aerosol loading; under unfavorable conditions (high PC1: −0.3 to 2.2), even lower aerosol concentrations lead to decreased CER. The ACI-LWP relationship shows a quasi-U-shaped pattern across three regimes. At low LWP (0.65–25 g/m2), competition for limited water vapor creates positive ACI values as aerosols produce smaller droplets. At moderate LWP (25–150 g/m2), the ACI index becomes negative, peaking at 75–100 g/m2, as aerosols enhance droplet growth with increased water vapor availability. At high LWP (150–300 g/m2), ACI returns to near zero when collision–coalescence dominates and larger droplets precipitate out.
Under single constraints, aerosol impacts on low-level cloud properties vary with meteorological conditions, represented by PC1, and water availability, represented by LWP. Under favorable meteorological conditions (low PC1), increasing aerosols initially enhance CER while slightly decreasing Albedo, with moderate increases in COD, LWP, CGT, and CF due to reduced precipitation efficiency. Under unfavorable conditions (high PC1), aerosols produce smaller droplets but significantly increase albedo (fitting index = 1.12) while enhancing cloud macrophysical properties. When constrained by LWP, limited water vapor conditions lead to decreased droplet size and enhanced Albedo (fitting index = 1.39), with aerosols extending cloud lifetime and thickness by suppressing precipitation. Notably, PC1 constraints reveal more systematic responses in cloud properties to aerosol variations than LWP constraints, indicating that meteorological conditions provide more effective constraints on ACI.
The dual-constraint approach (PC1 and LWP) reveals more pronounced aerosol effects on cloud properties than single constraints. Under favorable meteorological conditions with high LWP, increased aerosol loading promotes cloud droplet growth, while the opposite occurs under less favorable conditions with limited water vapor. While most cloud macrophysical properties show consistently positive correlations with AOD, CBH demonstrates a unique negative correlation under conditions of low PC1 and high LWP. Regression analysis confirms systematic variations in aerosol effects across different meteorological and moisture conditions.
Different aerosol types affect cloud microphysical properties distinctly—black carbon reduces CER through enhanced droplet evaporation, dust generally increases CER under favorable meteorological conditions, organic carbon shows suppressive effects similar to black carbon, and sulfate consistently decreases CER across all conditions—highlighting the critical role of the aerosol chemical composition in cloud–aerosol interactions.

Author Contributions

Conceptualization, J.G. and Q.L.; methodology, Q.L.; software, Q.L.; validation, Y.L., Q.M., N.P. and J.S.; formal analysis, Q.L.; investigation, Q.L.; resources, Q.L.; data curation, Q.L.; writing—original draft preparation, Q.L.; writing—review and editing, B.W., C.Z. and B.L.; visualization, Q.L.; supervision, J.G.; project administration, J.G.; funding acquisition, J.G. All authors have read and agreed to the published version of the manuscript.

Funding

This research was funded by the National Science Foundation of China (42275076 and 41875028), the Science and Technology Projects of Gansu Province (22JR5RA398), and the Fundamental Research Funds for the Central Universities (lzujbky-2022-ct06).

Data Availability Statement

The KAZR data are available from http://climate.lzu.edu.cn (accessed on 1 October 2024). CERES data are available from https://ceres-tool.larc.nasa.gov/ord-tool/ (accessed on 5 October 2024). MERRA-2 data are available from https://disc.gsfc.nasa.gov/datasets/ (accessed on 10 October 2024). ERA5 data are available from https://cds.climate.copernicus.eu/datasets/ (accessed on 10 October 2024).

Conflicts of Interest

The authors declare no conflicts of interest.

References

  1. Duveiller, G.; Filipponi, F.; Ceglar, A.; Bojanowski, J.; Alkama, R.; Cescatti, A. Revealing the widespread potential of forests to increase low level cloud cover. Nat. Commun. 2021, 12, 4337. [Google Scholar] [CrossRef] [PubMed]
  2. Liu, H.; Koren, I.; Altaratz, O.; Chekroun, M.D. Opposing trends of cloud coverage over land and ocean under global warming. Atmos. Chem. Phys. 2023, 23, 6559–6569. [Google Scholar] [CrossRef]
  3. Kamae, Y.; Watanabe, M.; Ogura, T.; Yoshimori, M.; Shiogama, H. Rapid Adjustments of Cloud and Hydrological Cycle to Increasing CO: A Review. Curr. Clim. Change Rep. 2015, 1, 103–113. [Google Scholar] [CrossRef]
  4. Kristjánsson, J.E.; Muri, H.; Schmidt, H. The hydrological cycle response to cirrus cloud thinning. Geophys. Res. Lett. 2015, 42, 10807–10815. [Google Scholar] [CrossRef]
  5. Wang, Y.X.; Yang, S.X.; Chen, G.X.; Bao, Q.; Li, J.D. Evaluating two diagnostic schemes of cloud-fraction parameterization using the CloudSat data. Atmos. Res. 2023, 282, 106510. [Google Scholar] [CrossRef]
  6. Naud, C.M.; Elsaesser, G.S.; Booth, J.F. Dominant Cloud Controlling Factors for Low-Level Cloud Fraction: Subtropical Versus Extratropical Oceans. Geophys. Res. Lett. 2023, 50, e2023GL104496. [Google Scholar] [CrossRef]
  7. Leahy, L.V.; Wood, R.; Charlson, R.J.; Hostetler, C.A.; Rogers, R.R.; Vaughan, M.A.; Winker, D.M. On the nature and extent of optically thin marine low clouds. J. Geophys. Res.-Atmos. 2012, 117, D22201. [Google Scholar] [CrossRef]
  8. Nuijens, L.; Serikov, I.; Hirsch, L.; Lonitz, K.; Stevens, B. The distribution and variability of low-level cloud in the North Atlantic trades. Q. J. Roy. Meteor. Soc. 2014, 140, 2364–2374. [Google Scholar] [CrossRef]
  9. Sun, F.; Hall, A.; Qu, X. On the relationship between low cloud variability and lower tropospheric stability in the Southeast Pacific. Atmos. Chem. Phys. 2011, 11, 9053–9065. [Google Scholar] [CrossRef]
  10. Murray, B.J.; Carslaw, K.S.; Field, P.R. Opinion: Cloud-phase climate feedback and the importance of ice-nucleating particles. Atmos. Chem. Phys. 2021, 21, 665–679. [Google Scholar] [CrossRef]
  11. Klein, S.A.; Hall, A.; Norris, J.R.; Pincus, R. Low-Cloud Feedbacks from Cloud-Controlling Factors: A Review. Surv. Geophys. 2017, 38, 1307–1329. [Google Scholar] [CrossRef]
  12. Twomey, S. The Influence of Pollution on the Shortwave Albedo of Clouds. J. Atmos. Sci. 1977, 34, 1149–1152. [Google Scholar] [CrossRef]
  13. Ramanathan, V.; Crutzen, P.J.; Kiehl, J.T.; Rosenfeld, D. Atmosphere—Aerosols, climate, and the hydrological cycle. Science 2001, 294, 2119–2124. [Google Scholar] [CrossRef]
  14. Saleeby, S.M.; Herbener, S.R.; van den Heever, S.C.; L’Ecuyer, T. Impacts of Cloud Droplet-Nucleating Aerosols on Shallow Tropical Convection. J. Atmos. Sci. 2015, 72, 1369–1385. [Google Scholar] [CrossRef]
  15. Albrecht, B.A. Aerosols, Cloud Microphysics, and Fractional Cloudiness. Science 1989, 245, 1227–1230. [Google Scholar] [CrossRef] [PubMed]
  16. Wang, Y.; Vogel, J.M.; Lin, Y.; Pan, B.W.; Hu, J.X.; Liu, Y.G.; Dong, X.Q.; Jiang, J.H.; Yung, Y.L.; Zhang, R.Y. Aerosol microphysical and radiative effects on continental cloud ensembles. Adv. Atmos. Sci. 2018, 35, 234–247. [Google Scholar] [CrossRef]
  17. McComiskey, A.; Feingold, G.; Frisch, A.S.; Turner, D.D.; Miller, M.A.; Chiu, J.C.; Min, Q.L.; Ogren, J.A. An assessment of aerosol-cloud interactions in marine stratus clouds based on surface remote sensing. J. Geophys. Res.-Atmos. 2009, 114, D09203. [Google Scholar] [CrossRef]
  18. Feingold, G.; Furrer, R.; Pilewskie, P.; Remer, L.A.; Min, Q.L.; Jonsson, H. Aerosol indirect effect studies at Southern Great Plains during the May 2003 Intensive Operations Period. J. Geophys. Res.-Atmos. 2006, 111, D05s14. [Google Scholar] [CrossRef]
  19. Costantino, L.; Bréon, F.M. Analysis of aerosol-cloud interaction from multi-sensor satellite observations. Geophys. Res. Lett. 2010, 37, L11801. [Google Scholar] [CrossRef]
  20. Quaas, J.; Boucher, O.; Bellouin, N.; Kinne, S. Satellite-based estimate of the direct and indirect aerosol climate forcing. J. Geophys. Res.-Atmos. 2008, 113, D05204. [Google Scholar] [CrossRef]
  21. Michibata, T.; Kawamoto, K.; Takemura, T. The effects of aerosols on water cloud microphysics and macrophysics based on satellite-retrieved data over East Asia and the North Pacific. Atmos. Chem. Phys. 2014, 14, 11935–11948. [Google Scholar] [CrossRef]
  22. Breon, F.M.; Tanre, D.; Generoso, S. Aerosol effect on cloud droplet size monitored from satellite. Science 2002, 295, 834–838. [Google Scholar] [CrossRef]
  23. Zhao, C.F.; Qiu, Y.M.; Dong, X.B.; Wang, Z.E.; Peng, Y.R.; Li, B.D.; Wu, Z.H.; Wang, Y. Negative Aerosol-Cloud re Relationship From Aircraft Observations Over Hebei, China. Earth Space Sci. 2018, 5, 19–29. [Google Scholar] [CrossRef]
  24. Twohy, C.H.; Anderson, J.R.; Toohey, D.W.; Andrejczuk, M.; Adams, A.; Lytle, M.; George, R.C.; Wood, R.; Saide, P.; Spak, S.; et al. Impacts of aerosol particles on the microphysical and radiative properties of stratocumulus clouds over the southeast Pacific Ocean. Atmos. Chem. Phys. 2013, 13, 2541–2562. [Google Scholar] [CrossRef]
  25. Painemal, D.; Zuidema, P. The first aerosol indirect effect quantified through airborne remote sensing during VOCALS-REx. Atmos. Chem. Phys. 2013, 13, 917–931. [Google Scholar] [CrossRef]
  26. Lu, C.S.; Liu, Y.G.; Niu, S.J.; Vogelmann, A.M. Observed impacts of vertical velocity on cloud microphysics and implications for aerosol indirect effects. Geophys. Res. Lett. 2012, 39, L21808. [Google Scholar] [CrossRef]
  27. Wang, Y.Y.; Li, Z.Q.; Zhang, Y.J.; Du, W.; Zhang, F.; Tan, H.B.; Xu, H.B.; Fan, T.Y.; Jin, X.A.; Fan, X.X.; et al. Characterization of aerosol hygroscopicity, mixing state, and CCN activity at a suburban site in the central North China Plain. Atmos. Chem. Phys. 2018, 18, 11739–11752. [Google Scholar] [CrossRef]
  28. Dusek, U.; Frank, G.P.; Hildebrandt, L.; Curtius, J.; Schneider, J.; Walter, S.; Chand, D.; Drewnick, F.; Hings, S.; Jung, D.; et al. Size matters more than chemistry for cloud-nucleating ability of aerosol particles. Science 2006, 312, 1375–1378. [Google Scholar] [CrossRef]
  29. Andreae, M.O.; Rosenfeld, D. Aerosol-cloud-precipitation interactions. Part 1. The nature and sources of cloud-active aerosols. Earth-Sci. Rev. 2008, 89, 13–41. [Google Scholar] [CrossRef]
  30. Koren, I.; Feingold, G.; Remer, L.A. The invigoration of deep convective clouds over the Atlantic: Aerosol effect, meteorology or retrieval artifact? Atmos. Chem. Phys. 2010, 10, 8855–8872. [Google Scholar] [CrossRef]
  31. Tang, J.P.; Wang, P.C.; Mickley, L.J.; Xia, X.G.; Liao, H.; Yue, X.; Sun, L.; Xia, J.R. Positive relationship between liquid cloud droplet effective radius and aerosol optical depth over Eastern China from satellite data. Atmos. Environ. 2014, 84, 244–253. [Google Scholar] [CrossRef]
  32. Zhang, X.; Wang, H.; Che, H.Z.; Tan, S.C.; Yao, X.P.; Peng, Y.; Shi, G.Y. Radiative forcing of the aerosol-cloud interaction in seriously polluted East China and East China Sea. Atmos. Res. 2021, 252, 105405. [Google Scholar] [CrossRef]
  33. Nakajima, T.; Higurashi, A.; Kawamoto, K.; Penner, J.E. A possible correlation between satellite-derived cloud and aerosol microphysical parameters. Geophys. Res. Lett. 2001, 28, 1171–1174. [Google Scholar] [CrossRef]
  34. Pawlowska, H.; Brenguier, J.L. Microphysical properties of stratocumulus clouds during ACE-2. Tellus B 2000, 52, 868–887. [Google Scholar] [CrossRef]
  35. Kant, S.; Panda, J.; Gautam, R. A seasonal analysis of aerosol-cloud-radiation interaction over Indian region during 2000–2017. Atmos. Environ. 2019, 201, 212–222. [Google Scholar] [CrossRef]
  36. Yuan, T.L.; Li, Z.Q.; Zhang, R.Y.; Fan, J.W. Increase of cloud droplet size with aerosol optical depth: An observation and modeling study. J. Geophys. Res.-Atmos. 2008, 113, D04201. [Google Scholar] [CrossRef]
  37. Fan, J.W.; Zhang, R.Y.; Li, G.H.; Tao, W.K. Effects of aerosols and relative humidity on cumulus clouds. J. Geophys. Res.-Atmos. 2007, 112, D14204. [Google Scholar] [CrossRef]
  38. Li, Z.Q.; Niu, F.; Fan, J.W.; Liu, Y.G.; Rosenfeld, D.; Ding, Y.N. Long-term impacts of aerosols on the vertical development of clouds and precipitation. Nat. Geosci. 2011, 4, 888–894. [Google Scholar] [CrossRef]
  39. Engström, A.; Ekman, A.M.L. Impact of meteorological factors on the correlation between aerosol optical depth and cloud fraction. Geophys. Res. Lett. 2010, 37, L18814. [Google Scholar] [CrossRef]
  40. Mauger, G.S.; Norris, J.R. Meteorological bias in satellite estimates of aerosol-cloud relationships. Geophys. Res. Lett. 2007, 34, L16824. [Google Scholar] [CrossRef]
  41. Kim, Y.J.; Kim, B.G.; Miller, M.; Min, Q.L.; Song, C.K. Enhanced aerosol-cloud relationships in more stable and adiabatic clouds. Asia-Pac. J. Atmos. Sci. 2012, 48, 283–293. [Google Scholar] [CrossRef]
  42. Wang, G.Y.; Huang, J.P.; Guo, W.D.; Zuo, J.Q.; Wang, J.M.; Bi, J.R.; Huang, Z.W.; Shi, J.S. Observation analysis of land-atmosphere interactions over the Loess Plateau of northwest China. J. Geophys. Res.-Atmos. 2010, 115, D00k17. [Google Scholar] [CrossRef]
  43. Huang, J.P.; Zhang, W.; Zuo, J.Q.; Bi, J.R.; Shi, J.S.; Wang, X.; Chang, Z.L.; Huang, Z.W.; Yang, S.; Zhang, B.D.; et al. An Overview of the Semi-arid Climate and Environment Research Observatory over the Loess Plateau. Adv. Atmos. Sci. 2008, 25, 906–921. [Google Scholar] [CrossRef]
  44. Liu, Y.; Huang, J.; Shi, G.; Takamura, T.; Khatri, P.; Bi, J.; Shi, J.; Wang, T.; Wang, X.; Zhang, B. Aerosol optical properties and radiative effect determined from sky-radiometer over Loess Plateau of Northwest China. Atmos. Chem. Phys. 2011, 11, 11455–11463. [Google Scholar] [CrossRef]
  45. Bi, J.R.; Huang, J.P.; Fu, Q.A.; Wang, X.; Shi, J.S.; Zhang, W.; Huang, Z.W.; Zhang, B.D. Toward characterization of the aerosol optical properties over Loess Plateau of Northwestern China. J. Quant. Spectrosc. Radiat. Transf. 2011, 112, 346–360. [Google Scholar] [CrossRef]
  46. Huang, J.; Minnis, P.; Yan, H.; Yi, Y.; Chen, B.; Zhang, L.; Ayers, J.K. Dust aerosol effect on semi-arid climate over Northwest China detected from A-Train satellite measurements. Atmos. Chem. Phys. 2010, 10, 6863–6872. [Google Scholar] [CrossRef]
  47. Widener, K.B.; Bharadwaj, N.; Johnson, K.L. Ka-Band ARM Zenith Radar (KAZR) Instrument Handbook; Department of Energy, Office of Science, Office of Biological and Environmental Research: Washington, DC, USA, 2012. Available online: https://www.arm.gov/publications/tech_reports/handbooks/kazr_handbook.pdf (accessed on 15 October 2024).
  48. Ge, J.M.; Zhu, Z.; Zheng, C.; Xie, H.L.; Zhou, T.; Huang, J.P.; Fu, Q. An improved hydrometeor detection method for millimeter-wavelength cloud radar. Atmos. Chem. Phys. 2017, 17, 9035–9047. [Google Scholar] [CrossRef]
  49. Hu, X.Y.; Ge, J.M.; Du, J.J.; Li, Q.H.; Huang, J.P.; Fu, Q. A robust low-level cloud and clutter discrimination method for ground-based millimeter-wavelength cloud radar. Atmos. Meas. Tech. 2021, 14, 1743–1759. [Google Scholar] [CrossRef]
  50. Doelling, D.R.; Loeb, N.G.; Keyes, D.F.; Nordeen, M.L.; Morstad, D.; Nguyen, C.; Wielicki, B.A.; Young, D.F.; Sun, M.G. Geostationary Enhanced Temporal Interpolation for CERES Flux Products. J. Atmos. Ocean. Technol. 2013, 30, 1072–1090. [Google Scholar] [CrossRef]
  51. Doelling, D.R.; Sun, M.; Nguyen, L.T.; Nordeen, M.L.; Haney, C.O.; Keyes, D.F.; Mlynczak, P.E. Advances in Geostationary-Derived Longwave Fluxes for the CERES Synoptic (SYN1deg) Product. J. Atmos. Ocean. Technol. 2016, 33, 503–521. [Google Scholar] [CrossRef]
  52. Gelaro, R.; McCarty, W.; Suárez, M.J.; Todling, R.; Molod, A.; Takacs, L.; Randles, C.A.; Darmenov, A.; Bosilovich, M.G.; Reichle, R.; et al. The Modern-Era Retrospective Analysis for Research and Applications, Version 2 (MERRA-2). J. Clim. 2017, 30, 5419–5454. [Google Scholar] [CrossRef]
  53. Buchard, V.; Randles, C.A.; da Silva, A.M.; Darmenov, A.; Colarco, P.R.; Govindaraju, R.; Ferrare, R.; Hair, J.; Beyersdorf, A.J.; Ziemba, L.D.; et al. The MERRA-2 Aerosol Reanalysis, 1980 Onward. Part II: Evaluation and Case Studies. J. Clim. 2017, 30, 6851–6872. [Google Scholar] [CrossRef]
  54. Randles, C.A.; da Silva, A.M.; Buchard, V.; Colarco, P.R.; Darmenov, A.; Govindaraju, R.; Smirnov, A.; Holben, B.; Ferrare, R.; Hair, J.; et al. The MERRA-2 Aerosol Reanalysis, 1980 Onward. Part I: System Description and Data Assimilation Evaluation. J. Clim. 2017, 30, 6823–6850. [Google Scholar] [CrossRef]
  55. Hersbach, H.; Bell, B.; Berrisford, P.; Hirahara, S.; Horányi, A.; Muñoz-Sabater, J.; Nicolas, J.; Peubey, C.; Radu, R.; Schepers, D.; et al. The ERA5 global reanalysis. Q. J. Roy. Meteor. Soc. 2020, 146, 1999–2049. [Google Scholar] [CrossRef]
  56. Wetzel, P.J. A Simple Parcel Method for Prediction of Cumulus Onset and Area-Averaged Cloud Amount over Heterogeneous Land Surfaces. J. Appl. Meteorol. 1990, 29, 516–523. [Google Scholar] [CrossRef]
  57. Romps, D.M. Exact Expression for the Lifting Condensation Level. J. Atmos. Sci. 2017, 74, 3891–3900. [Google Scholar] [CrossRef]
  58. Ge, J.M.; Wang, Z.Q.; Liu, Y.Y.; Su, J.; Wang, C.; Dong, Z.X. Linkages between mid-latitude cirrus cloud properties and large-scale meteorology at the SACOL site. Clim. Dynam. 2019, 53, 5035–5046. [Google Scholar] [CrossRef]
  59. Wall, C.J.; Hartmann, D.L.; Ma, P.L. Instantaneous Linkages between Clouds and Large-Scale Meteorology over the Southern Ocean in Observations and a Climate Model. J. Clim. 2017, 30, 9455–9474. [Google Scholar] [CrossRef]
  60. Slingo, J.M. A Cloud Parametrization Scheme Derived from Gate Data for Use with a Numerical-Model. Q. J. Roy. Meteor. Soc. 1980, 106, 747–770. [Google Scholar] [CrossRef]
  61. Logan, T.; Xi, B.; Dong, X.; Li, Z.; Cribb, M. Classification and investigation of Asian aerosol absorptive properties. Atmos. Chem. Phys. 2013, 13, 2253–2265. [Google Scholar] [CrossRef]
  62. Moosmüller, H.; Chakrabarty, R.K. Technical Note: Simple analytical relationships between Angstrom coefficients of aerosol extinction, scattering, absorption, and single scattering albedo. Atmos. Chem. Phys. 2011, 11, 10677–10680. [Google Scholar] [CrossRef]
  63. Wang, H.F.; Li, Z.Q.; Goloub, P.; Hu, Q.Y.; Wang, F.; Lv, Y.; Ge, B.Y.; Hu, X.Q.; Shang, J.; Zhang, P. Identification of typical dust sources in Tarim Basin based on multi-wavelength Raman polarization lidar. Atmos. Environ. 2022, 290, 119358. [Google Scholar] [CrossRef]
  64. Gao, X.G.; Cao, X.J.; Wang, J.Y.; Guo, Q.; Du, T.; Zhang, L. Analysis of aerosol optical properties in a Lanzhou suburb of China. Atmos. Res. 2020, 246, 105098. [Google Scholar] [CrossRef]
  65. Dong, X.Q.; Schwantes, A.C.; Xi, B.K.; Wu, P. Investigation of the marine boundary layer cloud and CCN properties under coupled and decoupled conditions over the Azores. J. Geophys. Res.-Atmos. 2015, 120, 6179–6191. [Google Scholar] [CrossRef]
  66. Douglas, A.; L’Ecuyer, T. Quantifying variations in shortwave aerosol-cloud-radiation interactions using local meteorology and cloud state constraints. Atmos. Chem. Phys. 2019, 19, 6251–6268. [Google Scholar] [CrossRef]
  67. Gryspeerdt, E.; Goren, T.; Sourdeval, O.; Quaas, J.; Mülmenstädt, J.; Dipu, S.; Unglaub, C.; Gettelman, A.; Christensen, M. Constraining the aerosol influence on cloud liquid water path. Atmos. Chem. Phys. 2019, 19, 5331–5347. [Google Scholar] [CrossRef]
  68. Zhao, P.G.; Zhao, W.; Yuan, L.; Zhou, X.; Ge, F.; Xiao, H.; Zhang, P.W.; Wang, Y.T.; Zhou, Y.J. Spatial Heterogeneity of Aerosol Effect on Liquid Cloud Microphysical Properties in the Warm Season Over Tibetan Plateau. J. Geophys. Res.-Atmos. 2023, 128, e2022JD037738. [Google Scholar] [CrossRef]
  69. Rosenfeld, D.; Zhu, Y.; Wang, M.; Zheng, Y.; Goren, T.; Yu, S. Aerosol-driven droplet concentrations dominate coverage and water of oceanic low-level clouds. Science 2019, 364, eaav0566. [Google Scholar] [CrossRef]
  70. Kawamoto, K.; Yamauchi, A.; Suzuki, K.; Okamoto, H.; Li, J.M. Effect of Dust Load on the Cloud Top Ice-Water Partitioning Over Northern Middle to High Latitudes With CALIPSO Products. Geophys. Res. Lett. 2020, 47, e2020GL088030. [Google Scholar] [CrossRef]
  71. Anwar, K.; Alam, K.; Labban, A.H.; Liu, Y.A.; Naila. Analysis of contrasting aerosol indirect effects in liquid water clouds over the northern part of Arabian Sea. Atmos. Environ. 2025, 348, 121123. [Google Scholar] [CrossRef]
  72. Li, Y.L.; Fan, T.Y.; Zhao, C.F.; Yang, X.; Zhou, P.; Li, K.Y. Quantifying the Long-Term MODIS Cloud Regime Dependent Relationship between Aerosol Optical Depth and Cloud Properties over China. Remote Sens. 2022, 14, 3844. [Google Scholar] [CrossRef]
  73. Feingold, G.; Eberhard, W.L.; Veron, D.E.; Previdi, M. First measurements of the Twomey indirect effect using ground-based remote sensors. Geophys. Res. Lett. 2003, 30, 1287. [Google Scholar] [CrossRef]
  74. Johnson, B.T.; Shine, K.P.; Forster, P.M. The semi-direct aerosol effect: Impact of absorbing aerosols on marine stratocumulus. Q. J. Roy. Meteor. Soc. 2004, 130, 1407–1422. [Google Scholar] [CrossRef]
  75. Allen, R.J.; Amiri-Farahani, A.; Lamarque, J.F.; Smith, C.; Shindell, D.; Hassan, T.; Chung, C.E. Observationally constrained aerosol-cloud semi-direct effects. Npj Clim. Atmos. Sci. 2019, 2, 16. [Google Scholar] [CrossRef]
Figure 1. Vertical profile of low-level cloud occurrence frequency (CF) as a function of (a) zonal wind (U), (b) meridional wind (V), (c) horizontal wind (HWS), (d) vertical velocity (ω), (e) relative humidity (RH), (f) temperature (T), (g) wind shear ( H W S Z ), and (h) potential temperature lapse rate ( θ Z ), respectively. Right plot (i) shows low-level cloud top height, cloud base height, and cloud body occurrence frequency profiles.
Remotesensing 17 01533 g001
Figure 2. The distribution of (a) the height of lifting condensation level (LCL), (b) RH at 775 hPa, (c) T at 775 hPa, and (d) H W S Z at 775 hPa in each PC1 bin is depicted by the box-and-whisker plot. Six PC1 bins are −1.9–−1.1, −1.1–−0.8, −0.8–−0.6, −0.6–−0.3, −0.3−0, and 0–2.2. The central line within each box represents the median, while the edges of the box indicate the 25th and 75th percentiles. Whiskers extend to 1.5 times the interquartile range above and below the box.
Remotesensing 17 01533 g002
Figure 3. Ångström exponent (AE) and single-scattering co-albedo ( ω a b s ) during different seasons: (a) spring (March/April/May, purple), (b) summer (June/July/August, green), (c) autumn (September/October/November, red), and (d) winter (December/January/February, blue). Horizontal dotted line denotes the demarcation of AE = 0.9. Vertical dotted line denotes the demarcation of ω a b s = 0.06. Numbers represent the sample size within each quadrant.
Remotesensing 17 01533 g003
Figure 4. Cloud macro and micro properties under the strongly absorptive (in red) and the weakly absorptive (in green) aerosol regimes. Probability distribution functions (PDFs) of (a) liquid water path (LWP), (b) cloud droplet effective radius (CER), (c) top of the atmosphere albedo (Albedo), (d) cloud optical depth (COD), (e) cloud occurrence frequency (CF), (f) cloud geometric thickness (CGT), (g) cloud bottom height (CBH), and (h) cloud top height (CTH).
Remotesensing 17 01533 g004
Figure 5. Aerosol–cloud interaction (ACI) index derived from ln(CER) to ln(aerosol optical depth (AOD)) in six PC1 bins: (a) −1.9–−1.1 (red), (b) −1.1–−0.8 (deep pink), (c) −0.8–−0.6 (orange-red), (d) −0.6–−0.3 (orange), (e) −0.3–0 (light blue), and (f) 0–2.2 (dark blue). (g) Variation of ACI with PC1, where ACI values are marked with red dots. (h) Variation of AOD with PC1, where AOD values are marked with blue squares. Blue whiskers indicate the 95% confidence interval of the mean for each PC1 bin.
Remotesensing 17 01533 g005
Figure 6. This figure is the same as Figure 5 but with six LWP bins: (a) 0.65–25 g/m2 (dark blue), (b) 25–50 g/m2 (light blue), (c) 50–75 g/m2 (orange), (d) 75–100 g/m2 (orange-red), (e) 100–150 g/m2 (deep pink), and (f) 150–300 g/m2 (red). (g) Variation of ACI with LWP, where ACI values are represented by red dots. (h) Variation of AOD with LWP, where AOD values are represented by blue squares. Blue whiskers indicate the 95% confidence interval of the mean for each LWP bin.
Remotesensing 17 01533 g006
Figure 7. Dependence of (a) ln(CF), (b) ln(CGT), (c) ln(CTH), (d) ln(CBH), (e) ln(CER), (f) ln(Albedo), (g) ln(COD), (h) ln(LWP) on ln(AOD) for intervals of PC1. The values are the means for each bin. Asterisk indicates that the relational equation passes the 95% significance test.
Remotesensing 17 01533 g007
Figure 8. This figure is the same as Figure 7 but for intervals of LWP (ah).
Remotesensing 17 01533 g008
Figure 9. The correlation coefficient between (a) CF, (b) CGT, (c) CTH, (d) CBH, (e) CER, (f) Albedo, (g) COD, (h) LWP, and AOD. Data are stratified according to LWP and PC1. Asterisks indicate that the result is statistically significant at the 95% confidence level.
Remotesensing 17 01533 g009
Figure 10. The computed slopes of (a) ln(CF), (b) ln(CGT), (c) ln(CTH), (d) ln(CBH), (e) ln(CER), (f) ln(Albedo), (g) ln(COD), and (h) ln(LWP) versus aerosol loading ln(AOD). Data are stratified according to LWP and PC1. Asterisks indicate that the result is statistically significant at the 95% confidence level.
Remotesensing 17 01533 g010
Figure 11. The variation of CER with PC1, LWP, and AOD for different aerosol types, including (a) black carbon aerosol optical depth (BCAOD), (b) dust aerosol optical depth (DUAOD), (c) organic carbon aerosol optical depth (OCAOD), and (d) sulfate aerosol optical depth (SUAOD). Six PC1 bins are −1.9–−1.1, −1.1–−0.8, −0.8–−0.6, −0.6–−0.3, −0.3–0, and 0–2.2. Six LWP bins are 0.65–25 g/m2, 25–50 g/m2, 50–75 g/m2, 75–100 g/m2, 100–150 g/m2, and 150–300 g/m2. The color of the dot represents the average CER.
Remotesensing 17 01533 g011
Table 1. The average absolute correlation coefficient of low-level cloud properties (cloud occurrence frequency (CF), cloud geometric thickness (CGT), cloud top height (CTH), cloud bottom height (CBH), cloud droplet effective radius (CER), liquid water path (LWP), cloud optical depth (COD), top of the atmosphere albedo (Albedo)) with meteorological variables (the height of lifting condensation level (LCL), relative humidity (RH), temperature (T), zonal wind (U), horizontal wind (HWS), meridional wind (V), potential temperature lapse rate ( θ Z ), vertical velocity (ω), and wind shear ( H W S Z )) across the 500–800 hPa levels. The mean of absolute correlation coefficients (MACC) is calculated between each meteorological factor and the eight low-level cloud properties.
VariablesCFCGTCTHCBHCERLWPCODAlbedoMACC
LCL0.510.740.960.960.870.880.910.910.84
RH0.870.930.760.800.500.920.820.940.82
T0.790.280.800.910.850.950.960.910.80
U0.670.690.860.800.450.830.830.910.76
HWS0.560.780.890.810.360.720.720.830.71
V0.810.830.760.530.720.670.690.670.71
θ Z 0.730.790.880.830.470.520.590.530.67
ω0.660.830.800.570.530.620.570.690.66
H W S Z 0.700.660.660.430.490.700.620.700.62
Table 2. The MACC between low-level cloud properties and the first principal component (PC1), including one of remaining six variables (U, HWS, V, θ Z , ω, and H W S Z ), at 500–800 hPa pressure levels.
Pressure (hPa)PC1-UPC1-HWSPC1-VPC1- θ Z PC1-ωPC1- H W S Z
5000.790.740.850.750.860.72
5500.740.760.790.710.860.75
6000.780.770.810.670.880.84
6500.860.890.810.580.860.88
7000.780.840.850.810.850.88
7500.840.830.870.840.850.85
7750.870.890.870.870.880.90
8000.840.860.80 0.83
Table 3. The correlation coefficients between low-level cloud properties and four meteorological factors used in Principal Component Analysis (PCA), as well as between low-level cloud properties and PC1.
VariablesCFCGTCTHCBHCERLWPCODAlbedo
LCL−0.51−0.740.960.960.87−0.88−0.91−0.91
RH775 hPa0.880.89−0.36−0.97−0.800.950.940.96
T775 hPa−0.92−0.130.890.96−0.850.930.960.87
H W S Z 775   h P a   0.690.830.880.79−0.540.46−0.160.57
PC1−0.89−0.910.770.970.85−0.95−0.91−0.95
Note: Bold indicates a failure in passing the 95% significance test.
Disclaimer/Publisher’s Note: The statements, opinions and data contained in all publications are solely those of the individual author(s) and contributor(s) and not of MDPI and/or the editor(s). MDPI and/or the editor(s) disclaim responsibility for any injury to people or property resulting from any ideas, methods, instructions or products referred to in the content.

