1. Introduction
With the acceleration of urbanization and the increasing demand for ecological environments, the construction of green spaces has become an indispensable component of modern urban planning [
1]. Trees play an increasingly prominent role in landscape design, urban greening, and ecological restoration [
2,
3]. Moreover, realistic 3D models of trees have extensive applications in virtual reality, video games, the film industry, and biomass calculations for forest inventory [
4]. Landscape trees refer to trees used in urban, park, courtyard, and other landscape designs to enhance aesthetic appeal, provide shade, improve air quality, and increase biodiversity. They play significant importance in ecological, aesthetic, and social functions. As essential elements in greening designs, the health and maintenance of landscape trees are crucial to ensuring their long-term economic benefits and aesthetic value. This includes regular pruning, pest control, and appropriate irrigation. However, traditional 3D tree models usually lack scientific accuracy and precision, particularly in representing growth patterns, branching structures, and similarity, making it difficult to provide reliable tree models for digital management.
In recent years, with the rapid advancement of Computer Vision (CV) and laser remote sensing technologies, these methods have demonstrated significant potential in the field of tree 3D reconstruction. Recently, many research projects have focused on this topic. Firstly, some studies use the LiDAR point cloud as input data for subsequent research. This includes using point cloud self-registration methods to achieve 3D reconstruction of tree seedlings [
5]. Three-dimensional morphological algorithms, clustering methods, and multi-scale curve fitting techniques were employed to robustly reconstruct 3D trees from the incomplete laser point cloud [
6]. Airborne LiDAR point cloud data and the 3D alpha-shape algorithm were used to construct models of trees, shrubs, and ground vegetation, achieving realistic forest scene reconstruction [
7]. A voxel-based approach was adopted to reconstruct single leafy trees using terrestrial laser scanning (TLS) data [
8]. The matrix-based rotational surface modeling method [
9] converts the irregular LiDAR point cloud into regular matrix structures, models tree models, and supports parameter calculation and visualization. Crown information of individual trees has been extracted using LiDAR point cloud data through 2D surface modeling or analyzing 3D data [
10]. Secondly, some studies conducted further research through deep learning or image data. For example, the evaluation of point clouds generated by single tree reconstruction using Neural Radiation Fields (NeRFs) has demonstrated its enormous potential for higher success rates in single tree reconstruction [
11]. Conditional Generative Adversarial Networks (cGANs) have been applied to reconstruct 3D trees from a single image [
12]. In addition, there are some studies based on an L-system for tree modeling, which calculates prior information about trees and generates tree models based on this prior information. For example, using the point cloud reconstruction of the generated tree skeleton [
13] to form multiple compact L-system expressions, then constructing a set of tree models with different growth patterns. These studies have achieved 3D tree modeling through various methods, some of which can provide point cloud data and extract tree feature parameters [
14]. The 3D model of trees and these characteristic parameters are very beneficial for forest resource management [
15], field investigations [
16], and urban landscape design [
17], laying the foundation for the digital management of forestry.
The above methods have achieved good results and progress has been made in tree and forest reconstruction, but several challenges remain unresolved. Firstly, research on reconstruction based on LiDAR point cloud data is not always feasible due to location, cost, or environmental or physical limitations, making it impractical to directly use precise 3D laser scanners [
18,
19,
20,
21,
22] to obtain the 3D point cloud. Secondly, deep learning-based networks require extensive training time, resulting in high temporal costs. Finally, the growth rules of trees are complex and diverse, and there is still a gap between the current reconstruction effect of trees and their true growth rules. The pruning of landscape trees is divided into winter dormancy pruning and summer growth pruning. And most garden maintenance personnel choose to prune the branches of landscape trees during the winter leaf-free period. Therefore, the accurate branching structure model of trees during the leaf free period provides a necessary scientific basis for the design, maintenance, and management of landscape trees. However, there is little attention and research on the reconstruction of tree branches during the leaf-free period. For landscape trees, the branching phenotype characteristics directly affect their aesthetic appearance, and the morphology and layout of tree crown branches have strong dynamic adaptability to the environment, which is directly related to their growth habits [
23,
24]. Therefore, reconstructing growth patterns that conform to trees is extremely important for forest management. Starting from this branching characteristic of trees, it is found that it is consistent with the scene representation logic of Gaussian distribution, and can describe changes in branch thickness through multi-scale Gaussian kernels [
25]. The 3D Gaussian Splatting [
25] uses adaptive Gaussian density control, backpropagation for iterative optimization, and combines differential tile rasterizers to enhance rendering speed. Compared to traditional neural networks, this method enables low-cost, high-quality, and real-time 3D reconstruction, offering a significant advancement in the 3D reconstruction field [
25]. Based on this, this article aims to propose a method for the 3D reconstruction of landscape trees in the leaf-free period, which applies 3D GS to the reconstruction of landscape trees and adds KD-Tree [
26,
27] to optimize the Gaussian kernel initialization scale. The effectiveness of the method was evaluated using image data collected from single landscape trees with different branching patterns in the park environment. The results showed that the method can generate highly realistic reconstruction models and has good effects on tree branches, expanding the research direction of the 3D reconstruction of landscape trees during the leafless period.
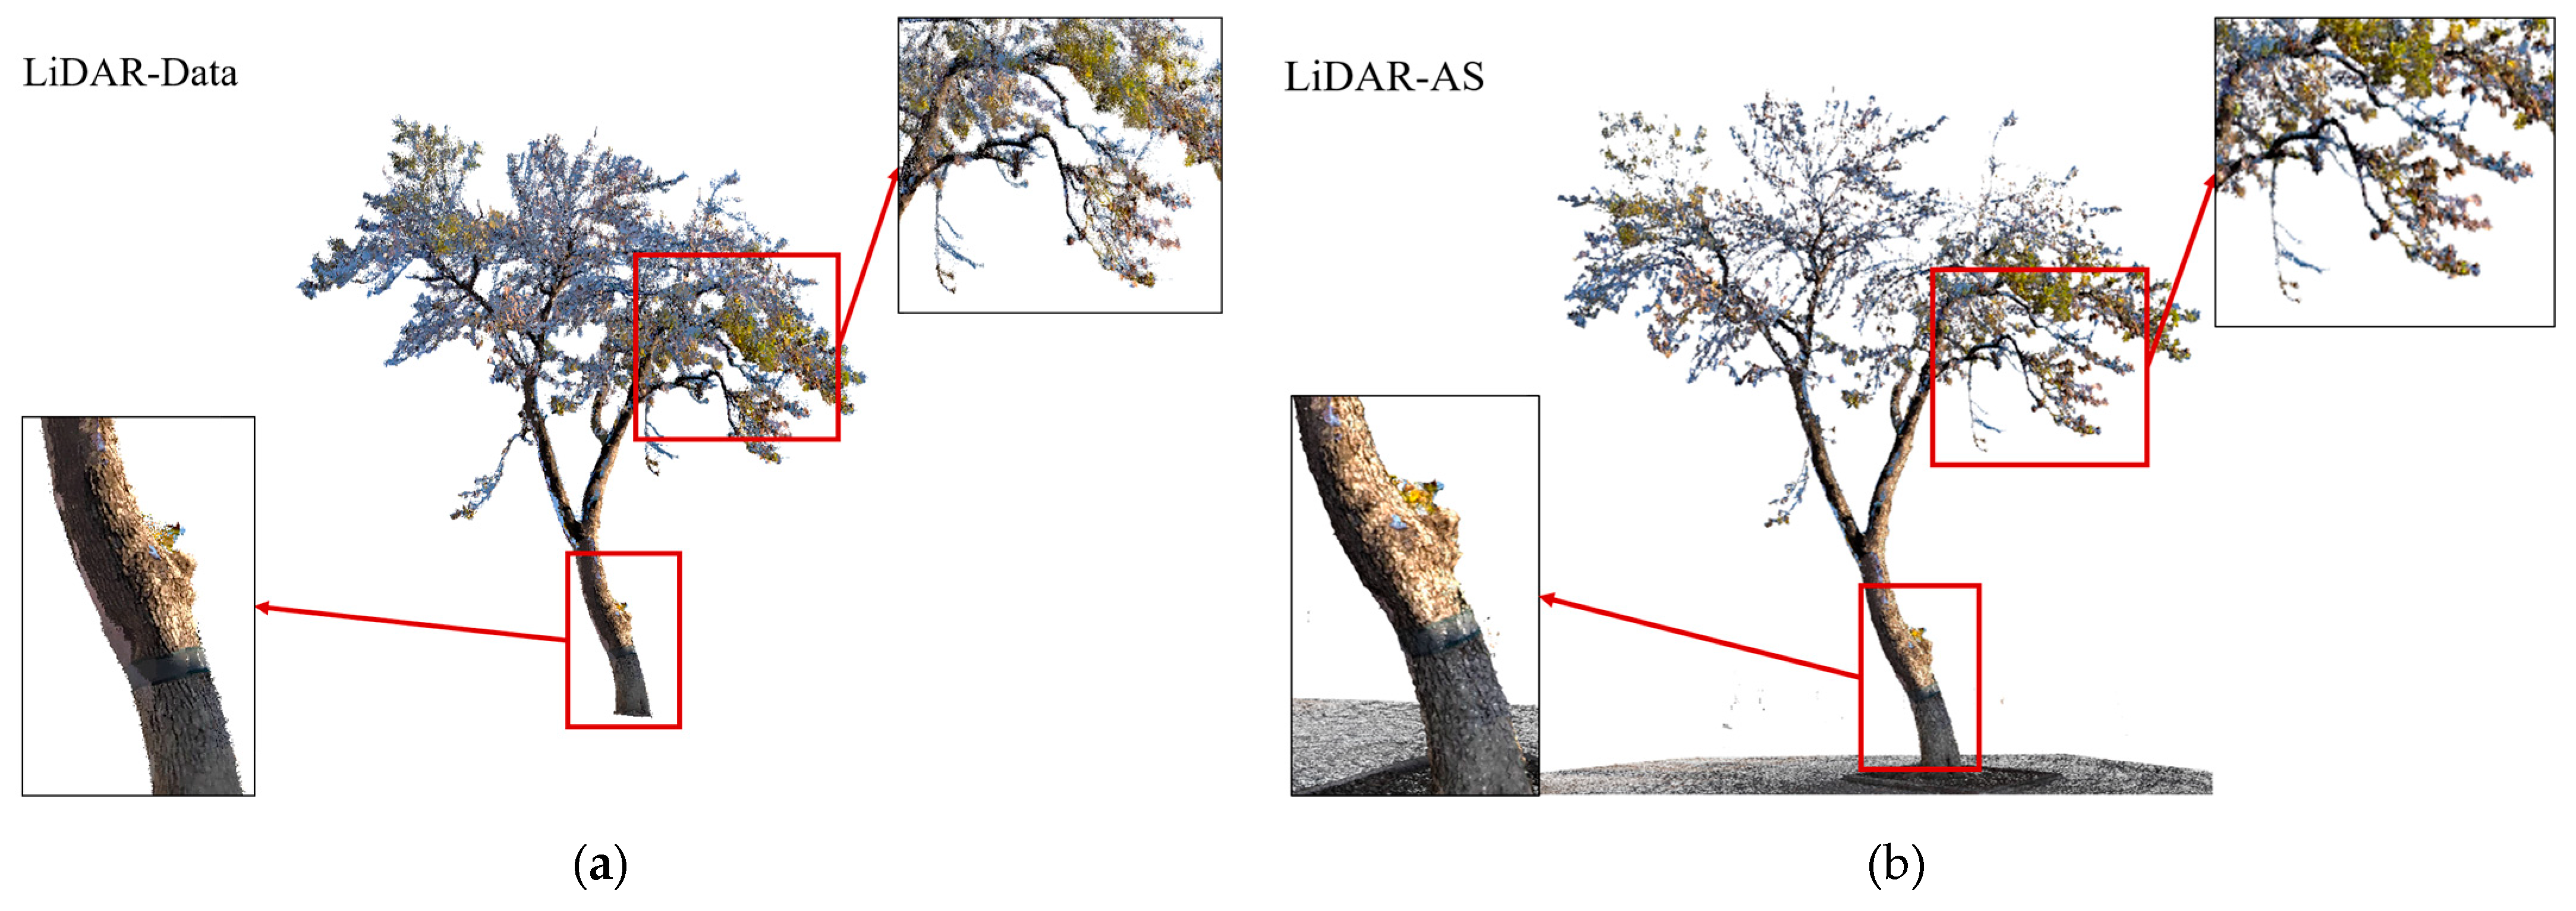
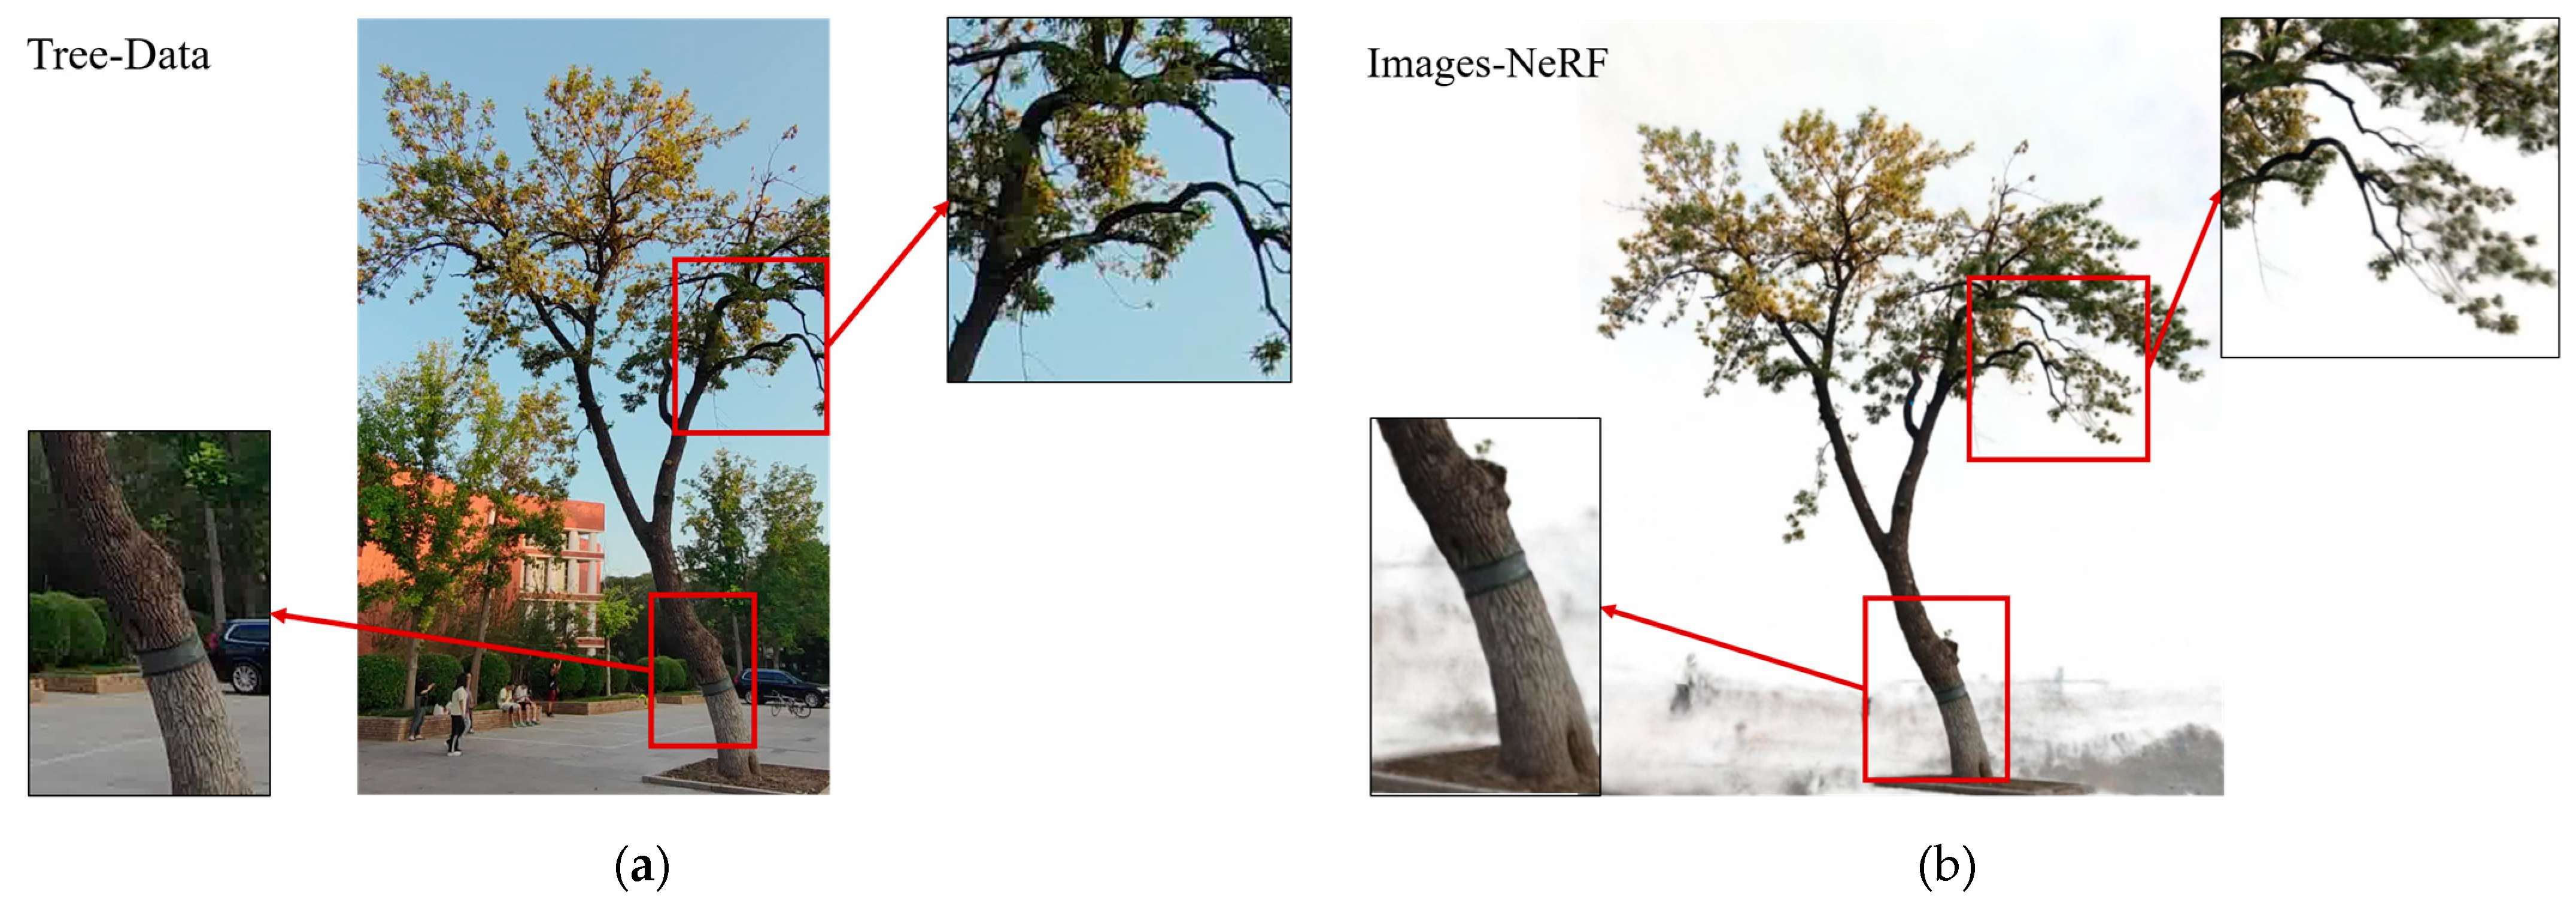
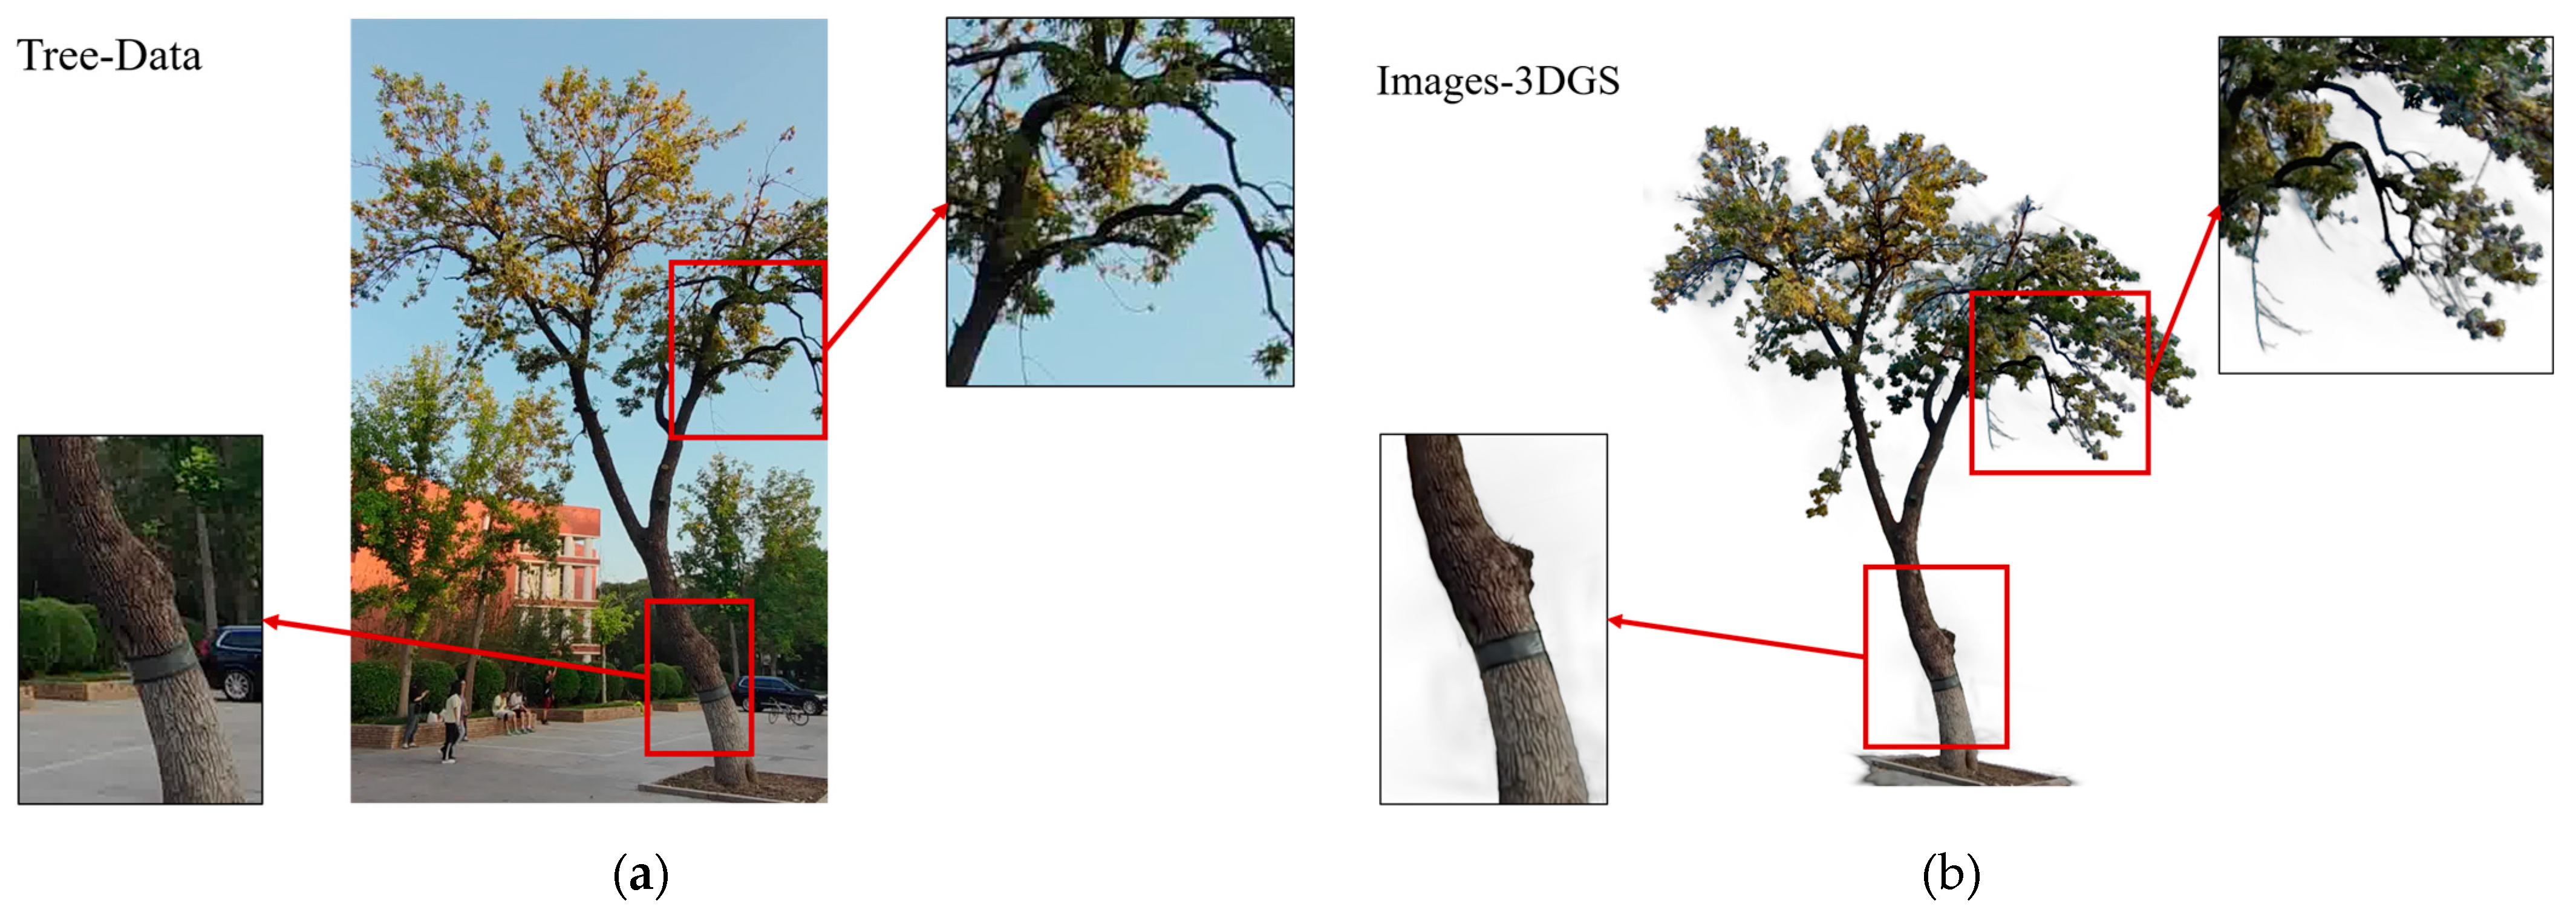
In summary, the motivation behind the work proposed in this paper is to provide a 3D GS-based reconstruction method for leafless landscape trees, which innovatively applies 3D GS to the 3D reconstruction of leafless landscape trees and can effectively reconstruct real branching structures. This article focuses on the following: (1) Collecting handheld LiDAR data and multi view image data of the same tree. Reconstructing LiDAR using Alpha Shapes [
28], and reconstructing multi view image using 3D-GS based methods and NeRF [
29]. Then comparing the reconstruction results and verify the advantages of the proposed method in 3D tree reconstruction. (2) Adding KD-Tree to extract distances to optimize the Gaussian kernel scale initialization process. (3) Using the 3D GS-based method for the 3D reconstruction of the image data of seven different trees to obtain the final reconstruction model.
2. Materials
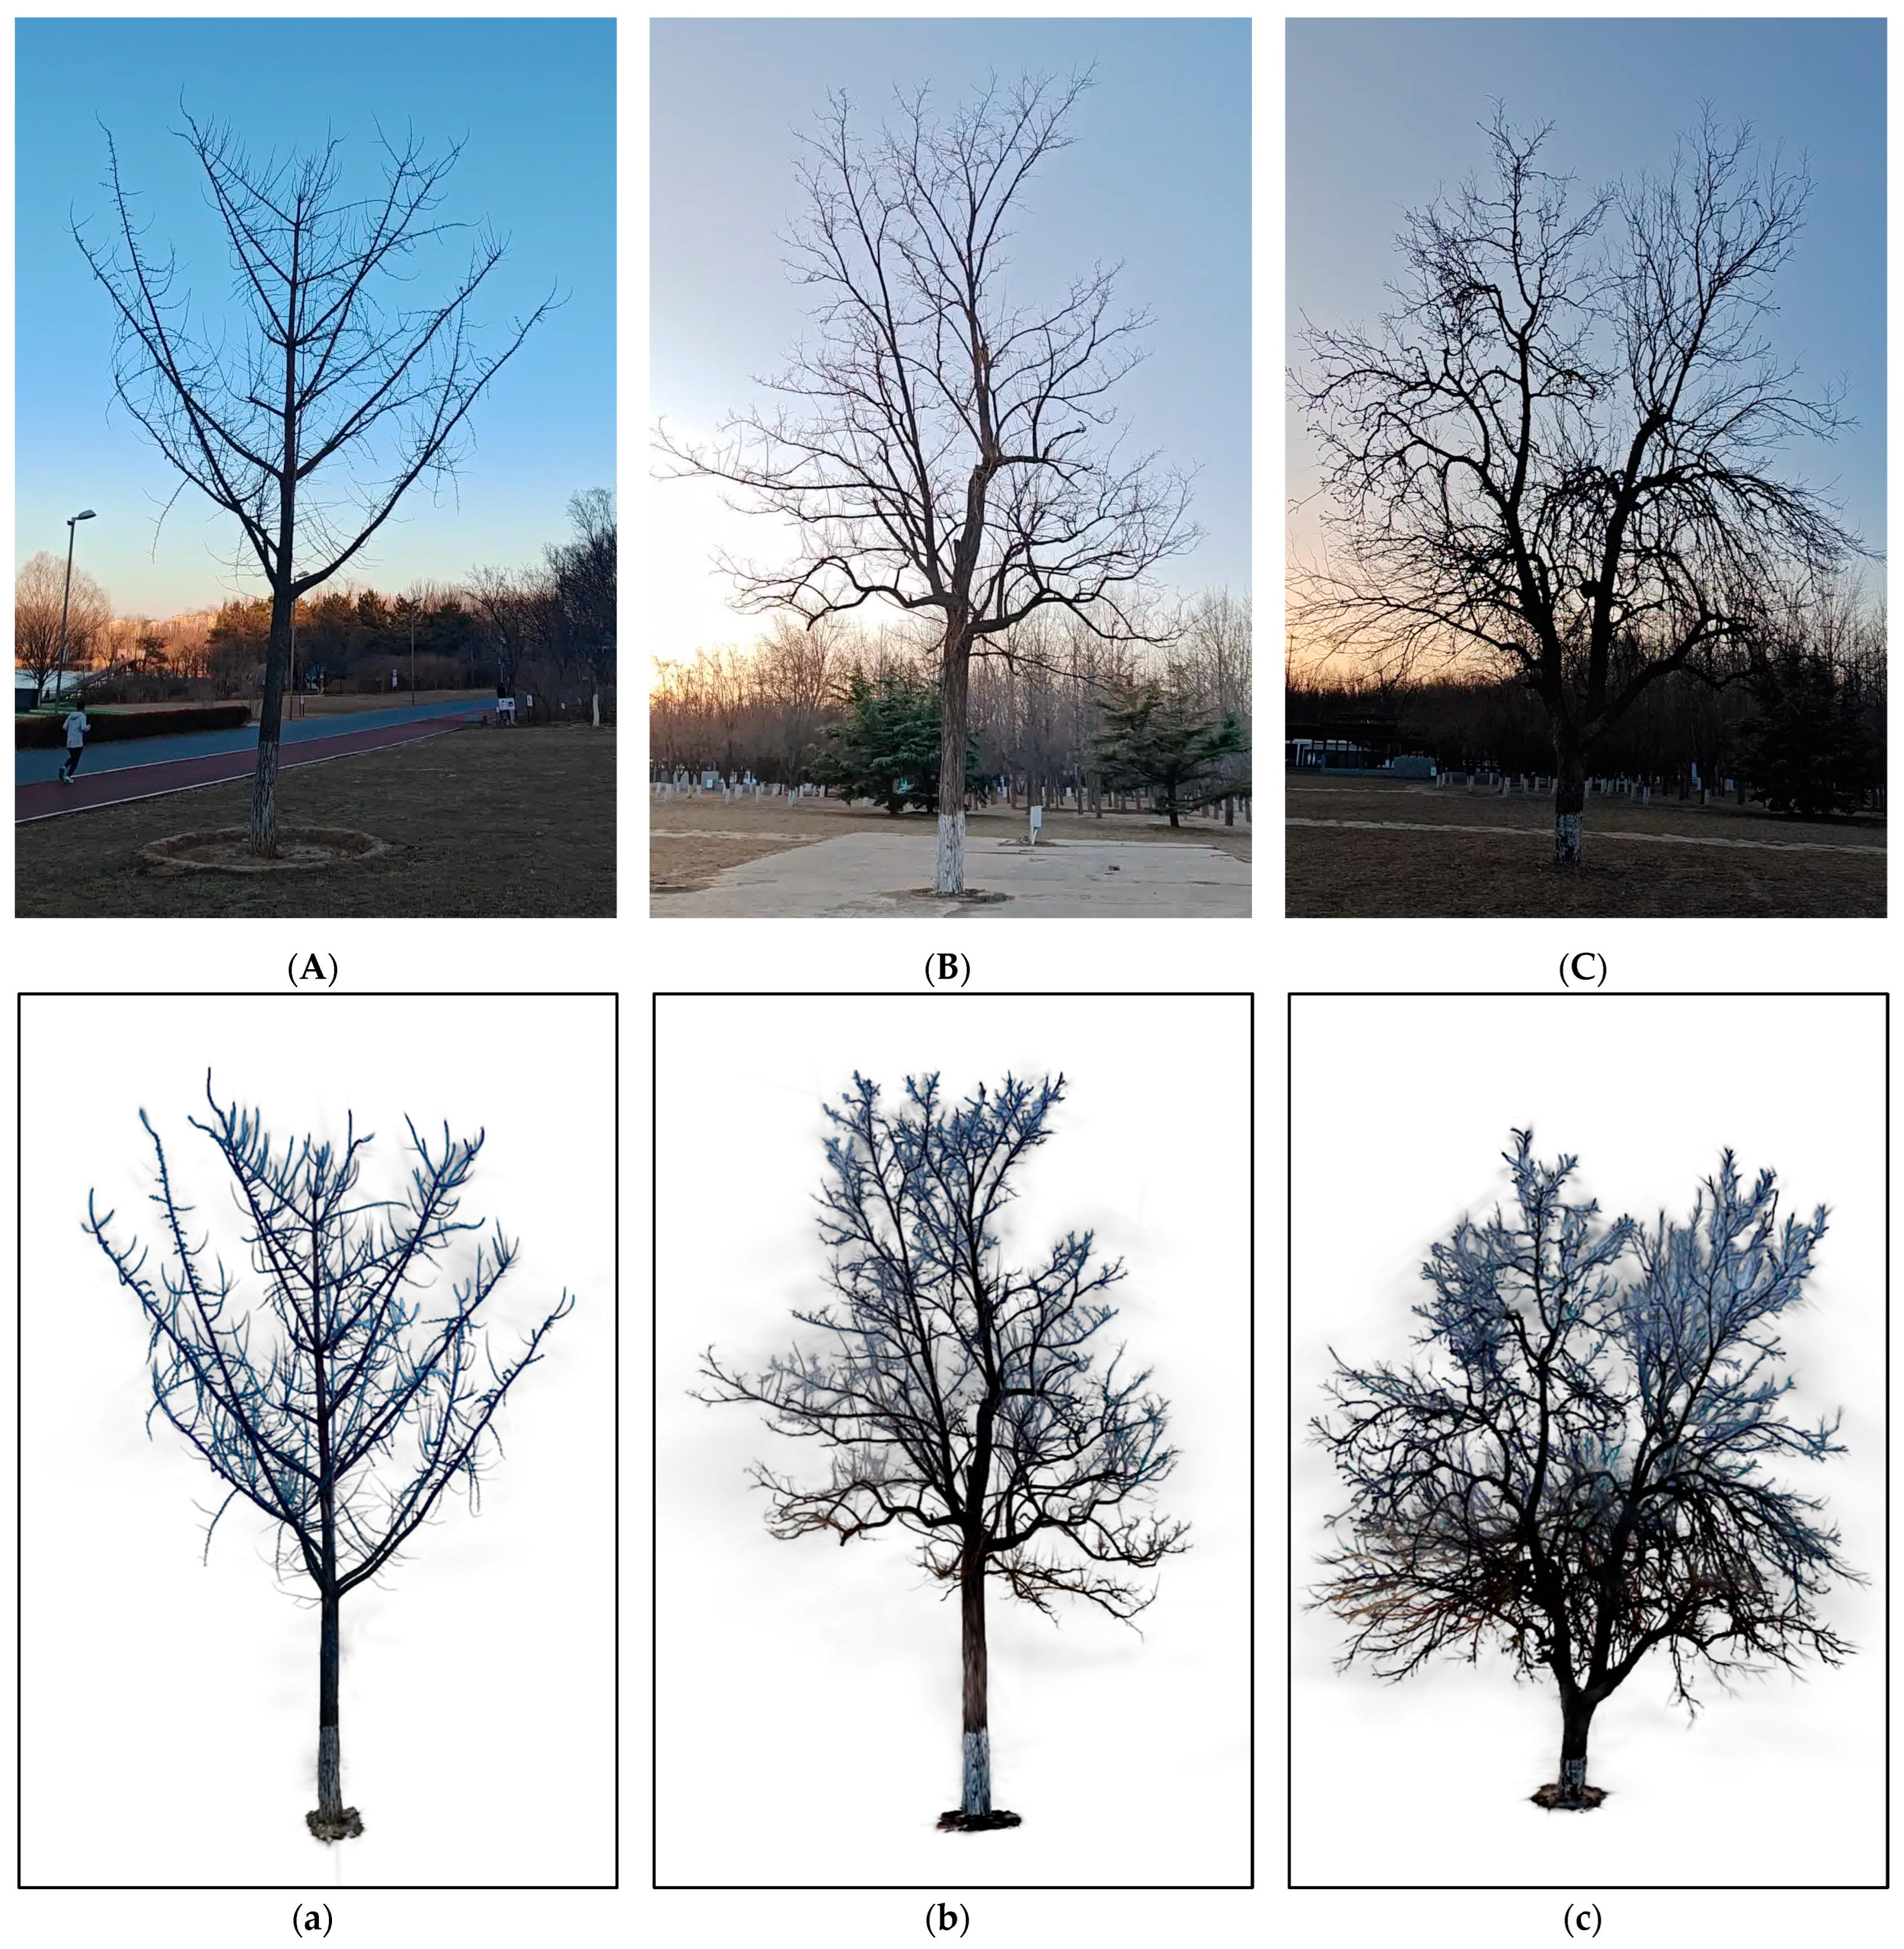
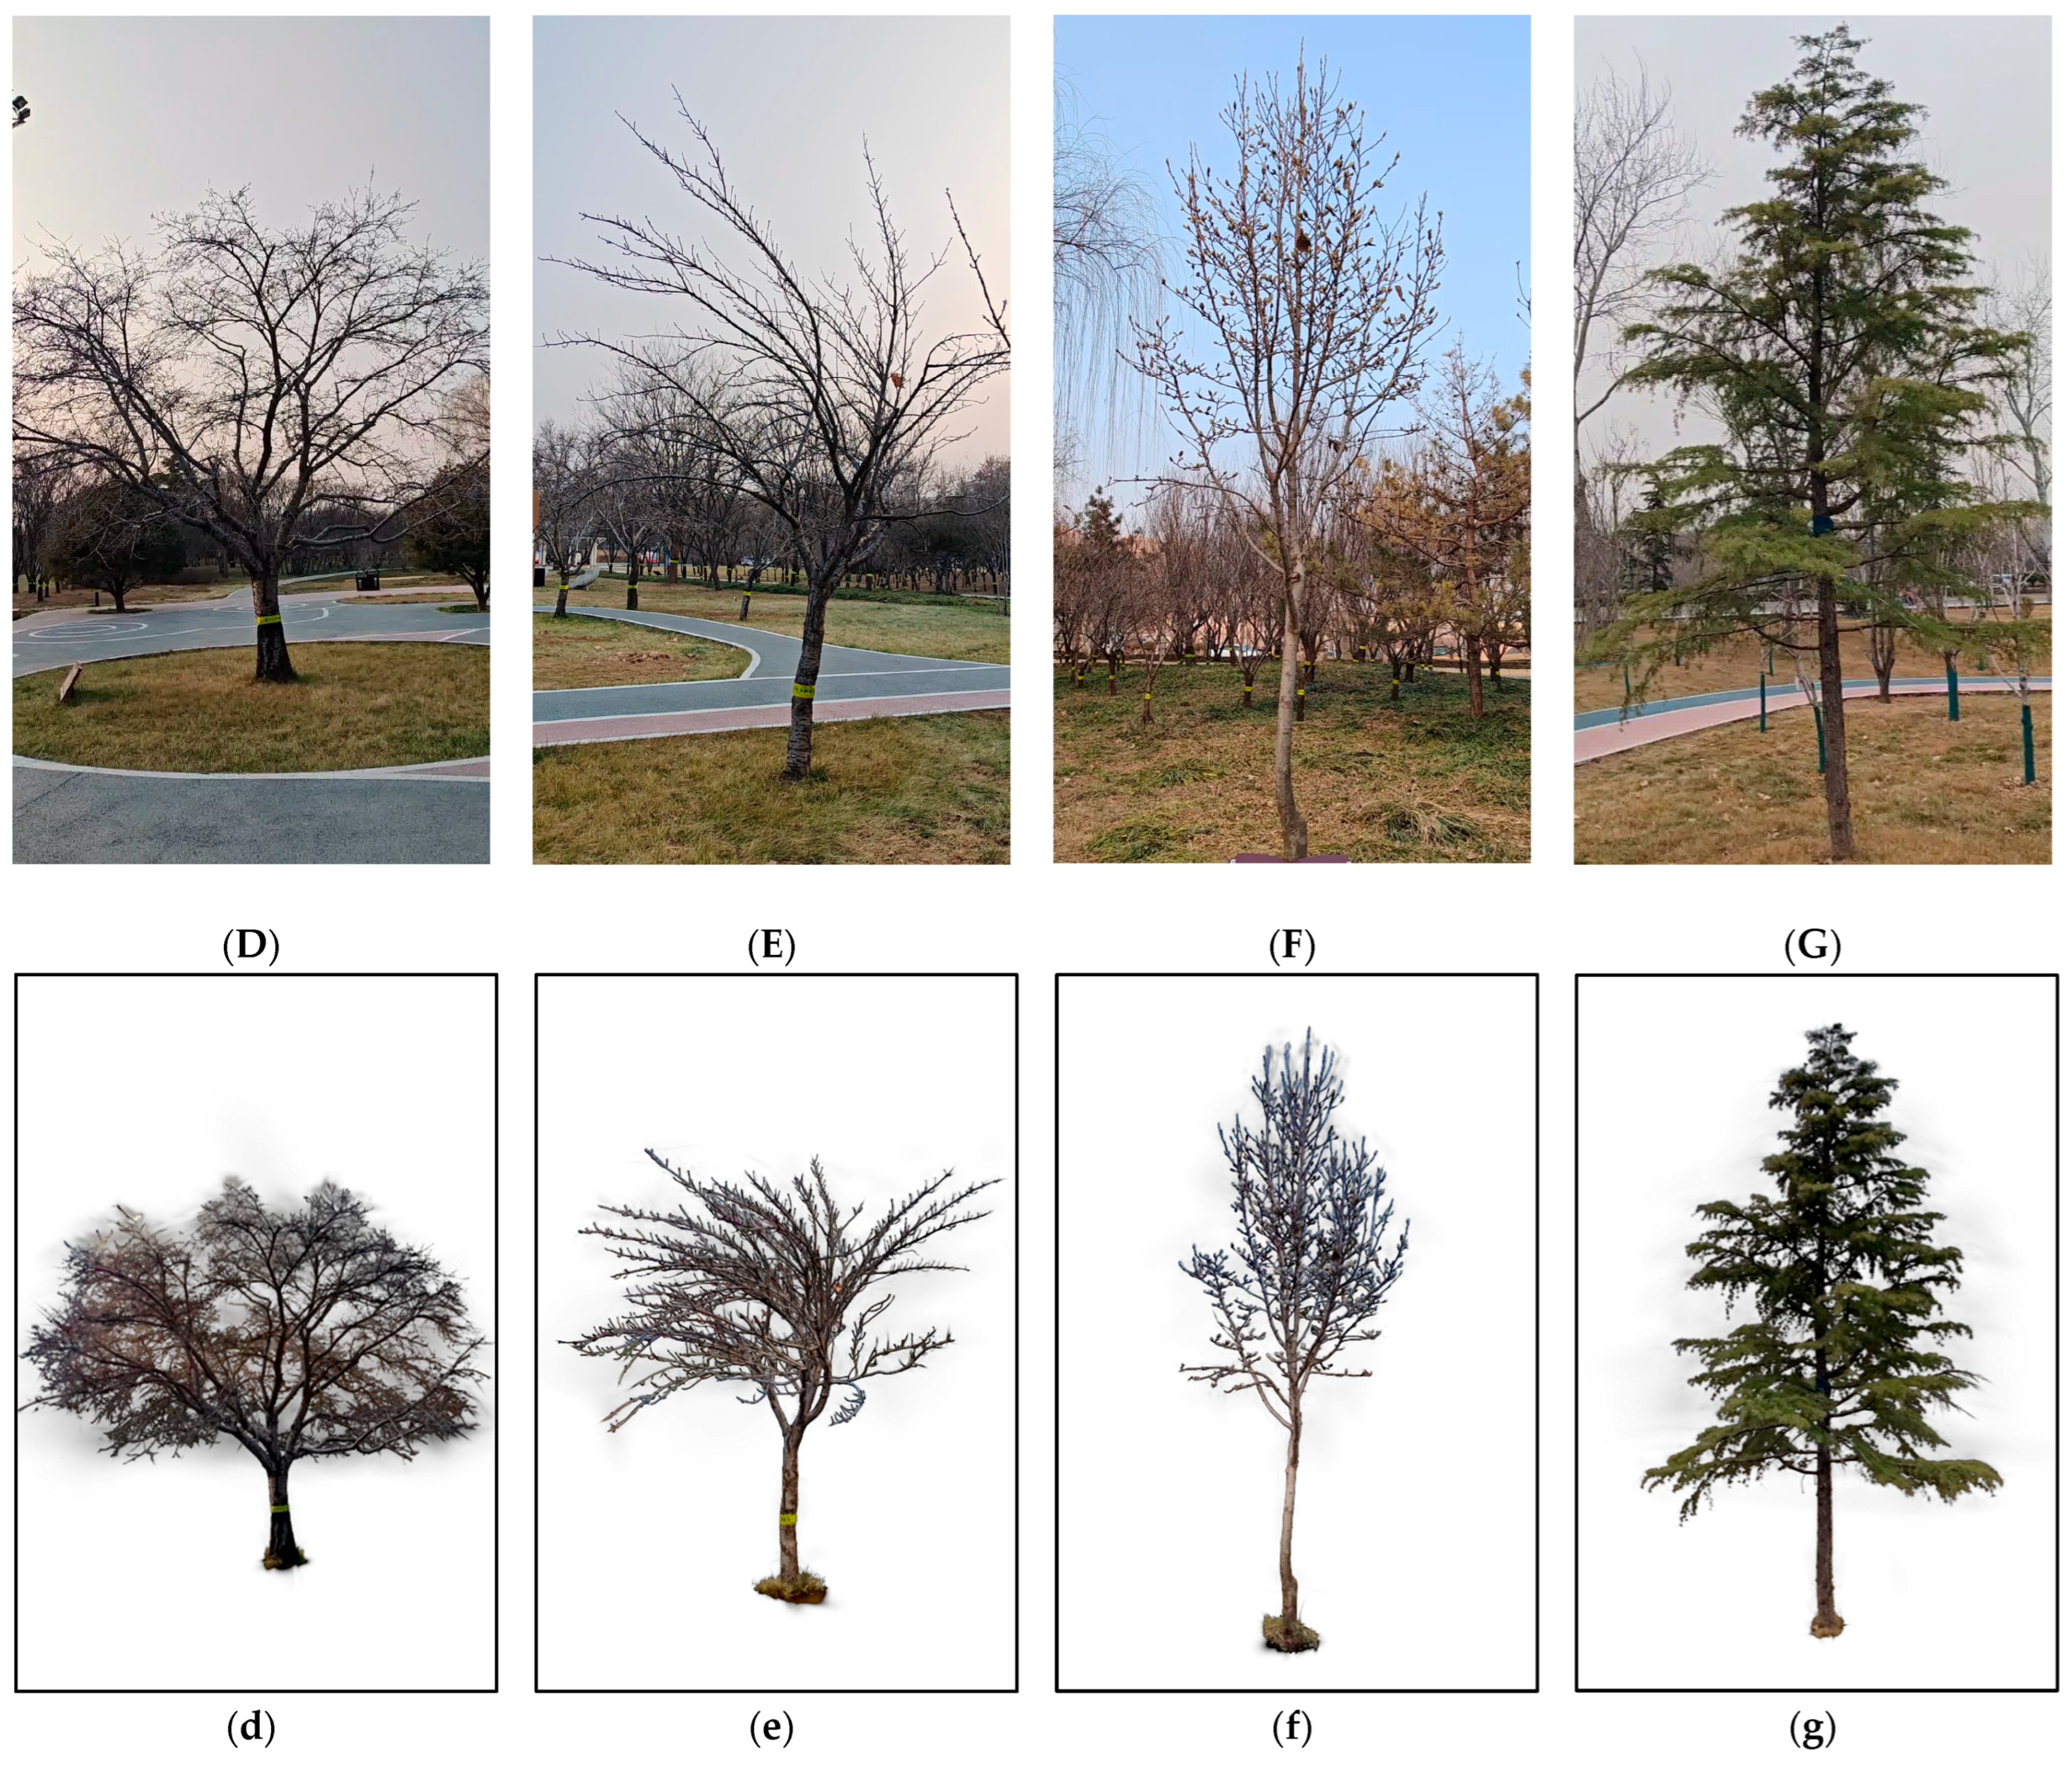
Landscape tree datasets The tree data used in this study are divided into two parts: one is to verify the feasibility of the 3D GS, and the other is to verify the 3D GS-based reconstruction effect. The first part of the sample was collected at Beijing Forestry University in Beijing, China, and we selected a Fraxinus pennsylvanica on campus as the sample. The other part of the sample was located in the Olympic Forest Park in Beijing, China and the Sakura Park in Hebei Province, China. The sample locations were all located in the temperate continental semi humid monsoon climate zone, with four distinct seasons and concentrated precipitation. We selected a total of seven typical landscape trees with different branching structures as experimental samples.
We use a handheld laser scanner, CHCNAV RS10 (Shanghai CHCNAV, China), to collect LiDAR point cloud data, and use an HONOR GT90 phone (HONOR, China) camera to obtain image data. The point cloud data are obtained through SmartGo data collection and CoPre data calculation. The point cloud data and image data are collected from the initial position in a clockwise direction, with the roots of the landscape tree as the center, and collected from a 360° perspective. The heights of the equipment are all set to 1.5 m above the ground, and the distance is adaptively adjusted according to the size of the landscape tree and the surrounding conditions. The collection equipment and method are shown in
Figure 1. The resolution of the image is 1080 × 1920. Each dataset used for the experiment consists of image data from multiple perspectives of single landscape trees. Due to the focus of this study on the three-dimensional reconstruction of branching structures, we chose to collect landscape trees during the leaf-free period.
In October 2023, we collected LiDAR point cloud data and image data of the Fraxinus pennsylvanica on campus.
In December 2023, when the landscape trees in the park were almost leafless, we collected image data of seven landscape trees in two parks and constructed datasets for each. The information of the datasets is shown in
Table 1.
3. Methods
In this section, we introduce relevant comparative experiments to verify the good performance of 3D GS in tree 3D reconstruction; sparse point cloud generation for multi view images; model framework and training method for 3D reconstruction of landscape trees; the methods used to construct the Quantitative Structure Model (QSM) and extract parameters; and a detailed explanation of how we validate these models and methods.
3.1. Methodology Overview
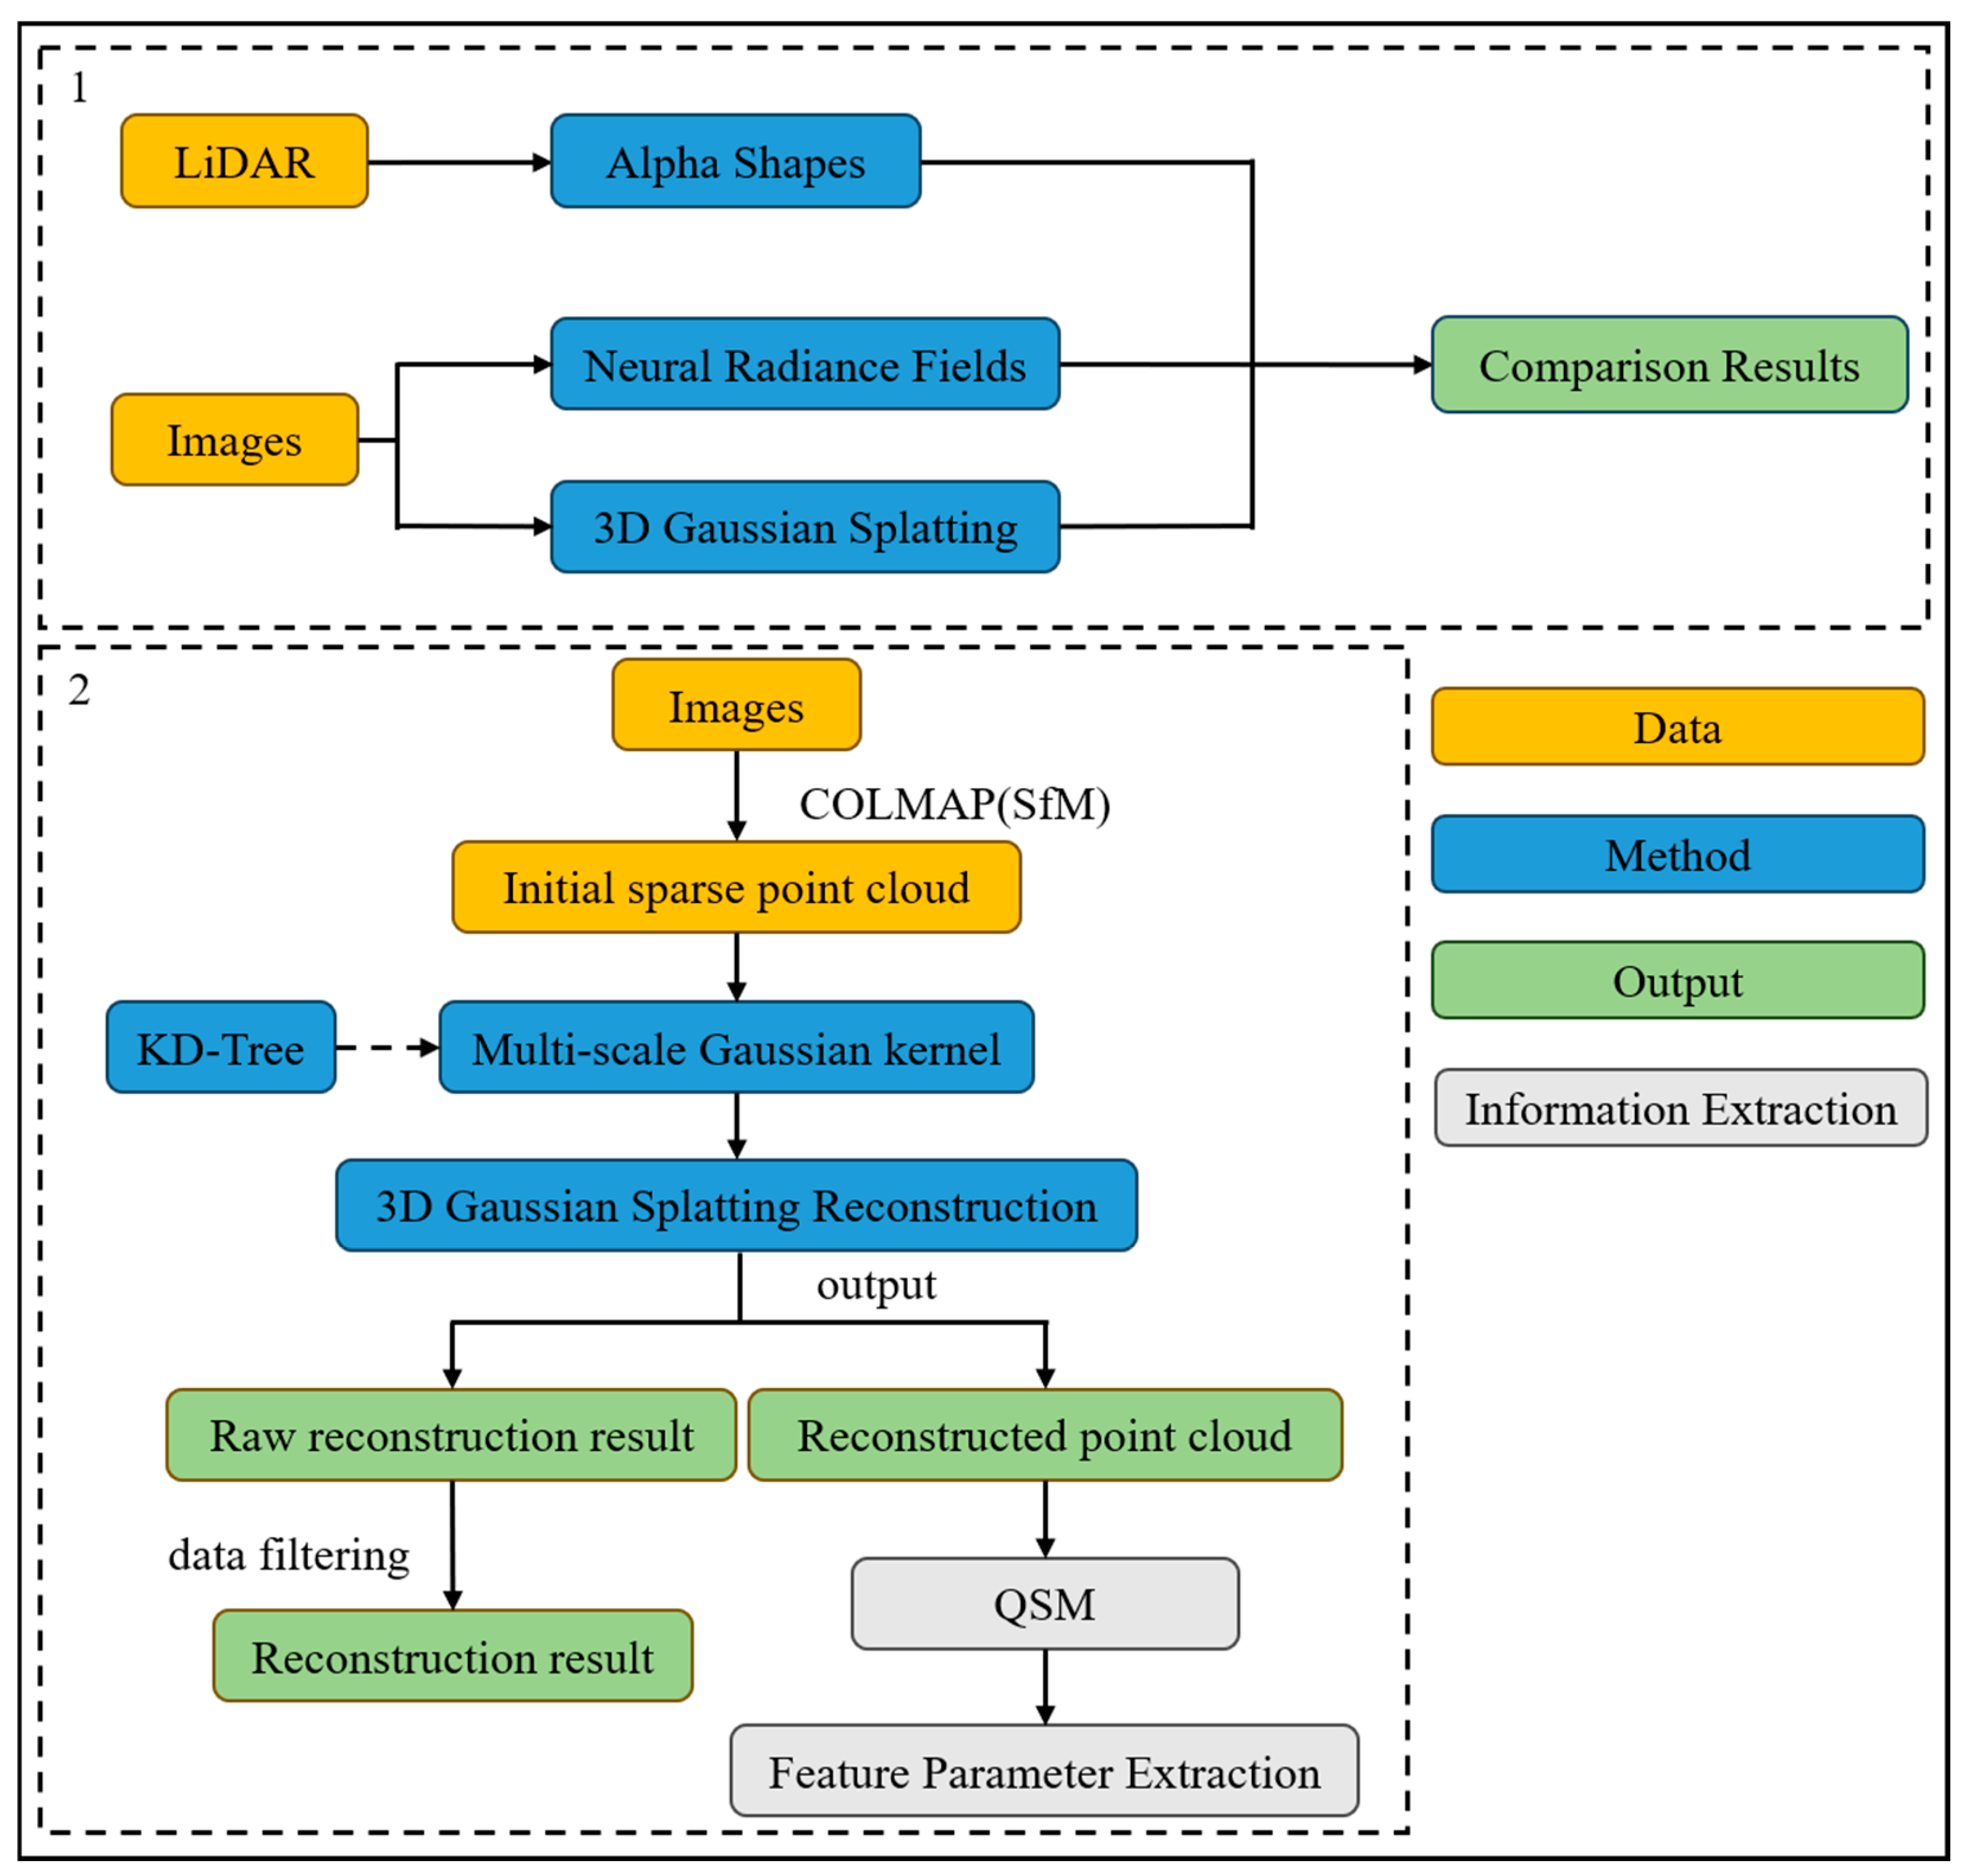
Our work is divided into two parts. The first part compares the reconstruction of LiDAR data and multi view image data of the same tree, demonstrating the advantages of the 3D GS method in tree 3D reconstruction and verifying the research significance of the method. The second part is method construction and evaluation. Firstly, the COLMAP tool is used to generate initial sparse point clouds from images from different angles, which are used as the initial point cloud input for the 3D GS method. Secondly, we embed the KD-tree into the Gaussian distribution scale initialization process of scene representation, considering the feature distance of adjacent points, further rationalizing the initial scale. Then, the 3D GS-based reconstruction method generates a 3D Gaussian distribution from the initial sparse point cloud and optimizes the addition/removal of Gaussian distributions to enhance scene representation. Finally, we use TreeQSM [
30,
31,
32,
33] to generate the QSM for analyzing branch structure and feature parameters.
Figure 2 is the flowchart of our work. The method proposed can effectively reconstruct landscape trees with different branch structures and extract tree feature parameters.
3.2. Generation of Sparse Point Cloud
In this study, the COLMAP tool was used to generate sparse point cloud. COLMAP(3.9.1) is a widely used Structure from Motion (SfM) [
34,
35] multi view stereo (MVS) reconstruction software that can generate point cloud data from images from multiple perspectives. The following is the detailed process of generating sparse point clouds using COLMAP.
Image preprocessing and feature extraction Firstly, COLMAP preprocesses the input images and extracts feature points from each image. COLMAP uses a feature extraction algorithm based on SIFT (Scale Invariant Feature Transform) [
36], which can effectively extract robust key point features from images. Then, these features will be matched between different images to find corresponding points of the same 3D scene from different perspectives.
Feature matching and camera pose estimation After feature extraction and matching, COLMAP calculates the relative position and pose of the camera through algorithms. Firstly, it performs Incremental Structure from Motion to gradually estimate the camera’s motion trajectory. This process determines the position and orientation of each image relative to the global coordinate system by calculating the relative position and orientation between image pairs. COLMAP estimates the position of 3D points based on feature matching results and camera parameters.
Sparse point cloud reconstruction Through the above steps, COLMAP can restore the shared 3D feature points in the image. These feature points are called “sparse point cloud” because they are matching points extracted from different images, with each point representing a position in three-dimensional space. Although the density of the sparse point cloud is low, it provides a preliminary 3D scene structure for subsequent dense reconstruction.
Optimization and post-processing After generating the initial sparse point cloud, COLMAP will globally optimize the camera pose and 3D points to reduce reconstruction errors. This is usually achieved through an optimization method called “Bundle Adjustment” (BA), aimed at improving reconstruction accuracy by minimizing reprojection errors. Ultimately, COLMAP will output an accurate sparse point cloud that contains the 3D coordinates of each feature point in the scene.
Output result Finally, COLMAP saves the generated sparse point cloud in PLY, LAS format or other common formats for use in subsequent 3D reconstruction algorithms. These sparse point cloud data are the foundation for subsequent fine reconstruction, helping to further restore the geometric shape of the scene.
The sparse point cloud generated by COLMAP can provide a rough 3D structure of the scene at a lower computational cost. Although these point clouds are sparse and unevenly distributed, they can provide necessary preliminary data support for image-based 3D reconstruction.
3.3. 3D Reconstruction Method Based on 3D Gaussian Splatting
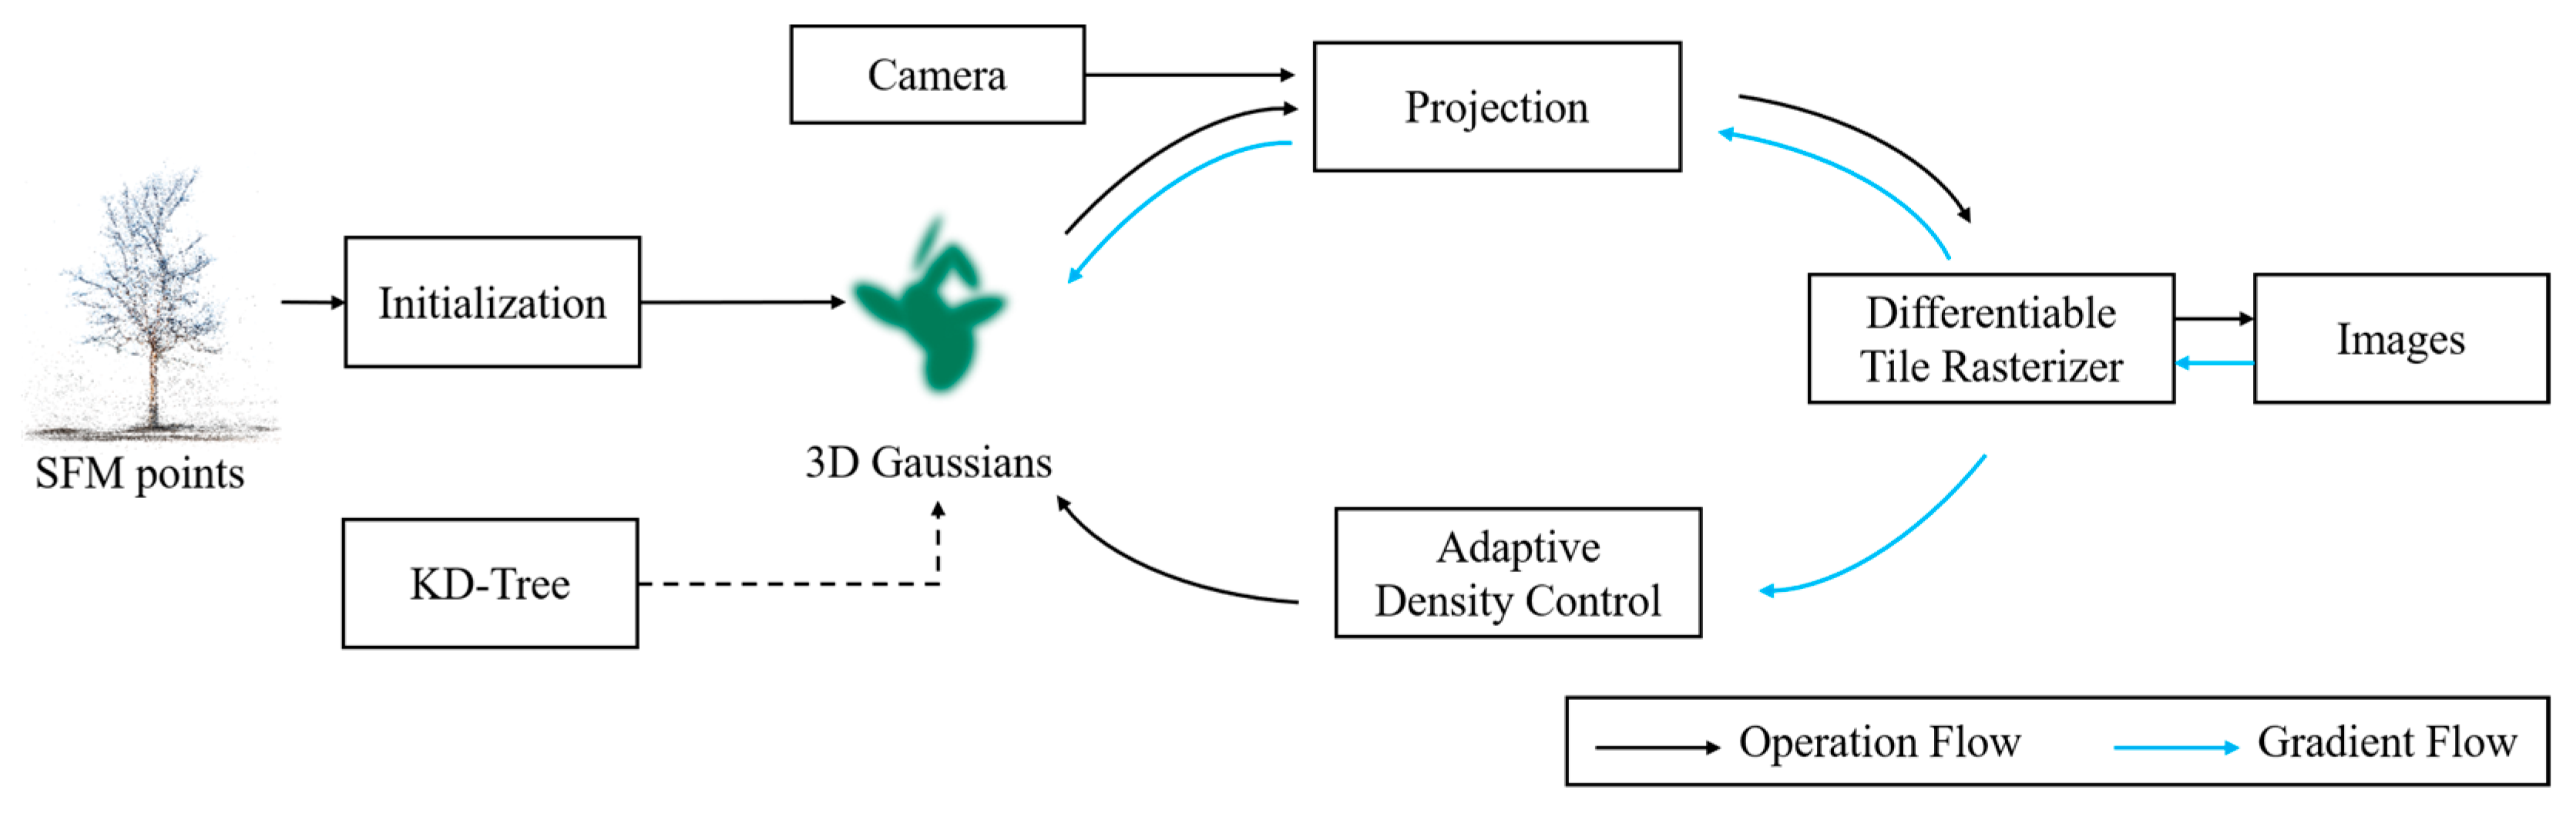
In this section, we introduce the process of reconstruction based on 3D GS. This paper did not change the method greatly, merely making it fit our needs; we added KD-Tree optimization for Gaussian kernel initial generation in this method.
Figure 3 shows the structure of the method.
The input of the 3D GS method is sparse point clouds generated by combining a set of static scene images with corresponding cameras calibrated by SfM. This method uses 3D Gaussian representation of the scene and optimized anisotropic covariance for scene optimization, with adaptive density control on interleaving to achieve accurate representation of the scene while avoiding unnecessary calculations in blank space. Three-dimensional Gaussian is a differentiable volume representation, where the properties of a 3D Gaussian include its center (position)
, opacity
, 3D covariance matrix
, and color
. All attributes are learnable and optimized through backpropagation. Among them, direct optimization of
may result in non-positive definite matrices. Therefore, 3D GS chooses to optimize a quaternion
and a three-dimensional vector
.
,
represent the rotation and scaling matrices, and
is represented as follows.
A key part of the method is adaptive density control, which involves adding and occasionally removing Gaussians during the optimization process. The point dense process clones small Gaussians in areas with insufficient reconstruction or splits large Gaussians in areas with excessive reconstruction. The pruning process removes almost transparent Gaussians and saves computational resources.
We introduced the KD-tree method in our approach to further calculate the Gaussian kernel scale reasonably, which was added to the initialization of the Gaussian kernel scale, we set k=3, which means the initial scale is the average distance between 3-nearest neighbors, making Gaussian kernel initialization more reasonable. KD-Tree (k-dimensional tree) is a hierarchical tree data structure used for efficiently organizing multidimensional spatial data, widely used in scenarios such as Nearest Neighbor Search, Range Query, and spatial partitioning. The core idea is to recursively divide the k-dimensional space into two parts along the coordinate axis, forming a hierarchical spatial division. The construction steps are as follows.
Input K-dimensional dataset .
Output KD-Tree root node.
Select the segmentation dimension, calculate the variance of all dimensions, and choose the dimension with the highest variance
:
Determine the segmentation point and take the median value
on dimension
:
Partition dataset, left subtree: , right subtree: .
Recursive construction; repeat steps 1–3 for the left and right subtrees until the termination condition is met.
3.4. QSM and Feature Parameter Extraction
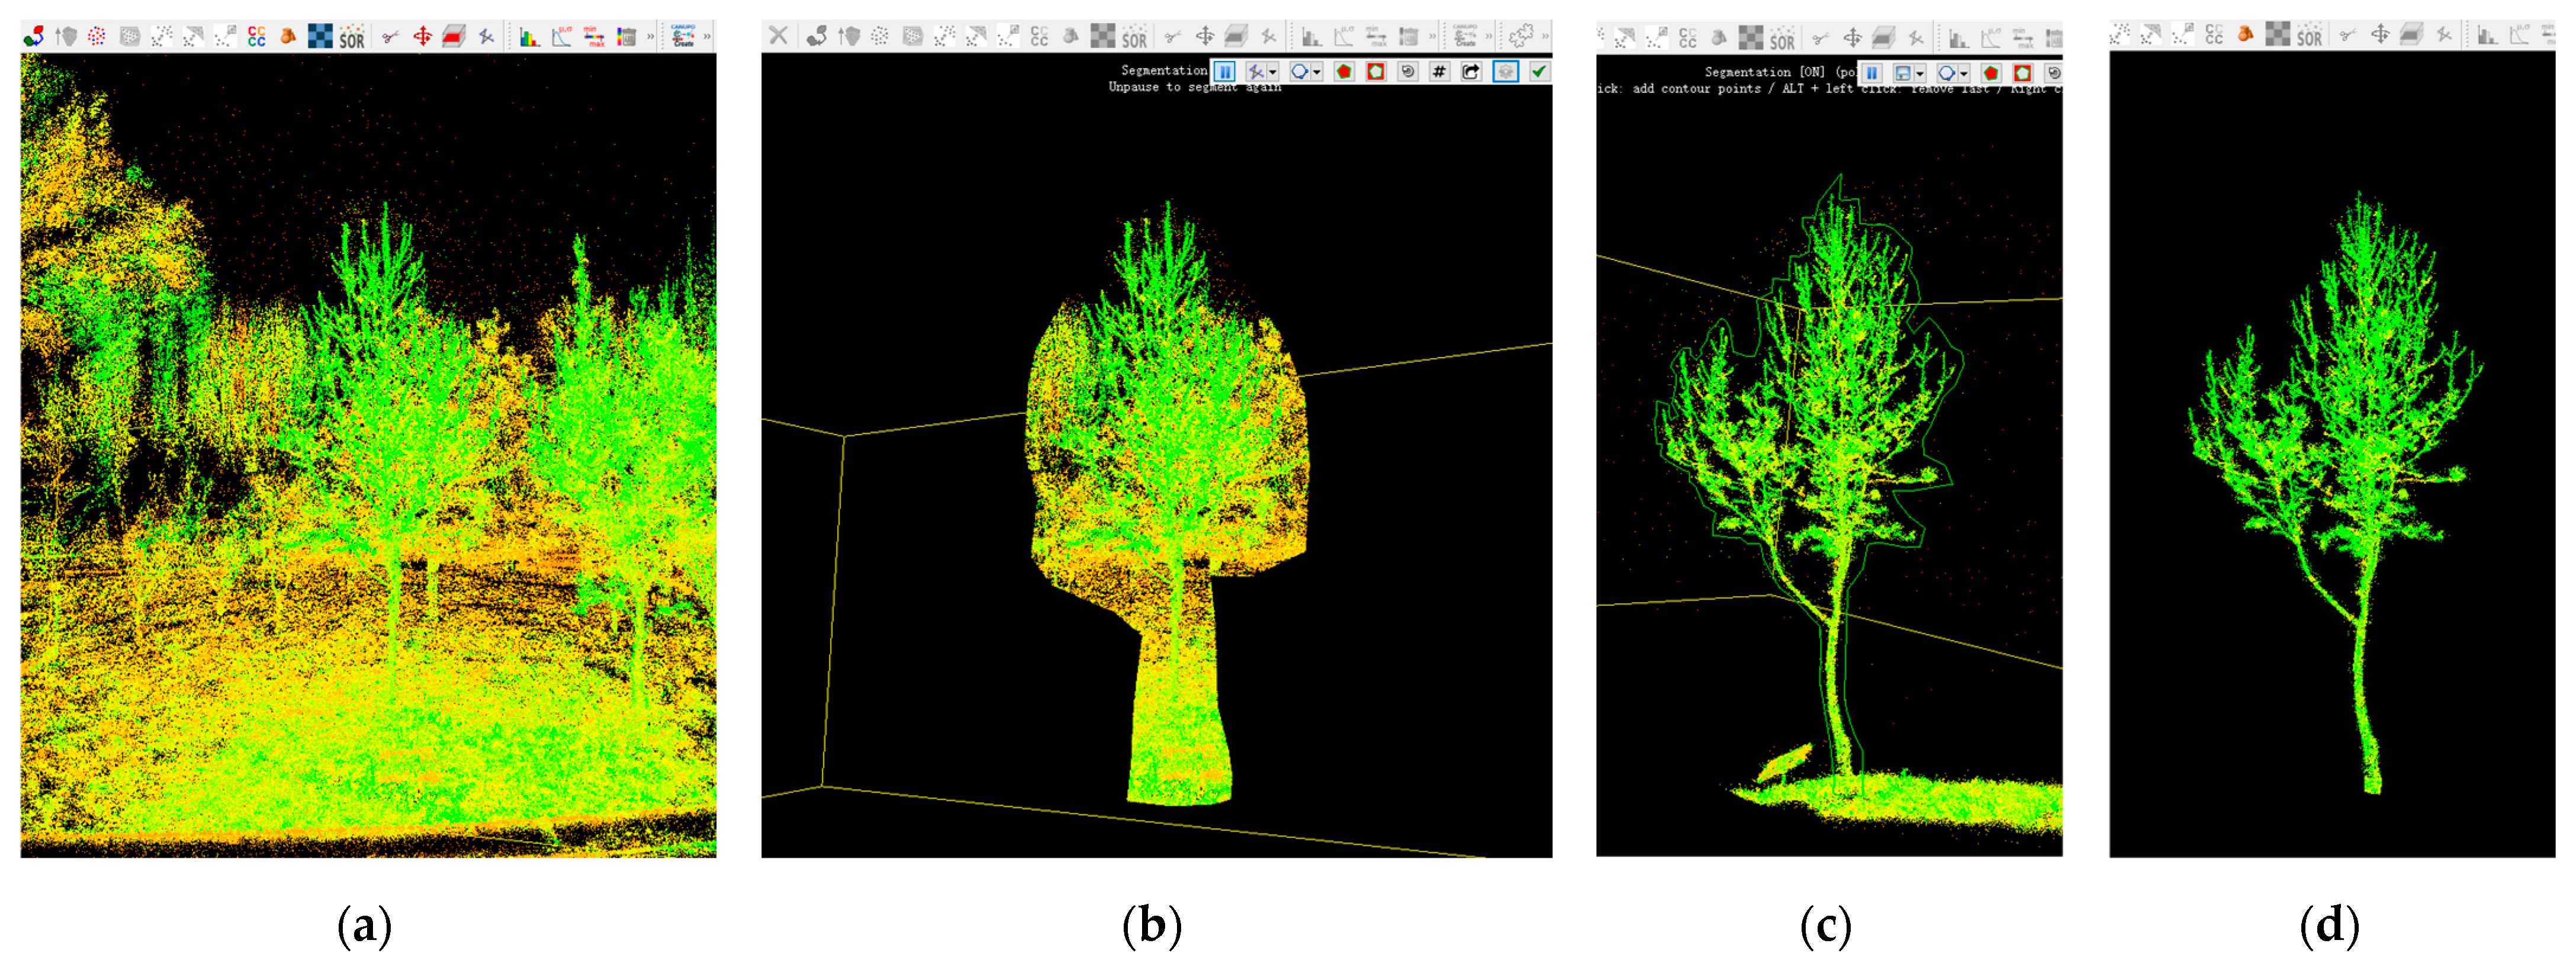
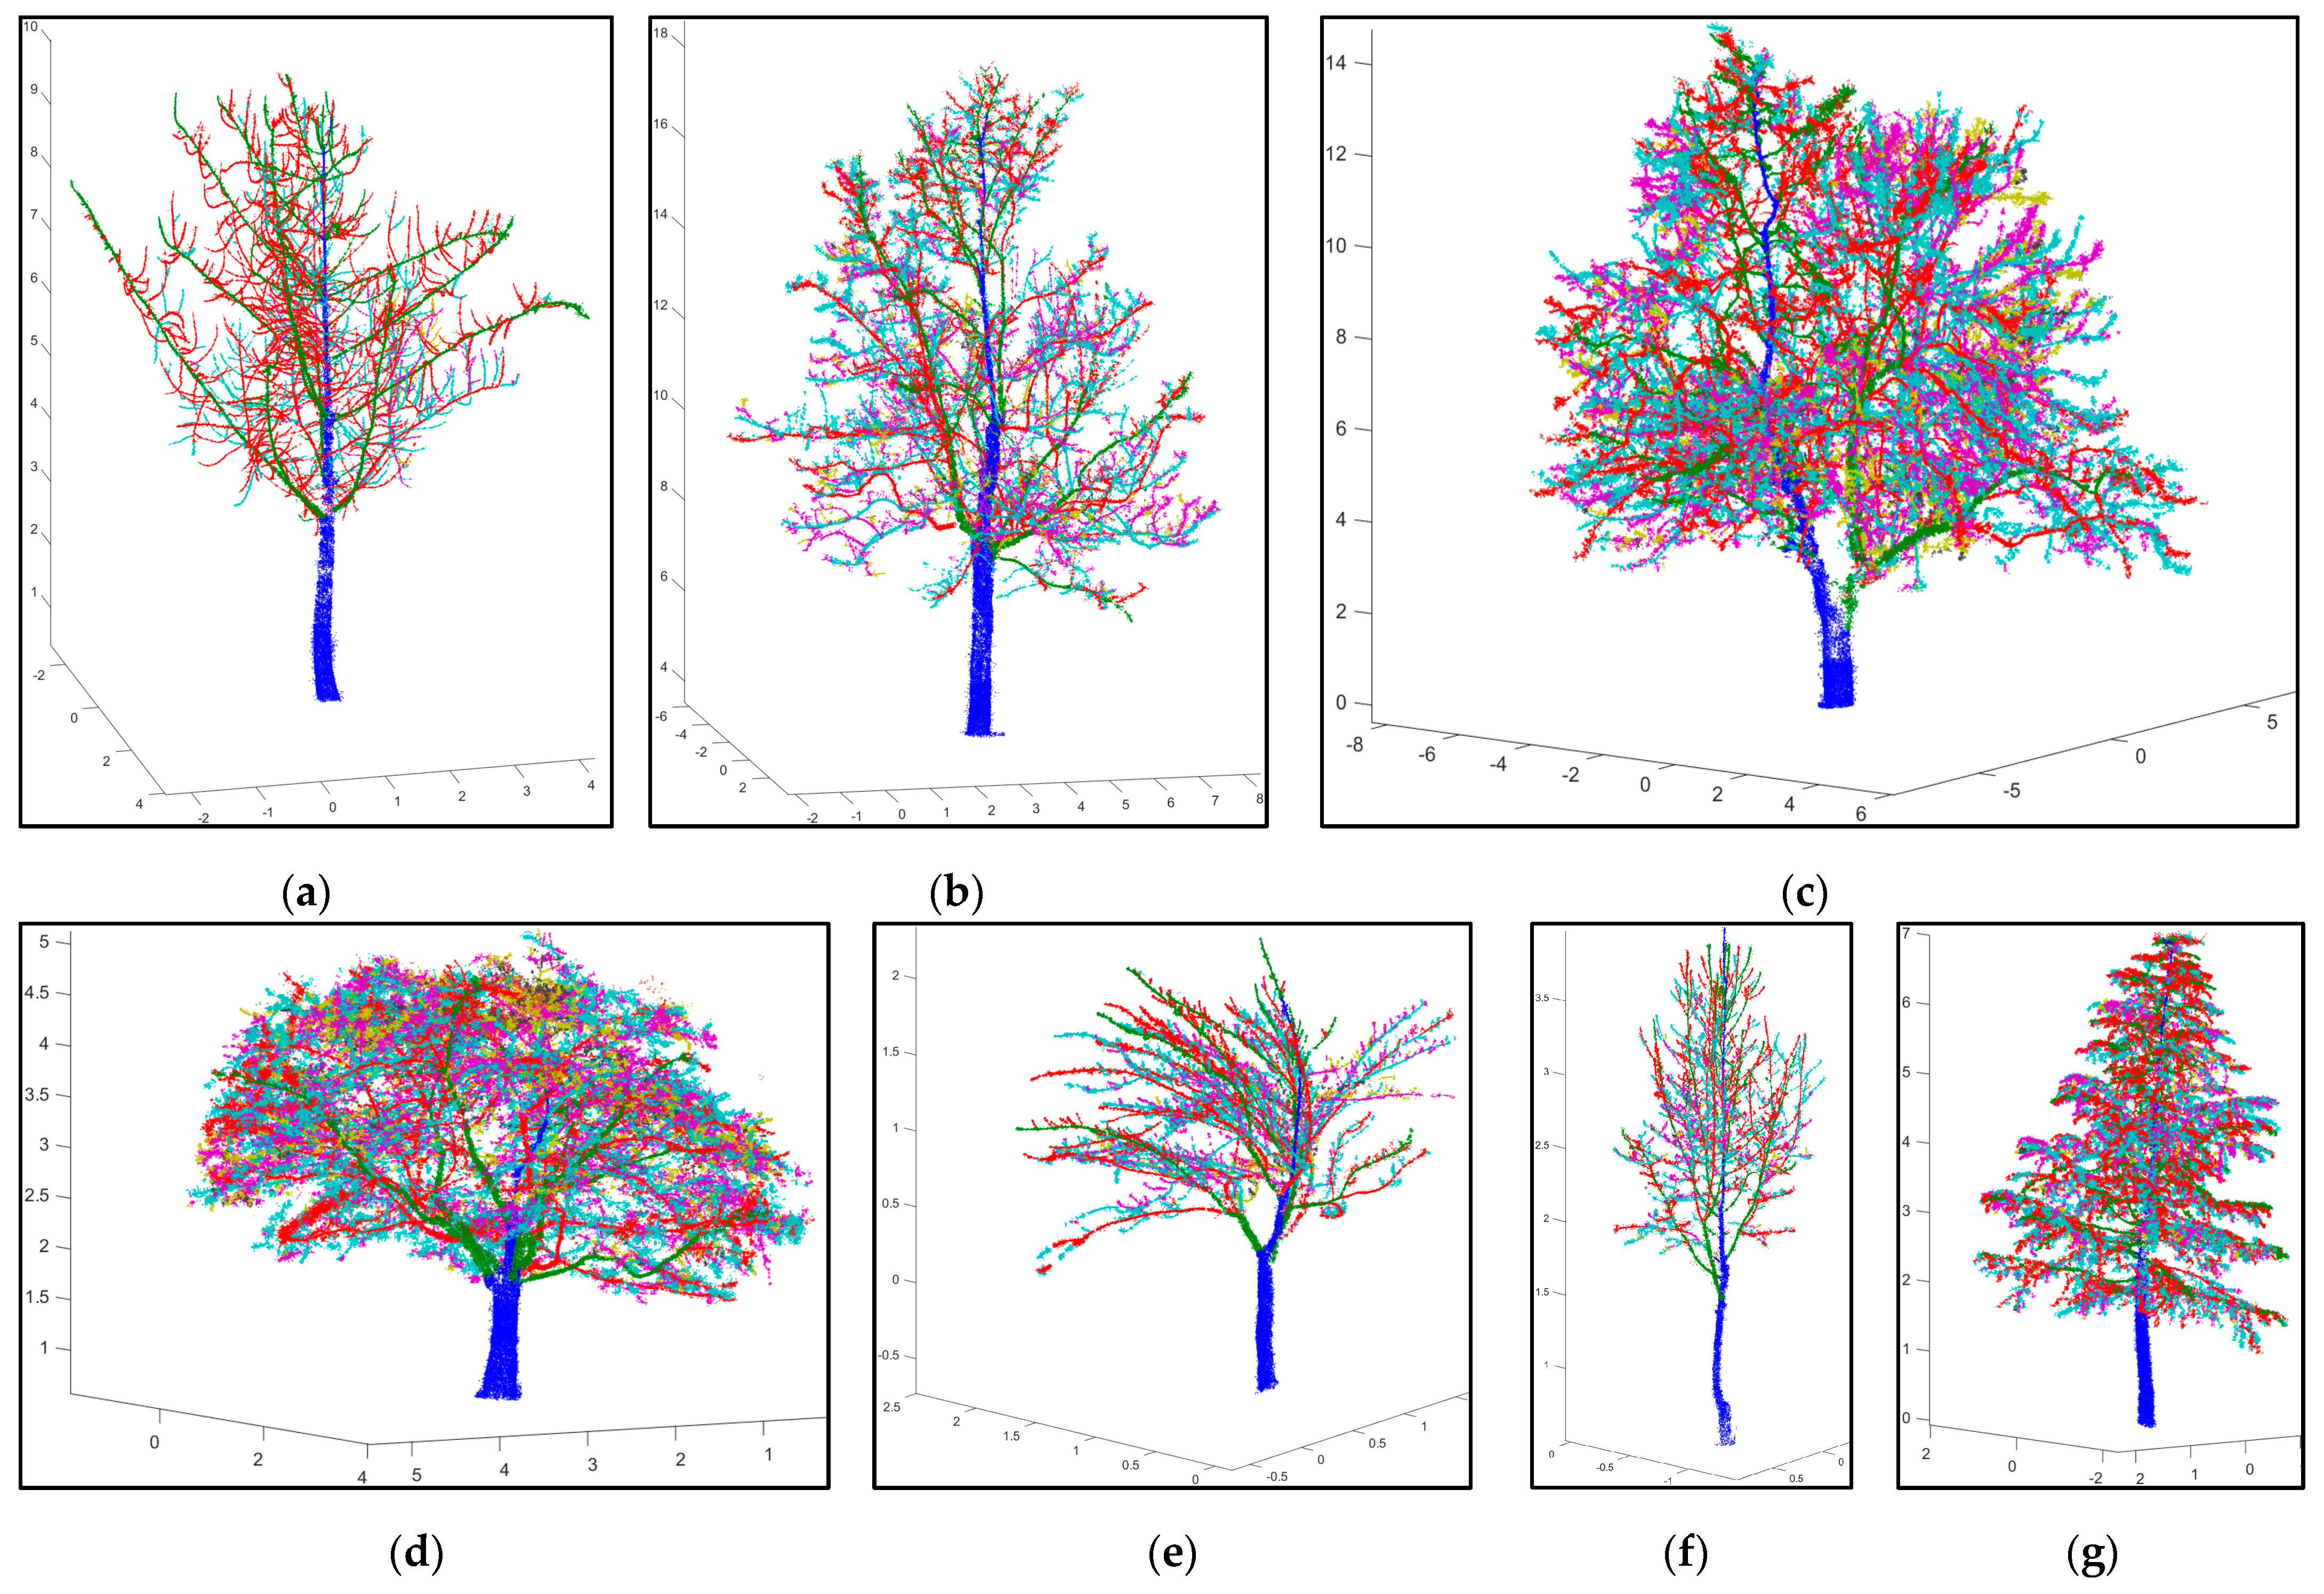
This article uses the TreeQSM method to construct a QSM model from the tree point cloud obtained from 3D reconstruction, and obtains the QSM model and tree feature parameters of each landscape tree. TreeQSM(v2.4.1) is a free and open-source MATLAB(R2023b) software program with high precision, high compilation, fast working speed, and high reliability. In most cases, the model can accurately estimate tree parameters such as parent–child relationships between branches, the number of branches, and the angles and lengths of these branches. The surface area and coverage area of the canopy, canopy closure, and other parameters can be obtained. But the input of point clouds of this method performs better when it only contains the branches of trees, so we manually segment the reconstructed point clouds, removing the point clouds of the background environment and only retaining the point clouds of the branches of trees. The manual segmentation is performed using CloudCompare(v2.13.1) software, which provides a user-friendly visual interface and convenient segmentation tools, and is widely used for point cloud processing tasks. It supports spatial rotation, allowing us to view a point cloud at any angle and select polygon areas. This software can achieve fast and accurate segmentation. We segment the target object by selecting several perspectives that cover 360 degrees in the same coordinate direction, and then perform spatial rotation inspection to complete the segmentation work.
Figure 4 shows the process of manual segmentation using CloudCompare.
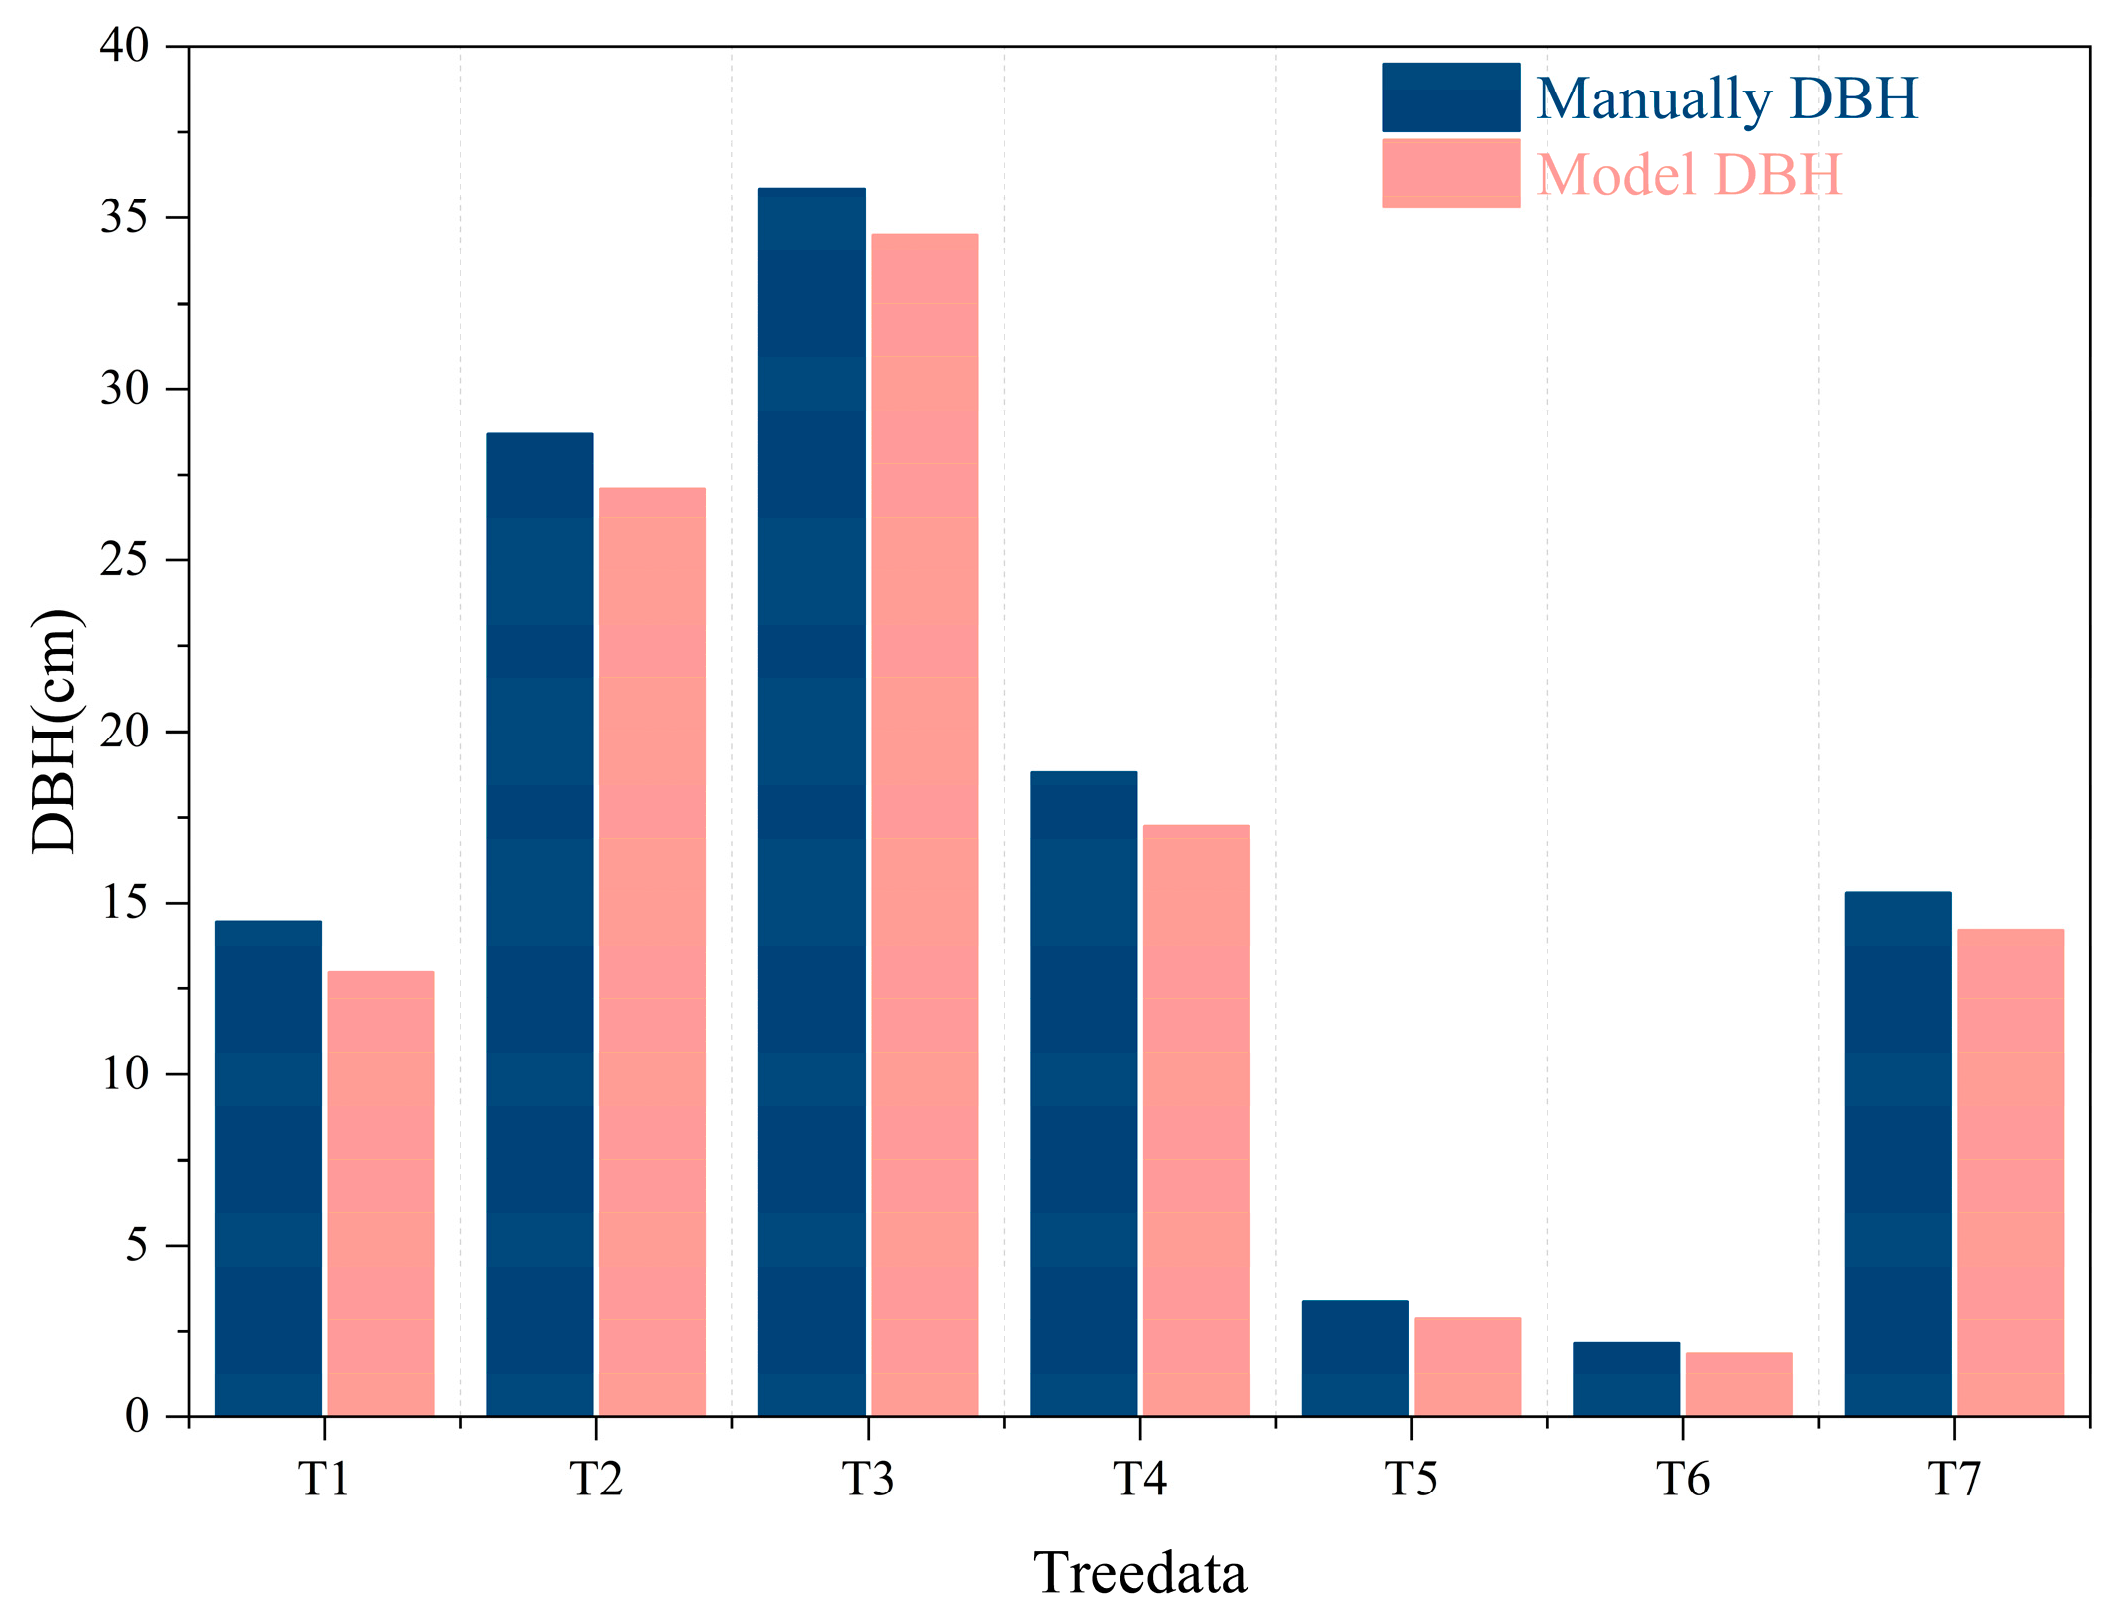
This article focuses on the reconstruction of branching structures; therefore, the landscape tree’s diameter at breast height obtained from the QSM model and the point cloud branching segmentation model were analyzed and compared with the manually measured data.
3.5. Training and Performance Measurement
In this section, we will provide a more detailed introduction to the training process and parameters of the 3D reconstruction model, as well as how we validate our 3D reconstruction model. All data processing, model training, and testing are conducted on the same personal computer. During the model training process, Nvidia 4070 GPU is used for CUDA accelerated computation. The 3D Gaussian Splatting method uses the method suggested by Mip-NeRF360 [
37] to train/test the dataset, with testing conducted every 8 photos. During the training process, the order of the spherical harmonic function is increased every 1000 iterations to gradually improve the model’s expressive power. The learning rate of each parameter is dynamically adjusted using the adaptive learning rate in the Adam optimizer to gradually converge the loss function. Meanwhile, to avoid an unreasonable increase in Gaussian distribution, the opacity parameter is reset every 1000 iterations.
In this study, we evaluated the 3D reconstruction effect of landscape trees from two aspects: visual realism, comparing the similarity between the reconstructed model and real image data, and comparing the branch structure and QSM feature parameters of the reconstructed model with real values. These two comparisons demonstrate the effectiveness of our method.
We use common evaluation metrics in the field of 3D reconstruction, such as PSNR, SSIM, and LPIPS [
38], to evaluate the similarity, pixels, and so on between the reconstructed image and the real image.
PSNR (Peak Signal to Noise Ratio) is one of the most commonly used image quality assessment metrics, primarily used to measure the quality of image reconstruction or the difference between compressed and original images. The larger its value, the smaller the distortion and the better the image quality. The formula is as follows.
represents the maximum possible value of an image pixel (usually 255 for 8-bit images).
stands for Mean Squared Error, which is calculated by taking the difference between two images pixel by pixel, then squaring and taking the average.
PSNR ≥ 30 dB, it is difficult for the human eye to detect image distortion, meaning that the test image is very close to the original image.
20 dB ≤ PSNR < 30 dB indicates that the human eye can perceive some differences in the image, but these differences are usually not too obvious.
10 dB ≤ PSNR < 20 dB means that the human eye can clearly see the differences in the image, but still recognize the basic structure of the image.
SSIM (Structural Similarity Index) is an indicator that measures the structural similarity between two images, taking into account brightness, contrast, and structural information. The range of SSIM values is [−1,1], and the closer the value is to 1, the more similar the two images are. The formula is as follows.
and are two images to be compared.
and are the average brightness values of image and , respectively.
The brightness variances of images and are represented by and , respectively.
is the brightness covariance between image and .
and are constants used for stable calculations, usually set to a smaller positive value.
LPIPS (Learned Perceptual Image Patch Similarity), also known as “perceptual loss”, is a deep learning-based image quality assessment metric that extracts image features through neural networks and calculates the distance between features to measure image similarity. The smaller the value of LPIPS, the more similar the image. We have chosen a pretrained AlexNet network as the feature extractor here.
We use the point clouds obtained during the 3D reconstruction process of landscape trees to generate a QSM, and compare the extracted branch order and diameter at breast height of the model with manually measured values.
Diameter at Breast Height (DBH) is a key indicator used in forestry and ecology to describe the thickness of trees. It is usually defined as the diameter of the tree trunk at a height of 1.3 m above the ground. For irregular trunks, the diameters in two vertical directions need to be measured and averaged. DBH is an important parameter for evaluating the growth status, biomass, and carbon storage of trees [
39]. This article evaluates the relative error between the QSM parameters of DBH and the manually measured values. Relative error is an indicator that measures the deviation between a measured or calculated value and the true value, typically used to evaluate the accuracy of an experiment or calculation. The calculation formula is as follows.
Branching Order describes the topological hierarchy of a tree’s branching structure, gradually increasing from the main stem (order 1). The Maximum Branching Order refers to the maximum branching level in a tree, used to describe the complexity of the tree’s branching structure and the degree of crown development. Here, we use the hierarchical branching reconstruction rate for evaluation, and the formula is as follows.
These indicators have important applications in forestry, ecology, and tree modeling, helping researchers quantify the morphological characteristics and growth status of trees.
5. Discussion
5.1. Evaluation of Our Method
This study proposes a 3D reconstruction method for landscape trees based on 3D GS. The KD-Tree is introduced to optimize Gaussian kernel generation, and the QSM model is used to generate parameters. This method merely requires image data as input to obtain a 3D reconstruction effect that conforms to tree growth structures, with a 3rd-order branch reconstruction rate of 100%, DBH error less than 1.59 cm, and relative error between 3.8% and 14.6%, which demonstrates the enormous potential of this method in tree structure reconstruction and expands the research direction of landscape tree 3D reconstruction. The current research lacks sufficient emphasis on tree branch reconstruction and is not suitable for reconstruction scenarios of landscape trees. For landscape design and the maintenance management of landscape trees, this method can achieve low-cost and effective reconstruction, reconstructing landscape trees of different shapes that conform to the growth laws of trees, and providing digital support for landscape greening layout design. Our method can also be extended to the field of urban forestry by combining with drone image acquisition to achieve synchronous modeling of multiple trees. Moreover, the reconstruction of point clouds combined with deep learning segmentation algorithms can quickly extract tree feature parameters, making high-precision non-destructive growth monitoring, maintenance, and risk assessment of urban forestry possible, providing new ideas for urban forestry management platforms. However, there are limitations in large-scale scenarios. Firstly, there are many types of trees in urban forestry, and deep learning segmentation algorithms and generalization require a large number of tree images or point clouds as training data to achieve good results. Secondly, using methods based on drones and ground radar often leads to high costs and operational difficulties. Finally, this method relies on the information expressed by multi view images, which may lead to excessive overlapping and missing perspectives in high-density green spaces, resulting in poor reconstruction models.
Overall, our method can reconstruct the branching structure of real trees with high visual realism, providing digital support for pruning robots in landscape branch shape design and maintenance management. This provides a reliable technical approach, new ideas, and a research direction for the 3D reconstruction of landscape trees. And it has certain scalability with great potential in the field of urban forestry.
5.2. Comparison with Similar Methods
Our method focuses on the branching structure of landscape trees, and there are a few similar methods that mostly reconstruct trees in the leaf stage. Therefore, we extract the branching parts of the results from existing methods for display.
Figure 11a,b are schematic diagrams of the research results [
12]. As shown in
Figure 11, it can be seen that there are still differences between the curvature of other model branches and the actual branches, and the curvature of the branches is almost ignored. In contrast, our method has high similarity between branches and real branches. This demonstrates the effectiveness of our method in tree structure reconstruction, which can reconstruct tree models that conform to tree growth patterns.
5.3. Future Work
Through summarizing existing work, we have identified three areas that need to be optimized. Firstly, in landscape trees with branch levels higher than 5th-order or tree heights greater than 20 m, due to the limitation of GPU devices’ computing speed, the resolution of the image acquisition camera device is limited to 1080 × 1920 to ensure normal reconstruction operation, resulting in a loss of details in the landscape tree and unsatisfactory reconstruction results. This is also the reason why the DBH of the reconstructed trees is smaller than the manually measured value. If we do not consider reconstruction time or better GPU devices, a higher resolution image input may improve the effect. Our future work is to optimize methods to accelerate rendering time with higher resolution input. Secondly, in areas with dense trees, the collected data may be obstructed, and branches are prone to overlap and adhere. Difficulty in data collection and the generation of sparse point clouds makes our method unsuitable for trees with overly dense surroundings. However, in practical scenarios, occlusion is inevitable. Therefore, the reconstruction of dense scenes is also a key focus of our future research. Finally, by combining point cloud segmentation algorithms, batch tree parameter extraction can be achieved, providing a more comprehensive automated method for the digital management of urban forestry. In the follow-up work, we will try to combine segmentation algorithms to achieve further functional expansion.
6. Conclusions
This article aims to obtain a 3D reconstruction method for leafless landscape trees, in order to achieve high structural fidelity and realistic reconstruction of landscape trees. We divide our work into comparing reconstruction methods, constructing landscape tree datasets, 3D reconstruction based on 3D Gaussian Splatting, extracting tree parameters based on QSM, and evaluating reconstruction models. Traditional modeling methods have limitations in restoring tree branch topology. Therefore, reconstructing real leafless trees is a suitable approach undoubtedly. We focus on the 3D reconstruction of leafless landscape trees based on 3D GS. Our method demonstrates positive 3D reconstruction performance on tree datasets with different branching structures. In terms of the visual aspect, quantitative evaluation shows that the PSNR of the method is above 24.22, the SSIM is above 0.801, and the LPIPS is below 0.157, indicating that the visual difference is not significant between the 3D reconstruction model and the real tree. In terms of reconstructing point clouds, the error of the DBH is below 1.59 cm, and the relative error is 3.8–14.6%. The reconstruction rate of the 3rd-order branch reaches 100%, and it can also reconstruct some 4th-order branches or terminal branches with a diameter > 0.5 cm, indicating that this method can effectively reconstruct tree structures and has great potential for expansion in the urban forestry field. Compared with traditional 3D modeling, our method based on 3D GS has significant advantages in providing digital models for landscape design and management, providing new ideas and research directions for creating high-precision 3D reconstruction methods for leafless landscape trees.

 ,
, 


