1. Introduction
The oceans play a critical role in the global climate system, and the sea surface temperature (SST), as a key parameter of the climate and the marine environment, holds significant importance in marine science, atmospheric science and climate change research [
1]. SST acquisition methods are primarily divided into two categories: in situ measurements and satellite remote sensing observations. In situ data are obtained from sea buoys and coastal stations, offering high accuracy. However, they are limited by poor spatial continuity and temporal synchronization due to the constraints of the buoy distribution and ship routes [
2]. Satellite remote sensing, on the other hand, offers advantages such as all-weather capabilities, near-real-time data acquisition, broad spatial coverage and repeatability over extended periods, effectively compensating for the limitations of in situ measurements [
3]. Among the various remote sensing techniques, infrared and microwave remote sensing are the primary methods used to acquire SST data. Infrared remote sensing provides a high spatial resolution, but it struggles to obtain accurate data under cloud-covered conditions [
4]. In contrast, microwave remote sensing can penetrate clouds, enabling all-weather observations, although it suffers from a lower spatial resolution and is more vulnerable to environmental factors [
5]. To address the limitations of individual data sources and fully leverage the strengths of different data types, multi-source data fusion has become an essential approach in obtaining more accurate SST data.
Early SST fusion methods primarily relied on simple statistical interpolation techniques, such as optimal interpolation (OI). The OI method minimizes the error variance to fuse multi-source data; however, it struggles in retaining spatial details and does not effectively account for the impact of cloud-covered regions on SST data [
6]. To address these limitations, fusion methods based on physical models were subsequently developed, including the variational (VAR) method and Kalman filter (KF). VAR enhances the fusion accuracy by incorporating physical constraints but suffers from high computational complexity, requiring substantial resources, and has limited adaptability in cloud-heavy regions [
7]. The KF allows for dynamic updates of the fusion results but encounters challenges in handling nonlinear problems, particularly in regions with dense cloud cover, where the filter accuracy deteriorates [
8]. Additionally, Bayesian theory-based fusion methods, such as Bayesian maximum entropy (BME), improve the fusion accuracy by constructing complex probabilistic models. However, these methods have high computational costs, intricate model construction processes and reduced efficiency in cloud-covered regions [
9]. To further enhance the accuracy, Shi et al. [
10] employed wavelet analysis to fuse MODIS and AMSR-E SST data over the China Sea and Northwest Pacific in 2005. This method effectively preserved oceanic details and reduced errors but had limited applicability to different data types. Zhou et al. [
11] integrated the OI method with a physical model-based bias correction technique to generate high-precision, time-sequenced SST fusion products for the Northwest Pacific. When compared with Argo buoy data, the fusion results achieved an average bias of 0.3–0.5 °C and an RMSE of 0.6–0.8 °C. Ding et al. [
12] validated OI- and BME-based fusion methods using iQuam and Argo buoy measurements, demonstrating that, while BME slightly outperformed OI, its higher computational cost remained a challenge.
In recent years, the application of machine learning methods in SST data fusion has gradually become a major research topic. Compared with traditional methods, machine learning techniques do not rely on a priori physical models, can automatically learn features from a large amount of data and have stronger adaptability. Kim et al. [
13] presented a study on the application of a generative adversarial network (GAN) to SST data fusion. GANs are able to generate highly accurate SST data through the adversarial training of generators and discriminators and significantly improve the visualization and accuracy of the data. Compared with traditional fusion methods, the GAN shows strong adaptability in dealing with the effects of cloud cover and is able to generate SST data that are closer to the reality. However, the GAN method relies on a large amount of training data and its generalization ability still needs to be further verified. Similarly, Sihun J et al. [
14] proposed an SST fusion method integrating convolutional neural networks (CNNs) with deep reinforcement learning. This approach leverages CNNs for feature extraction while employing reinforcement learning to optimize the fusion strategy, effectively addressing the impact of cloud cover and improving the data accuracy. However, challenges remain, including the high demand for training data, extended training durations and the need for better real-time adaptability to cloud cover variations.
In summary, SST fusion methods still face numerous challenges. The OI method tends to lose spatial details, while the VAR method and KF struggle in accurately computing the error variance. Bayesian model-based approaches, although capable of improving the fusion accuracy, are computationally complex and slow. Meanwhile, neural network-based methods require large volumes of historical training data [
15,
16,
17,
18]. Additionally, existing fusion methods generally lack targeted strategies to handle different cloud cover conditions. To address these limitations, this study proposes a multi-source SST weighted fusion method tailored to cloud-covered conditions. This approach not only effectively overcomes the limitations of traditional methods in regions affected by cloud cover but also maintains algorithmic simplicity and high computational efficiency. Compared with existing techniques, the proposed method offers greater portability, making it well suited for SST fusion across multiple oceanic regions and diverse data sources. Duan et al. [
19] first introduced and applied this method in surface temperature fusion, achieving promising results. However, its application in SST fusion remains unexplored, presenting a novel avenue for further research.
This study proposes a multi-source SST weighted fusion method designed for cloud-covered conditions. To evaluate its effectiveness, three global SST datasets with different periods, spatial resolutions and sensor sources—both domestic and international—are selected and analyzed, with a particular focus on extreme weather anomalies in the South China Sea. The paper begins by introducing the satellite datasets used in this study, including FY-3C VIRR, FY-3C MWRI, AVHRR, MODIS and AMSR-2 radiometer data, along with iQuam buoy data for validation and OISST data as a reference. It then details the principles of data preprocessing and the weighted fusion method adapted for cloud-covered conditions. The proposed method is assessed in terms of both spatial coverage and accuracy, followed by a focused analysis of its performance in the South China Sea region. Finally, the methodology is evaluated and summarized, highlighting its advantages and potential applications.
3. Fusion Methods
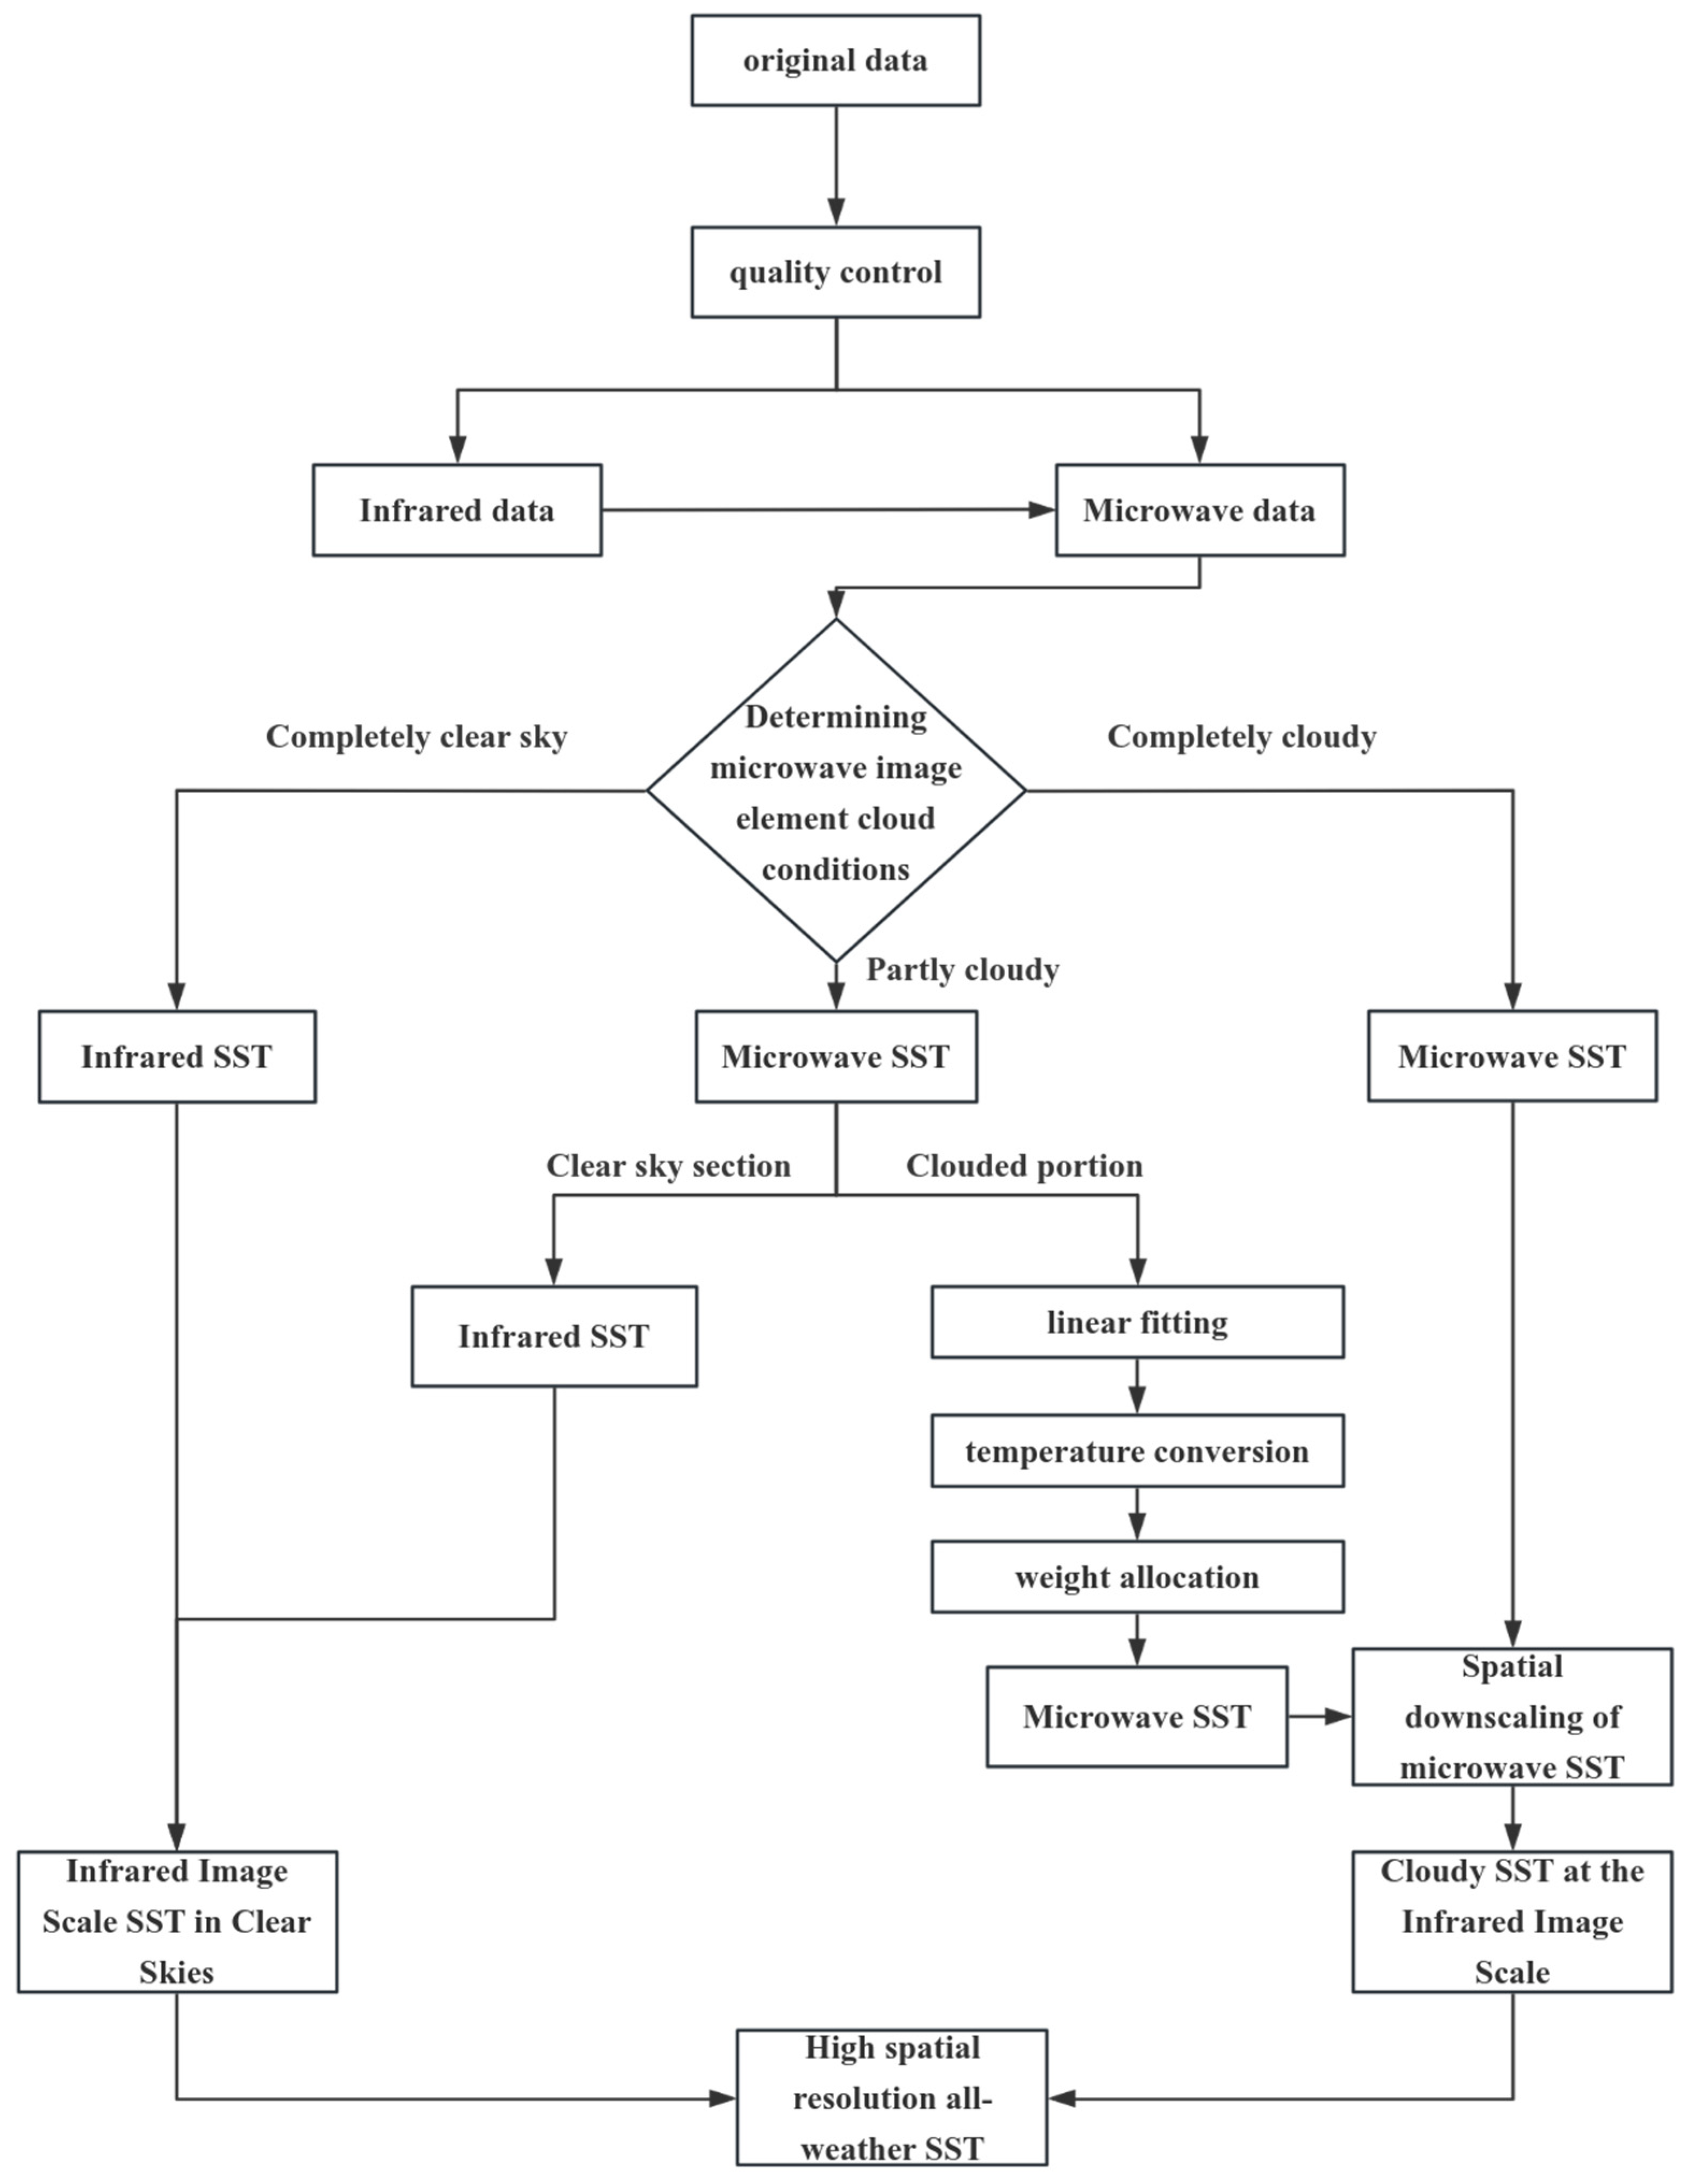
The methodology for the fusion of SST data is divided into two main parts. The first part is the quality control of the raw data to ensure that the data used have sufficient accuracy and reliability. The second part is based on the cloud conditions of the microwave image elements. According to the different situations in terms of cloud conditions, including completely clear skies, partially cloudy and completely cloudy, the corresponding processing methods are adopted, and the flow chart is shown in
Figure 1.
In the ideal situation of a completely clear sky, infrared remote sensing can be directly utilized to obtain the SST. In the case of partially cloudy conditions, it is necessary to differentiate the clear-sky part of the microwave SST from the cloudy part, in which the cloudy part requires us to take into account the calculation of the weight of the percentage of cloud coverage and, at the same time, perform the conversion of the cortex and subcortex temperatures and combine the microwave and infrared remote sensing data to perform linear fitting and other operations. In the case of completely cloudy conditions, since the infrared remote sensing data cannot provide an effective SST, the microwave remote sensing data will be the main data source, and the SST on the infrared scale will be obtained by the downscaling method. This fusion method, by differentiating among different cloud conditions, finally obtains SST data with a high spatial resolution and all-weather coverage.
3.1. Data Preprocessing
For satellite, measured and reference data, the data integrity is checked to ensure that no data are missing or corrupted. Based on the quality identifiers attached to each experimental datum, the data with the highest quality markers were selected. In view of the differences in the formats of the different data sources, they needed to be converted into a uniform format for subsequent processing. Because of the differences in the latitude and longitude starting points of the data, all the experimental data were precisely adjusted for latitude and longitude matching so that they were under the same latitude and longitude system, seeking to ensure the consistency of the spatial location of the data from different sources.
The VIRR and MWRI satellite data are stored in HDF format, while the other datasets are in netCDF format, necessitating conversion into a unified netCDF format for subsequent processing. The MODIS data must be filtered to exclude land areas using sea and land markers, retaining only the SST data over the ocean. Prior to fusing the satellite data, a bilinear interpolation method is applied to the infrared satellite data, interpolating them onto a 25 km grid. This ensures that the spatial resolution is consistent with that of the microwave data, providing a unified dataset for subsequent processes such as linear fitting and improving the comparability and synergy between the data sources.
The measured buoy data, on the other hand, are stored in column format. The high-quality data are first filtered based on quality identifiers and then converted to the same grid format as the other experimental data using nearest-neighbor interpolation. This process ensures the accurate evaluation of the data’s accuracy.
3.2. A Weighted SST Fusion Method Based on Cloud Conditions
The algorithm divides the fusion process into three categories based on the cloud conditions: fully clear sky, fully cloudy and partially cloudy. A targeted strategy is then applied to achieve effective fusion. The fusion of infrared SST (V SST) under clear sky conditions and microwave SST (M SST) under cloudy conditions is as follows.
To perform sea surface temperature fusion, the cloud conditions need to be categorized into three scenarios based on the M image element: completely clear, completely cloudy and partially cloudy.
(1) If the M image element corresponds to a completely clear sky, meaning that the V image elements associated with the M image elements are also clear, the sea surface temperature from the V image element is directly used as the fused SST.
(2) If the M image element is fully cloudy, meaning that the corresponding V image elements are all cloudy, the SST estimated from the M data needs to be spatially downscaled to the V image element scale as the final SST.
If the M image element is fully cloudy, meaning that the corresponding V image elements are all cloudy, the SST estimated from the M data must be spatially downscaled to the V image element scale as the final SST. In the presence of clouds, ocean temperatures are more homogeneous across different depths, and the V skin temperature and M sub-skin temperature are approximately equal. Therefore, when the M image is fully cloud-covered, there is no need to convert the M sub-skin temperature to the surface temperature. Instead, the M sea temperature is spatially downscaled to match the V image scale. This spatial downscaling of the M SST is performed using bilinear interpolation, resulting in the final SST on the V image element scale under cloudy conditions.
(3) If the M image element corresponds to a partially cloudy condition, meaning that the corresponding V image element is partly cloudy and partly a clear sky, it is necessary to first separate the SST of the cloudy portion from that of the clear-sky portion within the M image element. Then, the SST of the M image element can be expressed as the area-weighted sum of the SST of the cloudy part and the clear-sky part of the SST within its image element:
where
is the sub-skin temperature of the M image element;
is the sub-skin temperature of the clear-sky portion within the M image element;
is the sub-skin temperature of the cloudy portion within the M image element;
P is the weight occupied by the clear-sky portion within the M image element; and its value can be computed from the V image element corresponding to the M image element.
Under clear-sky conditions, the ocean temperature exhibits a gradient at different depths, making the difference between the skin and sub-skin temperatures non-negligible. To address this, a linear fitting approach is applied to establish the conversion relationship between the M sub-skin temperature and the V skin temperature under clear-sky conditions:
where
is the sub-skin temperature in the clear-sky case,
is the skin temperature in the clear-sky case,
m and
t are the conversion factors,
and
n are the SST values and number of clear-sky pixels in the region of V pixels corresponding to M pixels; and the conversion factors are obtained by linearly fitting the sub-skin temperature of M in the clear-sky case to the skin temperature of V after interpolating with the same resolution as M. The conversion factor is calculated from the sub-skin temperature of M in the clear-sky case and the skin temperature of V after interpolating with the same resolution as M.
The sub-skin temperature of the cloudy portion within the M image element was calculated:
where
is the sub-skin temperature of the cloudy part within the M image element;
is the sub-skin temperature of the M image element;
is the sub-skin temperature of the clear-sky part within the M image element; and
P is the weight occupied by the clear-sky part within the M image element.
After obtaining the sub-skin temperature of the cloudy portion within the M image element, the skin temperature at the V image element scale in the cloudy case is obtained by utilizing the same steps as in the completely cloudy case; combining the SSTs of the clear-sky and cloudy image elements at the M image element scale, the final SST at the V image scale is obtained.
3.3. Cloud Coverage Ratio
In the processing of cloud mask data, a computational method based on pixel correspondence is employed. Specifically, each microwave pixel is associated with n pixels within the corresponding infrared pixel region.
Infrared data are typically highly susceptible to cloud cover, and SST data can generally be obtained only under clear sky conditions. Leveraging this characteristic, we assume that all pixels corresponding to the quality-controlled and screened infrared valid data are clear-sky pixels, and these clear-sky pixels are uniformly assigned a value of 0. In the ocean area, all pixels other than those identified as clear-sky pixels are considered completely cloudy pixels and are assigned a value of 1.
On this basis, processing based on the pixel correspondence relationship is carried out. Specifically, an M pixel representing microwave data corresponds to
n V pixels representing the infrared pixel region. If all
n V pixels corresponding to the M pixel have a value of 0, it indicates that these V pixels are clear-sky pixels, and the M pixel is also assigned a value of 0. If all
n V pixels have a value of 1, it means that they are all cloudy pixels, and the M pixel is assigned a value of 1. If the V pixels corresponding to the M pixel contain both 0-valued and 1-valued pixels, it implies the presence of some cloudy pixels in the region:
where
k is the number of pixels in the V pixel with a value of 1,
n is the total number of pixels in the infrared pixel region corresponding to a microwave pixel, and
f is the percentage of cloud coverage.
3.4. Cloud Coverage Percentage Weighting
In the process of weighted fusion based on cloud conditions, it is crucial to reasonably assign weights to different data. In the research scenario presented in this paper, when the cloud coverage parameter
f = 0, indicating a cloud-free condition, both the infrared (IR) sensor and the microwave sensor can acquire data without issues. In the same pixel, the data obtained from the IR sensor and the microwave sensor are assigned equal weights, each with a value of 0.5. This assignment is based on the understanding that, under cloud-free conditions, the IR data and the microwave data are regarded as having comparable reliability and importance in reflecting the target information [
22,
23].
Nevertheless, as the cloud coverage gradually increases, with the value of f continuously rising, the weight of the IR data will correspondingly and gradually decrease. This is because the interference of cloud cover in the IR data is positively correlated with the cloud amount. Clouds severely impede the accurate detection and faithful reflection of the target by the IR data. As a result, the quality and reliability of the IR data steadily decline as the cloud amount increases. To quantify this relationship, we introduce the formula
In this formula, P is the weight of the clear-sky portion within the M image element, and f is the proportion of cloudy pixels in the region of the V image element corresponding to the M image element. The value of f can be derived from the cloud mask data of the region in the V image element corresponding to the M image element, with values ranging from 0 to 1. A value of 0 indicates no cloud cover, while 1 signifies complete cloud coverage. By calculating the cloud coverage ratio based on the cloud mask data and dynamically adjusting the data weights, this approach can effectively enhance the accuracy and reliability of the weighted fusion results, allowing the fused data to more accurately reflect the actual state of the target.
3.5. Precision Evaluation Indicators
Four commonly used evaluation indices are selected to measure the fusion accuracy of the model: the bias, root mean squared error (RMSE), unbiased root mean squared error (URMSE) and correlation coefficient (
). The formulas for their calculation are given below:
where
n is the number of samples,
is the i-th predicted value and
is the
i-th true value.
is the average of the predicted values, and
is the average of the true values. The closer the bias is to 0, the smaller the values of the RMSE and URMSE are, and, if
is close to 1, it means that the model fits well and the fusion results have small errors; in the opposite case, the model fits poorly and the fusion results have large errors.
4. Results and Analysis
4.1. Fusion Product Results
In order to comprehensively assess the accuracy and fusion effects of various types of SST data, the iQuam measured data at three time points, 15 July 2019, 15 October 2023 and 6 September 2024, were selected for this study. They were matched and verified with the SST data fusion products of VIRR and MWRI, the SST data fusion products of AVHRR and AMSR-2, the SST data fusion products of MODIS and AMSR-2 and the OI reference data, respectively.
As shown in
Figure 2, the scatter plots of the three fusion products—VIRR-MWRI, AVHRR-AMSR and MODIS-AMSR—against the measurement data vividly demonstrate their excellent agreement with the OISST reference data. The scatter points are closely clustered along the fitted line, clearly indicating a strong correlation between the fusion products and the in situ buoy measurement data. The
r values of the three fusion products all exceed 0.9. Specifically, the VIRR-MWRI fusion product has a correlation coefficient of 0.984, while both the AVHRR-AMSR and MODIS-AMSR fusion products have a coefficient of 0.996. Such high correlation coefficients strongly validate the remarkable effectiveness of the data fusion method in integrating multi-source data and enhancing the data consistency. In the scatter plot, the scatter of the VIRR-MWRI fusion product is more dispersed compared to the OISST product. In contrast, the scatter trends of the AVHRR-AMSR and MODIS-AMSR fusion products are similar to that of the OISST product, tightly centered around the fitted line. This disparity mainly stems from the quality of the original VIRR and MWRI data. Compared to the more mature data of AVHRR and MODIS, the early-stage VIRR data have deficiencies in sensor accuracy and data calibration. These issues introduce more uncertainties during the fusion process, thereby affecting the accuracy and stability of the final fused products.
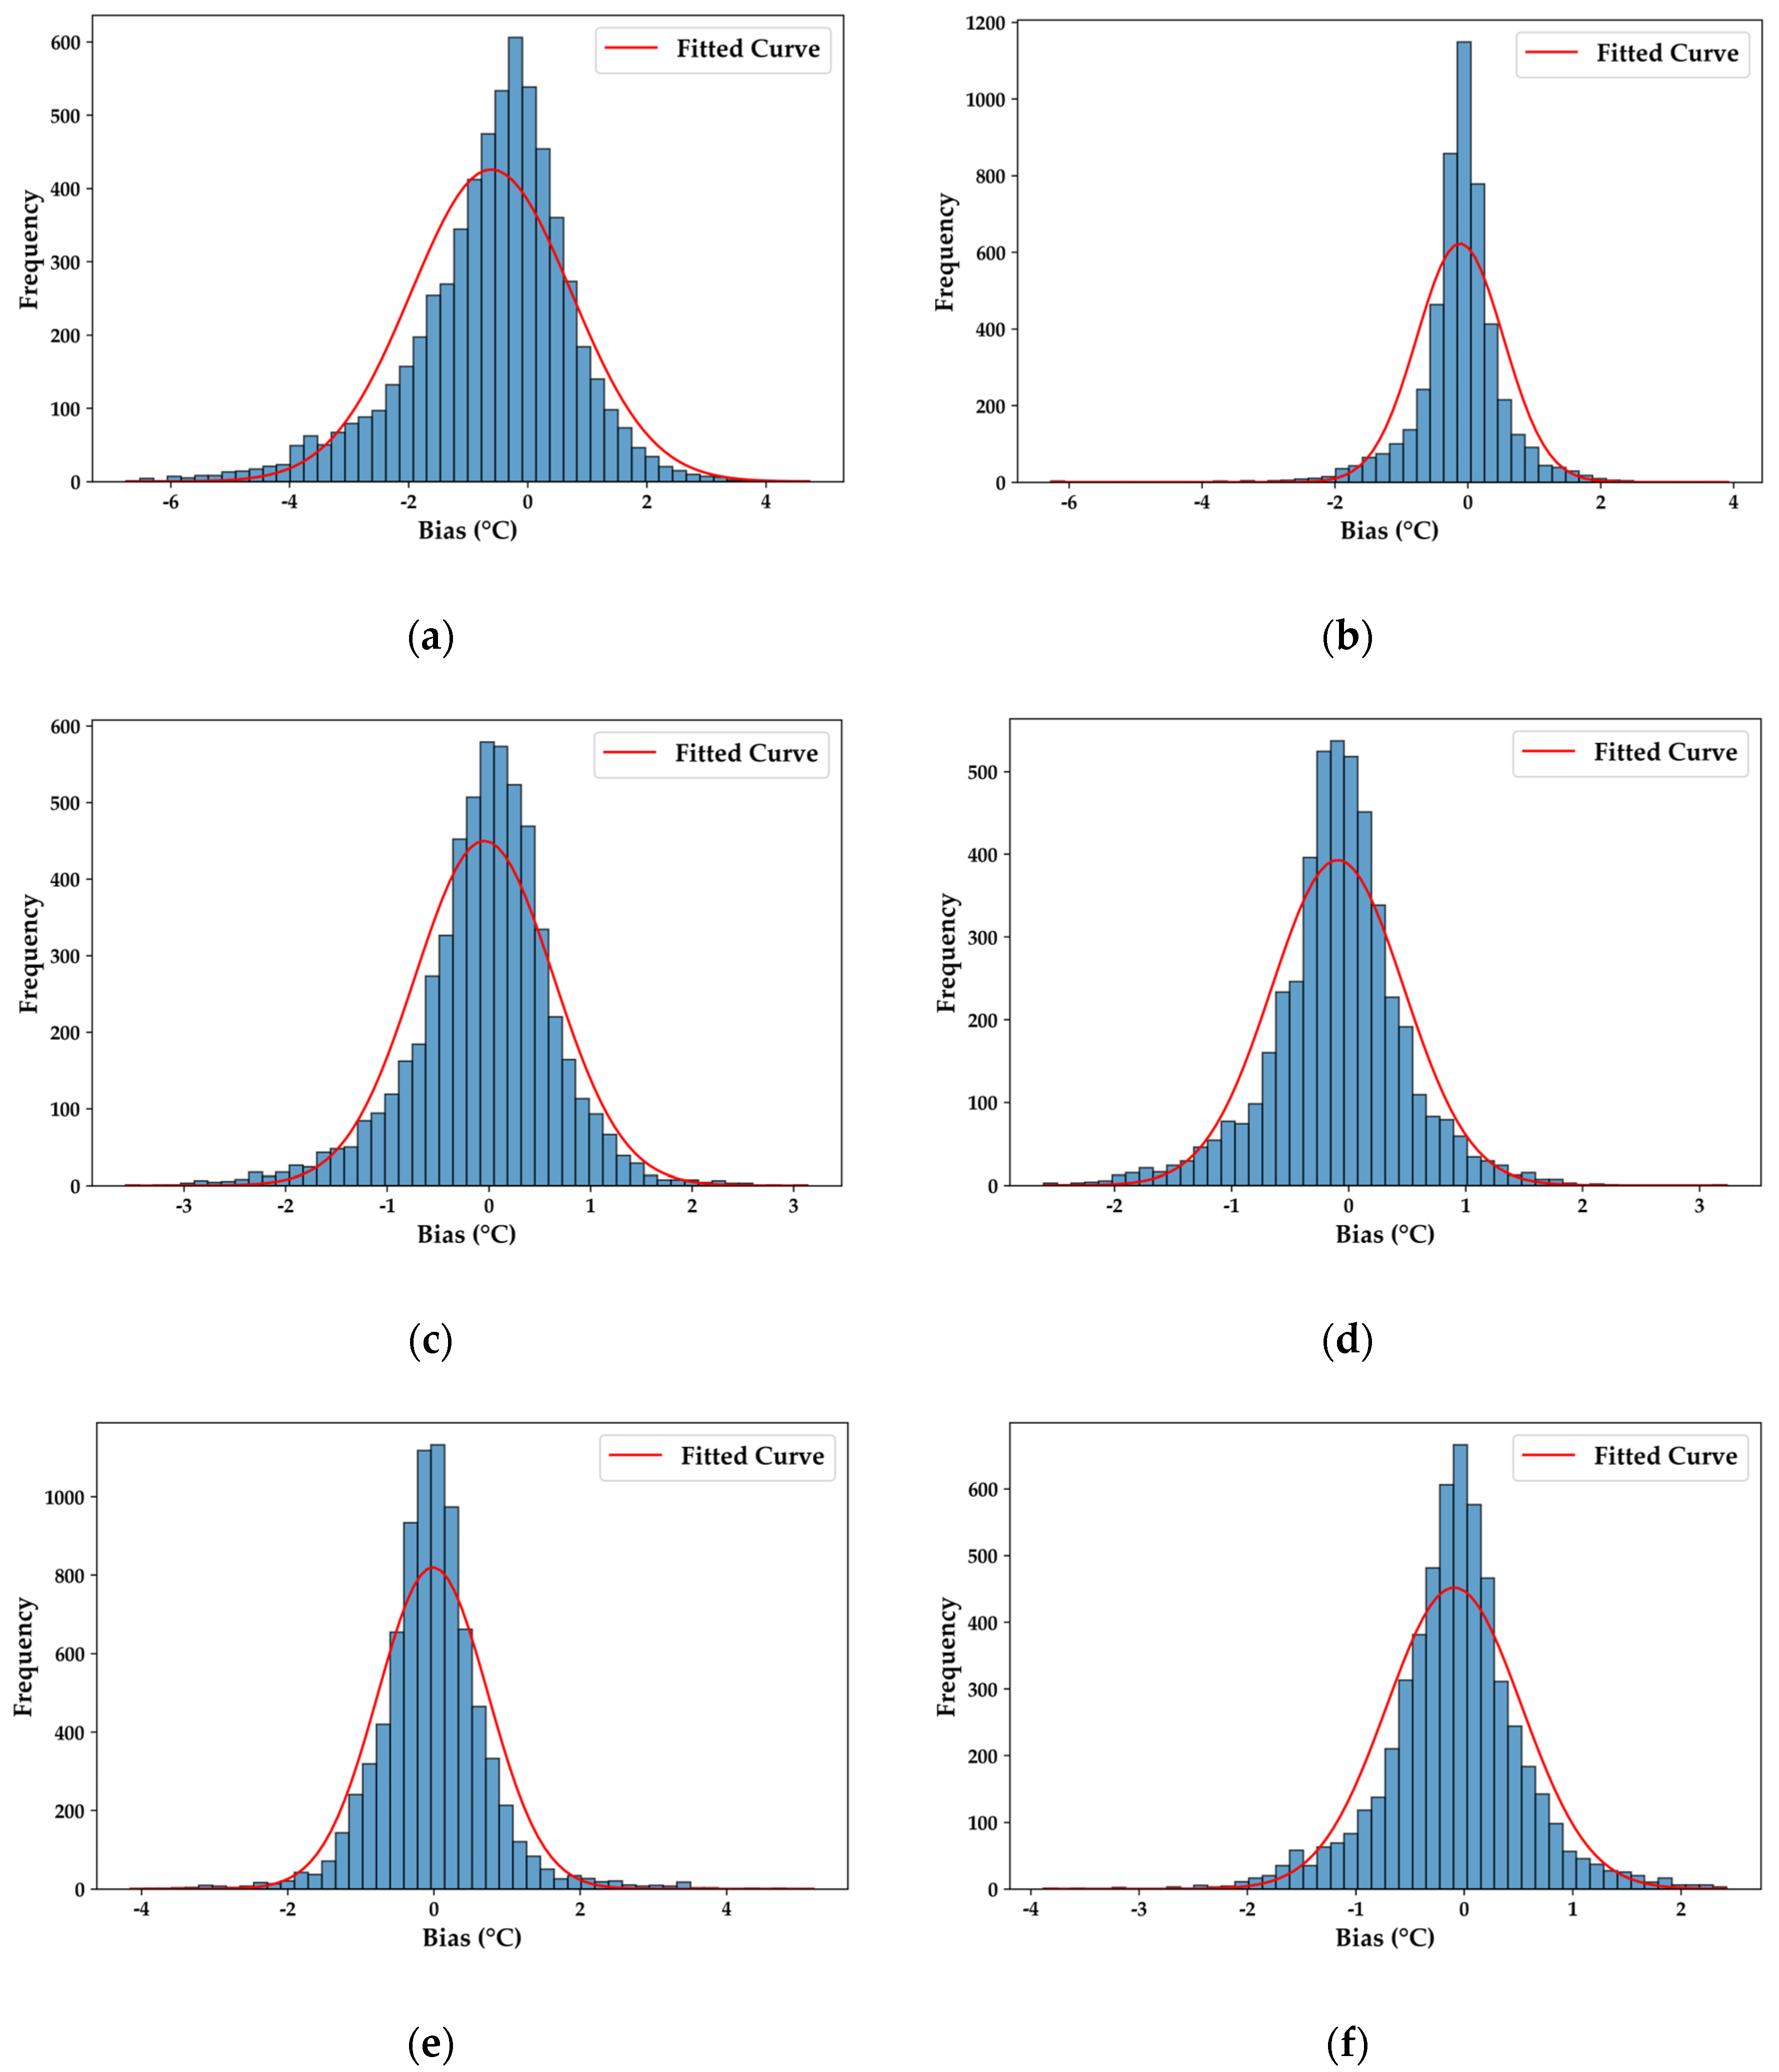
The histogram in
Figure 3, which details the deviation distributions of the three fusion products and the OISST reference data relative to the measured data, provides crucial insights into the accuracy of the fusion process. Evidently, most deviation values are closely concentrated around zero. Specifically, the deviations of the AVHRR-AMSR fusion product are mostly within the range of ±0.5 °C, and those of the MODIS-AMSR fusion product are also mainly in this range. Although the deviations of the VIRR-MWRI fusion product are relatively larger, they are mostly within ±1.0 °C. This distribution pattern indicates that the deviations of the fusion products are generally small. A meticulous comparison of the fitted curves of the fusion products and the OISST reference data reveals that the fitted curves of the AVHRR-AMSR fusion product closely resemble those of the OISST product, presenting a highly similar distribution pattern. The fitted curves of the MODIS-AMSR fusion product are more concentrated and narrower, suggesting more precise bias control. Conversely, the fitted curves of the VIRR-MWRI fusion product are relatively broader, signifying a more dispersed bias distribution.
The results of the above graphical analyses comprehensively indicate that the applied data fusion method effectively improves the accuracy and usability of SST data overall. Although the VIRR-MWRI fusion product has certain limitations due to the original data constraints, the results of the AVHRR-AMSR and MODIS-AMSR fusion products highlight the great potential of this method in optimizing SST data.
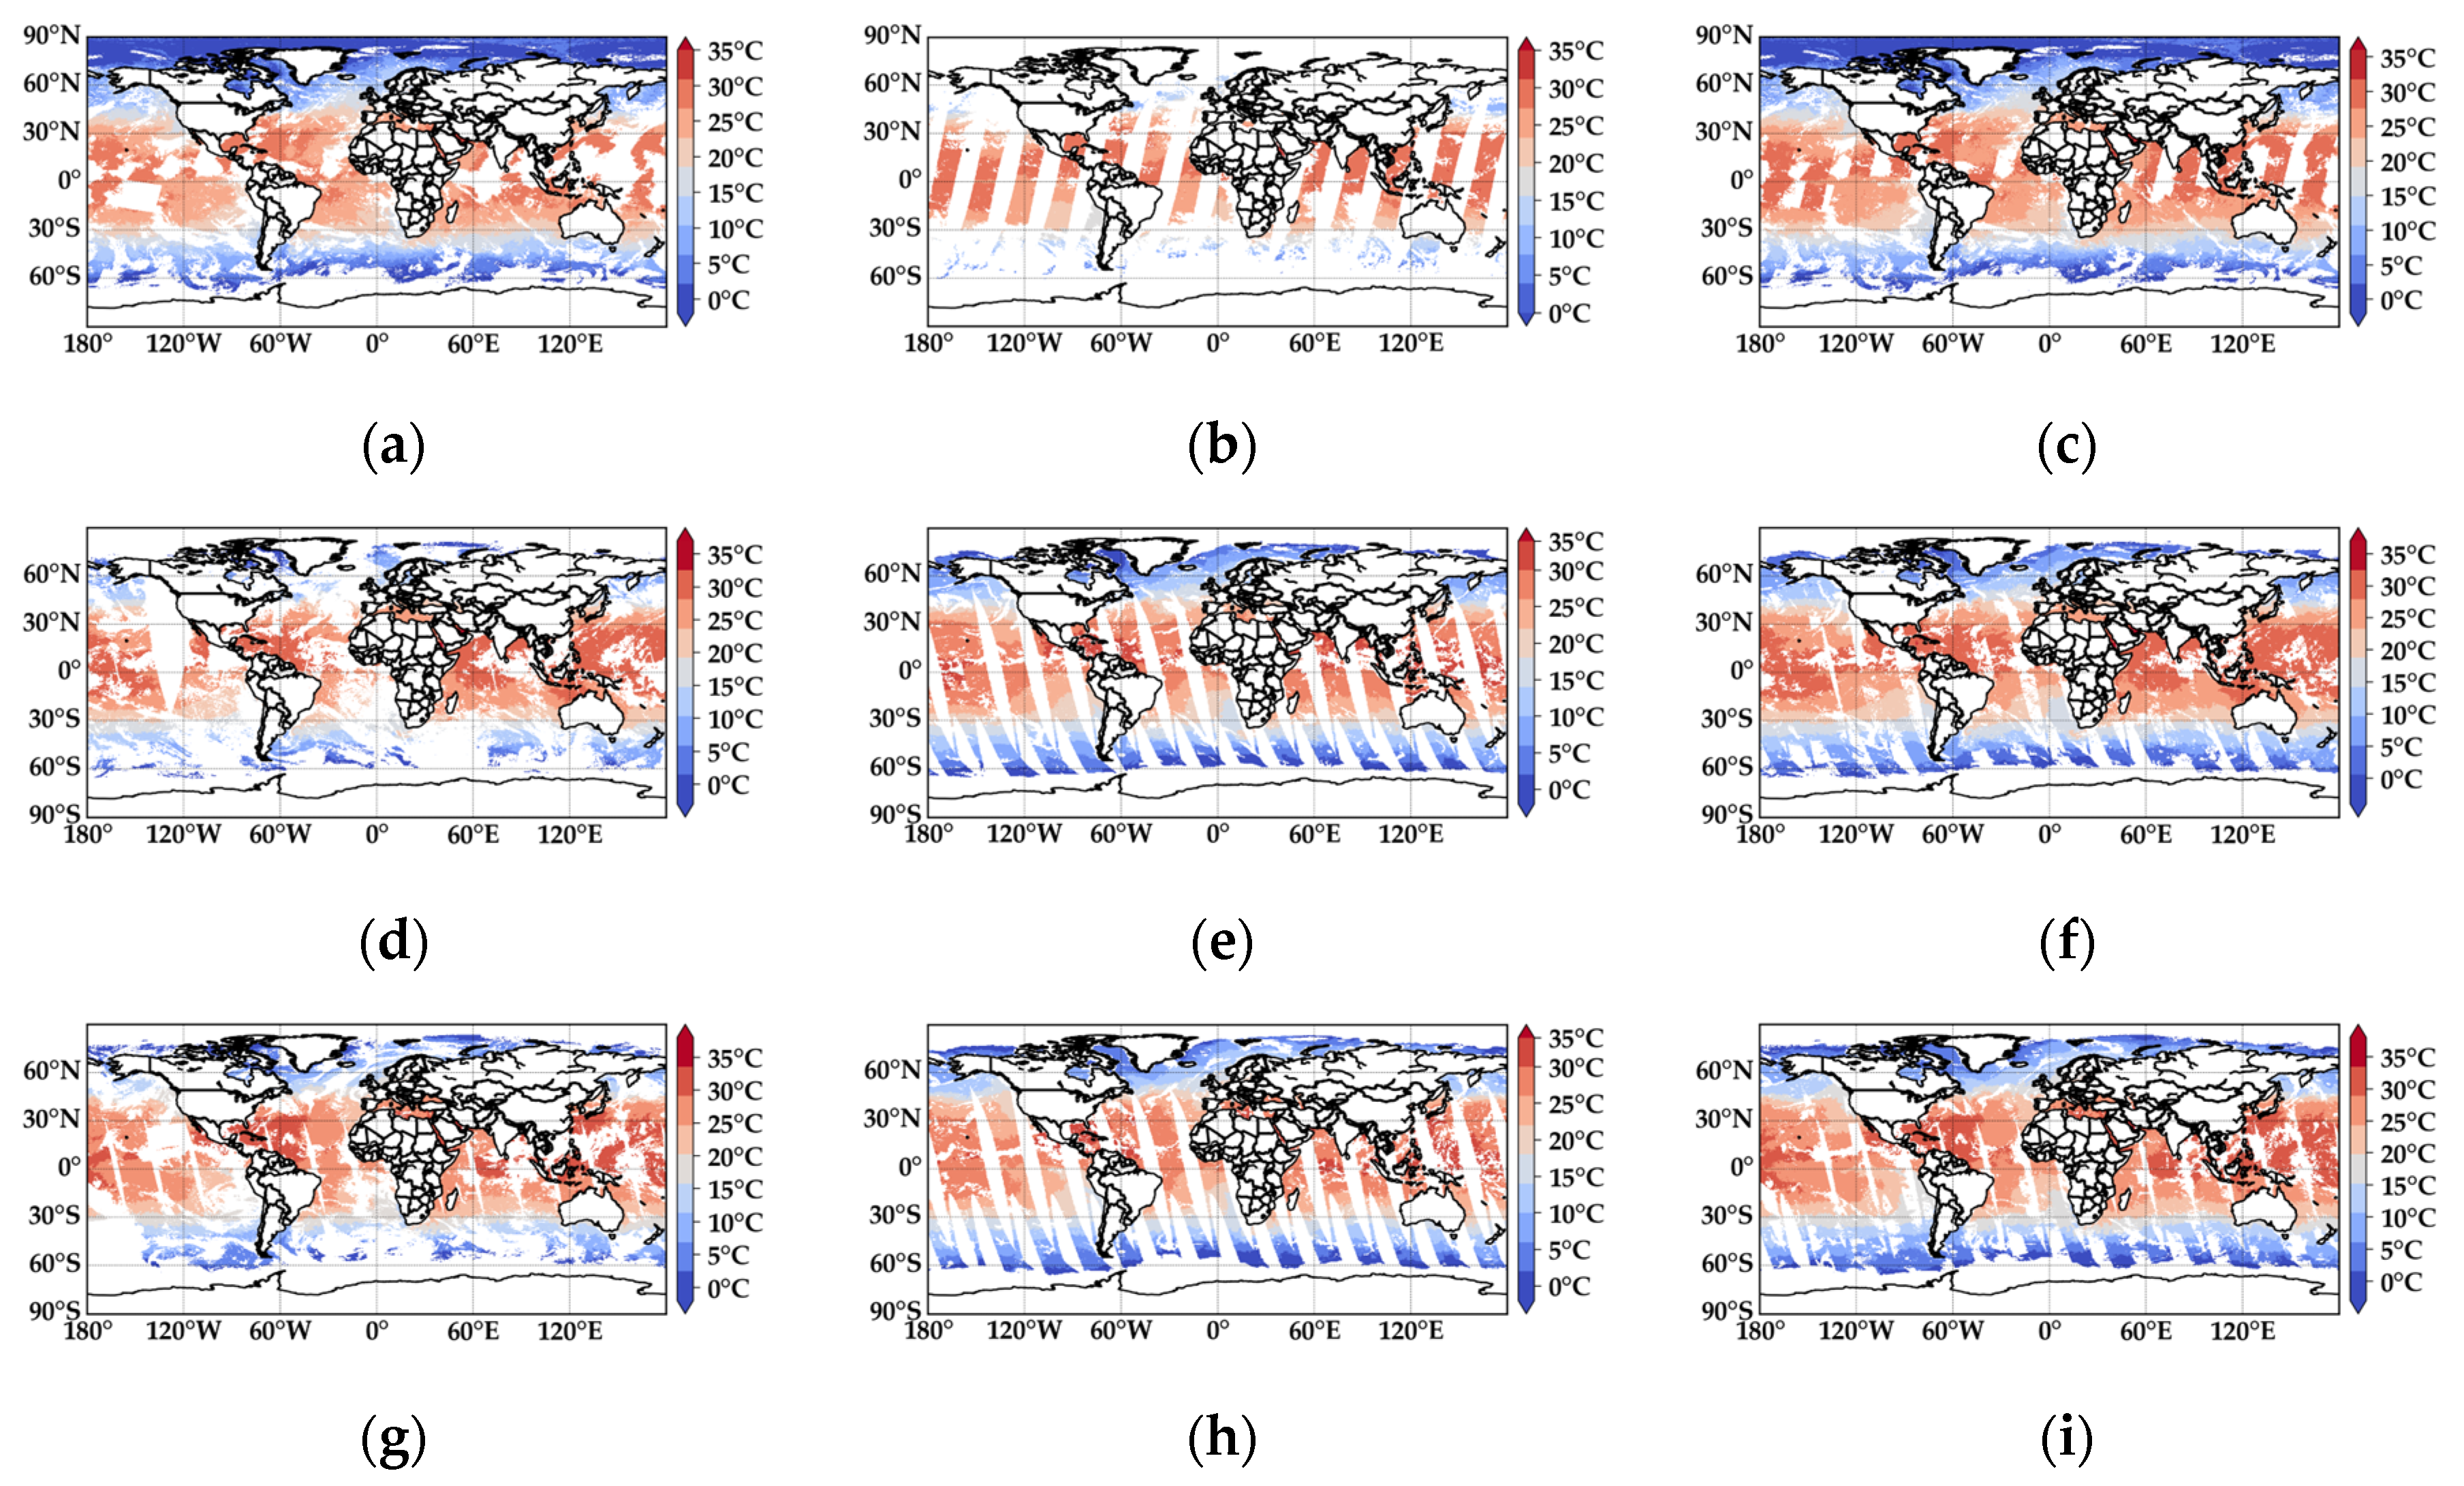
Figure 4 provides a visual representation of the SST distribution from both the raw satellite data and the fused results. A detailed examination of the figure reveals that the fusion products achieve extensive coverage across the entire study area. By analyzing the spatial distribution data in depth, it becomes evident that the fusion results offer stable and reliable SST data in most regions. Taking the fusion of VIRR and MWRI data as an example, a comparison between the original VIRR satellite data (
Figure 4a) and MWRI data (
Figure 4b) highlights certain areas where the SST information is incomplete or entirely missing, resulting in blank regions. However, after the fusion process (
Figure 4c), these missing areas are significantly improved, with a substantial portion of the data gaps effectively filled, enabling a more comprehensive SST representation. Similarly, the fusion of AVHRR and AMSR data (
Figure 4f) substantially enhances the spatial coverage compared to the individual AVHRR (
Figure 4d) and AMSR (
Figure 4e) datasets. Areas lacking SST data in either AVHRR or AMSR are distinctly restored in the fused result. Likewise, the fusion of MODIS and AMSR data (
Figure 4i) effectively fills in missing SST regions observed in the original MODIS (
Figure 4g) and AMSR (
Figure 4h) datasets. The resulting fusion product ensures a more complete and continuous SST distribution, addressing the limitations of individual satellite datasets. The results show that the fusion product has high coverage in the whole study area. Through a detailed analysis of the spatial distribution data, it is found that the fusion product can provide effective sea surface temperature data in most of the study sea area, which greatly compensates for the limitations in the spatial coverage of a single data source.
Taken together, the results of the scatter plots and histograms of the deviation distribution visually demonstrate the applicability and stability of the proposed algorithm for SST fusion. The algorithm is unaffected by the sensor types, regional differences and temporal variations and is able to achieve higher-precision fusion results under a wide range of conditions.
4.2. Fusion Product Accuracy
Table 2 presents the accuracy evaluation of both the original and fused SST data. By analyzing the accuracy assessment results of the experimental satellite SST data against in situ measurements, the following observations can be made. For infrared SST data, the bias values for VIRR, AVHRR and MODIS relative to the in situ measurements are −0.759 °C, −0.098 °C and −0.044 °C, respectively. The RMSE values are 1.553 °C, 0.647 °C and 0.823 °C, while the URMSE values are 1.355 °C, 0.640 °C and 0.822 °C, respectively. The
r values for these datasets are 0.984, 0.995 and 0.994, respectively. For the fused products, the bias values of the VIRR-RH, AVHRR-RH and MODIS-RH fusion datasets relative to the in situ measurements are −0.611 °C, −0.043 °C and −0.012 °C, respectively. The RMSE values are 1.478 °C, 0.682 °C and 0.753 °C, while the URMSE values are 1.345 °C, 0.681 °C and 0.753 °C, respectively. The
r values for the fused datasets are 0.984, 0.996 and 0.996, respectively. For the reference datasets (20190715OISST, 20231015OISST and 20240906OISST), the bias values relative to the in situ measurements are −0.114 °C, −0.091 °C and −0.091 °C, respectively. The RMSE values are 0.662 °C, 0.572 °C and 0.630 °C, while the URMSE values are 0.652 °C, 0.565 °C and 0.623 °C, respectively. The
r values for these datasets are 0.997, 0.998 and 0.997, respectively.
Taken together, the three fusion products all show reduced bias and enhanced correlations compared to the original infrared data, and the accuracy has been significantly improved. Among them, VIRR-RH and MODIS-RH show a decrease in the RMSE and URMSE, indicating that the fusion accuracy of these two fusion products is good. Moreover, the deviation of AVHRR-RH and MODIS-RH is lower than that of the OISST reference data, which fully reflects that the fusion effect of these two fusion products is more significant.
4.3. Convergence Product Analysis
To further validate the effectiveness of the fusion method and assess its performance across regions with different latitudes, the global ocean is divided into three latitude zones: 90°S–20°S, 20°S–20°N and 20°N–90°N. The fusion accuracy and spatial coverage are analyzed separately for each region. The spatial coverage of the SST is defined as the ratio of the number of valid SST pixels to the total number of pixels in the global ocean. To provide a comprehensive evaluation of the fusion method across different latitude zones, SST data collected by the VIRR, MWRI, AVHRR, MODIS and AMSR-2 radiometers are used.
Table 3 presents the accuracy metrics for regions of different latitudes and the global ocean, while
Table 4 summarizes the global and regional spatial coverage of the satellite datasets used in the experiment and the three fusion products.
The results indicate that the performance of the different fusion products varies across different latitudes. In terms of accuracy, the VIRR-RH fusion product exhibits the largest bias of −1.001 °C in the 20°N–90°N region. This deviation is primarily due to the influence of high albedo in ice-covered areas, which affects the original infrared sensor and leads to lower SST measurements [
24]. In contrast, MODIS-RH demonstrates a smaller bias of 0.030 °C in this region, benefiting from the high spatial resolution of the MODIS data and the fusion algorithm’s effective handling of cloud cover. However, despite this improvement, the RMSE remains relatively high, indicating that cloud interference remains a major source of error. In the 20°S–20°N region, the URMSE values for all fusion products are generally low. For example, the URMSE of AVHRR-RH is 0.625 °C, which can be attributed to the relatively uniform distribution of tropical clouds and the small SST gradient. This enhances the complementarity between infrared and microwave data in this region [
25]. MODIS-RH demonstrates the lowest URMSE value of 0.532 °C within the 90°S–20°S region. This outcome is intricately linked to the spatiotemporal distribution of sea ice cover in the southern hemisphere’s middle and high latitudes. In this area, the relatively low sea ice coverage significantly alleviates the challenges associated with discerning the ice–water boundary during SST inversion, thereby enhancing the accuracy of the multi-source data fusion algorithm [
26]. Simultaneously, the microwave data, which have high coverage in the southern ocean, can effectively bridge the observational gaps of optical sensors under adverse meteorological conditions. However, its sensitivity to sea surface roughness inevitably introduces additional errors [
27]. Notably, when the bilinear interpolation method is used for the downscaling of microwave data under fully cloudy conditions, it smooths out temperature gradient features at the spatial scale. This effect is particularly pronounced in regions with significant temperature gradients, such as the frontal zones in the southern ocean (e.g., the Antarctic Circumpolar Current front) [
28]. As a result, this algorithm causes an increase in the systematic bias of the fused SST products relative to the global average, which accounts for the larger bias of AVHRR and MODIS in this region. The spatial heterogeneity further accentuates this large bias characteristic.
In terms of the spatial coverage rate, differences exist among the various fusion products, primarily due to the fusion algorithm’s reliance on the combined availability of infrared and microwave data, with infrared data playing a dominant role. When infrared data are insufficient, the fusion algorithm faces limitations in estimating cloud-covered areas and filling data gaps. In the 20°N–90°N region, the relatively large volume of VIRR data results in a higher spatial coverage rate for the corresponding fusion products. In contrast, MODIS and AVHRR have comparatively fewer observations in this region, which reduces the overall spatial coverage rates of their fusion products.
Overall, the fusion method proposed in this study effectively improves the SST data quality across most ocean regions, although it is important to note that the existing cloud classification framework—while significantly enhancing the computational efficiency—still encounters limitations in handling complex marine cloud systems. At high latitudes, ice crystal-dominated high clouds exhibit significantly lower scattering attenuation coefficients in thermal IR bands compared to liquid water-laden low clouds, enabling partial IR signal penetration to retrieve the underlying SST [
29]. Conversely, low clouds with high liquid water content completely block IR radiation, underscoring the superiority of microwave sensors for all-weather observations [
30]. Current models lack cloud type-dependent weighting mechanisms, potentially leading to an overreliance on IR data in complex cloud regimes such as the Intertropical Convergence Zone (ITCZ). Under partial cloud cover, thermal IR data preferentially sample surface temperatures through cloud gaps, whereas microwave data struggle to resolve gap locations due to their coarser resolution. The assumption of homogeneous cloud distributions in existing fusion algorithms fails to account for cloud gap fragmentation, potentially exacerbating errors in transitional zones like cloud edges [
3]. Additionally, microwave penetration decreases with increasing cloud thickness, yet the current methods do not quantify this effect, risking the underestimation of the errors due to dynamic cloud variability. Arctic liquid- and ice-phase clouds exhibit distinct radiative signatures: ice-phase clouds often cause IR sensors to misclassify them as clear oceans, while liquid-phase clouds introduce cooling biases in retrievals [
31]. Existing algorithms’ inability to differentiate cloud phases may introduce systematic cold errors during Arctic summer melt periods. To address these challenges, future research should integrate multi-source cloud classification data to dynamically adjust IR–microwave weights based on the cloud type, phase and thickness. Incorporating radiative transfer corrections tailored to the sensor characteristics and environmental conditions will be critical in improving the fusion accuracy and coverage in high-latitude and heavily clouded regions.
4.4. Fusion Case Analysis
In this study, we focus on the South China Sea, covering a latitude–longitude range of 105°E–125°E and 0°N–25°N, with data from 6 September 2024. The selected datasets include MODIS infrared SST data and AMSR-2 microwave SST data. This specific time and location were chosen due to the exceptionally severe meteorological conditions on this day. On 6 September 2024, Super-Typhoon Yagi made landfall in Wengtian Town, Wenchang City, Hainan Province, China, with an extreme intensity. As the strongest typhoon ever recorded in the Beibu Gulf since meteorological records began, Yagi brought devastating winds and heavy rainfall, triggering storm surges, flooding and landslides, which caused severe casualties and economic losses across the affected regions. Due to these extreme weather conditions, the acquisition of infrared SST data was significantly impacted. The dense cloud cover, intense atmospheric turbulence and complex water vapor distribution associated with the typhoon severely interfered with the ability of infrared sensors to accurately measure the sea surface temperature. However, it is precisely under such extreme circumstances that this study aims to rigorously assess the reliability and effectiveness of the proposed fusion method by conducting an in-depth analysis of this case.
Figure 5 illustrates the SST distribution in the South China Sea region based on MODIS infrared SST data, AMSR-2 microwave SST data and the fused SST product. A closer examination of the MODIS infrared SST data reveals extensive blank areas, primarily due to the impact of the typhoon. When a typhoon strikes the South China Sea, it generates thick and widespread cloud cover, preventing MODIS infrared sensors from capturing sea surface temperature information and resulting in significant data gaps. In contrast, the AMSR-2 microwave SST data exhibit greater stability in the South China Sea region. This stability is attributed to the unique characteristics of microwave radiation, which allows for better cloud penetration and makes it less susceptible to weather-related disturbances and other external factors. The fused SST data product can effectively combine the infrared and microwave data, and the large blank area of MODIS infrared SST data can be accurately filled by fusing microwave data. This not only gives full play to the advantages of the two types of data but also greatly improves the completeness and accuracy of SST data in the South China Sea.
Table 5 provides a clear comparison of the accuracy metrics and spatial coverage of the infrared, microwave and fused SST data. In terms of accuracy, the bias, RMSE and URMSE of NH-MODIS are −0.541 °C, 0.880 °C and 1.020 °C, respectively. After applying the fusion process, the accuracy metrics of NH-MODIS-RH show noticeable improvements. The bias is reduced to −0.428 °C, bringing it closer to the actual temperature value compared to NH-MODIS, indicating that the fusion method effectively enhances the data accuracy. The RMSE increases slightly to 0.941 °C, but remains within a reasonable range. Meanwhile, the URMSE is significantly reduced to 0.424 °C, demonstrating that the fused data exhibit lower dispersion after the fusion process, thereby improving the overall accuracy. Regarding spatial coverage, the coverage rates of NH-MODIS, NH-AMSR and NH-MODIS-RH are 13.42%, 22.42% and 25.55%, respectively. This increase in coverage confirms that the fusion method effectively expands the data availability, enabling the retrieval of SST data from a broader area. Overall, the fused NH-MODIS-RH dataset demonstrates notable advantages in terms of accuracy, stability and spatial coverage, reinforcing the effectiveness of the fusion approach.
5. Conclusions
The accurate acquisition and effective fusion of SST data are essential in marine science. This study proposes a cloud-based SST weighted fusion method that offers diverse fusion capabilities. It effectively integrates microwave and infrared data, demonstrating strong adaptability to various sensor types. Additionally, it is not constrained by the geographic location or time, making it highly versatile. This method enables the efficient and seamless fusion of SST data, enhancing both the data quality and usability.
During the research process, SST data from three different infrared sensors were fused, and the fusion results were thoroughly compared and analyzed against buoy-measured data. The results indicate that the fused data exhibit improved accuracy and spatial coverage. Furthermore, when compared with OISST products, some of the fusion results demonstrate lower deviations, highlighting the advantages of the proposed method. To further validate the effectiveness and accuracy of the cloud-based SST weighted fusion method under extreme weather conditions, additional analyses were conducted. The findings confirm that this method not only performs well in severe weather scenarios by effectively mitigating the impact of cloud cover but also enhances both the accuracy and spatial coverage of the SST data.
This study demonstrates the significant potential of the proposed method in SST fusion, which not only enhances the SST retrieval accuracy but also establishes a more reliable and comprehensive data foundation for marine research and applications, offering substantial scientific value and practical implications. The framework presented here provides a highly valuable methodological reference for future investigations. Notably, future work could focus on exploring the physical relationships between multi-source cloud parameters (e.g., cloud type, phase and thickness) and SST fusion weights through the development of dynamic mapping models that link cloud microphysical properties to adaptive weight allocation strategies. Additionally, integrating environmental parameters such as the sea surface roughness and aerosol optical thickness into the dynamic weighting process would enable the creation of more sophisticated fusion algorithms, thereby expanding the frontiers for marine scientific research under complex atmospheric conditions.


