Abstract
Accurate three-dimensional change detection is essential for monitoring dynamic environments such as urban areas, infrastructure, and natural landscapes. Point-based methods are sensitive to noise and lack spatial coherence, while object-based approaches rely on clustering, which can miss fine-scale changes. To address these limitations, we introduce an object-based change detection framework integrating semantic segmentation and geometric change indicators. The proposed method first classifies bi-temporal point clouds into ground, vegetation, buildings, and moving objects. A cut-pursuit clustering algorithm then segments the data into spatially coherent objects, which are matched across epochs using a nearest-neighbor search based on centroid distance. Changes are characterized by a combination of geometric features—including verticality, sphericity, omnivariance, and surface variation—and semantic information. These features are processed by a random forest classifier to assign change labels. The model is evaluated on the Urb3DCD-v2 dataset, with feature importance analysis to identify important features. Results show an 81.83% mean intersection over union. An additional ablation study without clustering reached 83.43% but was more noise-sensitive, leading to fragmented detections. The proposed method improves the efficiency, interpretability, and spatial coherence of change classification, making it well suited for large-scale monitoring applications.
1. Introduction
Three-dimensional change detection (3DCD) plays a crucial role in monitoring dynamic changes within a geographic area by analyzing multi-epoch data acquired using LiDAR (Light Detection and Ranging). In contrast with 2D remote sensing methods that are based on images, 3DCD uses 3D point clouds to capture structural and vertical modifications, such as new constructions, vegetation growth, and infrastructure degradation. This capability has broad applications in urban planning, environmental monitoring, infrastructure management, and disaster response [1,2].
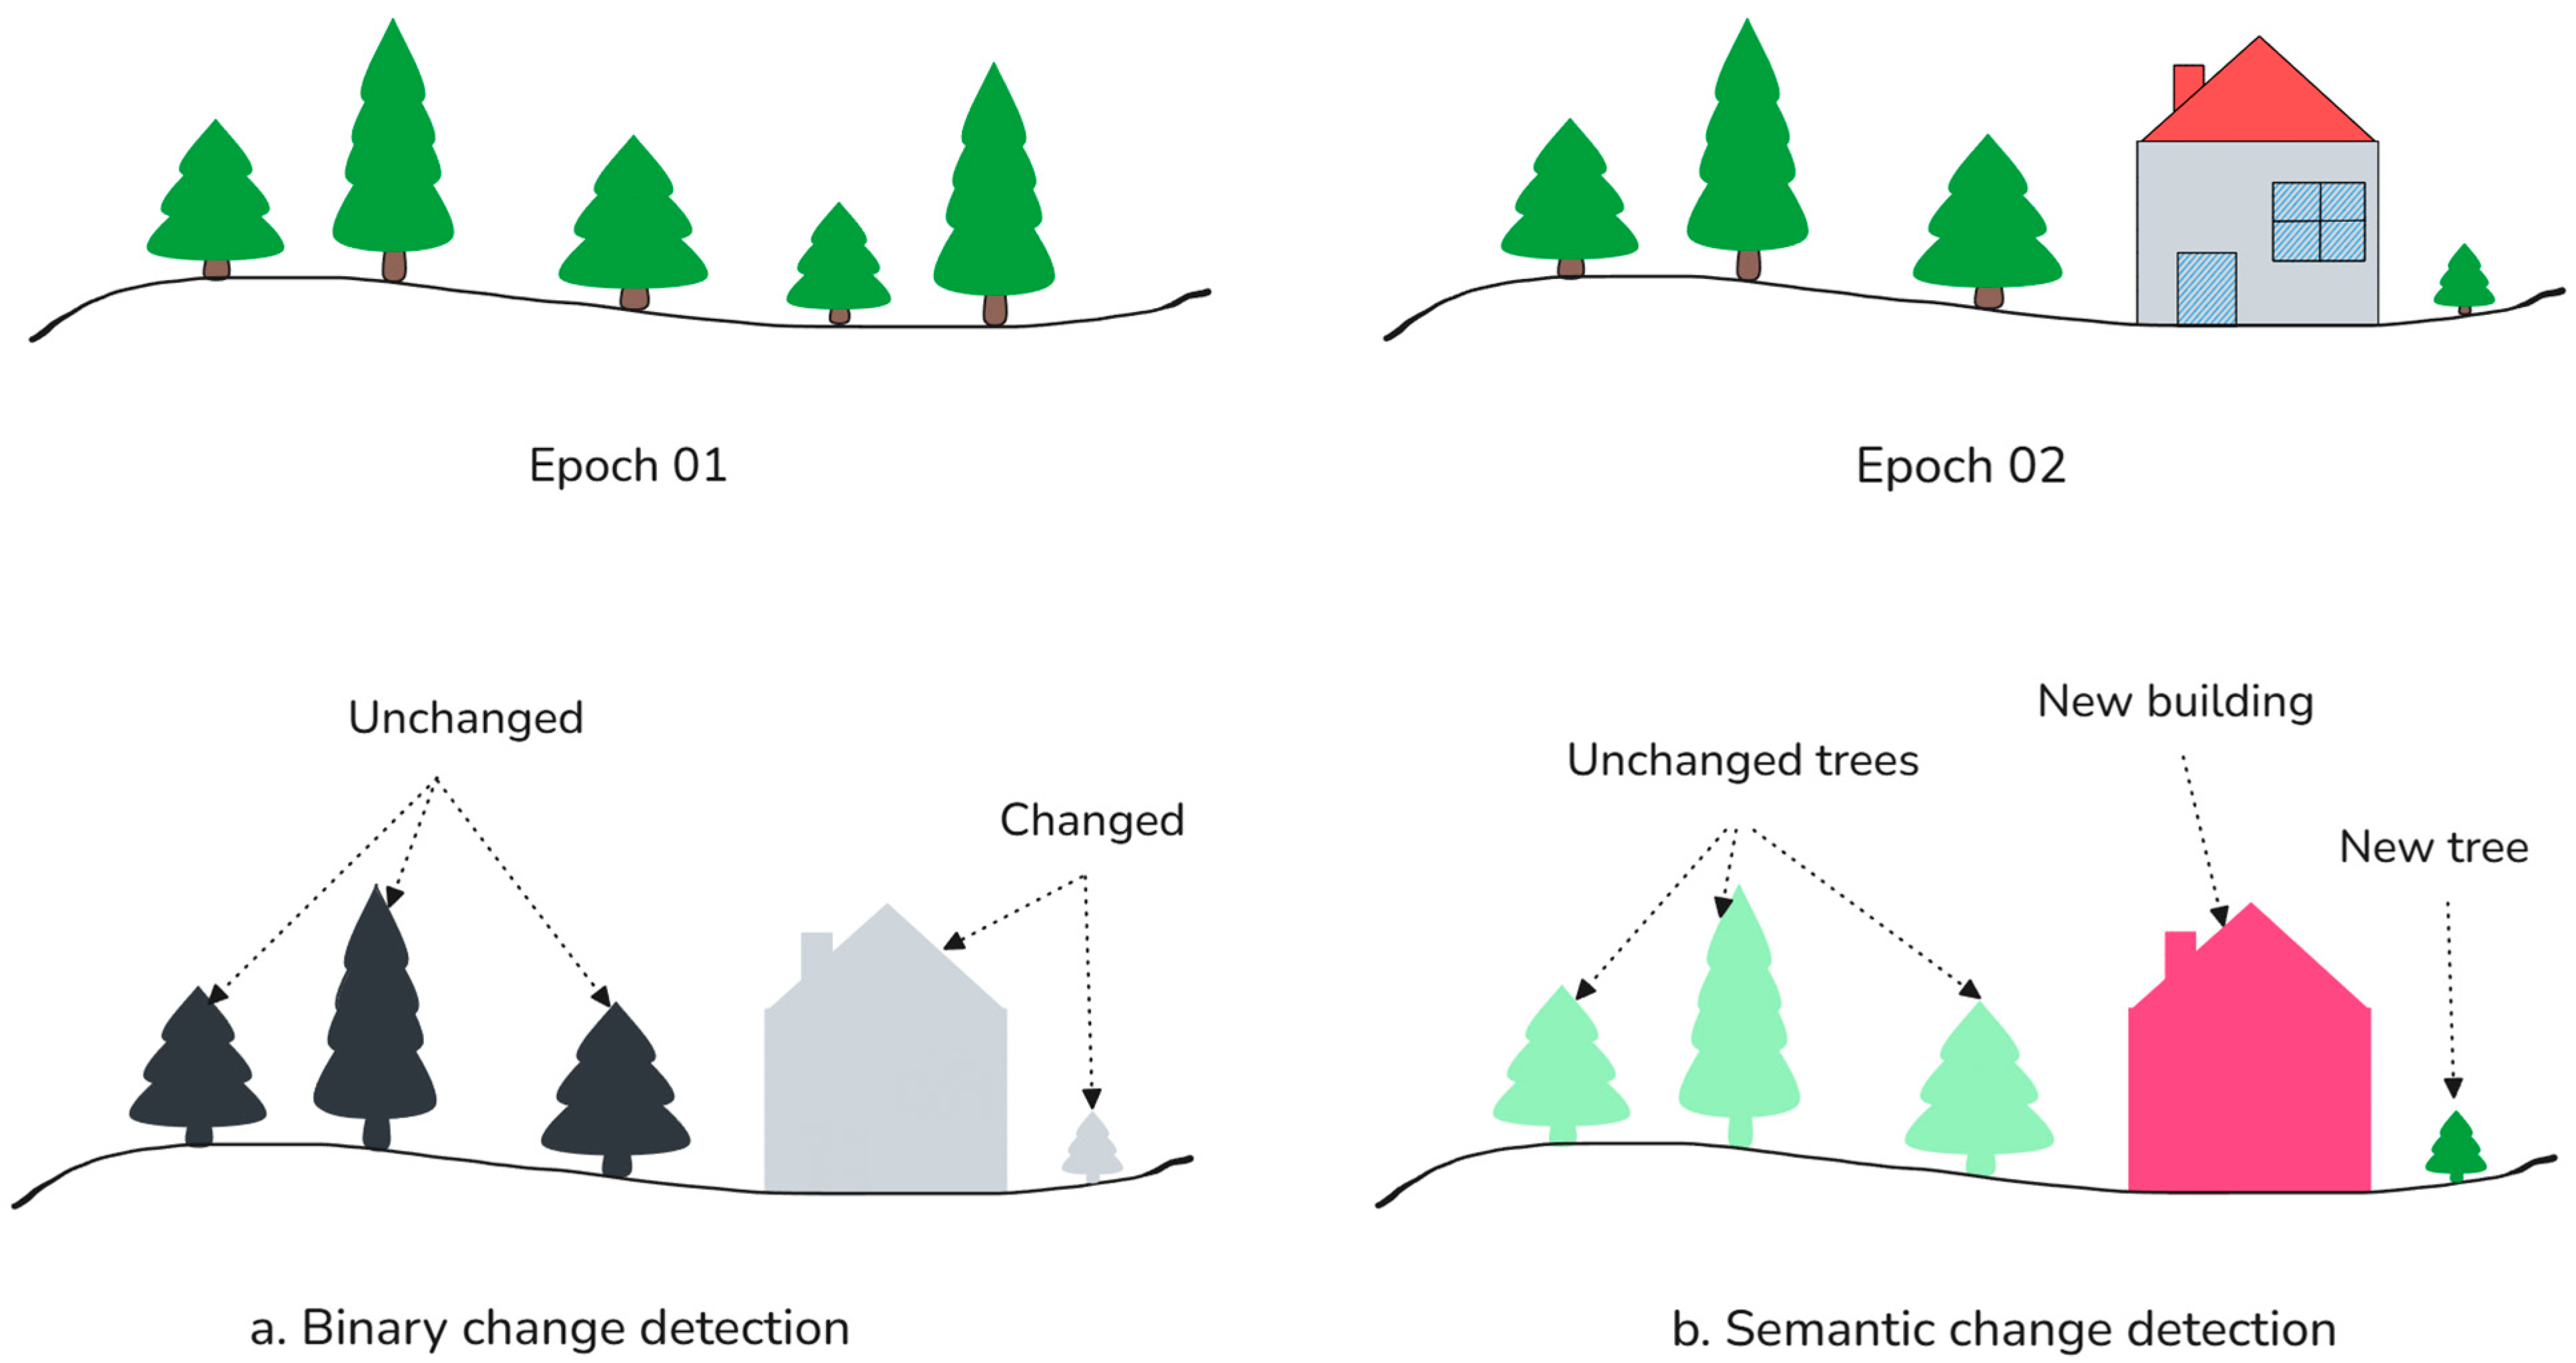
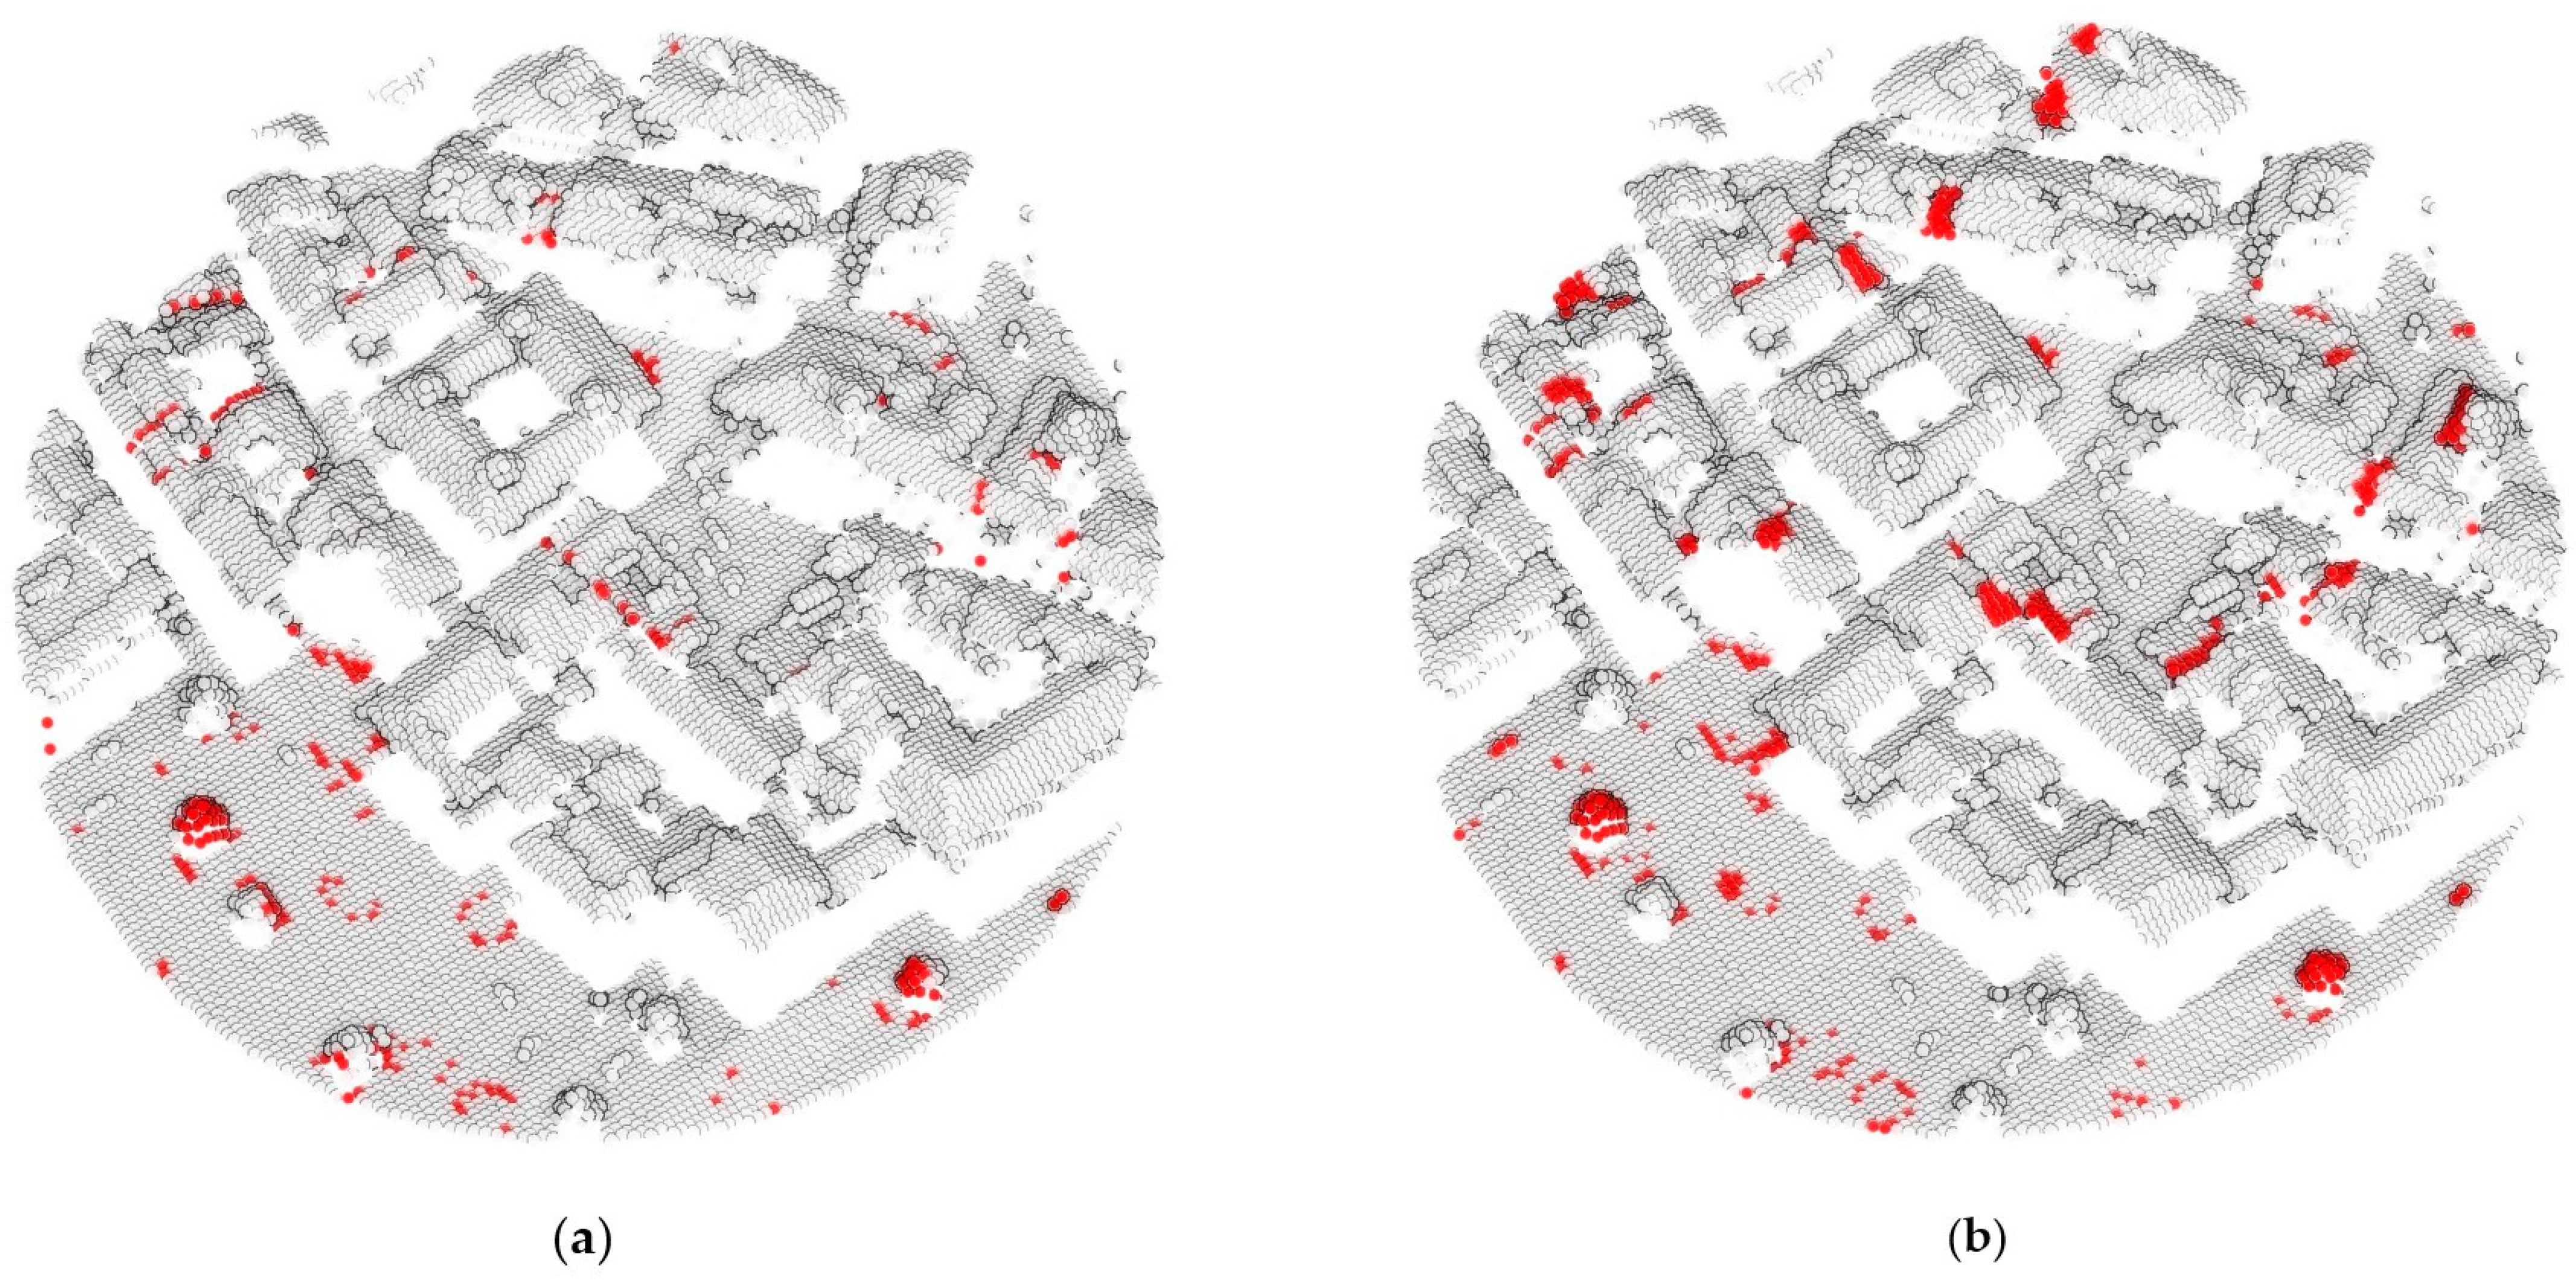
Traditional 3D change detection methods primarily classify changes into binary categories—changed and unchanged areas (Figure 1a). The most common approaches, such as Cloud-to-Cloud (C2C) and Multi-scale Model-to-Model Cloud Comparison (M3C2), rely on spatial distance calculations to quantify differences between point clouds [3]. While effective in detecting geometric variations, these methods face several limitations, including sensitivity to sensor noise, variations in point density, and occlusions. More critically, they do not provide semantic information about the nature of the detected changes, which is essential for real-world applications. To address these shortcomings, machine learning-based approaches have integrated feature extraction and classification into the change detection process. Tran et al., (2018) proposed a method to integrate classification and change detection in a single step using machine learning applied to airborne LiDAR [4]. It extracts features describing point distribution, terrain elevation, and multi-target capabilities, along with inter-epoch features that compare local point distributions between two epoch to detect changes. A supervised classifier then assigns each point to a change category. This approach avoids error propagation from sequential classification and change detection. However, it relies heavily on training data quality, struggles with subtle or gradual changes, and is sensitive to point density variations and occlusions.
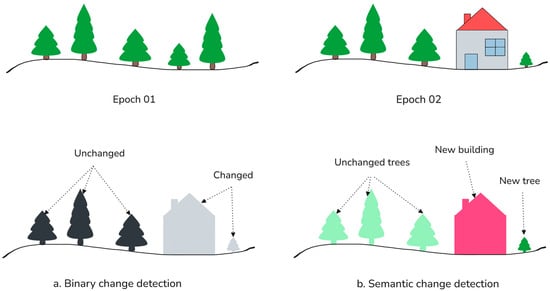
Figure 1.
(a,b) Illustrated differences between binary and semantic change. The change results are projected on epoch 02.
To improve robustness and interpretability, object-based change detection approaches have emerged, segmenting point clouds into meaningful entities before analyzing changes. Object-based methods enhance spatial coherence, reduce noise sensitivity, and allow for more detailed interpretation of change types. Zhang et al., (2023) proposed a framework that segments buildings using region growing and graph-cut techniques guided by point-level change indicators. It demonstrated good classification performance for complex urban changes on buildings [5]. Similarly, Stilla and Xu (2023) emphasized that aggregating points into coherent segments can reduce false detections, although segmentation accuracy remains a challenge, particularly in dense urban environments with varying point densities and occlusions [6]. Despite this progress, these approaches often lack integration with semantic segmentation methods and neglect the role of clustering quality in change detection performance. However, recent advancements in object-level semantic segmentation [7], such as superpoint-based methods, have proved the advantages of object-based processing. Robert et al., (2023) demonstrated that processing point clouds at the object level can improve computational efficiency, achieving up to a sevenfold increase in speed compared to existing methods [8]. Applying this principle to 3DCD suggests potential benefits for urban monitoring and rapid disaster response.
Concurrently, semantic change detection (SCD) [9,10,11] has advanced beyond binary classification by separating changes according to object categories (Figure 1b). Deep learning-based approaches, including Siamese PointNet [12], Siamese Graph Convolutional Network (SiamGCN) [13], end-to-end change detection [14], Siamese Kernel Point Convolution (Siamese KPConv) [15], Multi-task Enhanced Cross-temporal Point Transformer (ME-CPT) [16], and Prior-Knowledge-Guided Network for Urban 3D Point Cloud Change Detection (PGN3DCD) [17], have demonstrated strong performance by using hierarchical feature extraction and attention mechanisms. These methods excel at capturing fine-grained 3D changes but rely heavily on large-scale annotated datasets, which remain scarce. Thus, the lack of a comprehensive, large-scale benchmark dataset for 3D change detection forces researchers to rely on synthetic datasets, such as Urban 3D Change Detection version 2 (Urb3DCD-v2) [15], or manually annotated datasets, limiting model generalization. Additionally, a fundamental trade-off remains between the interpretability of traditional geometric methods and the data-driven nature of learning approaches. Object-based methods can present an alternative that balances interpretability, efficiency, and robustness, as they detect changes at the object level rather than at the individual point level. By using prior knowledge of object structures and spatial relationships, object-based approaches reduce dependency on large-scale annotated datasets and enhance generalization in real-world scenarios, particularly in urban settings where objects (e.g., buildings, vehicles) serve as primary units of interest.
Given these challenges, particularly the need for computational efficiency, interpretability, and robust semantic change identification, this paper proposes a semantic-assisted object-based 3D change detection framework. Our approach integrates graph-based clustering with geometric and semantic feature fusion to provide robust, scalable, and interpretable change detection. It mitigates issues related to segmentation errors, computational complexity, and limited semantic interpretability prevalent in existing methods. To summarize, the main contributions of this work are as follows:
- Introduce a novel semantic-based object-based 3D change detection framework that integrates graph-based clustering with geometric and semantic feature fusion;
- conduct a systematic ablation study to evaluate the influence of clustering on the overall performance of the change detection task;
- provide a comprehensive benchmark with state-of-the-art methods.
The remainder of this paper is organized as follows: Section 2 describes the proposed framework in detail. Section 3 presents the experimental setup and evaluation results, including an ablation study. Section 4 discusses the findings and limitations. Finally, Section 5 summarizes the paper and outlines the potential directions for future research.
2. Materials and Methods
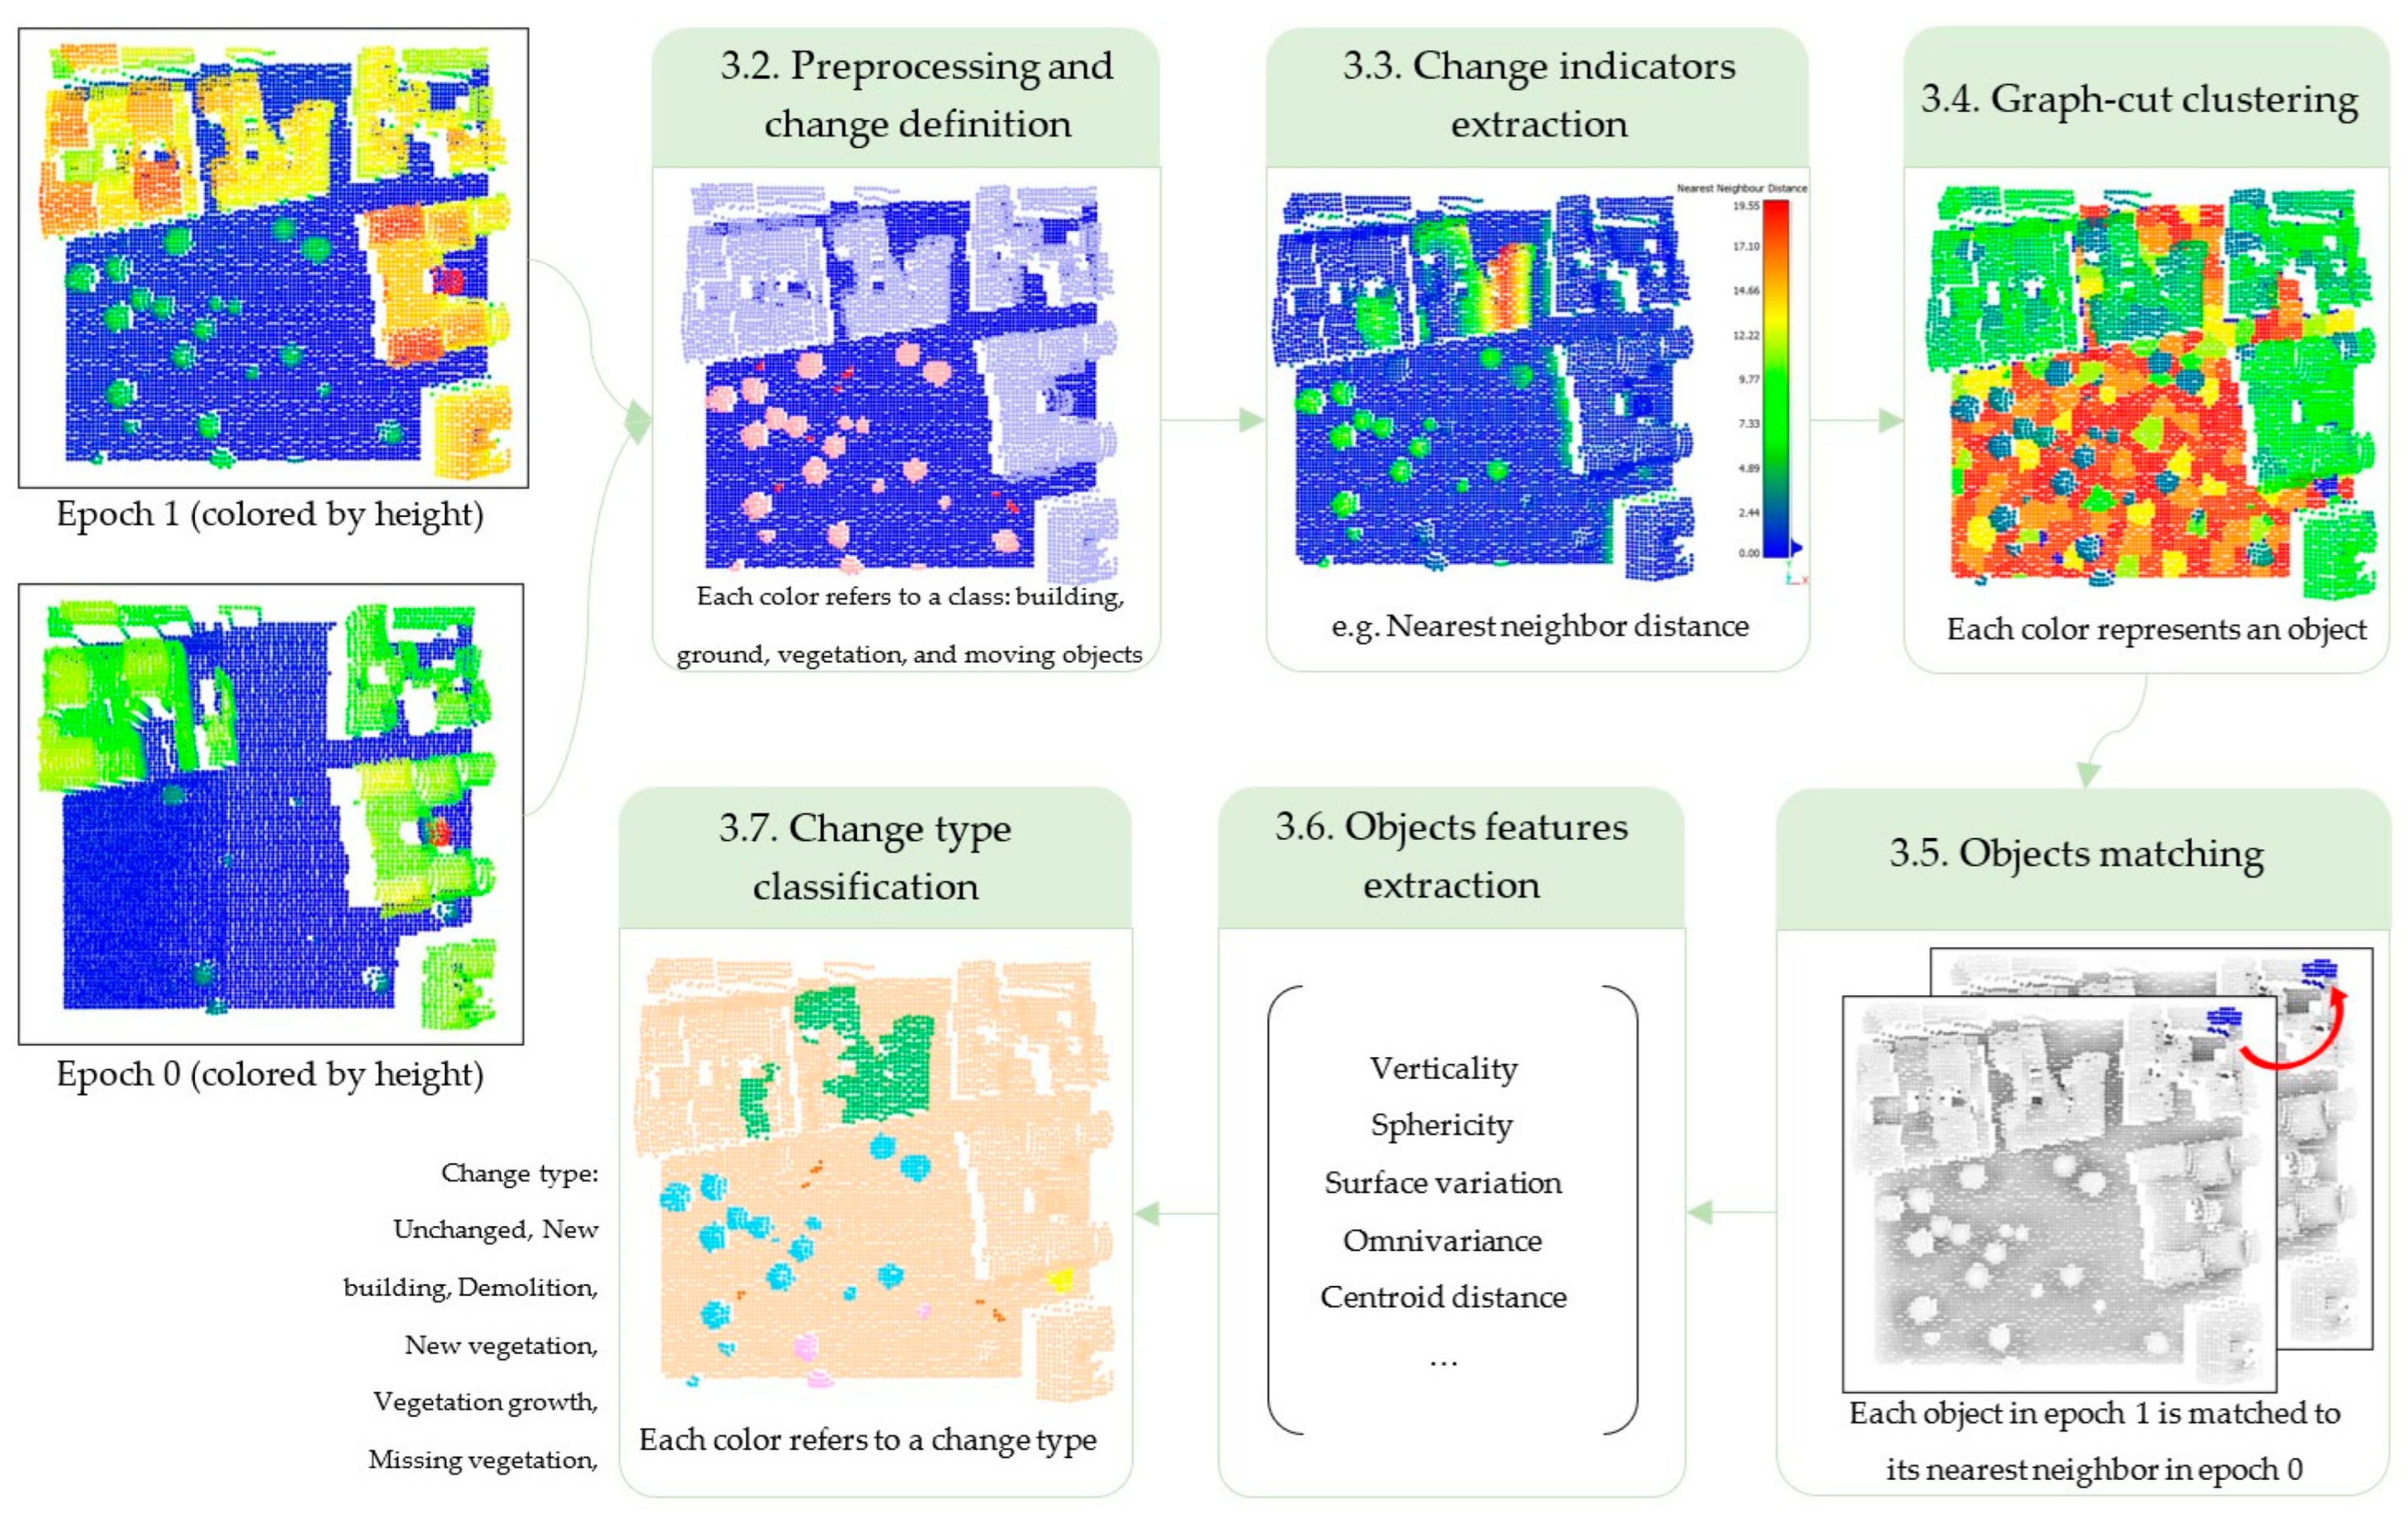
The proposed framework integrates semantic segmentation, geometric change indicators, and object-level analysis to improve the accuracy and consistency of 3D change detection. It follows a structured six-step process. First, preprocessing ensures comparability between bi-temporal point clouds through coordinate alignment, noise filtering, and spatial indexing. If the point clouds are unclassified, semantic segmentation assigns labels to the ground, vegetation, buildings, and moving objects. Second, change indicators are extracted using displacement-based metrics to quantify geometric variations. Third, graph-based clustering segments the point cloud into spatially coherent objects, preserving geometric consistency. Fourth, object matching links corresponding objects across epochs using a nearest-neighbor search based on centroid distance. Fifth, feature extraction combines geometric descriptors (e.g., verticality, sphericity, omnivariance, and surface variation) with semantic information to characterize object-level changes. Finally, a random forest classifier assigns change labels, distinguishing the different types of modifications. Figure 2 summarizes the workflow of the proposed framework.

Figure 2.
The illustrated methodology of our 3D change detection framework.
2.1. Simulated Dataset
Urb3DCD-v2 is a publicly available simulated urban point cloud dataset designed for 3D change detection [15]. To the best of our knowledge, it is the only publicly available multi-class urban dataset that serves as a benchmark in the field [18]. It provides bi-temporal point clouds that simulate realistic urban change, ensuring a standardized evaluation for change detection methods. Each point is labeled according to one of seven categories: unchanged, new building, demolition, new vegetation, vegetation growth, missing vegetation, and mobile objects. Additionally, semantic labels categorize the points into ground, building, vegetation, and mobile objects. The dataset includes two subsets. The first subset has a point density of 0.5 points/m2, simulating sparse urban acquisitions, while the second (multi-sensor) subset presents a first epoch with low density and high noise (mimicking photogrammetry) and a second epoch with higher density and lower noise (resembling aerial LiDAR). Figure 3 illustrates labeled ground truth examples, showing the distribution of the change categories.
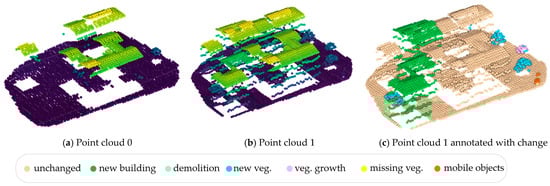
Figure 3.
Clipped area from the simulated urban point cloud dataset: (a) Point cloud at epoch 0, colored by height; (b) Point cloud at epoch 1, colored by height; (c) Ground truth changes labels on point cloud 1.
It offers a controlled yet diverse evaluation environment, ensuring reproducibility while maintaining real-world complexity. The dataset is divided into training, validation, and testing sets, following a standardized protocol. Table 1 summarizes key dataset characteristics, including point density and class distribution.

Table 1.
Summary of the dataset characteristics, including point density and distribution.
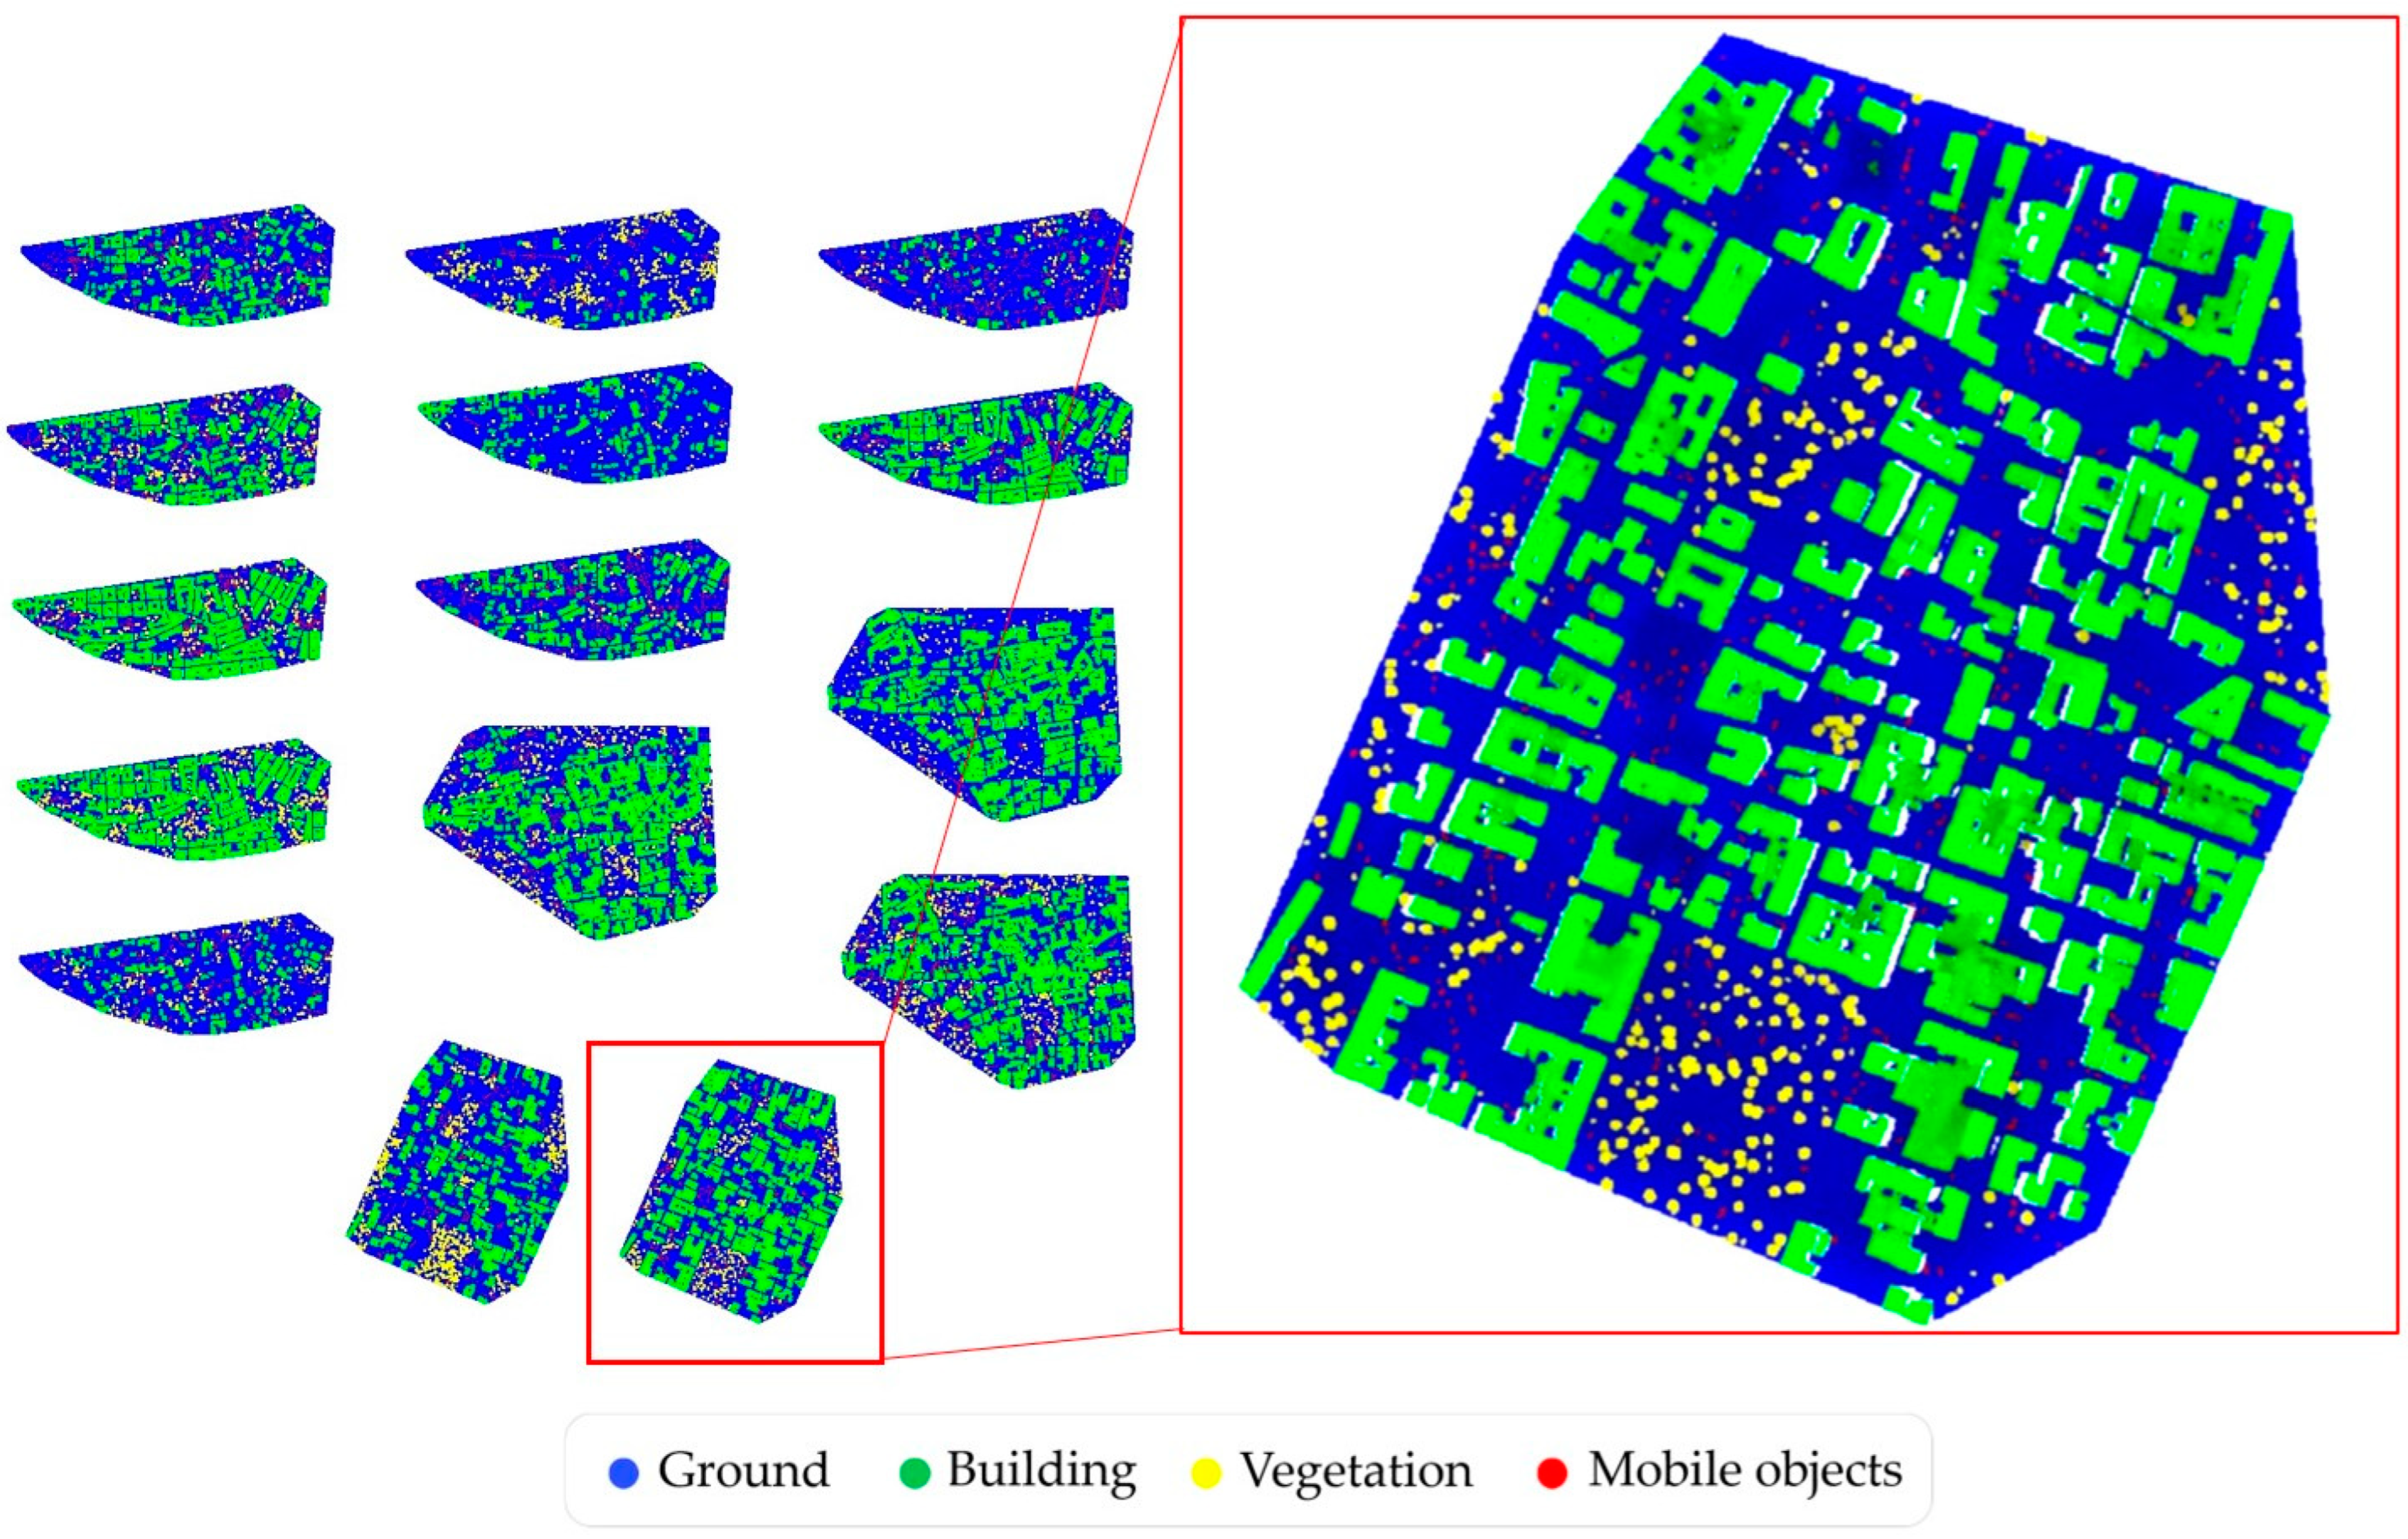
A key feature of Urb3DCD-v2 is the simulation of occluded regions, a frequent challenge in urban LiDAR acquisitions. By varying the flight path of ALS (Airborne Laser Scanning) acquisitions, occlusion patterns shift between epochs, introducing realistic variations that complicate change detection. Occluded facades and ground areas reflect real-world sensor limitations. The dataset also captures long-term environmental changes, including tree growth, removal, and mobile object displacements. Figure 4 presents the dataset’s spatial distribution, showing tile placement and a zoom-in on a selected tile to illustrate spatial coverage and resolution. The class labels used include ground, building, vegetation, and mobile objects.

Figure 4.
Overview of the dataset’s spatial coverage with classes labels.
2.2. Preprocessing and Change Definition
Preprocessing ensures that bi-temporal point clouds are aligned and structured for reliable change detection. It generally includes coordinate alignment, noise filtering, and spatial indexing, as well as semantic classification to remove irrelevant variations. However, in this study, these steps were not performed, as the dataset already provides preprocessed data in a consistent coordinate system with predefined semantic labels. This classification helps refine change detection by filtering out irrelevant changes, such as temporary objects, which do not indicate meaningful change. Here, we categorize change relevance into the following three types: relevant, irrelevant, and falsified change. Relevant changes include modifications such as new or demolished buildings, height change, and tree growth or trimming [19,20]. Irrelevant changes include temporary objects or classes that we are not interested in. Falsified changes, caused by sensor noise, misclassification, or minor misregistration, also introduce uncertainty into the process.
Formally, let Pt and Pt′ be two registered point clouds acquired at times t and t′ (t ≠ t′); an object that is present in Pt but absent in Pt′ is classified as removed when t < t′, or new when t > t′. For unchanged or modified objects, our fusion framework of geometric and semantic features can determine the type of change based on the extracted features. The changes we are interested in are unchanged, new building, demolition, new vegetation, vegetation growth, missing vegetation, and mobile objects.
2.3. Change Indicators Extraction
Change indicators are crucial for detecting modifications across epochs [21]. To capture displacement at multiple levels, we extract the following three key metrics: Cloud-to-Cloud (C2C) distance, planar C2C-2D, and Multiscale Model-to-Model Cloud Comparison (M3C2) distance. C2C distance measures direct point-wise displacement, computing the shortest Euclidean distance between corresponding points in both epochs. While computationally efficient, it is sensitive to variations in point density and occlusions, which can introduce false detections. To mitigate this, we introduce planar C2C-2D, which refines displacement estimation by projecting points onto a horizontal plane. This method ensures a more accurate assessment of lateral shifts in buildings and vegetation while filtering out vertical noise from LiDAR artifacts, such as façade points. However, both C2C and C2C-2D may lack robustness when dealing with non-rigid deformations (vegetation growth), prompting the integration of M3C2 distance. M3C2 estimates displacement along the local surface normal, fitting a cylindrical neighborhood around each point and computing the mean surface position per epoch. This approach provides a more stable measurement by accounting for surface roughness and registration uncertainties, reducing false positives in highly dynamic areas. These three complementary metrics form the geometric foundation of our change detection framework [3].
2.4. Graph-Cut Clustering
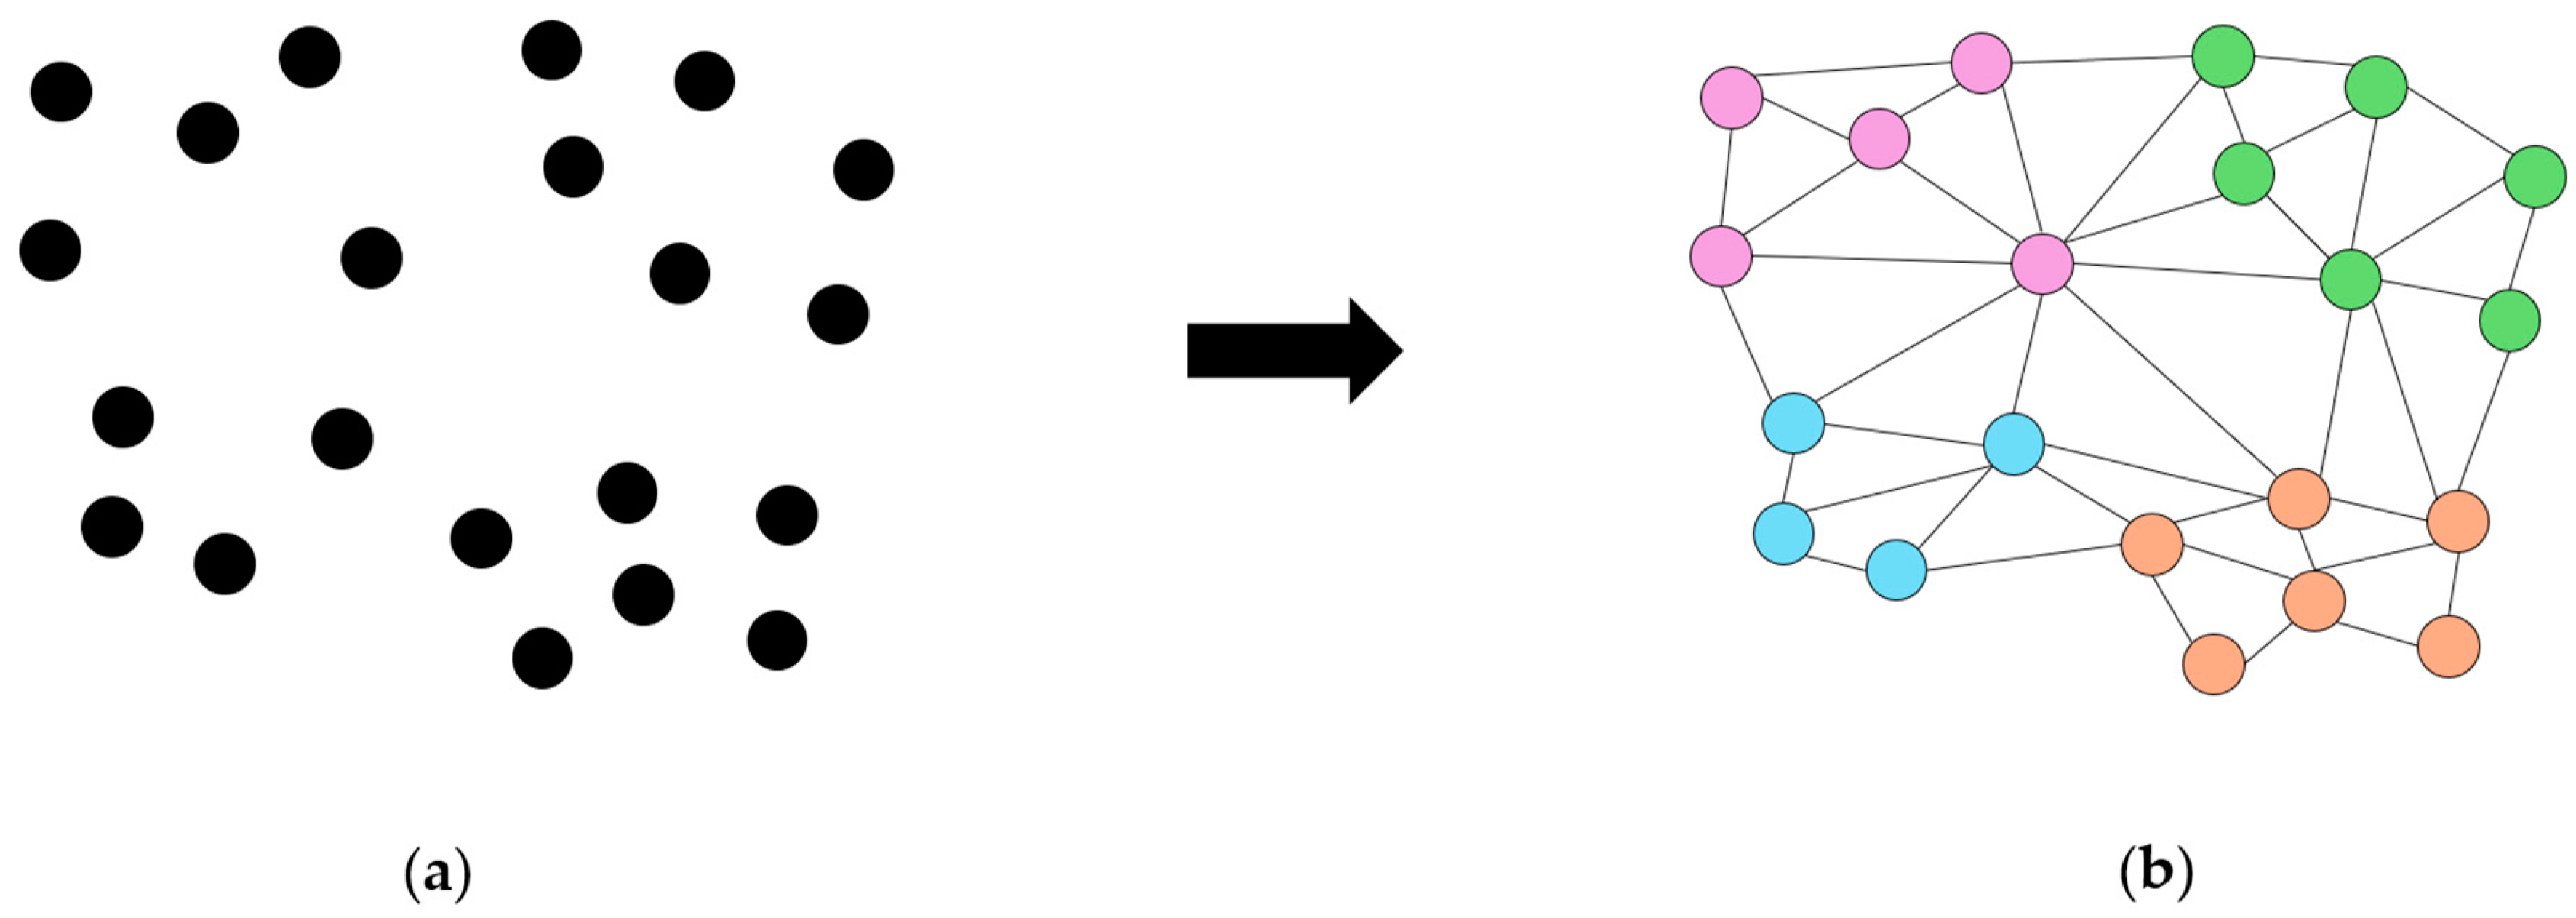
Our graph-cut clustering approach is based on the ℓ0 cut-pursuit algorithm [22], which segments the point cloud into spatially coherent objects (a simplified principal shown in Figure 5). The point cloud is represented as a graph, where nodes correspond to individual points, and edges define connectivity based on spatial proximity and geometric similarity. Clustering is performed in two stages. First, local-scale segmentation groups the points into fine-scale clusters using k-nearest neighbors (k-NN) and ℓ0 cut-pursuit optimization. This ensures that each cluster preserves its geometric properties. Next, a global aggregation stage refines segmentation by merging the clusters based on spatial consistency, preventing over-segmentation. The regularization parameter (λ) plays a key role in controlling the trade-off between segmentation granularity and spatial smoothness. A higher λ leads to fewer, larger clusters by enforcing spatial coherence and reducing unnecessary segment boundaries (under-segmentation). Conversely, a lower λ results in more granular segmentation, capturing small-scale variations but increasing segmentation complexity (over-segmentation). Optimization iteratively minimizes an energy function to balance data fidelity and regularization constraints for optimal segmentation. Additionally, the k-NN parameter influences spatial connectivity to allow for structurally meaningful clusters. This adaptive segmentation method is particularly effective for detecting objects of varying scales [23], making it well suited for this work. We maintain an over-segmented representation rather than merging all segments to avoid change misclassification.

Figure 5.
Illustration of partitioning a point cloud graph into clusters via ℓ0 Cut-Pursuit by [22]. (a) Initial point cloud; (b) Clustered point cloud graph with nodes, edges and distinct clusters represented by different colors.
2.5. Object Matching
Building on the segmented objects, the next step is to establish correspondences between epoch 0 and epoch 1. Since segmentation is performed using the cut-pursuit algorithm, each object is assigned a unique segment identifier (ID). To efficiently link objects between epoch 0 and epoch 1, we use a nearest-neighbor search (NNS) based on centroid distance. The latter identifies the closest corresponding object in epoch 0 for each object in epoch 1. To accelerate correspondence search, we construct a k-dimensional (k-d) tree for each epoch using the centroids of objects. These k-d trees recursively partition the 3D space along alternating coordinate axes (x, y, z), creating an efficient hierarchical structure for fast nearest-neighbor retrieval. Each object in epoch 0 is then matched to its nearest neighbor in epoch 1. Instead of using a fixed threshold to determine whether an object has disappeared or appeared, we treat centroid displacement as a feature to be used in the classification stage. The Euclidean distance between matched centroids serves as a change indicator, where larger distances suggest object displacement or modification. We used this adaptive approach to avoid rigid thresholds, allowing for more flexible and accurate change classification.
2.6. Object Feature Extraction
Once objects are matched across epochs 0 and 1, feature extraction is performed to characterize their geometric and semantic properties, providing structured inputs for change classification. The extracted features capture both the shape and structure of objects, as well as their semantic consistency over time. Geometric features include verticality, surface variation, omnivariance, and sphericity [24]. Semantic features assess the stability of an object’s classification across epochs, ensuring that changes are meaningfully detected. In addition to centroid displacement, these features are aggregated to compute the nearest feature difference, which serves as the final input to the classification model.
2.6.1. Aggregation of Point-Level and Object-Based Features
Each object consists of multiple points, requiring feature aggregation to obtain meaningful object-level descriptors. For continuous features, such as verticality, surface variation, omnivariance, and sphericity, the mean value is computed per object. For example, mean verticality captures the overall orientation of an object, while mean surface variation reflects its roughness. For categorical features, such as the semantic label from epoch 1 and the propagated label from epoch 0, the median is used to ensure a robust representation of the dominant class within the object. This prevents outliers or mislabeled points from affecting the final classification. Table 2 summarizes the features used in this study.
Table 2.
Summary of aggregated point level and object-based features.
2.6.2. Nearest Feature Difference
The suggested Nearest Feature Difference (NFD) operation quantifies the difference in object features between two epochs. It is computed for each object by comparing its feature values at epoch 1 to those of its nearest corresponding object in the other epoch. This metric captures geometric and semantic changes while preserving the directional nature of differences (which can be negative or positive). Let the following be defined accordingly:
We define the NFD vector for as follows:
where
- represents the pth feature of the object at epoch t;
- represents the same feature for the nearest-matched object at epoch t′;
- is the total number of features.
Each NFD vector component preserves the sign of the difference to enable the detection of both magnitude and direction of change.
2.7. Change Type Classification
We use a random forest (RF) classifier to classify object-level changes based on geometric and semantic features. RF is an ensemble learning method that combines multiple decision trees, where majority voting improves stability and enhances generalization. Unlike single decision trees, which are prone to overfitting, RF leverages bootstrap aggregation, training each tree on randomly sampled subsets of the data. This process increases robustness while reducing sensitivity to noise and outliers. Additionally, RF efficiently handles heterogeneous features. Its low computational cost and scalability further make it an attractive choice for large-scale 3D change detection. Several parameters influence RF’s performance. The number of trees controls the trade-off between variance reduction and computational cost. The maximum depth regulates model complexity, preventing overfitting. Meanwhile, the split criterion, such as Gini impurity, determines the best feature at each node by maximizing class separability. This ensures that the classifier prioritizes the most discriminative features when distinguishing objects across epochs. RF also provides feature importance analysis, ranking attributes based on their contribution to impurity reduction across decision splits. This enables us to quantify the role of NFD in identifying new, disappeared, modified, and unchanged objects.
3. Results
To evaluate the proposed framework, we conducted experiments on the Urb3DCD-v2 dataset, assessing both the quantitative and qualitative performances. The evaluation includes a comparison with state-of-the-art methods, an ablation study to measure the impact of object-based clustering, and a feature importance analysis to identify key contributors to change classification.
3.1. Implementation
All pre-processing, feature extraction, and classification tasks were conducted using Python 3.9, using key libraries such as Scikit-Learn for machine learning and the LiDAR Platform (https://lidar-platform.readthedocs.io/en/latest/ accessed on 15 January 2025) for point cloud processing and automation. The cut-pursuit clustering was implemented using the TreeIso library (https://github.com/truebelief/artemis_treeiso/tree/main/Python accessed on 07 February 2025) [23], ensuring the efficient clustering of large-scale point clouds. Additionally, custom scripts were developed to integrate data processing, object matching, and feature computation into a streamlined workflow. To accelerate object matching, we used the KDTree implementation from scipy.spatial, which efficiently structures centroid locations for nearest-neighbor searches. The experiments were executed on a high-performance workstation equipped with an NVIDIA GeForce RTX 3090 GPU, an Intel i9-10980XE CPU (3.00 GHz), and 256 GB of RAM (Random-Access Memory).
3.2. Experiment Setting
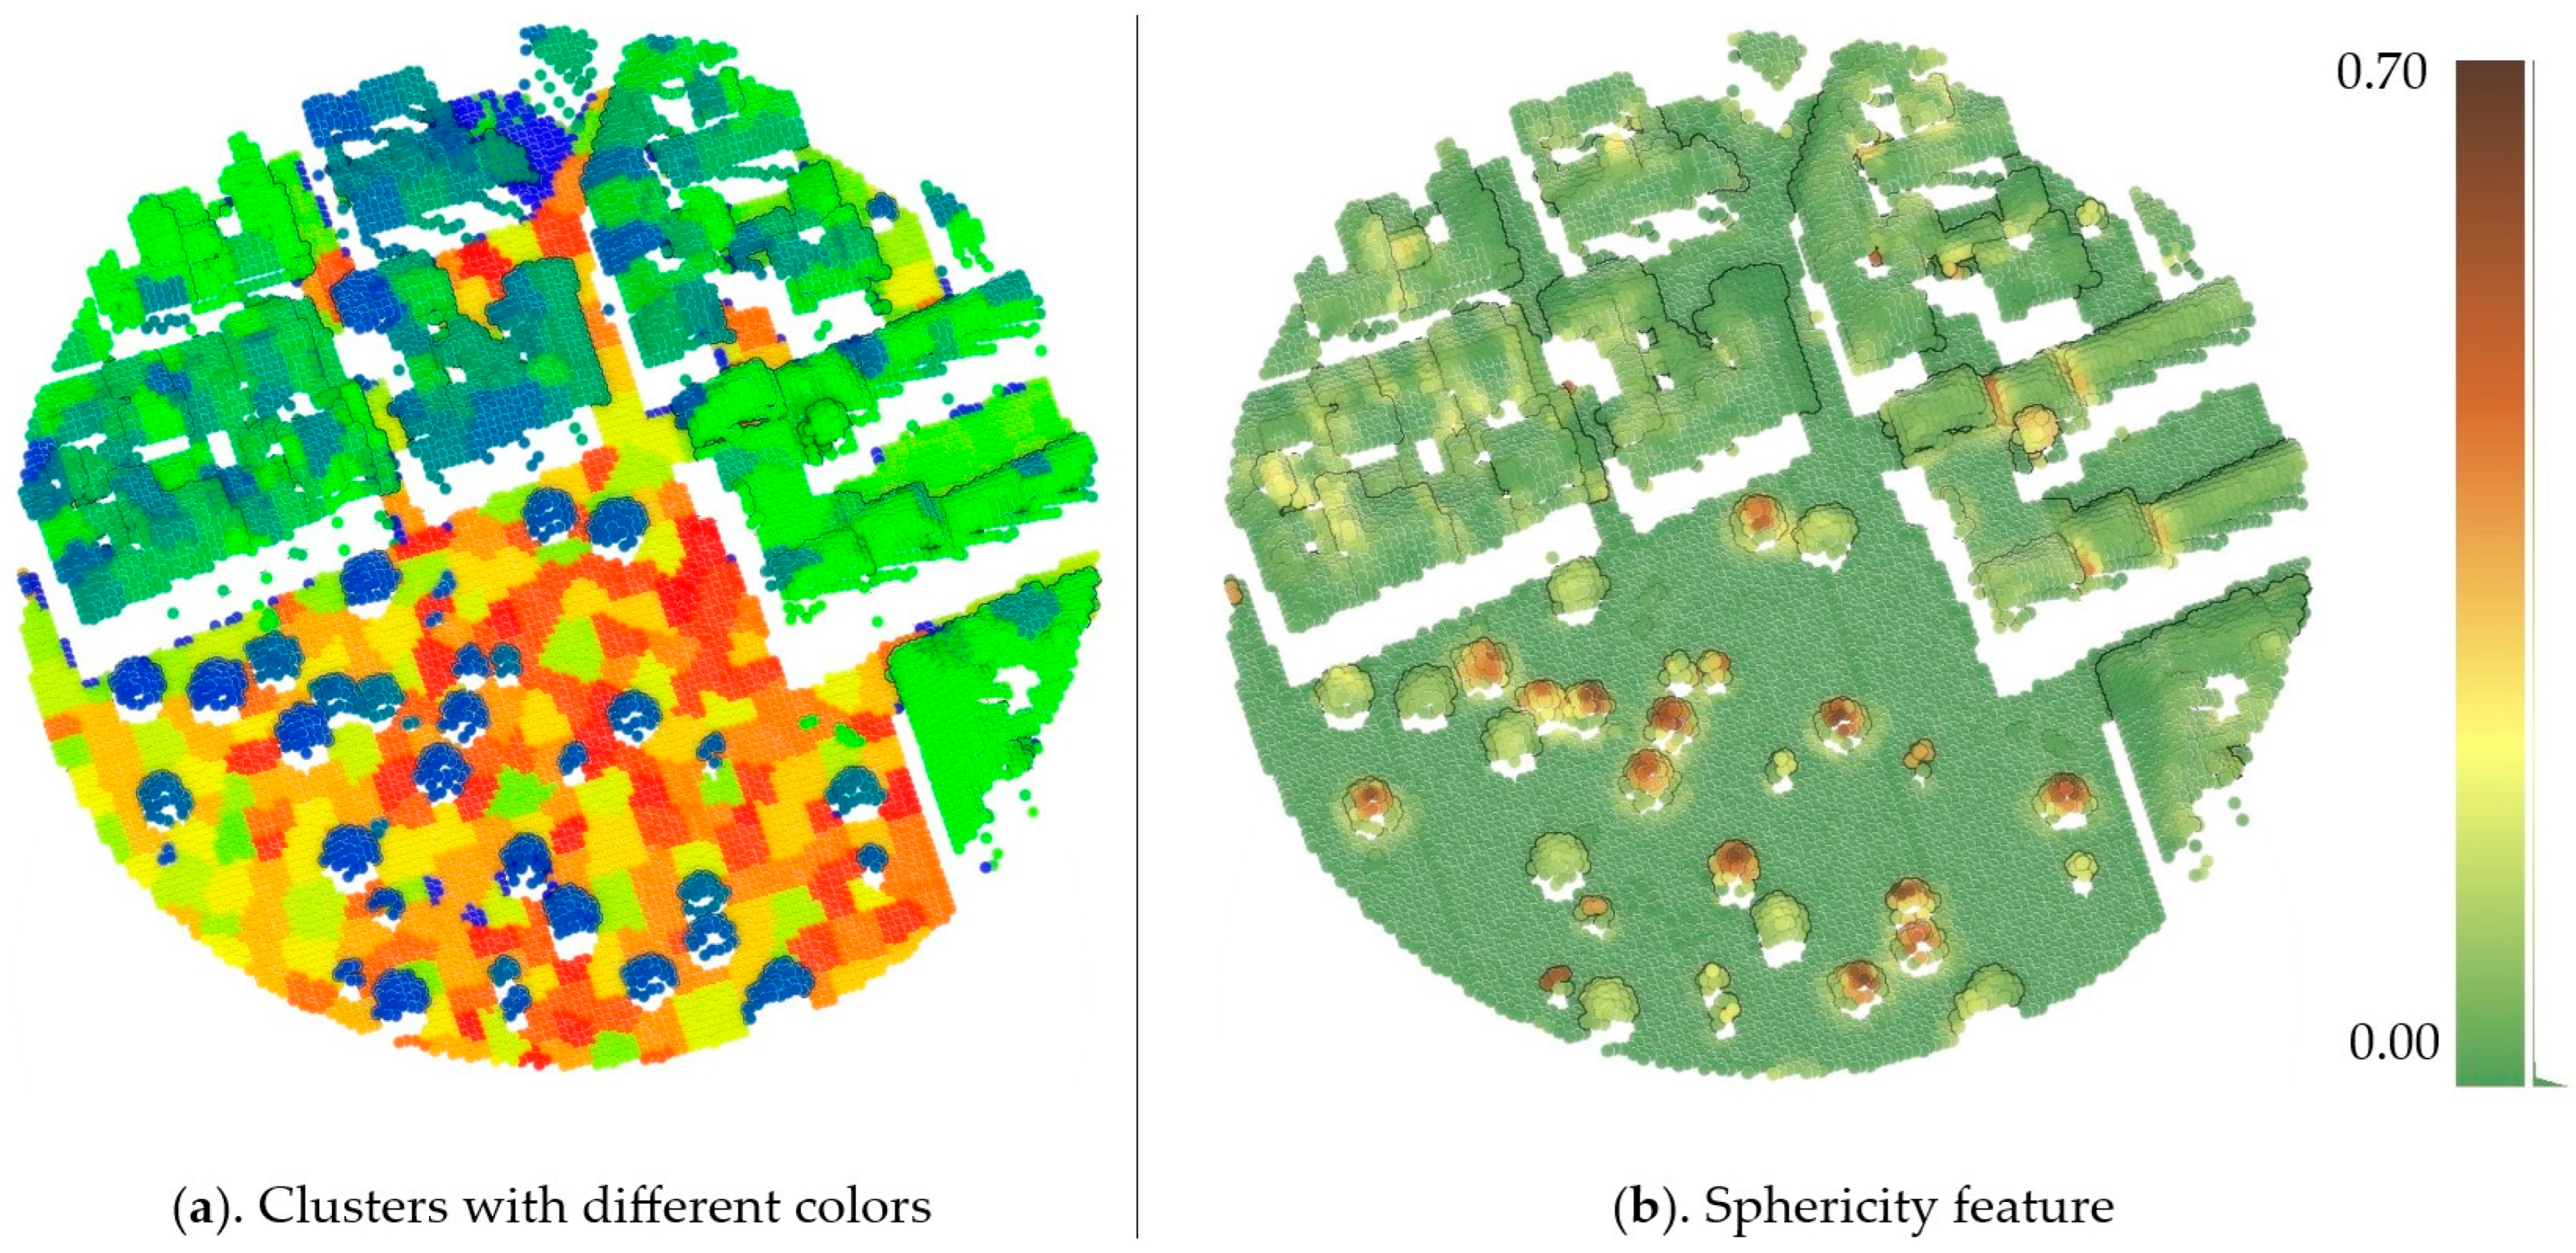
The proposed method was implemented using the predefined point cloud classification, with all the data already registered. Feature extraction was performed using a 6 m diameter for computing geometric features such as verticality, sphericity, surface variation, and omnivariance to ensure robust local shape characterization. Change indicators were derived using C2C distances computed with a nearest-neighbor search, as well as M3C2 distances with a normal diameter of 14 m, a projection diameter of 14 m, and a maximum depth of 50 m to capture variations at multiple scales, particularly for complex urban structures and vegetation (see Figure 6b).
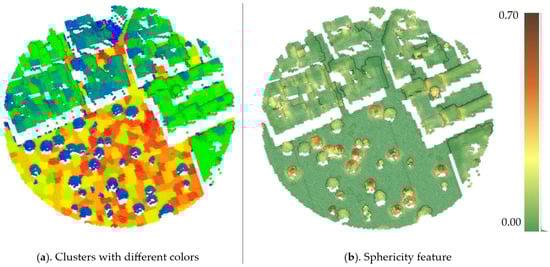
Figure 6.
Illustration of cut-pursuit clustering and sphericity feature results. (a) shows results of cut-pursuit clustering, where each color represents a distinct object. (b) shows an example of a geometric feature, sphericity, calculated at a 6 m diameter. The color scale ranges from dark brown (high sphericity values) to green (low sphericity), indicating how well the neighbors fit a spherical shape.
For clustering, the ℓ0 cut-pursuit algorithm was applied with a regularization parameter λ = 12, balancing spatial consistency and cluster separation, while a 6-neighbor connectivity ensured that local geometric structures were preserved (see Figure 6a). To optimize computational efficiency, the point cloud was decimated to a 1 m resolution, reducing processing time while maintaining sufficient detail for change classification. This choice was guided by prior research on 3D graph-based clustering (e.g., TreeIso method [23]) and validated through visual assessments to ensure robust object segmentation.
NFD was computed using a nearest-neighbor search to quantify the differences between corresponding objects across epochs. The features used for classification are detailed in Table 2. A random forest classifier was trained with 150 trees, a maximum depth of 20, and a minimum of 10 samples per split to have a balance between model complexity and generalization. These hyperparameters were determined using grid search cross-validation, optimizing for high classification performance while preventing overfitting.
3.3. Evaluation Metrics
The performance of the proposed method is evaluated using the following three standard classification metrics: recall, mean Intersection over Union (mIoU), and per-class Intersection over Union (IoU). These metrics provide an objective assessment of classification performance at both the global and class-specific levels. Recall quantifies the proportion of correctly detected changes among all actual changes. Per-class IoU is computed for each change type, providing a detailed assessment of class-specific performance. Additionally, mIoU measures the overall classification performance by computing the average overlap between the predicted and reference change regions across all classes. Higher values of these metrics indicate better classification results. The equations for these metrics are as follows:
where C is the total number of classes, TP represents true positives, FP represents false positives, and FN represents false negatives. These metrics collectively ensure a robust evaluation of change detection accuracy, both at the global and per-class levels.
3.4. Quantitative Results
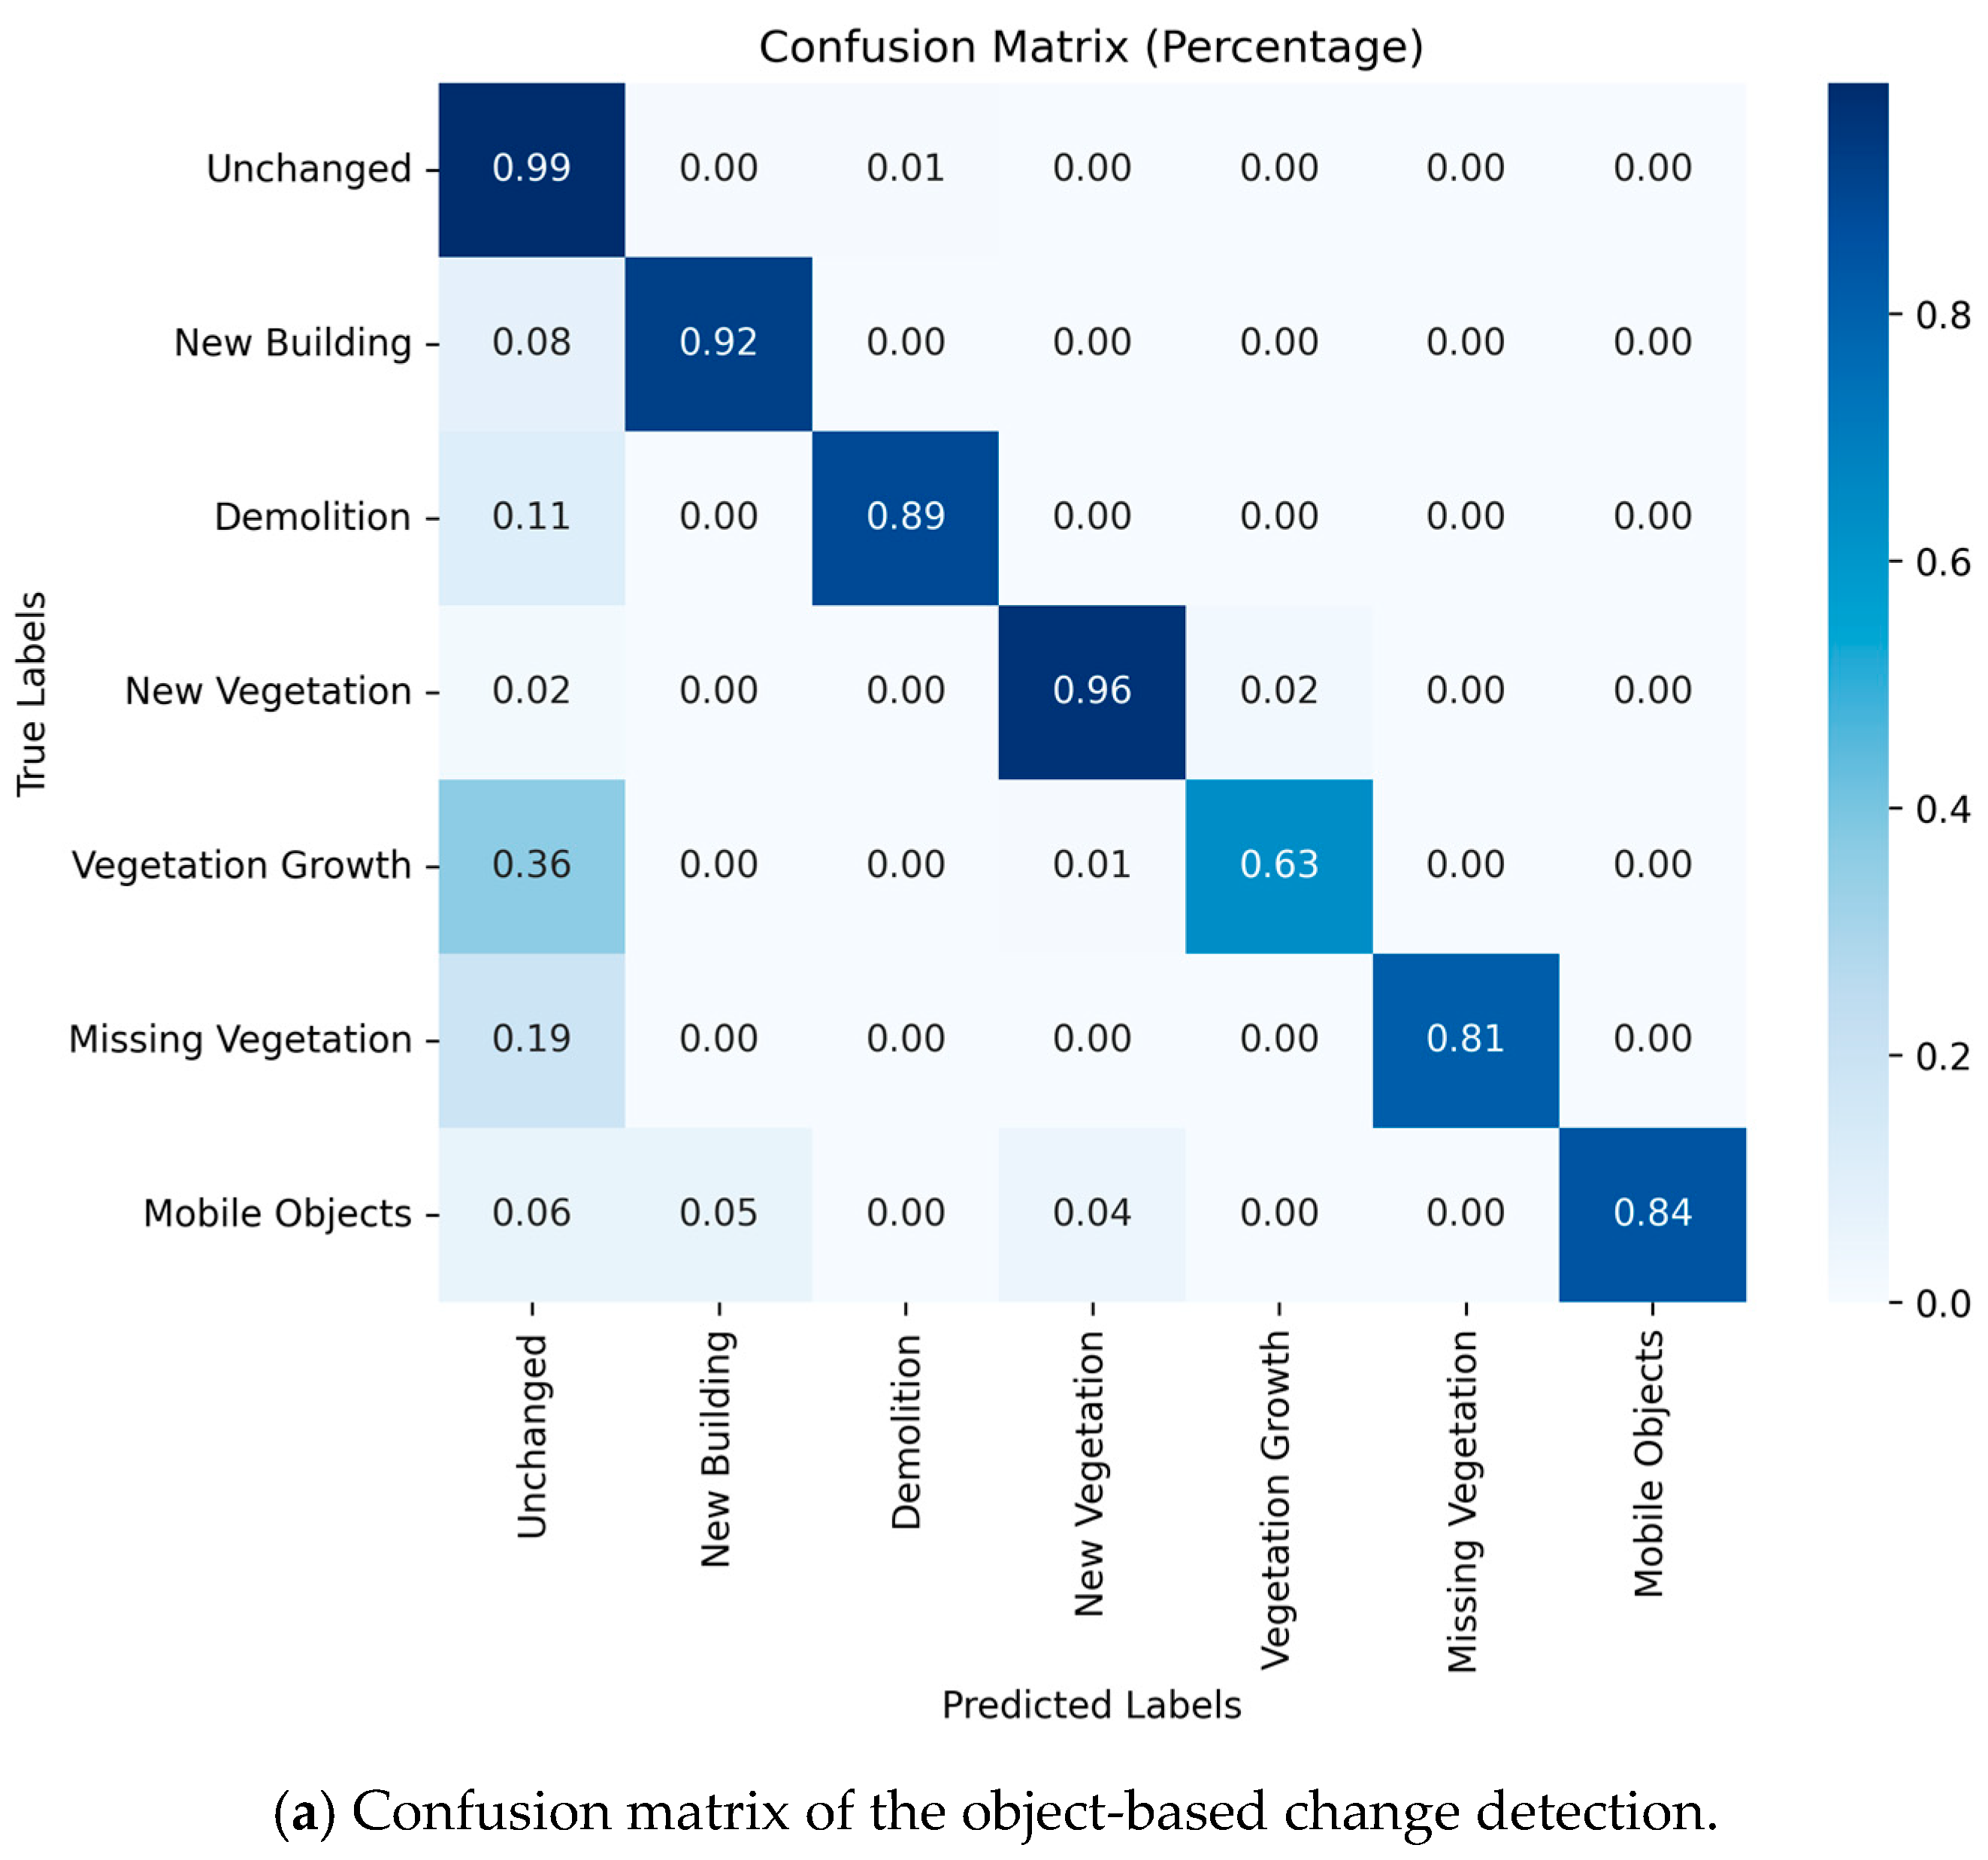
Table 3 presents the quantitative evaluation of our proposed object-based change detection framework across multiple change categories. Our method achieves an mIoU of 81.83% and a recall of 86.39%, demonstrating strong classification performance. Notably, it performs well in detecting major structural changes such as new buildings (87.93%) and demolition (81.40%), benefiting from the integration of geometric and semantic features. For vegetation-related changes, our method achieves 94.07% IoU for new vegetation, indicating its ability to distinguish between persistent and newly introduced natural elements. Our method outperformed the random forest method by [4], which achieved an mIoU of only 53.37%. Compared to deep learning models such as Siamese KPConv and Triplet KPConv, our method remains competitive despite not relying on learned feature representations. While deep models achieve a higher mIoU (84.08%), they require substantial computational resources. By using the handcrafted geometric and semantic features in our machine learning framework, we provide a scalable and interpretable alternative for 3D change detection. A detailed confusion matrix is presented in Appendix A, offering a per-class percentage of classified objects.
We analyzed the results of two 2D methods—DSM-Siamese (Digital Surface Model Siamese) and DSM-FC-EF (Digital Surface Model Fully Connected Network with Early Fusion). DSM-Siamese and DSM-FC-EF operate on rasterized digital surface models (DSM), detecting changes based on height variations between epochs. These methods perform well in structured environments but struggle with complex vegetative and mobile object changes due to their reliance on height differences rather than object-level features. In our evaluation, DSM-Siamese achieved an mIoU of 57.41%, while DSM-FC-EF reached 56.98%, showing limitations in handling diverse change categories, particularly vegetation growth (8.92% IoU for DSM-Siamese and 1.89% for DSM-FC-EF).
Additionally, we analyzed the DC3DCD EFSKPConv model [25], which introduces an unsupervised learning approach for multiclass 3D change detection, leveraging deep clustering principles to segment changes without requiring extensive labeled datasets. It extracts pseudo-clusters from raw point clouds, which are later mapped to real-world change classes through a weakly supervised learning process. Compared to traditional supervised models, DC3DCD reduces the dependency on annotated data, making it scalable for large-scale change detection tasks. The evaluation on Urb3DCD-v2 shows that DC3DCD achieves an mIoU of 57.06%, surpassing classical machine learning models such as random forest and DSM-based approaches. However, its performance remains lower than fully supervised deep networks, including Triplet KPConv (84.08%) and Siamese KPConv (80.12%). Implicit neural representation (INR) methods take a continuous function-based approach to change detection, encoding spatiotemporal variations through learned representations. These include the Sinusoidal Representation Network (SIREN) and Random Fourier Features (RFF), both combined with Spatial Encoding (S), Total Variation Norm (TVN) for spatial smoothness, and Temporal Difference (TD) for temporal coherence. By reconstructing the underlying surface geometry at each epoch, these models aim to improve structural consistency over time. The experiments show that RFF + S + TVN + TD achieve a low per-class IoU, underperforming DC3DCD but still falling short of fully supervised deep learning models. INR-based methods excel in capturing large-scale height variations, but their reliance on function approximation makes them less effective in detecting fine-scale object changes, such as small vegetation growth or mobile objects.
Table 3.
Quantitative evaluation of methods on the simulated point cloud dataset.
Table 3.
Quantitative evaluation of methods on the simulated point cloud dataset.
| Per Class IoU (%) | |||||||||
|---|---|---|---|---|---|---|---|---|---|
| Method | Recall (%) | mIoU (%) | Unchanged | New Building | Demolition | New Veg. | Veg. Growth | Missing Veg. | Mobile Object |
| RF [4] | / | 52.37 | 92.72 | 73.16 | 64.60 | 75.17 | 19.78 | 7.78 | 73.71 |
| DSM-Siamese [26] | / | 57.41 | 93.21 | 86.14 | 69.85 | 70.69 | 8.92 | 60.71 | 8.14 |
| DSM-FC-EF [26] | / | 56.98 | 94.39 | 91.23 | 71.15 | 68.56 | 1.89 | 62.34 | 46.70 |
| Siamese KPConv [15] | 85.31 | 80.12 | 95.82 | 86.67 | 78.66 | 93.16 | 65.18 | 65.46 | 91.55 |
| Triplet KPConv [21] | 86.41 | 84.08 | 97.41 | 95.73 | 81.71 | 96.24 | 64.85 | 73.02 | 92.90 |
| DC3DCD EFSKPConv [25] | / | 57.06 | 93.96 | 79.26 | 67.88 | 75.34 | 19.48 | 20.29 | 80.10 |
| SIREN + S + TVN + TD [27] | / | / | 84.83 | 62.62 | 47.92 | 4.26 | 0.62 | 3.89 | 0.26 |
| RFF + S + TVN + TD [27] | / | / | 87.47 | 71.81 | 57.63 | 5.44 | 1.54 | 8.82 | 0.58 |
| Object-based (ours) | 86.39 | 81.83 | 96.57 | 87.93 | 81.40 | 94.07 | 57.01 | 72.04 | 83.83 |
| Point-based (ablation) | 86.99 | 83.43 | 96.98 | 91.54 | 82.31 | 93.98 | 45.37 | 73.86 | 100 |
Compared to these approaches, our object-based change detection framework provides a balanced trade-off between efficiency, interpretability, and robustness. Achieving an mIoU of 81.83%, our method outperforms the unsupervised approaches while maintaining lower computational costs than the deep learning models. It reduces false positives, particularly in new building detection (87.93% IoU), demolition (81.40% IoU), and new vegetation (94.07% IoU). While the INR methods offer a novel perspective on spatiotemporal modeling, their computational complexity and sensitivity to function fitting limit their real-world applicability. Despite its strengths, our method can be further improved by integrating feature-learning techniques from deep clustering methods like DC3DCD while retaining the structural coherence of object-based segmentation.
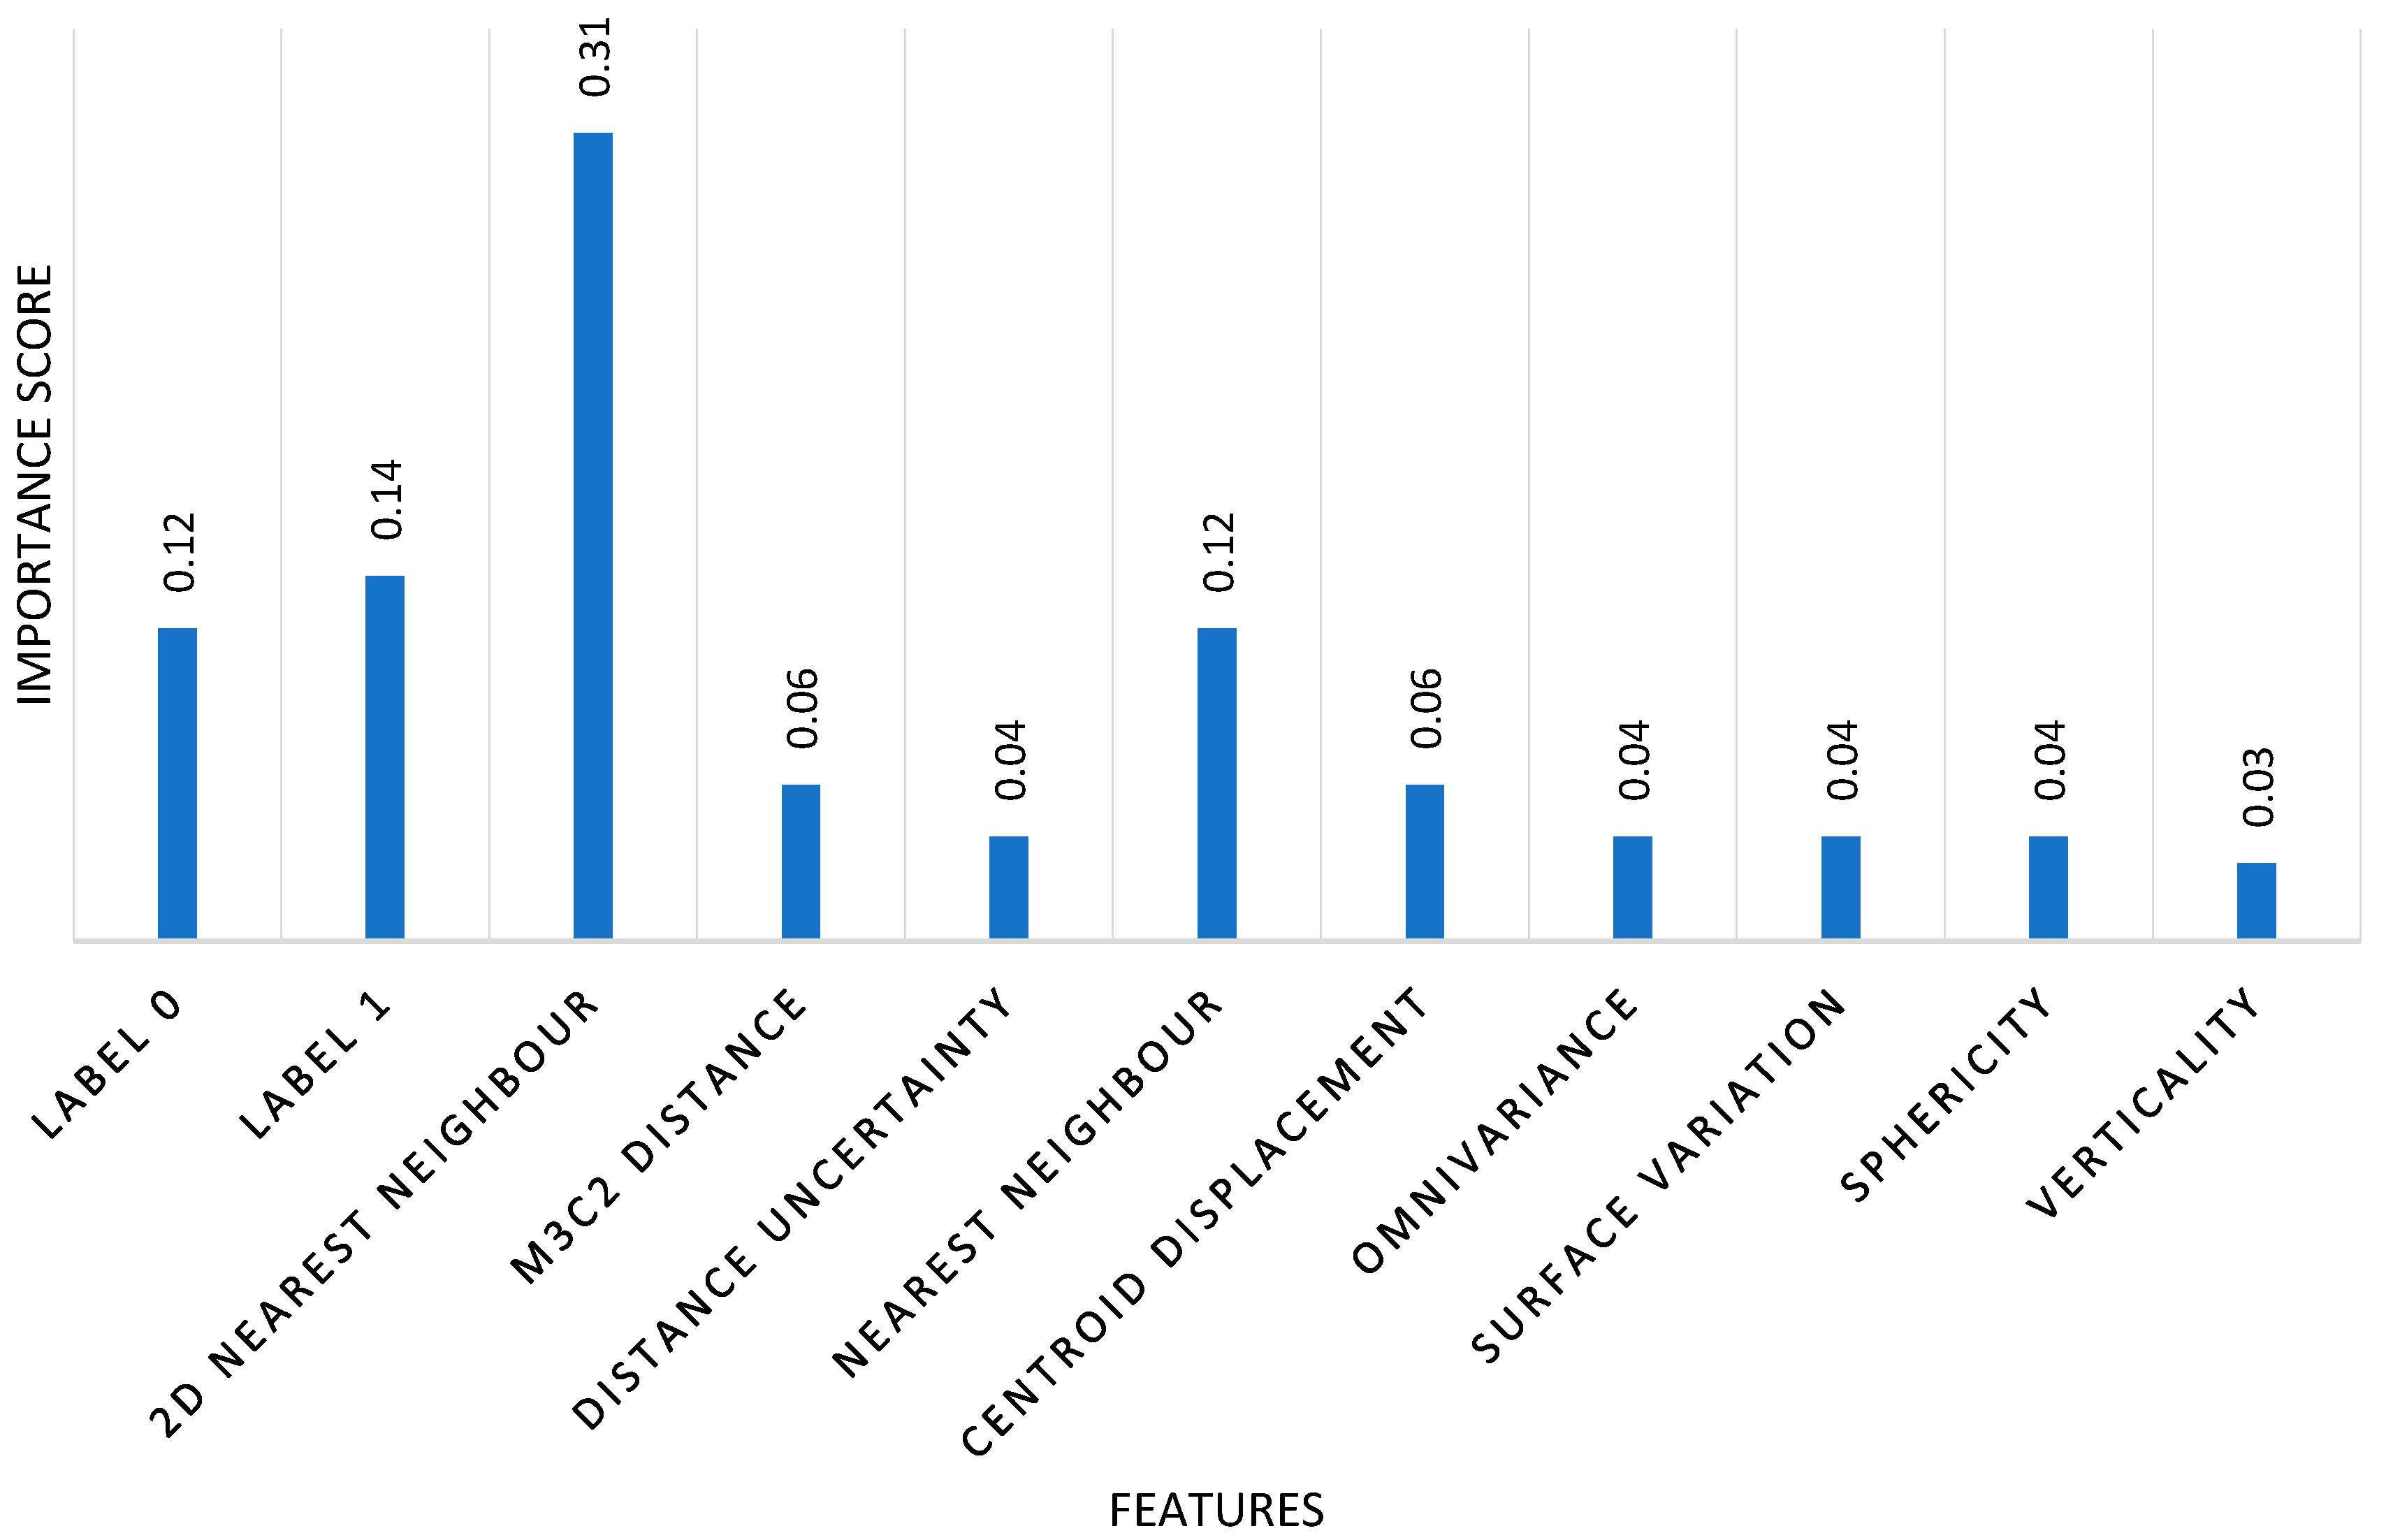
A key advantage of our method is its computational efficiency. By operating at the object level rather than the point level, the method significantly reduces the number of elements processed, leading to faster training and inference times (it was six times faster than point-based methods). In terms of interpretability, in Figure 7, we present the feature importance analysis that highlights the key features contributing to change type classification. The x-axis represents the different features analyzed, while the y-axis represents the importance of each feature. The units on the vertical axis are dimensionless and represent the relative importance of each feature, normalized to a range between 0 and 1, where 1 indicates the most important feature. This normalization allows for a clear comparison of the contribution of each feature to the classification performance. The 2D nearest-neighbor distance holds the highest importance (0.31), indicating that spatial proximity within the horizontal plane is a crucial factor for distinguishing changes. The semantic labels (label 0 and label 1) also play a significant role (0.12 and 0.14, respectively), emphasizing the relevance of object class consistency across epochs. The M3C2 distance (0.06) and object’s centroid displacement (0.06) provide valuable insights into geometric changes, particularly for structural modifications. Distance uncertainty (0.04), omnivariance (0.04), surface variation (0.04), and sphericity (0.04) contribute moderately, while verticality (0.03) holds the lowest importance, suggesting that vertical alignment is less discriminative for identifying changes in this dataset.

Figure 7.
Contribution of geometric and semantic features to object-based change classification. The values represent the relative importance of each feature, normalized to a range between 0 and 1, where 1 indicates the most important feature.
3.5. Ablation Study
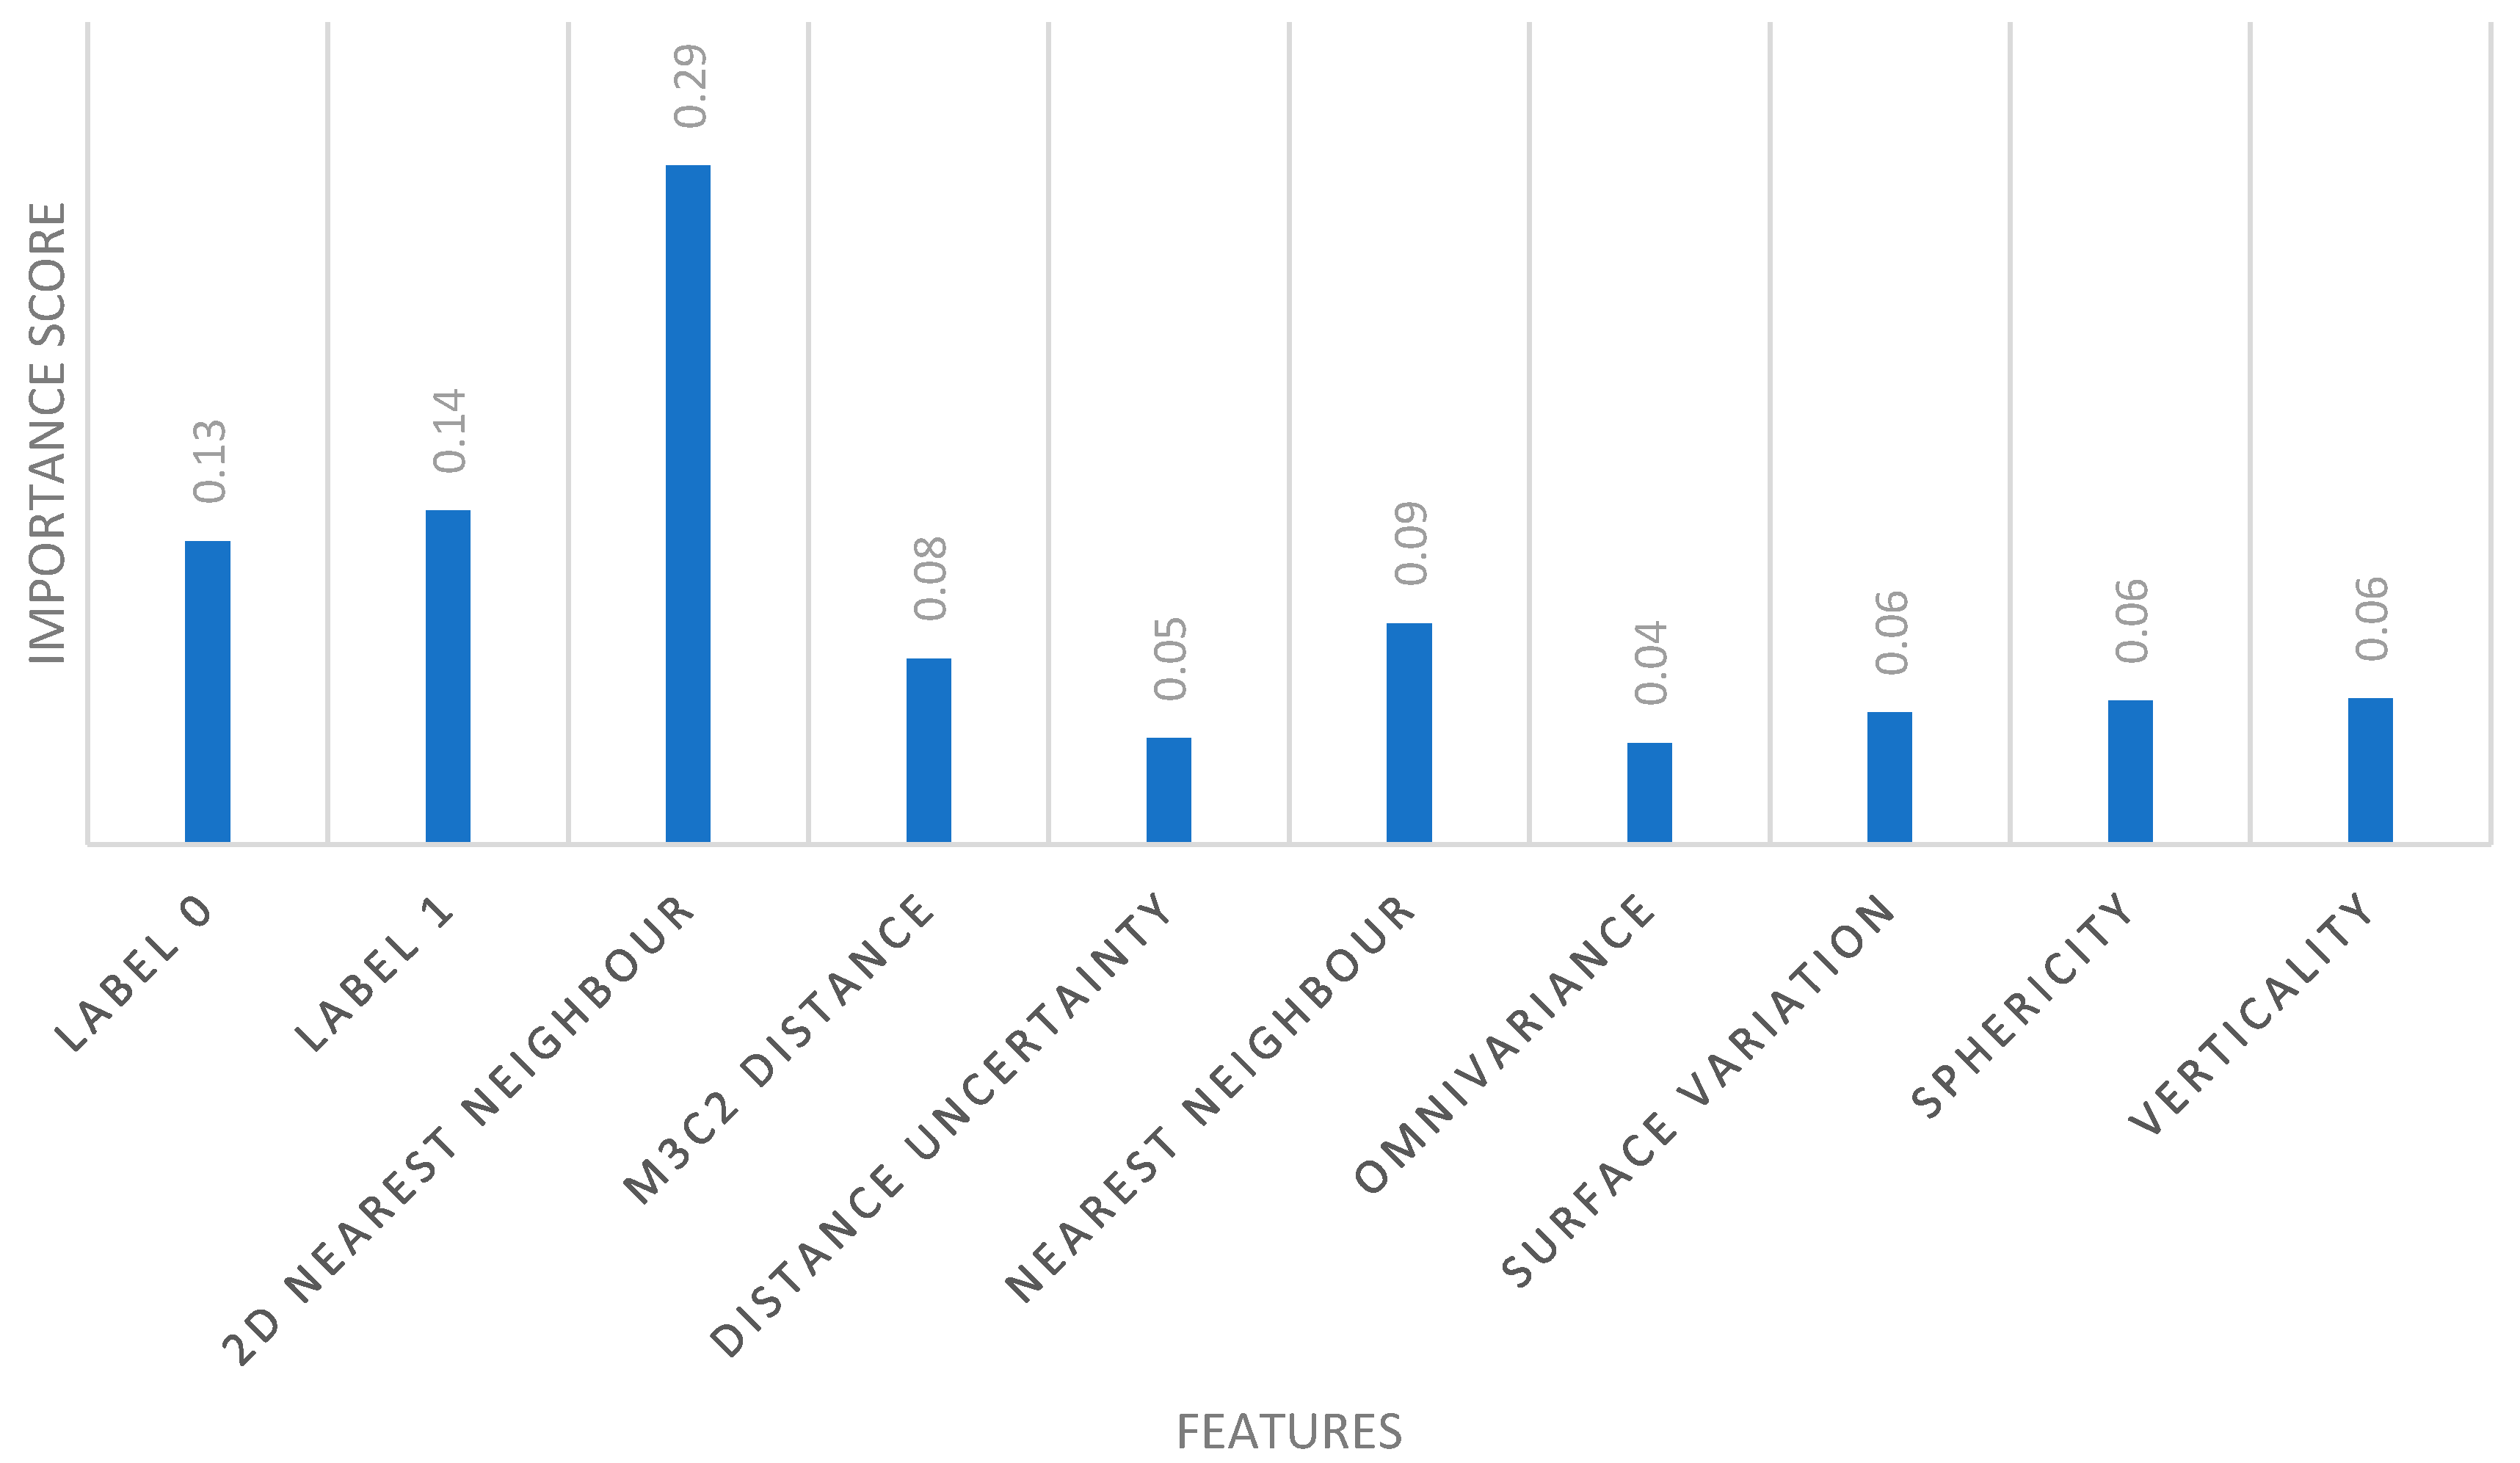
To further experiment our work, we analyze the impact of clustering on change detection by evaluating change classification without object-based features or spatial constraints. This study isolates the effect of clustering on classification performance. The point-based method classifies points independently, without object-level clustering, leading to a lack of spatial coherence. The objective is to assess the impact of working at the point level, without segmenting objects beforehand or applying post-classification refinement. We used the same features and the same random forest classifier parameters. The results (in Table 3) show that the point-based classification achieves a mean Intersection over Union (mIoU) of 83.43%, with per-class IoU values ranging from 45.37% (vegetation growth) to approx. 100% (moving objects). The confusion matrix visualization (Figure A1) highlights that certain change classes, particularly class 4 (vegetation growth), suffer from reduced performance, likely due to local inconsistencies in point-based predictions. This suggests that spatially enforcing coherence, through object-level classification, improves robustness. Analysis of the feature importance indicates that the 2D nearest neighbor search (28.91%) and label propagation from the first epoch (12.84%) are the most influential features, followed by M3C2 distance (7.89%) and sphericity (6.08%); see Figure 8. This suggests that geometric change features, particularly those using bi-temporal comparisons, are important for changes.
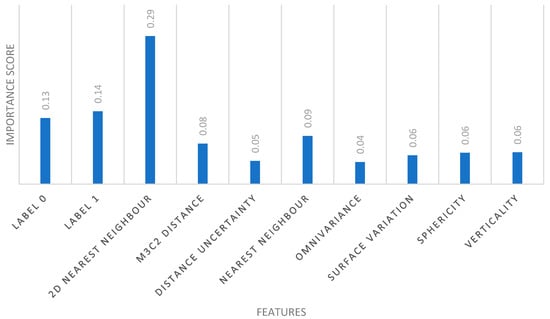
Figure 8.
Contribution of geometric and semantic features to point-based change classification. The values represent the relative importance of each feature, normalized to a range between 0 and 1, where 1 indicates the most important feature.
3.6. Qualitative Results
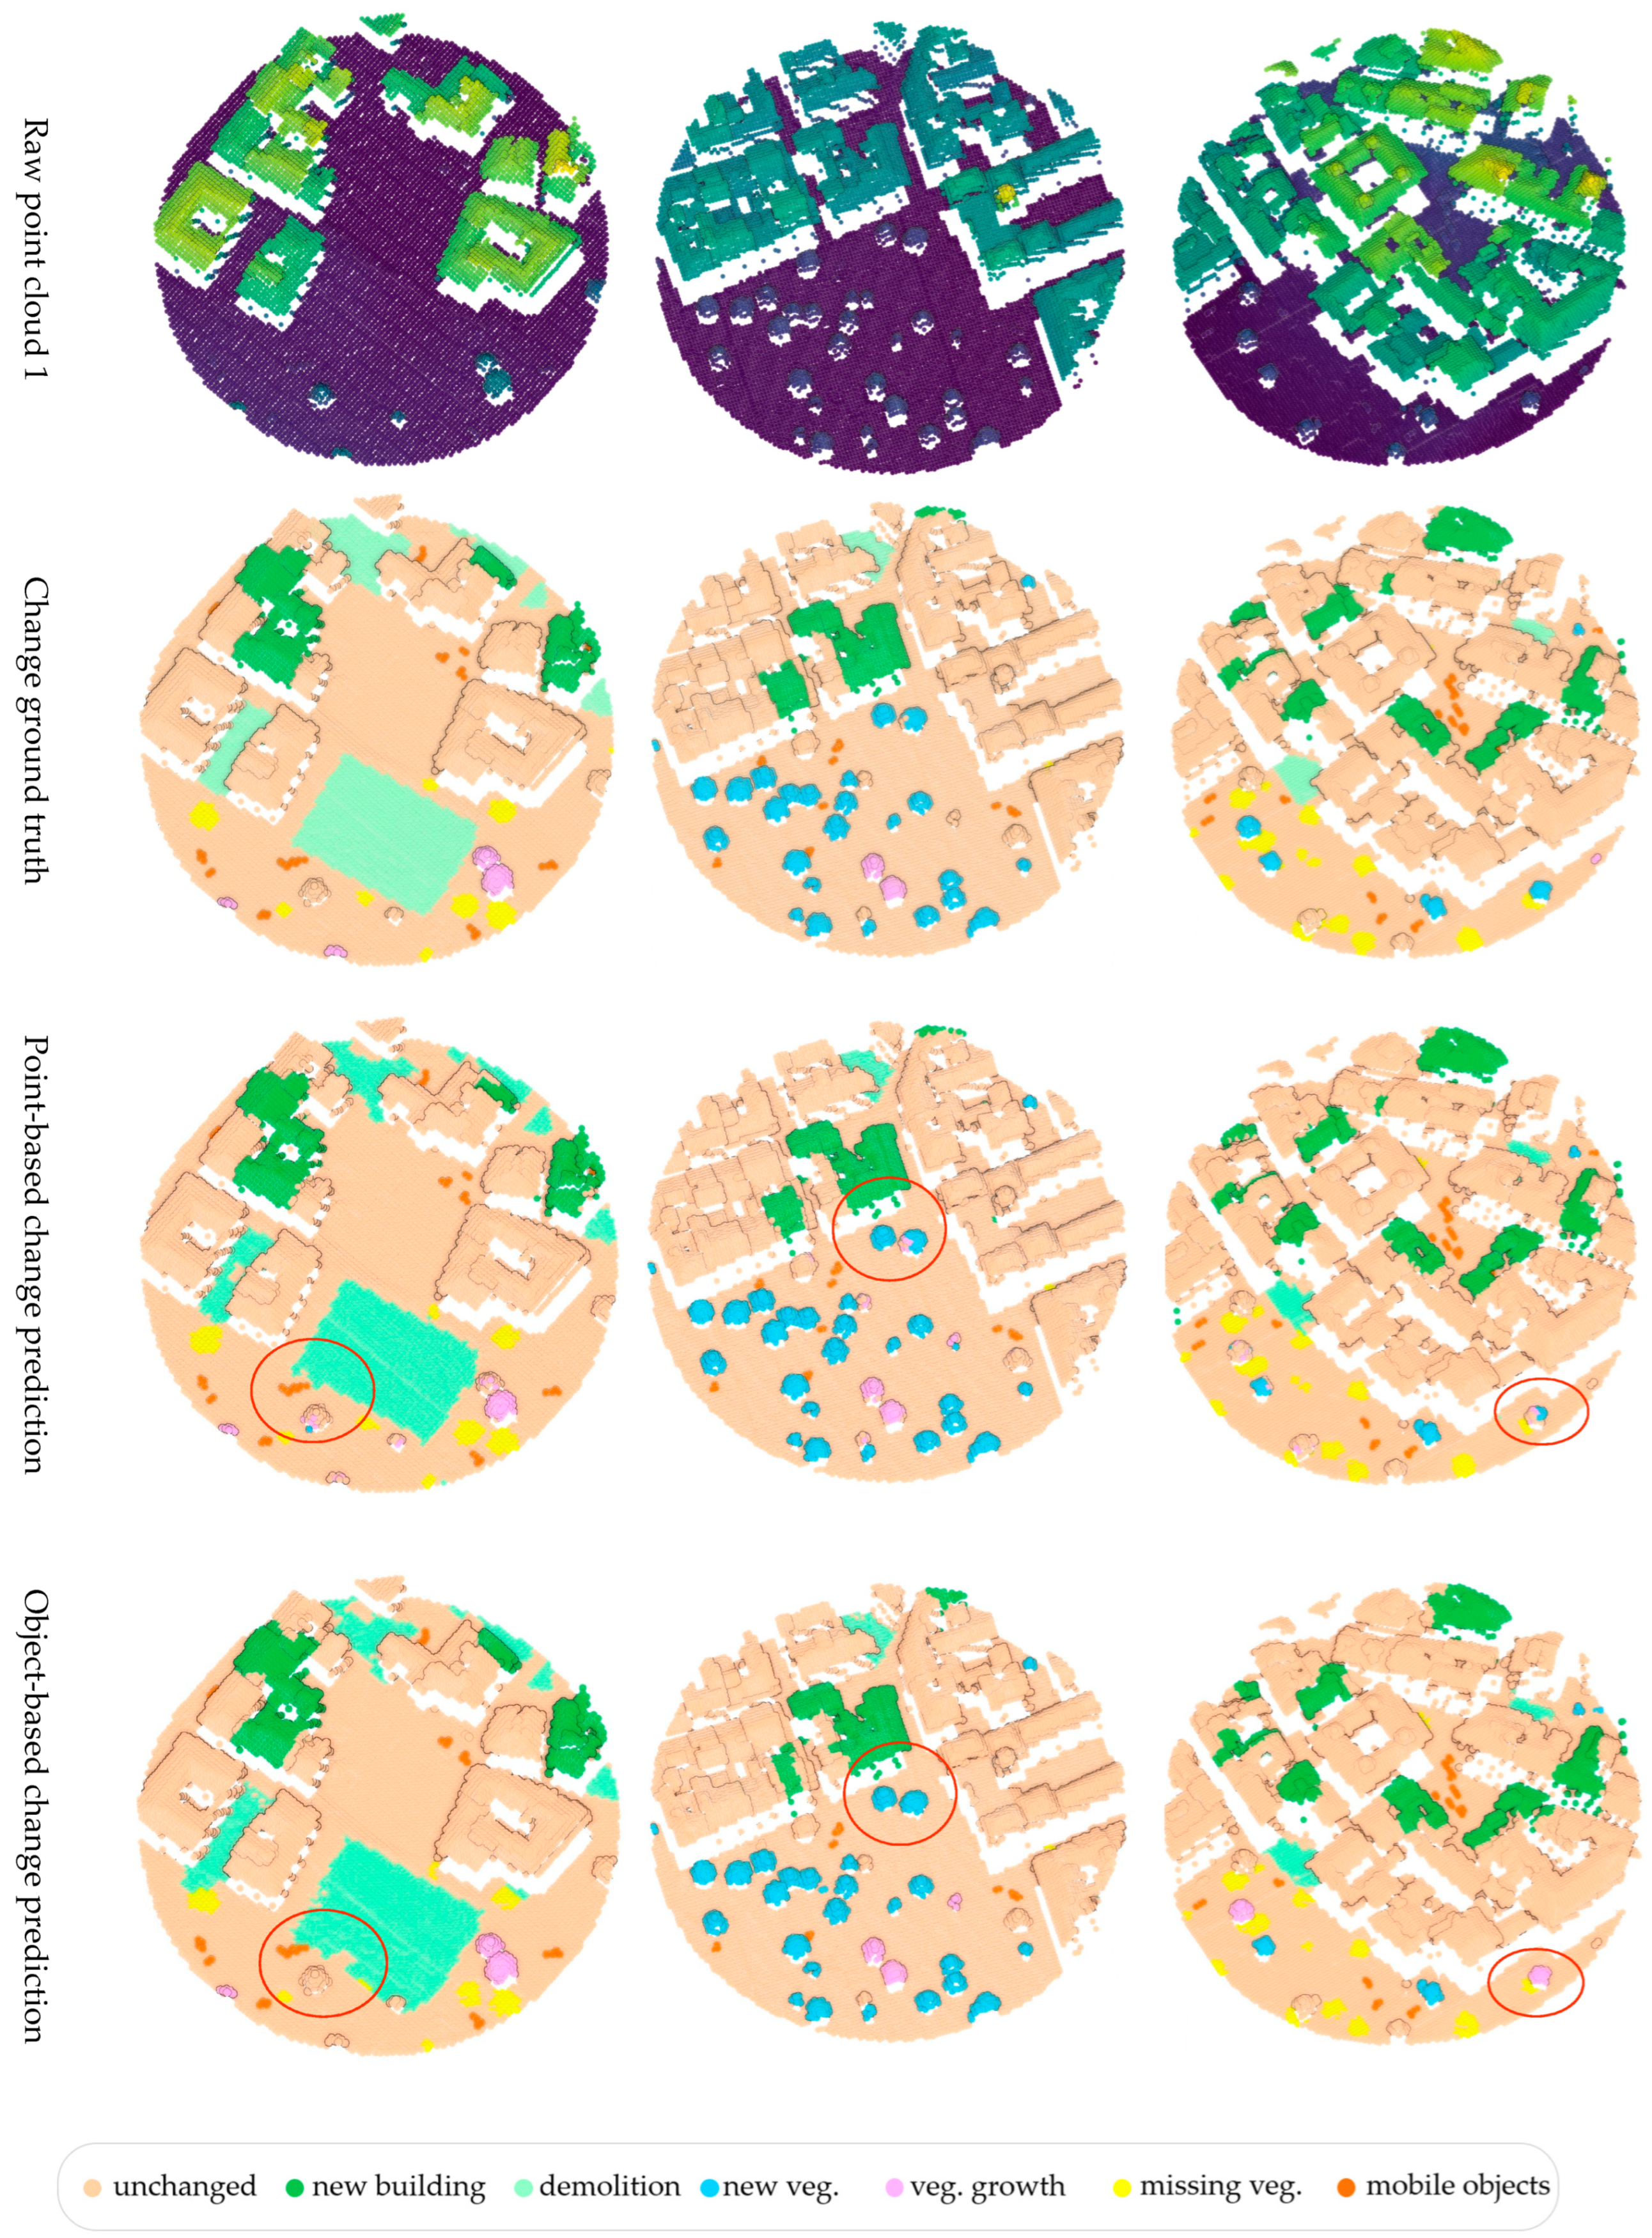
The qualitative evaluation compares the predictions of the object-based and point-based methods with the ground truth (Figure 9). The point-based approach captures detailed changes with high precision but introduces noise (red circles), as small variations are sometimes misclassified as a change. A main limitation appears in vegetation growth detection, where part of the tree is classified as unchanged, while new points are labeled as growth. This leads to errors in identifying gradual expansion.
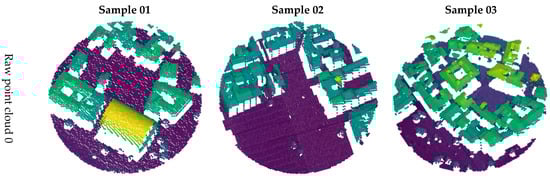
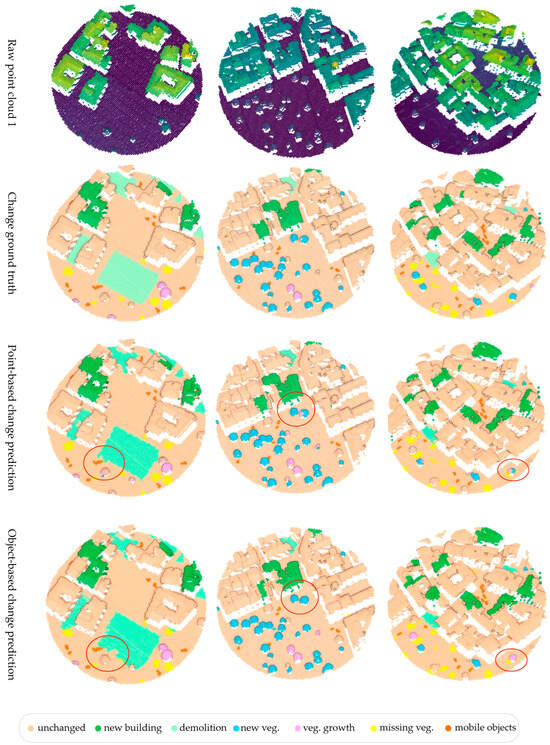
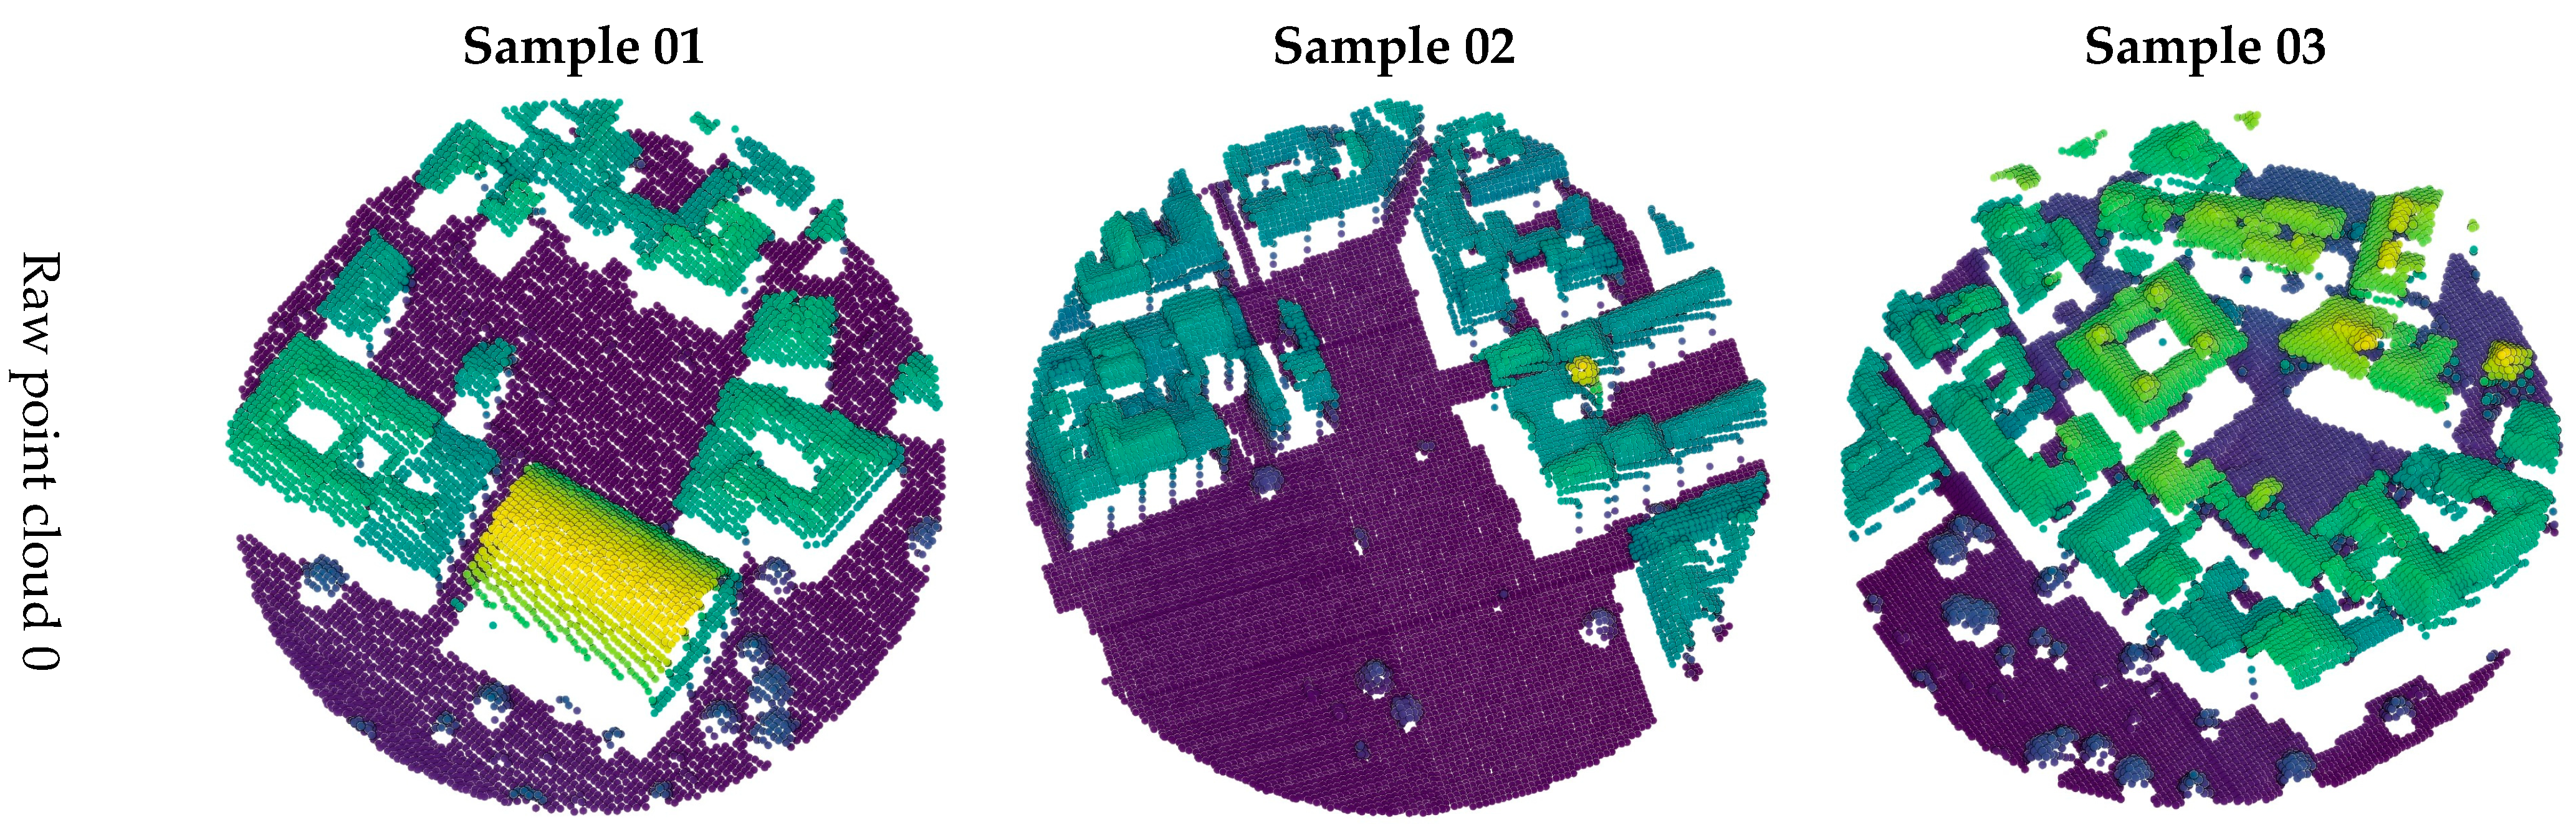
Figure 9.
Point cloud visualization of three sample regions. From top to bottom, rows represent: epoch 0 (colored by height), epoch 1 (colored by height), ground truth, point-based results, and object-based results. Red ellipses highlight key areas of interest discussed in the text.
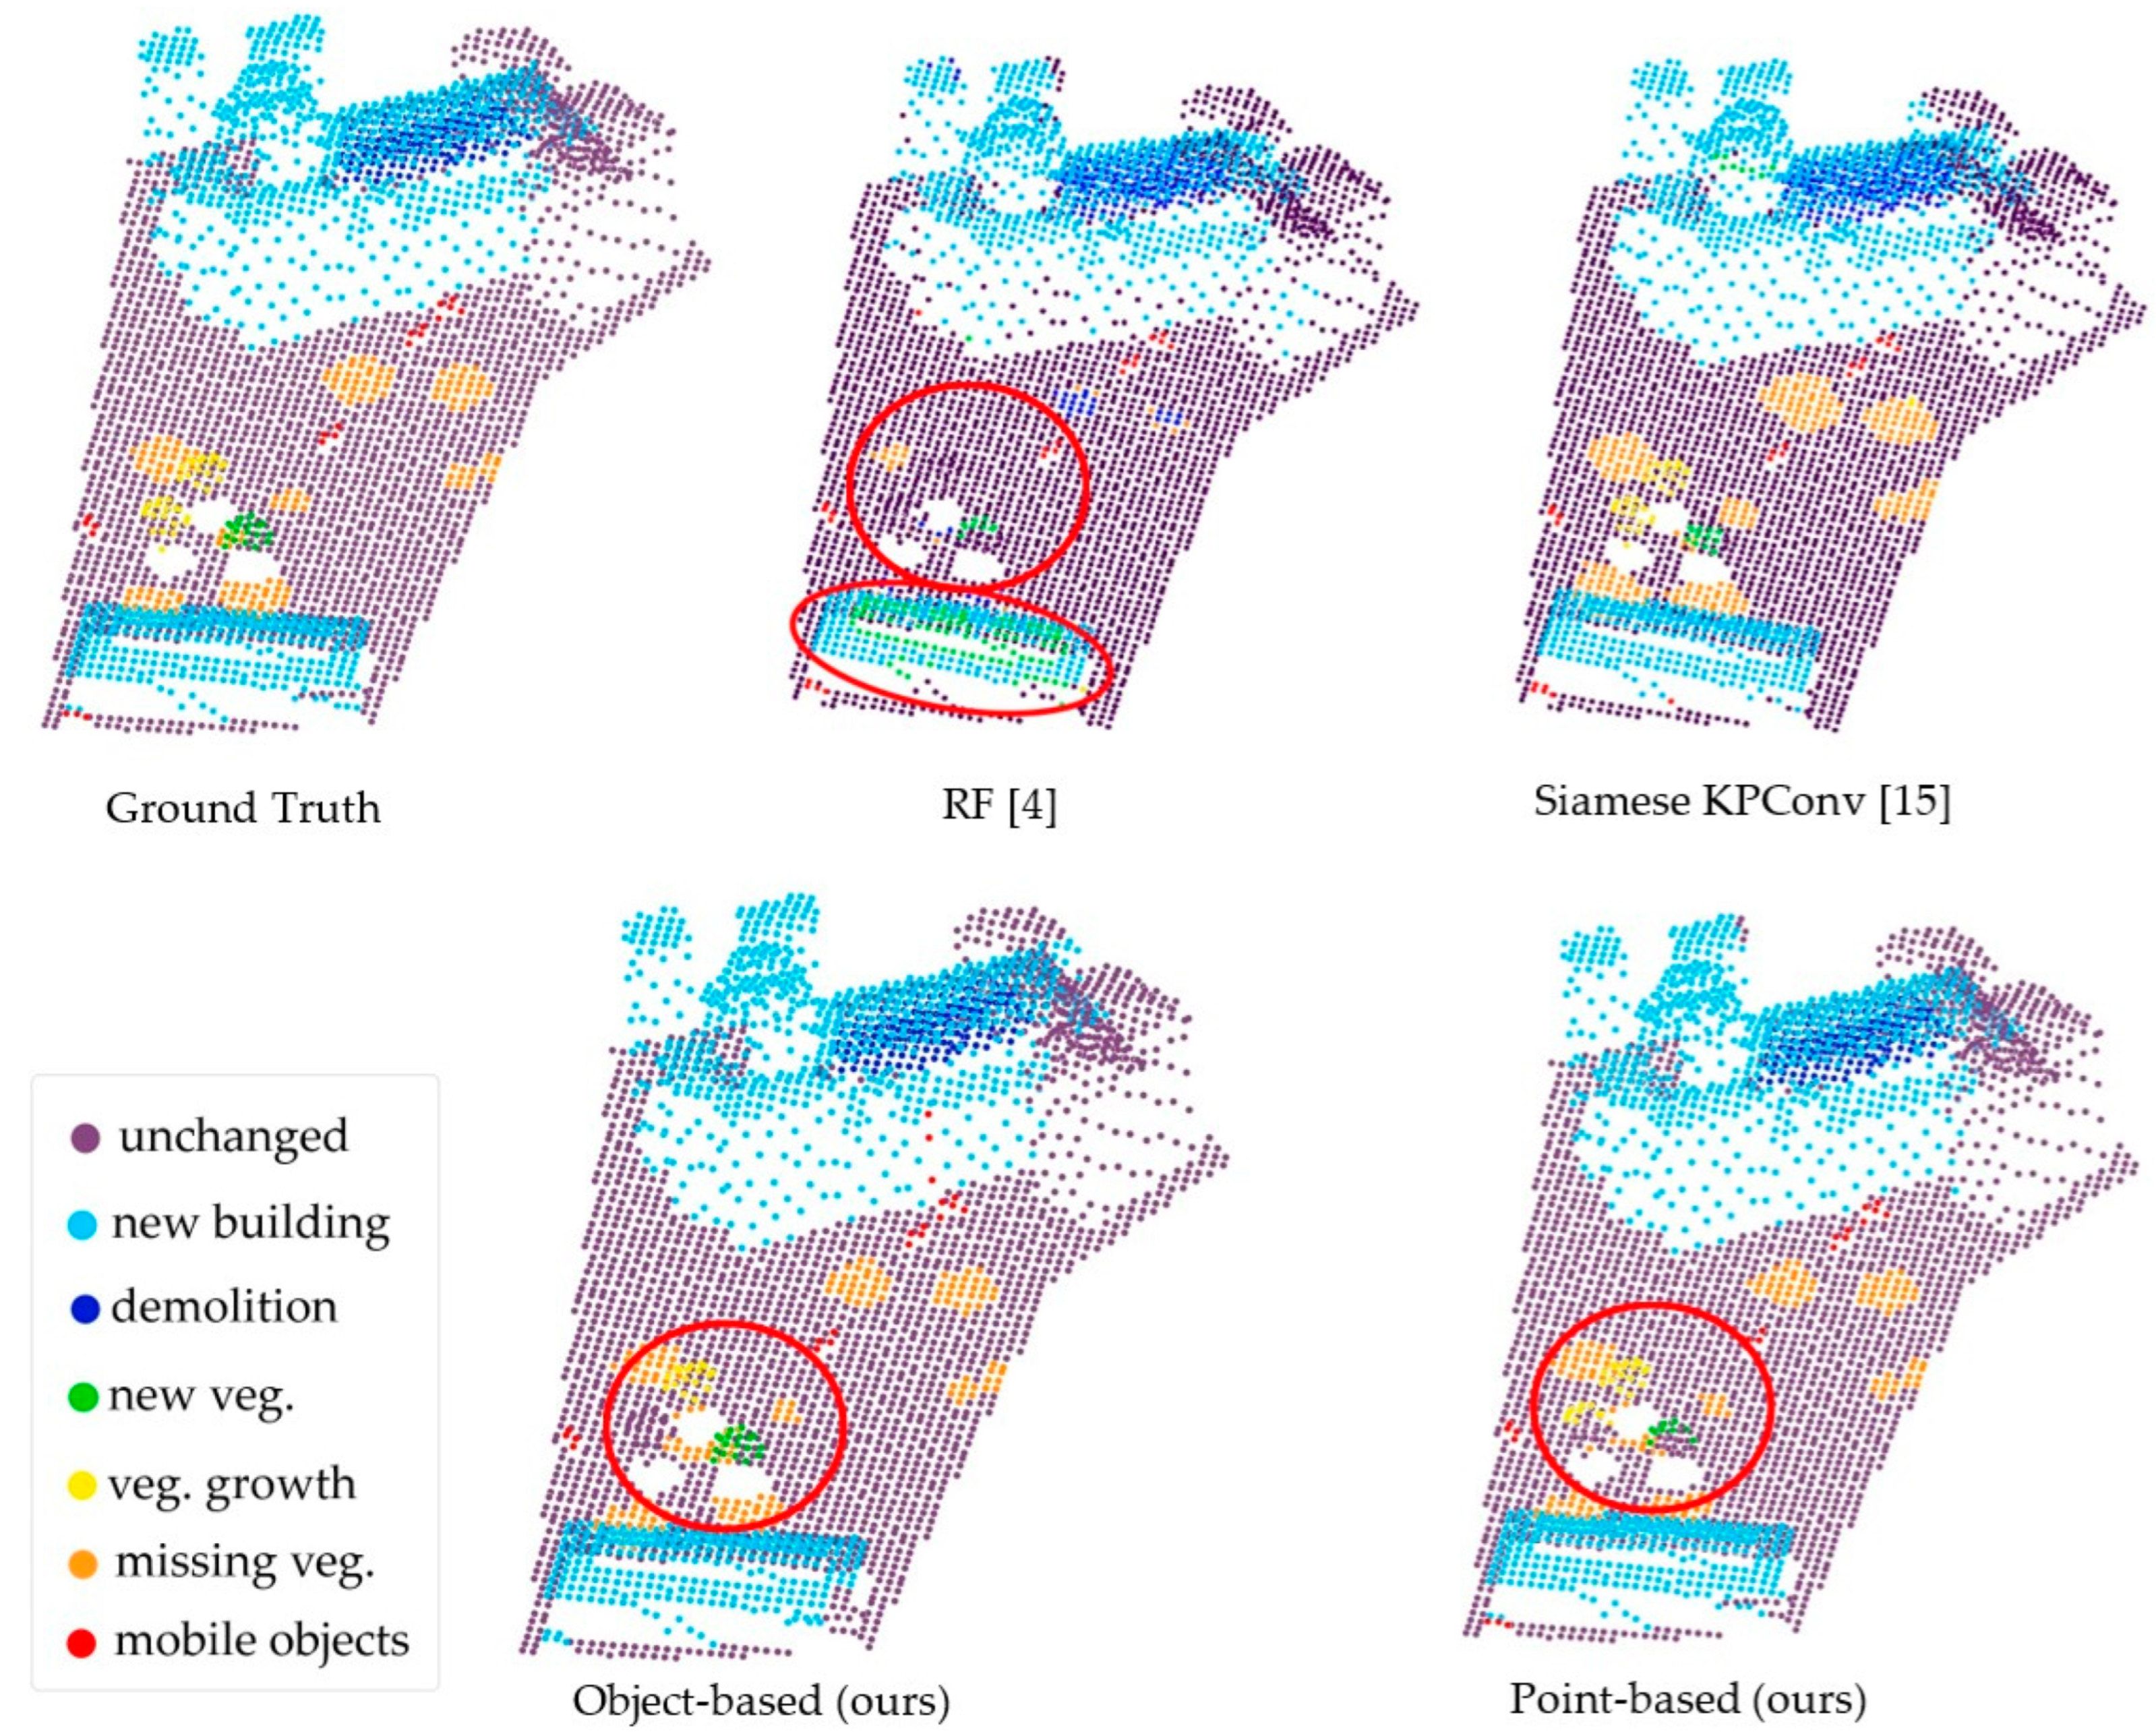
The object-based method provides more stable results with reduced noise due to structured segmentation. However, clustering influences the shape of the predicted changes, especially at object boundaries. When clusters do not match the exact shape of the change, the detection follows the cluster limits rather than the actual change boundary. This effect is noticeable along the edges of buildings and trees, where the segmentation structure affects classification. Figure 10 presents the committed errors of both methods, showing the differences in how each approach handles change detection. The results shown in Figure 11 illustrate the qualitative results achieved. The RF-based method was the least effective, where we can clearly see problems in the buildings, and the disappeared vegetation. It detects a new building as vegetation, which can be explained by the geometric similarity of these two objects in the dataset. Siamese KPConv, on the other hand, performed the most and gave visually more consistent results. In contrast, our two methods are positioned between traditional and more advanced approaches, with the object-based showing consistent results.
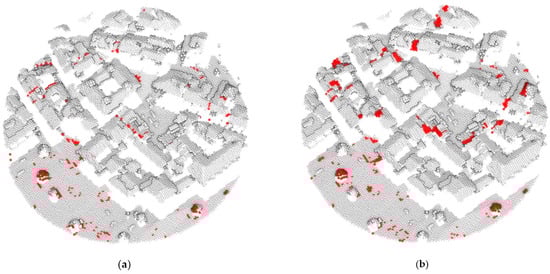
Figure 10.
Error analysis in change classification. Errors are shown in red for each method: (a) point-based errors; (b) object-based errors.
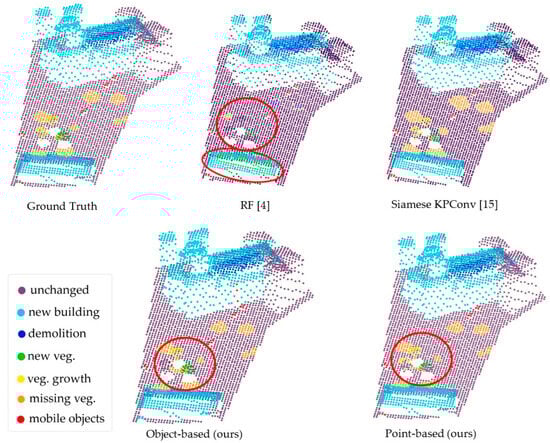
Figure 11.
Visual comparative of our methods to: Random Forest [4] and Siamese KPConv [15]. Problematic regions are highlighted by red circles.
4. Discussion
This study presents an object-based 3D change detection framework that integrates semantic segmentation and geometric feature analysis to improve classification accuracy and spatial consistency. Unlike point-based methods, which process individual points and are highly sensitive to noise, this approach groups the points into spatially coherent objects, ensuring a more stable classification process. The framework segments the point cloud using the ℓ0 cut-pursuit algorithm, matches objects across epochs, and classifies changes based on aggregated geometric and semantic features.
The results show that the method performs well in structured elements, particularly for new buildings (87.93% IoU) and demolitions (81.40% IoU), where segmentation helps maintain spatial coherence. However, vegetation-related changes remain more challenging, with 57.01% IoU for vegetation growth and 62.07% IoU for missing vegetation. These changes occur gradually and at finer scales, making them harder to track at the object level. The proposed method achieves high accuracy in mobile object classification because it learns associations from semantic labels in the previous epoch. Since mobile objects retain their class across epochs, the model automatically assigns them to the mobile object change class. When compared to state-of-the-art methods, the object-based approach achieves a balance between accuracy, efficiency, and interpretability. Deep learning models, such as Triplet KPConv (84.08% mIoU), improve feature extraction but require large training datasets. Unsupervised methods, like DC3DCD EFSKPConv (57.06% mIoU), avoid labeling costs but are highly dependent on clustering quality. These comparisons highlight the trade-offs in 3D change detection, where accuracy, computational cost, and data availability influence model selection.
The results confirm that the object-based approach enhances spatial coherence while maintaining competitive classification performance. It reduces misclassifications in urban structures and ensures a structured classification process. However, limitations persist in tracking small-scale changes, where segmentation may smooth out finer details. Moreover, the nearest-neighbor object matching may misassociate objects in densely populated areas where multiple objects have close centroid positions. Future work could explore more advanced graph-based matching techniques or probabilistic models to improve correspondence accuracy. Another limitation lies in the reliance on pre-classified point clouds. While this ensures robust semantic integration, it restricts the method’s applicability to datasets without prior classification. A potential improvement would be to integrate deep learning-based semantic segmentation within the pipeline, allowing for automated class inference. Additionally, while the object-based approach improves computational efficiency, it may oversimplify complex changes occurring at finer scales, as was demonstrated in the ablation study. Introducing adaptive segmentation techniques that dynamically refine clustering based on local geometry could enhance the framework’s adaptability.
Future work should explore adaptive segmentation strategies to refine object boundaries, particularly for dynamic environments. Integrating feature-learning techniques from deep clustering [8,25] could also enhance the method’s ability to detect complex changes while maintaining interpretability and efficiency.
5. Conclusions
This work presents an object-based 3D change detection framework that integrates geometric and semantic fusion to improve classification robustness in LiDAR point clouds. The method maintains spatial coherence, particularly for structured elements such as buildings (96.57% IoU) and missing vegetation (57.01% IoU), while clustering ensures greater classification stability by reducing spatial inconsistencies. However, segmentation may overlook small-scale changes, particularly in dynamic environments. The ablation study shows that a point-based approach achieves a higher mIoU (83.43%), with better performance in fine-grained categories such as vegetation growth (73.86%) and mobile object detection (100%). However, the lack of spatial constraints introduces more noise and classification inconsistencies, confirming a trade-off where object-based methods improve structural consistency, while point-based approaches capture finer details but remain sensitive to noise. Future work should explore hybrid models that combine adaptive clustering with attention-based architectures, such as SuperPoint Transformers, to refine object boundaries dynamically.
Author Contributions
Conceptualization, A.K. and R.B.; Data Curation, A.K.; Funding Acquisition, A.K. and R.B.; Investigation, A.K.; Methodology, A.K., and R.B.; Supervision, R.B. and R.H.; Validation, A.K., and R.B.; Visualization, A.K.; Writing—Original Draft, A.K. and Z.B.; Writing—Review and Editing, R.B., R.H., Z.B. and F.R. All authors have read and agreed to the published version of the manuscript.
Funding
Abderrazzaq Kharroubi is an Aspirant of the Fonds National de la Recherche Scientifique (FNRS).
Data Availability Statement
The data used in this study are publicly available at https://ieee-dataport.org/open-access/urb3dcd-urban-point-clouds-simulated-dataset-3d-change-detection (accessed on 10 January 2025).
Acknowledgments
The authors would like to thank their colleagues at the University of Liège and FBK for their valuable support throughout this work. Special thanks to the Fonds de la Recherche Scientifique – FNRS for providing the funding that supported this research as part of the first author’s doctoral thesis. We also extend our sincere gratitude to the reviewers for their detailed and insightful comments, which greatly helped improve the quality of the manuscript.
Conflicts of Interest
The authors declare no conflicts of interest.
Appendix A

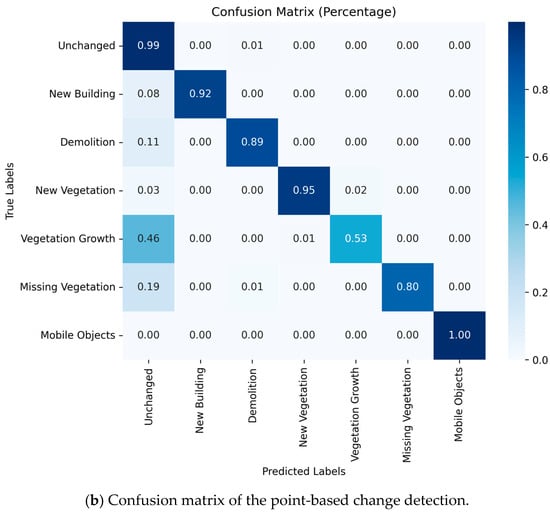
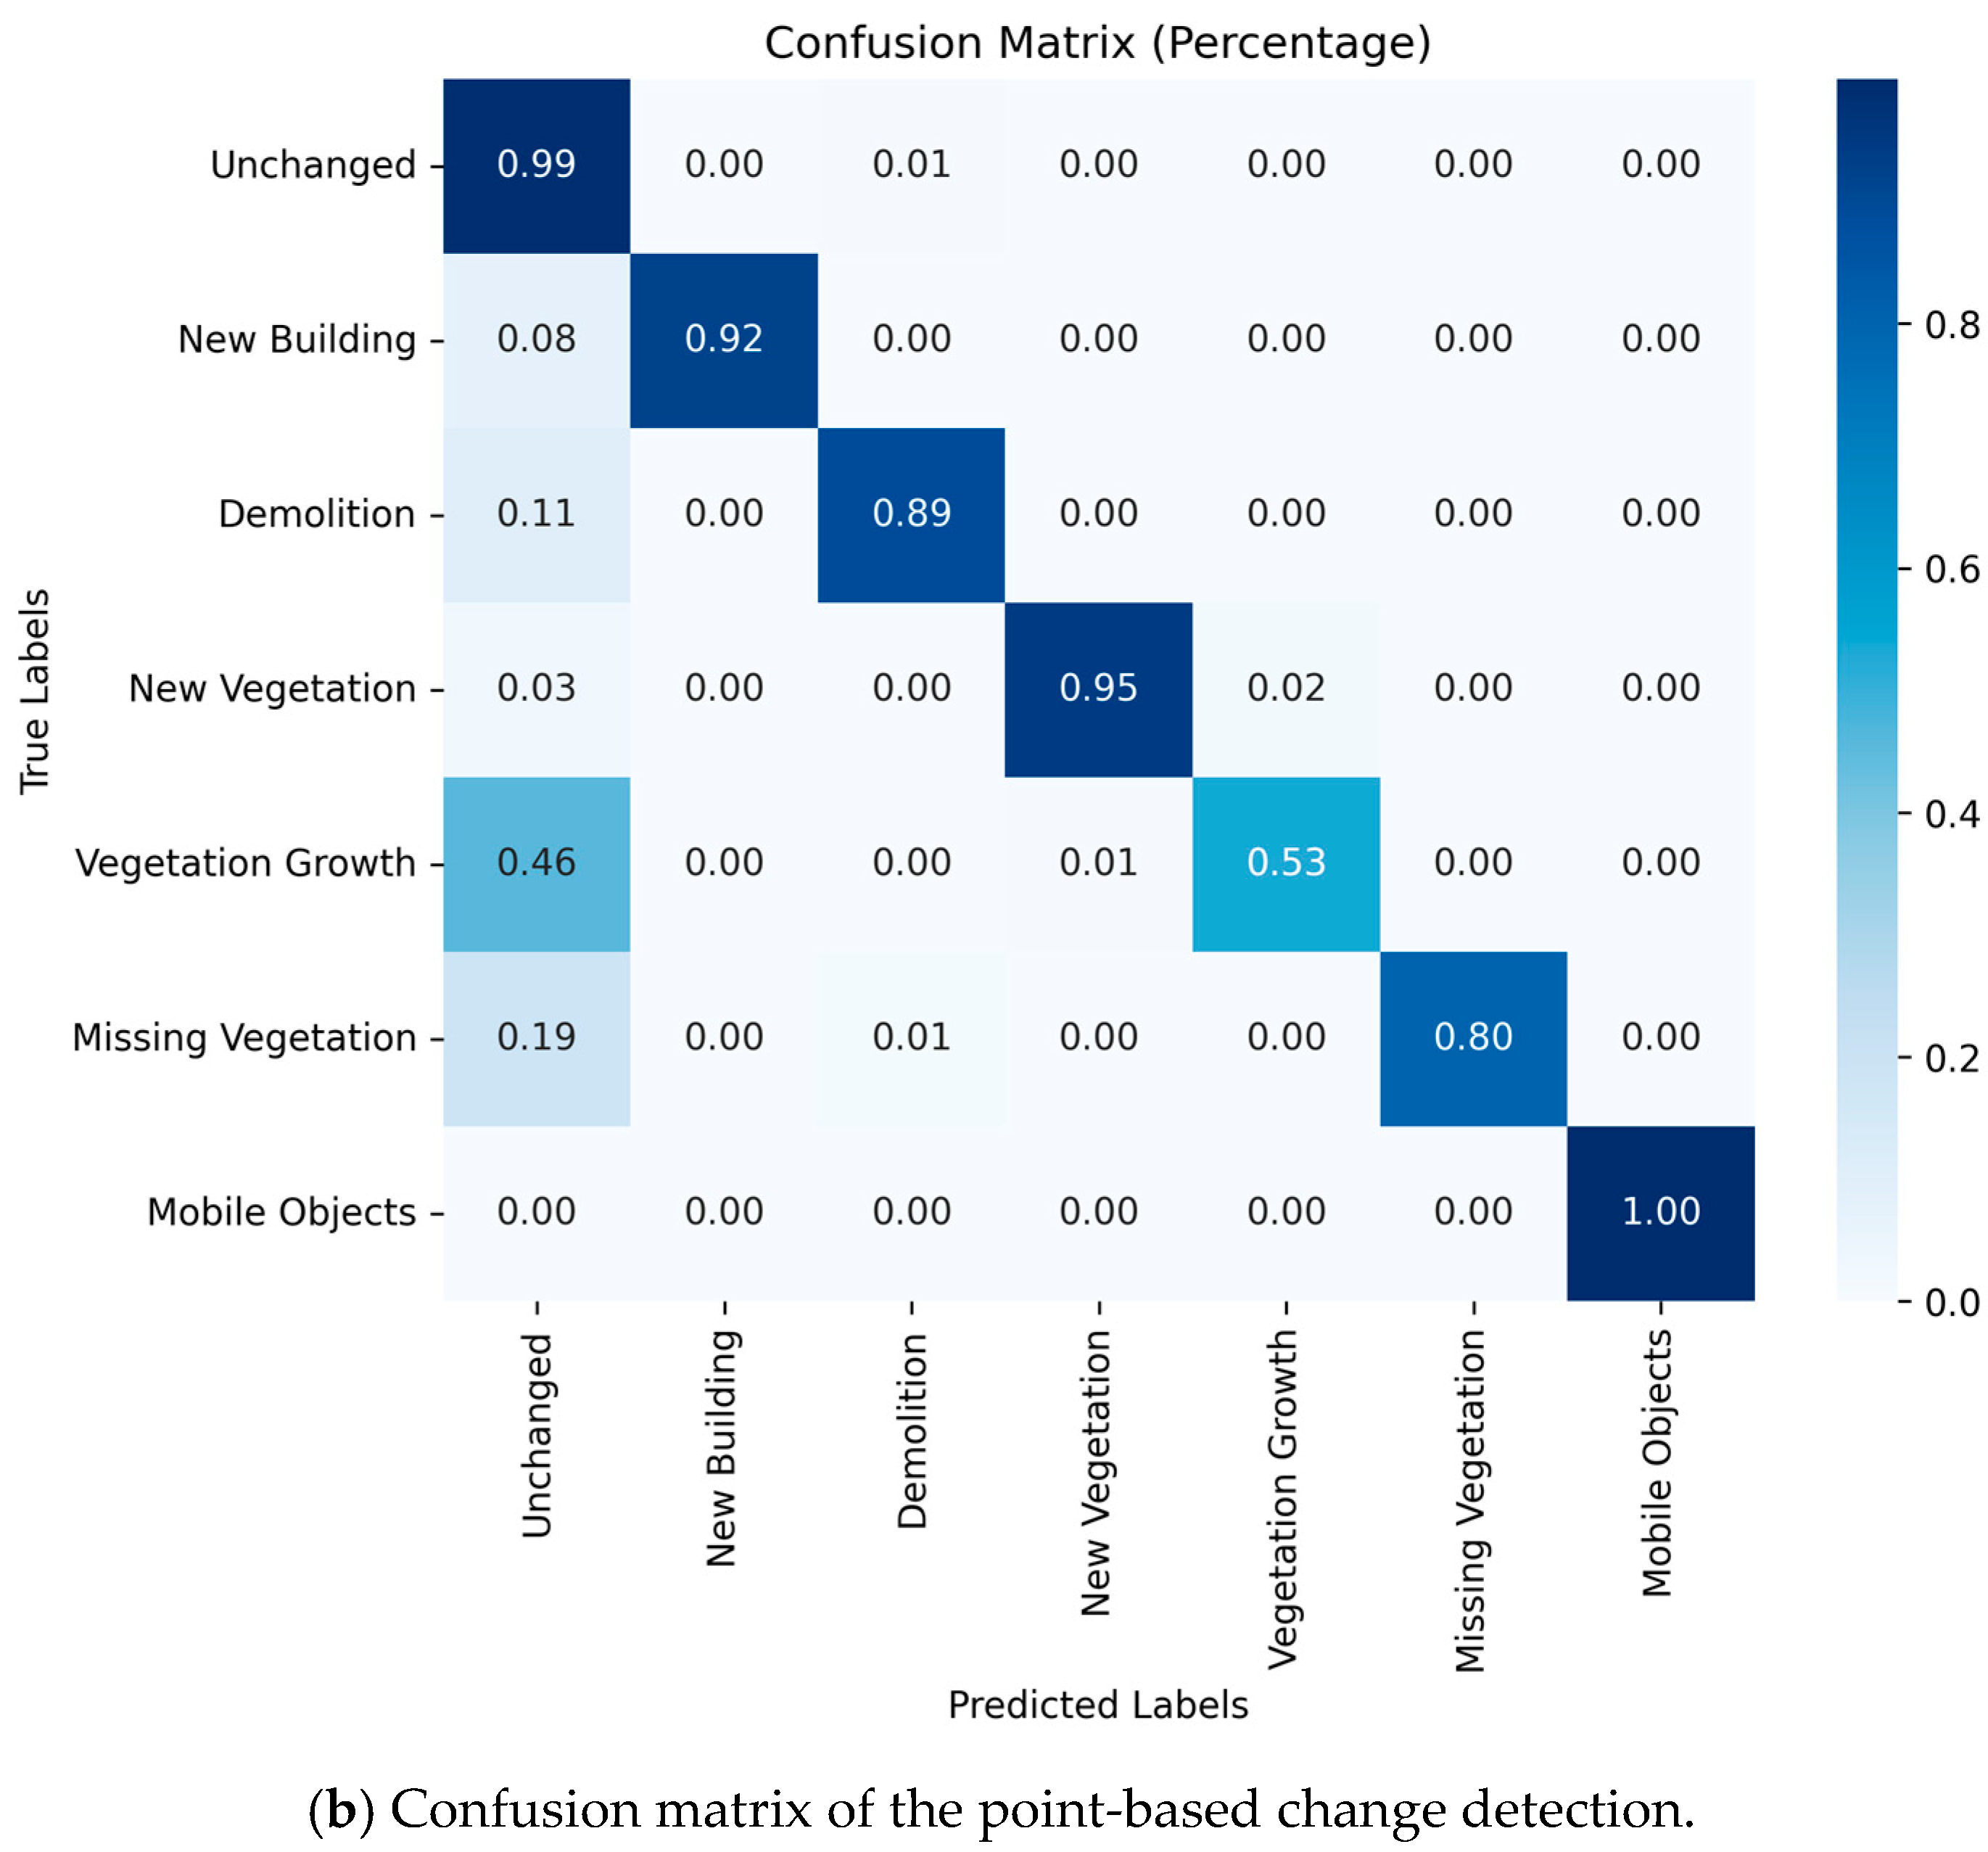
Figure A1.
Comparison between the confusion matrices: (a) object-based; (b) point-based.
Figure A1.
Comparison between the confusion matrices: (a) object-based; (b) point-based.
References
- Kim, H.; Lee, S.B.; Min, K.S. Shoreline change analysis using airborne LiDAR bathymetry for coastal monitoring. J. Coast. Res. 2017, 79, 269–273. [Google Scholar] [CrossRef]
- Mayr, A.; Rutzinger, M.; Geitner, C. Object-based point cloud analysis for landslide and erosion monitoring. Photogramm. Eng. Remote. Sens. 2019, 85, 455–462. [Google Scholar] [CrossRef]
- Lague, D.; Brodu, N.; Leroux, J. Accurate 3D comparison of complex topography with terrestrial laser scanner: Application to the Rangitikei canyon (N-Z). ISPRS J. Photogramm. Remote Sens. 2013, 82, 10–26. [Google Scholar] [CrossRef]
- Tran, T.H.G.; Ressl, C.; Pfeifer, N. Integrated change detection and classification in urban areas based on airborne laser scanning point clouds. Sensors 2018, 18, 448. [Google Scholar] [CrossRef] [PubMed]
- Zhang, L.; Zhang, Z.; Zhang, J.; Qiao, X.; Zhang, Z.; Yang, B.; Dong, Z. Object-based 3D building change detection using point-level change indicators. Int. J. Appl. Earth Obs. Geoinformation 2023, 118, 103293. [Google Scholar] [CrossRef]
- Stilla, U.; Xu, Y. Change detection of urban objects using 3D point clouds: A review. ISPRS J. Photogramm. Remote. Sens. 2023, 197, 228–255. [Google Scholar] [CrossRef]
- Betsas, T.; Georgopoulos, A.; Doulamis, A.; Grussenmeyer, P. Deep Learning on 3D Semantic Segmentation: A Detailed Review. Remote. Sens. 2025, 17, 298. [Google Scholar] [CrossRef]
- Robert, D.; Raguet, H.; Landrieu, L. Efficient 3D Semantic Segmentation with Superpoint Transformer. In Proceedings of the IEEE/CVF International Conference on Computer Vision, Paris, France, 2–6 October 2023; Available online: http://arxiv.org/abs/2306.08045 (accessed on 8 January 2025).
- Huang, R.; Xu, Y.; Hoegner, L.; Stilla, U. Semantics-aided 3D change detection on construction sites using UAV-based photogrammetric point clouds. Autom. Constr. 2021, 134, 104057. [Google Scholar] [CrossRef]
- Tan, L.; Zuo, X.; Cheng, X. CGMNet: Semantic Change Detection via a Change-Aware Guided Multi-Task Network. Remote. Sens. 2024, 16, 2436. [Google Scholar] [CrossRef]
- Zhu, Y.; Li, L.; Chen, K.; Liu, C.; Zhou, F.; Shi, Z. Semantic-CD: Remote Sensing Image Semantic Change Detection towards Open-vocabulary Setting. arXiv 2025, arXiv:2501.06808. [Google Scholar]
- Zhang, Z. Photogrammetric Point Clouds: Quality Assessment, Filtering, and Change Detection. Ph.D. Thesis, Faculty of Geo-Information Science and Earth Observation, University of Twente, Enschede, The Netherlands, 2022. [Google Scholar] [CrossRef]
- Gao, Y.; Yuan, H.; Ku, T.; Veltkamp, R.C.; Zamanakos, G.; Tsochatzidis, L.; Amanatiadis, A.; Pratikakis, I.; Panou, A.; Romanelis, I.; et al. SHREC 2023: Point cloud change detection for city scenes. Comput. Graph. 2023, 115, 35–42. [Google Scholar] [CrossRef]
- Wang, Z.; Zhang, Y.; Luo, L.; Yang, K.; Xie, L. An End-to-End Point-Based Method and a New Dataset for Street-Level Point Cloud Change Detection. IEEE Trans. Geosci. Remote. Sens. 2023, 61, 1–15. [Google Scholar] [CrossRef]
- de Gélis, I.; Lefèvre, S.; Corpetti, T. Siamese KPConv: 3D multiple change detection from raw point clouds using deep learning. ISPRS J. Photogramm. Remote. Sens. 2023, 197, 274–291. [Google Scholar] [CrossRef]
- Zhang, L.; Wang, H.; Liu, C.; Dong, Z.; Yang, B. ME-CPT: Multi-Task Enhanced Cross-Temporal Point Transformer for Urban 3D Change Detection. arXiv 2025, arXiv:2501.14004. [Google Scholar]
- Zhan, W.; Cheng, R.; Chen, J. PGN3DCD: Prior-Knowledge-Guided Network for Urban 3D Point Cloud Change Detection. IEEE Trans. Geosci. Remote. Sens. 2024, 62, 1–15. [Google Scholar] [CrossRef]
- Kharroubi, A.; Poux, F.; Ballouch, Z.; Hajji, R.; Billen, R. Three Dimensional Change Detection Using Point Clouds: A Review. Geomatics 2022, 2, 457–485. [Google Scholar] [CrossRef]
- Kharroubi, A.; Ballouch, Z.; Jeddoub, I.; Hajji, R.; Billen, R. Automated detection and structuration of building and vegetation changes from LiDAR point clouds. ISPRS-Int. Arch. Photogramm. Remote. Sens. Spat. Inf. Sci. 2024, XLVIII-2/W, 227–233. [Google Scholar] [CrossRef]
- Tamort, A.; Kharroubi, A.; Hajji, R.; Billen, R. 3d Change Detection For Semi-Automatic Update Of Buildings In 3d City Models. ISPRS-Int. Arch. Photogramm. Remote. Sens. Spat. Inf. Sci. 2024, XLVIII-4/W, 349–355. [Google Scholar] [CrossRef]
- de Gélis, I.; Corpetti, T.; Lefèvre, S. Change detection needs change information: Improving deep 3D point cloud change detection. IEEE Trans. Geosci. Remote. Sens. 2023, 62, 1–10. [Google Scholar] [CrossRef]
- Landrieuy, L.; Obozinskiz, G. Cut pursuit: Fast algorithms to learn piecewise constant functions on general weighted graphs. SIAM J. Imaging Sci. 2017, 10, 1724–1766. [Google Scholar] [CrossRef]
- Xi, Z.; Hopkinson, C. 3D Graph-Based Individual-Tree Isolation (Treeiso) from Terrestrial Laser Scanning Point Clouds. Remote. Sens. 2022, 14, 6116. [Google Scholar] [CrossRef]
- Weinmann, M.; Jutzi, B.; Mallet, C.; Weinmann, M. Geometric Features And Their Relevance For 3d Point Cloud Classification. ISPRS Ann. Photogramm. Remote. Sens. Spat. Inf. Sci. 2017, IV-1/W1, 157–164. [Google Scholar] [CrossRef]
- de Gélis, I.; Lefèvre, S.; Corpetti, T. DC3DCD: Unsupervised learning for multiclass 3D point cloud change detection. ISPRS J. Photogramm. Remote. Sens. 2023, 206, 168–183. [Google Scholar] [CrossRef]
- Zhang, Z.; Vosselman, G.; Gerke, M.; Persello, C.; Tuia, D.; Yang, M.Y. Detecting building changes between airborne laser scanning and photogrammetric data. Remote. Sens. 2019, 11, 2417. [Google Scholar] [CrossRef]
- Naylor, P.; Di Carlo, D.; Traviglia, A.; Yamada, M.; Fiorucci, M. Implicit neural representation for change detection. In Proceedings of the IEEE/CVF Winter Conference on Applications of Computer Vision, Waikoloa, HI, USA, 3–7 January 2023; Available online: http://arxiv.org/abs/2307.15428 (accessed on 8 January 2025).

Disclaimer/Publisher’s Note: The statements, opinions and data contained in all publications are solely those of the individual author(s) and contributor(s) and not of MDPI and/or the editor(s). MDPI and/or the editor(s) disclaim responsibility for any injury to people or property resulting from any ideas, methods, instructions or products referred to in the content. |
© 2025 by the authors. Licensee MDPI, Basel, Switzerland. This article is an open access article distributed under the terms and conditions of the Creative Commons Attribution (CC BY) license (https://creativecommons.org/licenses/by/4.0/).