Article

Comprehensive Assessment of Nine Fine-Resolution Global Forest Cover Products in the Three-North Shelter Forest Program Region

1
Key Laboratory of Digital Earth Science, Aerospace Information Research Institute, Chinese Academy of Sciences, Beijing 100094, China
2
International Research Center of Big Data for Sustainable Development Goals, Beijing 100094, China
3
University of Chinese Academy of Sciences, Beijing 100049, China
*
Author to whom correspondence should be addressed.
Remote Sens. 2025, 17(7), 1296; https://doi.org/10.3390/rs17071296
Submission received: 21 January 2025 / Revised: 12 March 2025 / Accepted: 2 April 2025 / Published: 5 April 2025
(This article belongs to the Section Forest Remote Sensing)

Abstract

:
Accurate forest cover maps are essential for forest conservation and sustainable development. Numerous global forest cover products have emerged in recent years; however, most tend to neglect sparsely forested arid and semi-arid areas, such as the Three-North Shelter Forest (TNSF) Program Region in China. Despite their sparse distribution, forests in these areas play a vital role in maintaining global ecological balance and biodiversity. Therefore, a comprehensive evaluation of these products is necessary. In this study, the performance of nine global forest cover products was systematically investigated at a 10–30 m resolution (GlobeLand30, GLC_FCS30D, FROM-GLC30, FROM-GLC10, ESA World Cover, ESRI Land Cover, GFC30, GFC 2020, and GFC) in the TNSF region around 2020. Specifically, a novel and comprehensive validation dataset was first generated by integrating all available open-access validation datasets in the TNSF region after visual interpretation. Second, the consistency and accuracy of nine forest cover products were evaluated, and their discrepancies with government statistical data were analyzed. The results indicate that GFC2020 provides the highest overall accuracy (OA) of 90.49%, followed by ESA World Cover, while GlobeLand30 had the lowest accuracy of 84.78%. Meanwhile, compared with statistical data, all nine products underestimated forest areas, especially in these hyper-arid zones (aridity index < 0.03). Notably, 31.04% of the area is identified as forest by only one product, attributable to differences in forest definitions and remote sensing data among the products. Therefore, this study provides a detailed assessment and analysis of nine global forest cover products from multiple perspectives, offering valuable insights for users in selecting appropriate forest cover products and supporting forest management.

1. Introduction

Forests comprise approximately one-third of Earth’s land surface and play a vital role in terrestrial ecosystems [1], including regulating the carbon cycle [2], conserving water, preserving biodiversity, mitigating climate change, and maintaining global ecological balance [3,4]. In recent decades, advancements in remote sensing technology have significantly improved global forest mapping and change monitoring, leading to the release of several global 10–30 m forest cover products [5,6], including GlobeLand30 [7], FROM-GLC30 [8], GLC_FCS30D [9], GFC [10], GFC30 [11], ESA World Cover [12], FROM-GLC10 [13], ESRI World Cover [14], and GFC 2020 [15]. Although these products claim high accuracy in forest mapping (Table 1), their performance metrics are not directly comparable due to the lack of a unified validation framework. Therefore, a comprehensive analysis of the accuracy metrics in these forest products and an understanding of their discrepancies in spatial patterns are critical.
Over the past few years, many previous studies have extensively evaluated the accuracy and consistency of global forest cover products at various scales. For example, Kang et al. [16] conducted a comprehensive evaluation of the performance of GLC_FCS30, GlobeLand30, and FROM-GLC in Indonesia, revealing that the user’s accuracy of forests was lower than the producer’s accuracy. Peng et al. [17] compared and analyzed six forest cover products, finding that mapping accuracy and the spatial consistency of forests were lower in areas with complex terrain and plantations. Gao et al. [18] assessed three global 30 m products in Europe using the LUCAS validation dataset and identified significant confusion between forests and grasslands in transition zones. Tsendbazar et al. [19] confirmed that the forest accuracy of GlobeLand30 was lower in Africa compared to other regions. Chen et al. [20] reported significant differences in global forest area estimates among five forest cover products. It can be found that most studies have concentrated on forest-rich regions and often neglect sparse forested arid and semi-arid zones, which account for approximately 41% of the world’s land surface [21].
Actually, forest mapping in these arid and semi-arid zones is particularly challenging due to limited precipitation and temperature constraints [22,23,24,25]. Currently, many global forest cover products demonstrate limitations in capturing areas with sparse tree canopies [26], leading to issues such as underestimating forest cover [27,28] and confusion in discriminating forest and shrubland [29]. For instance, Bie et al. [30] assessed the precision of three 10 m resolution land cover datasets in the arid zones of Northwest China and found significant discrepancies in the heterogeneous areas, including the interfaces between mixed pixels and the boundaries of small forest patches. Therefore, in the context of an increase in the abundance of global forest products, it is important and necessary to comprehensively analyze the accuracy of these forest products in arid and semi-arid regions.
One of the largest challenges of accuracy analysis in arid and semi-arid regions is the lack of high-quality validation datasets [31]. There are usually two options for collecting high-quality validation points, including field surveys and visual interpretation [32,33,34]. The former strategy can ensure the high-confidence of each validation point at the expense of high-cost and inefficiency, which is not suitable for large-area land cover validation [35]. With the increasing availability of free high-resolution imagery, visual interpretation has gained more attention [36]. However, it also faces significant difficulties in these arid and semi-arid regions because sparse forests usually exhibit similar characteristics to shrubs and grasslands in their coexisting areas [26,29,37]. Namely, it is difficult for us to ensure the high quality of the validation points through visual interpretation. Fortunately, over the past few years, some regional validation datasets [38,39,40] from field surveys have been shared free of charge, offering the possibility of conducting an accuracy assessment for our study of arid and semi-arid regions. Therefore, knowledge of how to make full use of these free-access datasets to build a reliable validation dataset is crucial, especially in arid and semi-arid regions.
The Three-North Shelter Forest (TNSF) Program, the world’s largest afforestation initiative [41], provides a unique opportunity to address these challenges. The TNSF region encompasses vast deserts and the Gobi desert, spanning 1.49 × 10⁶ km2, which comprises approximately 85% of China’s desertified land. Over the past four decades, afforestation efforts have increased the region’s forest cover from 5.05% to 13.57% [42], significantly improving ecological conditions [43], controlling soil erosion and desertification [44], and mitigating sandstorms. Despite its ecological importance, a comprehensive evaluation of global forest cover products in the TNSF region has yet to be conducted. Whether current fine-resolution forest cover products sufficiently meet the research needs of this region remains an urgent question.
To address this gap, this study conducts a comprehensive analysis of nine global 10–30 m forest cover products in the TNSF region. The research objectives are threefold: (1) to compile all available forest-related validation datasets and generate a robust forest validation sample set; (2) to quantify the performance of nine global forest products using the validation dataset and official statistical data, while analyzing their spatial consistency and discrepancies; (3) to explore the underlying causes of discrepancies among the products.

2. Study Area and Datasets

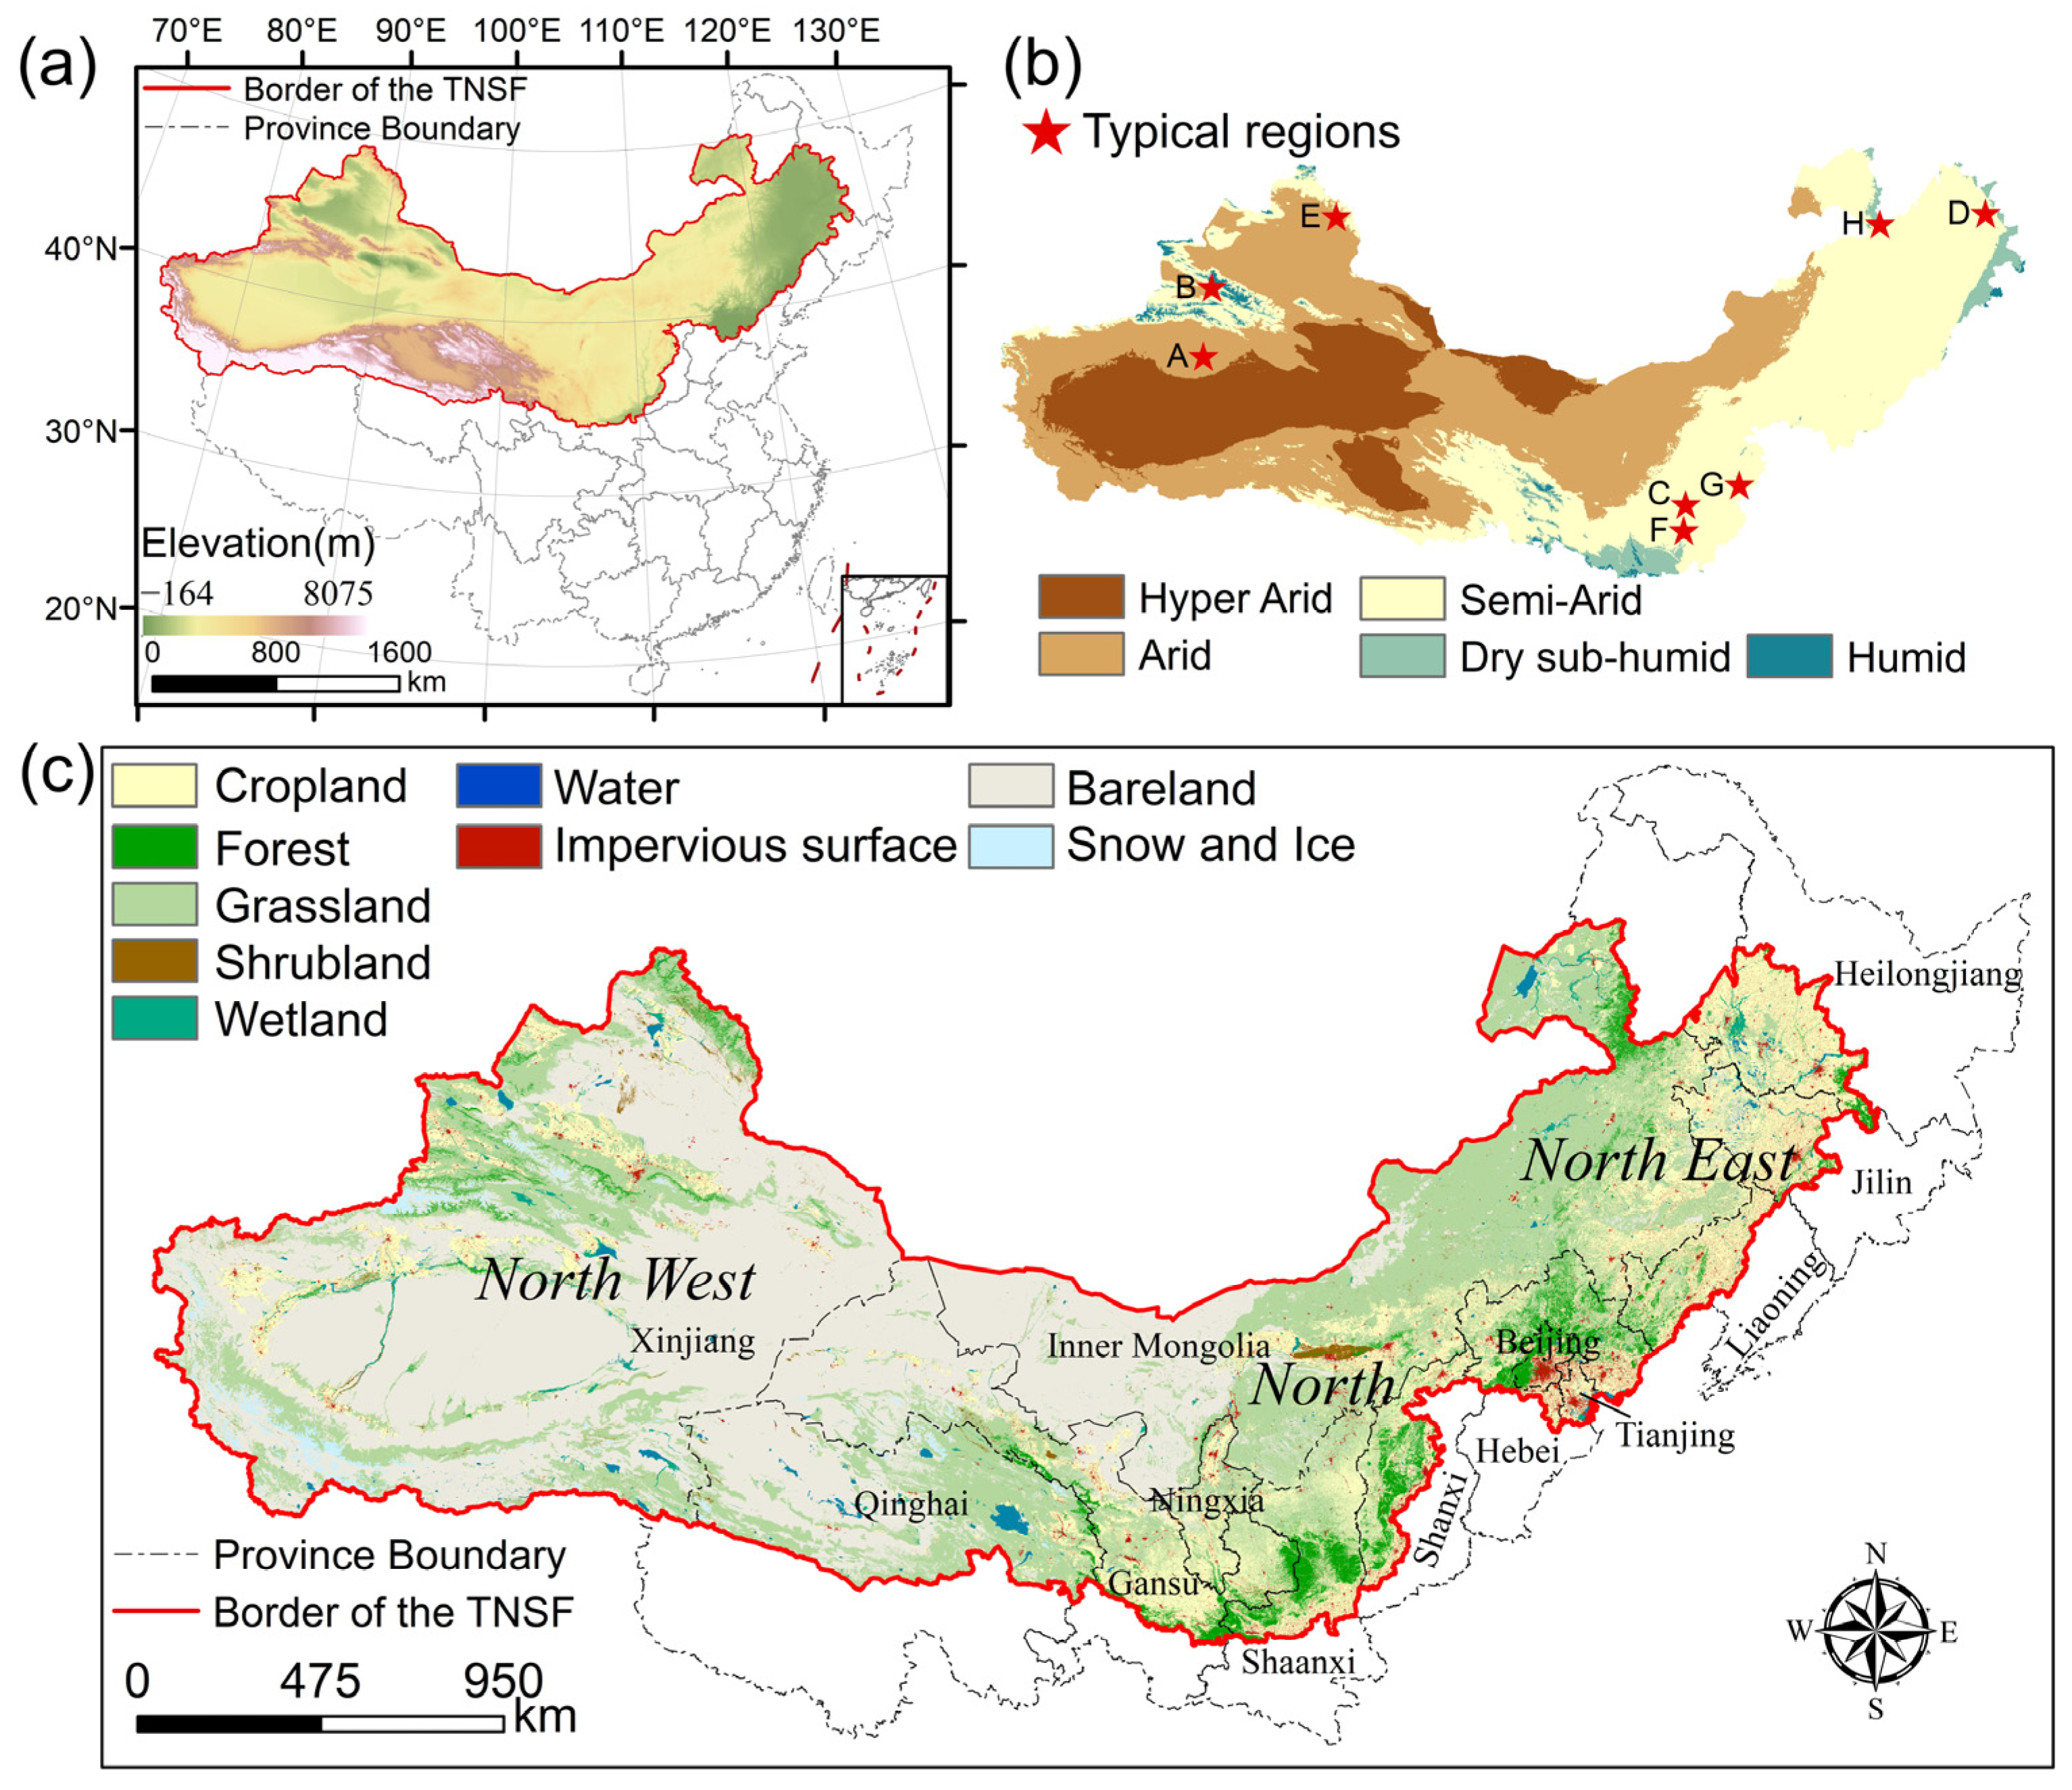
2.1. Three-North Shelter Forest Region

The TNSF Project is a large-scale forest ecological project located in the Three-North regions of China (Figure 1a). This area covers approximately 4.069 × 10⁶ km2, comprising 42% of China’s total land area, and relates to 13 provinces and autonomous regions. Launched by the Chinese government in 1979, the project aims to improve ecological conditions in the Three-North regions. Over the past decades, it has achieved significant progress, with a cumulative afforestation area of 30.14 × 10⁴ km2 [42]. As shown in Figure 1b, nearly 96.15% of this study area falls within hyper-arid, arid, and semi-arid climate zones. Figure 1c further illustrates the spatial distribution of land cover in the TNSF. This area is dominated by barren land and grassland, with some cropland and forest located in the eastern portion.

2.2. Nine Global 10–30 m Forest Products

This study incorporates nine global forest products with 10–30 m spatial resolutions, as detailed in Table 1. These include six global land cover products, where forest constitutes one type of land cover, alongside three forest-thematic products. Overall, all products achieved the fulfillment of user accuracy (UA) for forest exceeding 80%, and the GFC2020 product attained the highest UA at 95.20%. It is noteworthy that the FROM-GLC30 and FROM-GLC10 datasets only provide a single-phase land cover map in 2017. Since some previous studies have demonstrated that forest changes at the 3-year temporal interval can be negligible compared with forest classification errors [16,31,45], the temporal interval in FROM-GLC30 and FROM-GLC10 was ignored in this study. In addition, the GFC dataset comprises three components: the tree canopy cover in 2000, forest gain data from 2000 to 2012, and forest loss data from 2000 to 2023. To obtain the forest cover in 2020, the approach used by Peng et al. [17] was followed by updating the 2000 forest cover data by overlaying forest gain and loss data. Specifically, this involved applying forest gain and loss layers to 2000 tree cover data, resulting in an updated 2020 forest cover map.

2.3. Forest Inventory Statistical Data

To optimally analyze the comprehensive performance of nine forest cover products in this study area, official forest statistical data were collected from China’s National Forest Inventory (CNFI) and statistical yearbooks. CNFI data, published by the National Forestry and Grassland Administration of China (https://www.forestry.gov.cn/, accessed on 20 January 2025), are updated every five years. These data serve as the official source for national forest cover percentages, both for domestic reporting and for submission to the Food and Agriculture Organization for global assessments [46]. In this study, forest area data from the ninth CNFI (2014–2018) were accessed via the China Forestry and Grassland Statistics Yearbook 2020. Second, as CNFI statistical data cannot provide explicit spatial information, the collection of forest coverage data from each city from the 2020 governmental statistical yearbooks was attempted to reveal the spatial patterns in forest cover at the prefecture-level city scale. Notably, for some prefecture-level cities with missing statistical data, statistical data were substituted with the nearest year.

2.4. Climate Zone Data

Climate data for this study are sourced from Global-AI_v3 [47]. According to the aridity index, the TNSF region is divided into five types of climate zones: hyper-arid, arid, semi-arid, dry sub-humid, and humid, as shown in Figure 1b. More details are provided in Table S2.

3. Materials and Methods

3.1. Generating Validation Dataset from the Multi-Sourced Products

The quality and quantity of validation points are crucial for evaluating forest cover products [48]. Although several studies have released land cover validation datasets at global or regional scales [19,31,34,49], the available validation points in this study area are generally sparse. This limits the use of existing validation datasets for accurate assessments in the TNSF. In this study, to ensure the objective and quality of validation points, full use of those third-party validation datasets sourced from the literature was made, and then a high-quality validation dataset for this study area was generated.
Specifically, we conducted a comprehensive search for literature and datasets on platforms such as Google Scholar, China National Knowledge Infrastructure (https://www.cnki.net/, accessed on 20 January 2025), Web of Science, Science Data Bank (https://www.scidb.cn/en, accessed on 20 January 2025), and Zenodo (https://zenodo.org/, accessed on 20 January 2025). Keywords used included “forest cover validation”, “China forest”, “land cover validation”, “arid forest”, and “Three-North Shelter Forest Program”. From this search, ten national and global forest-related validation datasets were collected, as summarized in Table 2. Most validation datasets are collected from field surveys that can guarantee the quality of each validation point.
In addition to forest validation points, non-forest validation points play a crucial role in accuracy assessments. Similar to the collection of forest validation points, the non-forest points are generated from two third-party datasets: the SRS_Val dataset [48] and the Global LULC dataset [57]. Specifically, the SRS_Val dataset, developed through stratified equal-area random sampling and visual interpretation methods, contains 79,112 globally distributed validation samples, and 4772 points were found to belong to the non-forest cover type in this study area. Then, the Global LULC dataset was the first globally crowdsourced land cover reference dataset and was collected from the Geo-Wiki platform (http://geo-wiki.org/, accessed on 20 January 2025). A total of 1898 non-forest data points were retained for this study area.
Then, as the work of Olofsson et al. [35] indicated, the validation sample size is important in accuracy assessments. Therefore, ensuring the reasonableness and balance of the validation sample is a key focus of this study. Based on the suggestion of Olofsson et al. [35], the sample size was determined using Equations (1) and (2) as follows:
n = W i p i 1 p i d z 2 + W i p i 1 p i N
n i = n W i
where n is the required total sample size, W i is the proportion of the area of type i ( W f o r e s t = 0.14 , W n o n f o r e s t = 0.86 ) , and p i is the estimated error accuracy of the type i . Considering that applying global products in specific regions often presents challenges [58], the lowest overall accuracy (OA) from the six land cover products (FROM-GLC10: 72.80%) was selected as p n o n f o r e s t , and the lowest OA from the three forest-thematic cover products (GFC2020: 76.60%) was selected as p f o r e s t ; z is the critical value corresponding to the confidence interval, which is 1.96 when the confidence interval is 95%; d is the margin error set to 0.01; N is the total pixel number; n i is the sample size of type i . Last, the required sample sizes were determined to be 1051 for forest and 6455 for non-forest.
To address the temporal inconsistency of the validation datasets and ensure their reliability, we conducted a visual interpretation of the sample points based on high-resolution 2020 Google Earth imagery and auxiliary information provided by the Google Earth Engine (GEE) interpretation platform to verify the correctness of the original labels. Google Earth offers high-resolution imagery, both in real time and from historical archives, making it an excellent resource for distinguishing between different land cover types. It has been extensively utilized as a supplementary data source for gathering training and validation samples in forest cover classification [31,46]. Additionally, the GEE interpretation platform developed by Zhao et al. [48] offers time-series vegetation index data for the pixels where sample points are located, further aiding the interpretation process. To minimize uncertainties, the sample point selection process adhered to the following criteria: (1) if a sample point was located within a typical forest (e.g., within a homogeneous forest area, not at the edge, and not a single tree), the point was retained; (2) if the land cover type at a sample point was non-forest, such as cropland, water bodies, or impervious surfaces, the point was discarded. These steps ensured the accuracy of the forest sample points in 2020 and solved the problem of temporal inconsistency. Ultimately, 2324 forest samples and 6670 non-forest samples were obtained (Figure 2).

3.2. The Harmonization of Multi-Sourced Global Forest Products

As mentioned in Section 2.2, six of the nine global forest products are global land cover products. Since this study focuses specifically on forest cover, the classification system of these six land cover products was harmonized into forest and non-forest types. To achieve this, mutual attribution methods were applied, i.e., if the land cover category belongs to the forest category in terms of its attributes, then it is attributed to forests; otherwise, it was merged with the non-forest category (Table 3). Taking the GLC_FCS30D as an example, the 10 forest subcategories were merged into the forest category, while the remaining 23 subcategories were grouped into the non-forest category.

3.3. Consistency Analysis and Accuracy Assessment

To comprehensively investigate the performance of the nine global forest products in this study area, “quantitative metrics” and “qualitative metrics” were adopted. Specifically, the “quantitative metrics” used the generated validation dataset and the forest statistical data to quantify the accuracy metrics and consistency metrics, while “qualitative metrics” focused on visual comparisons among the nine forest products. First, in terms of how to use the validation points to quantify the absolute accuracy of nine forest products, confusion matrices have been widely emphasized in numerous past accuracy assessment studies [59]. It serves a dual purpose: capturing the misclassification among different land cover categories and offering quantitative metrics such as UA, which reflects commission errors; producer’s accuracy (PA), which indicates omission errors; OA; the kappa coefficient. In addition to the overall assessment, to further explore the spatial variations in the performance across the nine products, the entire study area was divided into 2° × 2° grids for localized accuracy assessments. The accuracy metrics were determined using Equations (3)–(6) as follows:
P A = x i i x + i × 100 %
U A = x i i x i + × 100 %
O A = i = 1 n x i i N × 100 %
K a p p a = N · i = 1 n x i i i = 1 n x i + · x + i N 2 i = 1 n x i + · x + i
where x i i represents the number of correctly classified samples for type i ; x + i is the total number of samples in the reference data for type i ; x i + is the total number of samples for type i in the assessed forest cover product; n refers to the number of all forest cover types; N stands for the total number of samples in the confusion matrix.
The forest cover percentage for each prefecture-level city was calculated and compared with the statistical data using linear regression analysis. The correlation coefficient r is calculated as in Equation (7); a higher correlation coefficient signifies better alignment with the statistical data and reduced deviation.
r = i = 1 n x i x ¯ y i y ¯ i = 1 n x i x ¯ 2 · i = 1 n y i y ¯ 2
where x i and y i are the forest cover percentages of prefecture-level city i derived from the products and statistical data; x ¯ and y ¯ are the average forest cover percentages of all prefecture-level cities across the TNSF derived from the products and statistical data; n is the total number of prefecture-level cities for which statistical data are available.
In this study, area-based consistency refers to the extent to which the boundaries of two forest products match and coincide [60]. To assess area-based consistency, the forest pixels from each product were overlaid, and the overlap proportion was calculated relative to the total forest area in the products being compared (Equation (8)).
P r o p A r e a = A i A j × 100 %
where A i denotes the area of overlapping regions among two paired forest products; A i represents the assessed area for the forest product being compared; P r o p A r e a is the area-based consistency between the two products.
Last, spatial consistency can visually express the spatial pattern and similarity of different forest cover products [18,61]. Consistency was assessed at the pixel level using the spatial superposition method and defined by the number of forest cover products that classify a given pixel as forest. For example, a consistency value of five indicates that five forest cover products classify the pixel as the same forest type. Thus, the higher the consistency among these products, the more likely it is that the investigated pixel accurately represents a forest [62]. Considering the varying spatial resolutions, all 10 m spatial resolution products were resampled to 30 m using a majority sampling method. To better understand the spatial consistency and performance of nine products across different environments, we selected eight typical regions for comparison using high-resolution imagery and the products. The selection criteria for these regions were as follows: (1) regions located in different climatic zones, (2) regions with varying levels of topographic complexity and landscape heterogeneity, and (3) regions exhibiting either high or low spatial consistency. Their locations are shown in Figure 1b.

4. Results

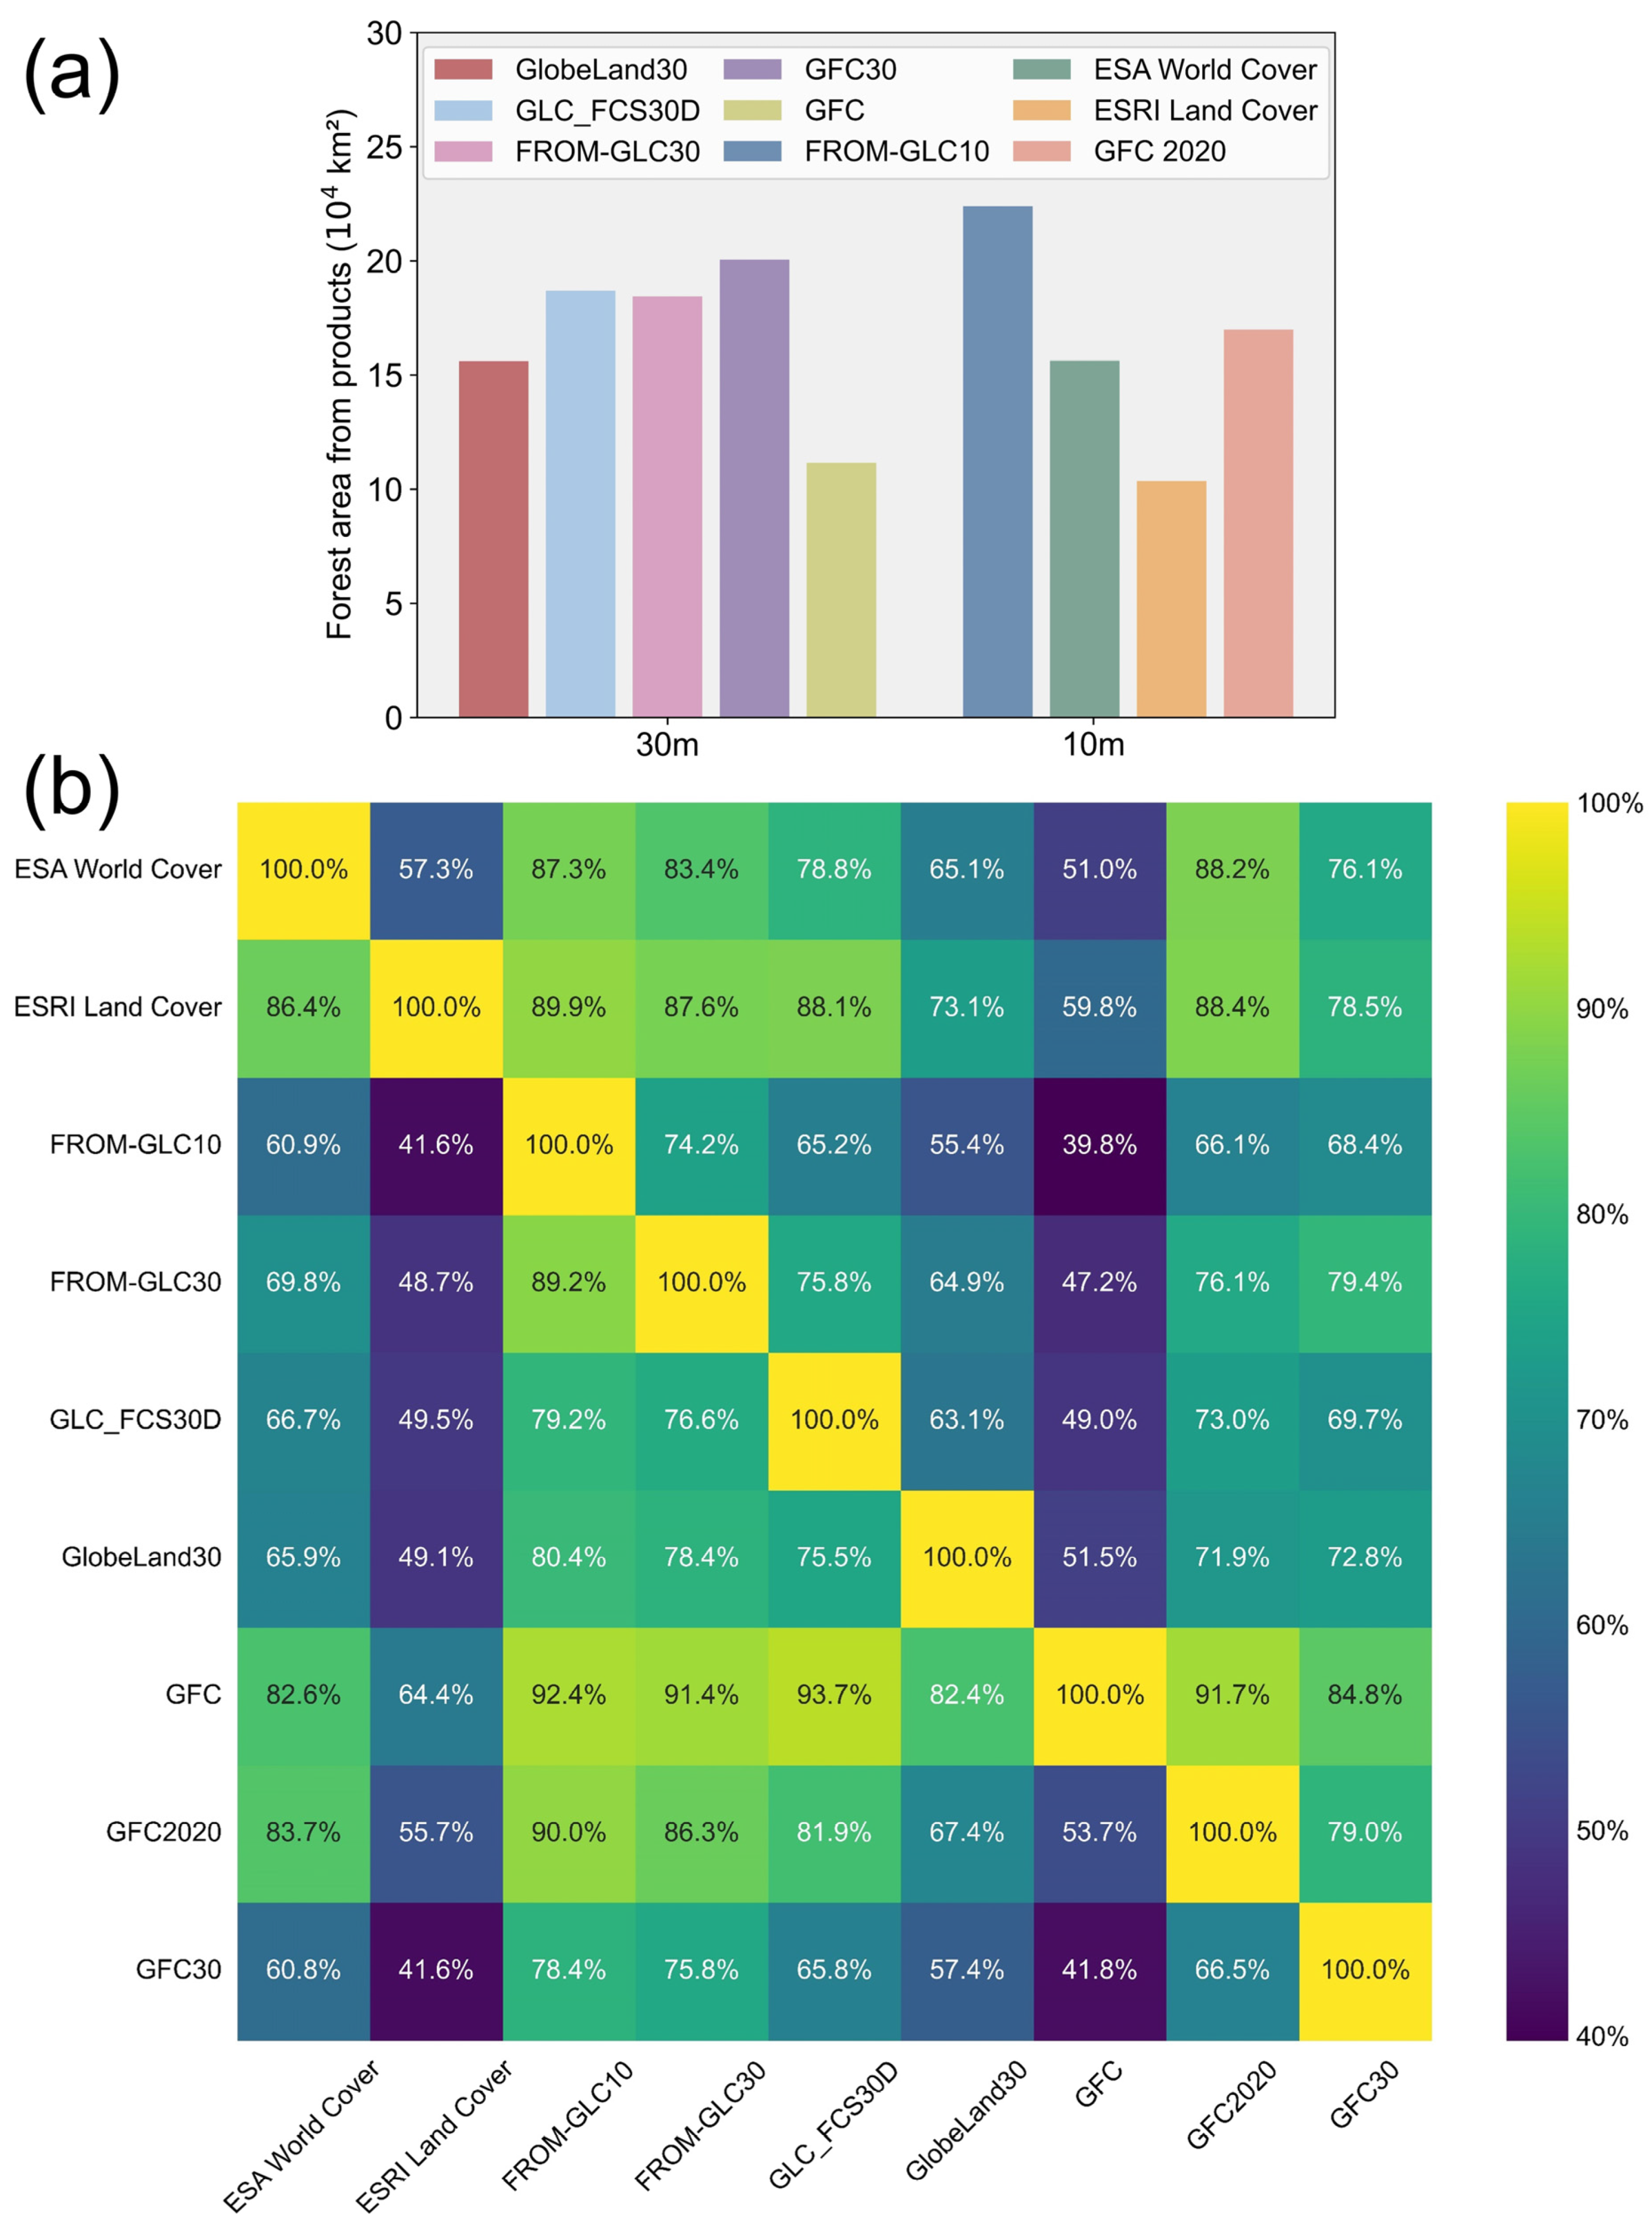
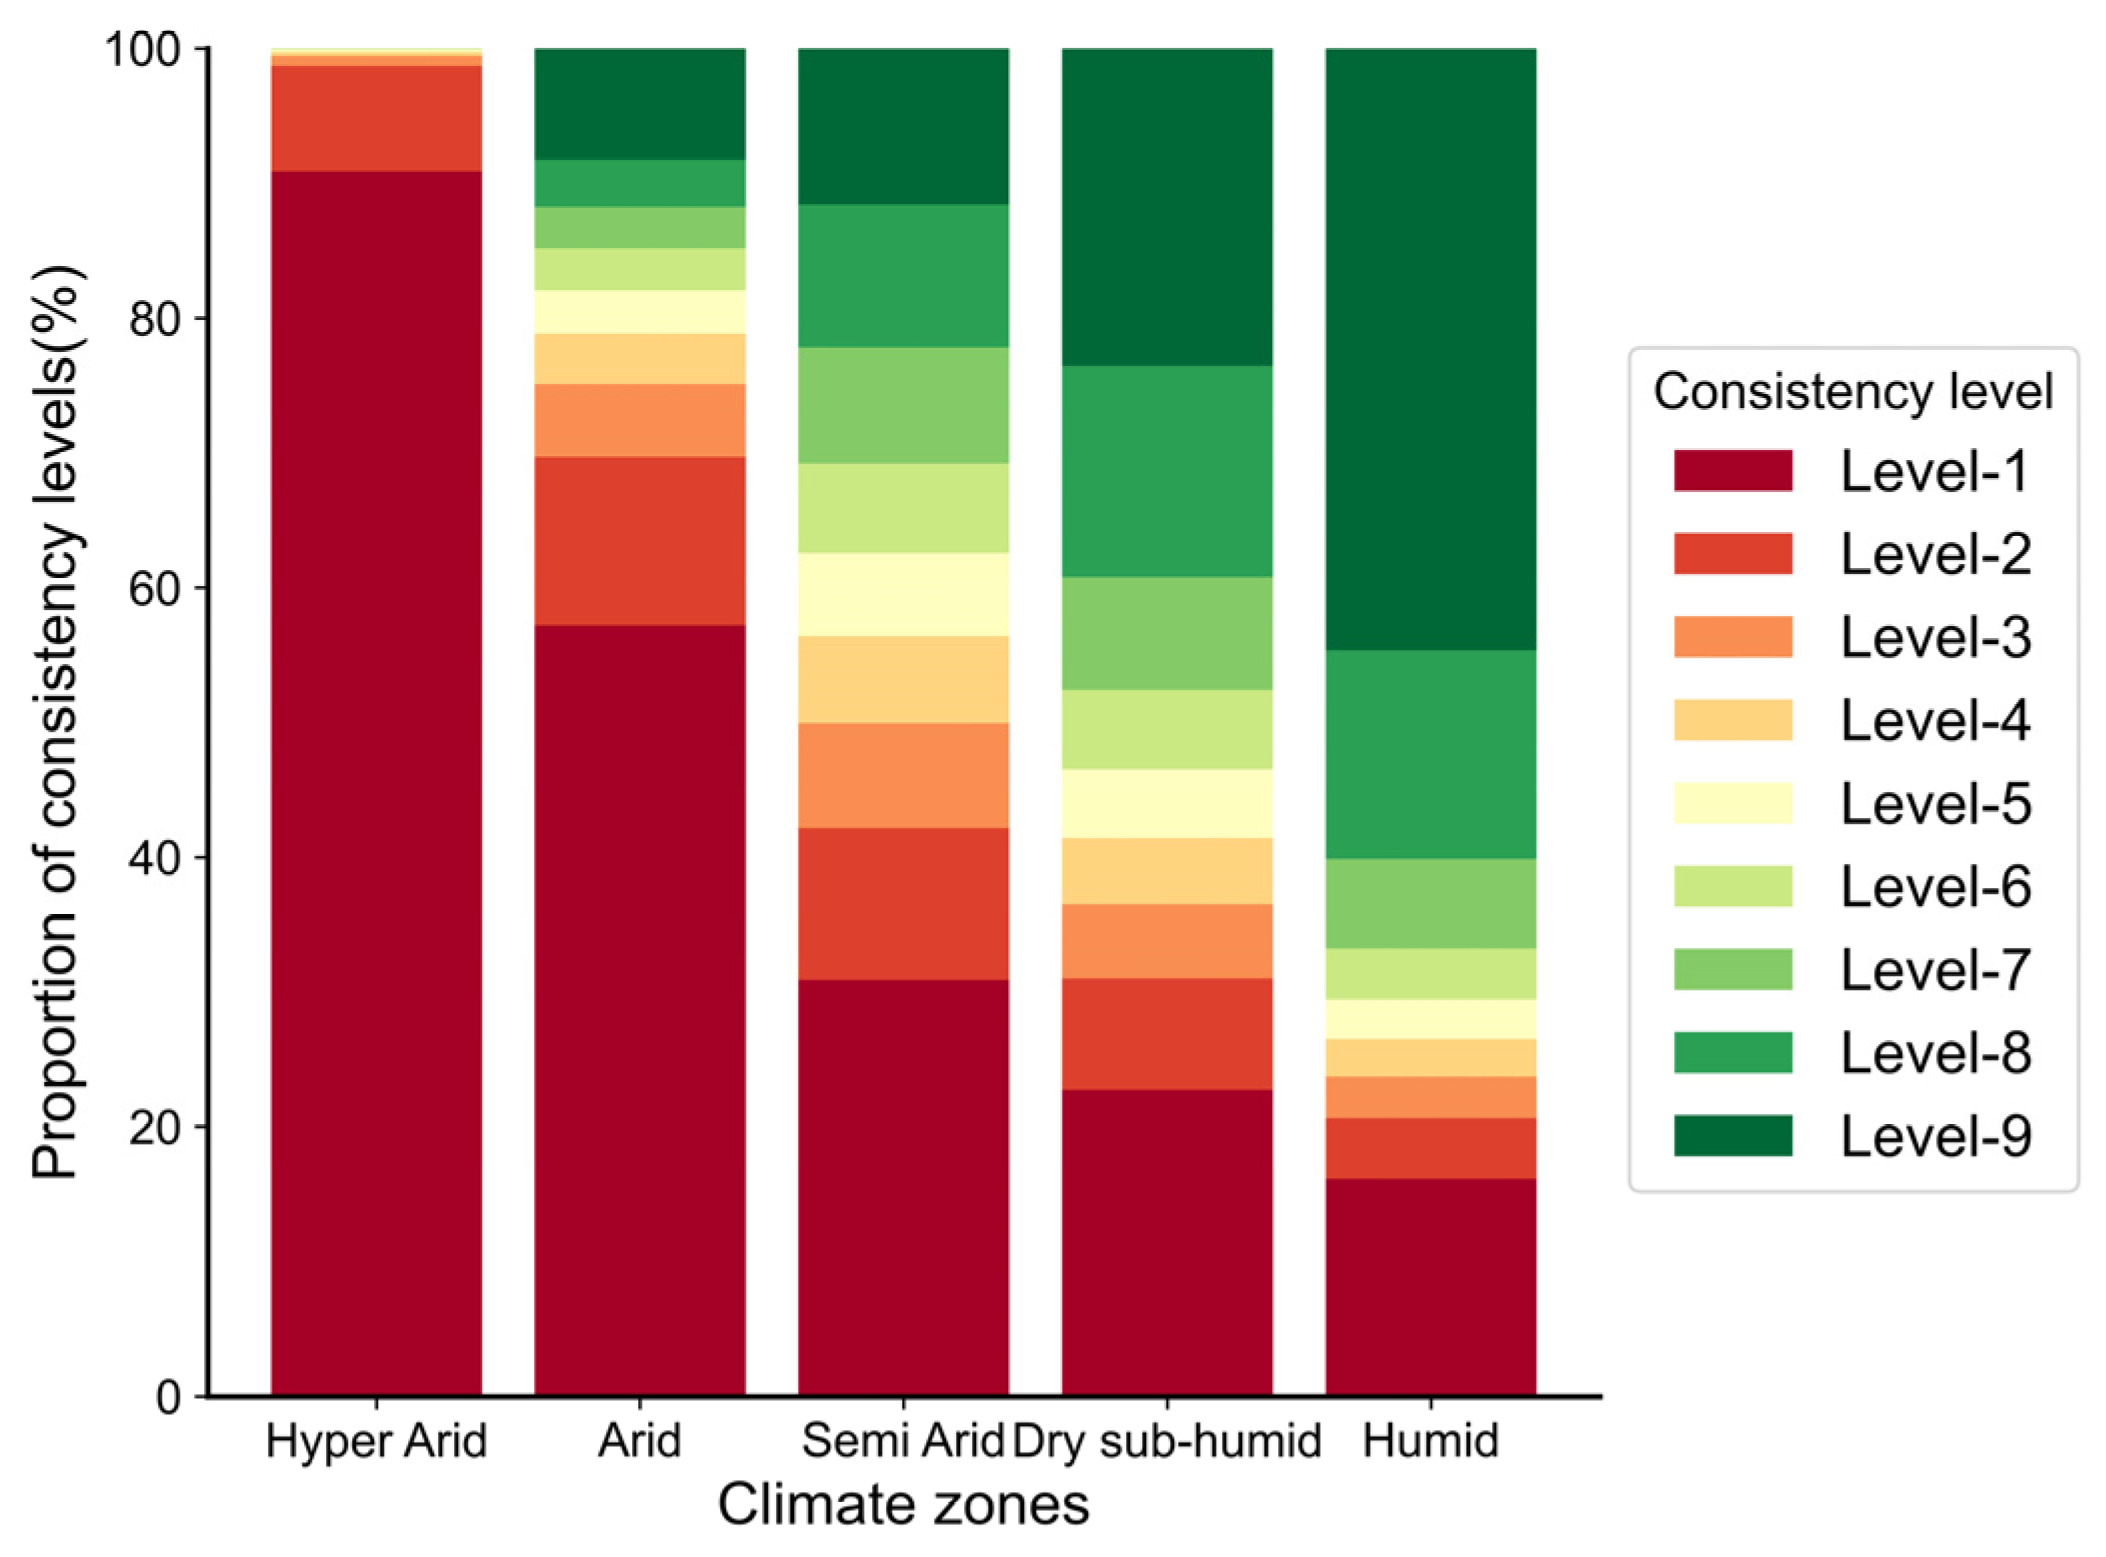
4.1. Area-Based Consistency Analysis of Multiple Products

Figure 3a presents the forest areas of the nine products in the TNSF region. The average forest area for the five 30 m resolution products is 16.79 × 10⁴ km2. Among these, GFC30 reports the largest forest area of 20.05 × 10⁴ km2, followed by FROM-GLC30 (18.44 × 10⁴ km2) and GLC_FCS30D (18.69 × 10⁴ km2). GlobeLand30 indicates a forest area of 15.61 × 10⁴ km2, while GFC reports the smallest area of 11.16 × 10⁴ km2. For the four 10 m resolution products, the average forest area is 16.34 × 10⁴ km2. FROM-GLC10 records the largest forest area at 22.39 × 10⁴ km2, while ESA World Cover and GFC2020 report forest areas of 15.62 × 10⁴ km2 and 16.99 × 10⁴ km2, respectively. ESRI Land Cover reports the smallest area at 10.36 × 10⁴ km2, which is less than half of the FROM-GLC10 estimate. Across the six land cover products, the average forest area (16.85 × 10⁴ km2) is higher than that derived from the three forest-thematic products (16.07 × 10⁴ km2). Figure 3b further quantifies the area-based consistency among the nine global products. For the five 30 m products, the average area-based consistency with other products ranks from highest to lowest as follows: FROM-GLC30 (81.72%), GLC_FCS30D (78.10%), GFC30 (76.08%), GlobeLand30 (66.13%), and GFC (49.22%). For the four 10 m products, the ranking is FROM-GLC10 (85.85%), GFC2020 (77.75%), ESA World Cover (72.11%), and ESRI Land Cover (50.99%). The average area-based consistency of the 10 m products (71.68%) is higher than that of the 30 m products (70.25%), indicating that the 10 m products exhibit better boundary alignment with other products, likely due to their finer spatial granularity.

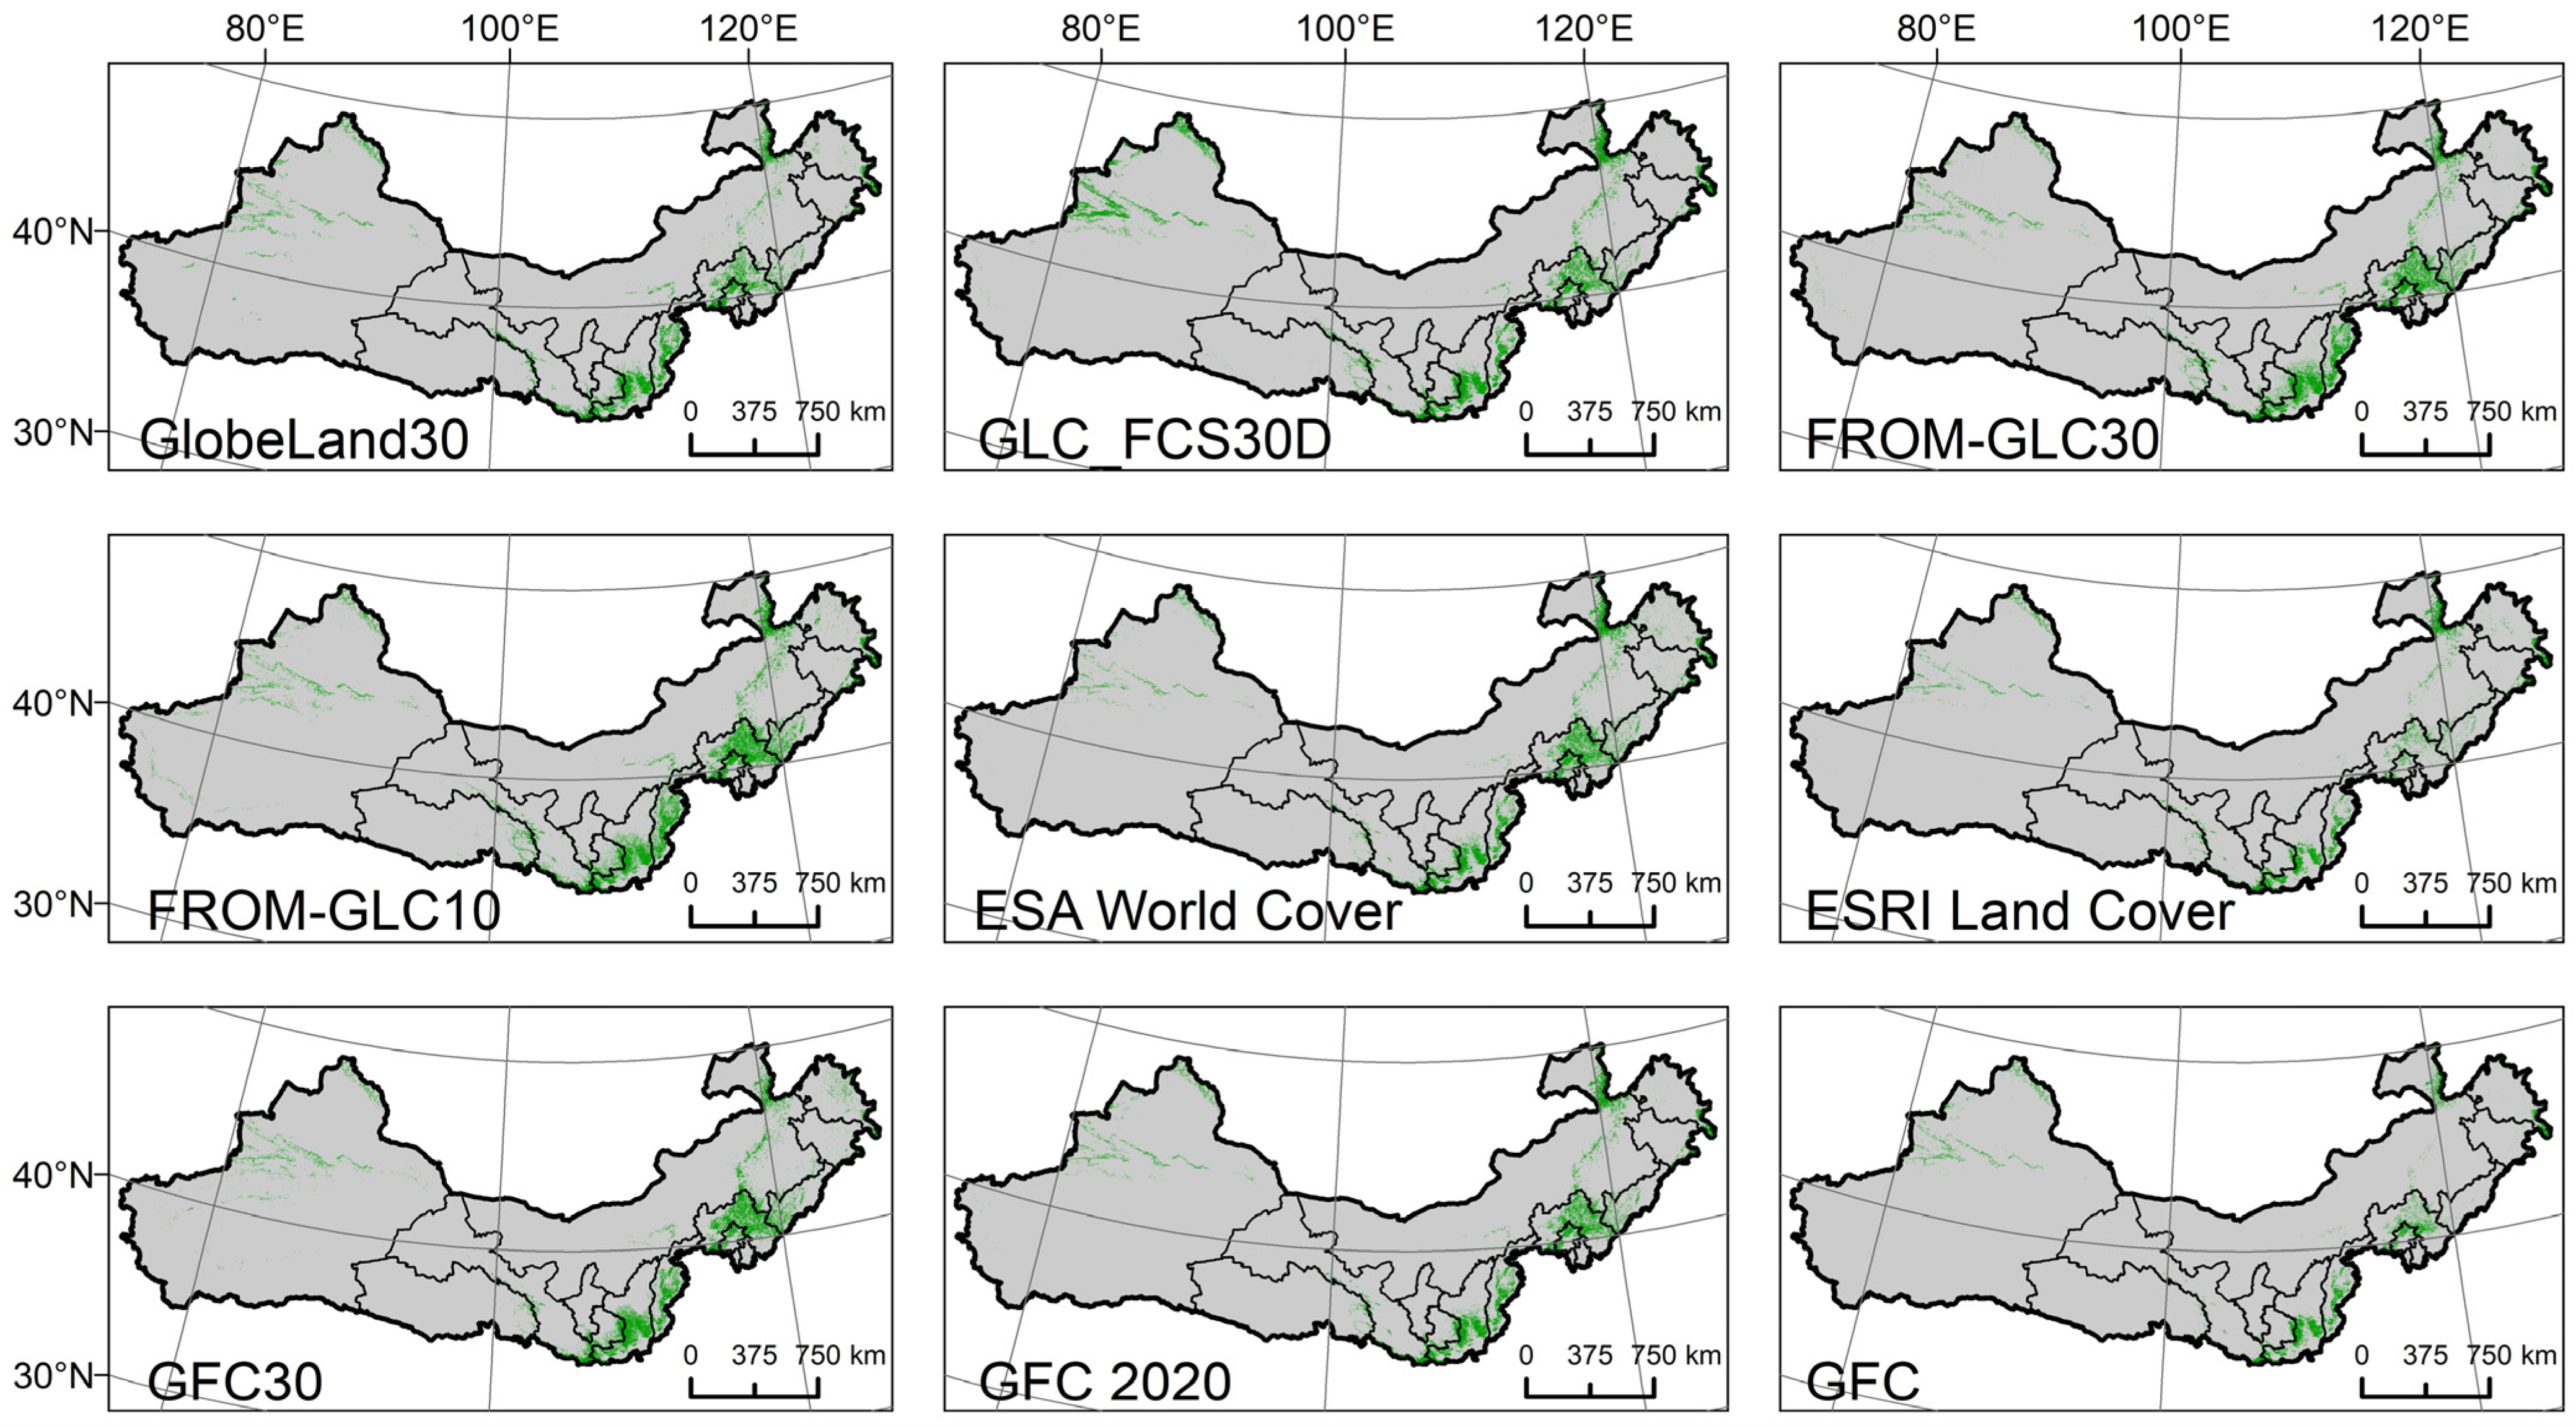
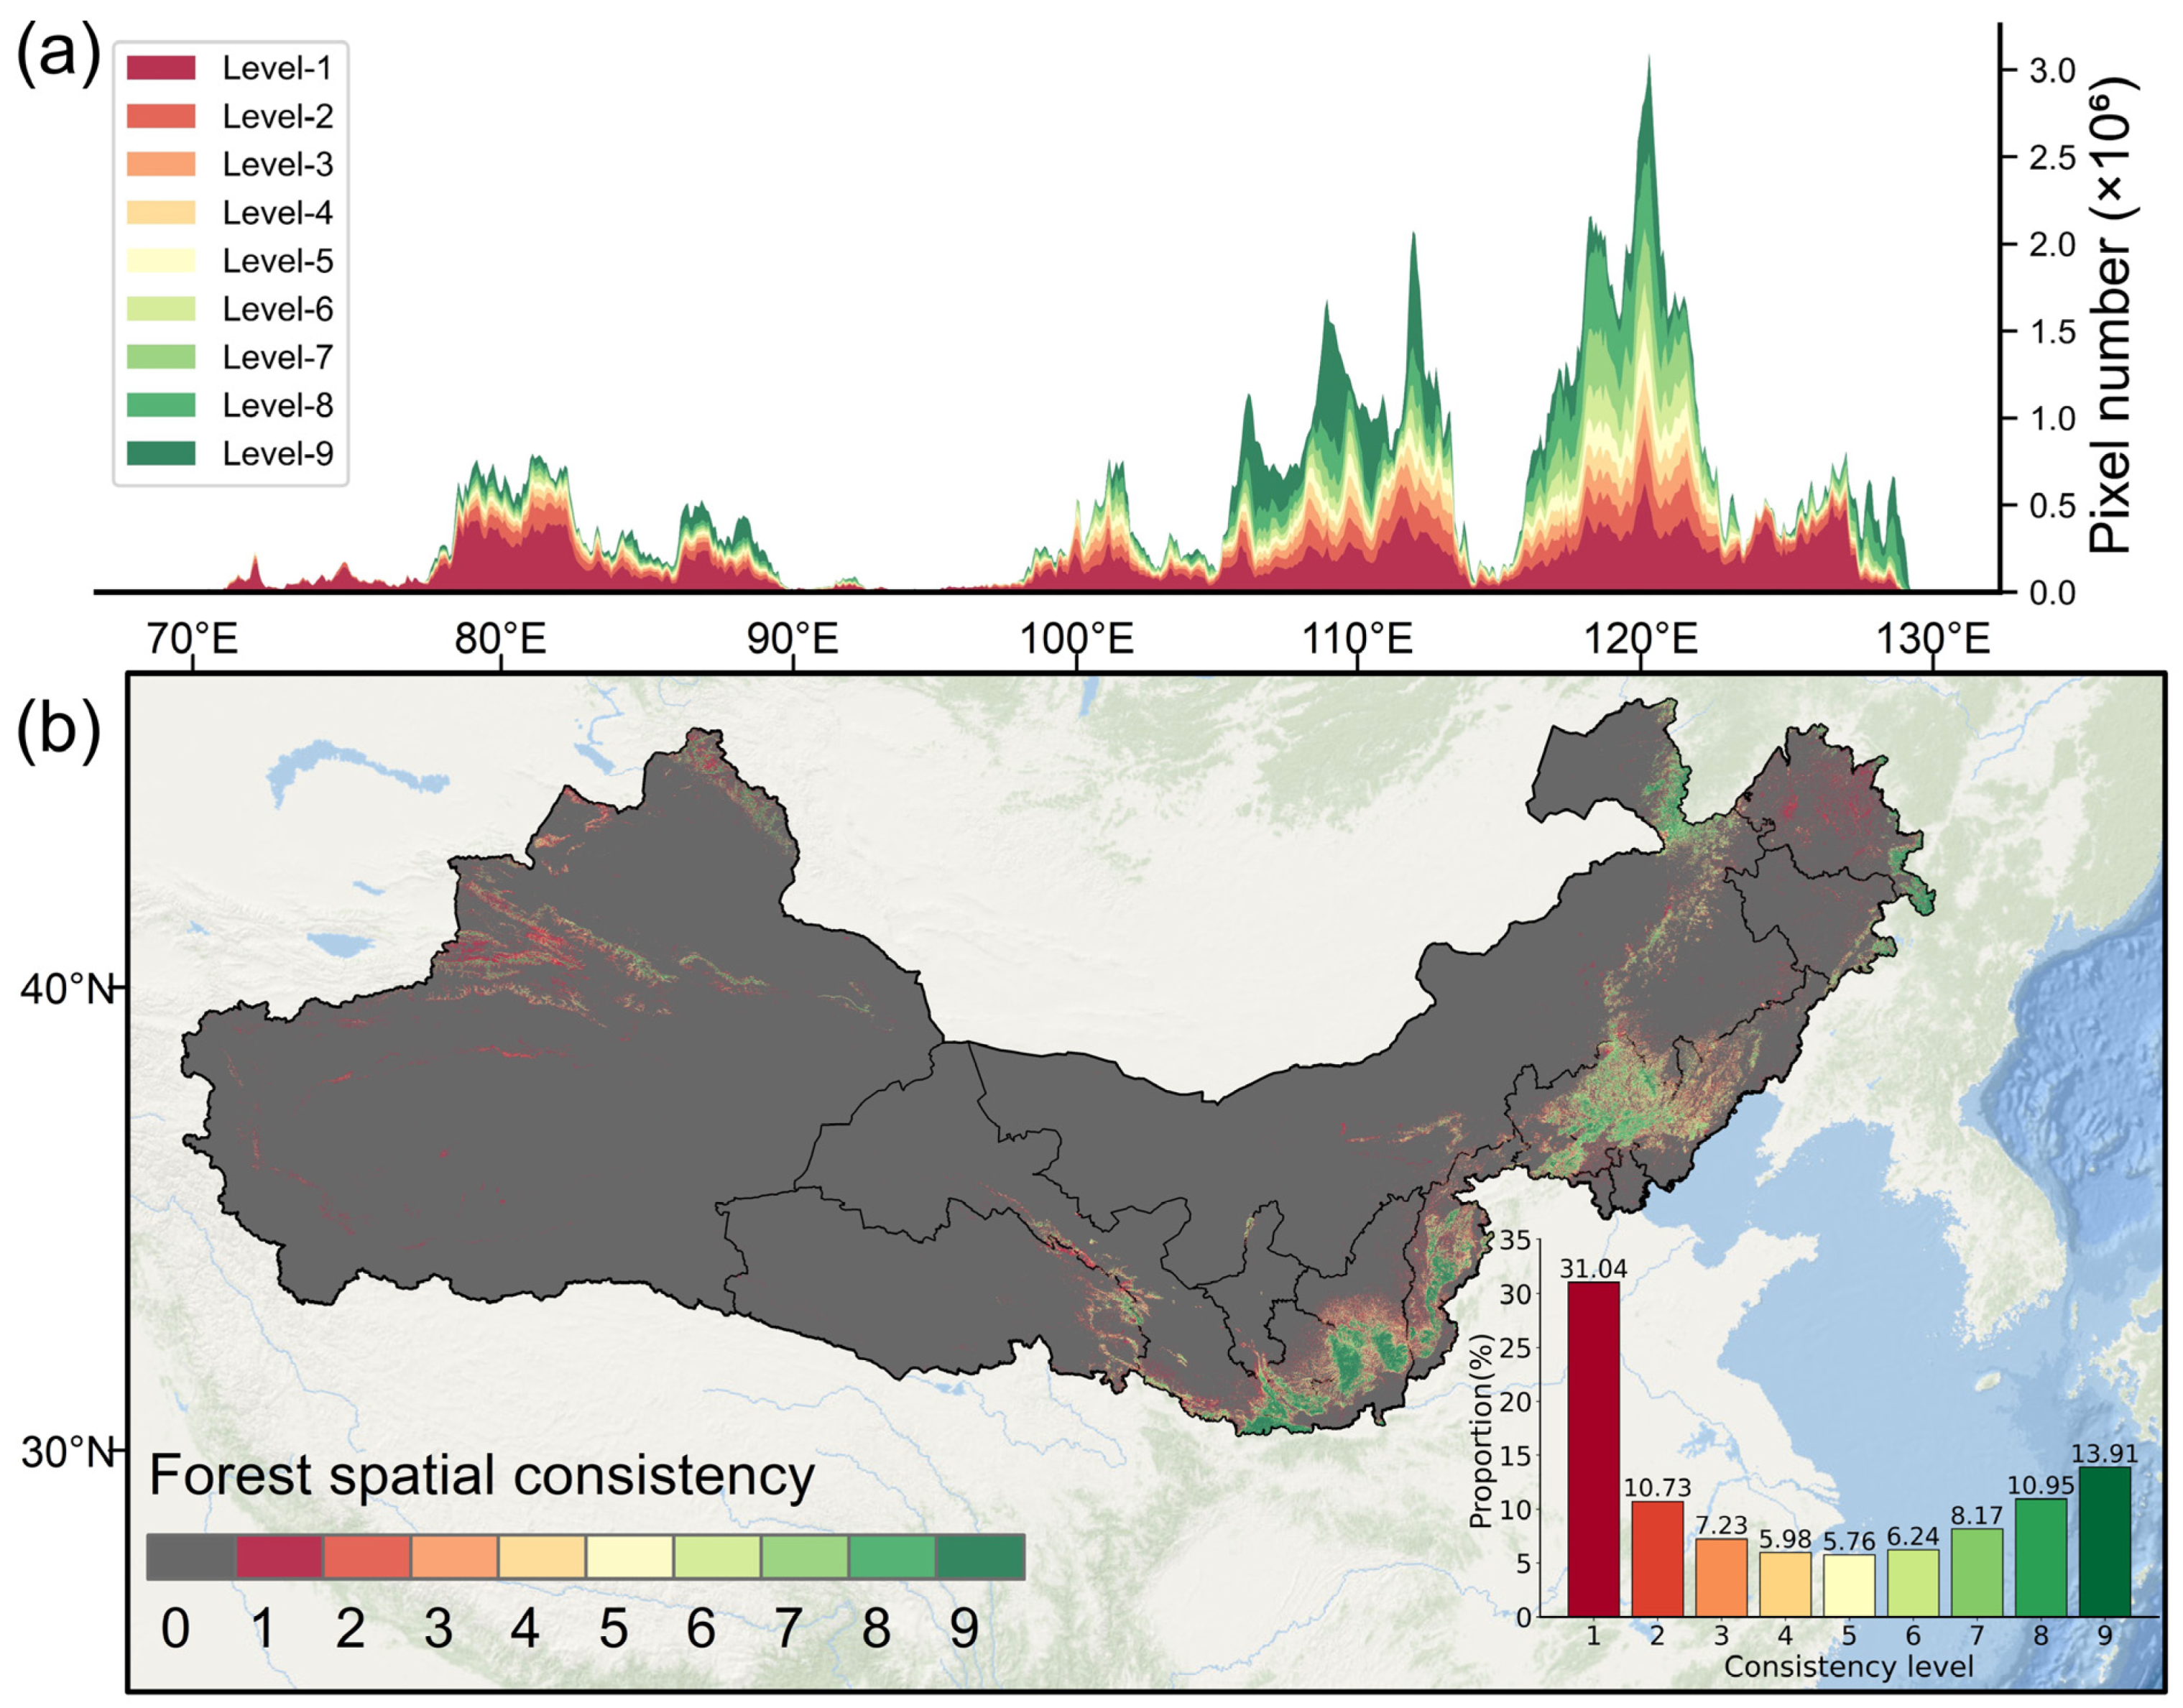
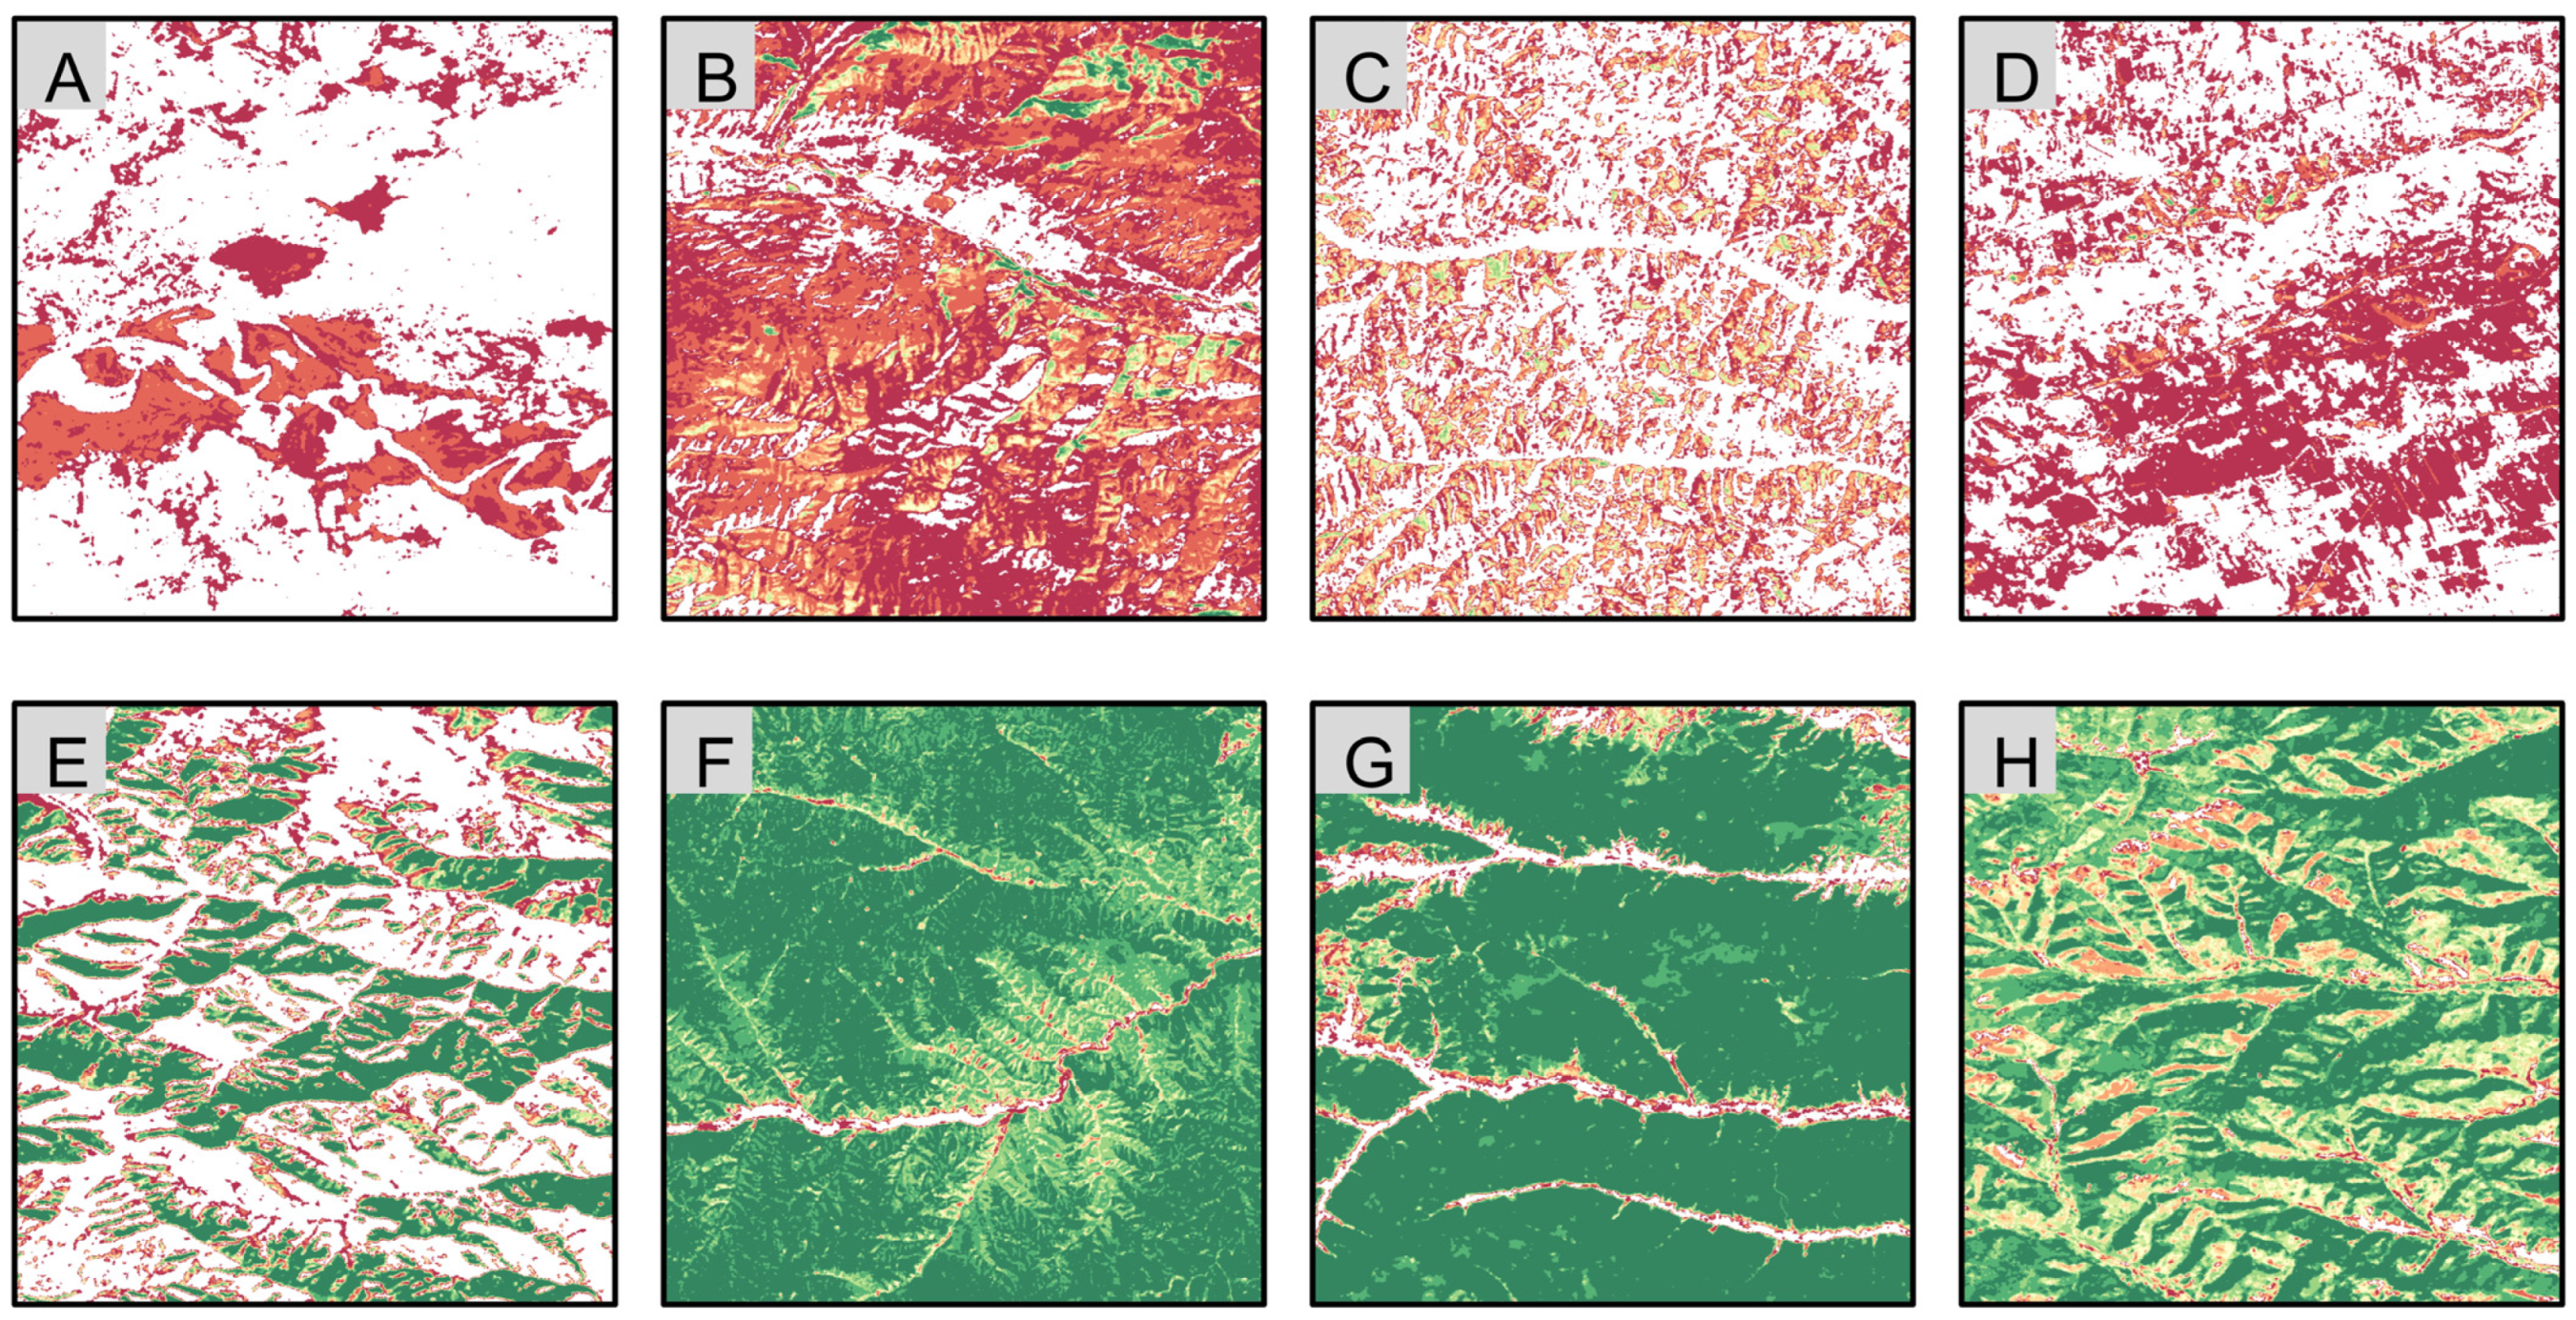
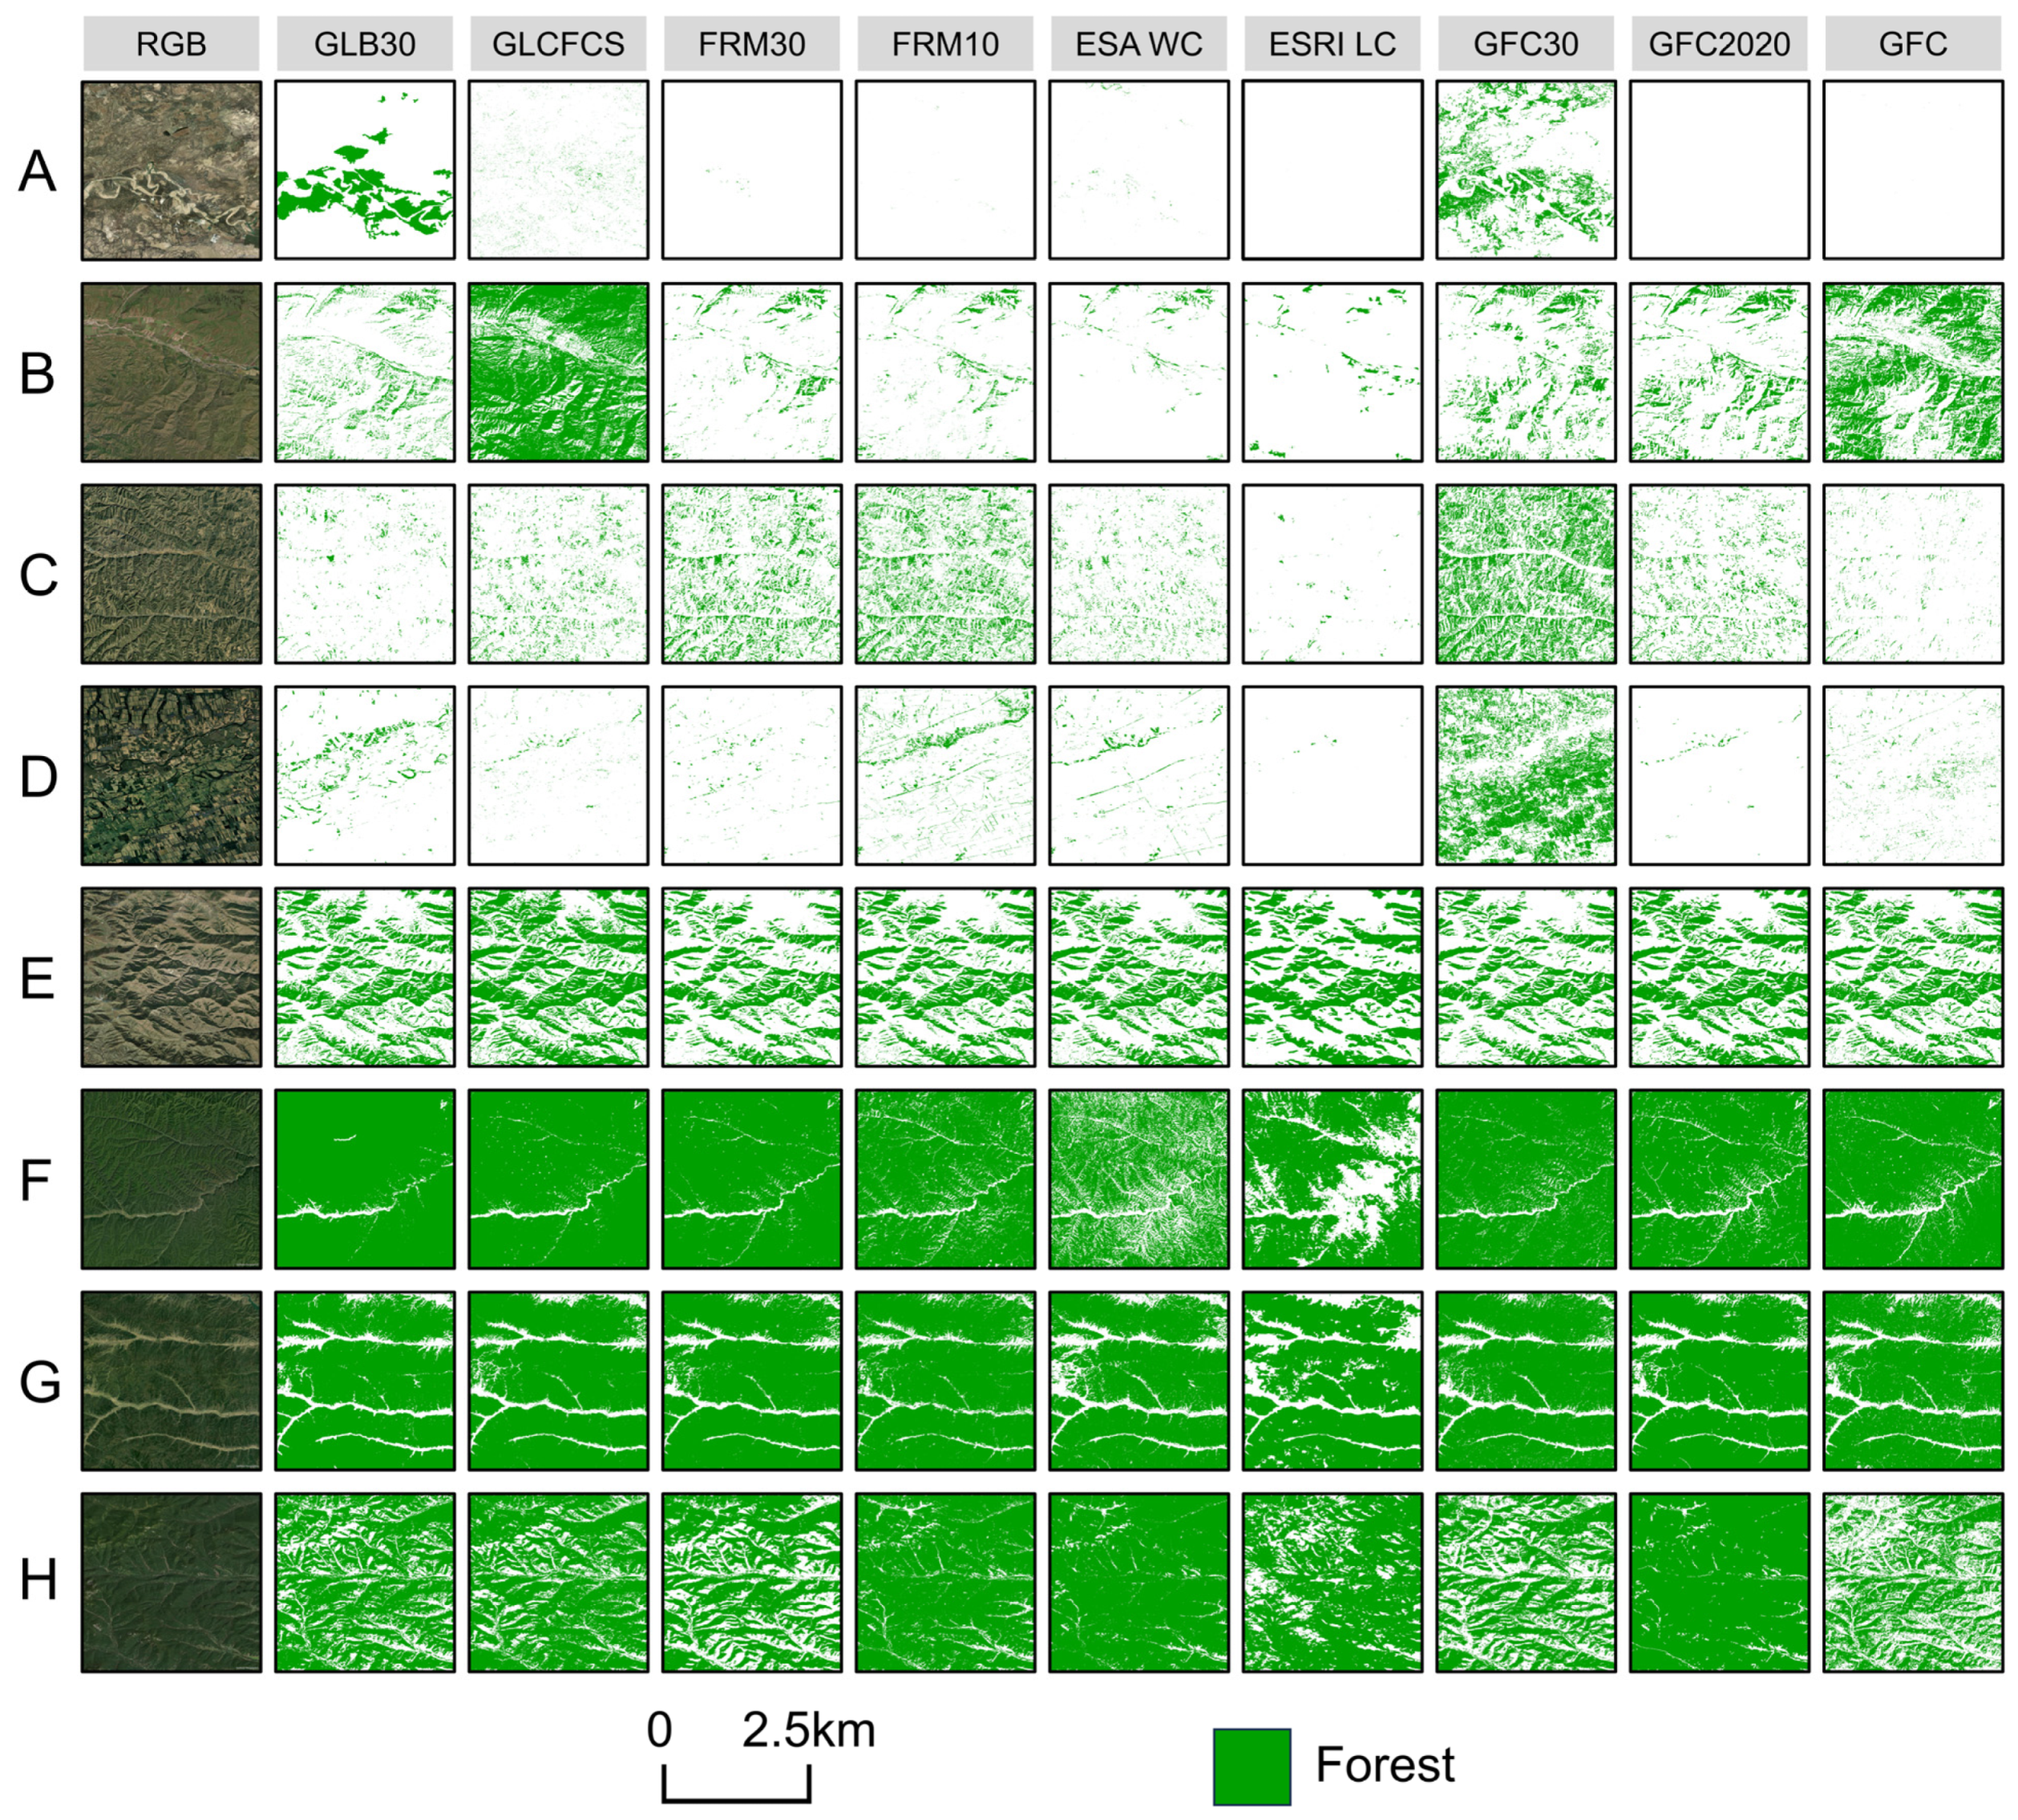
4.2. Spatial Consistency Analysis of Nine Products

Figure 4 illustrates the spatial distribution of nine global forest products across the TNSF region. Overall, all products capture similar spatial forest patterns. Most forests are concentrated in the southeastern area of the TNSF region, including the Shanxi and Hebei Provinces and the Greater Khingan Mountains in the northeastern area, while the remaining area has sparse forest cover. In addition, in terms of the forest intensity, ESRI Land Cover and GFC showed underestimations of these rich-forest areas compared with other forest products, consistent with the area estimation in Section 4.1.
Figure 5 illustrates the spatial consistencies of forest cover derived from the nine products at a 30 m resolution and also summarizes their area distribution in terms of longitude. Specifically, only 13.91% of the area shows complete agreement (level 9) among all nine products, while areas with the lowest consistency (level 1) represented 31.04%. In contrast, 55.05% of the regions were considered to be forest by 2–8 of the nine products. In terms of spatial patterns, regions with high consistency are primarily located in areas with dense and continuous forest cover (100°E to 120°E), constituting 67.47% of the regions with consistency levels exceeding 6. Conversely, two notable clusters of low-consistency areas are observed: one in the northwest (73°E–90°E) and the other in the northeast (120°E–128°E). These clusters account for 26.37% and 21.74% of regions with consistency levels below 4, respectively. The remaining low-consistency areas are evenly distributed across the TNSF region in terms of longitude.
Figure 6 shows the spatial consistency of forests across the five climate zones. The results indicate that the proportion of high-consistency areas decreases as aridity increases. In hyper-arid and arid regions, areas with a consistency level of less than four dominate, accounting for 99.45% and 75.11%, respectively. Conversely, in dry sub-humid and humid regions, areas with a consistency level greater than six are predominant, comprising 47.59% and 66.76%, respectively.
Figure 7 and Figure 8 present qualitative comparisons of the nine global forest products in eight typical regions, covering various climate zones and spatial consistencies. Regions A–D represent areas with low consistency, while Regions E–H correspond to areas with high consistency. Regions A and B are located in low-consistency zones in the northwest. Specifically, Region A comprises forests along a river in an arid area, where only GlobeLand30 and GFC30 successfully identified the forest. In Region B, GLC_FCS30D significantly overestimated the extent of forest cover, leading to considerable discrepancies compared with other products. Region C, located on the Loess Plateau, exhibits highly variable and complex topography, making it challenging for the nine products to maintain consistency. Region D, situated in the Northeast Plain, shows high heterogeneity in land cover because of intense agricultural activities, resulting in significant discrepancies among products. In contrast, the high-consistency regions (E–H) represented large, continuous, and stable forested areas where all products accurately captured the forest distribution. Overall, in transitional zones or fragmented landscapes (Regions C and D), the 10 m resolution products generally delineate forest boundaries more effectively than the 30 m products.

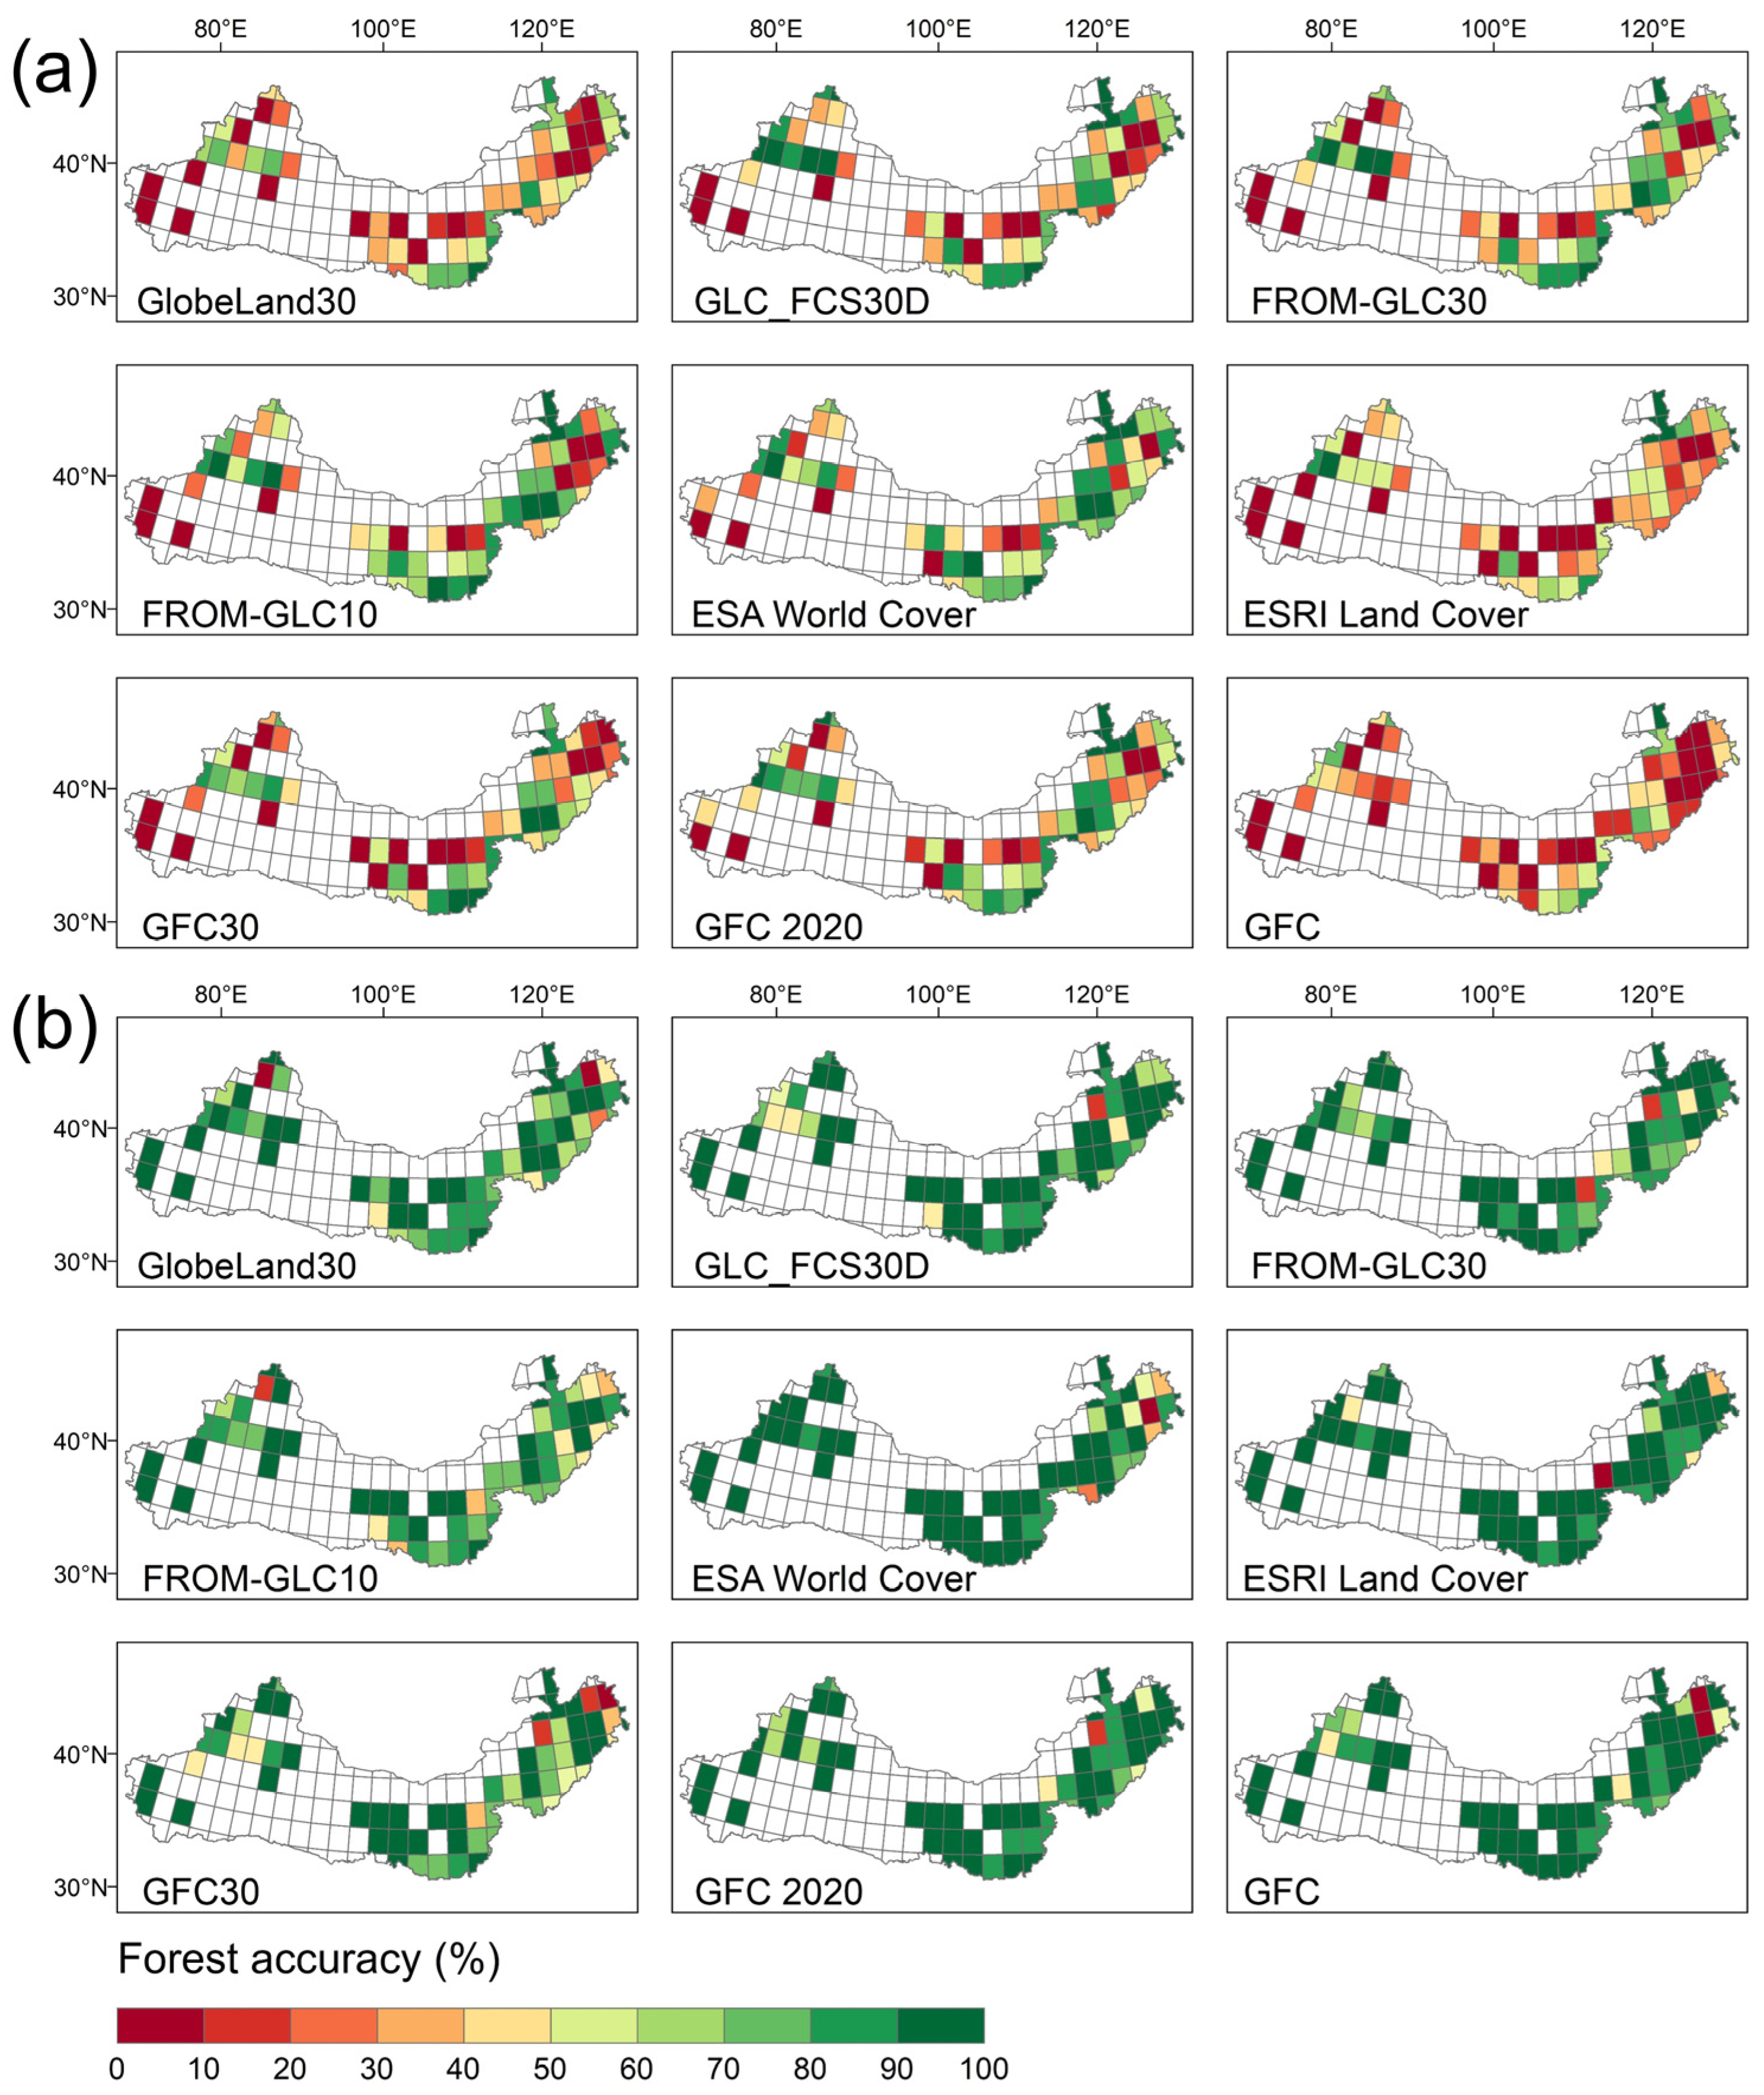
4.3. Accuracy Assessment of the Nine Products

Table 4 presents the accuracy assessment results of the nine products based on the validation dataset outlined in Section 3.1, with the corresponding confusion matrices provided in Figure S1. Overall, all products demonstrate satisfactory OA, with GFC2020 achieving the highest OA at 90.49%, followed by ESA World Cover (89.44%), while GlobeLand30 shows the lowest OA at 84.78%. In terms of UA, all products exceed 80% except for GFC30 (79.64%). ESRI Land Cover achieves the highest UA at 92.72%. However, with regard to PA, all products perform below the accuracy levels reported in their original reports (Table 1). FROM-GLC10 achieves the highest PA at 72.46%, followed by ESA World Cover (71.64%) and GFC2020 (71.08%). In contrast, GlobeLand30, ESRI Land Cover, and GFC exhibit much lower PAs of 49.66%, 48.28%, and 45.57%, respectively. In comparison, except for ESRI Land Cover, the 10 m resolution products outperform the 30 m resolution products in both PA and OA. Across the six land cover products, the mean OA, UA, and PA for forest are 87.68%, 86.72%, and 61.67%, respectively. Similarly, the mean OA, UA, and PA for the three forest-thematic products are 87.78%, 85.66%, and 62.73%, respectively, indicating no significant advantage for the forest-thematic products. Considering all accuracy metrics, GFC2020 achieved the optimal overall performance (highest OA, third for PA and UA).
Figure 9 illustrates the accuracy performance of the nine products across each 2° × 2° grid. The results reveal that the overall spatial patterns are relatively similar among all products. A comparison between Figure 5 and Figure 9 indicates that regions with higher spatial consistency often exhibit higher accuracy, while regions with lower consistency tend to have poorer accuracy. In terms of PA, all products perform poorly across most grids, with PA values of less than 60%. In contrast, UA is relatively high in most regions, exceeding 80%. This discrepancy highlights that omission errors have a more significant impact than commission errors for the nine products in the TNSF region.

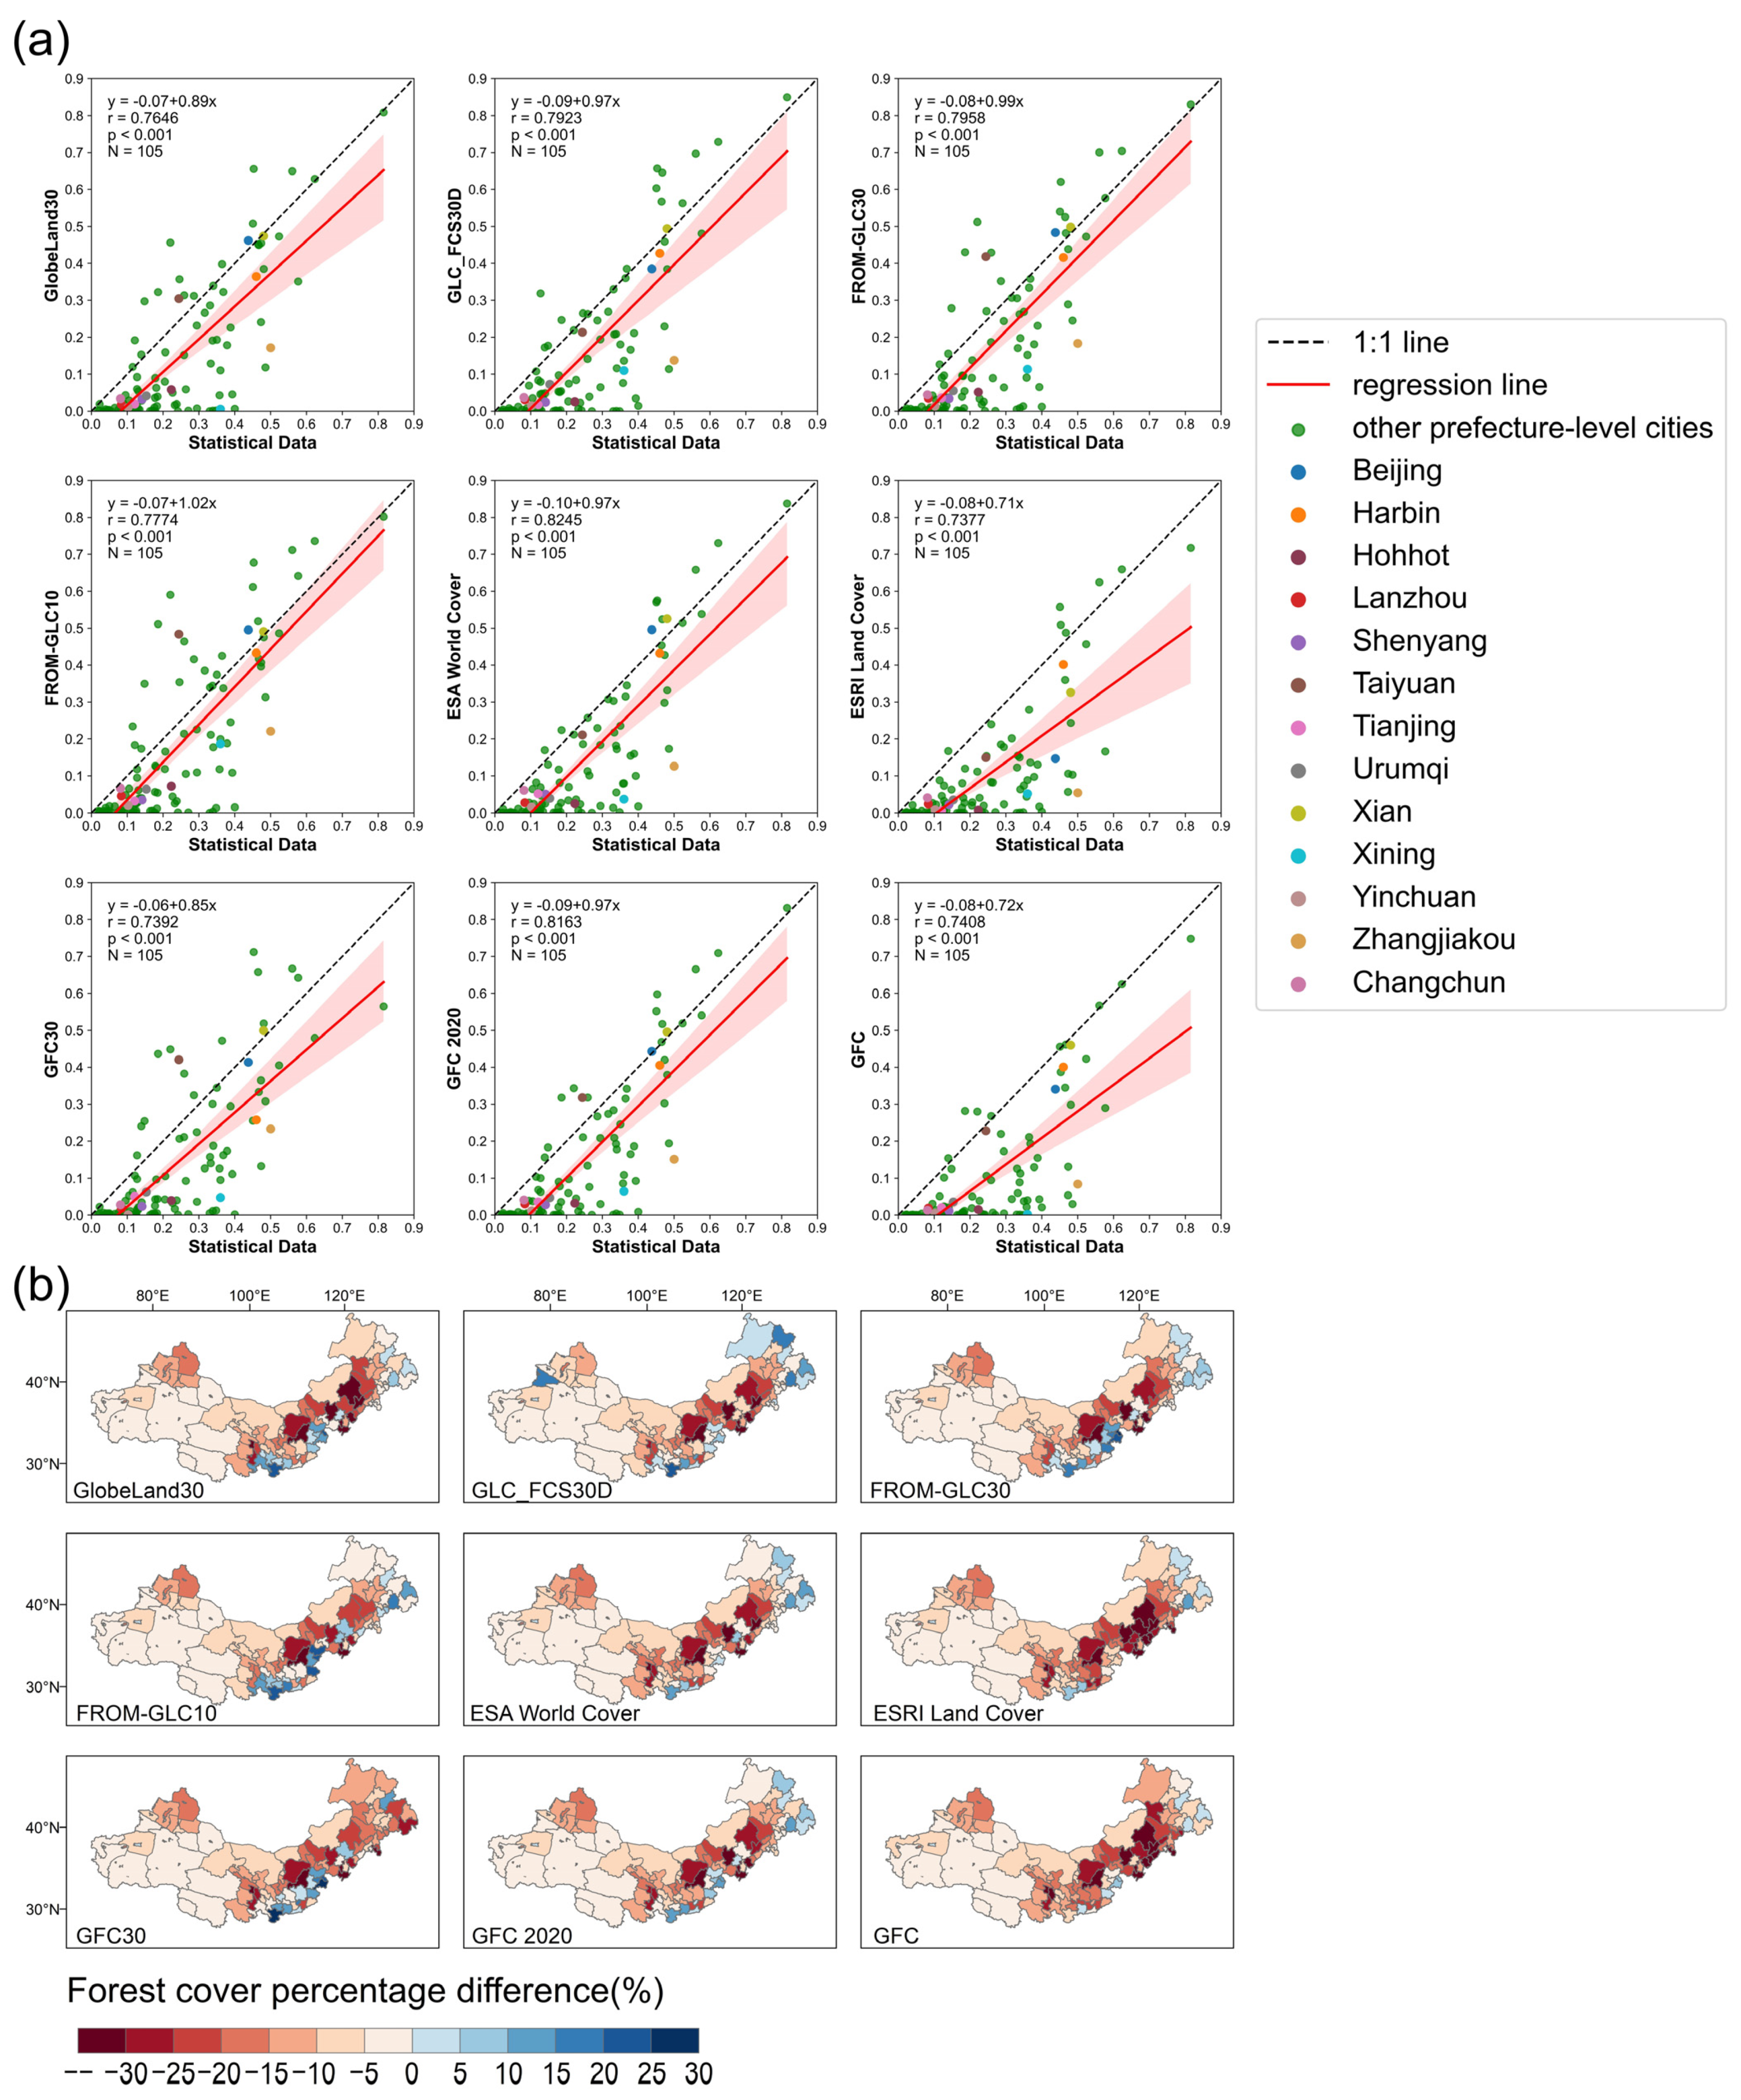
4.4. Comparison Between Statistical Data and Global Forest Cover Products

Figure 10 compares the forest cover percentages derived from the nine products with statistical data at the prefecture-level city scale. Among the products, ESA World Cover demonstrates the highest correlation ( r = 0.8245), providing the most accurate forest area estimates compared with other products. In contrast, ESRI Land Cover shows the poorest performance ( r = 0.7377). Overall, the 10 m resolution products outperform the 30 m resolution products, with mean r values of 0.7890 and 0.7666, respectively. Similarly, the six land cover products (mean r = 0.7821) slightly outperform the three forest-thematic products (mean r = 0.7654). The scatterplots reveal that the forest cover percentage derived from the nine products is less than that derived from statistical data (points below the 1:1 line) for most cities, with some cities’ forest coverage being missed almost entirely (points close to the x-axis). Among the 105 cities analyzed, 93 cities exhibit average forest cover percentages from the nine products lower than those reported in statistical datasets. For instance, in Zhangjiakou and Xining, the statistics are 50% and 36%, respectively, while the nine products report averages of only 15.15% and 6.88%, respectively. In contrast, a few cities show good alignment between the products and statistics. For example, in Xian, the statistics indicate forest cover is 48.03%, and the nine products yield an average of 47.39%, closely matching the statistics. Comparing Figure 9 with Figure 10b reveals that regions with lower accuracy also tend to exhibit larger discrepancies with these statistical data. This indicates that the accuracy assessment results in Section 4.3 effectively reflect the products’ ability to capture forest cover.

5. Discussion

5.1. Reasons for Discrepancies Among Forest Products

Forests are crucial for maintaining ecological balance. Considering that the nine products assessed in this study are free, easily accessible, and widely used by researchers and policymakers, understanding their reliability is essential. This study conducted a comprehensive evaluation and analysis of nine global forest cover products in the TNSF region. Overall, low consistency is observed among these products, and their accuracy varies significantly. However, creating a global forest map is inherently challenging due to the wide geographic variability within and between biomes, which leads to differences in forest characteristics [63]. Therefore, it is unsurprising that the accuracy and spatial consistency of the nine different global forest products vary greatly in this unique region [64]. The reasons for the large differences in accuracy and consistency across the forest cover products are manifold.
First, the varying definitions of forests employed in their classification systems lead to discrepancies between the products [17,45,65]. These definitions differ in key elements, including tree cover, tree height, and minimum area thresholds. For example, GLC_FCS30D, FROM-GLC30, and FROM-GLC10 require a minimum tree cover of 15%, whereas GlobeLand30, ESA World Cover, GFC30, and GFC2020 use a lower threshold of 10%. The three forest-thematic products, GFC30, GFC2020, and GFC, require a tree height greater than 5 m, while the six land cover products either use a threshold of 3 m or impose no height requirement. Additionally, in terms of forest purposes, ESA World Cover includes plantations such as oil palm and olive trees in its statistical analysis, whereas GFC2020 excludes forests intended for agricultural or urban use. These differences make it challenging to compare forest cover products and to use different products in combination [8,66]. Achieving a consensus on forest definitions that meet the universal requirements for forest monitoring could reduce inconsistencies in forest cover estimates and enhance the reliability of remote sensing products [60]. Second, discrepancies among products arise from differences in their remote sensing data sources [16]. As the foundation of forest cover products, the observation period and spatial resolution of the imagery directly influence the final classification results [17]. Previous research has shown that higher spatial resolution significantly decreases the proportion of mixed pixels in heterogeneous areas [60]. This study includes five 30 m products and four 10 m products. Although the 10 m products generally perform better than the 30 m products in capturing forest boundaries, achieving higher accuracy, and aligning with statistical data, a higher resolution does not always guarantee better performance. For instance, the PA of the ESRI Land Cover product is lower than that of all 30 m products except for GFC. Finally, the variable environment within the TNSF region significantly contributes to the inconsistencies among different products, particularly in areas with highly heterogeneous landscapes and complex topography, such as the typical regions C and D in Figure 7. Numerous studies have demonstrated that current global forest cover products exhibit lower accuracy and consistency in areas with complex terrain [67], fragmented forests [48], and forest transition zones [17]. Expanding the training sample size can improve the performance and reliability of these products in such regions [5,68].

5.2. Differences Between Forest Cover Products and Statistical Data

5.2.1. Underestimation of Forest Cover Products in Arid Regions

The results indicate that all nine products underestimate forest area across most of the TNSF region compared with statistical data. Due to sparse tree cover and the reflective bright soil background, forests in arid regions are often underestimated by existing global forest cover products [69]. Figure 11 shows the Forest PA and UA for nine products in different climate zones. The PA of all the products was 0 in the hyper-arid region and also poor in the arid region (7.92% to 32.67%). In contrast, the PA of all products improved significantly as the aridity decreased and ranged from 80% to 100% in the humid region. Many studies have emphasized this phenomenon at both the global and regional scales. For example, Bastin et al. [23] analyzed high-resolution imagery of more than 210,000 forested sites and found that forest cover in drylands across the globe may be underestimated by 40–47%. Similarly, Reiner et al. [70] found that approximately 29% of tree cover in central Africa lies outside of areas categorized as forests by the ESA World Cover product, and areas with less than 10% tree cover are completely overlooked. To summarize, underestimation of forest remote sensing products is common in arid areas.

5.2.2. Differences from the Forest Definition in the Forest Resources Survey

The variation in forest definitions is influenced by different forest management objectives and societal needs, resulting in multiple definitions of forests [71]. In China’s forest resource surveys, the definition of a forest includes arboreal forests, bamboo forests, and shrub forests specified by the state, with a minimum continuous area of 0.0667 hectares. This area is smaller than the area of a single pixel in the 30 m resolution products (0.09 hectares). Additionally, the tree canopy must exceed 20% and also encompass land that has been afforested but has not yet reached the scale of a forest. The definition used in forest surveys is more management-oriented [46]. In contrast, remote sensing products provide an objective “what you see is what you get” representation, focusing on actual vegetation conditions. A typical example is afforestation areas, where existing products may underestimate forests that are in growth or recovery stages, often near the thresholds of forest definitions in terms of tree height and tree cover. This difference in forest definition may be particularly amplified in the TNSF region because of the ongoing large-scale afforestation efforts, as it hosts the world’s largest forest ecological project. In 2020, this region achieved 209,519 hectares of artificial afforestation (China Forestry and Grassland Statistic Yearbook 2020). The temporal lag in observing afforestation activities may introduce unavoidable errors.

6. Conclusions

In recent years, the availability of fine-resolution global forest cover products has significantly expanded user options, making comprehensive accuracy assessments and consistency analyses essential. In this study, all available open-access datasets were compiled, and visual interpretation was conducted to develop a comprehensive validation dataset. This dataset includes 2324 forest samples and 6670 non-forest samples, significantly increasing the sample size for the TNSF region. This novel validation dataset was used to evaluate nine global forest cover products. Among the five 30 m products, FROM-GLC30 achieved the highest OA (89.01%), followed by GLC_FCS30D (88.55%), GFC30 (87.63%), GFC (84.91%), and GlobeLand30 (84.78%). For the four 10 m products, GFC2020 performed best with an OA of 90.49%, followed by ESA World Cover (89.44%), FROM-GLC10 (89.18%), and ESRI Land Cover (85.71%). Across all nine products, the average UA (86.01%) exceeded the PA (62.38%). In addition, the consistency among these products was analyzed. The area-based consistency with 10 m products (71.68%) was higher than with 30 m products (70.25%). High spatial consistency was primarily observed in areas with dense and continuous forests, while low spatial consistency was found in fragmented forests and regions with complex terrain. Finally, the forest cover percentages from all nine products were compared with statistical data at the prefecture-level city scale. The forest area in the TNSF region was underestimated by all products; however, compared with the 30 m products, the 10 m products provided more accurate forest area estimates. Differences in forest definitions and remote sensing data sources were identified as the primary sources of variation among the products. Global forest cover products are constrained by arid climates, which have a significant impact on consistency and accuracy. This study emphasizes the limitations and discrepancies of nine fine-resolution products in the TNSF region and offers valuable insights to help users select the most suitable product for their specific needs.

Supplementary Materials

The following supporting information can be downloaded at: https://www.mdpi.com/article/10.3390/rs17071296/s1, Table S1: The details of all nine global forest cover products; Table S2: Generalized climate classification scheme for Aridity Index values; Figure S1: Confusion matrix for nine product forest categories (F: forest, NF: non-forest).

Author Contributions

Conceptualization, L.L., C.W. and X.Z.; methodology, L.L., C.W., X.Z. and T.Z.; funding acquisition, L.L. and X.Z.; writing—original draft, C.W. and X.Z.; writing—review and editing, C.W., X.Z. and L.L. All authors have read and agreed to the published version of the manuscript.

Funding

This study is financially supported by the National Key Research and Development Program of China [Grant No. 2023YFB3907403].

Data Availability Statement

The global forest cover products and validation datasets covered in this study are freely available online from their distributing organizations.

Acknowledgments

The authors would like to thank all producers of publicly available global forest cover products and validation datasets.

Conflicts of Interest

The authors declare no conflicts of interest.

References

  1. Keenan, R.J.; Reams, G.A.; Achard, F.; de Freitas, J.V.; Grainger, A.; Lindquist, E. Dynamics of global forest area: Results from the FAO Global Forest Resources Assessment 2015. For. Ecol. Manag. 2015, 352, 9–20. [Google Scholar] [CrossRef]
  2. Harris, N.L.; Gibbs, D.A.; Baccini, A.; Birdsey, R.A.; De Bruin, S.; Farina, M.; Fatoyinbo, L.; Hansen, M.C.; Herold, M.; Houghton, R.A. Global maps of twenty-first century forest carbon fluxes. Nat. Clim. Change 2021, 11, 234–240. [Google Scholar] [CrossRef]
  3. Keenan, T.F.; Hollinger, D.Y.; Bohrer, G.; Dragoni, D.; Munger, J.W.; Schmid, H.P.; Richardson, A.D. Increase in forest water-use efficiency as atmospheric carbon dioxide concentrations rise. Nature 2013, 499, 324–327. [Google Scholar] [CrossRef]
  4. Nguyen, T.H.; Jones, S.D.; Soto-Berelov, M.; Haywood, A.; Hislop, S. A spatial and temporal analysis of forest dynamics using Landsat time-series. Remote Sens. Environ. 2018, 217, 461–475. [Google Scholar] [CrossRef]
  5. Xiao, Y.; Wang, Q.; Zhang, H.K. Global Natural and Planted Forests Mapping at Fine Spatial Resolution of 30 m. J. Remote Sens. 2024, 4, 0204. [Google Scholar] [CrossRef]
  6. Zhao, C.; Jia, M.; Zhang, R.; Wang, Z.; Mao, D.; Zhong, C.; Guo, X. Distribution of Mangrove Species Kandelia obovata in China Using Time-series Sentinel-2 Imagery for Sustainable Mangrove Management. J. Remote Sens. 2024, 4, 0143. [Google Scholar] [CrossRef]
  7. Chen, J.; Chen, J.; Liao, A.; Cao, X.; Chen, L.; Chen, X.; He, C.; Han, G.; Peng, S.; Lu, M. Global land cover mapping at 30 m resolution: A POK-based operational approach. ISPRS J. Photogramm. Remote Sens. 2015, 103, 7–27. [Google Scholar] [CrossRef]
  8. Gong, P.; Wang, J.; Yu, L.; Zhao, Y.; Zhao, Y.; Liang, L.; Niu, Z.; Huang, X.; Fu, H.; Liu, S. Finer resolution observation and monitoring of global land cover: First mapping results with Landsat TM and ETM+ data. Int. J. Remote Sens. 2013, 34, 2607–2654. [Google Scholar] [CrossRef]
  9. Zhang, X.; Zhao, T.; Xu, H.; Liu, W.; Wang, J.; Chen, X.; Liu, L. GLC_FCS30D: The first global 30 m land-cover dynamics monitoring product with a fine classification system for the period from 1985 to 2022 generated using dense-time-series Landsat imagery and the continuous change-detection method. Earth Syst. Sci. Data 2024, 16, 1353–1381. [Google Scholar] [CrossRef]
  10. Hansen, M.C.; Potapov, P.V.; Moore, R.; Hancher, M.; Turubanova, S.A.; Tyukavina, A.; Thau, D.; Stehman, S.V.; Goetz, S.J.; Loveland, T.R. High-resolution global maps of 21st-century forest cover change. Science 2013, 342, 850–853. [Google Scholar] [CrossRef]
  11. Zhang, X.; Long, T.; He, G.; Guo, Y.; Yin, R.; Zhang, Z.; Xiao, H.; Li, M.; Cheng, B. Rapid generation of global forest cover map using Landsat based on the forest ecological zones. J. Appl. Remote Sens. 2020, 14, 022211. [Google Scholar]
  12. Zanaga, D.; De Kerchove, R.V.; Keersmaecker, W.D.; Souverijns, N.; Brockmann, C.; Quast, R.; Wevers, J.; Grosu, A.; Paccini, A.; Vergnaud, S. ESA WorldCover 10 m 2020 v100, Version 100; The European Space Agency: Paris, France, 2021. [Google Scholar] [CrossRef]
  13. Gong, P.; Liu, H.; Zhang, M.; Li, C.; Wang, J.; Huang, H.; Clinton, N.; Ji, L.; Li, W.; Bai, Y. Stable classification with limited sample: Transferring a 30-m resolution sample set collected in 2015 to mapping 10-m resolution global land cover in 2017. Sci. Bull. 2019, 64, 370–373. [Google Scholar]
  14. Karra, K.; Kontgis, C.; Statman-Weil, Z.; Mazzariello, J.C.; Mathis, M.; Brumby, S.P. Global land use/land cover with Sentinel 2 and deep learning. In Proceedings of the 2021 IEEE International Geoscience and Remote Sensing Symposium IGARSS, Brussels, Belgium, 11–16 July 2021; pp. 4704–4707. [Google Scholar]
  15. Bourgoin, C.; Ameztoy, I.; Verhegghen, A.; Desclée, B.; Carboni, S.; Bastin, J.; Beuchle, R.; Brink, A.; Defourny, P.; Delhez, B. Mapping Global Forest Cover of the Year 2020 to Support the EU Regulation on Deforestation-Free Supply Chains; Publications Office of the European Union: Luxembourg, 2024. [Google Scholar]
  16. Kang, J.; Wang, Z.; Sui, L.; Yang, X.; Ma, Y.; Wang, J. Consistency Analysis of Remote Sensing Land Cover Products in the Tropical Rainforest Climate Region: A Case Study of Indonesia. Remote Sens. 2020, 12, 1410. [Google Scholar] [CrossRef]
  17. Peng, X.; He, G.; Wang, G.; Long, T.; Zhang, X.; Yin, R. User-Aware Evaluation for Medium-Resolution Forest-Related Datasets in China: Reliability and Spatial Consistency. Remote Sens. 2023, 15, 2557. [Google Scholar] [CrossRef]
  18. Gao, Y.; Liu, L.; Zhang, X.; Chen, X.; Mi, J.; Xie, S. Consistency Analysis and Accuracy Assessment of Three Global 30-m Land-Cover Products over the European Union using the LUCAS Dataset. Remote Sens. 2020, 12, 3479. [Google Scholar] [CrossRef]
  19. Tsendbazar, N.E.; Herold, M.; de Bruin, S.; Lesiv, M.; Fritz, S.; Van De Kerchove, R.; Buchhorn, M.; Duerauer, M.; Szantoi, Z.; Pekel, J.F. Developing and applying a multi-purpose land cover validation dataset for Africa. Remote Sens. Environ. 2018, 219, 298–309. [Google Scholar] [CrossRef]
  20. Chen, H.; Zeng, Z.; Wu, J.; Peng, L.; Lakshmi, V.; Yang, H.; Liu, J. Large uncertainty on forest area change in the early 21st century among widely used global land cover datasets. Remote Sens. 2020, 12, 3502. [Google Scholar] [CrossRef]
  21. Schimel, D.S. Drylands in the earth system. Science 2010, 327, 418–419. [Google Scholar] [CrossRef]
  22. Almalki, R.; Khaki, M.; Saco, P.M.; Rodriguez, J.F. Monitoring and Mapping Vegetation Cover Changes in Arid and Semi-Arid Areas Using Remote Sensing Technology: A Review. Remote Sens. 2022, 14, 5143. [Google Scholar] [CrossRef]
  23. Bastin, J.-F.; Berrahmouni, N.; Grainger, A.; Maniatis, D.; Mollicone, D.; Moore, R.; Patriarca, C.; Picard, N.; Sparrow, B.; Abraham, E.M. The extent of forest in dryland biomes. Science 2017, 356, 635–638. [Google Scholar] [CrossRef]
  24. Qin, Y.; Xiao, X.; Wang, J.; Dong, J.; Ewing, K.; Hoagland, B.; Hough, D.; Fagin, T.; Zou, Z.; Geissler, G.; et al. Mapping Annual Forest Cover in Sub-Humid and Semi-Arid Regions through Analysis of Landsat and PALSAR Imagery. Remote Sens. 2016, 8, 933. [Google Scholar] [CrossRef]
  25. Rotenberg, E.; Yakir, D. Contribution of semi-arid forests to the climate system. Science 2010, 327, 451–454. [Google Scholar] [CrossRef]
  26. Hüttich, C.; Herold, M.; Wegmann, M.; Cord, A.; Strohbach, B.; Schmullius, C.; Dech, S. Assessing effects of temporal compositing and varying observation periods for large-area land-cover mapping in semi-arid ecosystems: Implications for global monitoring. Remote Sens. Environ. 2011, 115, 2445–2459. [Google Scholar] [CrossRef]
  27. Cunningham, D.; Cunningham, P.; Fagan, M.E. Identifying Biases in Global Tree Cover Products: A Case Study in Costa Rica. Forests 2019, 10, 853. [Google Scholar] [CrossRef]
  28. Fagan, M.E. A lesson unlearned? Underestimating tree cover in drylands biases global restoration maps. Glob. Change Biol. 2020, 26, 4679–4690. [Google Scholar] [CrossRef]
  29. Yang, J.; Weisberg, P.J.; Bristow, N.A. Landsat remote sensing approaches for monitoring long-term tree cover dynamics in semi-arid woodlands: Comparison of vegetation indices and spectral mixture analysis. Remote Sens. Environ. 2012, 119, 62–71. [Google Scholar] [CrossRef]
  30. Bie, Q.; Luo, J.; Lu, G. Accuracy Performance of Three 10-m Global Land Cover Products Around 2020 in an Arid Region of Northwestern China. IEEE Access 2023, 11, 133215–133228. [Google Scholar] [CrossRef]
  31. Zhao, Y.; Gong, P.; Yu, L.; Hu, L.; Li, X.; Li, C.; Zhang, H.; Zheng, Y.; Wang, J.; Zhao, Y.; et al. Towards a common validation sample set for global land-cover mapping. Int. J. Remote Sens. 2014, 35, 4795–4814. [Google Scholar] [CrossRef]
  32. Foody, G.M. Assessing the accuracy of land cover change with imperfect ground reference data. Remote Sens. Environ. 2010, 114, 2271–2285. [Google Scholar] [CrossRef]
  33. Olofsson, P.; Stehman, S.V.; Woodcock, C.E.; Sulla-Menashe, D.; Sibley, A.M.; Newell, J.D.; Friedl, M.A.; Herold, M. A global land-cover validation data set, part I: Fundamental design principles. Int. J. Remote Sens. 2012, 33, 5768–5788. [Google Scholar] [CrossRef]
  34. Stehman, S.V.; Pengra, B.W.; Horton, J.A.; Wellington, D.F. Validation of the U.S. Geological Survey’s Land Change Monitoring, Assessment and Projection (LCMAP) Collection 1.0 annual land cover products 1985–2017. Remote Sens. Environ. 2021, 265, 112646. [Google Scholar] [CrossRef]
  35. Olofsson, P.; Foody, G.M.; Herold, M.; Stehman, S.V.; Woodcock, C.E.; Wulder, M.A. Good practices for estimating area and assessing accuracy of land change. Remote Sens. Environ. 2014, 148, 42–57. [Google Scholar] [CrossRef]
  36. Fritz, S.; McCallum, I.; Schill, C.; Perger, C.; Grillmayer, R.; Achard, F.; Kraxner, F.; Obersteiner, M. Geo-Wiki.Org: The Use of Crowdsourcing to Improve Global Land. Cover. Remote Sens. 2009, 1, 345–354. [Google Scholar] [CrossRef]
  37. Stehman, S.V.; Foody, G.M. Key issues in rigorous accuracy assessment of land cover products. Remote Sens. Environ. 2019, 231, 111199. [Google Scholar] [CrossRef]
  38. Hu, J.; Ni, J.; Liu, J. A China’s Sample Trees Biomass Dataset Based on Literature Collection; Science Data Bank: Beijing, China, 2022. [Google Scholar] [CrossRef]
  39. Wu, X.; Jiang, X.; Liu, H.; Allen, C.; Li, X.; Wang, P.; Li, Z.; Yang, Y.; Zhang, S.; Shi, F.; et al. CPSDv0: A forest stand structure database for plantation forests in China. Big Earth Data 2022, 7, 212–230. [Google Scholar] [CrossRef]
  40. Yu, Z.; Dong, Y.; Lu, C.; Agathokleous, E.; Zhang, L.; Liu, S.; Zhou, G. China’s forestation on marginal land was less efficient in carbon sequestration compared with non-marginal land. One Earth 2023, 6, 1692–1702. [Google Scholar] [CrossRef]
  41. Qi, K.; Zhu, J.; Zheng, X.; Wang, G.G.; Li, M. Impacts of the world’s largest afforestation program (Three-North Afforestation Program) on desertification control in sandy land of China. GISci. Remote Sens. 2023, 60, 2167574. [Google Scholar] [CrossRef]
  42. Zhai, J.; Wang, L.; Liu, Y.; Wang, C.; Mao, X. Assessing the effects of China’s Three-North Shelter Forest Program over 40 years. Sci. Total Environ. 2023, 857, 159354. [Google Scholar] [CrossRef]
  43. Qiu, B.; Chen, G.; Tang, Z.; Lu, D.; Wang, Z.; Chen, C. Assessing the Three-North Shelter Forest Program in China by a novel framework for characterizing vegetation changes. ISPRS J. Photogramm. Remote Sens. 2017, 133, 75–88. [Google Scholar] [CrossRef]
  44. Cao, S.; Suo, X.; Xia, C. Payoff from afforestation under the Three-North Shelter Forest Program. J. Clean. Prod. 2020, 256, 120461. [Google Scholar] [CrossRef]
  45. Wang, Y.; Xu, Y.; Xu, X.; Jiang, X.; Mo, Y.; Cui, H.; Zhu, S.; Wu, H. Evaluation of six global high-resolution global land cover products over China. Int. J. Digit. Earth 2024, 17, 2301673. [Google Scholar] [CrossRef]
  46. Zhang, D.; Wang, H.; Wang, X.; Lü, Z. Accuracy assessment of the global forest watch tree cover 2000 in China. Int. J. Appl. Earth Obs. Geoinf. 2020, 87, 102033. [Google Scholar] [CrossRef]
  47. Zomer, R.J.; Xu, J.; Trabucco, A. Version 3 of the Global Aridity Index and Potential Evapotranspiration Database. Sci. Data 2022, 9, 409. [Google Scholar] [CrossRef] [PubMed]
  48. Zhao, T.; Zhang, X.; Gao, Y.; Mi, J.; Liu, W.; Wang, J.; Jiang, M.; Liu, L. Assessing the accuracy and consistency of six fine-resolution global land cover products using a novel stratified random sampling validation dataset. Remote Sens. 2023, 15, 2285. [Google Scholar] [CrossRef]
  49. Ballin, M.; Barcaroli, G.; Masselli, M.; Scarnó, M. Redesign sample for land use/cover area frame survey (LUCAS) 2018. Eurostat Stat. Work. Pap. 2018, 10, 132365. [Google Scholar]
  50. Gao, J. Belowground Biomass of Natural and Planted Forests in China; Science Data Bank: Beijing, China, 2023. [Google Scholar] [CrossRef]
  51. Lesiv, M.; Schepaschenko, D.; Buchhorn, M.; See, L.; Durauer, M.; Georgieva, I.; Jung, M.; Hofhansl, F.; Schulze, K.; Bilous, A.; et al. Global forest management data for 2015 at a 100 m resolution. Sci. Data 2022, 9, 199. [Google Scholar] [CrossRef]
  52. Bukoski, J.J.; Cook-Patton, S.C.; Melikov, C.; Ban, H.; Chen, J.L.; Goldman, E.D.; Harris, N.L.; Potts, M.D. Rates and drivers of aboveground carbon accumulation in global monoculture plantation forests. Nat. Commun. 2022, 13, 4206. [Google Scholar] [CrossRef]
  53. Liang, J.; Crowther, T.W.; Picard, N.; Wiser, S.; Zhou, M.; Alberti, G.; Schulze, E.D.; McGuire, A.D.; Bozzato, F.; Pretzsch, H.; et al. Positive biodiversity-productivity relationship predominant in global forests. Science 2016, 354, aaf8957. [Google Scholar] [CrossRef]
  54. Xu, L.; He, N.; Yu, G. A dataset of carbon density in Chinese terrestrial ecosystems (2010s). China Sci. Data 2019, 4, 90–91. [Google Scholar] [CrossRef]
  55. Zhang, S.; Xu, H.; Liu, A.; Qi, S.; Hu, B.; Huang, M.; Luo, J. Mapping of secondary forest age in China using stacked generalization and Landsat time series. Sci. Data 2024, 11, 302. [Google Scholar] [CrossRef]
  56. Xu, H.; He, B.; Guo, L.; Yan, X.; Zeng, Y.; Yuan, W.; Zhong, Z.; Tang, R.; Yang, Y.; Liu, H. Global forest plantations mapping and biomass carbon estimation. J. Geophys. Res. Biogeosci. 2024, 129, e2023JG007441. [Google Scholar] [CrossRef]
  57. Fritz, S.; See, L.; Perger, C.; McCallum, I.; Schill, C.; Schepaschenko, D.; Duerauer, M.; Karner, M.; Dresel, C.; Laso-Bayas, J.C.; et al. A global dataset of crowdsourced land cover and land use reference data. Sci. Data 2017, 4, 170075. [Google Scholar] [CrossRef] [PubMed]
  58. Liang, L.; Liu, Q.; Liu, G.; Li, H.; Huang, C. Accuracy Evaluation and Consistency Analysis of Four Global Land Cover Products in the Arctic Region. Remote Sens. 2019, 11, 1396. [Google Scholar] [CrossRef]
  59. Foody, G.M. Status of land cover classification accuracy assessment. Remote Sens. Environ. 2002, 80, 185–201. [Google Scholar] [CrossRef]
  60. Cui, Y.; Liu, R.; Li, Z.; Zhang, C.; Song, X.-P.; Yang, J.; Yu, L.; Chen, M.; Dong, J. Decoding the inconsistency of six cropland maps in China. Crop J. 2024, 12, 281–294. [Google Scholar] [CrossRef]
  61. Shi, W.; Zhao, X.; Zhao, J.; Zhao, S.; Guo, Y.; Liu, N.; Sun, N.; Du, X.; Sun, M. Reliability and consistency assessment of land cover products at macro and local scales in typical cities. Int. J. Digit. Earth 2023, 16, 486–508. [Google Scholar] [CrossRef]
  62. Xia, X.; Xia, J.; Chen, X.; Fan, L.; Liu, S.; Qin, Y.; Qin, Z.; Xiao, X.; Xu, W.; Yue, C. Reconstructing Long-Term Forest Cover in China by Fusing National Forest Inventory and 20 Land Use and Land Cover Data Sets. J. Geophys. Res. Biogeosci. 2023, 128, e2022JG007101. [Google Scholar]
  63. Venter, Z.S.; Barton, D.N.; Chakraborty, T.; Simensen, T.; Singh, G. Global 10 m Land Use Land Cover Datasets: A Comparison of Dynamic World, World Cover and Esri Land Cover. Remote Sens. 2022, 14, 4101. [Google Scholar] [CrossRef]
  64. Jiang, G.; Wang, J.; Li, K.; Xu, C.; Li, H.; Jin, Z.; Liu, J. Consistency Analysis and Accuracy Evaluation of Multi-Source Land Cover Data Products in the Eastern European Plain. Remote Sens. 2023, 15, 4254. [Google Scholar] [CrossRef]
  65. Hua, T.; Zhao, W.; Liu, Y.; Wang, S.; Yang, S. Spatial Consistency Assessments for Global Land-Cover. Datasets: A Comparison among GLC2000, CCI LC, MCD12, GLOBCOVER and GLCNMO. Remote Sens. 2018, 10, 1846. [Google Scholar] [CrossRef]
  66. Yang, Y.; Xiao, P.; Feng, X.; Li, H. Accuracy assessment of seven global land cover datasets over China. ISPRS J. Photogramm. Remote Sens. 2017, 125, 156–173. [Google Scholar] [CrossRef]
  67. Amin, G.; Imtiaz, I.; Haroon, E.; Saqib, N.u.; Shahzad, M.I.; Nazeer, M. Assessment of Machine Learning Algorithms for Land Cover Classification in a Complex Mountainous Landscape. J. Geovis. Spat. Anal. 2024, 8, 34. [Google Scholar] [CrossRef]
  68. Cheng, K.; Su, Y.; Guan, H.; Tao, S.; Ren, Y.; Hu, T.; Ma, K.; Tang, Y.; Guo, Q. Mapping China’s planted forests using high resolution imagery and massive amounts of crowdsourced samples. ISPRS J. Photogramm. Remote Sens. 2023, 196, 356–371. [Google Scholar] [CrossRef]
  69. Shafeian, E.; Fassnacht, F.E.; Latifi, H. Mapping fractional woody cover in an extensive semi-arid woodland area at different spatial grains with Sentinel-2 and very high-resolution data. Int. J. Appl. Earth Obs. Geoinf. 2021, 105, 102621. [Google Scholar] [CrossRef]
  70. Reiner, F.; Brandt, M.; Tong, X.; Skole, D.; Kariryaa, A.; Ciais, P.; Davies, A.; Hiernaux, P.; Chave, J.; Mugabowindekwe, M.; et al. More than one quarter of Africa’s tree cover is found outside areas previously classified as forest. Nat. Commun. 2023, 14, 2258. [Google Scholar] [CrossRef]
  71. Verchot, L.V.; Zomer, R.; Straaten, O.V.; Muys, B. Implications of Country-Level Decisions on the Specification of Crown Cover in the Definition of Forests for Land Area Eligible for Afforestation and Reforestation Activities in the CDM. Clim. Change 2007, 81, 415–430. [Google Scholar] [CrossRef]
Figure 1. (a) Geographic location and altitudinal characteristics of the TNSF region, (b) climate zone map and locations of typical regions A–H, (c) land cover spatial distributions based on GlobeLand30.
Remotesensing 17 01296 g001
Figure 2. Location of the generated validation points across the TNSF region; the bar plot demonstrates the number of sample points for different land cover types.
Remotesensing 17 01296 g002
Figure 3. (a) Forest area estimates for the nine products within the TNSF region, (b) area-based consistency among the nine products.
Remotesensing 17 01296 g003
Figure 4. Spatial pattern of the nine global forest cover products in the TNSF region.
Remotesensing 17 01296 g004
Figure 5. (a) Axes plots display the number of pixels with varying consistency levels at the corresponding longitude. (b) Spatial distribution of consistency among the nine products across the TNSF region with the bar plot indicating the proportion of pixels at each consistency level. Figure 5a,b share the same longitude axes.
Remotesensing 17 01296 g005
Figure 6. Proportion of different consistency level areas across the five types of climate zones.
Remotesensing 17 01296 g006
Figure 7. Spatial consistency results of the eight typical regions (AH), their specific spatial locations are shown in Figure 1b.
Remotesensing 17 01296 g007
Figure 8. Spatial distribution of forests among the nine products in Regions (AH), the first column shows high-resolution remote sensing imagery of these regions.
Remotesensing 17 01296 g008
Figure 9. Spatial pattern of forest accuracy of the nine products at 2° × 2° grids: (a) PA, (b) UA.
Remotesensing 17 01296 g009
Figure 10. (a) Scatter plots depicting the comparison between the nine global forest cover products and statistical data across 105 prefecture-level cities; the red line represents the regression line, while the dashed line indicates the 1:1 reference line. Municipalities and provincial capitals are marked with different colors. (b) Spatial visualization of the differences between statistical data and products for different cities.
Remotesensing 17 01296 g010
Figure 11. Forest UA and PA for the nine products across five climate regions.
Remotesensing 17 01296 g011
Table 1. Main forest characteristics in the nine global 10–30 m forest products (UA and PA represent user’s accuracy and producer’s accuracy, respectively).
NameForest DefinitionSpatial
Resolution
AccuracyReferences
GlobeLand30Covered by trees with a tree cover greater than 30% and open woodland with a tree cover of 10–30%30 mUA:92.40%
PA:84.10%
[7]
GLC_FCS30DTree-cover percentage > 15% and tree height > 3 m30 mUA:86.35%
PA:92.83%
[9]
FROM-GLC30Tree-cover percentage > 15%, tree height > 3 m30 mUA:80.49%
PA:76.45%
[8]
FROM-GLC10Tree-cover percentage > 15%, tree height > 3 m10 mUA:83.47%
PA:84.20%
[13]
ESA World CoverAreas dominated by trees with a cover greater than 10%, or areas planted with trees for afforestation purposes and plantations (e.g., oil palm and olive trees) are included in this class, or some tree-covered areas seasonally or permanently flooded with fresh water except for mangroves10 mUA:80.80%
PA:89.90%
[12]
ESRI Land CoverTrees with significant clustering and a minimum height (~15 feet or higher) 10 mUA:90.35%
PA:91.07%
[14]
GFC30Land area greater than 0.5 ha with trees taller than 5 m, canopy cover greater than 10%30 mUA:87.12%
PA:93.95%
[11]
GFC 2020Land area greater than 0.5 hectares with trees taller than 5 m, canopy cover greater than 10%, excluding land that is predominantly under agricultural or urban land use (cocoa, coffee, oil palm, and rubber)10 mUA:95.20%
PA:60.30%
[15]
GFCVegetation height greater than 5 m30 mNo-provide[10]
Table 2. Forest validation datasets collected in this study.
NameCoverageMethodSizeSource
China’s sample trees biomass dataset based on literature collectionChinaField survey2506[38]
CPSDv0: A forest stand structure database for plantation forests over ChinaChinaField survey594[39]
Belowground biomass of natural and planted forests in ChinaChinaField survey926[50]
Global forest management data at a 100 m resolution for the year 2015GlobalImage interpretation231,453[51]
Global Plantation Forest Carbon DatabaseGlobalField survey4756[52]
GFBI Ground-Sourced Forest Inventory DataGlobalField survey777,125[53]
A dataset of carbon density in Chinese terrestrial ecosystems (2010s)ChinaField survey15,610[54]
Validation Samples for SFACChinaImage interpretation3000[55]
China planted forest dataChinaField survey5072[40]
Global interpreted planted forest, natural forests validation samplesGlobalImage interpretation23,215[56]
Table 3. Harmonization of the nine global forest products.
NameForest CategoriesNon-Forest Categories
GlobeLand30ForestCultivated land, Grassland, Shrubland, Wetland, Water bodies, Tundra, Artificial surfaces, Bareland, Permanent snow and ice
GLC_FCS30DOpen evergreen broadleaved forest
Closed evergreen broadleaved forest
Open deciduous broadleaved forest
Closed deciduous broadleaved forest
Open evergreen needle-leaved forest
Closed evergreen needle-leaved forest
Open deciduous needle-leaved forest
Closed deciduous needle-leaved forest
Open mixed leaf forest
Closed mixed leaf forest
Rainfed cropland, Herbaceous cover, Tree or shrub cover (Orchard), Irrigated cropland, Grassland, Shrubland,
Evergreen shrubland, Deciduous shrubland, Wetlands,
Water body, Lichens and mosses,
Impervious surface, Sparse vegetation, Sparse shrubland,
Sparse herbaceous, Bare areas, Consolidated bare areas,
Unconsolidated bare areas, Permanent ice and snow
FROM-GLC30ForestCropland, Grassland, Shrubland, Wetland, Water, Tundra, Impervious surface, Bareland, Snow/Ice
FROM-GLC10ForestCropland, Grassland, Shrubland, Wetland, Water, Tundra, Impervious surface, Bareland, Snow/Ice
ESA World CoverTree CoverCropland, Grassland, Shrubland, Herbaceous wetland, Mangroves, Permanent water bodies, Moss and lichen, Built-up area, Bare/Sparse vegetation, Snow and ice
ESRI Land CoverTreesCrops, Grass, Scrub/shrub, Flooded vegetation, Water, Built-up area, Bare ground, Snow/Ice
GFC30ForestNot provided
GFC 2020ForestNot provided
GFCTree cover
Forest gain
Forest loss
Not provided
Table 4. Forest accuracy assessment results in the TNSF region for each product (products with a * have resolutions of 30 m; the remainder are 10 m).
DatasetsKappaOAUAPA
GlobeLand30 *0.585284.7884.3649.66
GLC_FCS30D *0.702288.5587.2164.41
FROM-GLC30 *0.722289.0183.7369.92
FROM-GLC100.730089.1882.1472.46
ESA World Cover0.734389.4483.7971.64
ESRI Land Cover0.602585.7192.7248.28
GFC30 *0.689287.6379.6468.37
GFC 20200.757190.4989.2371.08
GFC *0.576984.9191.3045.57
Disclaimer/Publisher’s Note: The statements, opinions and data contained in all publications are solely those of the individual author(s) and contributor(s) and not of MDPI and/or the editor(s). MDPI and/or the editor(s) disclaim responsibility for any injury to people or property resulting from any ideas, methods, instructions or products referred to in the content.

