In this section, the radar echoes of spatial targets are obtained through electromagnetic calculation methods to validate the proposed parameter estimation approach.
5.2. Validation of Scattering Center Matching Method
The HRRP of the target can be obtained through electromagnetic calculation methods. Then, by using the micro-range curve separation method from [
14], the micro-range history sequences of each scattering center can be obtained.
Figure 4a,c,e show the micro-range history sequences for viewing angles of 50°, 120°, and 170°, respectively, denoted as
,
, and
. It can be observed that the number of extracted curves matches the occlusion situations, and the micro-range range curves do not match the scattering centers
A,
B, and
C. By utilizing the algorithm proposed in this paper for scattering center matching and association, the results are shown in
Figure 4b,d,f. It can be observed that the proposed method successfully matches and associates the micro-range curves with the scattering centers.
The correct association between scattering centers and micro-range curves is fundamental for subsequent parameter estimation. We conducted a statistical analysis of the success rate of scattering center matching under different signal-to-noise ratios for viewing angles of
,
, and
. Each result was obtained through 10,000 Monte Carlo simulations, and the results are shown in
Figure 5. It can be observed that as the signal-to-noise ratio decreases, the matching rates begin to decline at approximately 10 dB, 10 dB, and 20 dB for the three scenarios, respectively. This is due to the poor observation angles and the resulting large errors in the extracted micro-range curves. For
and
, the matching success rate remains close to
when the signal-to-noise ratio exceeds 10 dB. In the case of
, the matching success rate approaches
when the signal-to-noise ratio exceeds 20 dB, validating the effectiveness of the proposed method.
5.3. Validation of Micro-Doppler Parameter Estimation
The estimation of multidimensional parameters for spatially maneuvering targets relies on the accuracy of the micro-motion parameters , , , , , and . Next, we will evaluate and analyze the estimation performance of these micro-motion parameters.
Taking the micro-Doppler curves at
as an example, with a signal-to-noise ratio of 20 dB, we compared the parameter estimation results using SRI-ESPRIT, the Residual Correction method proposed in [
15], and the Levenberg–Marquardt (L-M) algorithm. The estimation results are presented in
Table 4. It can be observed that the L-M algorithm has the smallest RE, but the accuracy of parameter estimation depends on the reasonable selection of initial values, resulting in a large RMSE. The Residual Correction algorithm has the smallest RMSE for the estimation of
f, but the RE is relatively large. The SRI-ESPRIT algorithm yields parameter estimation results comparable to the L-M algorithm in terms of RE, but it demonstrates better stability in parameter estimation.
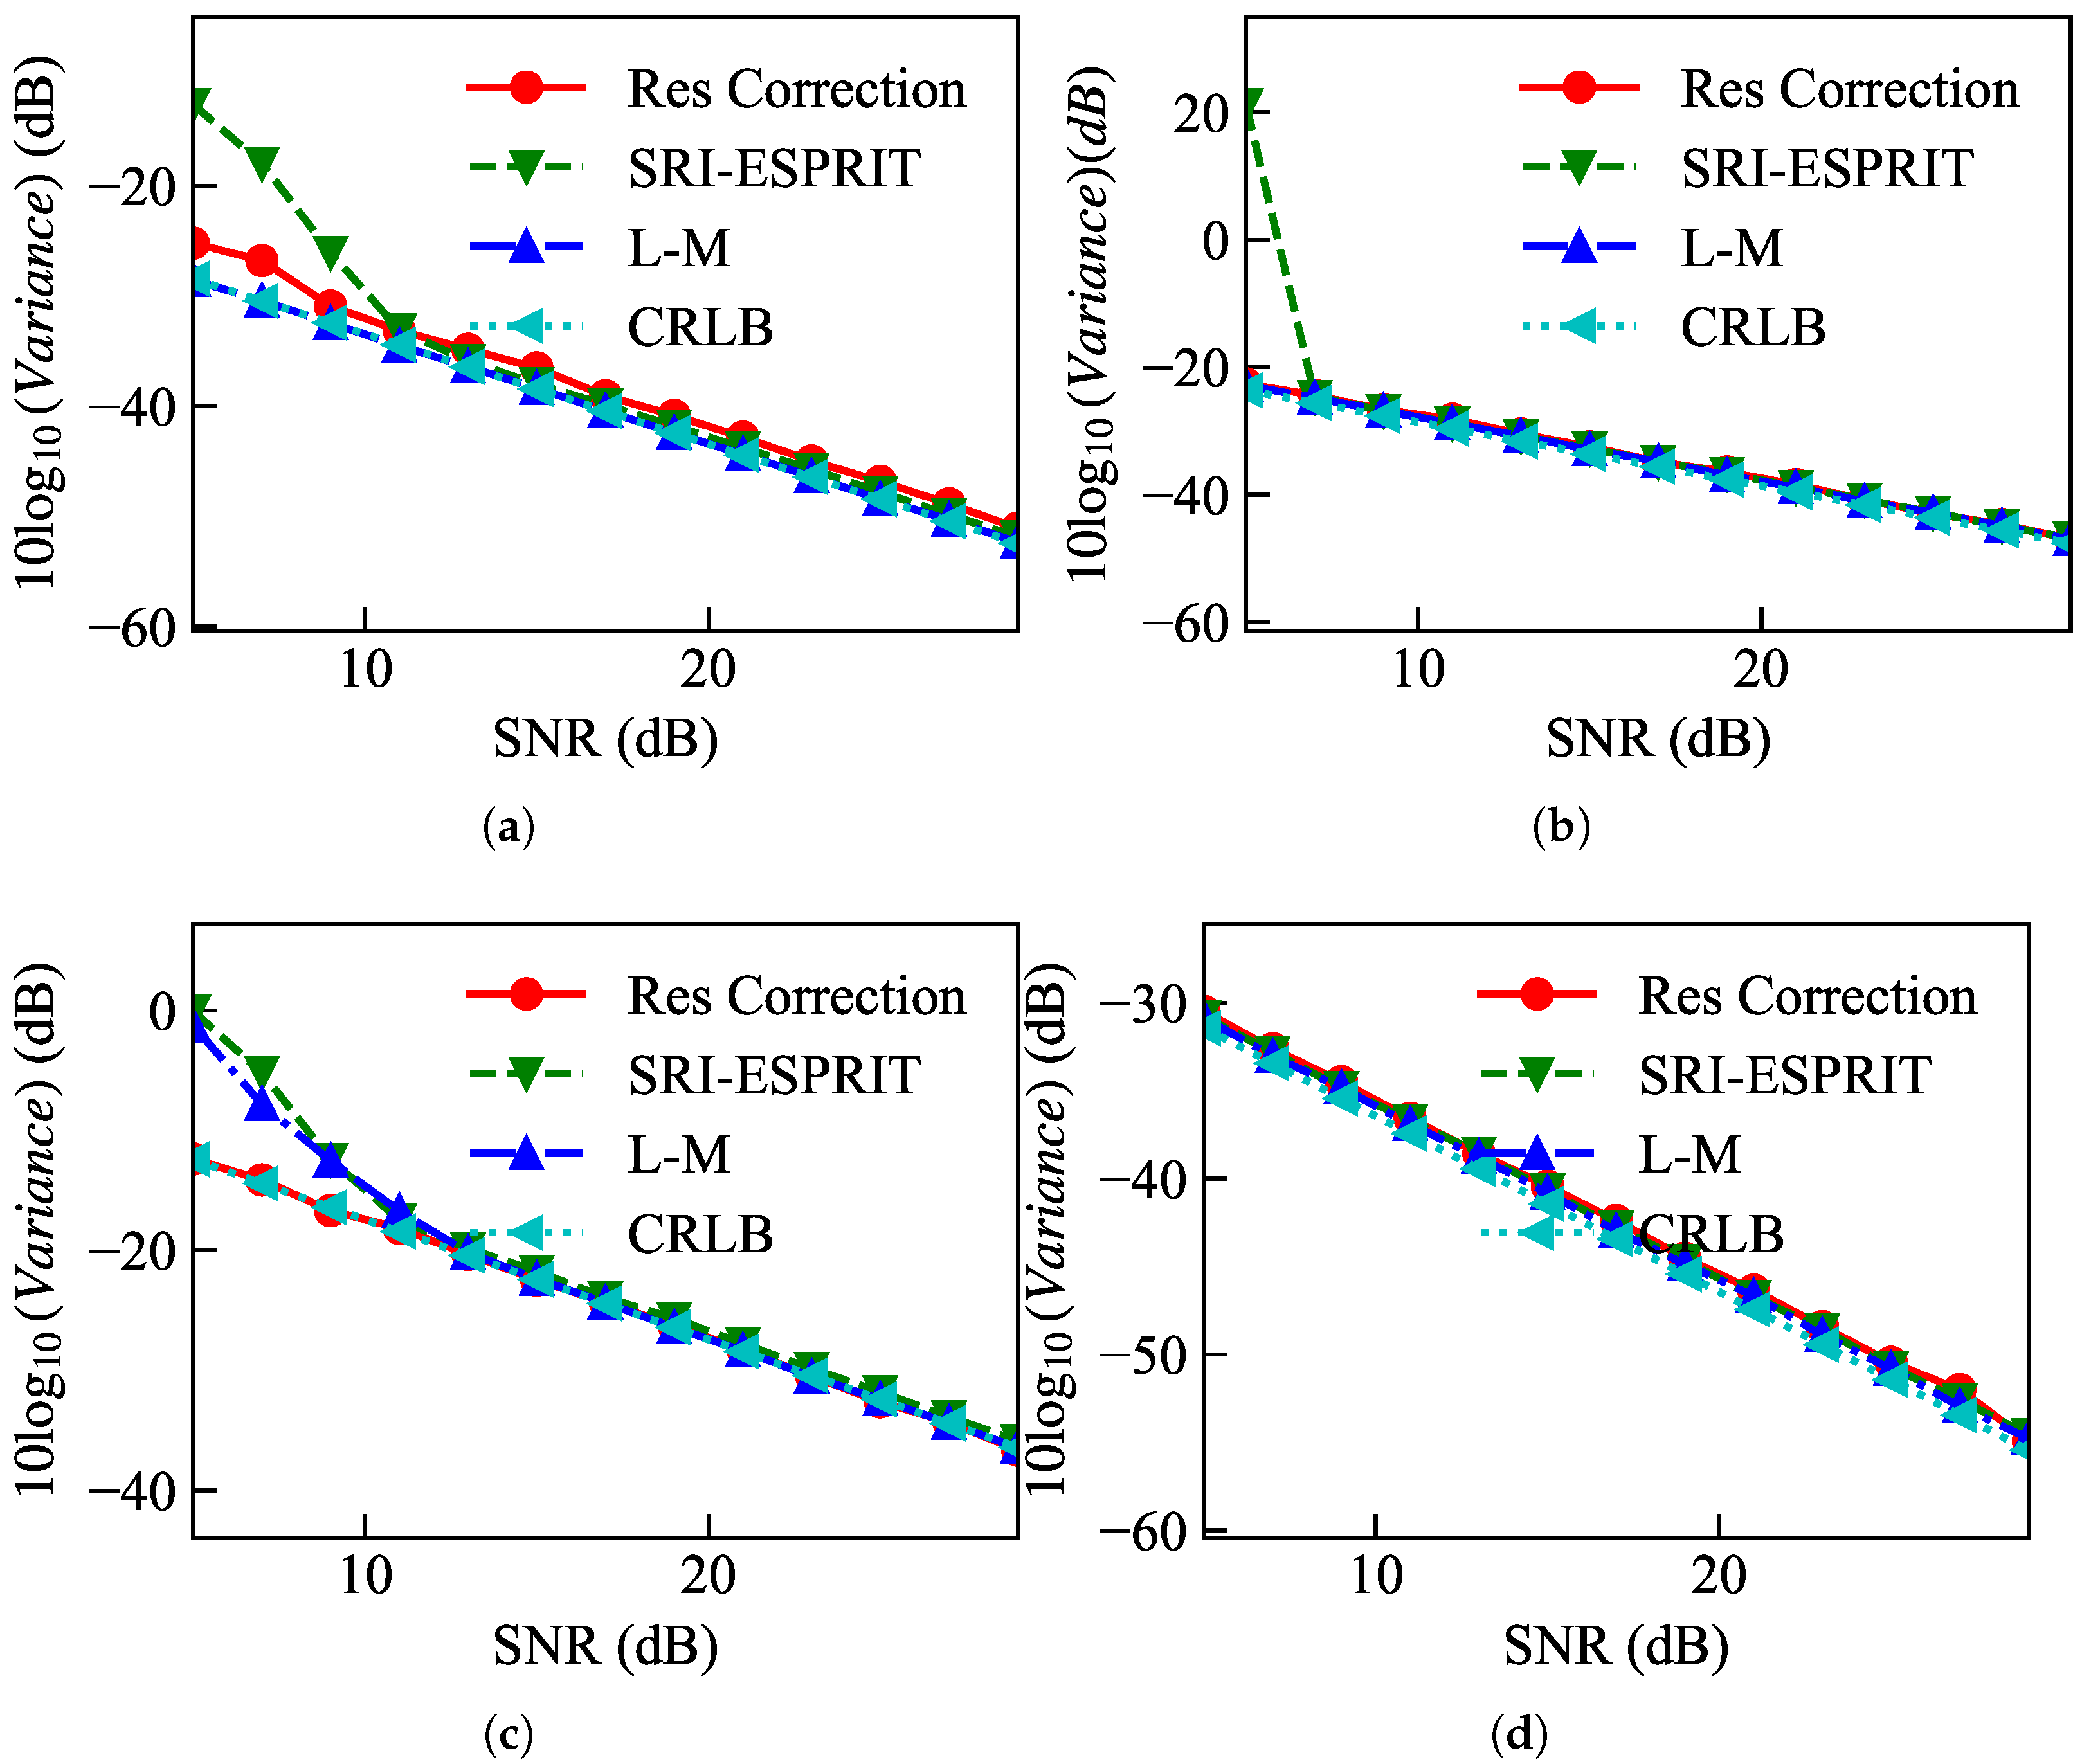
Figure 6 illustrates the performance of different parameter estimation methods under various signal-to-noise ratios. It can be observed that the parameter estimation accuracy of SRI-ESPRIT, Residual Correction, and the L-M algorithm is close to the CRLB. Overall, the SRI-ESPRIT method exhibits the highest parameter estimation accuracy. However, during the process of scatter center matching and association, the estimation of amplitude and bias for different forms of micro-Doppler curves is required. The L-M algorithm and Residual Correction algorithm fail for cosine signals. Therefore, the method adopted in this paper demonstrates superiority in terms of accuracy and stability in parameter estimation.
For the bottom scatter center, after estimating
f and
using SRI-ESPRIT, the micro-Doppler decomposition coefficients are obtained through the least squares method. The variances of the decomposition coefficients under different signal-to-noise ratios are shown in
Figure 7. It can be observed that as the signal-to-noise ratio increases, the variance of the decomposition coefficients gradually decreases, indicating an improvement in parameter estimation accuracy. The estimated variance of
is close to the CRLB, while the estimated variance of
is slightly larger than the CRLB, differing by approximately 5 dB. The variances of higher-order decomposition coefficients are even larger, indicating their unsuitability for parameter estimation, which is consistent with theoretical analysis.
5.4. Validation of Multidimensional Parameter Estimation
We construct an optimization model to solve the multidimensional parameters of the spatial target. Solving the optimization problem yields the parameter estimation results . Below, we analyze the parameter estimation results for three scenarios: , , and .
When solving the multi-dimensional parameter estimation model, the parameters are set as
m],
,
, and
within their respective ranges. The parameters are randomly initialized within these constraints.
Table 5 presents the parameter estimation results for the case of
. It can be observed that the RE of
is relatively large at
. This is because the value set for
itself is too small, and furthermore, the estimated value of
is not involved in target identification. The REs of
and H are both less than
, while those of h and r are
and
respectively. The RMSE of all parameters is below 0.06, indicating relatively accurate parameter estimation results.
When
, all three scatter centers
A,
B, and
C are observable.
Table 6 presents the parameter estimation results using only scatter centers
A and
B. Compared to the results obtained when
, the REs of
and
have increased slightly. However, the RE of parameters
,
H,
h, and
r are relatively small, indicating that the radar line of sight angle affects the estimation accuracy of different parameters. The RMSE values are all below 0.4, indicating accurate parameter estimation results.
The different combinations of the three micro-Doppler curves, , , and , provide more possibilities for the estimation of multi-dimensional parameters of the spatial target, assuming that the combinations of solved micro-Doppler curves include , , , , and , where A, B, C, and denote the labels of , , , and , respectively.
Table 7 shows the REs under different combination scenarios. The RE of each parameter under
is shown in
Table 6. It can be observed that when using
, the RE of
H is the smallest, at 0.0542%. Adding the micro-Doppler curve
or
reduces the REs of
. When only using
, the RE of each parameter is relatively large, indicating that the information provided by the micro-Doppler parameters is insufficient.
Using , the REs of h and r are the smallest, at 0.0591% and 0.0083%, respectively. Adding the micro-Doppler curve increases the REs of r and h, but at this point, the REs of estimation results are the smallest among all combinations, at 1.1698%, 0.167%, and 0.7722%, respectively.
Overall, increasing the amount of information improves the accuracy of parameter estimation, but different micro-Doppler curves have varying impacts on the estimation accuracy of different parameters due to differences in the information they provide.
Table 8 presents the parameter estimation results when
. It can be observed that the estimation accuracy of
is relatively high, with an RE of 0.2148%. The RE of
and
r are below 20%, while the estimation accuracy of other parameters is relatively poor. The RMSE values of all parameters are below 0.5. This is mainly because of the poor observation angle and the insufficient information provided by the two scatter centers at the cone bottom due to their similar expressions. In such cases, multiple radar perspectives are required to improve the accuracy of the parameter estimation.
When observing the spatial target with two radars, with viewing angles
and
where
corresponds to the selection of micro-Doppler curves
,
Table 9 shows the results of multidimensional parameter estimation. Comparing the results between
Table 7 and
Table 9 for the single-view case, it can be observed that in the case of dual views, all parameters can be estimated simultaneously with the smallest RE, all below 1.15%. The RMSE values are all below 0.05, indicating accurate and stable parameter estimation results. The redundant information provided by multi-view observations effectively improves the accuracy of multidimensional parameter estimation for spatial targets.
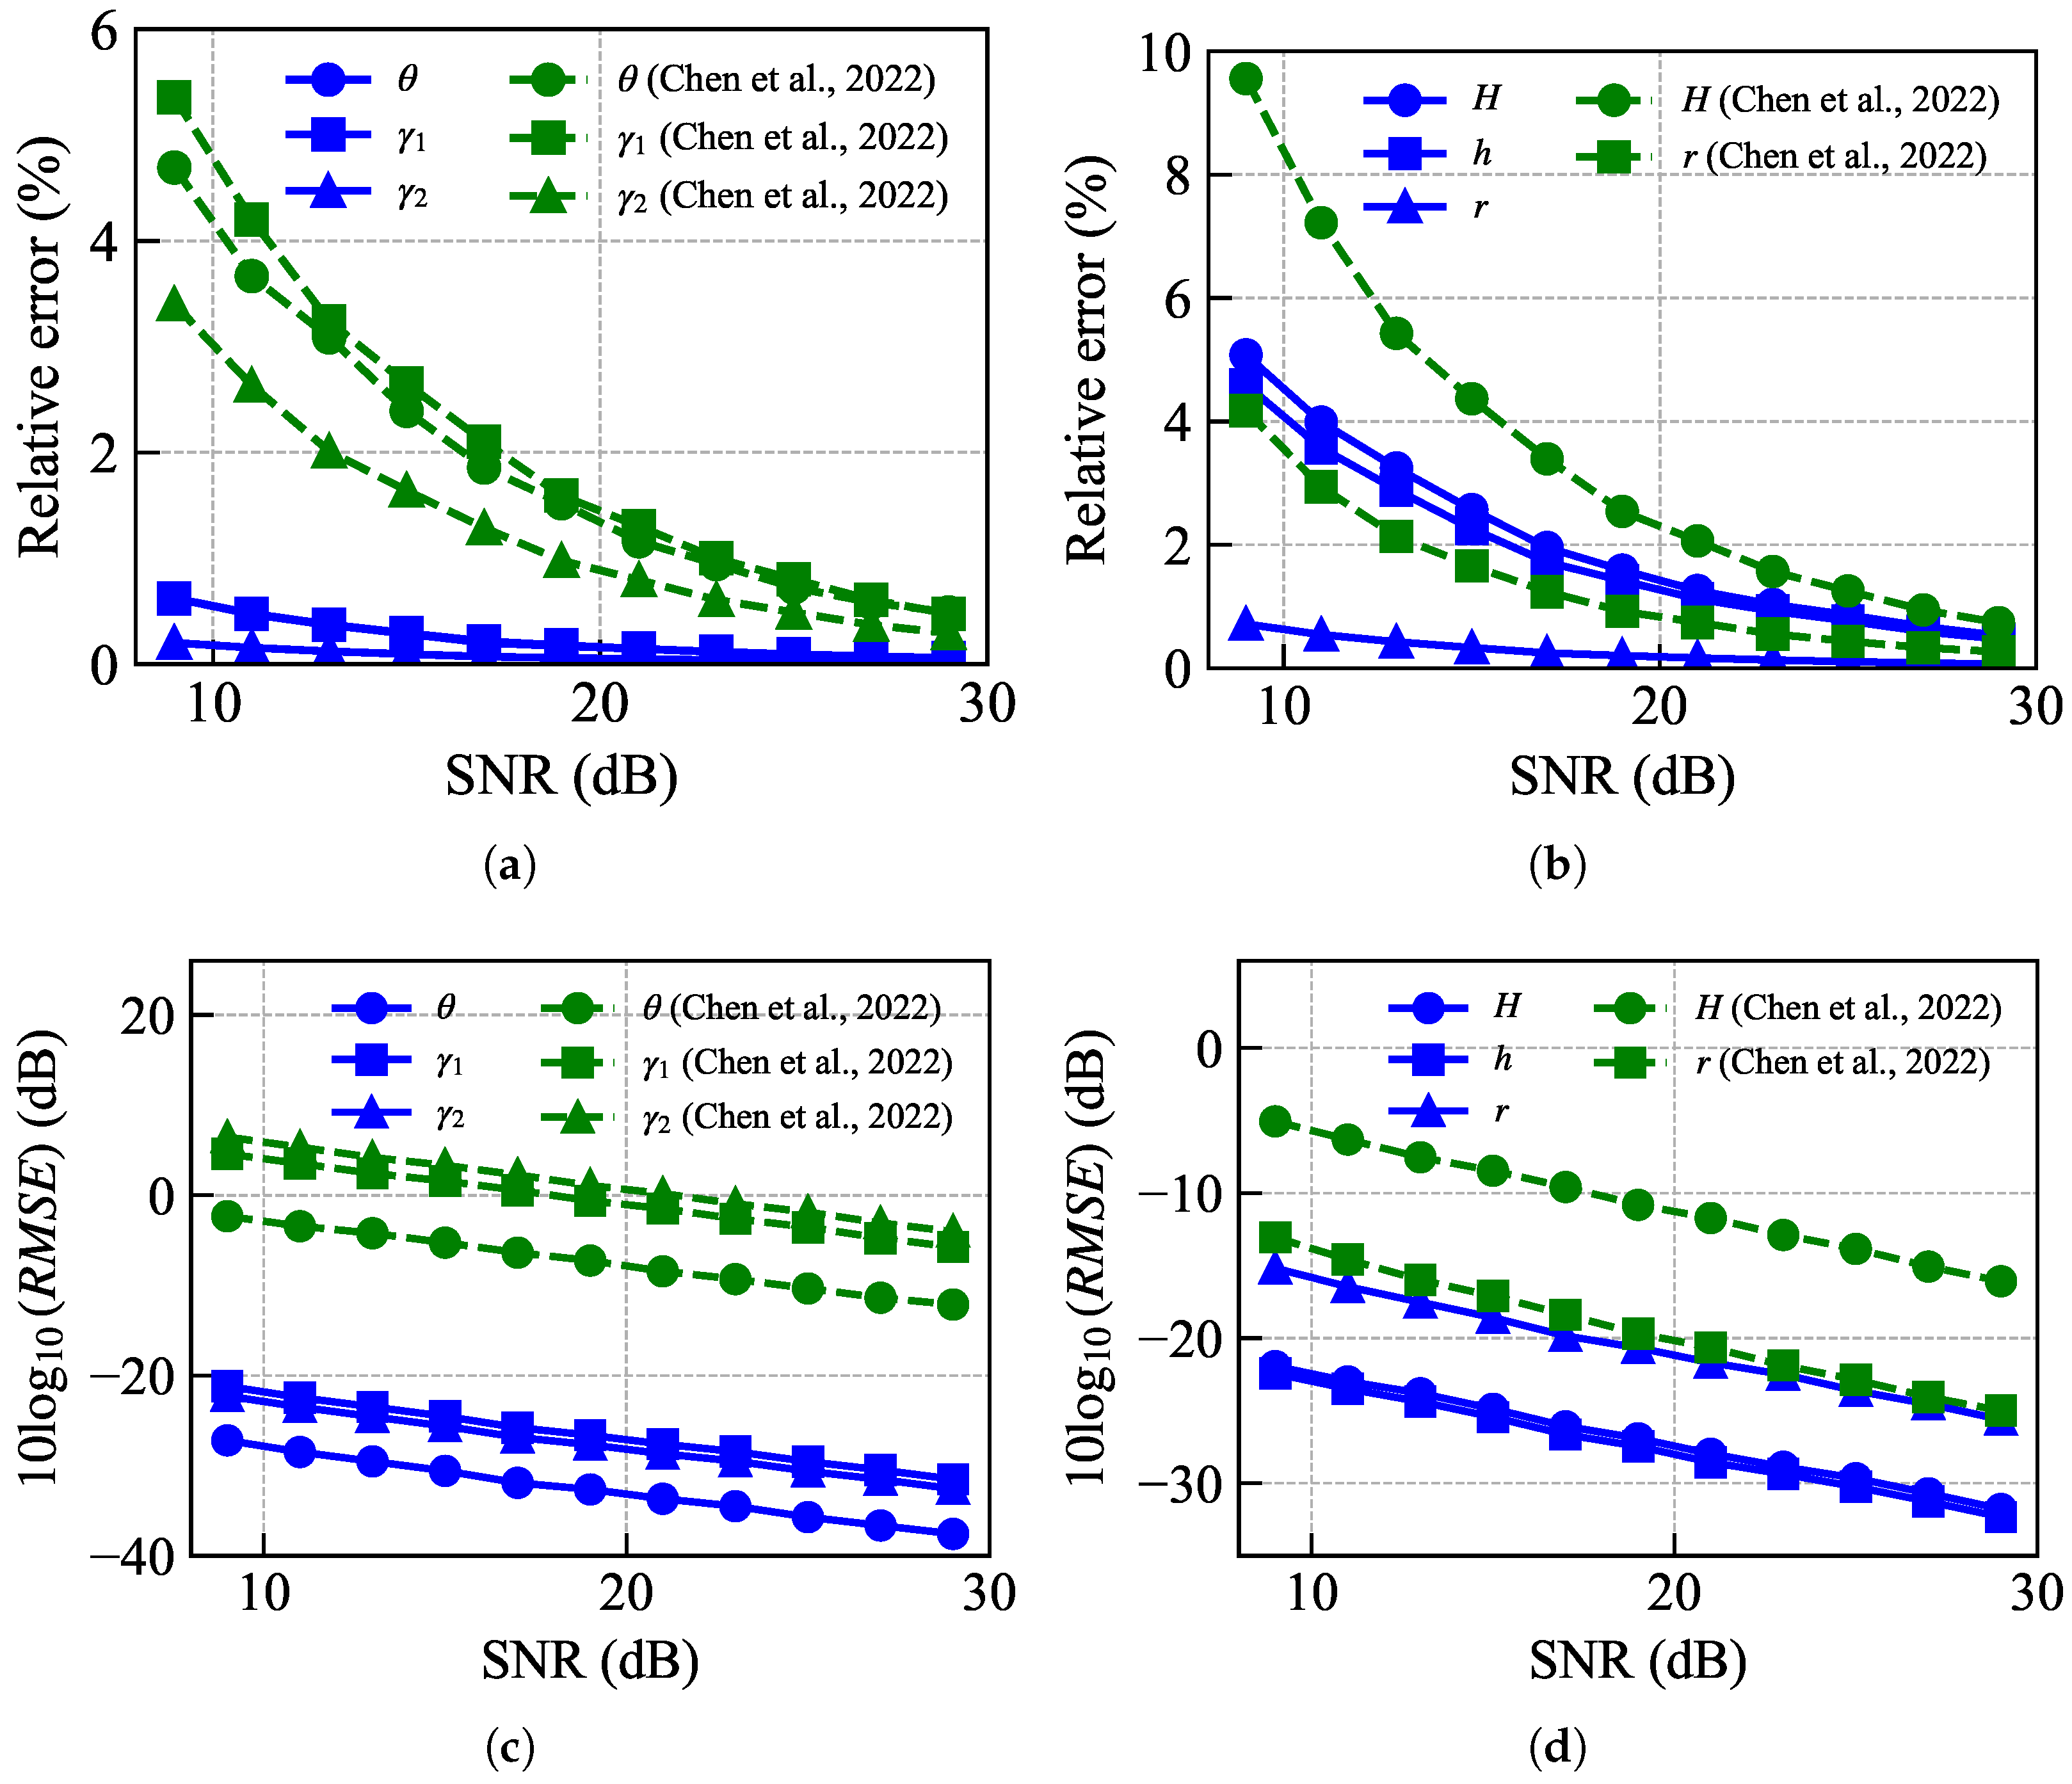
Finally, under double-view observation, we compared the multidimensional parameter estimation method proposed by Chen et al. (2022) [
10]. The relative errors (REs) under different signal-to-noise ratios are shown in
Figure 8a,b. When the SNR decreases, increased noise in the HRRP signal can distort the shape and continuity of the extracted micro-range curves. Super-resolution frequency estimation algorithms, such as SRI-ESPRIT, are also sensitive to noise, which negatively affects the estimation of micro-range coefficients and reduces the reliability of scattering center association and parameter fitting. These factors severely degrade the accuracy of multidimensional parameter estimation. It can be observed that the RE of the estimated value of
,
and
using the proposed method is smaller than that of Chen et al. (2022) [
10]. In addition, the REs of the estimated values of
H and
h are all smaller when using the proposed method. The performance of the two algorithms varies relative to each other; however, the proposed algorithm exhibits significantly better mean square errors compared to Chen et al. (2022) [
10], as shown in
Figure 8c,d.
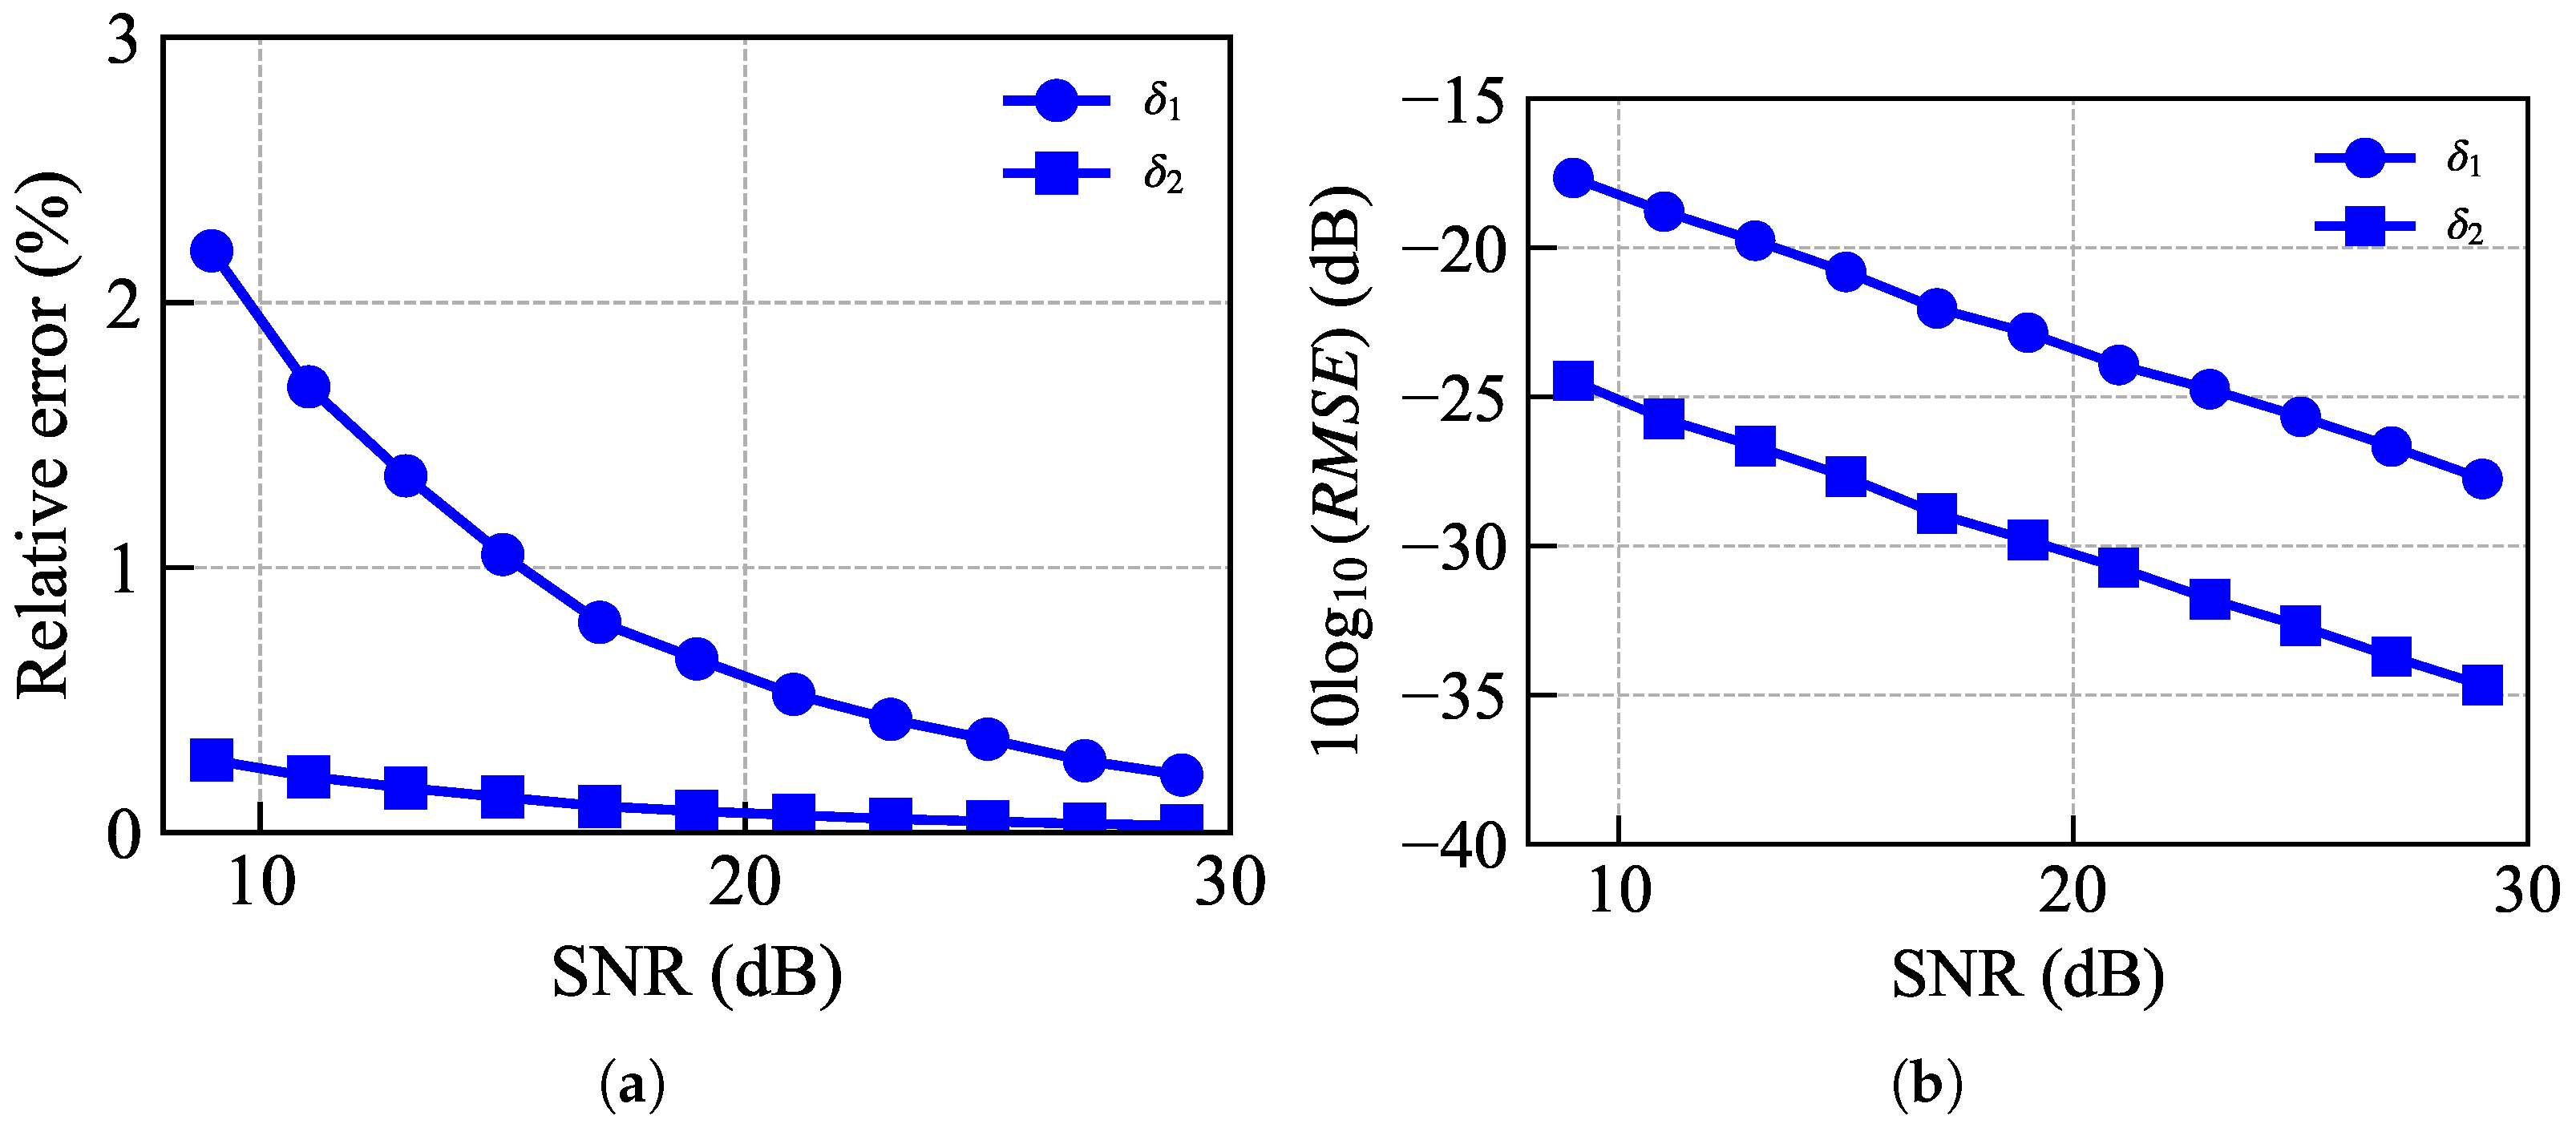
Additionally, the proposed algorithm can effectively estimate the multi-dimensional parameters
and
, as shown in
Figure 9a,b. It can be observed that the RE and mean square errors of
and
are both below 20% and −15 dB, respectively. The proposed method can mitigate the influence of the target center of gravity and reference distance on parameter estimation performance.
In summary, the proposed method effectively addresses the challenge of multi-dimensional parameter estimation for spatial targets under single and multi-view angles, demonstrating higher accuracy and robustness.


