Article

Advanced Building Detection with Faster R-CNN Using Elliptical Bounding Boxes for Displacement Handling

1
Department of Convergence and Fusion System Engineering, Kyungpook National University, Sangju 37224, Republic of Korea
2
Department of Location-Based Information System, Kyungpook National University, Sangju 37224, Republic of Korea
3
Research Institute of Artificial Intelligent Diagnosis Technology for Multi-Scale Organic and Inorganic Structure, Kyungpook National University, Sangju 37224, Republic of Korea
*
Author to whom correspondence should be addressed.
Remote Sens. 2025, 17(7), 1247; https://doi.org/10.3390/rs17071247
Submission received: 12 February 2025 / Revised: 28 March 2025 / Accepted: 29 March 2025 / Published: 1 April 2025

Abstract

:
This study presents an enhanced Faster R-CNN framework that incorporates elliptical bounding boxes to significantly improve building detection in off-nadir imagery, effectively reducing severe geometric distortions caused by oblique sensor angles. Off-nadir imagery enhances architectural detail capture and reduces occlusions, but conventional bounding boxes, such as axis-aligned and rotated bounding boxes, often fail to localize buildings distorted by extreme perspectives. We propose a hybrid method integrating elliptical bounding boxes for curved structures and rotated bounding boxes for tilted buildings, achieving more precise shape approximation. In addition, our model incorporates a squeeze-and-excitation mechanism to refine feature representation, suppress background noise, and enhance object boundary alignment, leading to superior detection accuracy. Experimental results on the BONAI dataset demonstrate that our approach achieves a detection rate of 91.96%, significantly outperforming axis-aligned bounding boxes (65.75%) and rotated bounding boxes (87.13%) in detecting irregular and distorted buildings. By providing a highly robust and adaptable detection strategy, our approach establishes a new standard for accurate and shape-aware building recognition in off-nadir imagery, significantly improving the detection of distorted, rotated, and irregular structures.

1. Introduction

1.1. Background and Motivation

Rapid urbanization has transformed cities into densely populated and architecturally complex environments, increasing the demand for accurate building detection technologies. These technologies are vital for urban planning, disaster management, infrastructure inspection, and smart city development [1,2]. In particular, advances in remote sensing technologies, mainly through high-resolution satellite or aerial imagery, have enabled researchers worldwide to automatically identify and analyze the locations, sizes, and shapes of buildings, contributing significantly to urban studies [3,4]. However, real-world urban environments present complexities that conventional methods fail to address, particularly in off-nadir imagery.
Off-nadir imagery, captured at oblique angles, provides unique perspectives that reveal critical structural details, such as facades, side walls, and roof tilts—features often hidden in conventional nadir imagery. By allowing a more comprehensive understanding of the three-dimensional structures of buildings, off-nadir imagery offers significant advantages, especially for detecting high-rise or architecturally intricate buildings in dense urban environments [5,6]. Moreover, off-nadir imagery reduces occlusions caused by overlapping structures in nadir imagery, allowing for a more accurate analysis of buildings’ complete forms. This capability is particularly beneficial for urban planning, where capturing detailed and precise building geometries is essential for infrastructure monitoring, population density analysis, and regulatory compliance.
Despite its advantages, off-nadir imagery presents significant challenges that adversely affect detection accuracy. One major issue is geometric distortion, where buildings appear skewed or stretched because of oblique viewing angles. This distortion complicates the alignment of detection boundaries, reducing the precision of detection models [7,8]. Furthermore, variations in lighting and shadows in off-nadir imagery significantly reduce detection accuracy, as elongated shadows and inconsistent illumination obscure key building features, making precise boundary identification challenging [8]. Occlusions and overlaps between buildings in densely populated urban areas further exacerbate these problems, leading to segmentation errors and reduced detection reliability [9]. Moreover, the need for additional preprocessing steps, such as geometric correction and alignment, increases computational complexity and processing time, limiting the practicality of off-nadir imagery in real-time detection scenarios [10].
Existing building detection methods primarily utilize axis-aligned or rotated bounding boxes, which inadequately represent geometric variations in off-nadir imagery. Axis-aligned boxes fail to align with tilted, elongated, or irregular structures, while rotated boxes struggle to accommodate curved or highly irregular shapes, particularly under severe perspective distortions [11,12].
Both methods introduce redundant background or miss key structural details, reducing boundary precision [13]. While instance segmentation methods, such as Mask R-CNN, have been widely adopted for fine-grained object boundary delineation, they pose significant limitations for large-scale building detection tasks. These approaches typically require pixel-level annotations and incur high computational costs, making them less suitable for operational deployment in urban-scale applications, particularly under off-nadir imaging conditions where variability is high. In contrast, bounding box-based methods offer a more computationally efficient and scalable alternative, especially when enhanced with advanced techniques such as rotated and elliptical bounding boxes to better capture geometrically distorted and irregular building structures. To overcome this, we introduce elliptical bounding boxes, which better approximate building outlines, reduce false detections, and improve localization. A squeeze-and-excitation (SE) mechanism further enhances feature representation by suppressing noise and refining object distinction. Experimental results on the BONAI dataset reveal significant improvements, particularly for buildings with extreme aspect ratios and complex geometries [12].
For example, buildings with curved or asymmetrical shapes present significant challenges because rectangular bounding boxes cannot accurately capture their true boundaries, reducing detection reliability. To mitigate these issues, researchers have developed rotated bounding boxes that align with the orientation of tilted buildings and elliptical bounding boxes, specifically designed to enclose curved and asymmetrical geometries [5,14,15]. These advanced techniques offer promising solutions for improving detection accuracy in urban environments with diverse building shapes.
Many existing studies concentrate on building rooftops or footprints [16], often failing to consider the entire structural form of buildings [17,18], thereby limiting their applicability in comprehensive urban analysis. While useful for some applications, this approach fails to capture essential structural characteristics such as height, tilt, and exterior design—features crucial for architectural and engineering analyses like stability assessments, structural defect analysis, and maintenance planning [19]. Detecting the complete shape of buildings yields a robust dataset for advanced urban planning, enabling traffic optimization, strategic public facility placement, and sunlight access regulation in dense urban areas. Moreover, precise structural detection enhances energy efficiency analysis by accounting for key architectural features, such as window layouts, roof configurations, and exterior materials, which influence energy consumption patterns [20,21].
High-rise buildings present additional complexities owing to their impact on urban density, traffic congestion, and resource distribution. Detecting their complete shapes allows for more precise space occupancy and population density analyses, contributing to effective urban resource management. Moreover, accurate detection ensures compliance with architectural regulations, such as height restrictions and structural stability standards, thereby promoting safety and legality in urban environments [22].
Given these challenges, there is a pressing need for innovative methods to enhance building detection in off-nadir imagery. This study is motivated by the necessity to address these gaps by leveraging advanced bounding box techniques, such as rotated and elliptical bounding boxes, to improve detection accuracy. This study attempts to provide robust solutions for detecting complex building geometries in real-world urban settings by tackling issues such as geometric distortion, shadowing effects, and occlusions. Furthermore, optimizing these techniques for computational efficiency ensures that the proposed methods are practical for real-time applications, supporting their integration into diverse urban management and planning workflows.
In conclusion, off-nadir imagery offers significant opportunities for building detection but also presents challenges that demand innovative solutions. This study seeks to introduce methodologies that mitigate the drawbacks of off-nadir imagery while leveraging its strengths. The study attempts to advance building detection technologies through these contributions, supporting sustainable and efficient urban development.

1.2. Research Objectives

This study introduces an advanced bounding-box representation method designed to alleviate detection accuracy loss stemming from geometric distortions, shadows, and occlusions, without explicitly resolving each issue in off-nadir imagery.
In Vision AI, object detection models commonly utilize axis-aligned rectangular bounding boxes to enclose detected objects. While this method effectively identifies objects’ general location within an image, it often includes irrelevant background information along with the object itself. This issue is particularly problematic when detecting diagonally elongated objects, such as buildings with structural displacement, where the object may occupy only a small portion of the bounding box, resulting in more background information being captured than the object [23]. These limitations become increasingly pronounced in urban environments, where buildings frequently exhibit complex structures, irregular orientations, or curved outlines. Furthermore, real-world photos are rarely taken under ideal conditions, making it uncommon for objects to fit perfectly within axis-aligned rectangular bounding boxes.
This study attempts to improve building detection accuracy in off-nadir imagery by optimizing the region proposal network (RPN) in Faster R-CNN. Specifically, we introduce elliptical bounding boxes to enhance detection performance for irregularly shaped buildings. We address key challenges such as geometric distortions, occlusions, and excessive background noise that hinder traditional bounding box methods. Unlike axis-aligned and rotated bounding boxes, which struggle with complex structures, elliptical bounding boxes better approximate building contours, improving localization accuracy. We validate our approach by comparing elliptical and rotated bounding boxes, highlighting their superior ability to detect distorted, elongated, and curved buildings in off-nadir imagery.
The first objective is to utilize rotated bounding boxes as a baseline for detecting buildings with structural displacements. These boxes help align detection with real-world building orientations, minimizing background noise and improving localization accuracy. By comparing their performance, we can better understand the role of elliptical bounding boxes in diverse urban settings. The primary objective is to develop and implement elliptical bounding boxes for detecting irregular or curved building structures. Unlike rotated bounding boxes, which are effective for rigid forms, elliptical bounding boxes are designed to represent asymmetrical or curved geometries. This capability allows for a more precise and accurate representation of complex architectural forms, addressing the inadequacy of conventional bounding boxes in representing such structures.
This study utilizes real-world building datasets featuring various urban environments to validate the effectiveness of the proposed methods. These datasets include densely populated areas with overlapping and occluded structures and buildings captured under different imaging conditions, such as off-nadir angles and variable lighting. By thoroughly testing the proposed model on these datasets, the study attempts to ensure its generalizability and robustness in real-world applications.
Beyond enhancing detection accuracy, this study seeks to optimize the computational efficiency of the proposed methods. While incorporating rotated and elliptical bounding boxes improves detection performance, it also increases computational demands, particularly in region proposal and bounding box alignment. To address this, the study investigates algorithmic refinements to reduce the computational load, ensuring the model remains viable for real-time applications. Achieving this balance between accuracy and efficiency is essential for facilitating the broader adoption of the proposed approach in urban planning, disaster response, and smart city development.
Finally, this study attempts to contribute to the broader field of object detection in Vision AI by advancing methodologies for detecting irregular and complex-shaped objects in challenging imaging conditions. This study supports the development of scalable and adaptable detection technologies by addressing the specific challenges posed by off-nadir imagery and providing innovative bounding box solutions. These technologies significantly impact urban management, enabling more precise planning, energy efficiency evaluations, and regulatory compliance assessments.
In conclusion, this study proposes an advanced Faster R-CNN-based building detection model incorporating elliptical bounding boxes as a primary tool for improving detection accuracy in off-nadir imagery. The model enhances the detection of buildings with structural displacements and irregular shapes by addressing issues such as geometric distortions, occlusions, and inadequate boundary representation. Rotated bounding boxes serve as a comparative benchmark to validate the performance of elliptical bounding boxes. This comprehensive approach contributes to scalable and practical building detection solutions, fostering improved urban management and planning.

2. Related Work

2.1. Challenges in Building Detection and the Role of Bounding Box Design

Building detection in very high-resolution (VHR) imagery, particularly under off-nadir conditions and in the presence of geometric distortions and spectrally similar surroundings such as roads and bare ground, remains challenging due to the intricate nature of building structures [24,25]. Continuous research has driven significant technological advancements to overcome these complexities.
Initial approaches relied on edge detection [26] and spectral classification utilizing support vector machines (SVMs) [24] to distinguish buildings from non-building areas. Deep belief networks (DBNs) marked one of the earliest uses of deep learning in remote sensing for building detection [27]. However, these methods struggled to differentiate buildings in environments with high spectral similarity, such as between roads and rooftops. This limitation suggests a need for more robust feature extraction methods to differentiate spectral similarities effectively.
Deep learning methods have significantly advanced building detection, particularly in urban environments. Fully convolutional networks (FCNs) [28] and U-Net [29] have improved segmentation accuracy, while DHAU-Net has further enhanced detail preservation and reduced misclassification in complex environments [30]. However, challenges remain in densely populated areas where shadows or occlusions obscure buildings. To mitigate these issues, integrating attention mechanisms or leveraging spatial relationships within segmentation networks can enhance detection robustness.
Rule-based methods leverage buildings’ geometric, spectral, and textural characteristics to provide a cost-efficient and semi-automated detection framework [31]. For example, the rectangular shape of buildings and their isotropic spatial properties have been utilized for detection [32]. Rule-based approaches perform well in simple cases but fail to adapt to irregular or curved structures. This shortcoming makes non-rectangular bounding boxes, particularly elliptical ones, more suitable for complex geometries. The spatial relationships between buildings and their surroundings play a crucial role in improving detection accuracy [33]. Shadows in particular provide valuable structural cues that enhance building detection in urban environments [18,34]. However, shadow-based methods can be unreliable when shadows overlap or obscure parts of a building. Incorporating multispectral data or applying shadow correction algorithms can help mitigate this issue. The field has recently expanded to include transformer-based architectures [35] and generative adversarial networks (GANs) for refining building footprints [36]. Techniques such as LiDAR-optical data fusion [37] and super-resolution [38] have also significantly enhanced accuracy, particularly for small or occluded buildings. However, the computational complexity of these models necessitates optimization techniques or lightweight architectures for practical deployment.

2.2. Limitations of Building Detection Based on Nadir Imagery

Nadir imagery, captured vertically, minimizes geometric distortions and accurately depicts building footprints and layouts [39]. This makes it particularly effective for large-scale urban analysis and mapping [40].
Despite its advantages, nadir imagery has limitations. It struggles to capture the height and side facades of buildings, limiting its effectiveness in detecting tall or complex structures [41]. Buildings on inclined surfaces are often distorted or inaccurately represented [9]. Shadows and overlapping structures in dense urban environments reduce the clarity of building boundaries, leading to lower detection reliability [42,43].
This study addresses these challenges by employing off-nadir imagery to capture the three-dimensional structure and curvature of buildings. Moreover, integrating DEM or DSM terrain models with nadir imagery refines height and slope measurements, improving detection in sloped environments.

2.3. Object Detection in Off-Nadir Imagery

Off-nadir imagery, captured at oblique angles, offers a richer representation of buildings, including their side facades and 3D structures. This perspective enhances detection in complex urban and sloped environments [44].
Conventional rectangular bounding boxes struggle with curved or sloped structures in off-nadir imagery. Solutions such as rotation-adaptive YOLO models [45] and metadata-based corrections [8] address some of these challenges but remain limited in adaptability to curved geometries. This study proposes elliptical bounding boxes as a more versatile solution for detecting irregular and curved structures frequently distorted in off-nadir imagery.
Attention mechanisms and multi-task models have also effectively mitigated occlusion and distortion issues [46]. To further enhance these methods, integrating off-nadir angle metadata and context-based constraints can improve accuracy in highly distorted environments.

2.4. Rotated and Non-Rectangular Bounding Boxes in Remote Sensing

Research has explored alternative bounding box approaches to address the challenges posed by off-nadir imagery. Rotated bounding boxes, designed to align with object orientations, improve detection of skewed or tilted structures [12,47]. While effective for aligned or rotated structures, their performance decreases for curved or irregular geometries. Elliptical bounding boxes offer a more versatile solution for curved and irregularly shaped buildings, addressing these limitations [14,48]. Polygonal bounding boxes provide precise boundary detection for complex shapes but require higher computational resources [49].
This study investigates the use of elliptical bounding boxes to improve detection accuracy for curved and irregular buildings, with rotated bounding boxes serving as a baseline for performance evaluation. By integrating attention-based methods and optimizing computational efficiency, this approach seeks to address the limitations of existing detection techniques.

3. Methodology

Conventional bounding boxes, such as axis-aligned and rotated bounding boxes, struggle to accurately detect irregular and curved buildings in off-nadir imagery because of geometric distortions, elevation displacement, and occlusions. This study introduces elliptical bounding boxes within a Faster R-CNN framework to address these limitations, providing a more adaptable representation for distorted building shapes. All three bounding box configurations—axis-aligned, rotated, and elliptical—were implemented and trained within this unified framework to ensure consistent and fair performance comparisons. Unlike conventional bounding boxes, which often fail to encapsulate complex contours, elliptical bounding boxes better approximate real building geometries, reducing false detections and improving localization accuracy.
This approach is further enhanced by incorporating a channel attention mechanism, which prioritizes critical features and refines boundary alignment by reducing multi-channel feature maps into a single 2D activation map. An algorithm is proposed to generate rotated and elliptical anchor boxes to effectively implement this, transforming feature map-derived anchor boxes into shape-adaptive detection regions.
Our methodology follows a three-step process:
  • Feature extraction using ResNet-50-FPN to capture multi-scale building representations.
  • Region proposal using elliptical bounding boxes to improve adaptability to complex shapes.
  • Final detection and classification via a Faster R-CNN framework optimized for off-nadir building detection.
To assess the effectiveness of elliptical bounding boxes, buildings are divided into two categories:
  • Regular buildings, with aspect ratios close to 1 and minimal rotation angles.
  • Irregular buildings, with extreme aspect ratios or significant rotation angles.
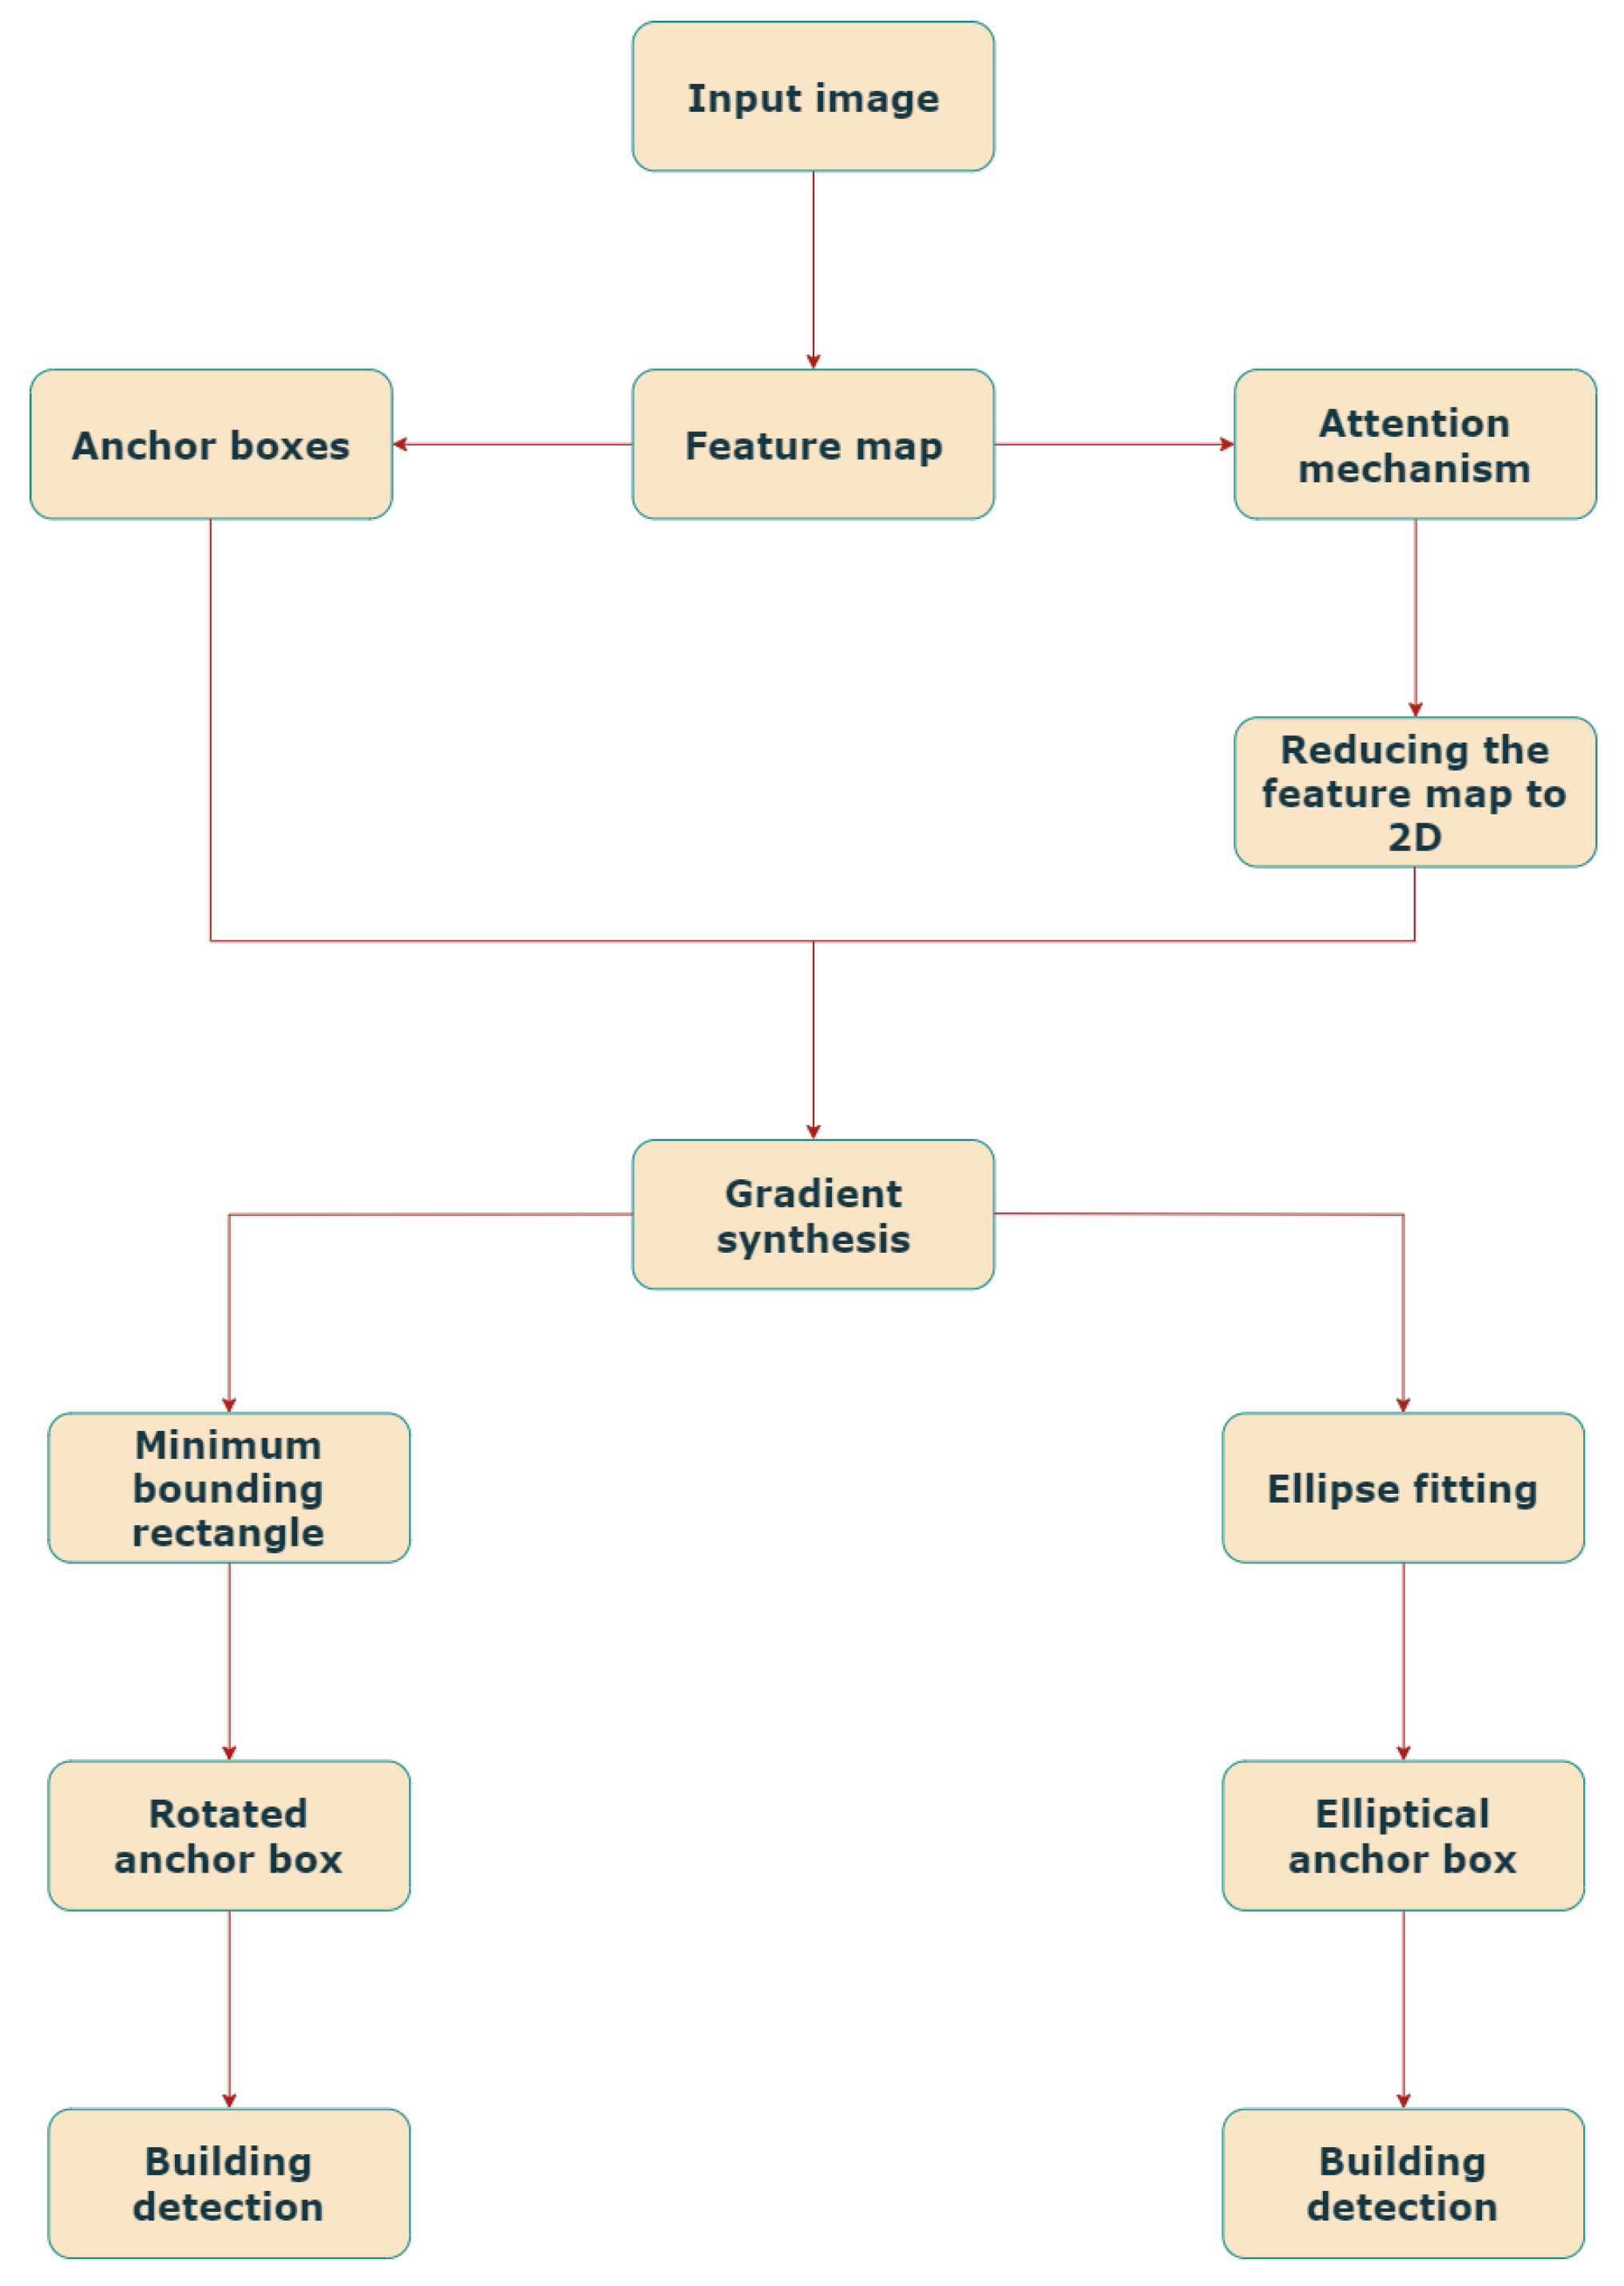
Comparing elliptical and rotated bounding boxes reveals their effectiveness in detecting distorted, elongated, and curved structures. The results indicate that elliptical bounding boxes outperform conventional methods in handling complex off-nadir building geometries, particularly in cases with extreme shape irregularities. This analysis confirms their advantage as a more adaptable and precise detection framework for diverse urban environments.

3.1. Faster R-CNN

Faster R-CNN is a deep learning model adopted for object detection. It processes an image through a CNN to generate a feature map, which captures spatial and visual details. Based on this feature map, an RPN identifies candidate object regions by applying anchor boxes of different sizes and aspect ratios. These regions are refined through RoI pooling and classification to determine object presence and category. The RPN predicts whether an object is present for each anchor box and calculates offsets to refine the bounding box, leading to the most accurate candidate regions.
RoI pooling then converts the proposed regions into a fixed-size feature map, ensuring that the CNN’s classifier and regressor can uniformly process regions of different sizes. This step is crucial for accurately predicting the object’s class and position while maintaining a consistent input size for efficient learning. After RoI pooling, each region is passed through the classifier and bounding box regressor to identify the object’s class and refine its location.
The core of Faster R-CNN involves applying a sliding window across the feature maps generated by convolution to create multiple rectangular bounding boxes of different sizes centered around the anchor point. It also calculates a priority score for each bounding box, optimizing the detection process.
This study proposes an enhanced method for building detection in off-nadir imagery by extending the anchor box generation process in the RPN of Faster R-CNN. Unlike conventional axis-aligned anchor boxes directly derived from the feature map, our approach introduces additional computational steps to generate rotated and elliptical bounding boxes, enabling better alignment with distorted building shapes caused by perspective effects (Figure 1).
The initial axis-aligned anchor boxes serve as regions of interest (RoIs) and are further refined through a multi-step transformation process:
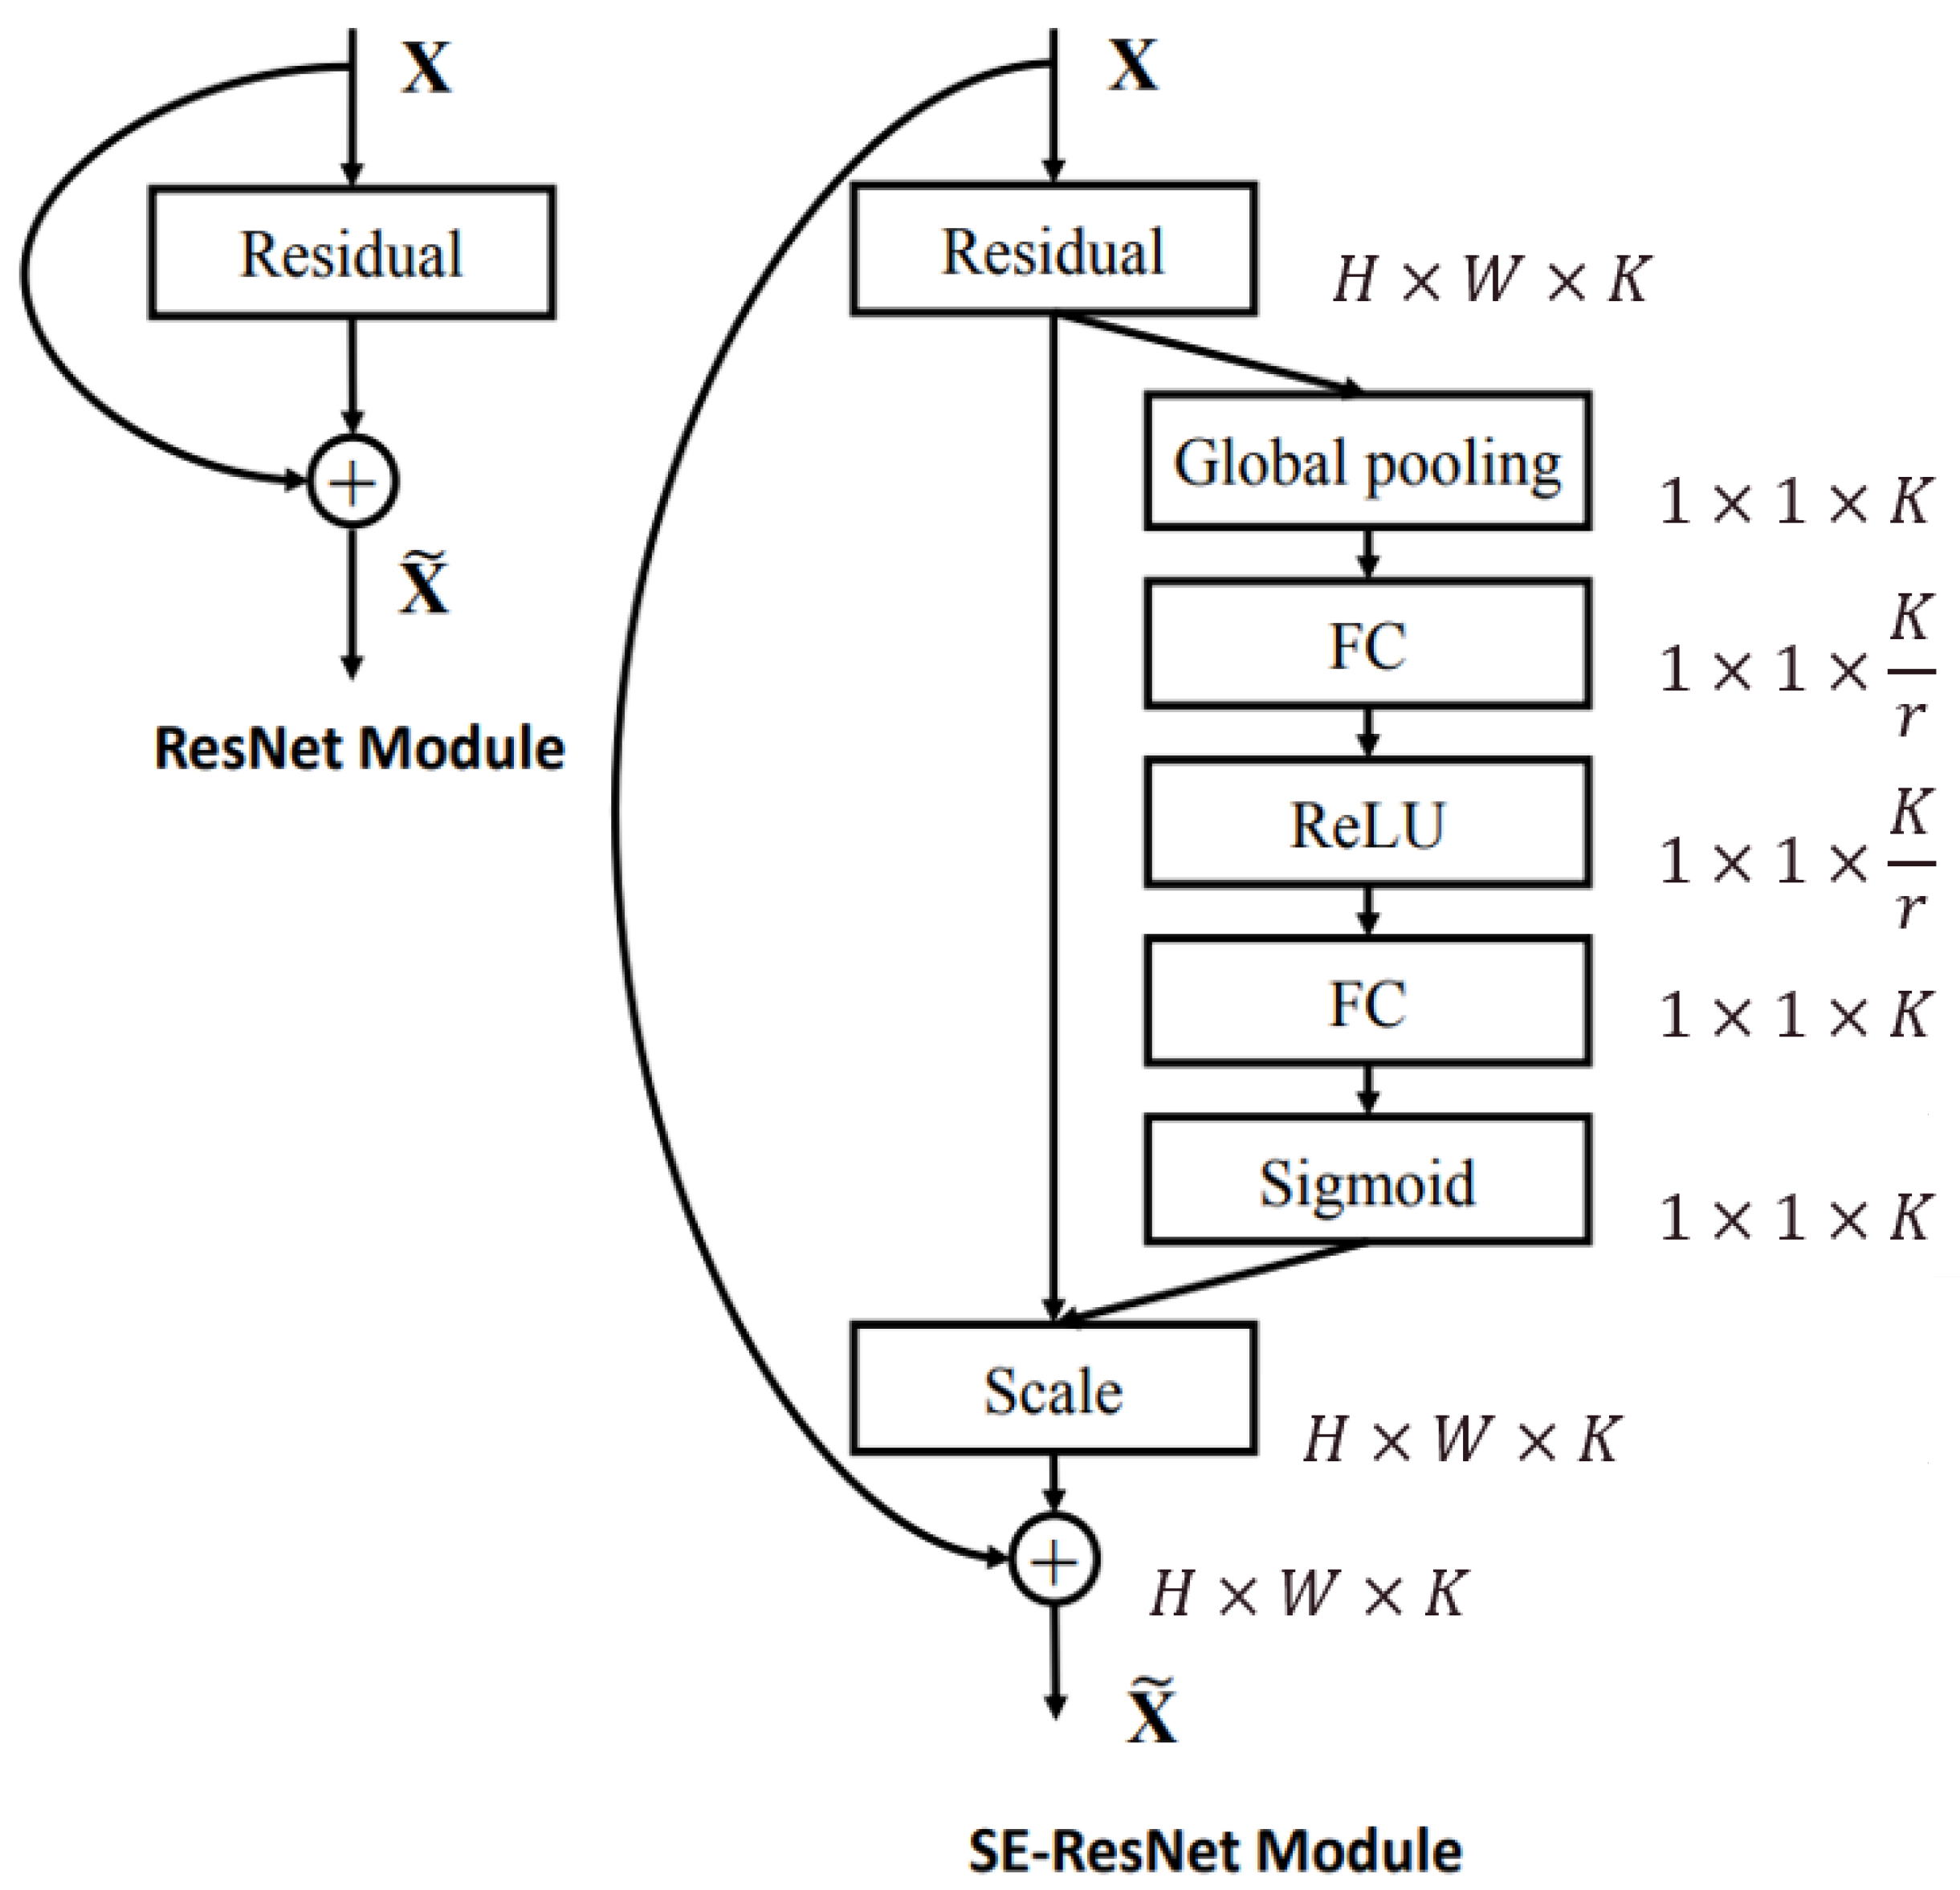
  • Feature Enhancement via Channel Attention Mechanism: An SE algorithm is applied within the anchor boxes to prioritize critical features. This mechanism enhances boundary extraction by amplifying important feature channels, leading to more precise detection of building orientation and edges.
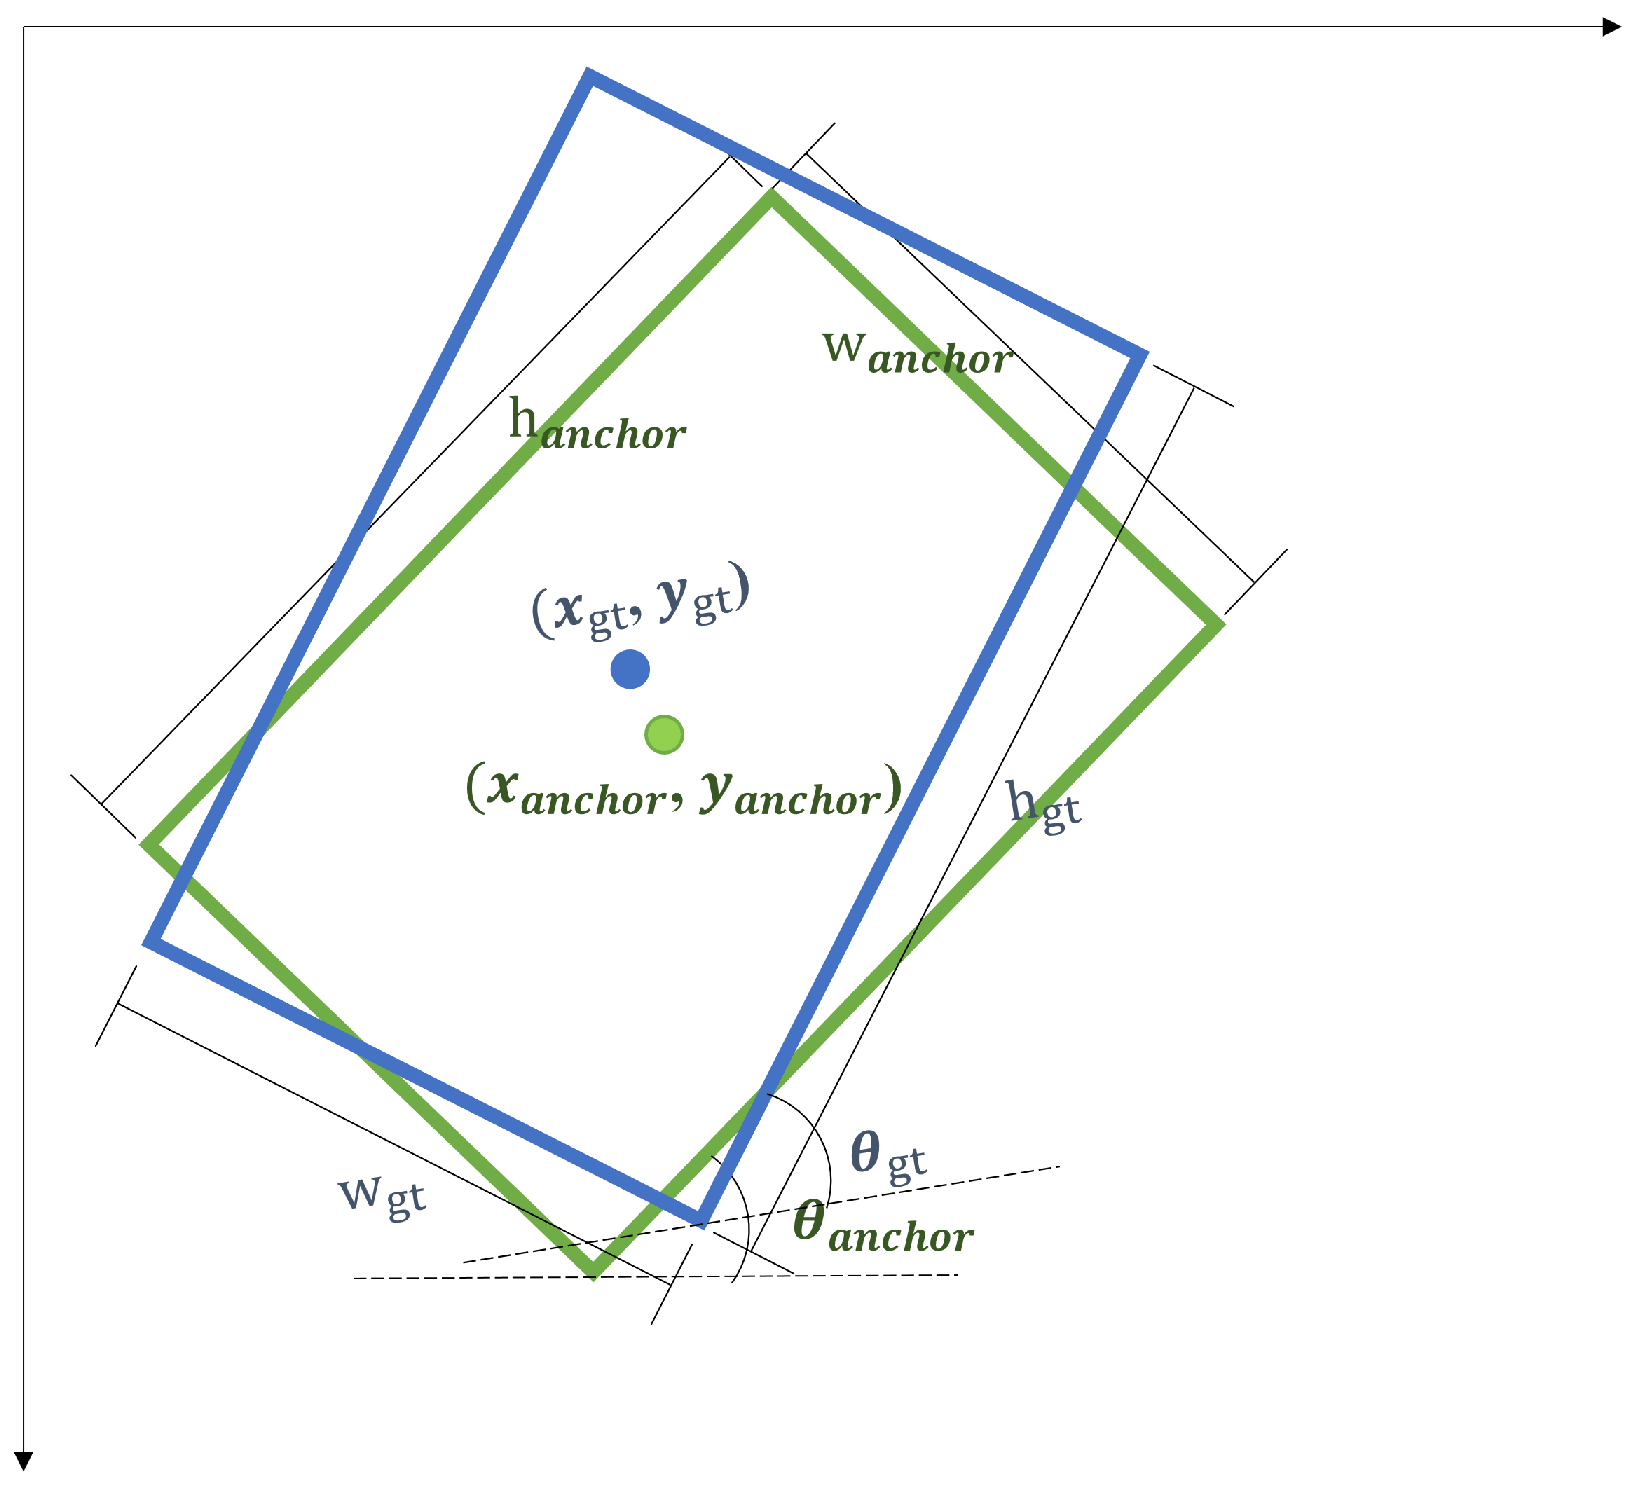
  • Rotation-based Transformation for Rotated Bounding Boxes: The initial axis-aligned anchor boxes are adjusted by applying a minimum bounding rectangle (MBR) algorithm, ensuring the smallest enclosing rectangle around the detected object. The rotation angle θ is calculated with
    θ = arctan y 2 y 1 x 2 x 1
    where ( x 1 , y 1 ) and ( x 2 , y 2 ) are the coordinates of two adjacent points on the object’s convex hull.
  • Elliptical Bounding Box Fitting: To better capture curved and irregular building contours, an ellipse is fitted to the extracted boundary points utilizing the least squares fitting method [50]. The general ellipse equation is as follows:
    a x 2 + b x y + c y 2 + d x + e y + f = 0
    where x and y denote the coordinates of a point, while a , b , d , d , e , and f are constants that determine the ellipse’s position and shape.
By combining boundary and feature information, our method produces rotated and elliptical bounding boxes that more effectively model distorted building structures. This approach particularly captures boundaries in off-nadir imagery, where significant geometric distortions occur because of perspective effects. Hence, our method significantly improves the detection of rotated or irregularly shaped buildings compared to conventional axis-aligned bounding boxes. The following chapters discuss the detailed methodology and implementation procedures for this approach.

3.2. Pre-Processing for Rotating and Elliptical Bounding Boxes

  • Optimal feature map selection
This study enhances building detection accuracy in off-nadir imagery by optimizing feature map selection. We employ ResNet-50-FPN for feature extraction, utilizing its FPN architecture to generate multi-scale feature maps [51]. This approach improves detection across varying building sizes and orientations, particularly in off-nadir conditions where perspective distortions challenge conventional methods.
The selection of the feature map is based on two essential aspects. Maintaining high spatial resolution (H, W) allows for precise localization of buildings, ensuring that even smaller structures are accurately detected. Simultaneously, preserving sufficient semantic depth (D) helps retain rich contextual information, distinguishing buildings from background noise. Instead of relying on a single level within the feature pyramid, the entire feature hierarchy is leveraged. This enables the model to effectively balance detailed spatial information with high-level contextual cues, enabling robust detection of distorted and irregularly shaped buildings in off-nadir imagery.
A channel attention mechanism is applied to emphasize the most relevant feature channels to enhance feature representation further. A weighted summation follows, reducing the multi-channel feature map to a 2D activation map. This refined activation map is then utilized to generate rotated and elliptical bounding boxes, ensuring more precise localization of buildings in complex urban environments.
  • Two-dimensional reduction via channel attention mechanism
The SE block is a mechanism designed to improve the quality of feature maps by emphasizing the most important channels and suppressing irrelevant ones. As illustrated in Figure 2, the SE block comprises three main stages:
1. Squeeze stage: Spatial information from the input feature map F R H × W × C is compressed via global average pooling (GAP). This operation aggregates the spatial information of each channel, resulting in a channel descriptor vector z R C , where
z c = 1 H × W i = 1 H j = 1 W F ( i , j , c ) ,
with F ( i , j , c ) representing the feature value at Position ( i , j ) in channel c.
2. Excitation stage: The channel descriptor z is passed through two fully connected (FC) layers separated by non-linear activations (ReLU and Sigmoid). These layers compute a set of channel-wise weights s R C , where
s = σ W 2 · ReLU ( W 1 · z ) ,
and W 1 R C r × C , W 2 R C × C r are learnable weight matrices, r is the reduction ratio, and σ is the sigmoid function.
3. Channel-wise recalibration: The learned weights s are multiplied with the original feature map F in a channel-wise manner, producing a recalibrated feature map F R H × W × C , where
F ( i , j , c ) = s c · F ( i , j , c ) ,
and s c is the learned weight for channel c.
This recalibration process enables the model to dynamically adjust its focus to the most relevant features in the input data.
When integrated into the ResNet module, as illustrated in Figure 3, the SE block is applied after the convolutional layers within the residual block. This integration allows SE-ResNet to improve feature representation while maintaining the efficiency of residual learning. The recalibrated feature map is then passed through the remaining layers of the residual block, enhancing the model’s ability to detect meaningful patterns in the input data.
The squeeze phase [52] extracts channel-wise statistical information with GAP, as illustrated in Equation (6).
z k = G A P ( F k ) = 1 H × W H i = 1 W j = 1 F i , j , k , k = 1 , 2 , , K
During this stage, spatial information from each channel in the multi-channel feature map is condensed into a single value called the spatial average. This process extracts global statistical information across channels, offering a summary representation of the feature map. The average activation value of the k-th channel ( z k ) indicates the overall importance of that channel. Channels with higher average activation values are considered to contain more important features. Thus, the squeeze stage reduces the multidimensional feature map along the channel dimension, allowing the model to compute and understand each channel’s contribution to the overall feature map. This sets the foundation for determining the importance of each channel in the subsequent stages.
In the excitation stage [52], the model learns channel-wise importance scores (s) by capturing inter-channel dependencies. This stage determines which channels are significant, should be emphasized, and should be suppressed. Rather than relying on simple linear combinations, the model applies non-linear transformations to model complex channel relationships. Utilizing two fully connected layers and activation functions, the inter-channel dependencies are learned, and the channel importance is computed via the sigmoid function ( σ ), which generates the final importance for each channel (Equations (7) and (8)).
e = σ ( W 1 z )
s = σ ( W 2 δ ( W 1 z ) ) = σ ( W 2 e )
Here, the input vector z contains each channel’s global average activation values and is the input for the first non-linear transformation. Defined as z = z 1 , z 2 , , z k T R K , this vector represents the statistical information of each channel. Based on this, the model learns the inter-dependencies between the channels.
First FC layer (e): This layer transforms the input into a lower-dimensional space, reducing model complexity and helping to prevent overfitting. The transformation matrix W 1 R K r × K is allplied, where r is the reduction ratio. The ReLU activation function, denoted by δ , is applied after this transformation to introduce non-linearity. The result is a dimensionally reduced intermediate representation vector (e), which captures the compressed relationships between the channels in a more manageable space.
Second FC layer (s): This layer restores the dimension of the representation to its original size while simultaneously calculating the channel-wise importance scores. The matrix W 2 R K × K r is applied, and a sigmoid function normalizes the output to the range [0, 1], allowing the scores to be utilized as weights. The output of this layer is the final channel importance vector (s), where each value reflects the relative importance of each channel.
After computing channel importance scores, they are applied to the multi-channel feature map to produce a single-channel 2D activation map. This process highlights the essential features, improving the performance of subsequent steps (such as gradient synthesis). Multiplying the original feature map ( F i , j , k ) by the learned importance scores results in a weighted feature map ( F ^ i , j , k ), where the importance of each channel is accounted for in Equation (9).
F ^ i , j , k = s k F i , j , k F
The weighted feature map is then summed along the channel dimension to produce a single-channel 2D activation map ( A i , j ) (Equation (10)):
A i , j = K k = 1 F ^ i , j , k
Through the channel attention mechanism, the values of important channels approach S k 1 , allowing these features to be preserved or amplified, while less important channels are suppressed as their values approach S k 0 . By performing this weighted sum, the most critical features from each channel are integrated into a single map, emphasizing crucial spatial locations. This 2D activation map captures rich information about the object’s position and shape, facilitating subsequent processing steps.
After generating the feature map A i , j , the final 2D activation map is obtained by selecting the maximum value of each channel. This process highlights specific features more effectively. The activation map is normalized to the [0, 255] range to facilitate further processing, and Gaussian blur is applied to reduce noise.
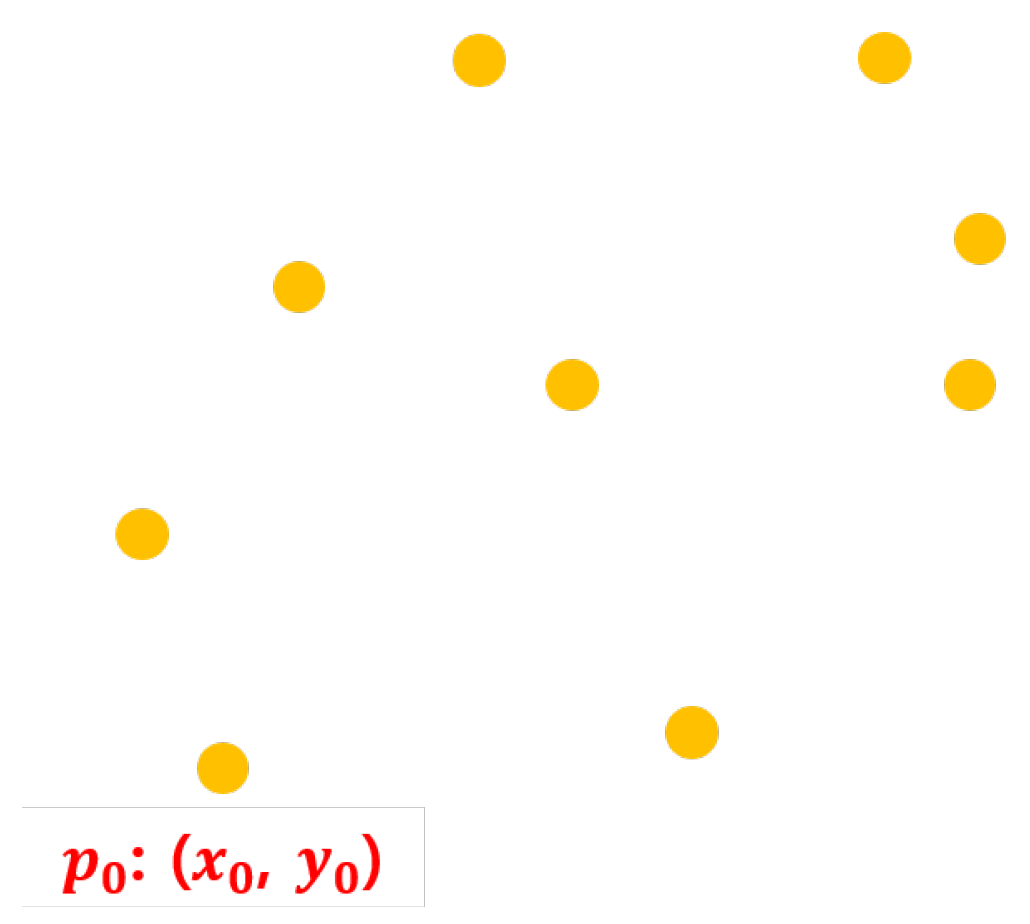
  • Finding object’s outer contour within anchor box
A gradient magnitude combination is applied to the feature map to extract the boundary points of an object within the anchor box. This technique computes the gradient in each direction of the feature map and combines them to detect edges. Sobel filters are commonly utilized to measure changes along the x and y-axis of the feature map, highlighting strong edge responses that are crucial for accurately delineating building shapes in off-nadir imagery. Conventional bounding box methods often struggle with perspective distortions, leading to inaccurate shape approximations. By applying Sobel filters, sharp intensity transitions are emphasized, allowing for the extraction of structural edges that improve boundary detection.
Because the feature map has a lower resolution than the original image and anchor boxes are based on feature map coordinates, they can be directly adopted as regions of interest (RoIs) without additional processing. The extracted gradient information ensures that bounding boxes align more closely with actual building contours rather than relying solely on feature intensity variations. The detected edge points further refine shape approximation through convex hull computation, enhancing the accuracy of rotated and elliptical bounding boxes. The gradients from both directions are integrated to produce the final edge map, effectively suppressing background noise and minimizing the inclusion of irrelevant regions, thereby enhancing building detection accuracy. One advantage of extracting boundaries from the feature map is that CNN feature maps have a much lower resolution than the original image, resulting in fewer pixels representing the object’s boundaries. However, despite this reduced resolution, the feature map still contains higher-level, abstracted information, preserving the critical details needed for boundary extraction. Unlike raw pixel-based edge detection in the original image, feature maps encode semantic information learned through convolutional layers, making them more robust to noise, lighting variations, and minor distortions.
Furthermore, CNN filters autonomously enhance key boundaries and structural details, enabling precise edge detection aligned with object contours. This results in more stable boundary extraction, as the network suppresses irrelevant background information while amplifying essential localization features. By deriving edges from the feature map rather than the original image, this approach ensures that detected boundaries are more context-aware and accurately reflect object structures, minimizing the impact of intensity fluctuations and image noise.
A gradient in a feature map measures how pixel intensity changes in a particular direction. It is described as a vector, where the magnitude reflects the extent of intensity change, and the direction specifies the orientation of this variation. Mathematically, the gradient components G x and G y are computed with the Sobel operator, which measures intensity changes in both the horizontal and vertical directions:
G x = F S x , G y = F S y ,
where S x and S y are the horizontal and vertical Sobel kernels. The magnitude of the gradient vector (G) is then calculated as
G = G x 2 + G y 2 .
In addition, the gradient direction is given by
θ = tan 1 G y G x .
The computed gradient (G) represents the final edge map, highlighting the edges detected across the feature map. By setting the RoI on the feature map and performing computations only within that region, unnecessary operations across the entire image are minimized, significantly improving processing efficiency. Furthermore, because the feature map contains high-level features extracted from the image, edge detection within the feature map results in more refined and abstracted boundaries compared to applying the same detection directly on the input image. The extracted gradient information ensures that the detected edges correspond more closely to the object structure rather than being influenced by low-level pixel variations or image noise.
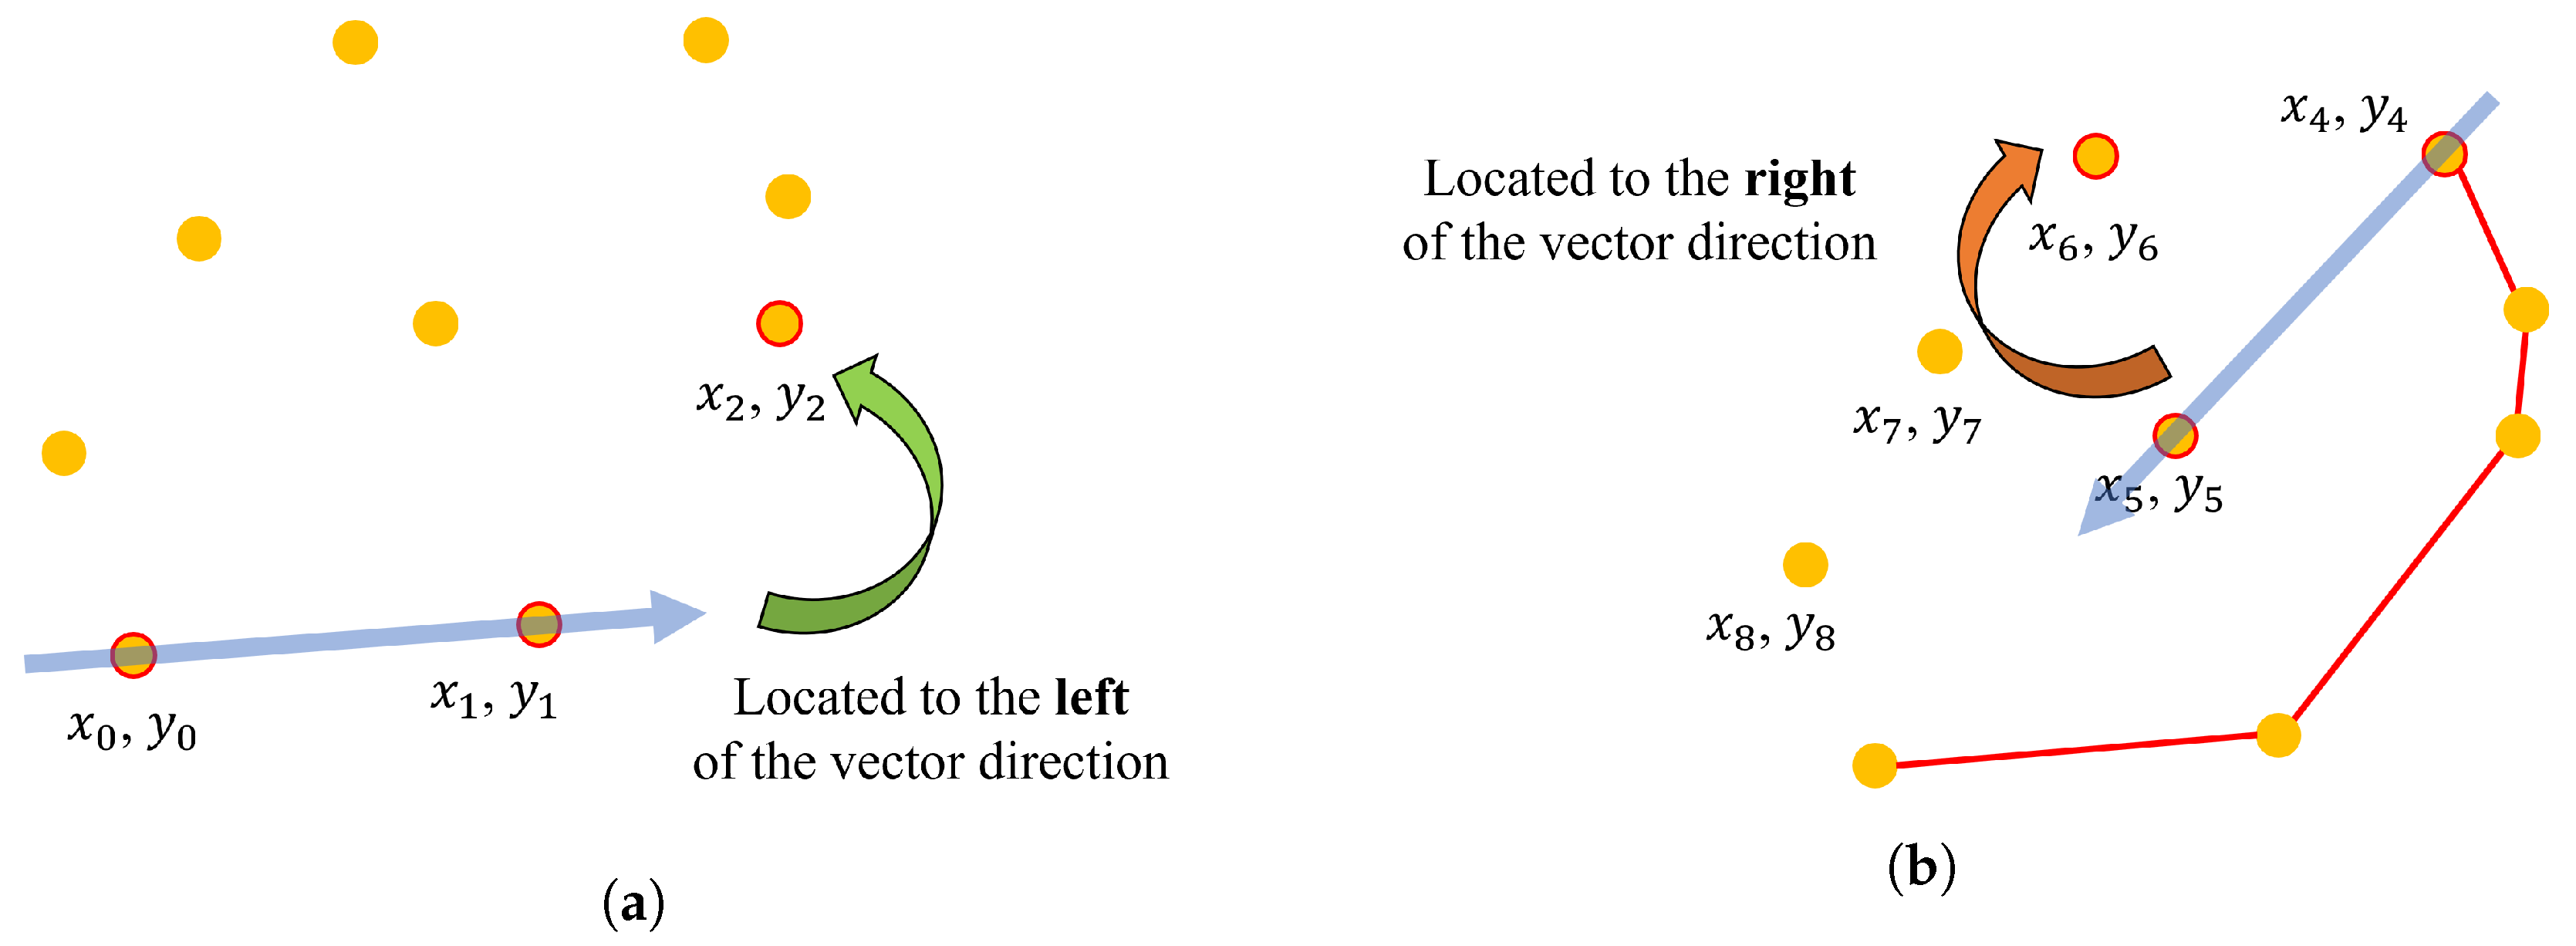
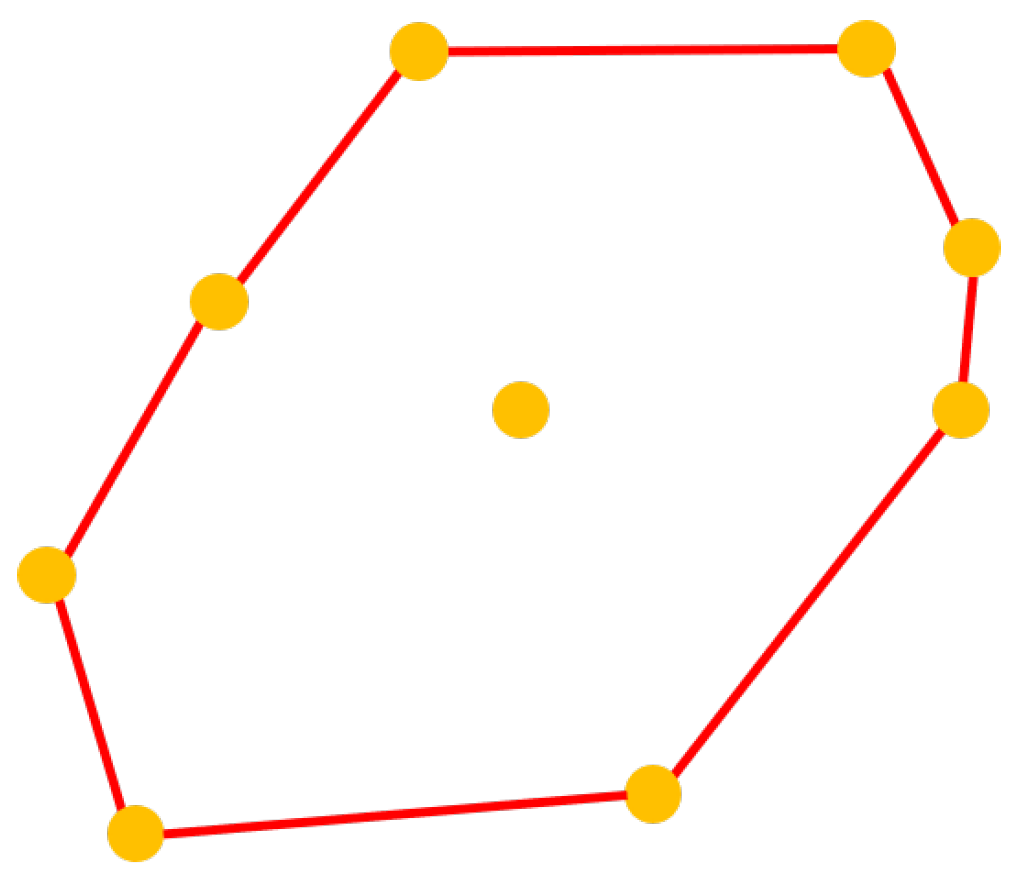
  • Convex hull calculation
The convex hull is the smallest convex polygon enclosing a given set of points, computed using the Graham scan algorithm. Given a 2D set of points (Equation (14)), the convex hull is the minimal convex polygon that contains all these points. A convex polygon is defined as a shape where no edges curve outward, and all interior angles are less than or equal to 180°.
P = ( x 0 , y 0 ) , ( x 1 , y 1 ) , , x n , y n
This process (Figure 4) begins by selecting the point at the lowest position on the coordinate plane as the reference point. The remaining points are sorted based on the angle they form with this reference point. After finding the reference point p 0 , all the other points are sorted according to the polar angle they form with p 0 . The polar angle of a given point relative to the reference point is calculated as in Equation (15).
P 0 = m i n ( x i , y i ) : i = 0 , 1 , , n
In this phase, the lowest point on the coordinate plane is chosen as the reference, and the remaining points are sorted by their angular relationship with it. After identifying the reference point p 0 , the next step is to sort all the other points according to the polar angle they form with p 0 . The polar angle of a given point relative to this is calculated as expressed in the following equation (Equation (16)).
d ( p 0 , p i ) = ( x i x i 0 ) 2 + ( y i + y 0 ) 2
At this stage, a list of points sorted by their polar angles relative to the reference point is obtained (Figure 5). This process sets the foundation for constructing the convex hull based on the point’s orientation. Orientation determines whether each point is part of the convex hull. Specifically, whether three consecutive points form a counterclockwise (left turn), clockwise (right turn) or collinear alignment must be determined. To achieve this, the vector cross-product is calculated for three points to assess the turn direction. The direction is determined as follows (Equation (17)).
orientation ( p 1 , p 2 , p 3 ) = ( y 2 y 1 ) ( x 3 x 2 ) ( x 2 x 1 ) ( y 3 y 2 )
  • orientation ( p 1 , p 2 , p 3 ) > 0 : indicates a counterclockwise (left turn) orientation.
  • orientation ( p 1 , p 2 , p 3 ) < 0 : indicates a clockwise (right turn) orientation.
  • orientation ( p 1 , p 2 , p 3 ) = 0 : indicates that the points are collinear.
To construct the convex hull, the sorted points are added individually while computing the orientation of the previous two points and the newly added point (Figure 6). Based on the orientation,
  • If it is a left turn, the new point is included in the convex hull.
  • If it is a right turn, the last added point is removed, and the orientation is recalculated.
  • If the points are collinear, only the farthest point is kept.
This process is essential because only counterclockwise turns are permitted in convex hull construction. A left turn ensures a convex shape, while a right turn introduces concavity. If a right turn occurs, the last point is removed, and orientation is recalculated. Repeating this process for all points results in the convex hull, which forms the smallest convex polygon enclosing the given points (Figure 7).

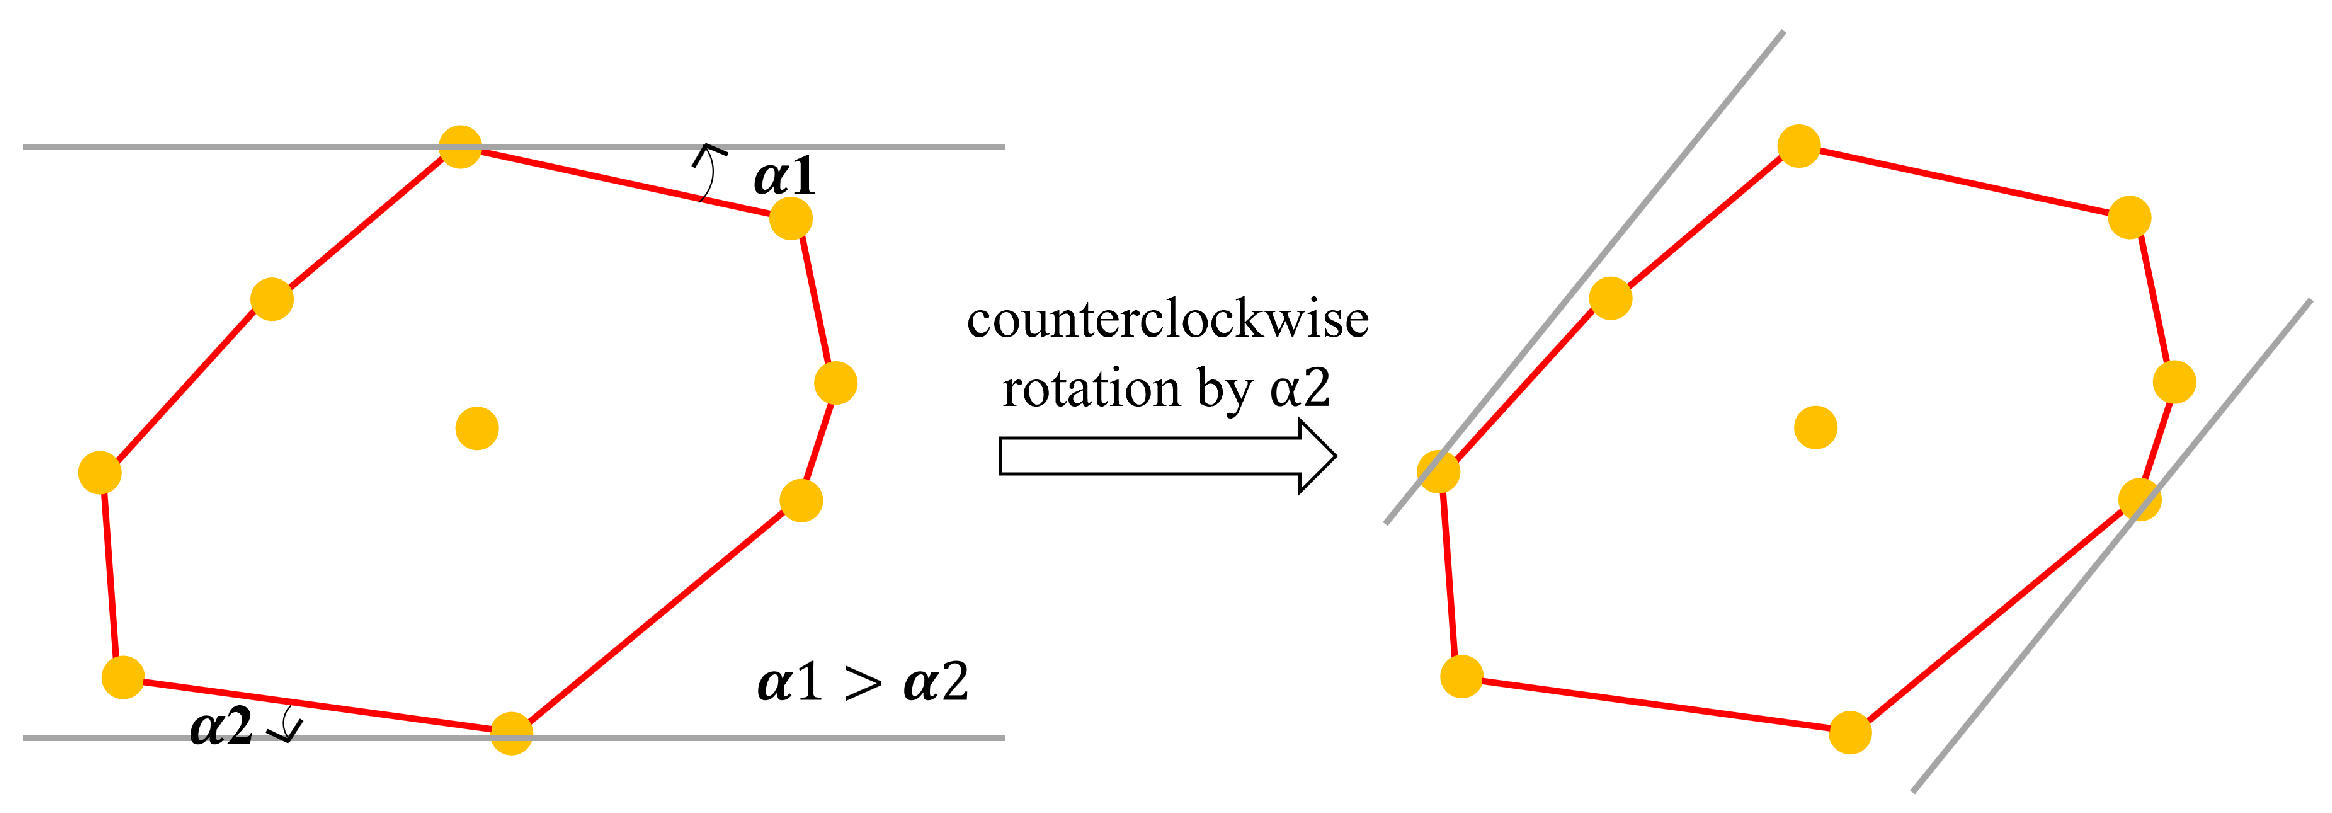
3.3. Rotated Bounding Box Approach

The method of calculating the MBR within an anchor box is employed to generate a rotated bounding box. This process involves finding the smallest rectangle that can enclose the given object (or RoI) within the anchor box. An anchor box is a predefined, fixed-size box utilized in object detection, and identifying the MBR that fits the object’s contour within this box is crucial for accurately enclosing the object’s shape. The process of calculating the MBR within an anchor box involves four key steps: detecting the object’s outer contour, computing the convex hull from boundary points, determining the MBR, and adjusting its size and orientation to optimally align with the anchor box.
The MBR calculation algorithm finds the smallest rectangular area that encloses a given convex hull. This process employs the rotating calipers algorithm, which rotates a rectangle to align with each edge of the convex hull and identifies the rectangle with the smallest area. The steps of the algorithm are as follows:
  • Convex Hull Initialization: Define the convex hull to be enclosed by the MBR.
  • Rotation Angle Calculation: For each edge of the convex hull, calculate the angle between that edge and the x-axis (Equation (18)).
  • Rectangle Boundaries Calculation (Figure 8): Rotate the convex hull by this angle such that the edge aligns with the x-axis. In the rotated coordinate system, determine the minimum and maximum x and y values for all points (Equation (19)).
  • Area Calculation: Utilizing these boundary values, calculate the width, height, and area of the rectangle (Equation (20)).
  • Minimum Area Selection: Repeat this process for each edge, and select the rectangle with the smallest area.
  • Return the Final Rectangle: Output the rectangle with the minimum area as the final MBR.
θ i = a r c t a n ( y i + 1 y i x i + 1 x i )
x min = min ( x 1 , x 2 , , x k ) , m max = max ( x 1 , x 2 , , x k ) y min = min ( y 1 , y 2 , , y k ) , y max = max ( y 1 , y 2 , , y k )
W = x max x min , H = y max y min A = W × H
This method ensures the algorithm efficiently identifies the smallest possible rectangle that encloses the convex hull. By rotating the convex hull and aligning its edges with the x-axis, the algorithm calculates a bounding rectangle in each iteration. The rectangle with the smallest area is chosen as the MBR.

3.3.1. Loss Function for Rotated Bounding Boxes

To improve detection accuracy, the loss function for rotated bounding boxes minimizes discrepancies between predicted and ground truth values. It achieves this by optimizing key regression parameters—center coordinates, width, height, and rotation angle—which determine the relative position and shape differences between the anchor box and the ground truth bounding box (Figure 9). These offsets are learned by the model to accurately predict rotated objects.
The loss function comprises three components: center coordinate loss, size loss, and rotation angle loss. The center coordinate loss measures the difference between predicted and ground truth coordinates, while the size loss captures the error in width and height. The rotation angle loss accounts for the periodicity of 360°, measuring the angle difference within a 0° to 180° range. The total regression loss is composed of three components: center coordinate loss, size loss, and rotation angle loss. The final loss function combines the classification loss and the regression loss, with a weighting parameter applied to balance the two. This approach enables the model to accurately classify objects while precisely localizing rotated bounding boxes.
After computing the loss, the model updates its parameters utilizing gradient descent. This iterative process adjusts the bounding boxes, resulting in predicted rotated bounding boxes that enclose the objects. Non-maximum suppression (NMS) is applied to eliminate overlapping bounding boxes.

3.3.2. NMS for Rotated Bounding Boxes

NMS for rotated bounding boxes removes redundant boxes by calculating the rotated intersection over union (IoU). Unlike conventional NMS, which utilizes axis-aligned rectangles, this method handles boxes with different rotation angles. The rotated IoU is calculated by determining the intersection area between two rotated rectangles based on their corner coordinates, which are derived from the center coordinates, width, height, and rotation angle.
The corner coordinates of a rotated bounding box ( x i , y i ) are computed as (Equation (21))
x i = x c + ( x i x c ) cos θ ( y i y c ) sin θ , y i = y c + ( x i x c ) sin θ + ( y i y c ) cos θ
To calculate the coordinates of a point after rotation, the following approach is adopted: The point’s position is adjusted based on its distance from the center of rotation. The horizontal and vertical components of this distance are then rotated with trigonometric functions (sine and cosine) corresponding to the rotation angle. This process results in new coordinates that reflect the point’s position after being rotated around the center.
NMS sorts bounding boxes by confidence score, selects the highest-scoring box, and removes overlapping ones using rotated IoU until only non-overlapping boxes remain.

3.4. Elliptical Bounding Box Approach

  • Ellipse fitting
Ellipse fitting is a geometric technique adopted to approximate the equation of an ellipse based on contour data [50]. This process employs the least squares method to estimate the parameters of an ellipse that best represents the given contour. From this approximation, key geometric properties of the ellipse, such as the center, major axis, minor axis, and rotation angle, are extracted. The boundary of the ellipse is then drawn with its parametric equation. Mathematically, an ellipse is represented by the following equation (Equation (2)).
Ellipse fitting starts with contour data from the convex hull process, applying the least squares method to determine ellipse parameters that best fit the contour points. The error is quantified as the sum of squared differences (S) between the actual contour points ( x i , y i ) and the ellipse parameters (a, b, c, d, e, and f) (Equation (22)).
S = i = 1 N a x i 2 + b x i y i + c y i 2 + d x i + e y i + f 2
Rearranging this equation into matrix form defines a vector for each point, enabling a more compact and efficient representation of the error function (Equation (23)). The equation of the ellipse can then be represented as a product of vectors (Equation (24)).
X i = x i 2 x i y i y i 2 x i 1
S = i = 1 N X i A 2
where A = ( a b c d e f ) represents the parameter vector of the ellipse.
In this process, to minimize S, the least squares method determines the optimal parameter vector A.
Once the parameters a, b, c, d, e, and f, are obtained, they are utilized to calculate the geometric properties of the ellipse, including the center coordinates ( x 0 , y 0 ), the length of the main axis ( a ), the minor axis length ( b ), and rotation angle ( θ ). These properties can be derived with the following equations (Equations (25)–(27)):
  • Center coordinates of the ellipse ( x 0 , y 0 ) :
    x 0 = 2 c d b c b 2 4 a c , y 0 = 2 a c b d b 2 4 a c
  • Lengths of the major ( a ) and minor axes ( b ) :
    a = 2 ( A + C + ( A C ) 2 + B 2 ) b 2 4 a c , b = 2 ( A + C ( A C ) 2 + B 2 ) b 2 4 a c
  • Rotation angle of the ellipse ( θ ) :
    θ = 1 2 arctan b a c
The rotation angle indicates the direction in which the ellipse is tilted, which is particularly important when it is not a perfect circle. Using these parameters, the ellipse’s boundary can be represented with a parametric equation (Equation (28))
x ( t ) = x 0 + a cos ( t ) cos ( θ ) b sin ( t ) sin ( θ ) y ( t ) = y 0 + a cos ( t ) sin ( θ ) + b sin ( t ) cos ( θ )
where t is a parameter ranging from 0 t 2 π . For each value of t, the corresponding points ( x ( t ) , y ( t ) ) difine the ellipse boundary.
  • Deriving Elliptical Bounding Box
An elliptical bounding box is generated when the ellipticity exceeds the specified threshold. This bounding box is visualized by plotting the ellipse with its parametric equation, which relies on the center coordinates, the lengths of the major and minor axes, and the rotation angle. The parametric equation utilizes the trigonometric functions cos ( t ) and sin ( t ) to calculate the coordinates of points along the ellipse’s boundary. The rotation angle θ accounts for any tilt of the ellipse within the coordinate system. As t varies from 0 to 2 p i (representing one full rotation around the ellipse), the corresponding points ( x ( t ) , y ( t ) ) are computed. To visualize the ellipse, parameter t is divided into N intervals, ensuring sufficient resolution for accurate boundary representation. The calculation of t at each interval is given by (Equation (29))
t i = 2 π i N , i = 0 , 1 , 2 , , N 1
By connecting the computed points, the ellipse boundary is accurately rendered on the image, ensuring a precise and visually accurate elliptical bounding box.

3.4.1. Loss Function for Elliptical Bounding Boxes

In the original Faster R-CNN architecture, the regression layer predicts four parameters—coordinates for the top-left corner ( x , y ), width (w), and height (h). The proposed method extends this to predict five parameters: the center coordinates ( x c , y c ), major axis length (a), minor axis length (b), and rotation angle ( θ ) (Figure 10). These parameters allow the model to represent rotated elliptical bounding boxes, capturing position, dimensions, and orientation.
  • Center Coordinates ( x c , y c ): Define the center of the ellipse.
  • Major Axis Length (a): Represents the length of the ellipse’s longest axis.
  • Minor Axis Length (b): Represents the length of the ellipse’s shortest axis.
  • Rotation Angle ( θ ): Denotes the orientation of the ellipse.
The model learns transformations from anchor boxes to predict these parameters:
  • Center Transformation: Describes the shift in the ellipse’s center from the anchor box.
  • Axis Length Transformation: Models the relative scaling of the major and minor axes.
  • Rotation Transformation: Captures the angular difference between the ellipse and anchor box.
To refine anchor boxes into accurate elliptical bounding boxes, transformation relationships for center coordinates, axis lengths, and rotation angles are mathematically defined. For example, the center transformation is determined by measuring the difference between the predicted ellipse center and the anchor box center, then scaling it based on anchor dimensions (Equation (30)).
t x = x c g t x c a n c h o r w a n c h o r , t y = y c g t y c a n c h o r h a n c h o r
To ensure accurate prediction, the loss function comprises the following components:
  • Center Loss: Evaluates the Euclidean distance between the predicted and actual ellipse centers.
  • Axis Length Loss: Measures the absolute error between predicted and actual lengths of the major and minor axes.
  • Rotation Angle Loss: Computes the absolute angular difference between the predicted and actual rotation angles.
  • IoU Loss: Quantifies the overlap between the predicted and actual ellipses utilizing IoU.
The total loss is a weighted sum of these components, enabling balanced optimization (Equation (31)):
L total = λ c L center + λ a L axis + λ r L rotation + λ IoU L IoU
Here, λ c , λ a , λ r , and λ IoU are weights that adjust the contribution of each loss component.

3.4.2. NMS for Elliptical Bounding Boxes

The NMS algorithm can be extended to elliptical bounding boxes by considering their unique geometric parameters: center coordinates, lengths of the major and minor axes, and rotation angle. The algorithm retains the bounding box with the highest confidence score while eliminating significantly overlapping ones. For elliptical bounding boxes, the IoU is computed as follows:
  • Intersection Area: The area of overlap between the boundaries of two ellipses. Determining the intersection area is mathematically significant and typically involves numerical methods.
  • Union Area: The union area is determined by summing the areas of the two ellipses and subtracting the intersection area:
    Union Area = A ellipse 1 + A ellipse 2 A intersection
    where A ellipse represents the area of an individual ellipse, computed as
    A ellipse = π · a · b
    Here, a and b are the lengths of the major and minor axes of the ellipse, respectively.
  • IoU: The IoU is then calculated as
    IoU = A intersection A union
When multiple bounding boxes overlap with an IoU above a predefined threshold, only the one with the highest confidence score is retained, while the others are suppressed.
The NMS process is executed iteratively:
  • Select Highest Confidence Box: The bounding box with the highest confidence score is selected.
  • Suppress Overlapping Boxes: Other bounding boxes with IoU values above the threshold are suppressed.
  • Repeat: The process is repeated until no bounding boxes remain for evaluation.
This approach ensures that the final set of bounding boxes accurately represents objects without significant overlap.

4. Experimental Setup

4.1. Dataset Description

  • BONAI dataset
The building off-nadir aerial imagery (BONAI) dataset [16] is a comprehensive resource designed for building detection studies utilizing off-nadir aerial imagery (Figure 11). This dataset comprises building images captured from various angles, covering diverse environments, from densely populated urban areas to sparsely populated rural regions. It features various building types, including high-rise structures and single-story houses, making it particularly useful for addressing the challenges posed by off-nadir conditions in building detection and segmentation tasks.
The dataset comprises a total of 3300 aerial images with 268,958 annotated building instances (Table 1). Of these, 3000 images are designated for training, while 300 images are reserved for testing. Most of the imagery has a resolution of 1.5 m/pixel, which is sufficient for accurately detecting buildings and estimating their boundaries. This high resolution enables precise identification of building outlines and other fine details.
The BONAI dataset test set contains 20,589 buildings, categorized into regular and irregular classes based on rotation angles and aspect ratios. Regular buildings, with rotation angles 20 and aspect ratios 1.5 , account for 9265 buildings (45%), while irregular buildings, with rotation angles > 20° or aspect ratios > 1.5, a total 11,324 buildings (55%). This classification enables the analysis of performance differences between rectangular and elliptical bounding boxes.
Regular buildings, which are usually rectangular, are prevalent in urban areas and work well with axis-aligned bounding boxes, providing high detection accuracy. Conversely, irregular buildings, with curved or deformed structures, are more effectively captured using elliptical bounding boxes, particularly in cases of extreme rotations or elongated aspect ratios. The dataset’s variation in aspect ratios and rotation angles accurately reflects the distortions present in off-nadir imagery.
This classification demonstrates why rectangular bounding boxes are well-suited for regular buildings, whereas elliptical bounding boxes provide improved adaptability for detecting irregular and curved structures. The dataset, labeled with polygonal annotations and ground truth data, serves as a controlled evaluation framework for assessing the proposed detection techniques. To ensure consistency with the study’s aims, the dataset was restructured to focus on the comparative analysis of rotated and elliptical bounding boxes.
  • Annotation
Building detection experiments adopted the BONAI dataset ground truth data for labeling, with annotations created with the CVAT tool. CVAT supports rotated rectangular and elliptical bounding boxes and integrates with tools like OpenVINO for automatic annotation, improving efficiency for large datasets.
  • Implementation Details
  • Dataset Preprocessing: The BONAI dataset images were cropped to 512 × 512 for training to balance computational efficiency and feature preservation. This resolution preserves essential building details while minimizing memory and computational demands, enabling the model to efficiently process images during training.
  • Backbone Selection (ResNet-50-FPN): ResNet-50-FPN was chosen as the backbone network because of its ability to generate multi-resolution feature maps through a feature pyramid network (FPN) [51]. Compared to other backbones such as VGG-16 or ResNet-101, ResNet-50-FPN provides a balance between computational efficiency and accuracy, enabling robust detection of buildings with varying sizes and shapes. This architecture effectively captures both the fine details of small structures and the high-level features of large buildings, making it particularly well-suited for the BONAI dataset, which encompasses diverse urban environments. Its ability to detect irregular and tilted buildings outperforms simpler architectures like VGG-16, making it a preferred choice despite the potential for slightly higher accuracy in models like ResNet-101, which come with significantly greater computational demands.
  • Environment: The training was conducted on Google Colab Pro+ with an NVIDIA GeForce RTX 3060 Ti GPU, 52 GB RAM, and 170 GB disk space (Santa Clara, CA, USA). The use of a GPU significantly accelerated the training process, allowing efficient handling of the computational demands posed by the BONAI dataset.
  • Training Configuration: The model was trained with Stochastic Gradient Descent with a learning rate of 0.02, momentum of 0.9, and a weight decay of 1 × 10 4 . Training was performed over 12 epochs with a batch size of 16. These hyperparameters were fine-tuned to optimize convergence and detection performance.

4.2. Performance Metrics and Analysis

The evaluation examined the performance of rectangular and elliptical bounding boxes in detecting regular and irregular buildings. Key metrics, including IoU, Precision, Recall, and F1 Score, were utilized to assess detection accuracy. Regular buildings, typically rectangular with low rotation angles and aspect ratios, achieved high detection accuracy with rectangular bounding boxes. Conversely, irregular buildings, which feature curved or asymmetrical shapes, significantly improved when using elliptical bounding boxes. These bounding boxes better aligned with complex boundaries, resulting in higher IoU and F1 Scores.

5. Results and Discussion

5.1. Results

The performance metrics (Table 2) and detection/miss rates for different bounding box types (Table 3) reveal clear differences in their effectiveness for building detection, particularly in off-nadir imagery. The first table highlights the performance metrics, establishing that elliptical bounding boxes outperform the other types with the highest IoU (0.88) and F1 score (0.92). This superior performance is attributed to their ability to conform to curved and irregular building shapes, minimizing background noise and improving localization accuracy. The elliptical shape is especially effective in reducing the influence of irrelevant regions such as shadows or adjacent structures, which often interfere with accurate boundary delineation.
In contrast, rotated bounding boxes, achieving an IoU of 0.72 and an F1 score of 0.85, effectively detect moderately rotated structures but face limitations with highly distorted geometries and occlusions. While they surpass axis-aligned bounding boxes in detecting tilted buildings, their rectangular shape constrains their adaptability to complex curvatures and irregular structures. Axis-aligned bounding boxes demonstrate the weakest performance, with an IoU of 0.58 and an F1 score of 0.73. Their fixed orientation and rigid rectangular structure often cause misalignment, particularly for tilted or non-rectilinear buildings. This misalignment results in significant background noise being included within the bounding box while also omitting parts of the actual structure, ultimately reducing detection accuracy.
Detection and miss rates (Table 3) provide additional insights into bounding box efficiency. Specifically, compared to axis-aligned bounding boxes, the proposed elliptical bounding boxes improved detection rate from 65.75% to 91.96%, corresponding to a 39.86% relative improvement. Furthermore, the number of undetected buildings decreased by 76.5%, reducing from 7052 to 1656. These quantitative results clearly demonstrate the significant advantage of elliptical bounding boxes in minimizing missed detections, particularly for distorted and irregular structures in off-nadir imagery. Elliptical bounding boxes achieved the highest detection rate (91.96%) and the lowest miss rate (8.04%), indicating their robustness in handling both regular and irregular structures. This performance stems from their ability to closely match the true boundaries of buildings, which minimizes FNs and reduces interference from surrounding noise. Rotated bounding boxes, while performing well with a detection rate of 87.13%, exhibited a higher miss rate (12.87%) than elliptical bounding boxes. This suggests that while rotated bounding boxes work effectively for moderately rotated and regular buildings, they struggle with complex curvatures, extreme aspect ratios, and irregular geometries. However, rotated bounding boxes perform better in scenarios where buildings exhibit a consistent linear rotation, making them well-suited for environments with minimal curvature variation. Axis-aligned bounding boxes, with the lowest detection rate (65.75%) and the highest miss rate (34.25%), demonstrated significant limitations in capturing rotated or distorted structures, particularly under the challenging conditions of off-nadir imagery.
Overall, the results suggest that axis-aligned bounding boxes are unsuitable for off-nadir imagery, where perspective distortions and rotations are prevalent. In contrast, rotated and elliptical bounding boxes achieve higher detection accuracy and demonstrate greater robustness in handling both regular and irregular building structures. Notably, elliptical bounding boxes significantly enhance detection performance by minimizing background noise and improving localization accuracy. Consequently, this study focuses on evaluating the performance of rotated and elliptical bounding boxes in building detection. By assessing their effectiveness for various structural forms, this research aims to provide deeper insights into their advantages and applications in off-nadir imagery. Furthermore, while bounding box selection is primarily driven by building geometry and imaging conditions, we acknowledge that geographic and urban contexts may indirectly influence this choice. For example, dense city centers with diverse and irregular building structures may benefit more from elliptical bounding boxes, whereas rotated or axis-aligned boxes may be sufficient in simpler suburban environments.

5.2. Discussion

This section provides a more in-depth analysis of the detection performance of the proposed methods. By refining the scope, the discussion offers a detailed evaluation of each method’s strengths and characteristics under consistent conditions. This focused approach enables a comprehensive assessment, yielding additional insights into the accuracy and effectiveness of the proposed techniques.

5.2.1. Overall Detection Performance

Elliptical bounding boxes demonstrated superior detection performance across both regular and irregular buildings because of their ability to adaptively conform to complex contours. For regular buildings—characterized by low aspect ratios (1.0–1.5) and rotation angles (0–20°)—elliptical bounding boxes consistently achieved high IoU values, often exceeding 0.8. This advantage stems from their ability to capture smooth, symmetrical outlines while minimizing background inclusion, which in turn reduces false detections. Unlike rotated bounding boxes, which may still encompass irrelevant regions owing to their rectangular constraints, elliptical bounding boxes provide a more precise fit, particularly in off-nadir conditions where buildings exhibit non-linear edges and shape distortions. Hence, they enhance detection accuracy and improve reliability by reducing IoU variation (Figure 12).
The performance gap widened with irregular buildings, defined by complex geometries, higher aspect ratios (>1.5), and rotation angles (>20°). Elliptical bounding boxes consistently achieved high IoU values, even as aspect ratios exceeded 2.0, demonstrating their effectiveness in handling non-linear boundaries. In contrast, rotated bounding boxes struggled, with IoU values dropping significantly as aspect ratios increased.
At rotation angles above 30°, elliptical bounding boxes maintained stable IoU values, showcasing their insensitivity to orientation. In contrast, rotated bounding boxes exhibited significant performance degradation, with IoU values becoming more dispersed and dropping sharply above 50°. Overall, elliptical bounding boxes excelled in robustness and adaptability, achieving consistently high IoU values across various aspect ratios and rotation angles. Rotated bounding boxes, however, exhibited uneven IoU distribution, particularly for irregular buildings, where lower IoU values were more frequent.
These findings underscore the advantages of elliptical bounding boxes, particularly for irregular buildings with complex geometries and high rotation angles. While rotated bounding boxes perform well for simpler, regular structures, their effectiveness diminishes in more challenging scenarios. This performance gap is further amplified when combined with ResNet-50-FPN as the backbone, which enhances feature extraction and improves detection accuracy. Leveraging this backbone, the model demonstrated superior performance with both rotated and elliptical bounding boxes, particularly for detecting irregular and tilted buildings in the BONAI dataset.

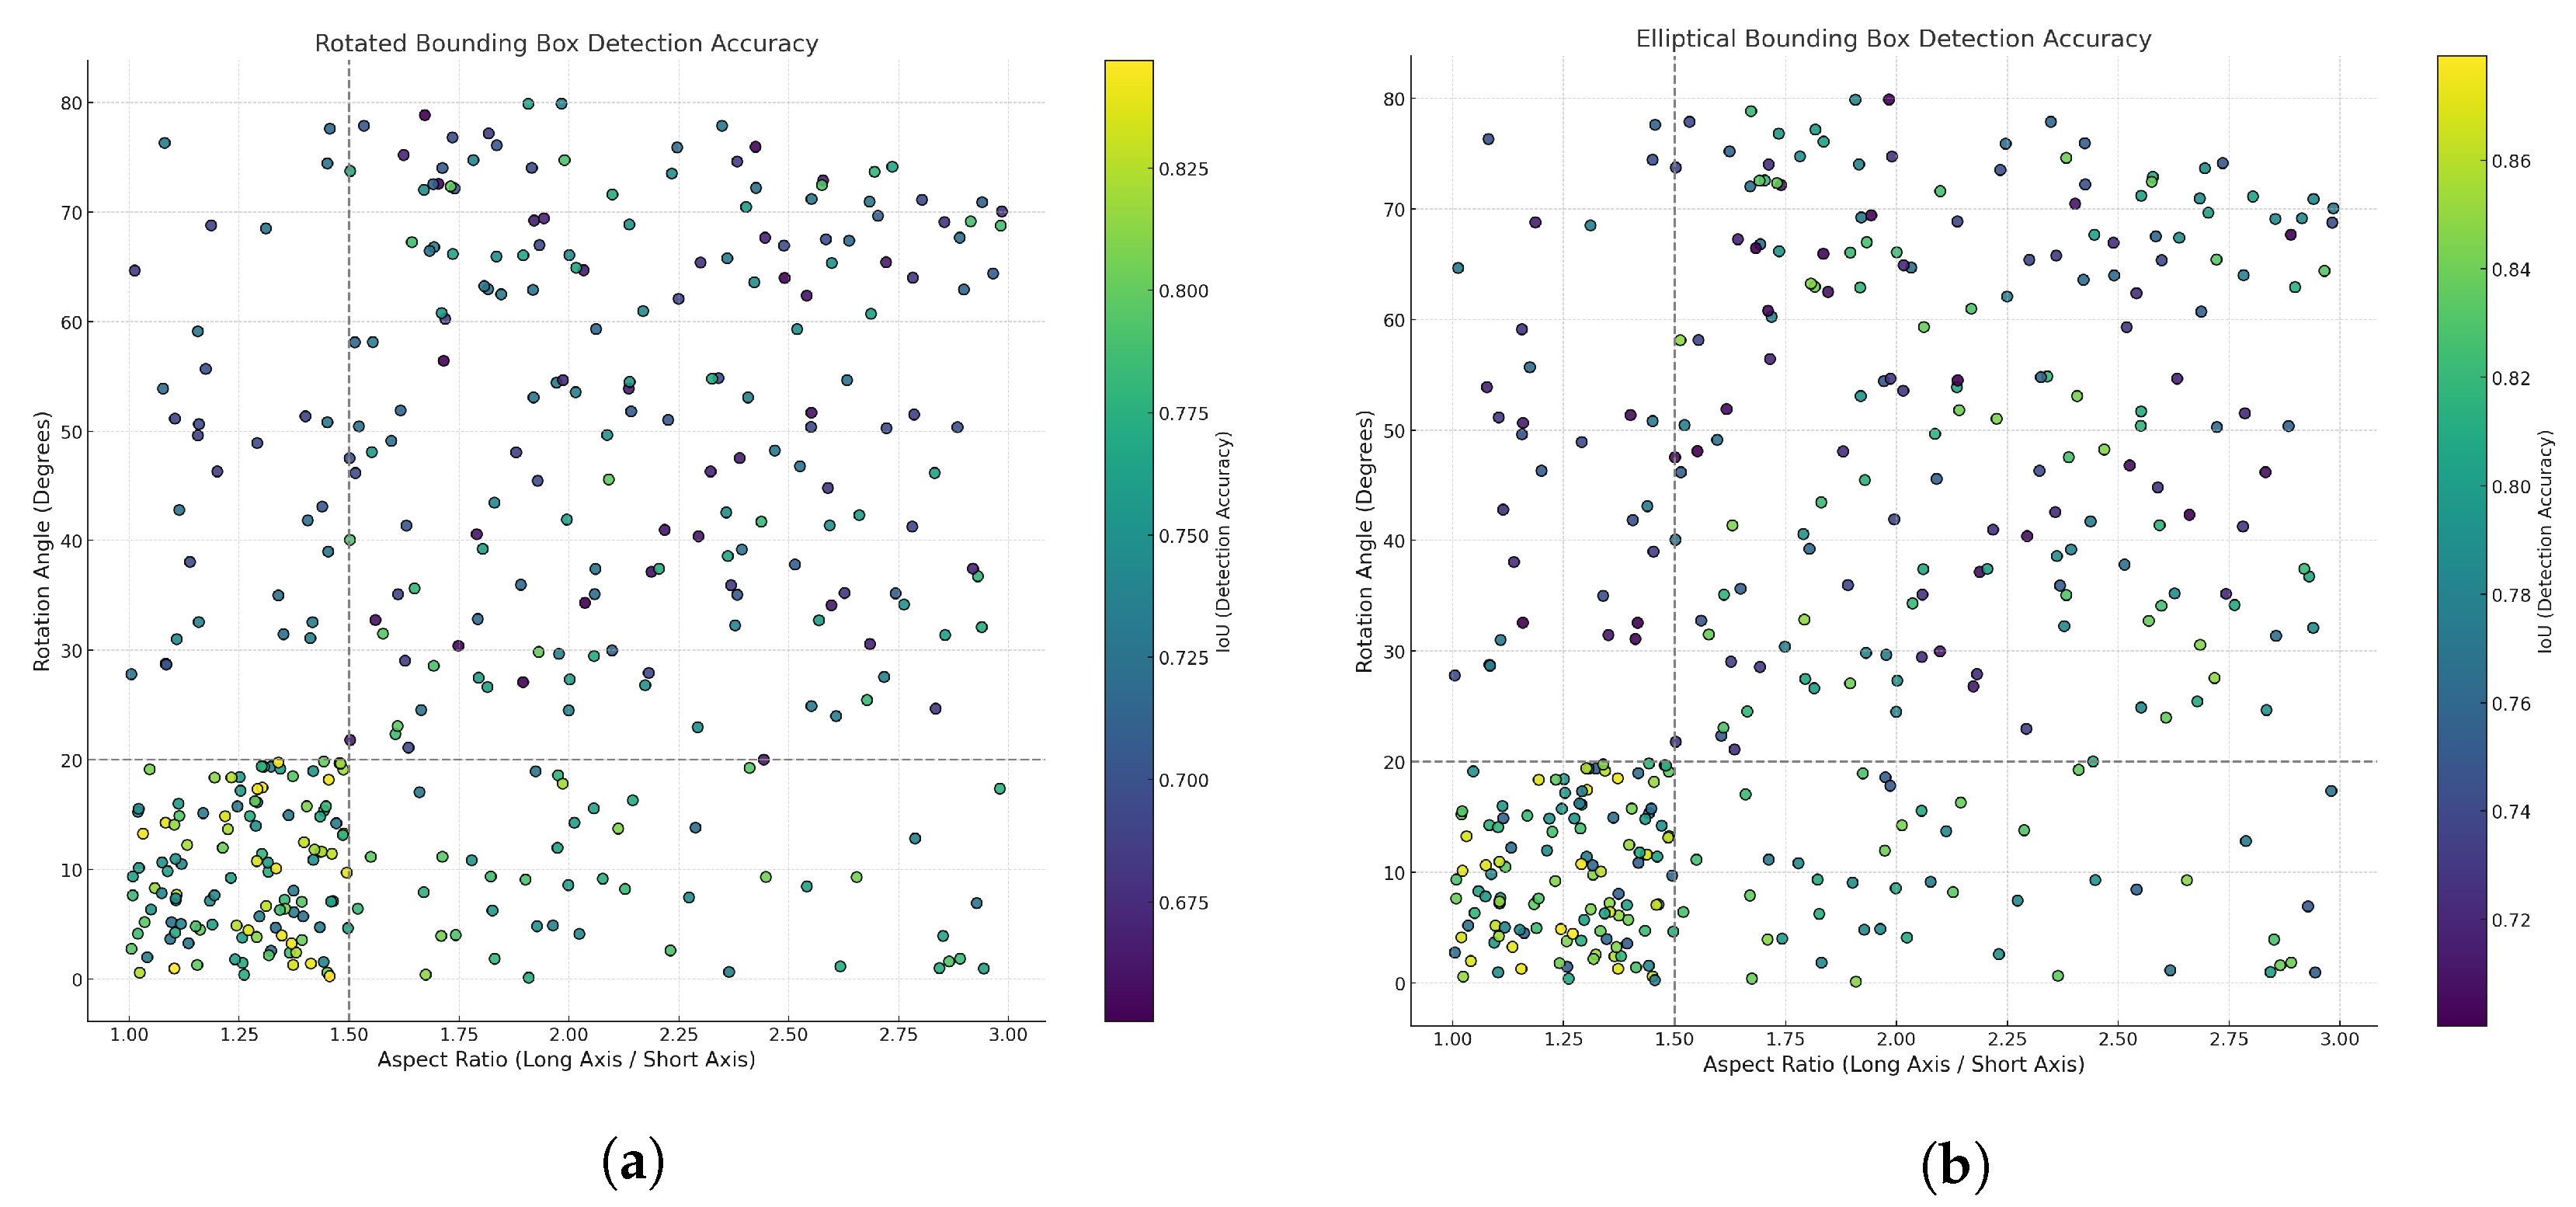
5.2.2. Categorical Analysis: Regular vs. Irregular Buildings

Table 4 presents the detection performance of rotated and elliptical bounding boxes for regular and irregular buildings, evaluated with IoU, Precision (P), Recall (R), and F1 scores. For regular buildings, both bounding box types achieve consistently high accuracy. Rotated bounding boxes slightly outperform elliptical ones, with an IoU of 0.88 and an F1 score of 0.94, compared to 0.84 and 0.90 for elliptical bounding boxes. These results confirm that both bounding box types are equally effective in capturing the simple, symmetrical geometries of regular structures, with only minor performance differences.
For irregular buildings, detection performance decreases for both bounding box types because of the increased complexity of shapes and distortions typical in off-nadir imagery. However, elliptical bounding boxes outperform rotated ones, achieving a higher IoU (0.81 vs. 0.79) and F1 score (0.82 vs. 0.79). These results emphasize the superior ability of elliptical bounding boxes to capture curved and irregular outlines. However, both methods exhibit lower Precision and Recall for irregular buildings compared to regular ones, highlighting the inherent challenges in detecting such structures.
In summary, both bounding box types achieve high detection accuracy for regular buildings. However, for irregular buildings, elliptical bounding boxes offer superior adaptability to complex geometries and off-nadir distortions. Given that regular buildings are consistently well-detected regardless of bounding box type, further analyses will emphasize irregular buildings to better compare the performance of rotated and elliptical bounding boxes under more demanding conditions.
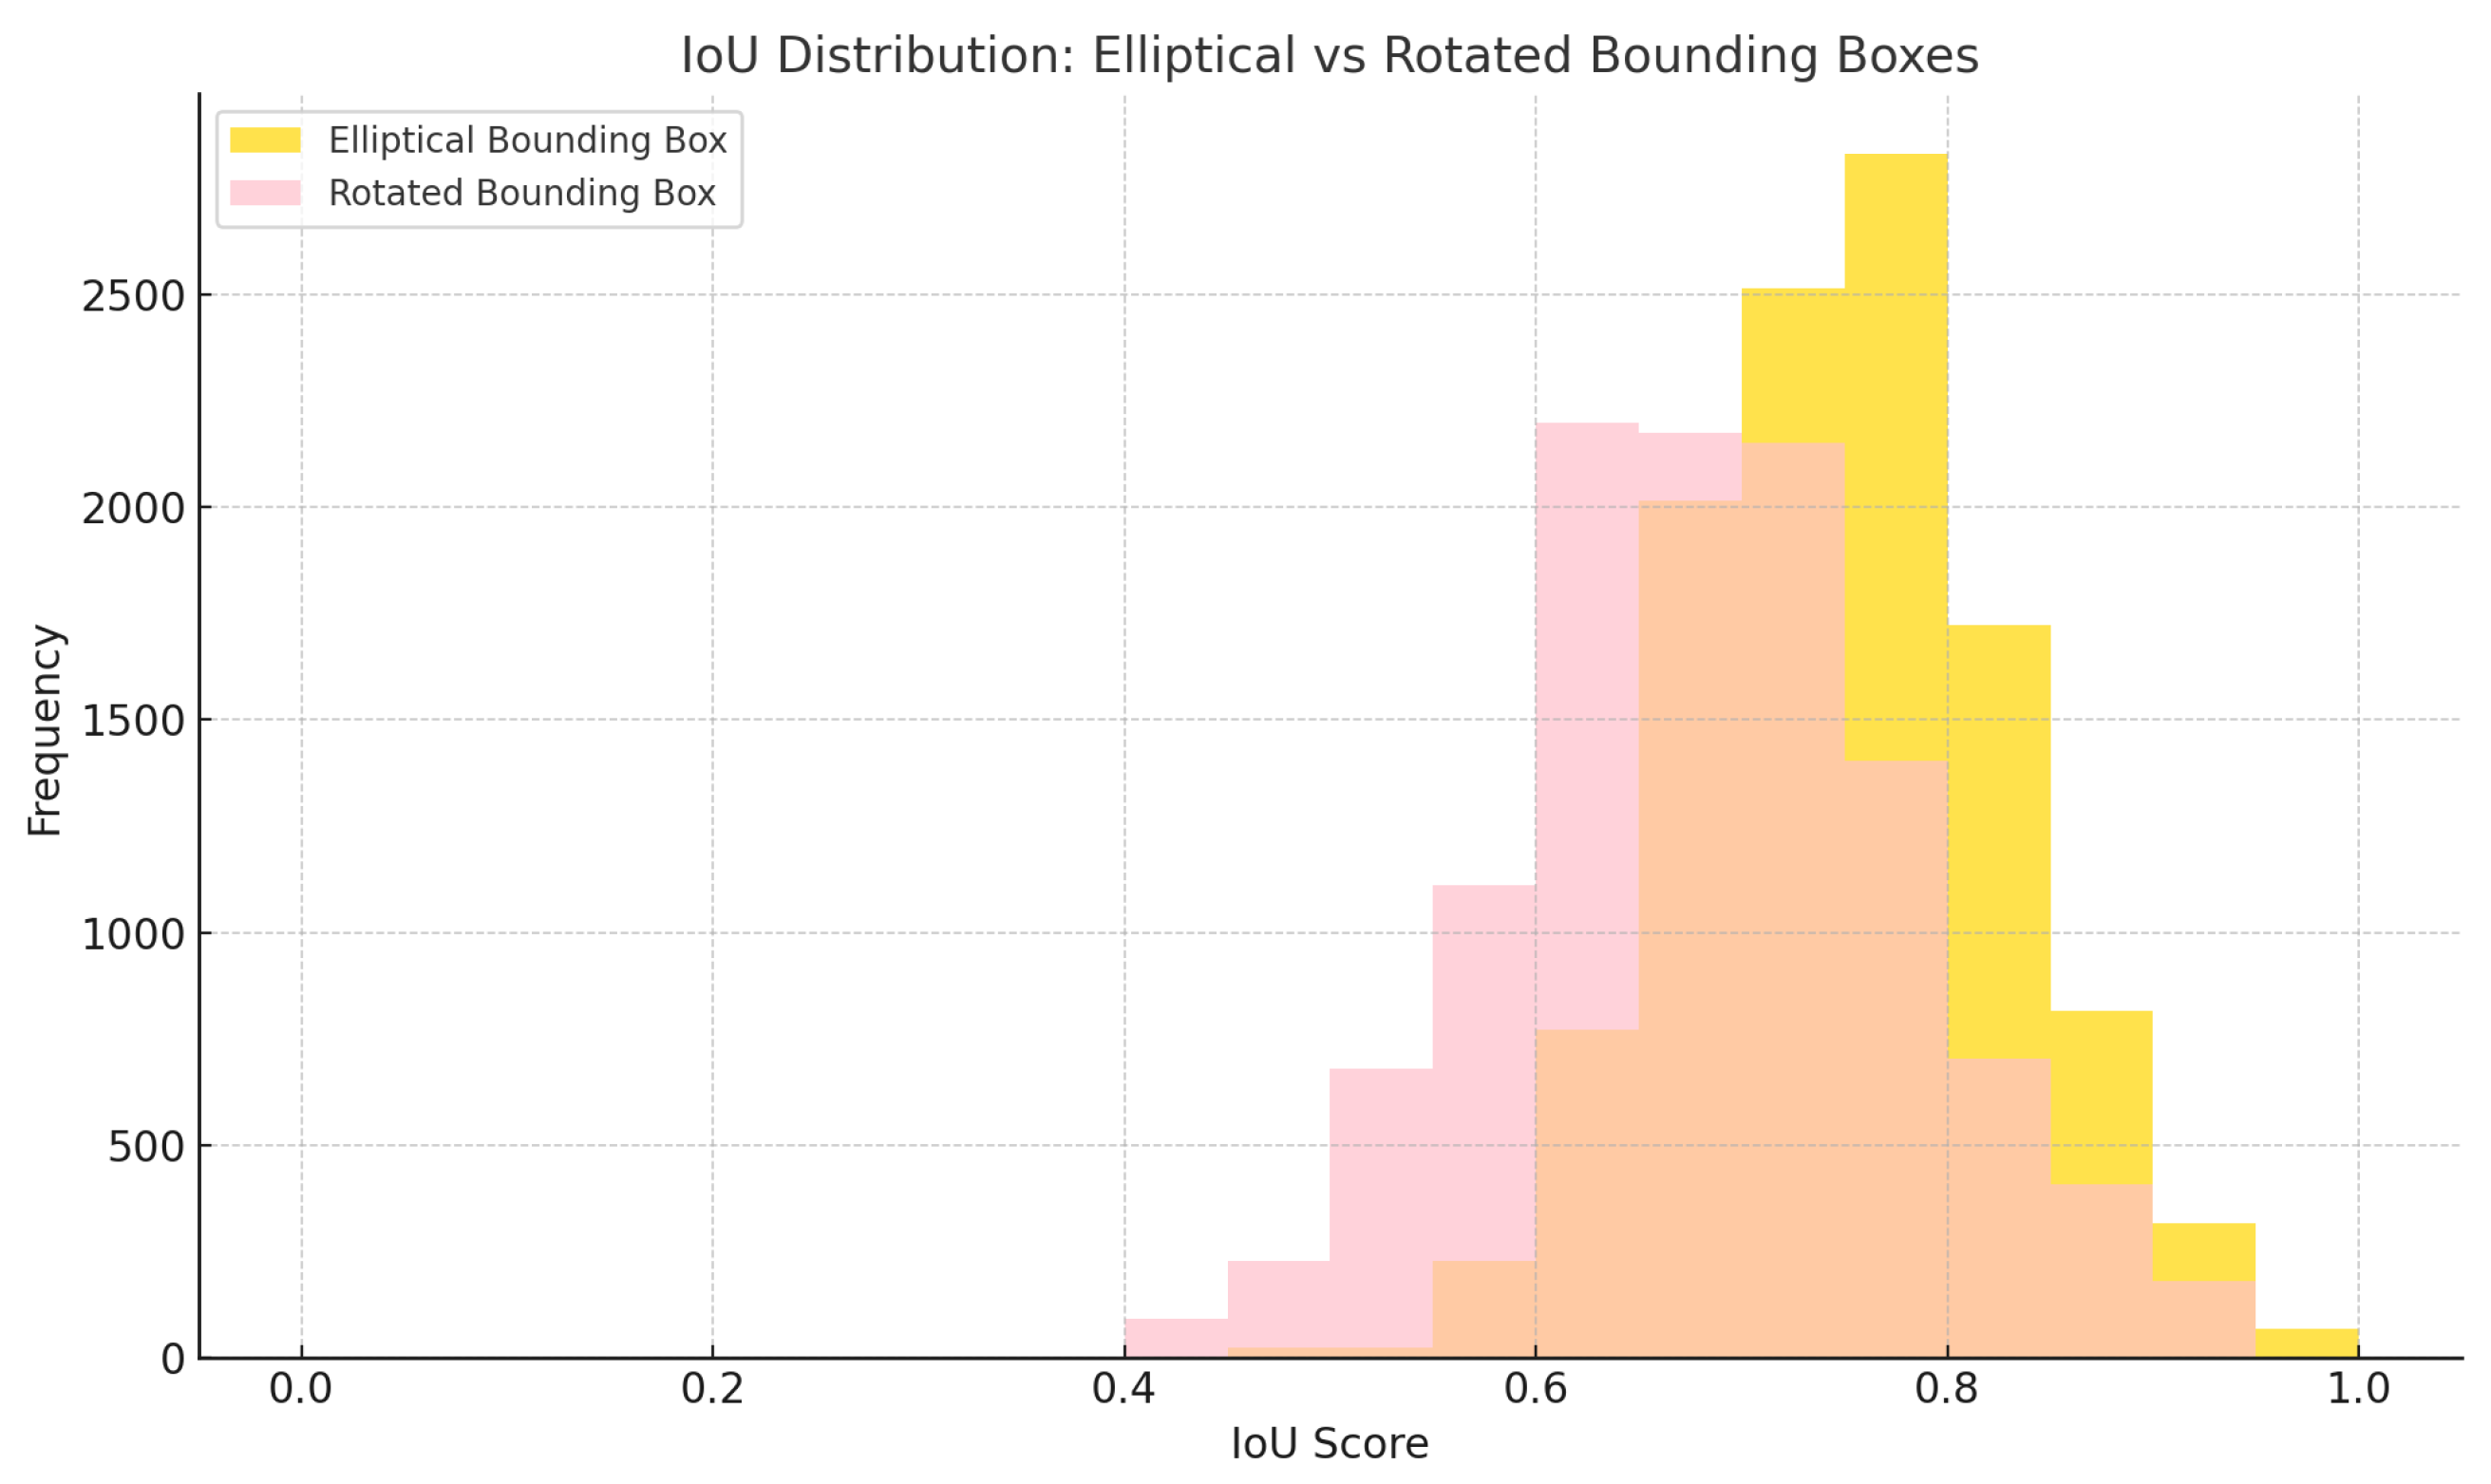
  • IoU Distribution Analysis for Irregular Buildings
The IoU distribution for irregular buildings, visualized in the histogram (Figure 13), provides a critical assessment of detection consistency. A narrower standard deviation and a concentration of IoU values within a specific range indicate a bounding box’s ability to reliably handle diverse building geometries, particularly in off-nadir imagery.
Elliptical bounding boxes maintain a mean IoU of 0.75 with a standard deviation of 0.078, demonstrating high accuracy and stability. Most IoU values are clustered within the 0.7–0.9 range, peaking at 2831 detections, reinforcing their effectiveness in modeling complex and irregular structures. Conversely, rotated bounding boxes yield a lower mean IoU of 0.68 with a higher standard deviation of 0.098, primarily falling within the 0.5–0.7 range and peaking at 2197 detections. This variation indicates a less consistent performance, particularly for detecting irregularly shaped buildings.
The histogram in Figure 13 further illustrates these performance trends. Elliptical bounding boxes exhibit a near-normal distribution, indicating their stability in detecting diverse building geometries. This suggests that they effectively minimize performance variability, even for irregular structures.
Conversely, rotated bounding boxes exhibit a right-skewed distribution with a wider spread and a higher frequency of low-IoU instances. This suggests greater performance variability, particularly in scenarios with extreme aspect ratios, occlusions, and non-linear edges. Their difficulty in handling off-nadir distortions further contributes to inconsistent detection performance.
These findings highlight the superior adaptability of elliptical bounding boxes to irregular geometries, making them more effective under challenging conditions. However, further analysis of false detections and missed detections is necessary to refine the assessment of bounding box performance. These error cases provide critical insights into scenarios where each bounding box type underperforms, enabling a more comprehensive evaluation of their adaptability and reliability.
  • Detection and False Detection Rate Analysis
Table 5 presents the detection, miss, and false detection rates for irregular buildings utilizing rotated and elliptical bounding boxes, based on a total of 11,324 irregular buildings. Elliptical bounding boxes achieved a significantly higher detection rate (91.93%) than rotated bounding boxes (84.79%), successfully identifying 10,409 buildings versus 9602. This 7.14% improvement is attributed to their ability to conform more effectively to complex and irregular building contours, reducing the inclusion of background noise and improving boundary alignment. Their superior adaptability is particularly evident in off-nadir imagery, where perspective distortions and irregular shapes challenge conventional detection methods.
The reduced miss rate of elliptical bounding boxes (8.07% compared to 15.21% for rotated bounding boxes) highlights their robustness in capturing irregular building boundaries. This corresponds to 915 undetected buildings for elliptical bounding boxes versus 1722 for rotated bounding boxes, a 47% reduction in missed detections. This improvement is mainly due to their ability to better model non-linear edges and asymmetric geometries, ensuring tighter fits and minimizing FNs.
Elliptical bounding boxes also achieve a lower false detection rate (4.59%) compared to rotated bounding boxes (5.93%), resulting in fewer incorrect detections (520 vs. 671). However, error analysis indicates that elliptical bounding boxes occasionally misclassify non-building structures, such as elliptical roads or dense vegetation clusters, leading to false positives (FPs). This issue arises because these structures share similar contours with irregular buildings, potentially misleading the detection algorithm. To address this, additional post-processing techniques, such as semantic segmentation-based filtering, could enhance precision by differentiating building-like structures from non-building elements.
Overall, elliptical bounding boxes surpass rotated bounding boxes in detecting irregular buildings, offering higher detection accuracy, fewer missed detections, and reduced FPs. Despite these advantages, both methods encounter challenges in handling specific error cases with precision. Refining detection pipelines through targeted error analysis and algorithmic improvements are essential for further performance enhancements.

5.2.3. Error Analysis

The error analysis reveals the advantages and limitations of rotated and elliptical bounding boxes in detecting irregular buildings, offering valuable insights into the factors affecting detection accuracy. Table 6 compares the false negative (FN) rates for rotated and elliptical bounding boxes across three building categories: small, distorted, and high-curvature. For small buildings, rotated bounding boxes achieve a lower FN rate of 3.8% compared to elliptical bounding boxes at 10.4%, as their rigid geometry aligns well with simple outlines. However, elliptical bounding boxes perform significantly better for distorted and high-curvature buildings, with FN rates of 6.7% and 4.3% compared to 13.9% and 24.1% for rotated bounding boxes. This demonstrates the adaptability of elliptical bounding boxes to complex shapes and irregular geometries.
Elliptical bounding boxes excel in detecting irregular or elliptical-shaped buildings, as demonstrated in Figure 14. Their curved contours allow them to closely conform to non-linear edges, ensuring accurate detection. For example, in Figure 14b, the elliptical bounding boxes effectively capture the complex outlines of the buildings while minimizing the inclusion of irrelevant background. This adaptability enables them to reduce FNs by better fitting the building geometries.
Rotated bounding boxes, presented in Figure 14a, demonstrate limitations in handling irregular structures. Their rigid rectangular geometry frequently struggles to align with curved or asymmetrical building edges, resulting in noticeable mismatches between bounding boxes and building outlines. This misalignment increases FNs, where portions of buildings are omitted, and FPs, where background regions resembling buildings are mistakenly included.
However, elliptical bounding boxes are not without limitations. As illustrated in Figure 14b, they occasionally misidentify non-building structures, such as elliptical roads or circular landscaping features, leading to FPs. This occurs because these non-building elements share similar contours and spatial patterns with the target structures.
To reduce these errors, implementing additional post-processing techniques, such as semantic segmentation or edge-detection refinement, could refine elliptical bounding boxes by better distinguishing buildings from surrounding non-building elements.
Detecting small buildings poses challenges for both bounding box types, as illustrated in Figure 15. Rotated bounding boxes perform better in these scenarios because they tightly conform to small, regular structures, aligning effectively with the rectangular geometries typical of such buildings. This precise alignment reduces background inclusion and enhances accuracy in detecting small, isolated buildings.
Elliptical bounding boxes, though effective for irregular and large structures, face challenges in detecting small buildings, particularly in areas with varying building sizes. Their flexible shape, while useful for capturing complex structures, can cause them to favor larger buildings, leading to the omission of smaller ones. This limitation is especially apparent in densely built environments, where overlapping structures create additional detection challenges, increasing FNs.
In addition, elliptical bounding boxes are more likely to misclassify adjacent small features, such as vegetation or non-building elements, as buildings, leading to FPs. This occurs because their broader coverage increases the likelihood of including irrelevant regions, especially in areas with high structural complexity.
To enhance small building detection, a hybrid approach could be explored, integrating the precision of rotated bounding boxes for small structures with the adaptability of elliptical bounding boxes for larger or irregular ones. Furthermore, advanced filtering techniques, such as multi-scale feature extraction and semantic segmentation, could further refine accuracy by mitigating size-related biases and reducing misclassification errors.
Buildings with non-linear contours, such as those with curved boundaries, present significant challenges for rotated bounding boxes. Figure 16a indicates that their rigid rectangular geometry often fails to conform to these shapes, resulting in missed detections or fragmented coverage. This limitation becomes most apparent with domed or circular buildings, as the rigid edges of rotated bounding boxes struggle to conform to their curved structures. Hence, portions of these buildings may be missed or inconsistently detected, leading to an increase in FNs.
In contrast, elliptical bounding boxes, as presented in Figure 16b, adapt more effectively to curved boundaries, ensuring better alignment with the actual geometry of the buildings. By adapting to non-linear contours, elliptical bounding boxes effectively reduce detection errors and minimize FNs. However, they also present challenges. In densely packed environments, their wider coverage can mistakenly capture adjacent structures or non-building elements, occasionally producing FPs.
To mitigate these issues, integrating post-processing techniques such as edge-based refinement or semantic segmentation could enhance the performance of both bounding box types. For rotated bounding boxes, adaptive shape modeling could improve their ability to handle non-linear structures, while elliptical bounding boxes could benefit from advanced filtering methods to better differentiate target buildings from irrelevant elements.
Both bounding box types face difficulties in regions with overlapping shadows and complex layouts, as demonstrated in Figure 17. These environmental complexities can lead both bounding box types to misclassify non-building structures, such as roads or dense urban features, as buildings, resulting in FPs. In particular, elliptical bounding boxes may mistakenly capture elongated features like roads and bridges due to their continuous shape. This occurs because their broader and more adaptable contours can unintentionally encompass linear or elongated elements that resemble buildings. Rotated bounding boxes, however, struggle with shadowed areas and densely packed structures where their rigid geometry fails to differentiate between adjacent buildings and non-building features, further contributing to FPs.
To mitigate these issues, post-processing methods such as semantic filtering could be integrated to refine predictions based on object context. Semantic filtering could help distinguish true buildings from elongated features or shadowed regions, improving both bounding box types’ precision in complex urban environments.
Shadowed buildings with low visibility exacerbate the challenges for both bounding box types, as illustrated in Figure 18. Rotated bounding boxes often fail to detect such structures because they rely on distinct edge features significantly diminished under shadowed conditions. This limitation leads to incomplete or entirely missed detections, contributing to FNs. In shadowed environments, the rigid geometry of rotated bounding boxes struggles to differentiate between building edges and adjacent shadow regions, further reducing detection accuracy.
In contrast, elliptical bounding boxes perform slightly better in these scenarios, as their broader and more flexible contours allow them to approximate the general shape of buildings without relying solely on sharp edge features. However, their performance still degrades in heavily occluded scenarios, particularly when shadows obscure critical geometric details or when buildings are partially merged with surrounding structures. This can result in incomplete detections or misclassifications of non-building elements, leading to FPs.
Advanced feature extraction techniques, such as shadow-invariant feature mapping or context-aware segmentation, could be integrated into the detection pipeline to address these challenges. These methods would enhance the ability of bounding boxes to differentiate building structures from shadows and other occluding elements, improving overall accuracy in low-visibility conditions.
In summary, elliptical bounding boxes perform better in detecting distorted, high-curvature, and irregular buildings, making them more effective for complex scenarios. Although they face challenges detecting small buildings or distinguishing non-building elliptical features, their adaptability to off-nadir imagery is unmatched. Rotated bounding boxes, while effective for small buildings, struggle with irregular and curved geometries. These findings highlight the necessity of selecting bounding box types that align with specific building characteristics and environmental conditions to optimize detection accuracy.
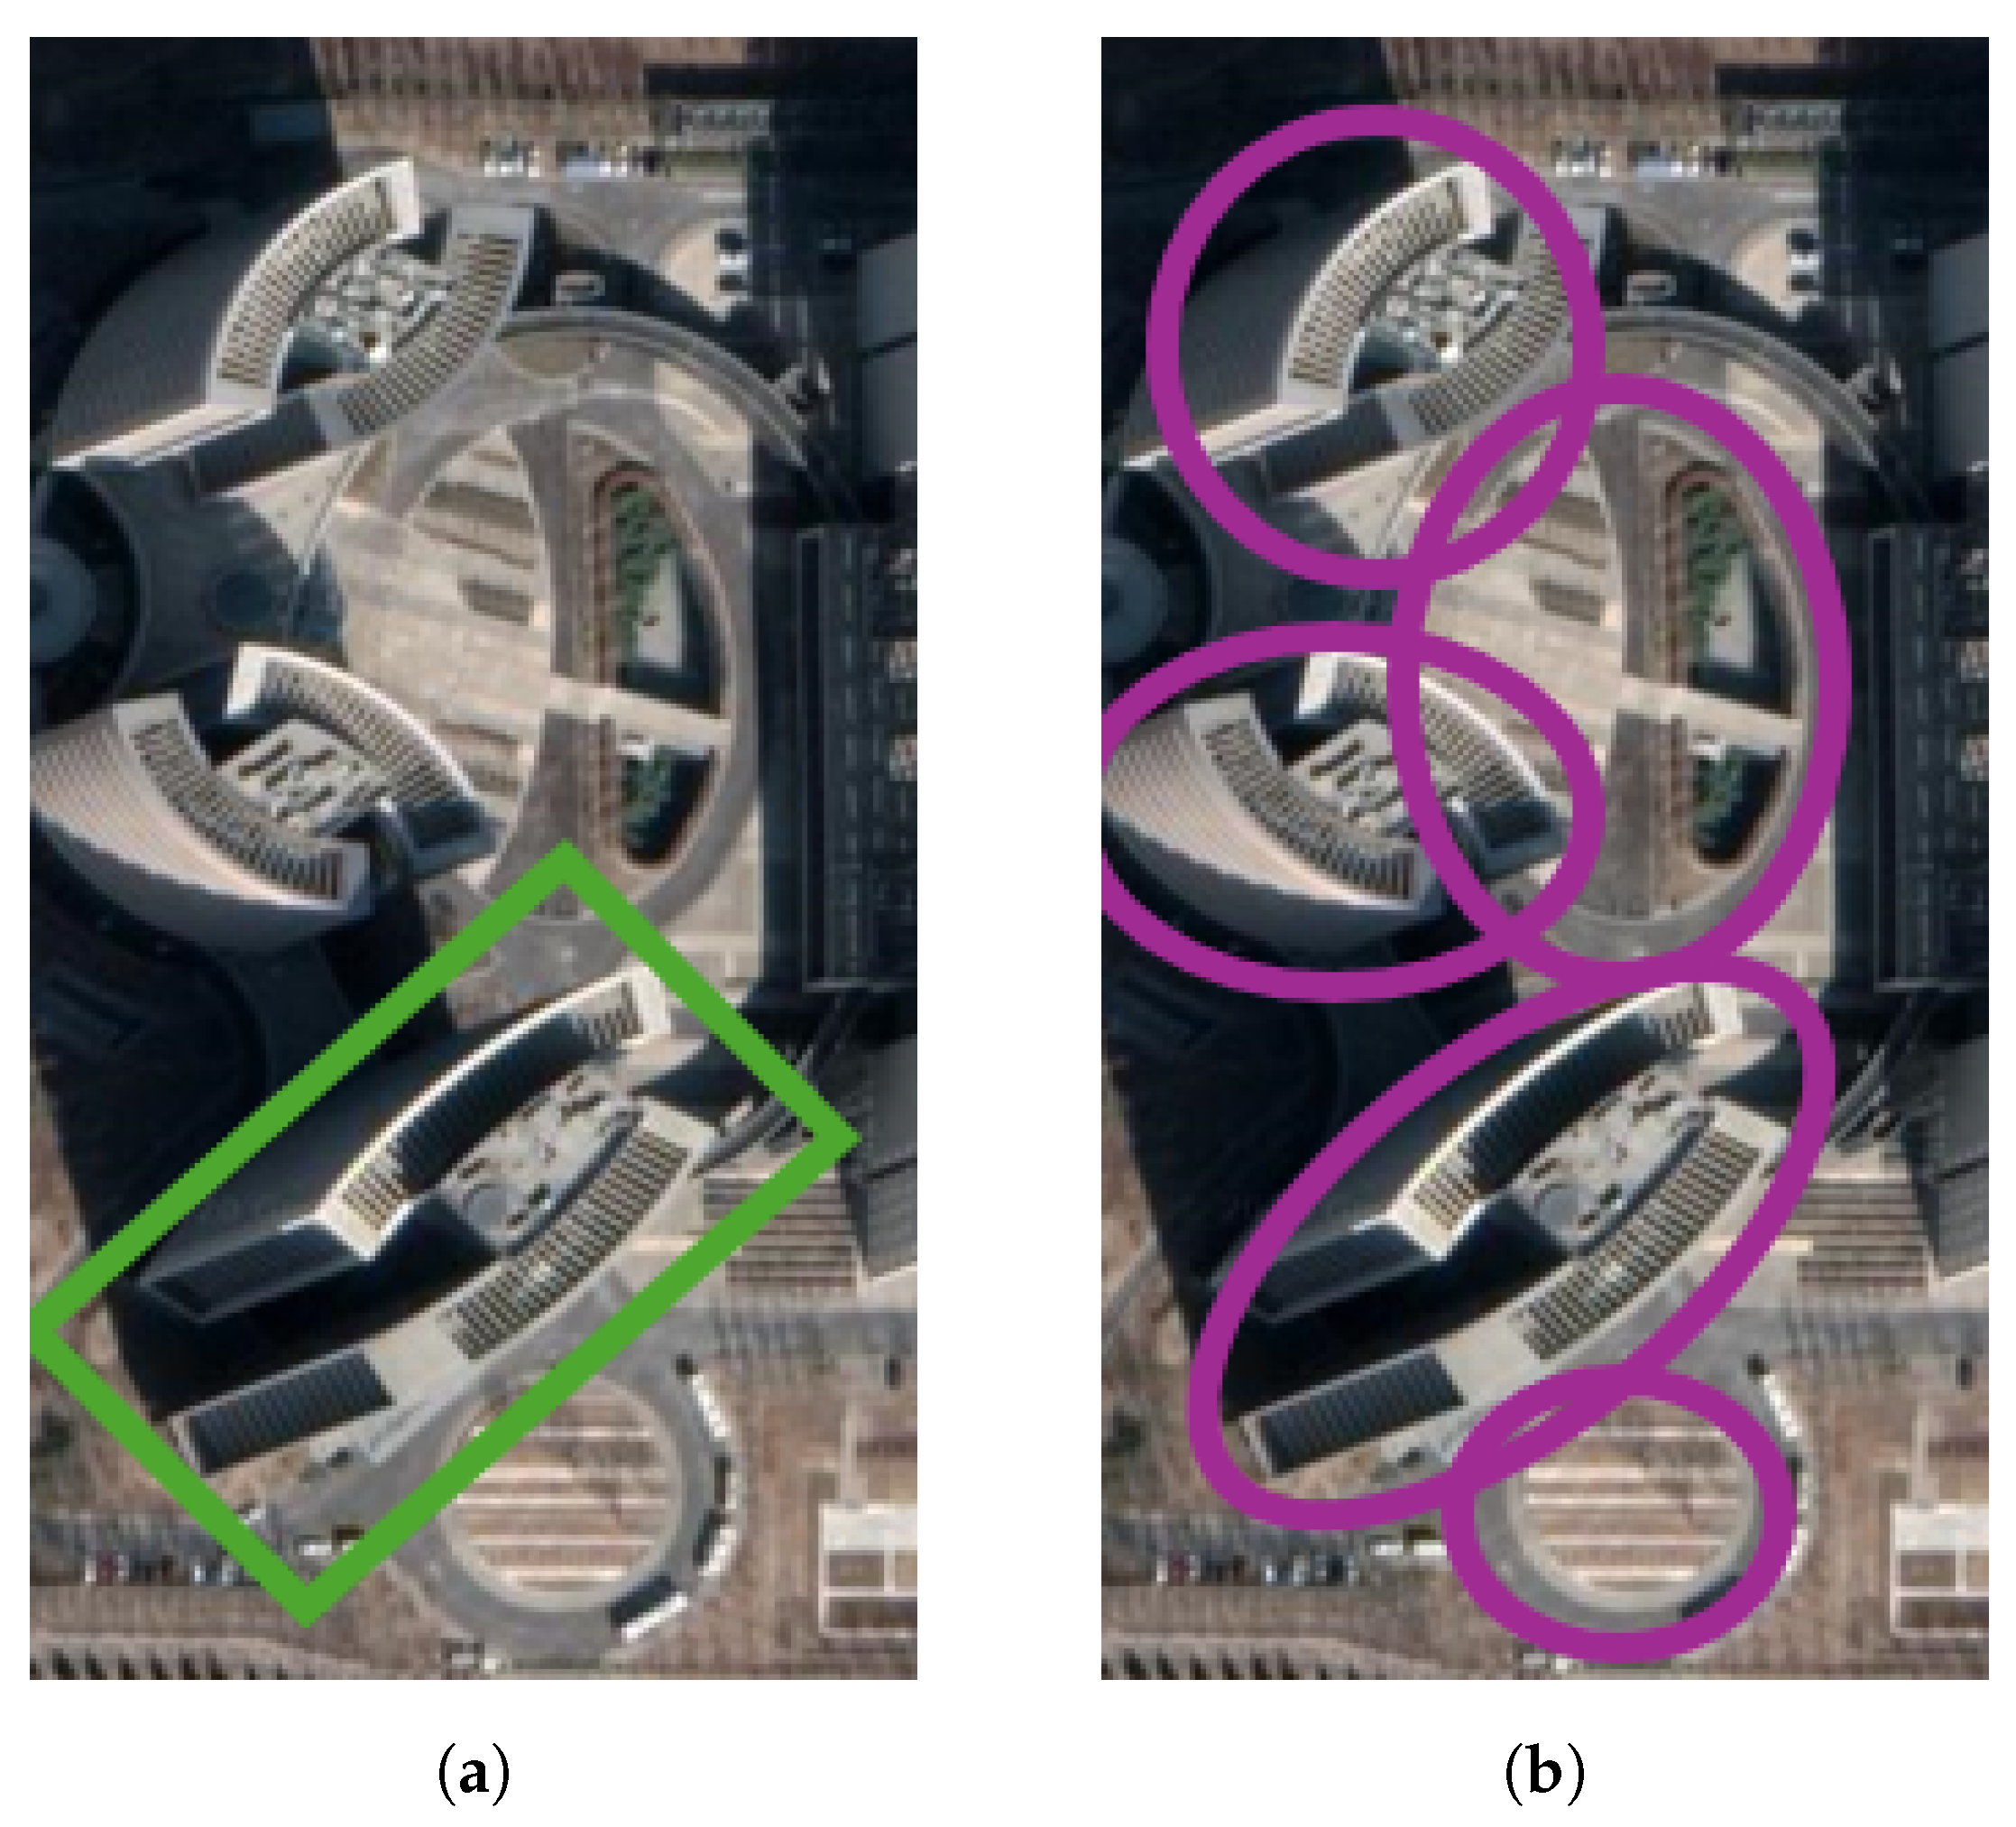
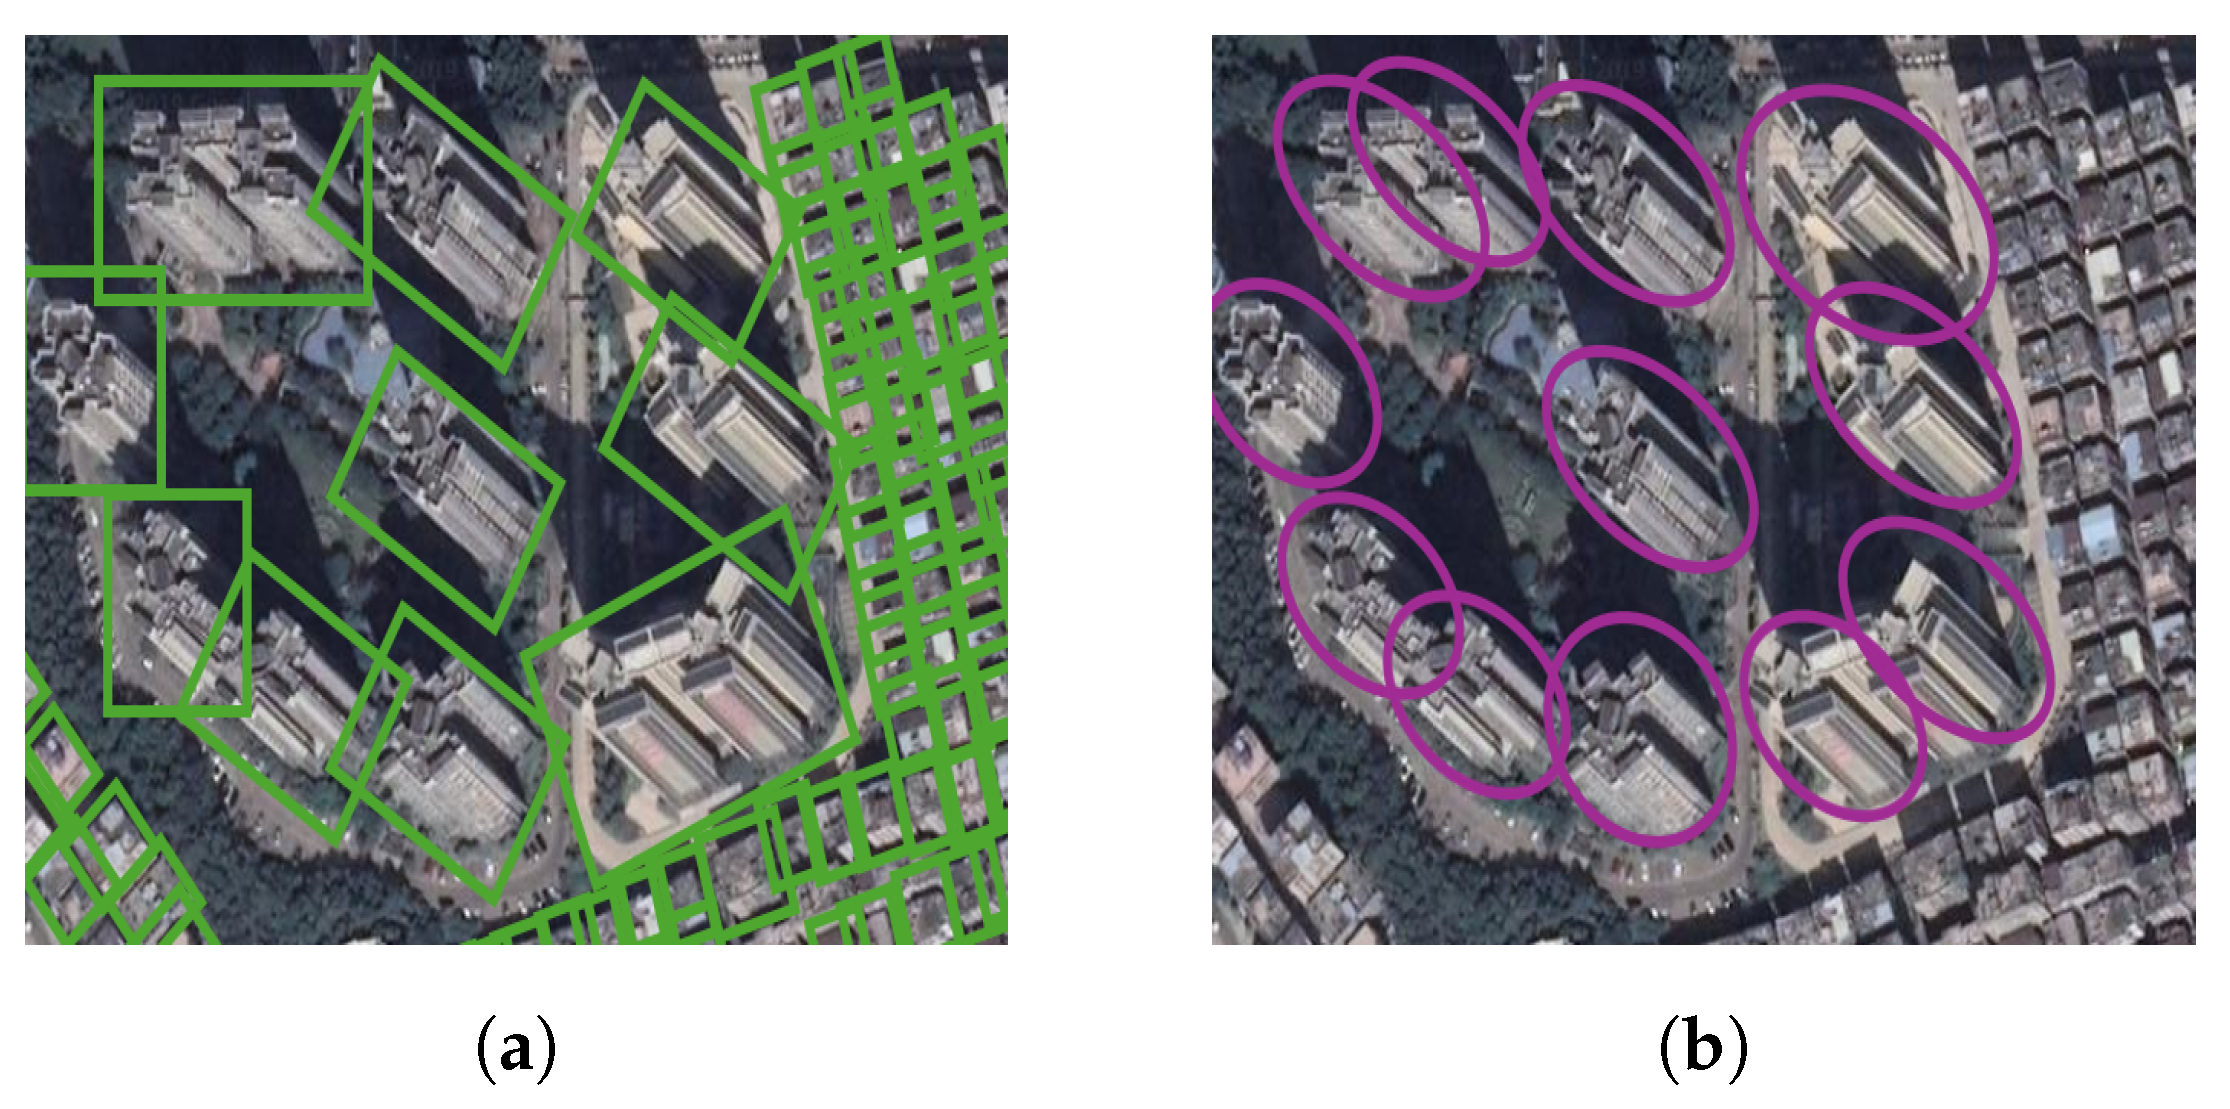
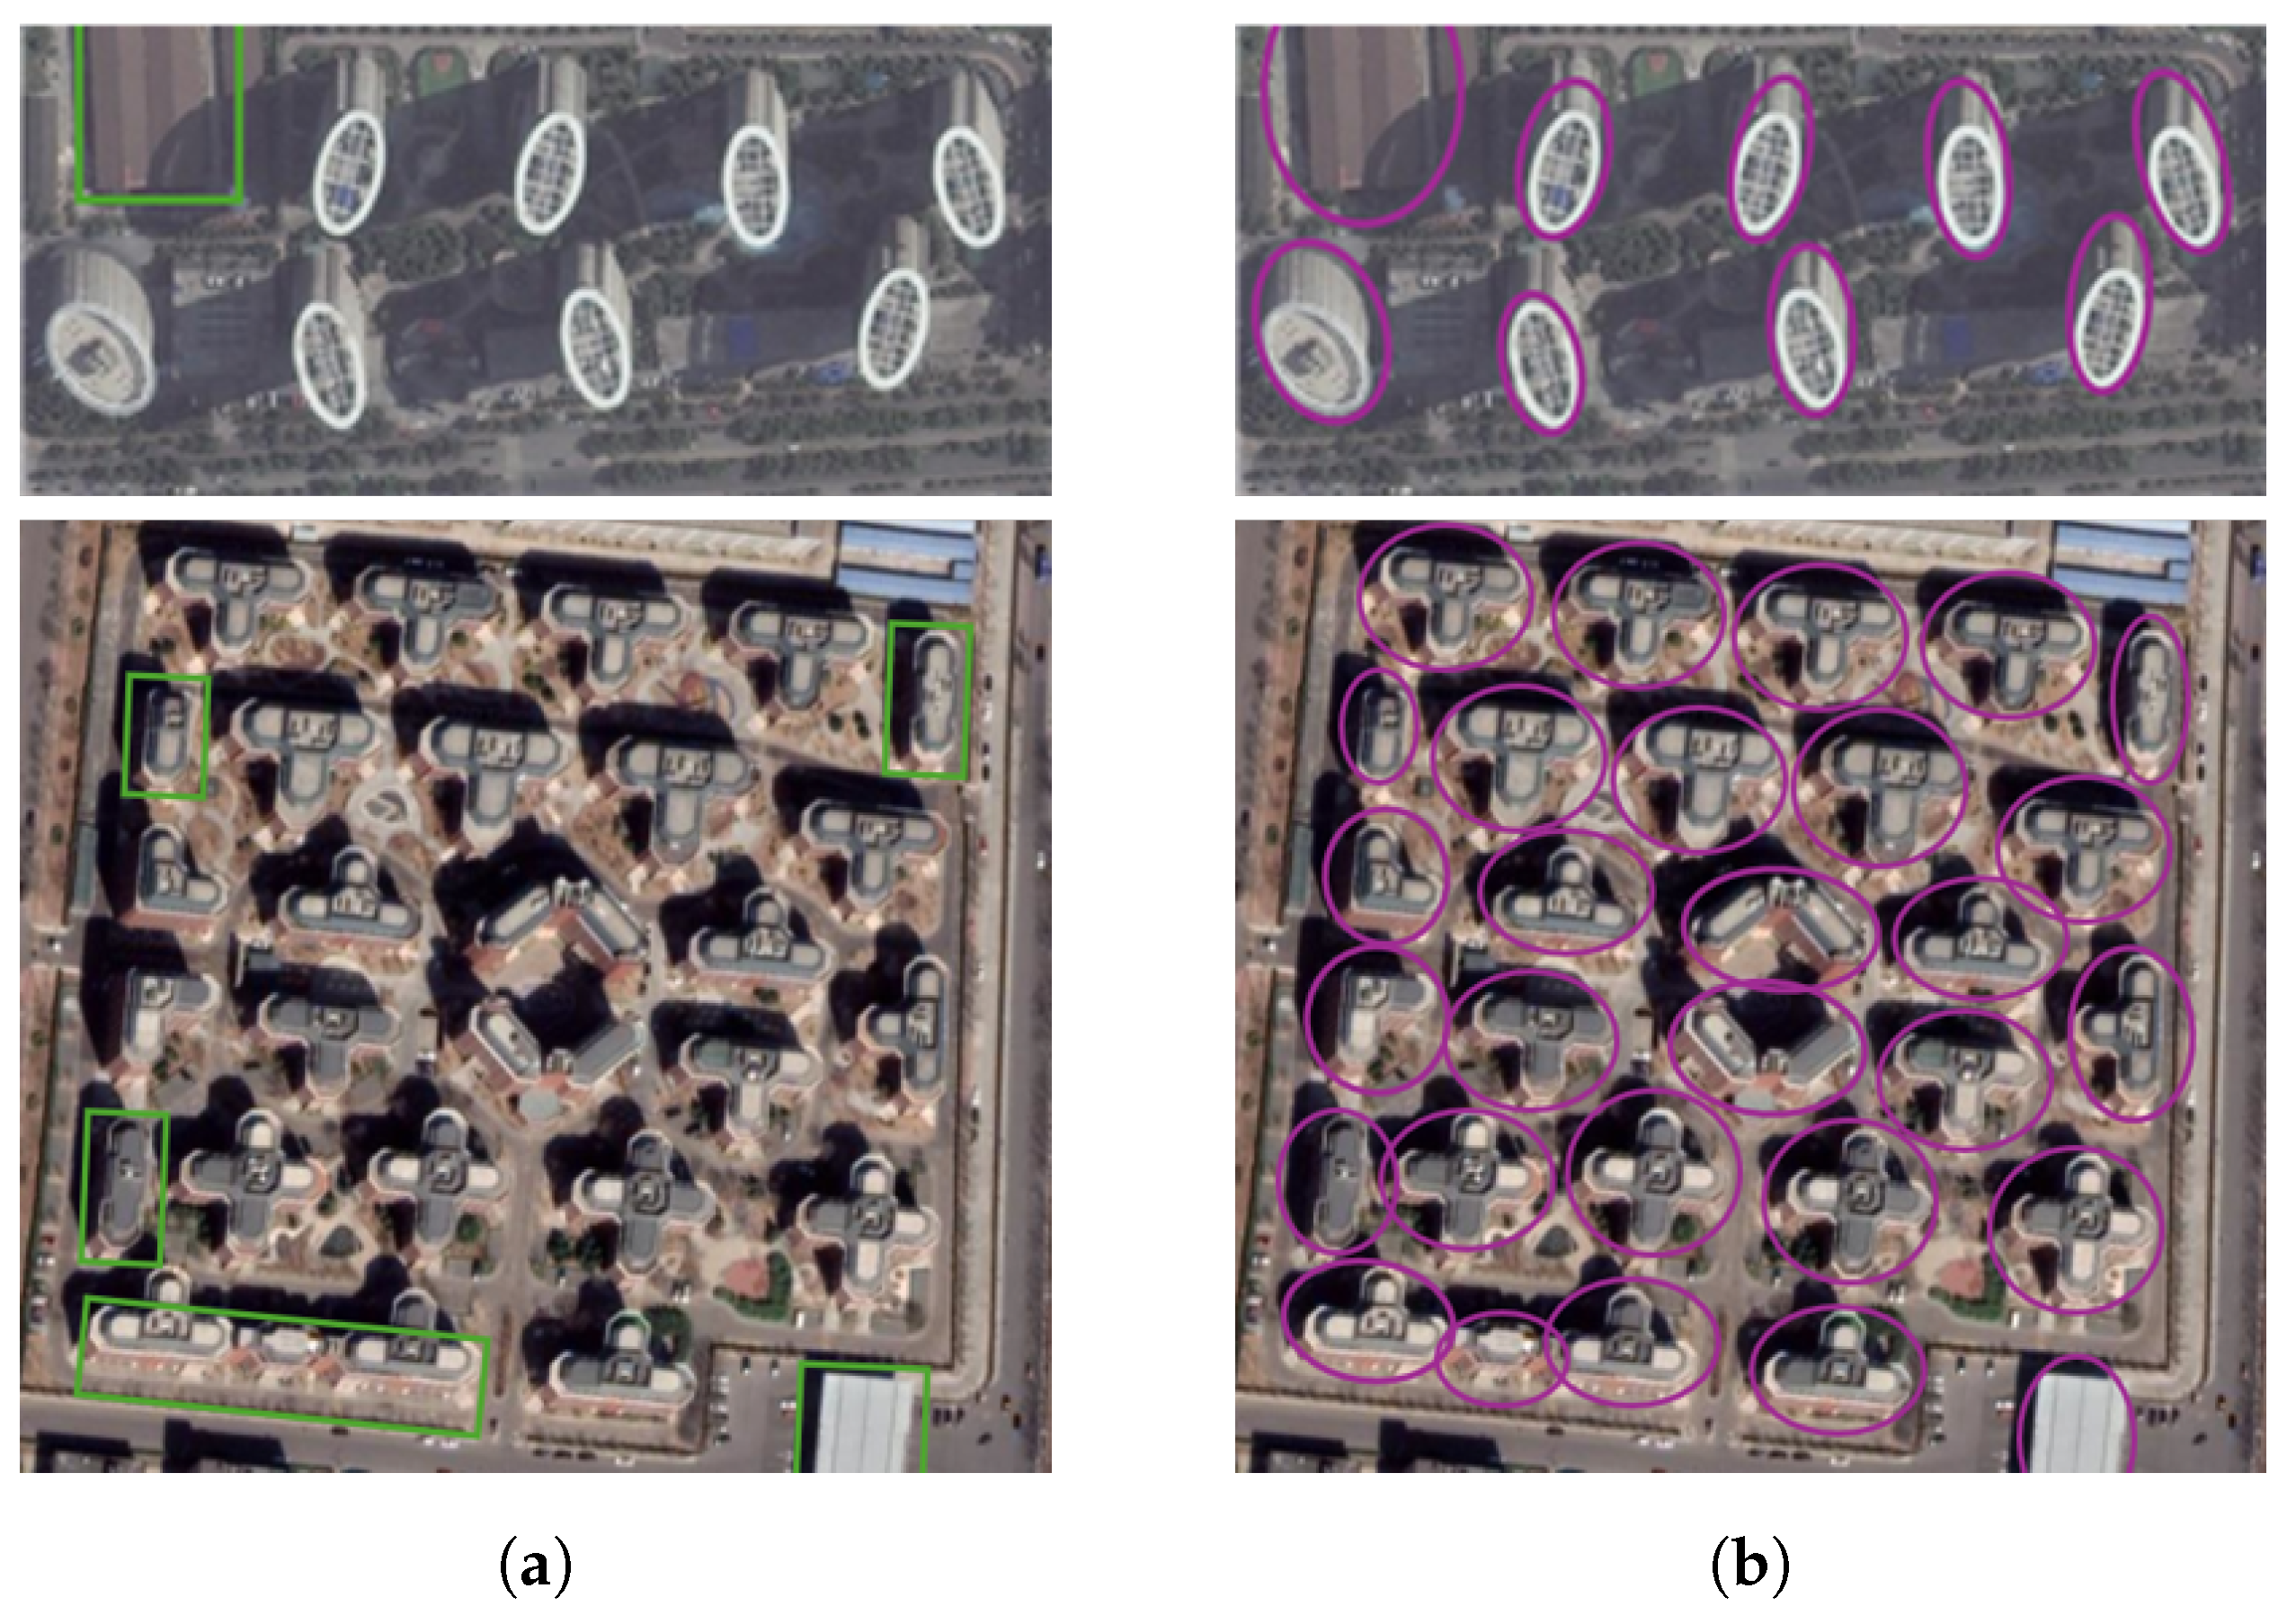
  • Error Patterns in Rotated and Elliptical Bounding Boxes
The comparison between rotated and elliptical bounding boxes highlights their strengths and limitations, influenced by building characteristics and imaging conditions. These insights help determine their suitability for different detection scenarios.
Elliptical bounding boxes excel at detecting irregular building geometries and managing perspective distortions, particularly in off-nadir imagery. For buildings with aspect ratios exceeding 2.0 or rotation angles greater than 45°, elliptical bounding boxes consistently achieve higher IoU values. Their continuous and flexible shape conforms better to non-linear or distorted footprints, such as domes or curved edges, while reducing irrelevant background inclusion. This adaptability is especially beneficial in rural or peri-urban areas with irregular structures or datasets featuring significant distortions.
Conversely, rotated bounding boxes excel in urban environments with grid-aligned, rectangular buildings. Their ability to tightly conform to straight edges ensures high precision where building separations are clear. However, their reliance on strict geometric alignment limits their effectiveness for elongated or irregular structures, often overlapping adjacent buildings or background inclusion. Rotated bounding boxes face challenges in extreme off-nadir conditions, where orientation errors lead to detection inaccuracies.
An important advantage of elliptical bounding boxes is their ability to maintain accuracy despite orientation variations. Unlike rotated bounding boxes, which require precise angle estimation, elliptical bounding boxes perform reliably even when rotation data is imprecise or absent. This makes them particularly effective in complex datasets and dense urban environments, where they minimize overlaps with nearby structures and ensure clearer boundary definitions.
Despite their advantages, elliptical bounding boxes come with notable computational drawbacks. Unlike rectangular IoU computations, which involve simple coordinate-based area intersections, elliptical IoU calculations require complex numerical approximations or advanced algebraic methods. This increases both inference time and computational load. The precise computation of overlaps between curved structures adds substantial processing overhead, posing significant challenges for real-time applications such as autonomous navigation and video surveillance, where efficiency is critical.
In addition, most existing detection frameworks are optimized for rectangular bounding boxes and do not natively support elliptical shapes. Integrating elliptical bounding boxes often necessitates custom implementations, such as specialized libraries or hardware optimizations, which can further increase development complexity. Although this overhead may be manageable in large-scale offline analyses, such as urban planning or satellite imagery interpretation, it poses a significant bottleneck for real-time systems where low latency is critical. However, the improved detection accuracy provided by elliptical bounding boxes often justifies the additional computational cost in scenarios involving complex geometries or severe distortions.
Rotated bounding boxes, while computationally efficient, are susceptible to rotation angle errors, particularly in off-nadir imagery where perspective distortions alter the building’s projected shape. These distortions make it challenging to accurately estimate the rotation angle, often leading to boundary misalignments and incomplete detections. Even minor errors in angle estimation can cause significant inaccuracies, as the bounding box fails to align correctly with actual building edges. This limitation becomes more pronounced in densely packed urban areas, where overlapping bounding boxes further complicate the separation of individual structures, reducing reliability in such scenarios.
In contrast, elliptical bounding boxes excel in scenarios involving irregular or curved structures. Their flexibility allows them to handle non-linear contours and uncertain orientations more effectively, particularly in datasets with significant distortions or off-nadir conditions. However, this adaptability comes at the cost of higher computational complexity. Unlike rectangular IoU calculations, elliptical IoU requires iterative numerical approximation or complex algebraic solutions, which can hinder real-time applications. Furthermore, owing to their broader coverage, elliptical bounding boxes may misclassify elongated non-building features, such as roads or bridges.
In conclusion, selecting the appropriate bounding box type depends on the characteristics of the target area and the intended application. Elliptical bounding boxes are well-suited for detecting irregular and curved structures, especially in off-nadir imagery or datasets with significant distortions, because of their flexibility and stability in handling uncertain orientations and complex geometries. However, their higher computational requirements and occasional misclassification of non-building features can limit their efficiency in real-time or large-scale applications. Rotated bounding boxes, by contrast, are more practical for structured urban environments with grid-aligned rectangular buildings, where their computational efficiency and precise alignment make them a compelling choice. Nevertheless, their sensitivity to rotation angle estimation errors and difficulty managing densely packed or distorted layouts reduce their effectiveness in more complex scenarios. Understanding these trade-offs is essential for optimizing bounding box selection for diverse tasks, such as remote sensing, urban analysis, or real-time monitoring.

6. Conclusions

This study highlights the advantages of elliptical bounding boxes over rotated bounding boxes for detecting buildings in off-nadir imagery, where distortions from elevation displacement and irregular geometries create significant challenges. The flexibility and adaptability of elliptical bounding boxes allow them to accurately capture complex building shapes, including circular, tilted, and asymmetrical structures, which are often distorted by oblique viewing angles. While YOLO OBB-based detectors have been explored for oriented object detection, they were excluded from this study due to their performance limitations under off-nadir conditions, where geometric distortions and severe aspect ratio variations reduce detection accuracy. Instead, this study focuses on optimizing bounding box representations within the Faster R-CNN detection pipeline.
Elliptical bounding boxes demonstrate superior performance over rotated bounding boxes across varying conditions, maintaining stable IoU trends regardless of aspect ratio or rotation angle. Their continuous and symmetrical shape enhances the detection of elongated or highly rotated buildings, significantly reducing errors caused by irregular outlines. In contrast, rotated bounding boxes struggle with non-linear or distorted geometries, leading to sharp declines in IoU under extreme conditions.
These findings suggest that while rotated bounding boxes may be suitable for straightforward scenarios, elliptical bounding boxes provide a more comprehensive solution for detecting buildings in complex environments. For example, rotated bounding boxes excel in structured urban layouts with rectangular buildings, where their computational efficiency and alignment precision are advantageous. In contrast, elliptical bounding boxes are better suited for irregular and distorted structures, such as those found in off-nadir satellite imagery or regions with architectural diversity.
In conclusion, elliptical bounding boxes significantly advance building detection for off-nadir imagery. By incorporating mechanisms like SE Channel Attention and optimizing bounding box parameters, they offer a robust and versatile solution for detecting irregular and distorted structures in diverse and challenging scenarios. However, their higher computational complexity and lack of native support in existing object detection frameworks complicate their use for real-time applications. Further optimization, such as approximated IoU calculations or efficient implementation strategies, is required to enhance their practical applicability.
Future research can focus on improving the efficiency and adaptability of elliptical bounding boxes in various remote sensing applications. Reducing computational overhead while maintaining detection accuracy is a key challenge to address. Exploring faster and more resource-efficient IoU calculation methods and developing standardized support for elliptical bounding boxes in mainstream frameworks could significantly expand their usability. Furthermore, incorporating auxiliary data sources such as LiDAR or hyperspectral imaging and refining post-processing techniques like semantic filtering could enhance detection performance in complex environments. Lastly, extending this approach beyond building detection—such as detecting other curved or irregular objects—could broaden its applicability in geospatial analysis, disaster management, and urban planning.

Author Contributions

Conceptualization, S.J. and A.S.; methodology, S.J.; software, K.L.; validation, S.J., A.S. and K.L.; investigation, K.L.; writing—original draft preparation, S.J.; writing—review and editing, A.S. and W.H.L.; visualization, S.J.; supervision, A.S. and W.H.L.; project administration, W.H.L.; funding acquisition, W.H.L. All authors have read and agreed to the published version of the manuscript.

Funding

This research was supported by the Korea Institute of Energy Technology Evaluation and Planning (KETEP), the Ministry of Trade, Industry and Energy (MOTIE) of the Republic of Korea (No. 20224000000150), and the National Research Foundation of Korea (NRF), funded by the Korean government (MSIT) (No. NRF-2021R1A5A8033165).

Data Availability Statement

The data presented in this study are available in the BONAI GitHub repository at https://github.com/jwwangchn/BONAI. These data were derived from publicly available resources.

Conflicts of Interest

The authors declare no conflicts of interest.

References

  1. Krayenhoff, E.S.; Moustaoui, M.; Broadbent, A.M.; Gupta, V.; Georgescu, M. Diurnal interaction between urban expansion, climate change and adaptation in US cities. Nat. Clim. Change 2018, 8, 1097–1103. [Google Scholar] [CrossRef]
  2. Huang, X.; Wang, Y. Investigating the effects of 3D urban morphology on the surface urban heat island effect in urban functional zones by using high-resolution remote sensing data: A case study of Wuhan, Central China. ISPRS J. Photogramm. Remote Sens. 2019, 152, 119–131. [Google Scholar]
  3. Wang, C.; Zhang, Y.; Chen, X.; Jiang, H.; Mukherjee, M.; Wang, S. Automatic building detection from high-resolution remote sensing images based on joint optimization and decision fusion of morphological attribute profiles. Remote Sens. 2021, 13, 357. [Google Scholar] [CrossRef]
  4. Yang, M.; Yu, K.; Zhang, C.; Li, Z.; Yang, K. Denseaspp for semantic segmentation in street scenes. In Proceedings of the IEEE Conference on Computer Vision and Pattern Recognition, Salt Lake City, UT, USA, 18–23 June 2018; pp. 3684–3692. [Google Scholar]
  5. Zhou, Q.; Yu, C. Point rcnn: An angle-free framework for rotated object detection. Remote Sens. 2022, 14, 2605. [Google Scholar] [CrossRef]
  6. Li, S.; Zhang, Z.; Li, B.; Li, C. Multiscale rotated bounding box-based deep learning method for detecting ship targets in remote sensing images. Sensors 2018, 18, 2702. [Google Scholar] [CrossRef]
  7. Ni, L.; Huo, C.; Zhang, X.; Wang, P.; Zhang, L.; Guo, K.; Zhou, Z. NaGAN: Nadir-like generative adversarial network for off-nadir object detection of multi-view remote sensing imagery. Remote Sens. 2022, 14, 975. [Google Scholar] [CrossRef]
  8. Hao, H.; Baireddy, S.; LaTourette, K.; Konz, L.; Chan, M.; Comer, M.L.; Delp, E.J. Improving building segmentation for off-nadir satellite imagery. arXiv 2021, arXiv:2109.03961. [Google Scholar]
  9. Pang, C.; Wu, J.; Ding, J.; Song, C.; Xia, G.S. Detecting building changes with off-nadir aerial images. Sci. China Inf. Sci. 2023, 66, 140306. [Google Scholar]
  10. McNally, S.; Nielsen, A.; Barrieau, A.; Jabari, S. Improving Off-Nadir Deep Learning-Based Change and Damage Detection through Radiometric Enhancement. Int. Arch. Photogramm. Remote Sens. Spat. Inf. Sci. 2024, 48, 33–39. [Google Scholar]
  11. Xia, G.S.; Bai, X.; Ding, J.; Zhu, Z.; Belongie, S.; Luo, J.; Datcu, M.; Pelillo, M.; Zhang, L. DOTA: A large-scale dataset for object detection in aerial images. In Proceedings of the IEEE Conference on Computer Vision and Pattern Recognition, Salt Lake City, UT, USA, 18–23 June 2018; pp. 3974–3983. [Google Scholar]
  12. Ding, J.; Xue, N.; Long, Y.; Xia, G.S.; Lu, Q. Learning RoI transformer for oriented object detection in aerial images. In Proceedings of the IEEE/CVF Conference on Computer Vision and Pattern Recognition, Long Beach, CA, USA, 15–20 June 2019; pp. 2849–2858. [Google Scholar]
  13. Follmann, P.; König, R. Oriented boxes for accurate instance segmentation. arXiv 2019, arXiv:1911.07732. [Google Scholar]
  14. He, X.; Ma, S.; He, L.; Ru, L.; Wang, C. Learning rotated inscribed ellipse for oriented object detection in remote sensing images. Remote Sens. 2021, 13, 3622. [Google Scholar] [CrossRef]
  15. Dong, R.; Yin, S.; Jiao, L.; An, J.; Wu, W. ASIPNet: Orientation-Aware Learning Object Detection for Remote Sensing Images. Remote Sens. 2024, 16, 2992. [Google Scholar] [CrossRef]
  16. Wang, J.; Meng, L.; Li, W.; Yang, W.; Yu, L.; Xia, G.S. Learning to extract building footprints from off-nadir aerial images. IEEE Trans. Pattern Anal. Mach. Intell. 2022, 45, 1294–1301. [Google Scholar]
  17. Chen, J.; Jiang, Y.; Luo, L.; Gong, W. ASF-Net: Adaptive screening feature network for building footprint extraction from remote-sensing images. IEEE Trans. Geosci. Remote Sens. 2022, 60, 4706413. [Google Scholar]
  18. Zhang, H.; Xu, C.; Fan, Z.; Li, W.; Sun, K.; Li, D. Detection and Classification of Buildings by Height from Single Urban High-Resolution Remote Sensing Images. Appl. Sci. 2023, 13, 10729. [Google Scholar] [CrossRef]
  19. Ali, M.M.; Moon, K.S. Advances in structural systems for tall buildings: Emerging developments for contemporary urban giants. Buildings 2018, 8, 104. [Google Scholar] [CrossRef]
  20. Anand, A.; Deb, C. The potential of remote sensing and GIS in urban building energy modelling. Energy Built Environ. 2024, 5, 957–969. [Google Scholar]
  21. Biljecki, F.; Chow, Y.S. Global building morphology indicators. Comput. Environ. Urban Syst. 2022, 95, 101809. [Google Scholar]
  22. Lian, W.; Sen, W. Building Structural Design Innovation and Code Development. Int. J. Archit. Arts Appl. 2024, 10, 9–19. [Google Scholar] [CrossRef]
  23. Zand, M.; Etemad, A.; Greenspan, M. Oriented bounding boxes for small and freely rotated objects. IEEE Trans. Geosci. Remote Sens. 2021, 60, 4701715. [Google Scholar]
  24. Huang, X.; Zhang, L. A multidirectional and multiscale morphological index for automatic building extraction from multispectral GeoEye-1 imagery. Photogramm. Eng. Remote Sens. 2011, 77, 721–732. [Google Scholar] [CrossRef]
  25. Swan, B.; Laverdiere, M.; Yang, H.L.; Rose, A. Iterative self-organizing SCEne-LEvel sampling (ISOSCELES) for large-scale building extraction. GIScience Remote Sens. 2022, 59, 1–16. [Google Scholar] [CrossRef]
  26. Sirmacek, B.; Unsalan, C. Building detection from aerial images using invariant color features and shadow information. In Proceedings of the 2008 23rd International Symposium on Computer and Information Sciences, Istanbul, Turkey, 27–29 October 2008; pp. 1–5. [Google Scholar]
  27. Mnih, V.; Hinton, G.E. Learning to detect roads in high-resolution aerial images. In Computer Vision–ECCV 2010, Proceedings of the 11th European Conference on Computer Vision, Heraklion, Greece, 5–11 September 2010; Proceedings, Part VI 11; Springer: Berlin/Heidelberg, Germany, 2010; pp. 210–223. [Google Scholar]
  28. Long, J.; Shelhamer, E.; Darrell, T. Fully convolutional networks for semantic segmentation. In Proceedings of the IEEE Conference on Computer Vision and Pattern Recognition, Boston, MA, USA, 7–12 June 2015; pp. 3431–3440. [Google Scholar]
  29. Ronneberger, O.; Fischer, P.; Brox, T. U-net: Convolutional networks for biomedical image segmentation. In Medical Image Computing and Computer-Assisted Intervention–MICCAI 2015, Proceedings of the 18th International Conference, Munich, Germany, 5–9 October 2015; Proceedings, Part III 18; Springer: Berlin/Heidelberg, Germany, 2015; pp. 234–241. [Google Scholar]
  30. Lei, J.; Liu, X.; Yang, H.; Zeng, Z.; Feng, J. Dual Hybrid Attention Mechanism-Based U-Net for Building Segmentation in Remote Sensing Images. Appl. Sci. 2024, 14, 1293. [Google Scholar] [CrossRef]
  31. Attarzadeh, R.; Momeni, M. Object-based rule sets and its transferability for building extraction from high resolution satellite imagery. J. Indian Soc. Remote Sens. 2018, 46, 169–178. [Google Scholar] [CrossRef]
  32. Ngo, T.T.; Mazet, V.; Collet, C.; De Fraipont, P. Shape-based building detection in visible band images using shadow information. IEEE J. Sel. Top. Appl. Earth Obs. Remote Sens. 2016, 10, 920–932. [Google Scholar] [CrossRef]
  33. Cheng, G.; Zhou, P.; Han, J. Learning rotation-invariant convolutional neural networks for object detection in VHR optical remote sensing images. IEEE Trans. Geosci. Remote Sens. 2016, 54, 7405–7415. [Google Scholar] [CrossRef]
  34. Jung, S.; Lee, W.H.; Han, Y. Change detection of building objects in high-resolution single-sensor and multi-sensor imagery considering the sun and sensor’s elevation and azimuth angles. Remote Sens. 2021, 13, 3660. [Google Scholar] [CrossRef]
  35. Dosovitskiy, A. An image is worth 16x16 words: Transformers for image recognition at scale. arXiv 2020, arXiv:2010.11929. [Google Scholar]
  36. Abdollahi, A.; Pradhan, B.; Gite, S.; Alamri, A. Building footprint extraction from high resolution aerial images using generative adversarial network (GAN) architecture. IEEE Access 2020, 8, 209517–209527. [Google Scholar] [CrossRef]
  37. Pang, S.; Hu, X.; Wang, Z.; Lu, Y. Object-based analysis of airborne LiDAR data for building change detection. Remote Sens. 2014, 6, 10733–10749. [Google Scholar] [CrossRef]
  38. Hamaguchi, R.; Hikosaka, S. Building detection from satellite imagery using ensemble of size-specific detectors. In Proceedings of the IEEE Conference on Computer Vision and Pattern Recognition Workshops, Salt Lake City, UT, USA, 18–23 June 2018; pp. 187–191. [Google Scholar]
  39. Tu, Y.H.; Johansen, K.; Aragon, B.; Stutsel, B.M.; Ángel, Y.; Camargo, O.A.L.; Al-Mashharawi, S.K.; Jiang, J.; Ziliani, M.G.; McCabe, M.F. Combining nadir, oblique, and façade imagery enhances reconstruction of rock formations using unmanned aerial vehicles. IEEE Trans. Geosci. Remote Sens. 2021, 59, 9987–9999. [Google Scholar]
  40. Ji, S.; Wei, S.; Lu, M. Fully convolutional networks for multisource building extraction from an open aerial and satellite imagery data set. IEEE Trans. Geosci. Remote Sens. 2018, 57, 574–586. [Google Scholar]
  41. Jang, H.; Kim, S.; Yoo, S.; Han, S.; Sohn, H.G. Feature matching combining radiometric and geometric characteristics of images, applied to oblique-and nadir-looking visible and TIR sensors of UAV imagery. Sensors 2021, 21, 4587. [Google Scholar] [CrossRef]
  42. Fatty, A.; Li, A.J.; Yao, C.Y. Instance segmentation based building extraction in a dense urban area using multispectral aerial imagery data. Multimed. Tools Appl. 2024, 83, 61913–61928. [Google Scholar]
  43. Ye, S.; Nedzved, A.; Chen, C.; Chen, H.; Leunikau, A.; Belotserkovsky, A. Shadow detection on urban satellite images based on building texture. Pattern Recognit. Image Anal. 2022, 32, 332–339. [Google Scholar]
  44. Wang, J.; Sun, K.; Cheng, T.; Jiang, B.; Deng, C.; Zhao, Y.; Liu, D.; Mu, Y.; Tan, M.; Wang, X.; et al. Deep high-resolution representation learning for visual recognition. IEEE Trans. Pattern Anal. Mach. Intell. 2020, 43, 3349–3364. [Google Scholar]
  45. Wu, J.; Su, L.; Lin, Z.; Chen, Y.; Ji, J.; Li, T. Object Detection of Flexible Objects with Arbitrary Orientation Based on Rotation-Adaptive YOLOv5. Sensors 2023, 23, 4925. [Google Scholar] [CrossRef]
  46. Qu, H.; Tong, C.; Liu, W. Image shadow removal algorithm guided by progressive attention mechanism. Signal Image Video Process. 2023, 17, 2565–2571. [Google Scholar]
  47. Yang, X.; Yang, J.; Yan, J.; Zhang, Y.; Zhang, T.; Guo, Z.; Sun, X.; Fu, K. Scrdet: Towards more robust detection for small, cluttered and rotated objects. In Proceedings of the IEEE/CVF International Conference on Computer Vision, Seoul, Republic of Korea, 27 October–2 November 2019; pp. 8232–8241. [Google Scholar]
  48. Zhou, K.; Zhang, M.; Zhao, H.; Tang, R.; Lin, S.; Cheng, X.; Wang, H. Arbitrary-oriented ellipse detector for ship detection in remote sensing images. IEEE J. Sel. Top. Appl. Earth Obs. Remote Sens. 2023, 16, 7151–7162. [Google Scholar]
  49. Acuna, D.; Ling, H.; Kar, A.; Fidler, S. Efficient interactive annotation of segmentation datasets with polygon-rnn++. In Proceedings of the IEEE Conference on Computer Vision and Pattern Recognition, Salt Lake City, UT, USA, 18–23 June 2018; pp. 859–868. [Google Scholar]
  50. Ahn, S.J.; Rauh, W.; Warnecke, H.J. Least-squares orthogonal distances fitting of circle, sphere, ellipse, hyperbola, and parabola. Pattern Recognit. 2001, 34, 2283–2303. [Google Scholar] [CrossRef]
  51. Lin, T.Y.; Dollár, P.; Girshick, R.; He, K.; Hariharan, B.; Belongie, S. Feature pyramid networks for object detection. In Proceedings of the IEEE Conference on Computer Vision and Pattern Recognition, Honolulu, HI, USA, 21–26 July 2017; pp. 2117–2125. [Google Scholar]
  52. Hu, J.; Shen, L.; Sun, G. Squeeze-and-excitation networks. In Proceedings of the IEEE Conference on Computer Vision and Pattern Recognition, Salt Lake City, UT, USA, 18–23 June 2018; pp. 7132–7141. [Google Scholar]
Figure 1. Proposed method for generating rotated or elliptical anchor boxes.
Remotesensing 17 01247 g001
Figure 2. Schematic of the SE block (colors are used for visual clarity only).
Remotesensing 17 01247 g002
Figure 3. Integration of SE block into ResNet module (SE-ResNet).
Remotesensing 17 01247 g003
Figure 4. Definition of p 0 = ( x 0 , y 0 ) as a reference point (illustration only; axes omitted for clarity).
Remotesensing 17 01247 g004
Figure 5. List of points sorted by angle.
Remotesensing 17 01247 g005
Figure 6. Vector direction between three points: (a) counterclockwise (left) direction, (b) clockwise (right) direction.
Remotesensing 17 01247 g006
Figure 7. Convex polygon formed by outer points (orange) and red connecting lines (illustration only).
Remotesensing 17 01247 g007
Figure 8. Rotating calipers applied to a convex polygon. Outer points are shown in orange, and red lines form the convex hull. Gray lines represent the rotating calipers (Illustration only; axes omitted for clarity).
Remotesensing 17 01247 g008
Figure 9. Regression parameters in rotated bounding box.
Remotesensing 17 01247 g009
Figure 10. Regression parameters in elliptical bounding box.
Remotesensing 17 01247 g010
Figure 11. Examples of buildings in the BONAI dataset: (a) Beijing, (b) Chengdu, (c) Harbin, (d) Jinan, (e) Xi’an, and (f) Shanghai.
Remotesensing 17 01247 g011
Figure 12. IoU distribution: (a) rotated bounding box and (b) elliptical bounding box, illustrating that elliptical boxes produce higher and more consistent IoU values under off-nadir conditions.
Remotesensing 17 01247 g012
Figure 13. IoU distribution for irregular buildings using elliptical and rotated bounding boxes, showing tighter clustering for elliptical boxes and improved detection stability.
Remotesensing 17 01247 g013
Figure 14. Detection of elliptical building features: (a) rotated bounding box fails to align with curved shapes, while (b) elliptical bounding box captures contours more effectively.
Remotesensing 17 01247 g014
Figure 15. Detection of small buildings: (a) rotated bounding box aligns closely with compact structures whereas (b) elliptical bounding box shows reduced accuracy.
Remotesensing 17 01247 g015
Figure 16. Detection of buildings with curved outlines: (a) rotated bounding boxes show poor fit while (b) elliptical bounding boxes adapt better to non-linear contours.
Remotesensing 17 01247 g016
Figure 17. False detections in complex urban areas: (a) rotated bounding box and (b) elliptical bounding box. Both struggle with elongated roads or dense structures, but elliptical boxes are more prone to include non-building shapes.
Remotesensing 17 01247 g017
Figure 18. Detection errors in shadowed regions: (a) rotated bounding box misses low-contrast edges while (b) elliptical bounding box partially captures the structure but suffers from occlusion.
Remotesensing 17 01247 g018
Table 1. Summary of BONAI dataset.
BONAI DatasetCity# of Imagery# of Instances
Training setShanghai1656167,595
Beijing68436,932
Chengdu724448
Harbin28816,480
Validation setShanghai22816,747
Jinan726147
Test setShanghai20015,100
Xi’an1005489
Total-3300268,958
Table 2. Performance metrics for different bounding box types.
Bounding Box TypeIoUPRF1 Score
Aligned0.580.770.690.73
Rotated0.720.900.810.85
Elliptical0.880.930.910.92
Table 3. Detection and miss rates by bounding box type.
Bounding Box TypeDetectedUndetectedDetection Rate (%)Miss Rate (%)
Aligned13,537705265.7534.25
Rotated17,940264987.1312.87
Elliptical18,933165691.968.04
Table 4. Detection accuracy by building type.
Bounding Box TypeBuilding TypeIoUPRF1 Score
RotatedRegular0.880.940.910.94
Irregular0.790.810.780.79
EllipticalRegular0.840.920.880.90
Irregular0.810.820.800.82
Table 5. Detection, miss, and false detection rates for irregular buildings.
Bounding Box TypeDetection Rate (%)Miss Rate (%)False Detection Rate (%)
Rotated84.7915.215.93
Elliptical91.938.074.59
Table 6. FN rate comparison by building type.
BuildingsRotated FN Rate (%)Elliptical FN Rate (%)
Small3.810.4
Distorted13.96.7
High curvature24.14.3
Disclaimer/Publisher’s Note: The statements, opinions and data contained in all publications are solely those of the individual author(s) and contributor(s) and not of MDPI and/or the editor(s). MDPI and/or the editor(s) disclaim responsibility for any injury to people or property resulting from any ideas, methods, instructions or products referred to in the content.

