
Rooftop Solar Photovoltaic Potential in Polluted Indian Cities: Atmospheric and Urban Impacts, Climate Trends, Societal Gains, and Economic Opportunities


Abstract

1. Introduction
2. Materials and Methods
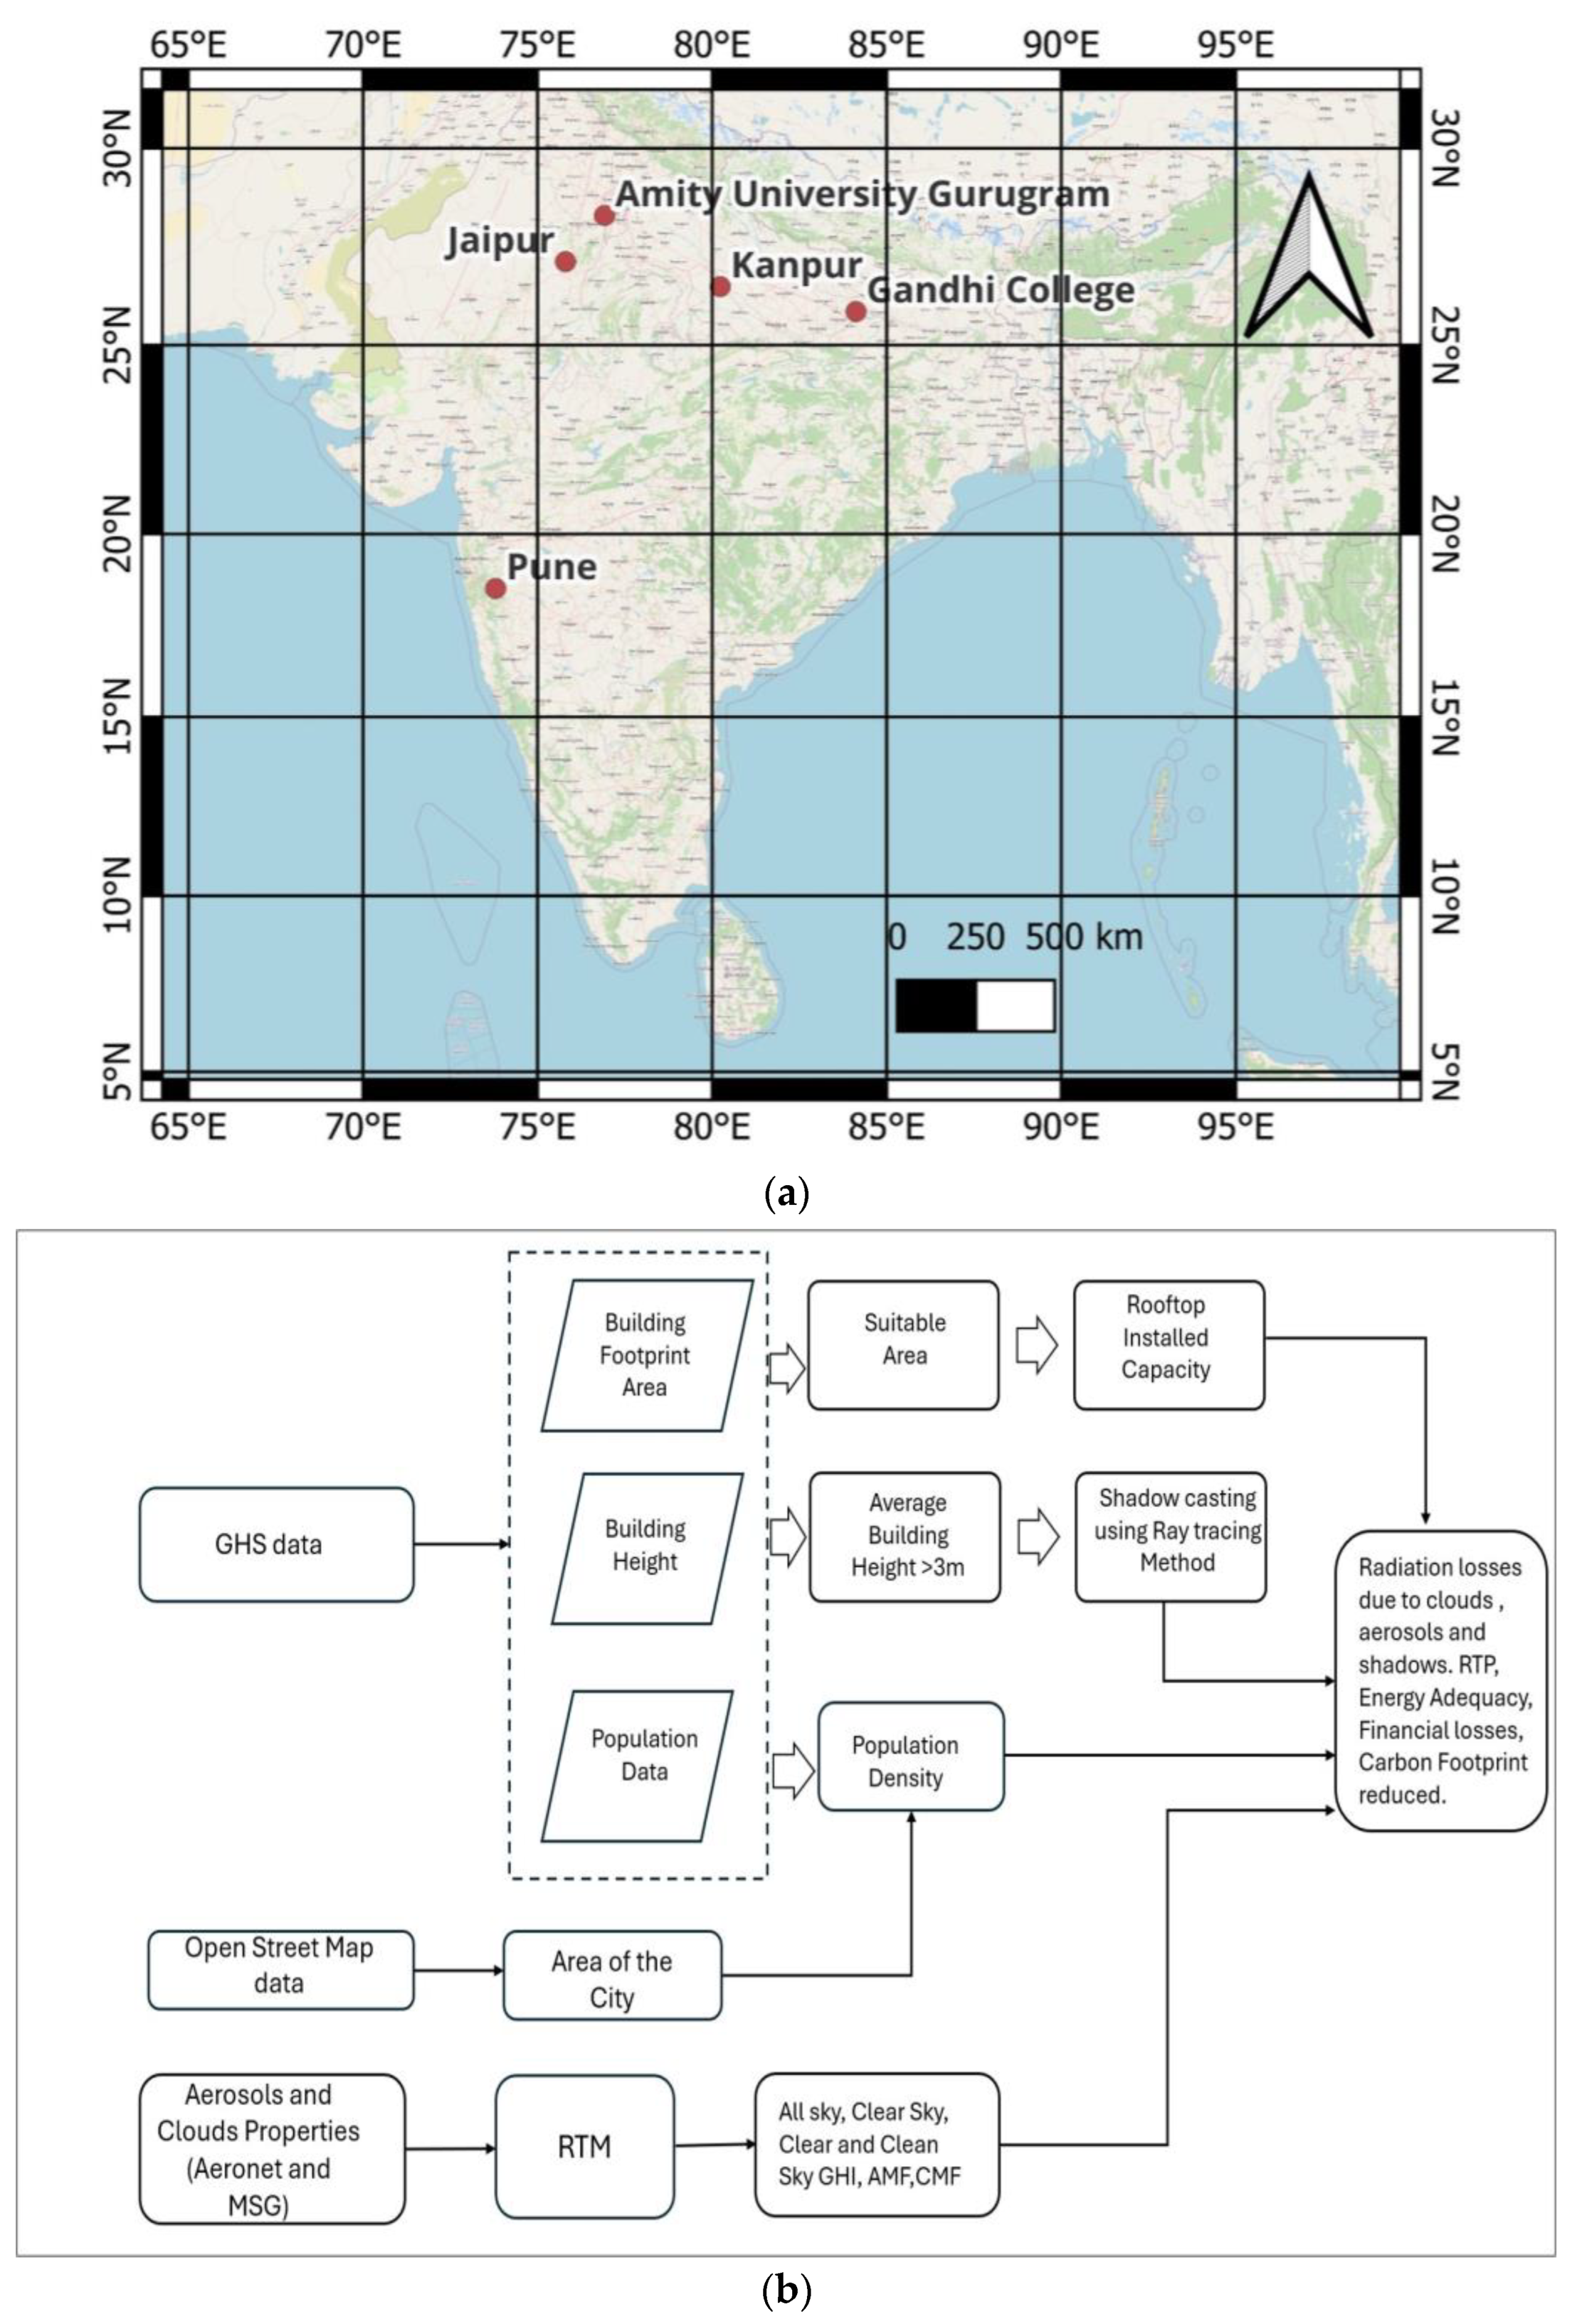
2.1. Study Area
2.2. Aerosol and Clouds Data
2.3. GHS Data
2.4. Simulations of Solar Radiation
2.5. Shadow Casting in Different Environments
2.6. The Calculation of the Rooftop Area and Its Potential
2.7. An Estimation of the Energy Adequacy, Financial Losses, and Earnings
3. Results
3.1. The Variation of Aerosol and Clouds Properties
3.2. The Variation of Architecture Effects Parameters
3.3. Aerosol and Cloud Effects on Solar Radiations
3.4. Rooftop Area and Rooftop Photovoltaic Potential Under Different Scenarios
4. Discussions
4.1. Solar Energy Planning
4.2. Financial Analysis
4.3. The Equivalent Reduction in Carbon Footprints
4.4. Future Challenges from India’s Perspective
5. Conclusions
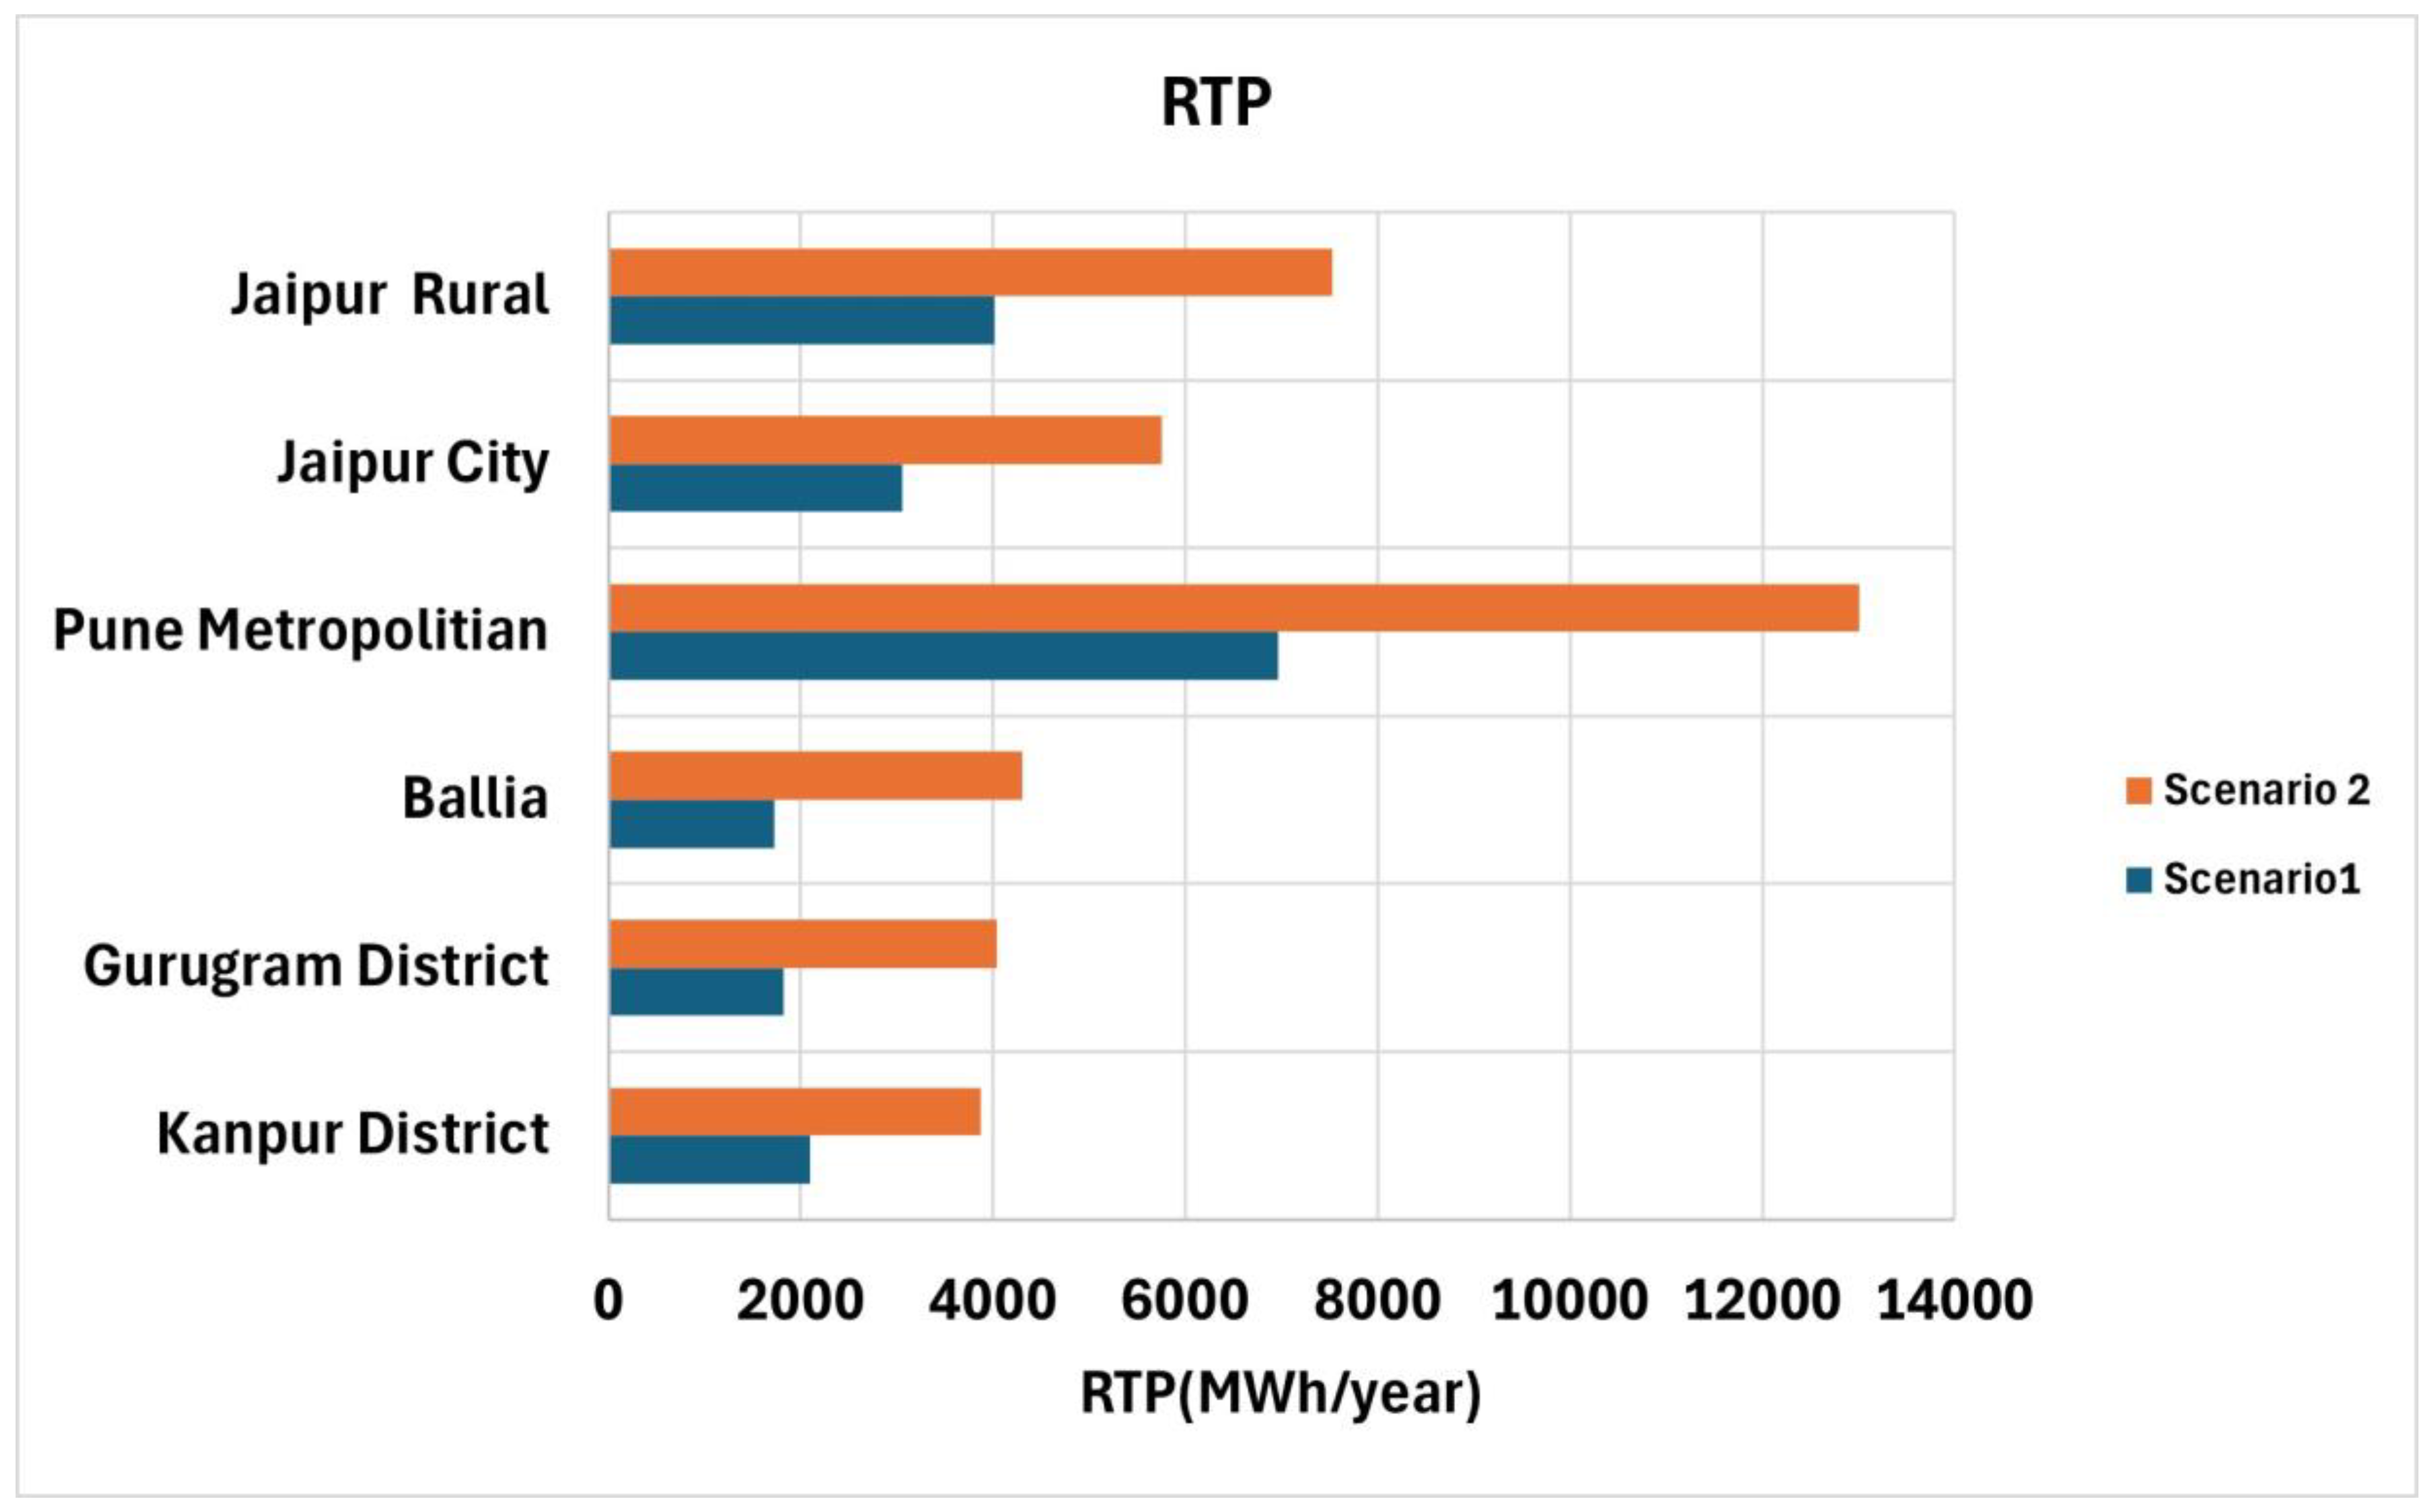
- The present research estimates the maximum total RTP for the southern city of Pune metropolitan to be approximately 6970.66 ± 751.38 MWh/year (13,005.65 ± 1210.71 MWh/year). In the central zone, the total RTP for the cities of Ballia and Kanpur is estimated at 3816.83 ± 541.24 MWh/year (8175.26 ± 818.59 MWh/year) under scenario 1 (scenario 2). The total RTP for the western zone cities, including Jaipur rural and city, is around 7073.38 ± 828.69 MWh/year (13,287.36 ± 1297.87 MWh/year). Conversely, the RTP assessment indicates a lower potential for the northern zone city of Gurugram, estimated at 1822.87 ± 257.99 MWh/year (4036.46 ± 388.25 MWh/year). Thus, it depicted the higher RTP over western zone cities of the country. Moreover, the RTP in the rural city examined in this study is 31% greater than the urban city of India under both scenarios.
- For the polluted Indian cities examined in this current research, we determined that tilting the plane of irradiance PV panels at an angle equivalent to the latitude of the location provides a superior long-term performance compared to a horizontal arrangement.
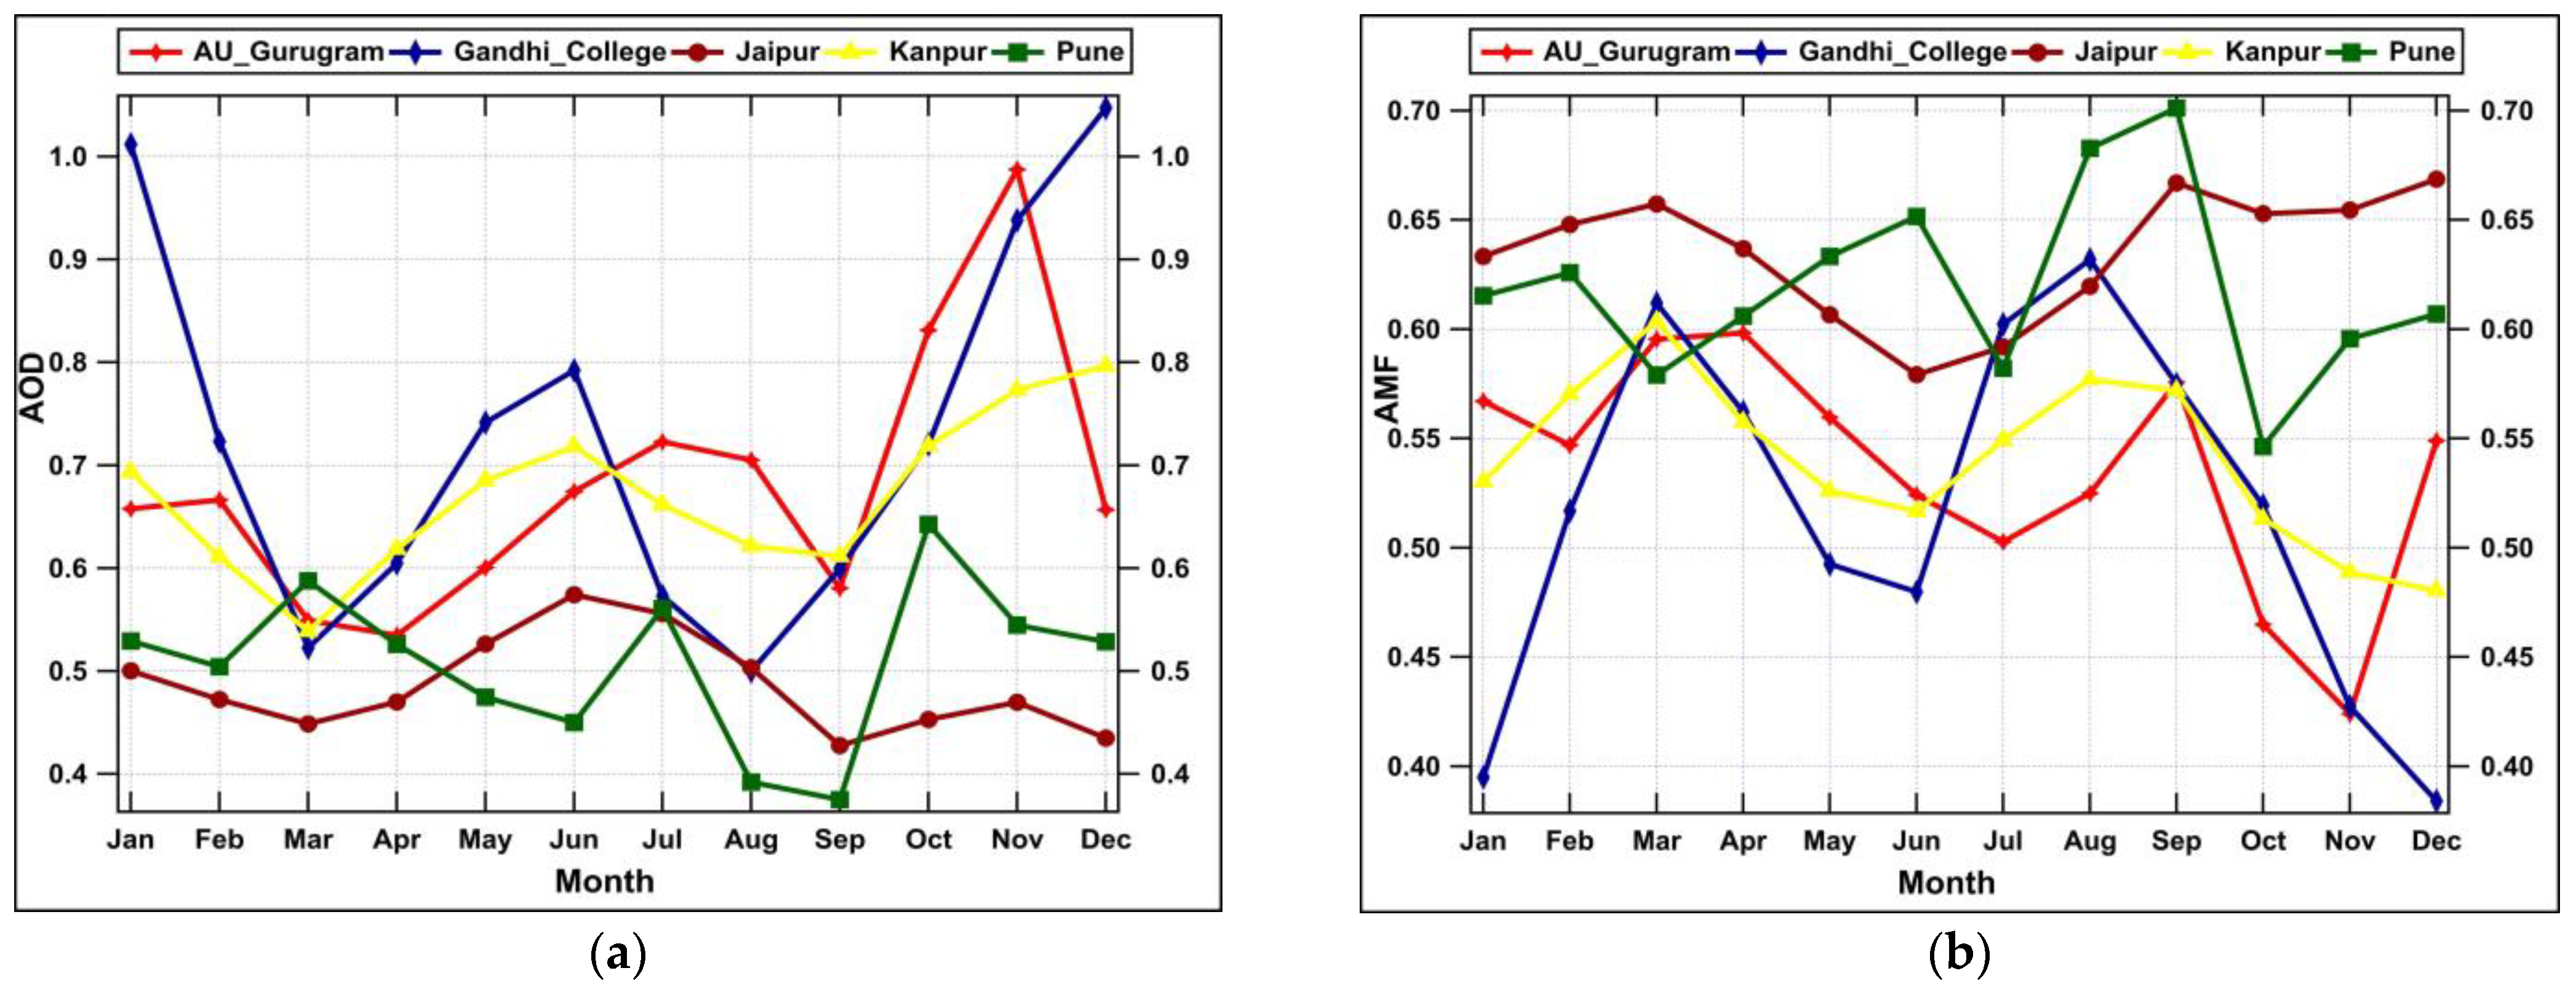
- We observed the significant effect of aerosols compared to the clouds over all the Indian cities. The climatological trends analysis of the AOD resulted over cities as Gurugram (0.019/month), Kanpur (0.013/month), Gandhi College/Ballia (−0.003/month), Jaipur (0.013/month), and Pune (−0.001/month). The significant aerosol levels resulted in GHI losses over the cities Gurugram (3.77 kW/m2/month), Kanpur (0.68 kW/m2/month), Gandhi College/Ballia (−0.912 kW/m2/month), Jaipur (−2.69 kW/m2/month), and Pune (−1.60 kW/m2/month). We observed significant rising AOD trends over the northern Gurugram and central IGP city of Kanpur, respectively, resulting in maximum GHI losses. Kanpur and Ballia are situated in the central IGP, but Kanpur exhibits higher aerosol trends due to significant industrial emissions, in contrast to the less industrialized Ballia. Conversely, the declining trends of the AOD in Pune metropolitan may be attributed to its coastal location and lower anthropogenic activity levels compared to cities in the IGP region. On the other hand, Jaipur shows a positive trend, likely due to its proximity to the arid areas. Therefore, these results highlight the need to consider aerosol effects in future assessments and planning for rooftop PV potential.
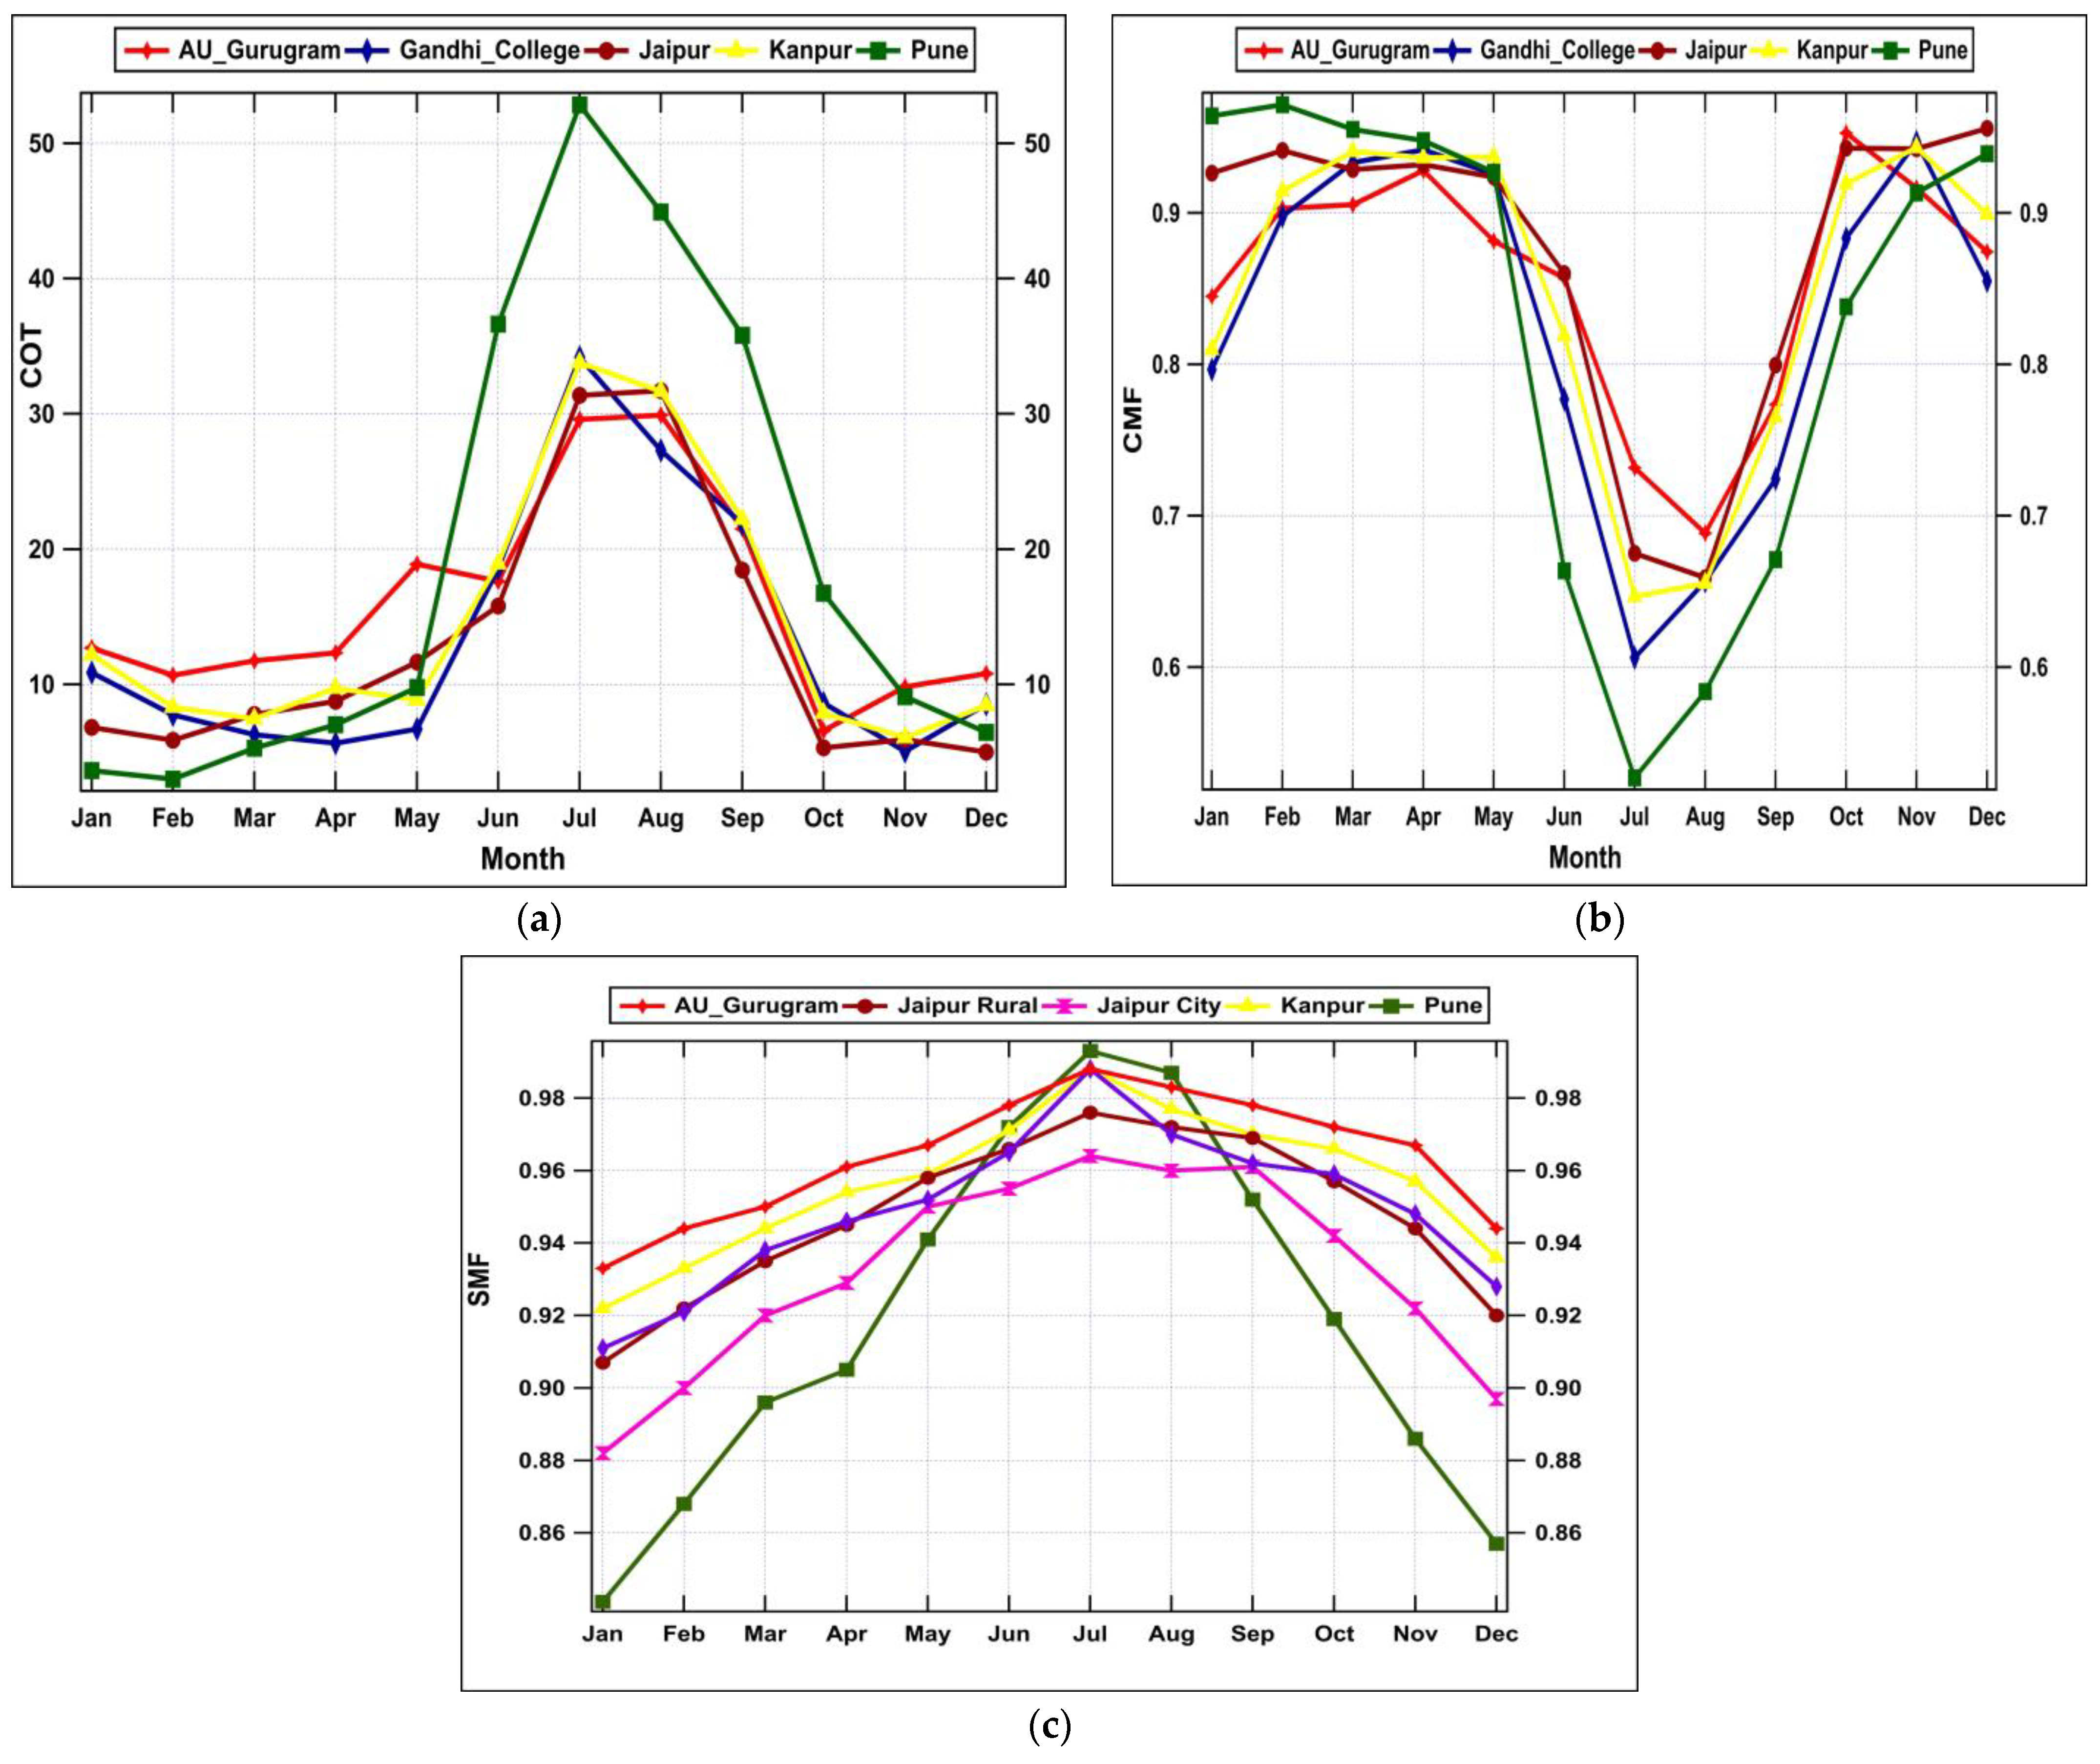
- The climatological trends of cloud effects were assessed using the COT results of Gurugram (0.09/month), Kanpur (0.31/month), Gandhi College/Ballia (−0.31/month), Jaipur (0.31/month), and Pune (1.51/month) over the cities. The presence of the cloud cover resulted in the GHI losses due to clouds over Gurugram (0.59 kW/m2/month), Kanpur (0.94 kW/m2/month), Gandhi College/Ballia (1.33 kW/m2/month), Jaipur (1.24 kW/m2/month), and Pune (3.70 kW/m2/month), respectively. The analysis indicates that AOD values are higher over the coastal city of Pune. This can be attributed to a denser cloud cover occurring twice a year during the monsoon season. Additionally, similar trends are observed in the IGP cities and the western city of Jaipur, primarily due to the influence of the southwest monsoon.
- The total GHI losses due to aerosols, clouds, and shadows have been translated into the total financial losses over the cities, of nearly 11,241.70 million rupees, 4439.49 million rupees, and 1167.65 million rupees, respectively, over all the five polluted cities of the Indian region. Under the scenario, for solar energy produced, we could have total estimated earnings of 45,282.87 million rupees with a total savings of nearly 279,340.3 million rupees. Moreover, the financial analysis reveals a maximum economic potential for generating income from RTP installations in urban metropolitan areas, with a significant economic potential in rural regions.
- According to the statistics [105], the burning of one ton of coal produces 2.07 tons of CO2. Using the conversion factor from scenario 1, deploying solar rooftop PV in cities could save between 153,570.04 to 501,342.02 metric tons of coal. Under scenario 2, the CO2 equivalent emission avoided has been translated to nearly 98,134.23 to 358,101.45 tons of coal burnt for electricity production for the Indian cities. The estimates of coal savings have an uncertainty range of ±7.25% to 14.49% per ton of avoided CO2 emissions under both scenarios. Thus, India could reach the net zero target as early as possible.The core objective and novelty of this study stem from its two-part methodological approach. Firstly, we estimated the RTP using current state-of-the-art methods, which involved assuming suitability factors and energy outputs based on PVGIS simulations and extrapolating these for effective city rooftop areas. Secondly, we advanced beyond the existing approaches by incorporating roof morphology metrics and various area allocation factors to assess RTP in more realistic terms. Both steps were applied under two distinct scenarios to evaluate variability. Moreover, the study concluded the more significant effect of aerosols than clouds over polluted Indian cities. The information in the assessment done in the study could be utilized by the GOI, various stakeholders, policymakers, and DISCOMS to analyze the investment opportunities and risks in implementing solar PV rooftops. The assessments help identify the realistic potential for rooftop solar installations by mapping suitable areas for deployment, allowing the government to plan and achieve its renewable energy targets effectively. In the future, studies that incorporate atmospheric and urban effects must be conducted using advanced machine-learning techniques. Additionally, there is a need to develop a solar cadaster for Indian cities to enable optimal solar PV planning and facilitate a greater penetration into society.
Author Contributions
Funding
Data Availability Statement
Acknowledgments
Conflicts of Interest
Nomenclature
| AMF | Aerosol modification factor |
| CMF | Cloud modification factor |
| GHI0 | Clear sky radiation (W m−2) |
| GHI00 | Radiation under clean (no aerosols) and clear (no cloud) conditions (W m−2) |
| GHI | Radiation under all clear-sky conditions (W m−2) |
| DHI | Diffuse horizontal irradiance (W m−2) |
| R | Diffusion coefficient |
| RTAu | Usable rooftop Area (km2) |
| Ab | Building footprint Area (km2) |
| fca | Calibration factor |
| cfa | Total area correction factor |
| Sflt,u | Area shares of usable flat roofs |
| cfa,slt | Area correction factor for slanted roof |
| cfa,flt | Area correction factor for flat roof |
| RTP | Rooftop photovoltaic potential (MWh yr−1) |
| µref | Electrical module efficiency at the standard testing conditions |
| cfrad | Radiation correction factor |
| β | Temperature coefficient (°C−1) |
| Tcell | Solar photovoltaic cell temperature (°C) |
| Tref | Reference temperature under standard testing conditions (°C) |
| PR | Performance ratio is the efficiency of the solar PV |
| Tai | Average temperature of the city (°C) |
| FL | Financial losses (Rupees) |
| FIT | Feed in Tariff (INR/KWh) |
| PVGIS | Photovoltaic Geographic Information System |
| EPmax | Maximum energy produced under the clean and clear conditions (KWh) |
| EPactual | Actual energy produced is inclusive of the effect of factors such as clouds/aerosols/shadows (KWh) |
| RES | Renewable energy system |
| GOI | Government of India |
| DISCOM | Distribution companies |
Appendix A
References
- Ge, M.; Friedrich, J.; Vigna, L. Where Do Emissions Come From? 4 Charts Explain Greenhouse Gas Emissions by Sector. Available online: https://www.wri.org/insights/4-charts-explain-greenhouse-gas-emissions-countries-and-sectors (accessed on 6 January 2025).
- Cabeza, L.F.; Bai, Q.; Bertoldi, P.; Kihila, J.M.; Lucena, A.F.P.; Mata, É.; Mirasgedis, S.; Novikova, A.; Saheb, Y. Buildings. In Climate Change 2022: Mitigation of Climate Change. Contribution of Working Group III to the Sixth Assessment Report of the Intergovernmental Panel on Climate Change; Shukla, P.R., Skea, J., Slade, R., Al Khourdajie, A., van Diemen, R., McCollum, D., Pathak, M., Some, S., Vyas, P., Fradera, R., et al., Eds.; Cambridge University Press (CUP): Cambridge, UK; New York, NY, USA, 2022; pp. 953–1019. [Google Scholar]
- IEA. World Energy Outlook; IEA: Paris, France, 2024. [Google Scholar]
- Zachariah, S.; Tyagi, B.; Kuldeep, N. Mapping India’s Residential Rooftop Solar Potential—A Bottom-Up Assessment Using Primary Data; Report; Council on Energy, Environment and Water: New Delhi, India, 2023. [Google Scholar]
- MNRE. Year End Review 2023 of Ministry of New & Renewable Energy. Available online: https://pib.gov.in/PressReleaseIframePage.aspx?PRID=1992732 (accessed on 6 January 2025).
- Shahrukh Anis, M.; Jamil, B.; Azeem Ansari, M.; Bellos, E. Generalized Models for Estimation of Global Solar Radiation Based on Sunshine Duration and Detailed Comparison with the Existing: A Case Study for India. Sustain. Energy Technol. Assess. 2019, 31, 179–198. [Google Scholar] [CrossRef]
- Kapoor, K.; Pandey, K.K.; Jain, A.K.; Nandan, A. Evolution of Solar Energy in India: A Review. Renew. Sustain. Energy Rev. 2014, 40, 475–487. [Google Scholar] [CrossRef]
- MNRE. Solar Overview, Ministry of New and Renewable Energy (MNRE), Government of India, New Delhi, India. Available online: https://pib.gov.in/PressReleaseIframePage.aspx?PRID=2003561 (accessed on 6 January 2025).
- Corti, P.; Bonomo, P.; Ramachandran, A.M.; Asok, A. Indian BIPV Report 2022: Status and Roadmap; SUPSI-ISAAC, CSIR-NIST: Lugano, Switzerland, 2022. [Google Scholar]
- IRENA. Renewable Energy Statistics 2024; IRENA: Abu Dhabi, United Arab Emirates, 2024. [Google Scholar]
- MNRE. India’s Renewable Energy Capacity Hits New Milestone Renewable Energy Now Constitutes More than 46.3% of Total Capacity. Available online: https://pib.gov.in/PressReleaseIframePage.aspx?PRID=2073038 (accessed on 6 January 2025).
- Bridge To India. India Solar Rooftop Map; Bridge To India: Mumbai, India, 2024. [Google Scholar]
- Md Khairi, N.H.; Akimoto, Y.; Okajima, K. Suitability of Rooftop Solar Photovoltaic at Educational Building towards Energy Sustainability in Malaysia. Sustain. Horiz. 2022, 4, 100032. [Google Scholar] [CrossRef]
- Ranjgar, B.; Niccolai, A. Large-Scale Rooftop Solar Photovoltaic Power Production Potential Assessment: A Case Study for Tehran Metropolitan Area, Iran. Energies 2023, 16, 7111. [Google Scholar] [CrossRef]
- Vigkos, S.; Kosmopoulos, P.G. Photovoltaics Energy Potential in the Largest Greek Cities: Atmospheric and Urban Fabric Effects, Climatic Trends Influences and Socio-Economic Benefits. Energies 2024, 17, 3821. [Google Scholar] [CrossRef]
- Sander, L.; Schindler, D.; Jung, C. Application of Satellite Data for Estimating Rooftop Solar Photovoltaic Potential. Remote Sens. 2024, 16, 2205. [Google Scholar] [CrossRef]
- Galvin, R. Re-Thinking Energy Justice to Achieve a Fair Distribution of Shared Electricity from Rooftop Photovoltaics in a Typical Multi-Apartment Building in Germany: An Interdisciplinary Approach. Energy Res. Soc. Sci. 2024, 112, 103531. [Google Scholar] [CrossRef]
- Fakhraian, E.; Forment, M.A.; Dalmau, F.V.; Nameni, A.; Guerrero, M.J.C. Determination of the Urban Rooftop Photovoltaic Potential: A State of the Art. Energy Rep. 2021, 7, 176–185. [Google Scholar] [CrossRef]
- Gernaat, D.E.H.J.; de Boer, H.S.; Dammeier, L.C.; van Vuuren, D.P. The Role of Residential Rooftop Photovoltaic in Long-Term Energy and Climate Scenarios. Appl. Energy 2020, 279, 115705. [Google Scholar] [CrossRef]
- Joshi, S.; Mittal, S.; Holloway, P.; Shukla, P.R.; Ó Gallachóir, B.; Glynn, J. High Resolution Global Spatiotemporal Assessment of Rooftop Solar Photovoltaics Potential for Renewable Electricity Generation. Nat. Commun. 2021, 12, 5738. [Google Scholar] [CrossRef]
- Risch, S.; Maier, R.; Du, J.; Pflugradt, N.; Stenzel, P.; Kotzur, L.; Stolten, D. Potentials of Renewable Energy Sources in Germany and the Influence of Land Use Datasets. Energies 2022, 15, 5536. [Google Scholar] [CrossRef]
- Ren, H.; Sun, Y.; Zhang, Y. A Novel 3D-Geographic Information System and Deep Learning Integrated Approach for High-Accuracy Building Rooftop Solar Energy Potential Characterization of High-Density Cities. Build. Simul. Conf. Proc. 2023, 18, 3880–3887. [Google Scholar] [CrossRef]
- Wang, Y.; Wang, D.; Yu, L.; Mao, J. What Really Influences the Development of Renewable Energy? A Systematic Review and Meta-Analysis. Environ. Sci. Pollut. Res. 2023, 30, 62213–62236. [Google Scholar] [CrossRef]
- Mehmood, U.; Agyekum, E.B.; Tariq, S.; Haq, Z.U.; Uhunamure, S.E.; Edokpayi, J.N.; Azhar, A. Socio-Economic Drivers of Renewable Energy: Empirical Evidence from BRICS. Int. J. Environ. Res. Public Health 2022, 19, 4614. [Google Scholar] [CrossRef]
- Bódis, K.; Kougias, I.; Jäger-Waldau, A.; Taylor, N.; Szabó, S. A High-Resolution Geospatial Assessment of the Rooftop Solar Photovoltaic Potential in the European Union. Renew. Sustain. Energy Rev. 2019, 114, 109309. [Google Scholar] [CrossRef]
- Kapsalis, V.; Maduta, C.; Skandalos, N.; Bhuvad, S.S.; D’Agostino, D.; Yang, R.J.; Udayraj; Parker, D.; Karamanis, D. Bottom-up Energy Transition through Rooftop PV Upscaling: Remaining Issues and Emerging Upgrades towards NZEBs at Different Climatic Conditions. Renew. Sustain. Energy Transit. 2024, 5, 100083. [Google Scholar] [CrossRef]
- Gagnon, P.; Margolis, R.; Melius, J.; Phillips, C.; Elmore, R. Rooftop Solar Photovoltaic Technical Potential in the United States: A Detailed Assessment; National Renewable Energy Lab. (NREL): Golden, CO, USA, 2016. [Google Scholar]
- Masoom, A.; Kosmopoulos, P.; Bansal, A.; Kazadzis, S. Solar Energy Estimations in India Using Remote Sensing Technologies and Validation with Sun Photometers in Urban Areas. Remote Sens. 2020, 12, 254. [Google Scholar] [CrossRef]
- Kosmopoulos, P.; Dhake, H.; Kartoudi, D.; Tsavalos, A.; Koutsantoni, P.; Katranitsas, A.; Lavdakis, N.; Mengou, E.; Kashyap, Y. Ray-Tracing Modeling for Urban Photovoltaic Energy Planning and Management. Appl. Energy 2024, 369, 123516. [Google Scholar] [CrossRef]
- Chen, Z.; Yang, B.; Zhu, R.; Dong, Z. City-Scale Solar PV Potential Estimation on 3D Buildings Using Multi-Source RS Data: A Case Study in Wuhan, China. Appl. Energy 2024, 359, 122720. [Google Scholar] [CrossRef]
- Singh, R.; Banerjee, R. Estimation of Rooftop Solar Photovoltaic Potential of a City. Sol. Energy 2015, 115, 589–602. [Google Scholar] [CrossRef]
- Kaleshwarwar, A.; Bahadure, S. Assessment of the Solar Energy Potential of Diverse Urban Built Forms in Nagpur, India. Sustain. Cities Soc. 2023, 96, 104681. [Google Scholar] [CrossRef]
- Singh, R. Approximate Rooftop Solar PV Potential of Indian Cities for High-Level Renewable Power Scenario Planning. Sustain. Energy Technol. Assess. 2020, 42, 100850. [Google Scholar] [CrossRef]
- Mishra, T.; Rabha, A.; Kumar, U.; Arunachalam, K.; Sridhar, V. Assessment of Solar Power Potential in a Hill State of India Using Remote Sensing and Geographic Information System. Remote Sens. Appl. Soc. Environ. 2020, 19, 100370. [Google Scholar] [CrossRef]
- Kumar, A.; Kosmopoulos, P.; Kashyap, Y.; Gautam, R. Rooftop Photovoltaic Energy Production Estimations in India Using Remotely Sensed Data and Methods. Remote Sens. 2023, 15, 3051. [Google Scholar] [CrossRef]
- Dumka, U.C.; Kosmopoulos, P.G.; Ningombam, S.S.; Masoom, A. Impact of Aerosol and Cloud on the Solar Energy Potential over the Central Gangetic Himalayan Region. Remote Sens. 2021, 13, 3248. [Google Scholar] [CrossRef]
- Boucher, O.; Randall, D.; Artaxo, P.; Bretherton, C.; Feingold, G.; Forster, P.; Kerminen, V.-M.; Kondo, Y.; Liao, H.; Lohmann, U.; et al. IPCC AR5 Clouds and Aerosols. In Climate Change 2013: The Physical Science Basis; Cambridge University Press: Cambridge, UK; New York, NY, USA, 2013; pp. 571–658. [Google Scholar] [CrossRef]
- Bergin, M.H.; Ghoroi, C.; Dixit, D.; Schauer, J.J.; Shindell, D.T. Large Reductions in Solar Energy Production Due to Dust and Particulate Air Pollution. Environ. Sci. Technol. Lett. 2017, 4, 339–344. [Google Scholar] [CrossRef]
- Ghosh, S.; Dey, S.; Ganguly, D.; Baidya Roy, S.; Bali, K. Cleaner Air Would Enhance India’s Annual Solar Energy Production by 6–28 TWh. Environ. Res. Lett. 2022, 17, 054007. [Google Scholar] [CrossRef]
- Ghosh, S.; Ganguly, D.; Dey, S.; Chowdhury, S.G. Future Photovoltaic Potential in India: Navigating the Interplay between Air Pollution Control and Climate Change Mitigation. Environ. Res. Lett. 2024, 19, 124030. [Google Scholar] [CrossRef]
- Copernicus Emergency Management Service. Human Settlement Data. Available online: https://human-settlement.emergency.copernicus.eu/ (accessed on 6 January 2025).
- Florczyk, A.J.; Corbane, C.; Ehrlich, D.; Freire, S.; Kemper, T.; Maffenini, L.; Melchiorri, M.; Pesaresi, M.; Politis, P.; Schiavina, M.; et al. GHSL Data Package 2019, EUR 29788 EN; Publications Office of the European Union: Luxembourg, 2019. [Google Scholar]
- Holben, B.N.; Eck, T.F.; Slutsker, I.; Tanré, D.; Buis, J.P.; Setzer, A.; Vermote, E.; Reagan, J.A.; Kaufman, Y.J.; Nakajima, T.; et al. AERONET—A Federated Instrument Network and Data Archive for Aerosol Characterization. Remote Sens. Environ. 1998, 66, 1–16. [Google Scholar] [CrossRef]
- Giles, D.M.; Sinyuk, A.; Sorokin, M.G.; Schafer, J.S.; Smirnov, A.; Slutsker, I.; Eck, T.F.; Holben, B.N.; Lewis, J.R.; Campbell, J.R.; et al. Advancements in the Aerosol Robotic Network (AERONET) Version 3 Database—Automated near-Real-Time Quality Control Algorithm with Improved Cloud Screening for Sun Photometer Aerosol Optical Depth (AOD) Measurements. Atmos. Meas. Tech. 2019, 12, 169–209. [Google Scholar]
- Sethi, D.; Radhakrishnan, S.R.; Sharma, C.; Mishra, S.K.; Jaswant. Aerosol Optical Properties over Delhi during a Dust Event in Summer 2014: Plausible Implications. Indian J. Phys. 2021, 95, 2531–2540. [Google Scholar] [CrossRef]
- Government of India. Smart Cities Mission: A Step Towards Smart India. Available online: https://www.india.gov.in/spotlight/smart-cities-mission-step-towards-smart-india (accessed on 6 January 2025).
- Government of India. PMS Surya Ghar. Available online: https://www.pmsuryaghar.gov.in/ (accessed on 6 January 2025).
- Ministry of New and Renewable Energy, Government of India. Schemes and Guidelines. Available online: https://mnre.gov.in/en/policies-and-regulations/schemes-and-guidelines/schemes/ (accessed on 6 January 2025).
- Hünerbein, A.; Bley, S.; Deneke, H.; Meirink, J.F.; Van Zadelhoff, G.J.; Walther, A. Cloud Optical and Physical Properties Retrieval from EarthCARE Multi-Spectral Imager: The M-COP Products. Atmos. Meas. Tech. 2024, 17, 261–276. [Google Scholar] [CrossRef]
- Mayer, B.; Kylling, A. Technical Note: The LibRadtran Software Package for Radiative Transfer Calculations—Description and Examples of Use. Atmos. Chem. Phys. 2005, 5, 1855–1877. [Google Scholar] [CrossRef]
- Emde, C.; Buras-Schnell, R.; Kylling, A.; Mayer, B.; Gasteiger, J.; Hamann, U.; Kylling, J.; Richter, B.; Pause, C.; Dowling, T.; et al. The LibRadtran Software Package for Radiative Transfer Calculations (Version 2.0.1). Geosci. Model Dev. 2016, 9, 1647–1672. [Google Scholar] [CrossRef]
- Kosmopoulos, P.; Dhake, H.; Melita, N.; Tagarakis, K.; Georgakis, A.; Stefas, A.; Vaggelis, O.; Korre, V.; Kashyap, Y. Multi-Layer Cloud Motion Vector Forecasting for Solar Energy Applications. Appl. Energy 2024, 353, 122144. [Google Scholar] [CrossRef]
- Kinne, S. The MACv2 Aerosol Climatology. Tellus Ser. B Chem. Phys. Meteorol. 2019, 71, 1–21. [Google Scholar] [CrossRef]
- Eskes, H.J.; Van Velthoven, P.F.J.; Valks, P.J.M.; Kelder, H.M. Assimilation of GOME Total-Ozone Satellite Observations in a Three-Dimensional Tracer-Transport Model. Q. J. R. Meteorol. Soc. 2003, 129, 1663–1681. [Google Scholar] [CrossRef]
- Kopeika, N.S. Optical Properties of the Atmosphere. In A System Engineering Approach to Imaging; SPIE Optical Engineering Press: Bellingham, WA, USA, 2017. [Google Scholar] [CrossRef]
- Sethi, D.; Kosmopoulos, P.G. Effect of Dust Events on Photovoltaics Electricity Production in the European and North African Regions. Environ. Sci. Proc. 2023, 26, 8. [Google Scholar] [CrossRef]
- Zsiborács, H.; Zentkó, L.; Pintér, G.; Vincze, A.; Baranyai, N.H. Assessing Shading Losses of Photovoltaic Power Plants Based on String Data. Energy Rep. 2021, 7, 3400–3409. [Google Scholar] [CrossRef]
- Batista, R.V.F. The Impact of Shadowing in Photovoltaic Systems and How to Minimizing It; Faculty of Engineering and Sustainable Development, University of Gävle: Gävle, Sweden, 2018. [Google Scholar]
- GRASS Development Team. Geographic Resources Analysis Support System (GRASS GIS); OSGeo Foundation: Beaverton, OR, USA, 2024. [Google Scholar]
- Liu, J.; Peng, C.; Zhang, J. Understanding the Relationship between Rural Morphology and Photovoltaic (PV) Potential in Traditional and Non-Traditional Building Clusters Using Shapley Additive ExPlanations (SHAP) Values. Appl. Energy 2025, 380, 125091. [Google Scholar] [CrossRef]
- Izquierdo, S.; Rodrigues, M.; Fueyo, N. A Method for Estimating the Geographical Distribution of the Available Roof Surface Area for Large-Scale Photovoltaic Energy-Potential Evaluations. Sol. Energy 2008, 82, 929–939. [Google Scholar] [CrossRef]
- Tröndle, T.; Pfenninger, S.; Lilliestam, J. Home-Made or Imported: On the Possibility for Renewable Electricity Autarky on All Scales in Europe. Energy Strateg. Rev. 2019, 26, 100388. [Google Scholar] [CrossRef]
- LONGi LR5-54HTH 445~455M Datasheet. Available online: https://static.longi.com/L_Gi_LE_PM_T_PMD_059_F131_LR_5_54_HTH_445_455_M_30_30_and_15_Frame_Scientist_V19_9e6db880ac.pdf (accessed on 15 February 2025).
- Mercom India Mercom India. Available online: https://www.mercomindia.com/ (accessed on 6 January 2025).
- Atia, D.M.; Hassan, A.A.; El-Madany, H.T.; Eliwa, A.Y.; Zahran, M.B. Degradation and Energy Performance Evaluation of Mono-Crystalline Photovoltaic Modules in Egypt. Sci. Rep. 2023, 13, 13066. [Google Scholar] [CrossRef]
- Saxena, A.K.; Saxena, S.; Sudhakar, K. Energy, Economic and Environmental Performance Assessment of a Grid-Tied Rooftop System in Different Cities of India Based on 3E Analysis. Clean Energy 2021, 5, 288–301. [Google Scholar] [CrossRef]
- Dumka, U.C.; Kosmopoulos, P.G.; Patel, P.N.; Sheoran, R. Can Forest Fires Be an Important Factor in the Reduction in Solar Power Production in India? Remote Sens. 2022, 14, 549. [Google Scholar] [CrossRef]
- Sarkar, S.; Chauhan, A.; Kumar, R. Impact of Deadly Dust Storms (May 2018) on Air Quality, Meteorological, and Atmospheric Parameters Over the Northern Parts of India. GeoHealth 2019, 3, 67–80. [Google Scholar] [CrossRef]
- Masoom, A.; Kosmopoulos, P.; Bansal, A.; Gkikas, A.; Proestakis, E.; Kazadzis, S.; Amiridis, V. Forecasting Dust Impact on Solar Energy Using Remote Sensing and Modeling Techniques. Sol. Energy 2021, 228, 317–332. [Google Scholar] [CrossRef]
- Wang, Y.; Xia, W.; Zhang, G.J. What Rainfall Rates Are Most Important to Wet Removal of Different Aerosol Types? Atmos. Chem. Phys. 2021, 21, 16797–16816. [Google Scholar] [CrossRef]
- Mohan, M.; Kandya, A.; Battiprolu, A. Urban Heat Island Effect over National Capital Region of India: A Study Using the Temperature Trends. J. Environ. Prot. 2011, 02, 465–472. [Google Scholar] [CrossRef]
- Srivastava, A.K.; Tripathi, S.N.; Dey, S.; Kanawade, V.P.; Tiwari, S. Inferring Aerosol Types over the Indo-Gangetic Basin from Ground Based Sunphotometer Measurements. Atmos. Res. 2012, 109–110, 64–75. [Google Scholar] [CrossRef]
- Sarangi, C.; Tripathi, S.N.; Mishra, A.K.; Goel, A.; Welton, E.J. Elevated Aerosol Layers and Their Radiative Impact over Kanpur during Monsoon Onset Period. J. Geophys. Res. 2016, 121, 7936–7957. [Google Scholar] [CrossRef]
- Bhadauria, N.; Chauhan, A.; Ranjan, R.; Jindal, T. An Assessment of Seasonal, Monthly and Diurnal Variations of Ambient Air Quality in the Gurugram City (Haryana). J. Appl. Nat. Sci. 2023, 15, 306–313. [Google Scholar] [CrossRef]
- Akanksha; Shukla, A.K.; Bhowmik, H.S.; Yadav, A.K.; Jain, V.; Murari, V.; Gaddamidi, S.; Lalchandani, V.; Tripathi, S.N. Comparative Analysis of Winter Composite-PM2.5 in Central Indo Gangetic Plain Cities: Combined Organic and Inorganic Source Apportionment and Characterization, with a Focus on the Photochemical Age Effect on Secondary Organic Aerosol Formation. Atmos. Environ. 2024, 338, 120827. [Google Scholar] [CrossRef]
- Mishra, S.K.; Ahlawat, A.; Khosla, D.; Sharma, C.; Prasad, M.V.S.N.; Singh, S.; Gupta, B.; Tulsi; Sethi, D.; Sinha, P.R.; et al. Experimental Investigation of Variations in Morphology, Composition and Mixing-State of Boundary Layer Aerosol: A Balloon Based Study over Urban Environment (New Delhi). Atmos. Environ. 2018, 185, 243–252. [Google Scholar] [CrossRef]
- Sethi, D.; Sharma, C.; Radhakrishnan, S.R. Physical Properties of Aerosols in Different Environments; Academy of Scientific and Innovative Research (AcSIR): Ghaziabad, India, 2022. [Google Scholar]
- Singh, T.; Ravindra, K.; Sreekanth, V.; Gupta, P.; Sembhi, H. Climatological Trends in Satellite-Derived Aerosol Optical Depth over North India and Its Relationship with Crop Residue Burning: Rural-Urban Contrast. Sci. Total Environ. 2020, 748, 140963. [Google Scholar]
- Saini, G.; Jagadeesh, P.; Saikumar, G. Trend Assessment of Rainfall Over Mumbai and Pune Cities. In River Dynamics and Flood Hazards. Disaster Resilience and Green Growth; Pandey, M., Azamathulla, H., Pu, J.H., Eds.; Springer: Singapore, 2023; pp. 587–606. ISBN 9789811971006. [Google Scholar]
- Sunil, S.; Padmakumari, B. Optical and Radiative Characteristics of the Lower Part of Cirrus Clouds Over a Rain Shadow Region in South Peninsular India. Pure Appl. Geophys. 2024, 181, 1697–1724. [Google Scholar] [CrossRef]
- Jain, N. Changing Monsoonal Rainfall Patterns in the Western Ghats. Available online: https://india.mongabay.com/2019/01/changing-monsoonal-rainfall-patterns-in-the-western-ghats/ (accessed on 6 January 2025).
- Agathangelidis, I.; Cartalis, C.; Santamouris, M. Urban Morphological Controls on Surface Thermal Dynamics: A Comparative Assessment of Major European Cities with a Focus on Athens, Greece. Climate 2020, 8, 131. [Google Scholar] [CrossRef]
- Singh, A.; Srivastava, A.K.; Pathak, V.; Shukla, A.K. Quantifying the Impact of Biomass Burning and Dust Storm Activities on Aerosol Characteristics over the Indo-Gangetic Basin. Atmosperic Environ. 2022, 270, 118893. [Google Scholar] [CrossRef]
- Kumar, A.; Pratap, V.; Kumar, S.; Singh, A.K. Atmospheric Aerosols Properties over Indo-Gangetic Plain: A Trend Analysis Using Ground—Truth AERONET Data for the Year 2009–2017. Adv. Sp. Res. 2022, 69, 2659–2670. [Google Scholar] [CrossRef]
- Tripathi, S.N.; Yadav, S.; Sharma, K. Air Pollution from Biomass Burning in India. Environ. Res. Lett. 2024, 19, 073007. [Google Scholar] [CrossRef]
- Kulshrestha, U.; Kumar, B. Airmass Trajectories and Long Range Transport of Pollutants: Review of Wet Deposition Scenario in South Asia. Adv. Meteorol. 2014, 2014, 596041. [Google Scholar] [CrossRef]
- Yang, J.; Yi, B.; Wang, S.; Liu, Y.; Li, Y. Diverse Cloud and Aerosol Impacts on Solar Photovoltaic Potential in Southern China and Northern India. Sci. Rep. 2022, 12, 19671. [Google Scholar] [CrossRef]
- Li, X.; Mauzerall, D.L.; Bergin, M.H. Global Reduction of Solar Power Generation Efficiency Due to Aerosols and Panel Soiling. Nat. Sustain. 2020, 3, 720–727. [Google Scholar] [CrossRef]
- Masoom, A.; Kosmopoulos, P.; Kashyap, Y.; Kumar, S.; Bansal, A. Rooftop Photovoltaic Energy Production Management in India Using Earth-Observation Data and Modeling Techniques. Remote Sens. 2020, 12, 1921. [Google Scholar] [CrossRef]
- Nayak, S.; Takemi, T.; Maity, S. Precipitation and Temperature Climatologies over India: A Study with AGCM Large Ensemble Climate Simulations. Atmosphere 2022, 13, 671. [Google Scholar] [CrossRef]
- Tyagi, A.P. Solar Radiant Energy Over India; India Meteorological Department Ministry of Earth Sciences: New Delhi, India, 2009. [Google Scholar]
- Lopez, A. India Direct Normal & Global Horizontal Irradiance Solar Resources; National Renewable Energy Lab. (NREL): Golden, CO, USA, 2016. [Google Scholar]
- Ayua, T.J.; Camara, M. Modeling and Estimation of Solar Panel Tilting Angles and Orientations in the Gambia: A Case Study of Brikama, West Coast Region. Discov. Energy 2024, 4, 31. [Google Scholar] [CrossRef]
- Gedifew, A.; Benor, A.; Lu, Y. Evaluating the Impact of Tilt Angles and Tracking Mechanisms on Photovoltaic Modules in Ethiopia. Front. Energy Res. 2025, 12, 1519725. [Google Scholar] [CrossRef]
- Ali, M.; Kumar, N. Pulses in Indo-Gangetic Plains Status and Strategies for Area Expansion and Productivity Gain. Indian Farming 2016, 66, 6–10. [Google Scholar]
- Government of India, PM Suryaghar: Solar Energy Initiative, Government of India, New Delhi, India. Available online: https://www.pmsuryaghar.gov.in/ (accessed on 7 January 2025).
- Tyagi, B.; Kuldeep, N. Community Solar for Advancing Power Sector Reforms and the Net-Zero Goals. 2023. Available online: https://www.ceew.in/sites/default/files/scaling-community-solar-for-net-zero-electricty-and-power-sector-decarbonisation.pdf (accessed on 6 January 2025).
- Singh, R.; Banerjee, R. Impact of Solar Panel Orientation on Large Scale Rooftop Solar Photovoltaic Scenario for Mumbai. Energy Procedia 2016, 90, 401–411. [Google Scholar] [CrossRef]
- Raptis, I.P.; Moustaka, A.; Kosmopoulos, P.; Kazadzis, S. Selecting Surface Inclination for Maximum Solar Power. Energies 2022, 15, 4784. [Google Scholar] [CrossRef]
- Sun, J.; Zhi, G.; Hitzenberger, R.; Chen, Y.; Tian, C.; Zhang, Y.; Feng, Y.; Cheng, M.; Zhang, Y.; Cai, J.; et al. Emission Factors and Light Absorption Properties of Brown Carbon from Household Coal Combustion in China. Atmos. Chem. Phys. 2017, 17, 4769–4780. [Google Scholar] [CrossRef]
- Khan, A.; Anand, P.; Khatun, R.; Khorat, S.; Niyogi, D.; Santamouris, M. Rooftop Photovoltaic Solar Panels Warm up and Cool down Cities. Nat. Cities 2024, 1, 780–790. [Google Scholar] [CrossRef]
- Solar, V. Solar Power—The Most Effective Solution for Controlling Carbon Footprint. Available online: https://www.vikramsolar.com/solar-power-the-most-effective-solution-for-controlling-carbon-footprint/ (accessed on 14 February 2025).
- U.S. Environmental Protection Agency. AVoided Emissions and GeneRation Tool (AVERT) User Manual; Version1; U.S. Environmental Protection Agency: Washington, DC, USA, 2018.
- Prayas (Energy Group). Electricity Consumption Patterns. Available online: https://energy.prayaspune.org/our-work/article-and-blog/electricity-consumption-patterns (accessed on 6 January 2025).
- Statista Worldwide. CO2 Emissions from Coal. Available online: https://www.statista.com/statistics/784682/worldwide-co2-emissions-from-coal/ (accessed on 6 January 2025).


| City | Area (km2) | Total Building Footprint Area (km2) | Building Density (%) | Average Building Height (for Height > 3 m) |
|---|---|---|---|---|
| Gurugram (28.32°N, 76.92°E) | 1252.56 | 110.33 | 8.81 | 5.24 |
| Ballia (25.87°N, 84.12°E) | 2988 | 110.35 | 3.69 | 3.86 |
| Kanpur (26.51°N, 80.28°E) | 2997.06 | 122.02 | 4.07 | 4.66 |
| Jaipur Rural (27.18°N, 75.80°E) | 6567 | 221 | 3.35 | 4.13 |
| Jaipur City (25.87°N, 84.12°E) | 1250 | 168.6 | 13.48 | 4.74 |
| Pune Metropolitan (18.53°N, 73.80°E) | 1037 | 381 | 36.72 | 5.48 |
| Sites | RAS1 | RAS2 |
|---|---|---|
| Gurugram (28.32°N, 76.92°E) | 47.66 | 110.33 |
| Ballia (25.87°N, 84.12°E) | 46.74 | 110.35 |
| Kanpur (26.51°N, 80.28°E) | 54.76 | 122.02 |
| Jaipur Rural (27.18°N, 75.80°E) | 97.12 | 220.33 |
| Jaipur City (25.87°N, 84.12°E) | 74.25 | 168.60 |
| Pune Metropolitan (18.53°N, 73.80°E) | 167.73 | 381 |
| (a) | ||||
| City | RTP (MWh/Year) | Consumption (MWh) | Production (MWh) | % Percentage of Energy Adequacy |
| Gurugram District | 1822.87 ± 257.99 | 1,465,000 | 303,088.52 | 20.69 |
| Ballia | 1723.10 ± 254.14 | 800,000 | 290,612.10 | 36.32 |
| Kanpur District | 2093.73 ± 287.10 | 3,142,000 | 330,882.52 | 10.53 |
| Jaipur Rural | 4017.30 ± 461.30 | 3,300,000 | 638,611.84 | 14.79 |
| Jaipur City | 3062.08 ± 367.39 | 3,301,000 | 488,232.70 | 19.35 |
| Pune Metropolitan | 6970.66 ± 751.38 | 3,699,000 | 1,060,472.11 | 28.66 |
| (b) | ||||
| City | RTP (MWh/Year) | Consumption (GWh) | Production (GWh) | % Percentage of Energy Adequacy |
| Gurugram District | 4036.46 ± 388.25 | 1,465,000 | 454,778.24 | 31.04 |
| Ballia | 4306.34 ± 381.81 | 800,000 | 464,979.37 | 58.12 |
| Kanpur District | 3868.92 ± 436.78 | 3,142,000 | 430,147.28 | 13.69 |
| Jaipur Rural | 7530.29 ± 727.21 | 3,300,000 | 894,056.58 | 20.70 |
| Jaipur City | 5757.07 ± 570.66 | 3,301,000 | 683,525.78 | 27.09 |
| Pune Metropolitan | 13,005.65 ± 1210.71 | 3,699,000 | 1,484,660.65 | 40.13 |
| City | FL Due to Aerosols | FL Due to Clouds | FL Due to Shadows | Total FL (M Rs) | Earnings (M Rs) | Profit (M Rs) |
|---|---|---|---|---|---|---|
| Gurugram | 1387.09 | 620.52 | 146.32 | 2153.93 | 4466.73 | 2312.80 |
| Ballia | 1859.85 | 661.83 | 265.92 | 2787.60 | 7518.78 | 4731.18 |
| Kanpur | 1357.02 | 472.42 | 128.84 | 1958.29 | 4214.31 | 2256.03 |
| Jaipur Rural | 1441.28 | 466.02 | 112.69 | 2019.99 | 7569.24 | 5549.26 |
| Jaipur City | 1431.44 | 509.38 | 204.67 | 2145.49 | 5786.85 | 3641.37 |
| Pune | 3765.01 | 1709.31 | 809.22 | 6283.54 | 15,726.94 | 9443.40 |
| (a) | ||||
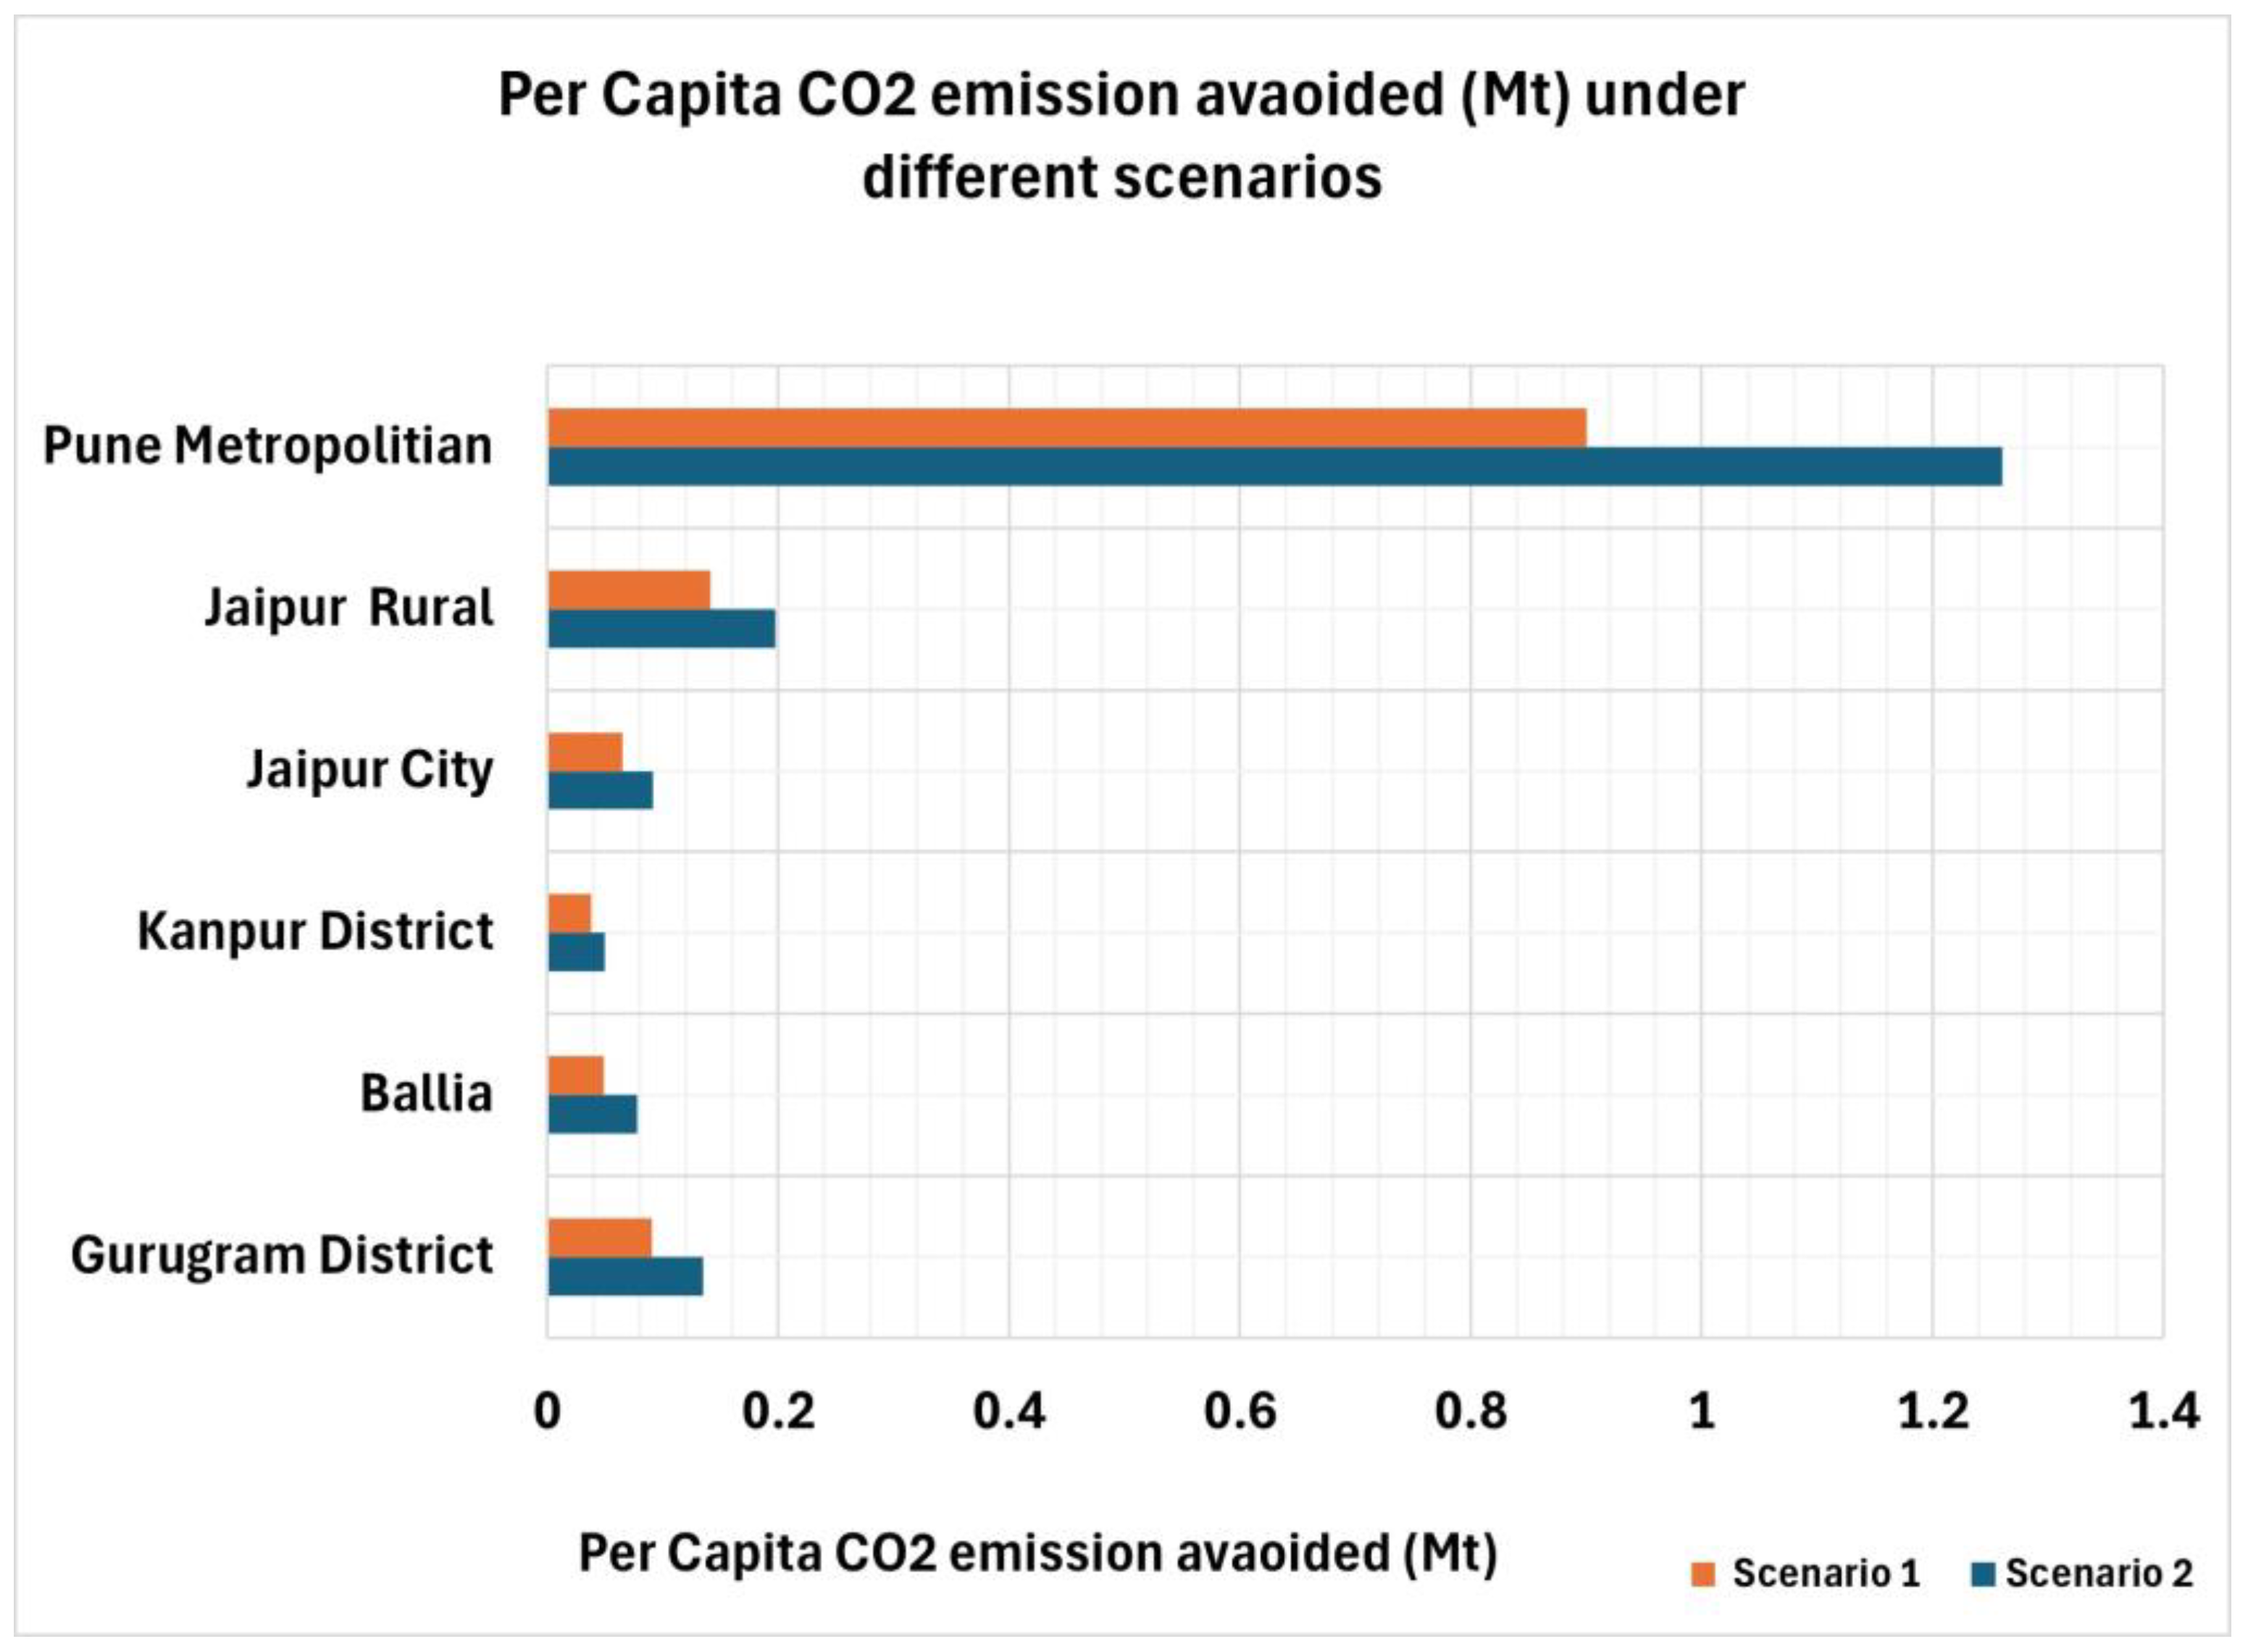
| City | Consumption (MWh) | Population Density per Square km | CO2 Equivalent (Metric Tons) | Per Capita CO2 Emission Avoided (Mt) |
| Gurugram | 1,465,000 | 1874.87 | 317,889.99 | 0.14 |
| Ballia | 800,000 | 1399.39 | 325,020.58 | 0.08 |
| Kanpur | 3,142,000 | 2036 | 3,00,672.95 | 0.05 |
| Jaipur Rural | 3,300,000 | 481.8 | 624,945.56 | 0.20 |
| Jaipur City | 3,301,000 | 4187.04 | 477,784.52 | 0.09 |
| Pune | 3,699,000 | 793.97 | 1,037,778.01 | 1.26 |
| (b) | ||||
| City | Consumption (MWh) | Population Density per Square km | CO2 Equivalent (Metric Tons) | Per Capita CO2 Emission Avoided (Mt) |
| Gurugram | 1,465,000 | 1874.87 | 211,926.66 | 0.09 |
| Ballia | 800,000 | 1399.39 | 203,137.86 | 0.05 |
| Kanpur | 3,142,000 | 2036 | 231,286.88 | 0.04 |
| Jaipur Rural | 3,300,000 | 481.8 | 446,389.68 | 0.14 |
| Jaipur City | 3,301,000 | 4187.04 | 341,274.66 | 0.07 |
| Pune | 3,699,000 | 793.97 | 741,270.01 | 0.90 |
Disclaimer/Publisher’s Note: The statements, opinions and data contained in all publications are solely those of the individual author(s) and contributor(s) and not of MDPI and/or the editor(s). MDPI and/or the editor(s) disclaim responsibility for any injury to people or property resulting from any ideas, methods, instructions or products referred to in the content. |
© 2025 by the authors. Licensee MDPI, Basel, Switzerland. This article is an open access article distributed under the terms and conditions of the Creative Commons Attribution (CC BY) license (https://creativecommons.org/licenses/by/4.0/).
Share and Cite
Sethi, D.; Kosmopoulos, P.G. Rooftop Solar Photovoltaic Potential in Polluted Indian Cities: Atmospheric and Urban Impacts, Climate Trends, Societal Gains, and Economic Opportunities. Remote Sens. 2025, 17, 1221. https://doi.org/10.3390/rs17071221
Sethi D, Kosmopoulos PG. Rooftop Solar Photovoltaic Potential in Polluted Indian Cities: Atmospheric and Urban Impacts, Climate Trends, Societal Gains, and Economic Opportunities. Remote Sensing. 2025; 17(7):1221. https://doi.org/10.3390/rs17071221
Chicago/Turabian StyleSethi, Davender, and Panagiotis G. Kosmopoulos. 2025. "Rooftop Solar Photovoltaic Potential in Polluted Indian Cities: Atmospheric and Urban Impacts, Climate Trends, Societal Gains, and Economic Opportunities" Remote Sensing 17, no. 7: 1221. https://doi.org/10.3390/rs17071221
APA StyleSethi, D., & Kosmopoulos, P. G. (2025). Rooftop Solar Photovoltaic Potential in Polluted Indian Cities: Atmospheric and Urban Impacts, Climate Trends, Societal Gains, and Economic Opportunities. Remote Sensing, 17(7), 1221. https://doi.org/10.3390/rs17071221