
Satellite-Derived Spatiotemporal Dynamics of Vegetation Cover and Its Driving Factors in the Three-River Headwaters Region from 2001 to 2022

 , , ,
, , , 

Abstract
1. Introduction
2. Materials and Methods
2.1. Materials
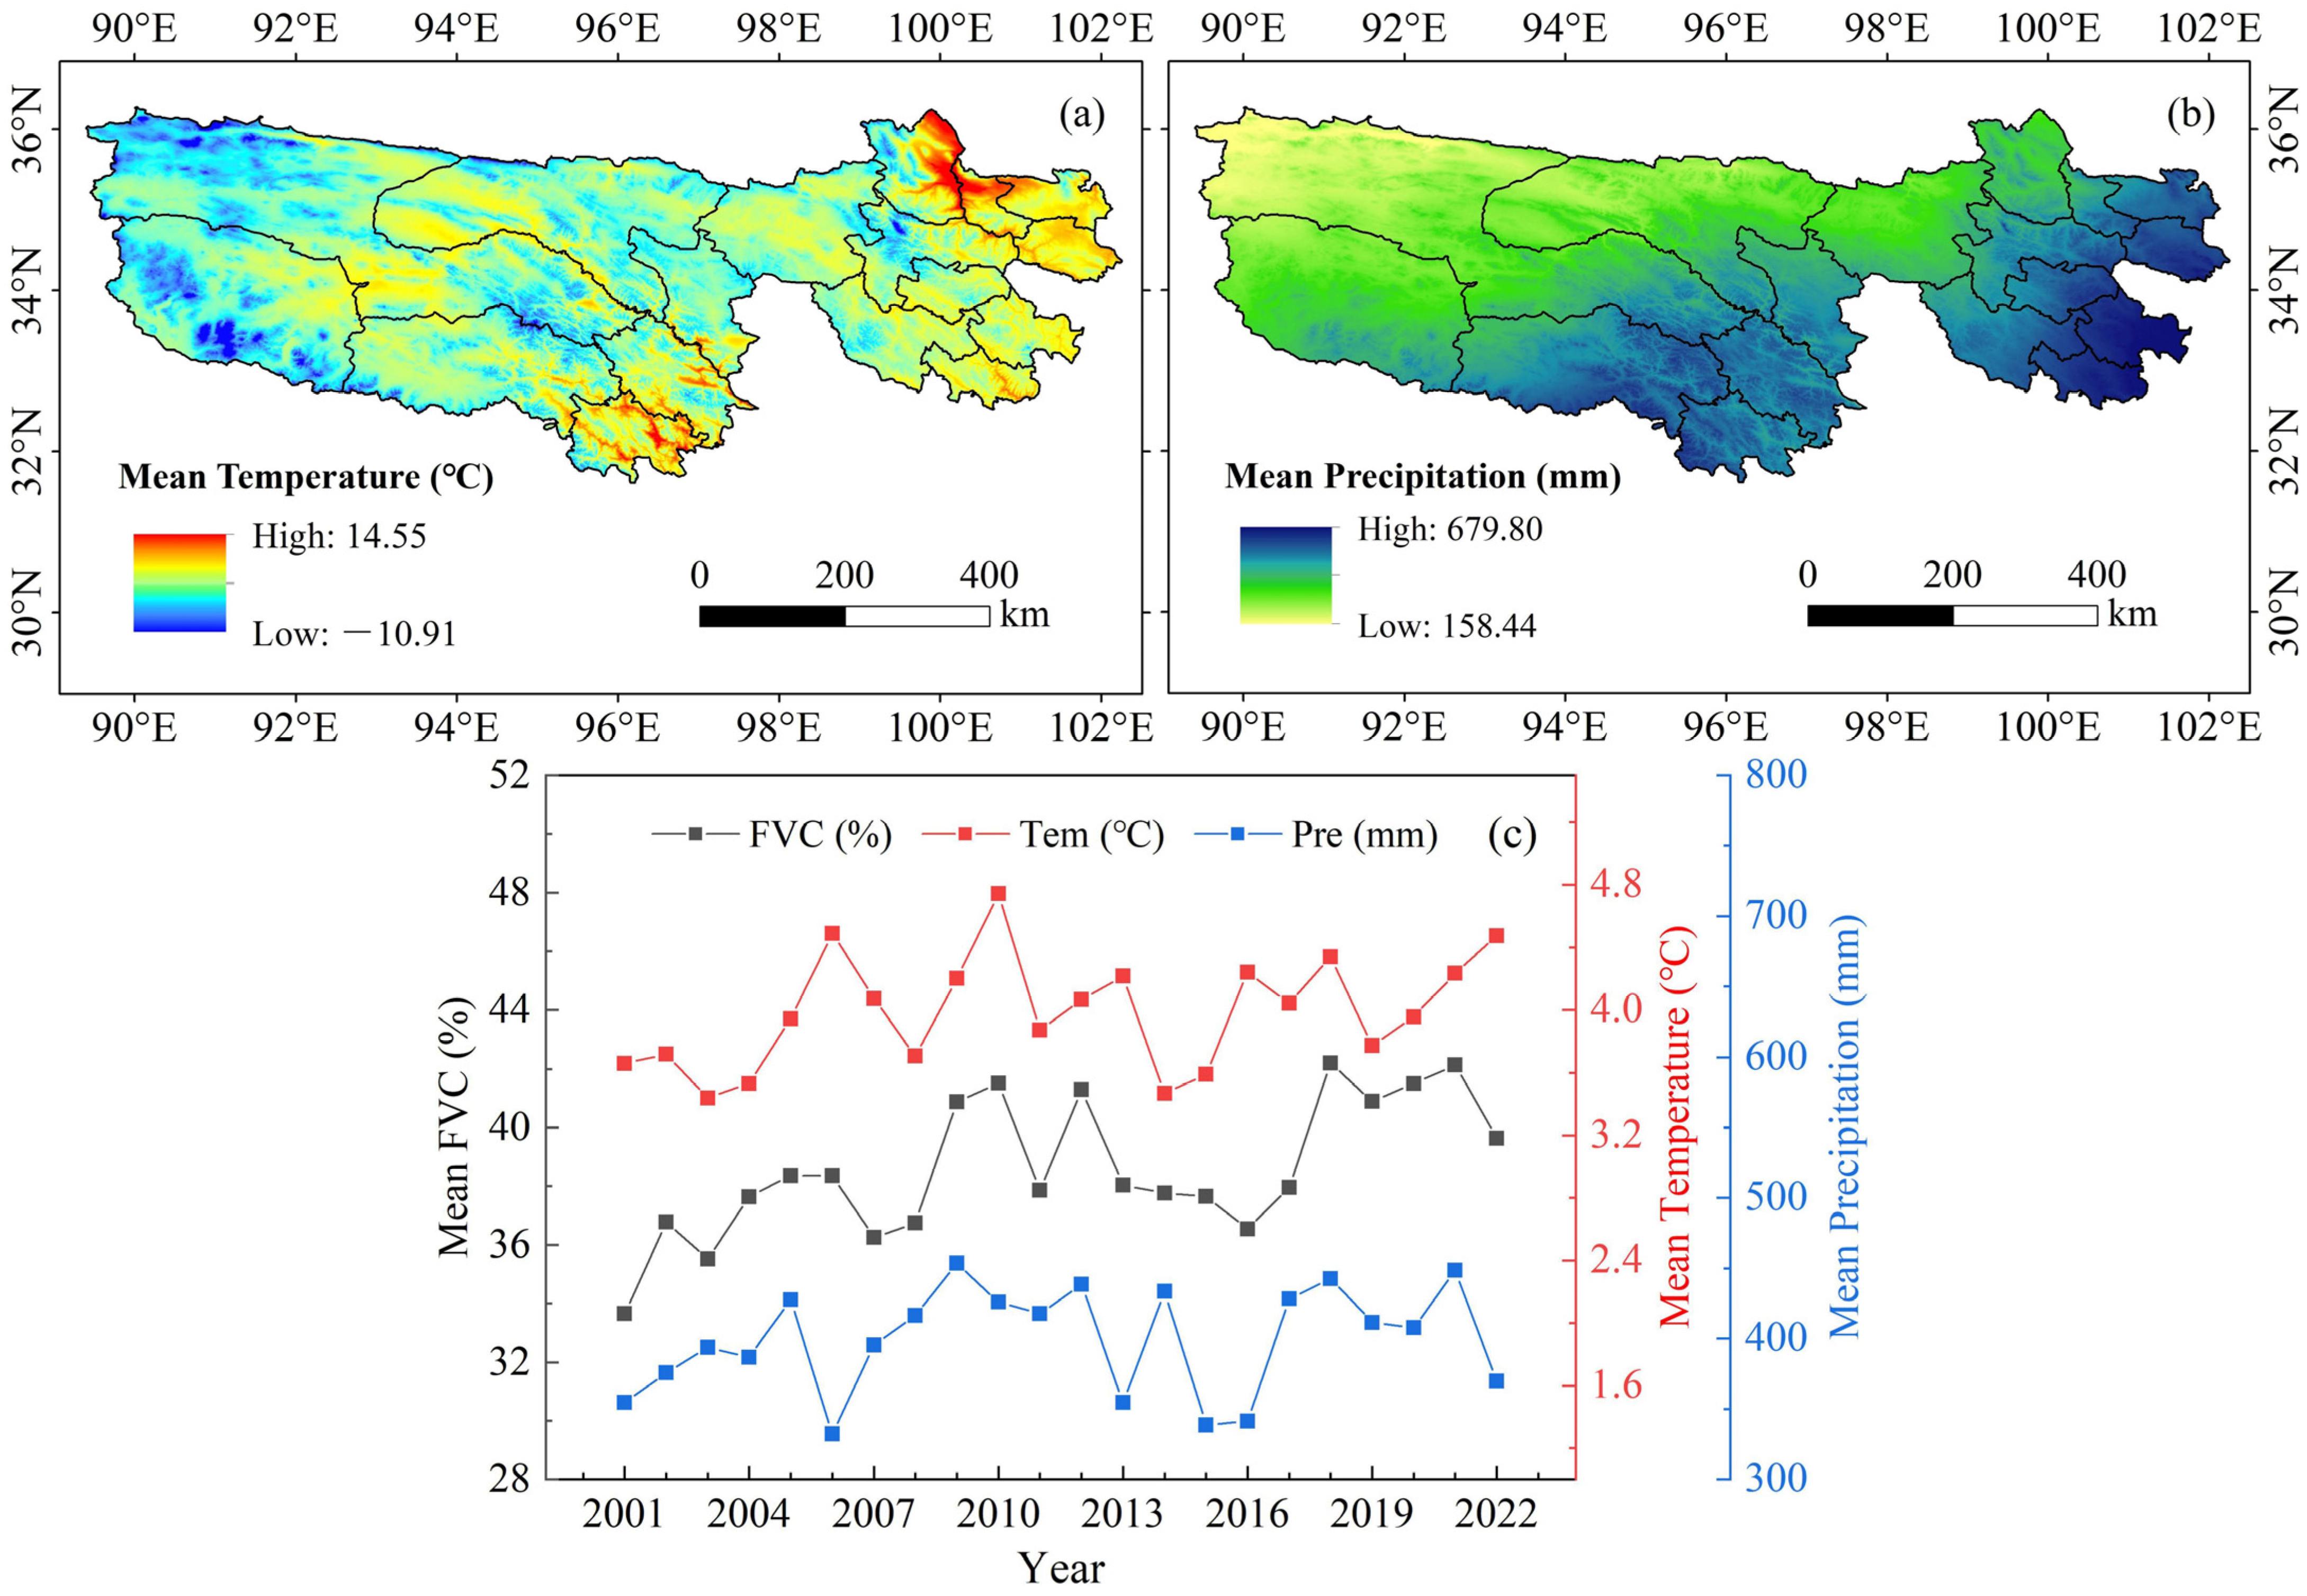
2.1.1. Study Area
2.1.2. Data
2.2. Methods
2.2.1. Dimidiate Pixel Model
2.2.2. Statistical Metrics
2.2.3. The Theil–Sen Median and the Mann-Kendall Significance Test
2.2.4. Hurst Index
- The average FVC time series was determined as follows:
- 2.
- The cumulative deviation was computed in the following manner:
- 3.
- The range of deviation was determined in the following way:
- 4.
- The standard deviation was determined in the following manner:
- 5.
- The Hurst index was computed in the following manner:
2.2.5. Partial Correlation Analysis
2.2.6. Residual Trend Analysis
3. Results
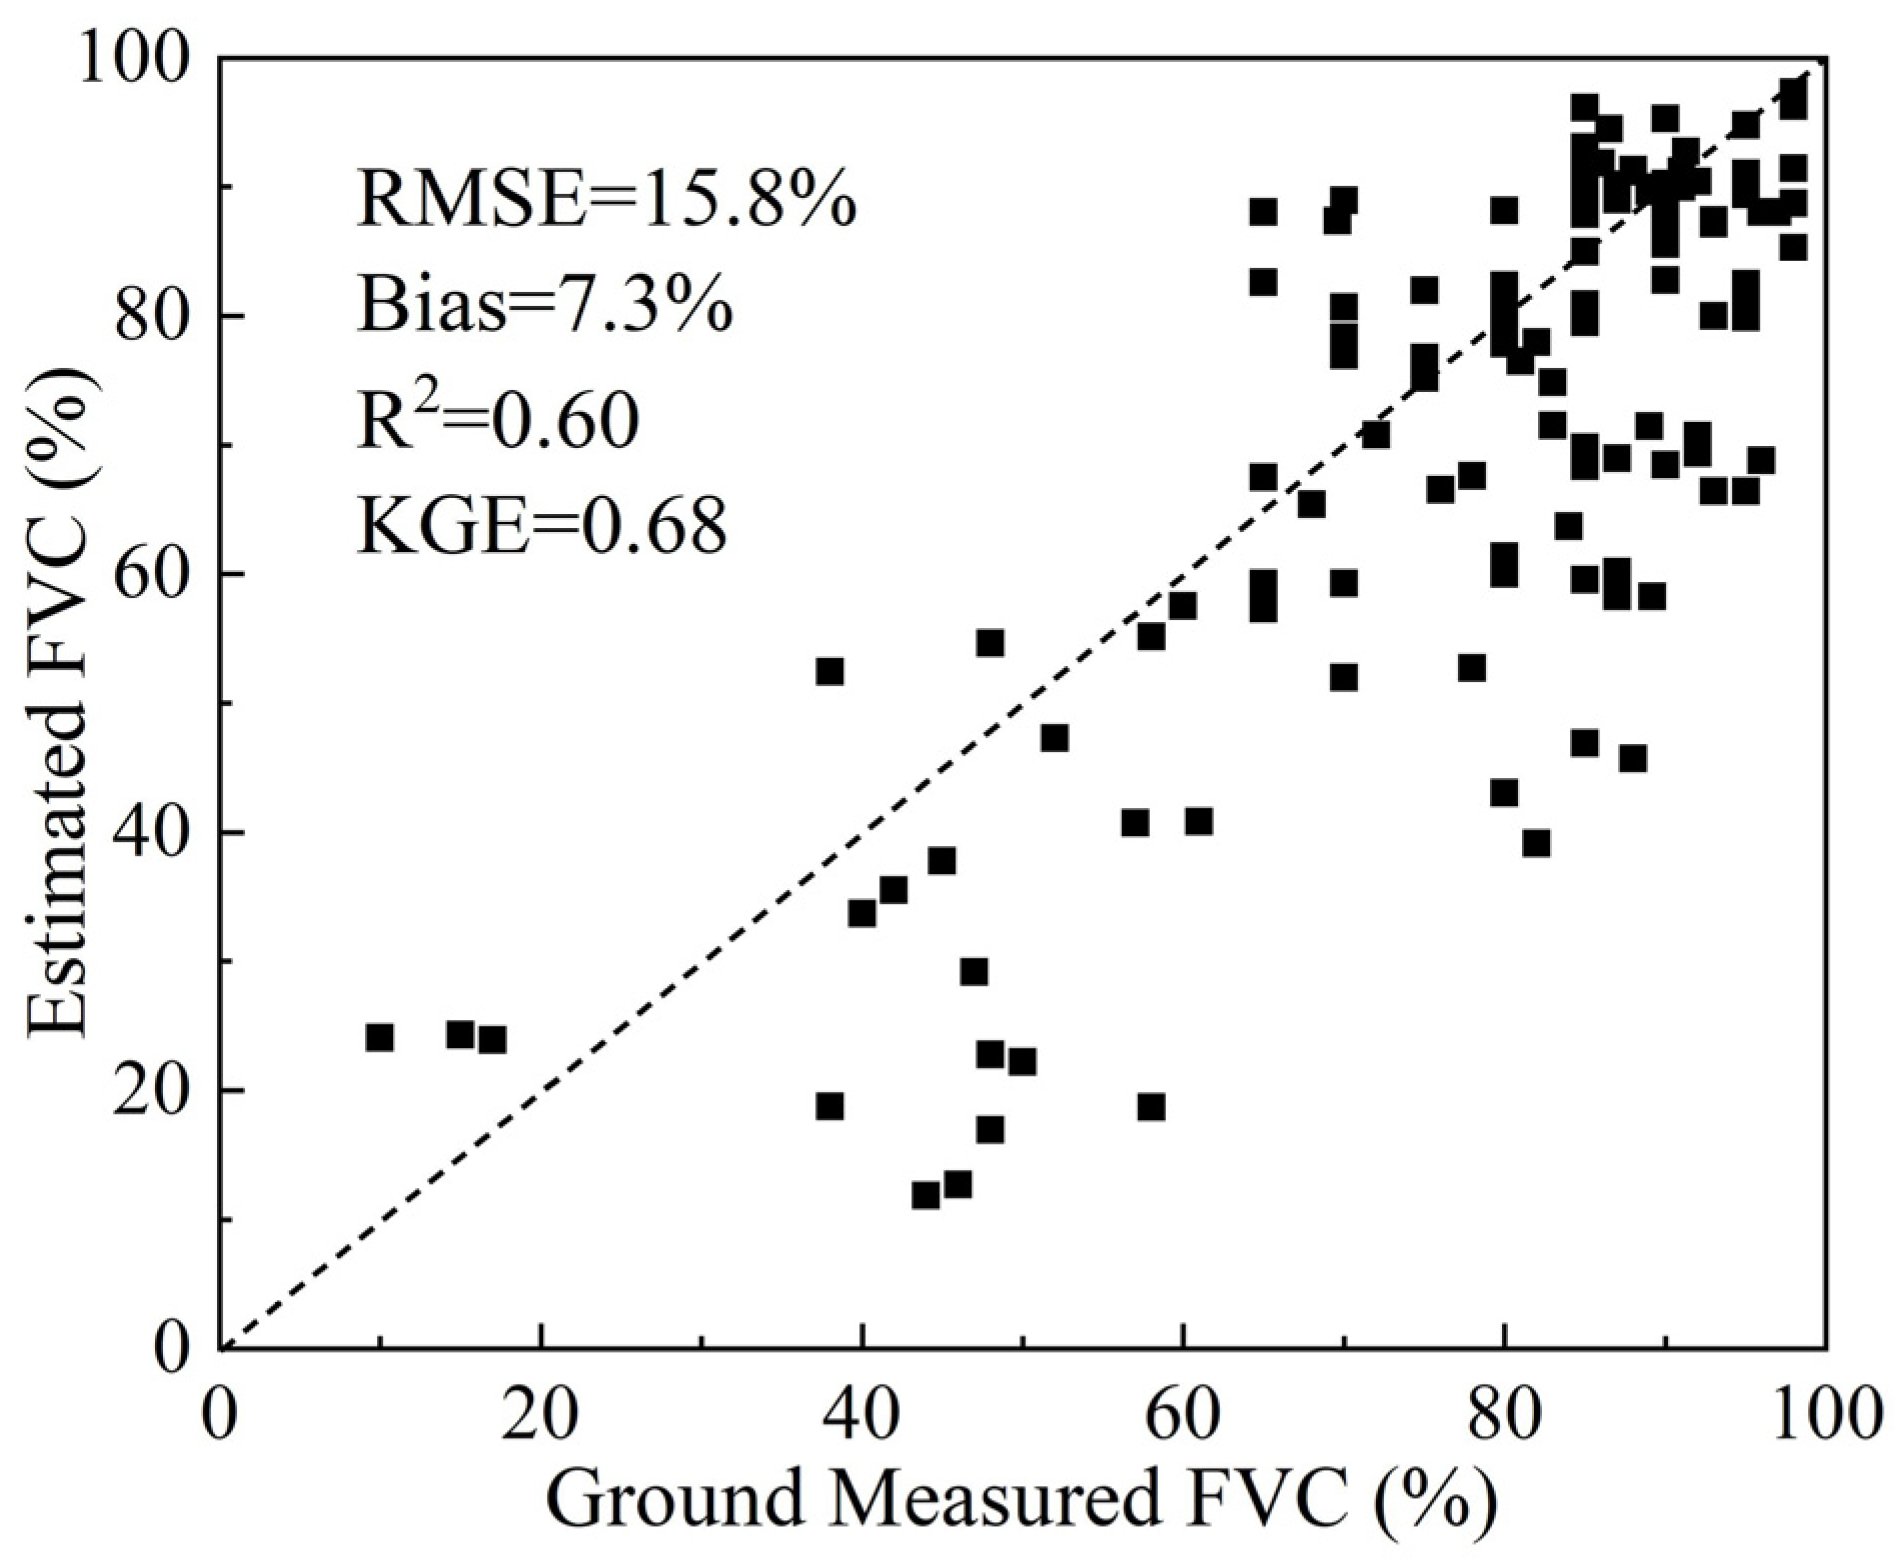
3.1. Validation of FVC Retrieval in the TRHR
3.2. Spatial Distribution of the FVC in the TRHR
3.3. Spatiotemporal Dynamics of the FVC from 2001 to 2022
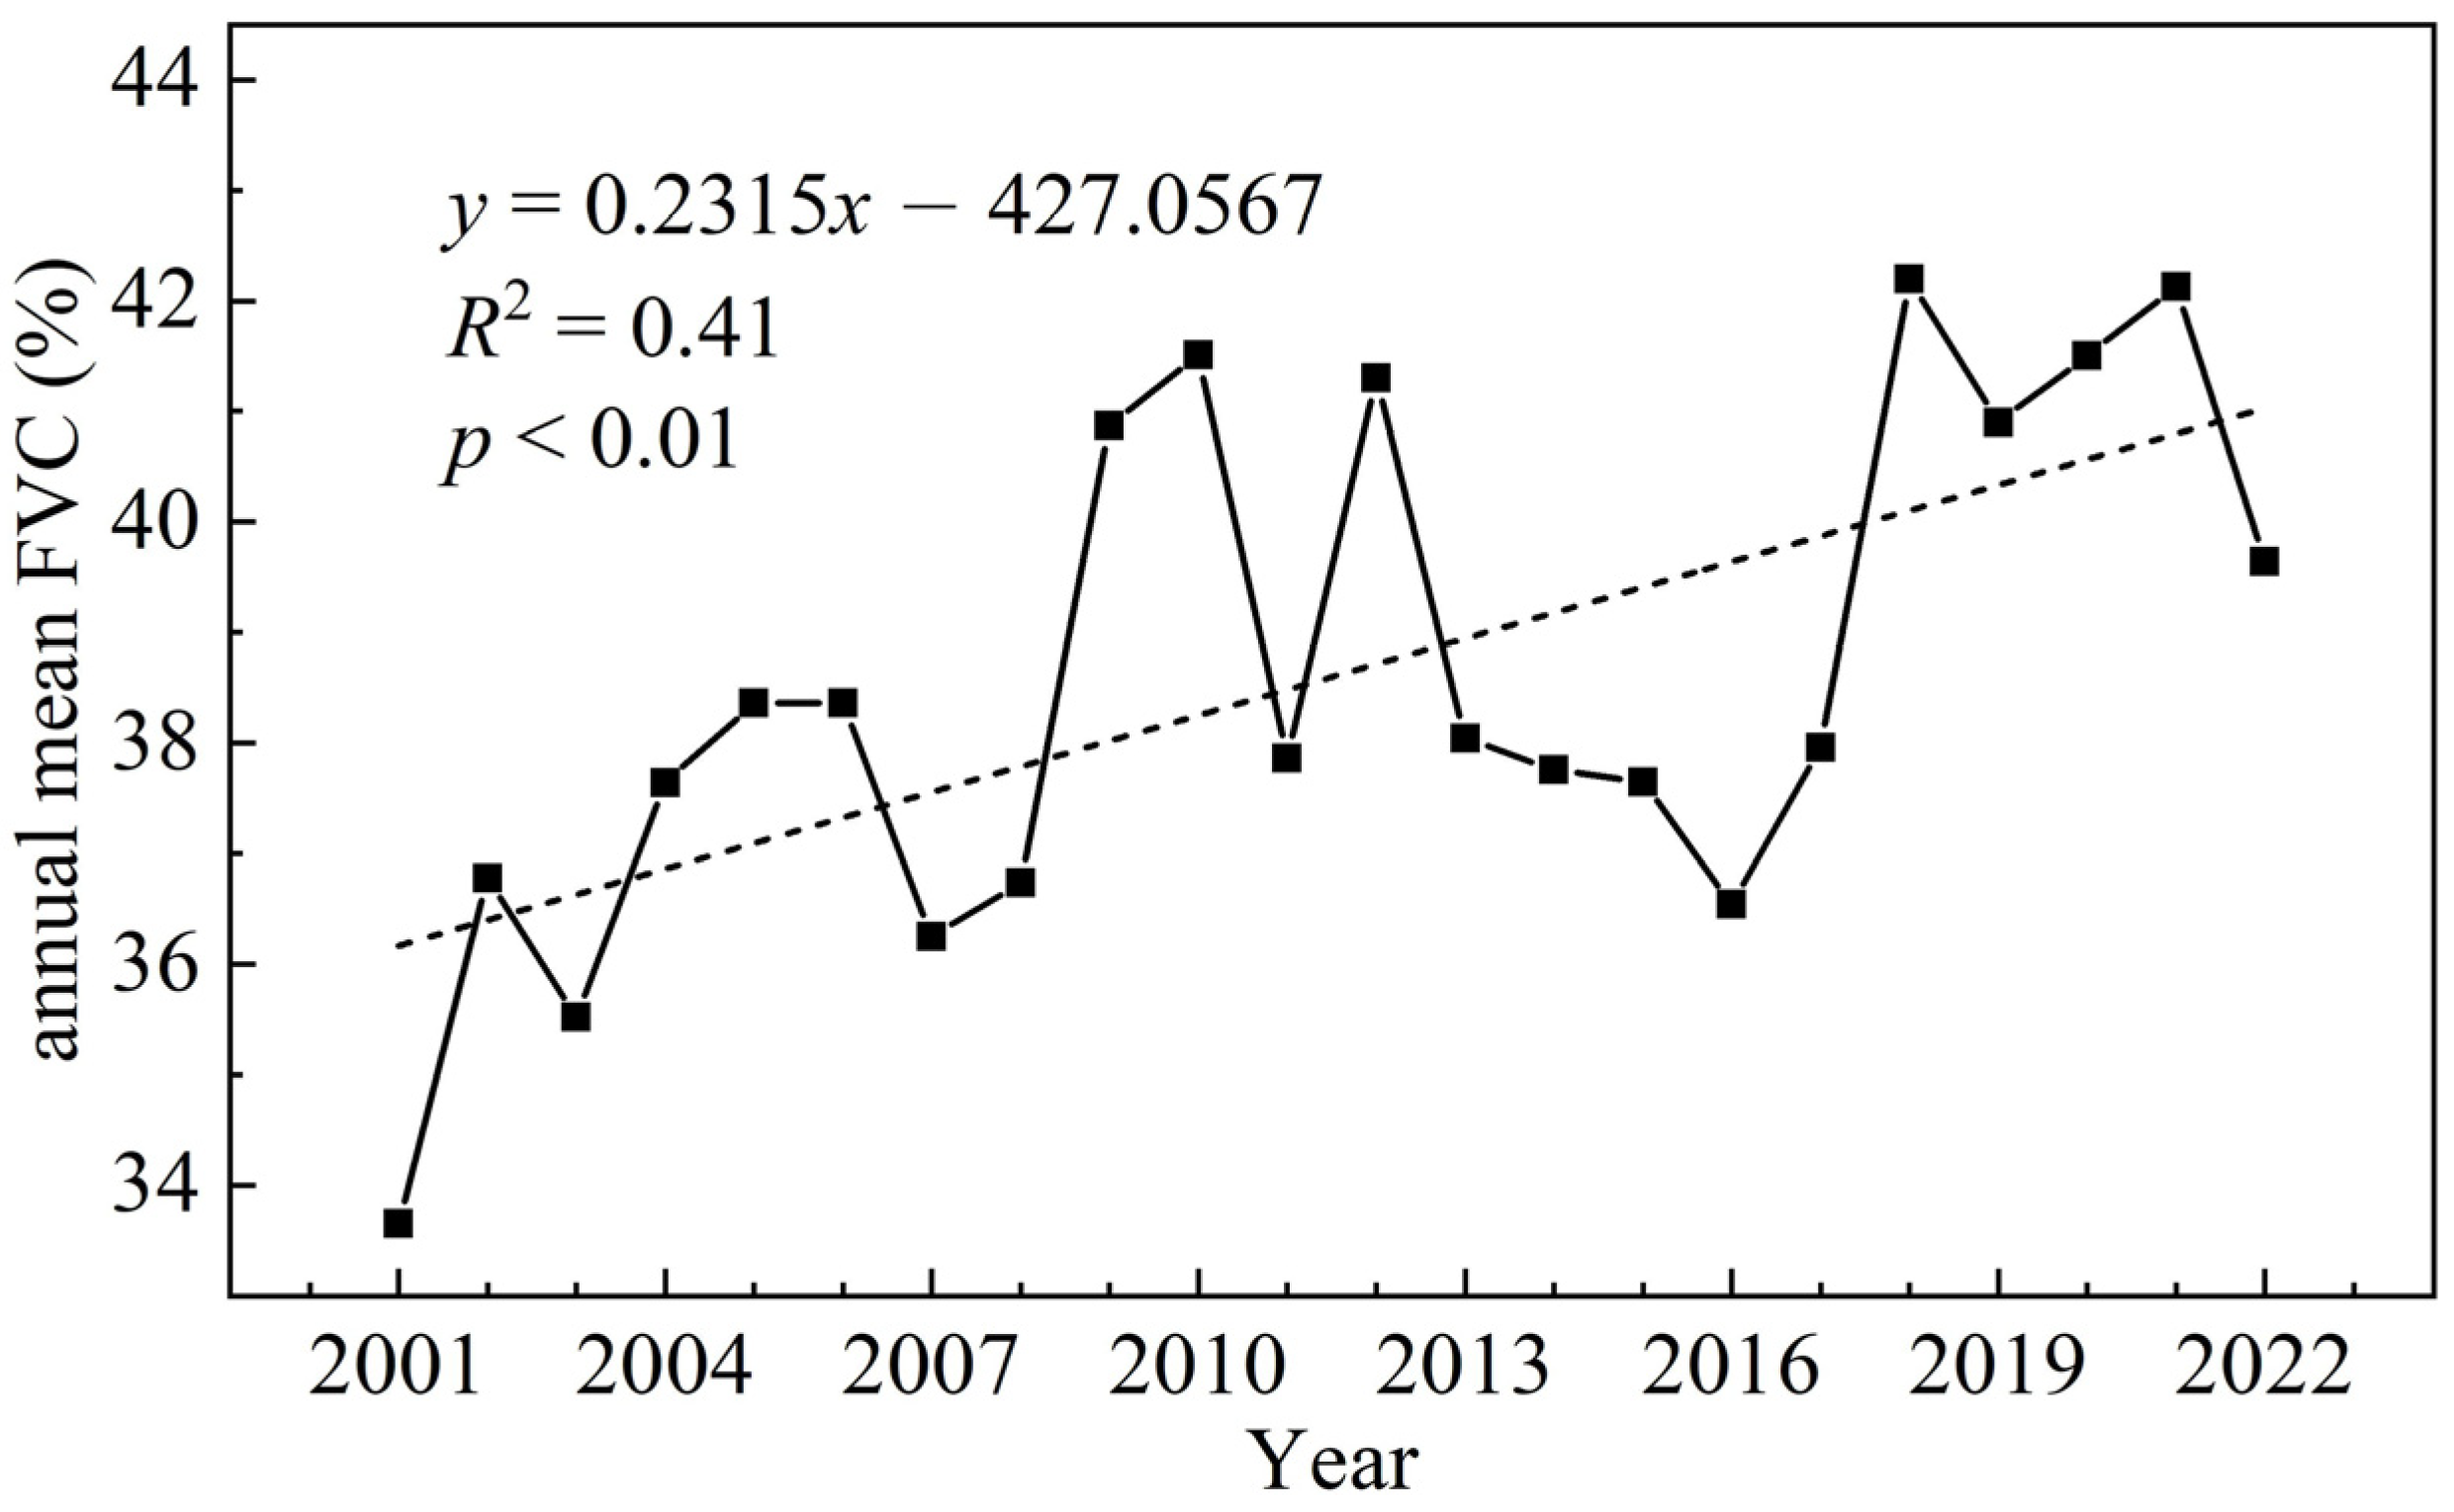
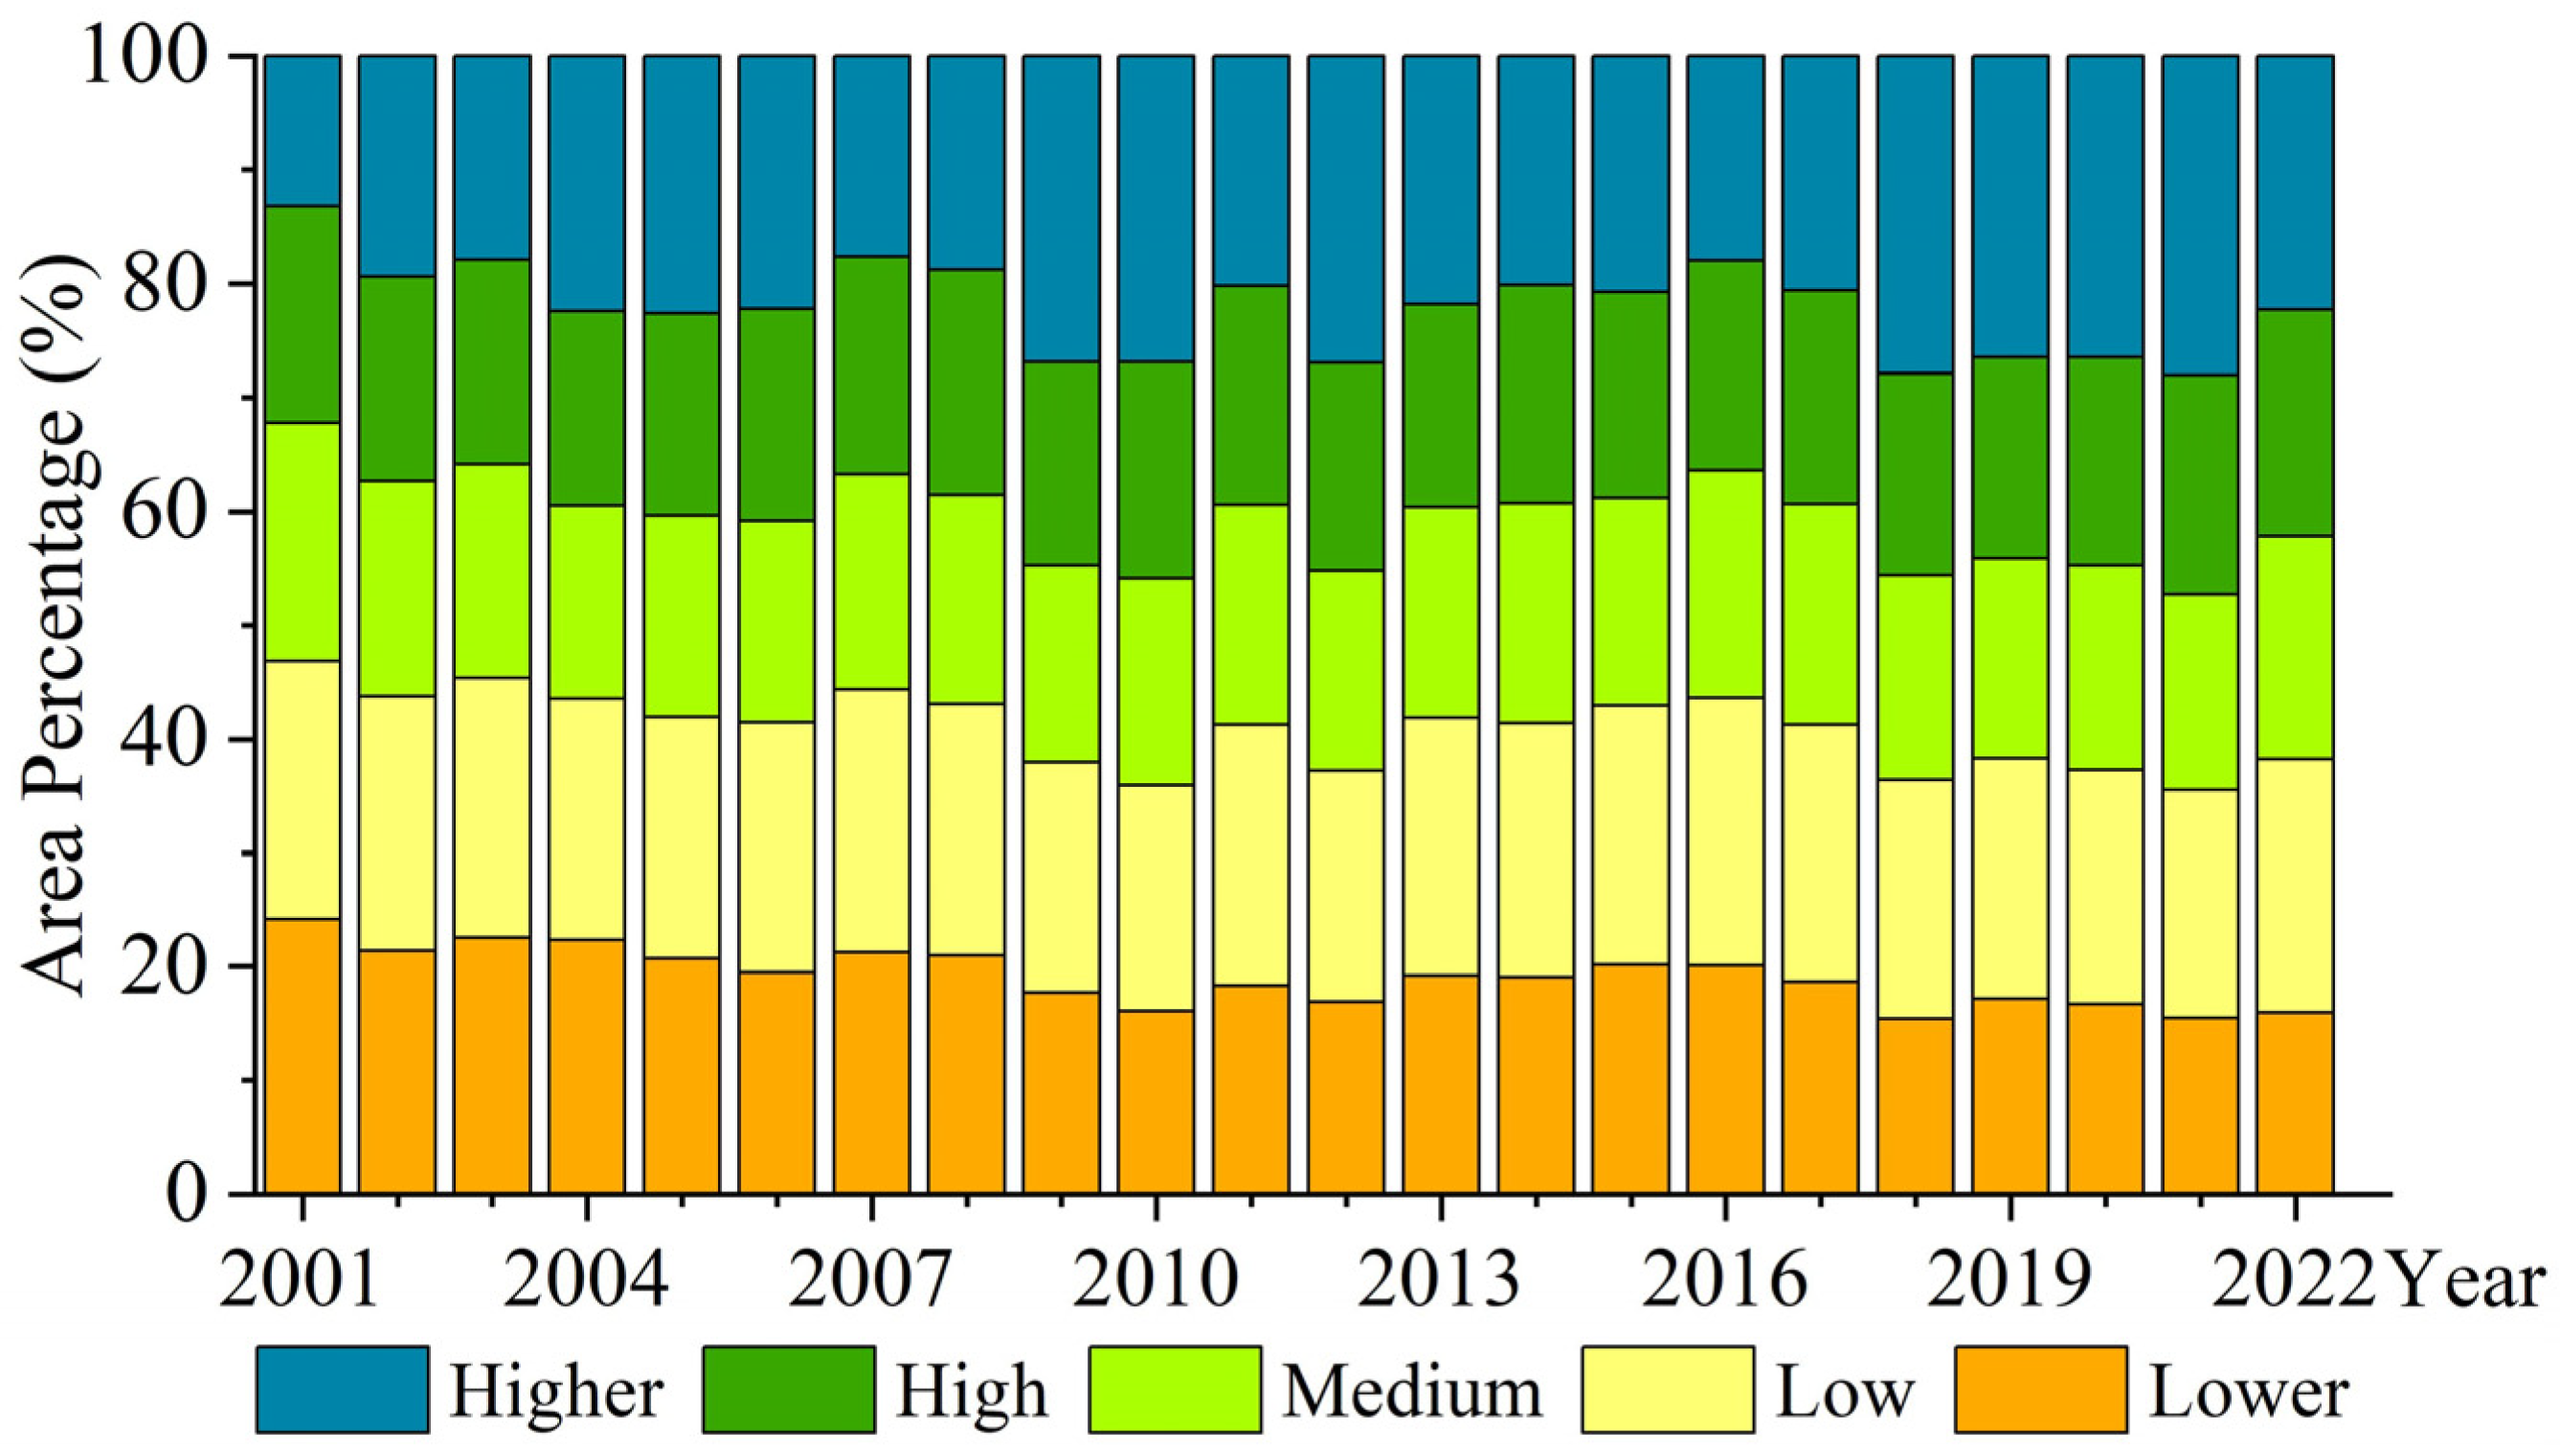
3.3.1. Temporal Variation in the FVC
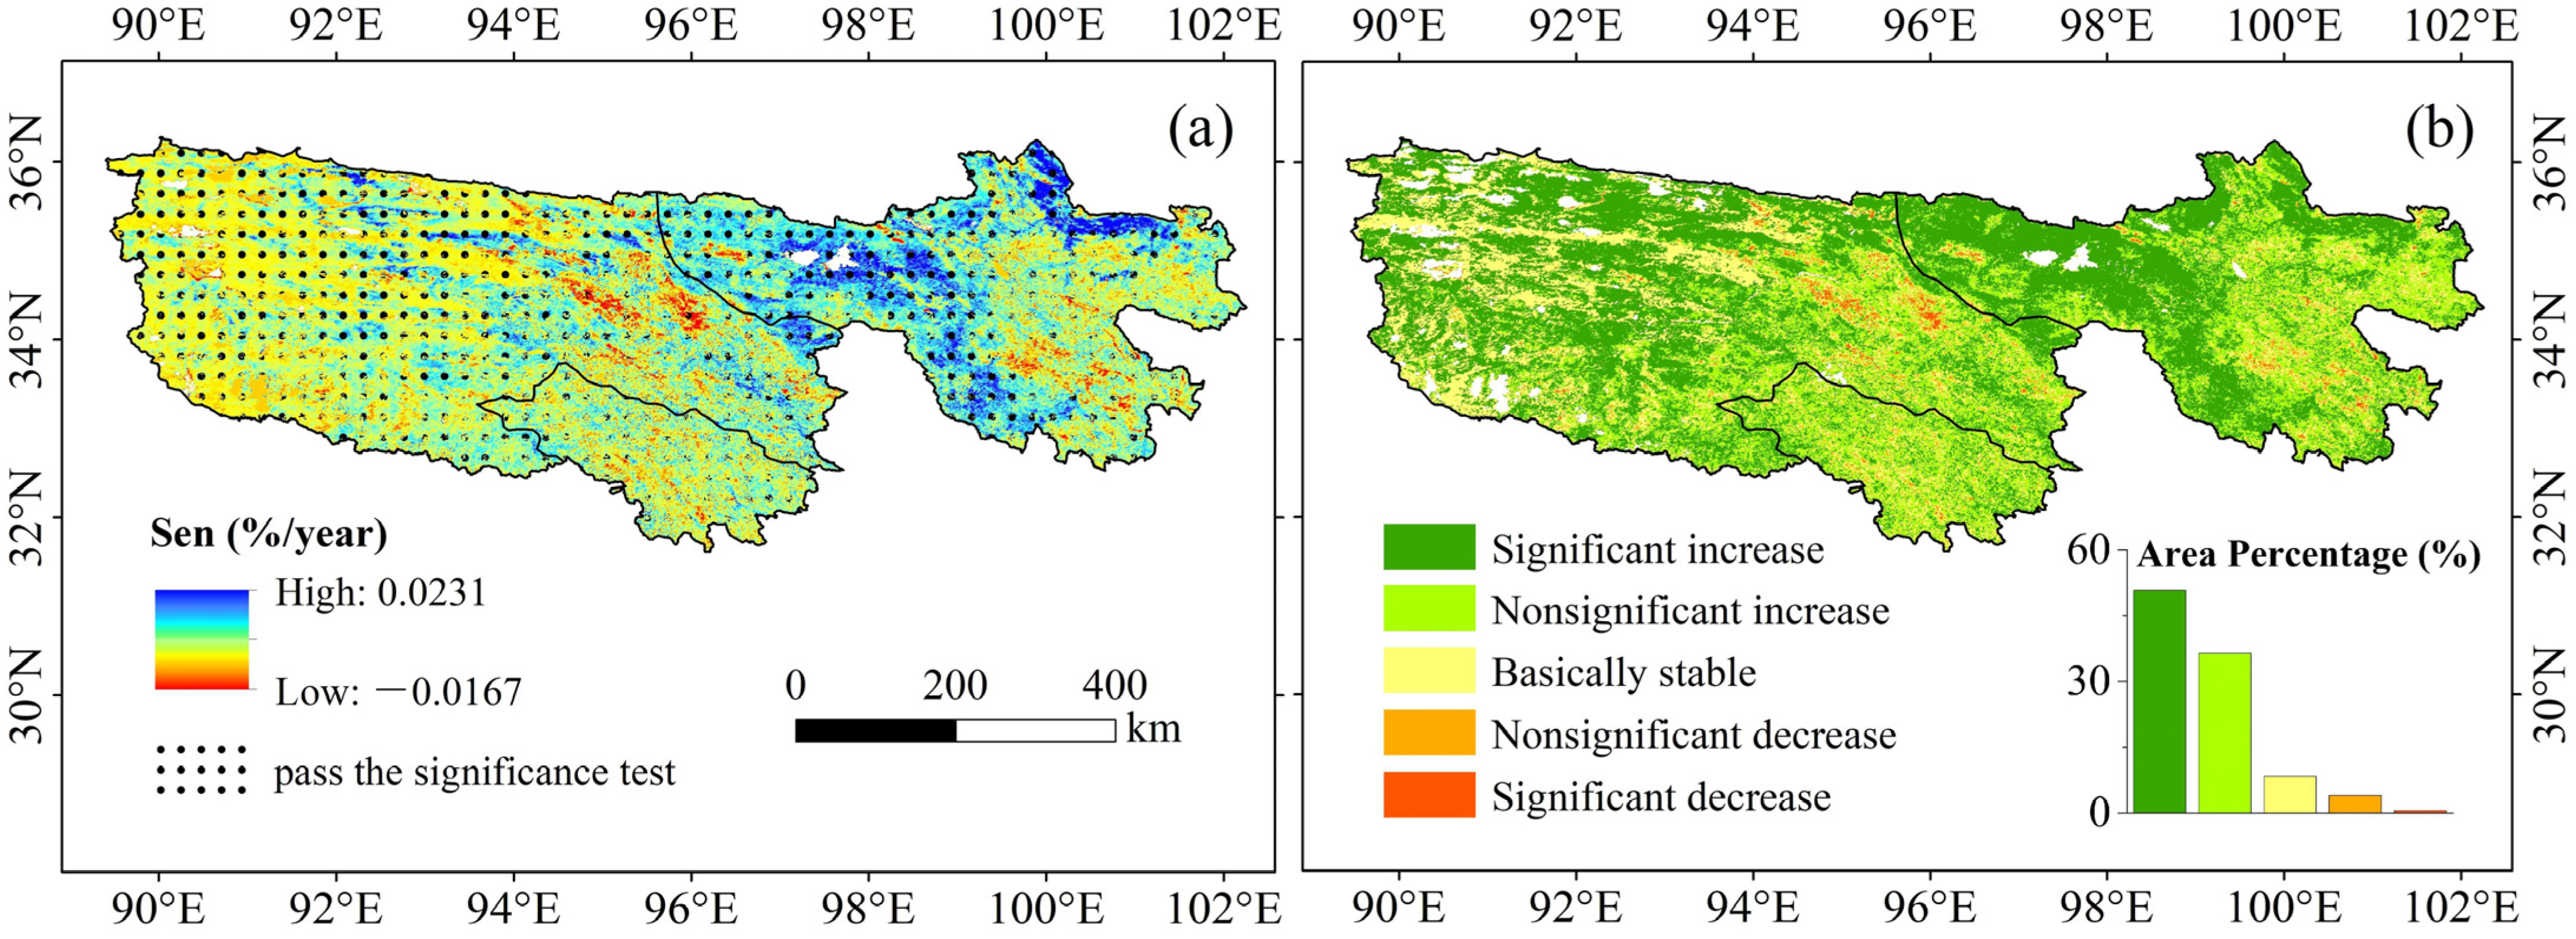
3.3.2. Spatial Variation in the FVC
3.3.3. Future Trends in FVC
3.4. Contribution of Driving Factors to FVC
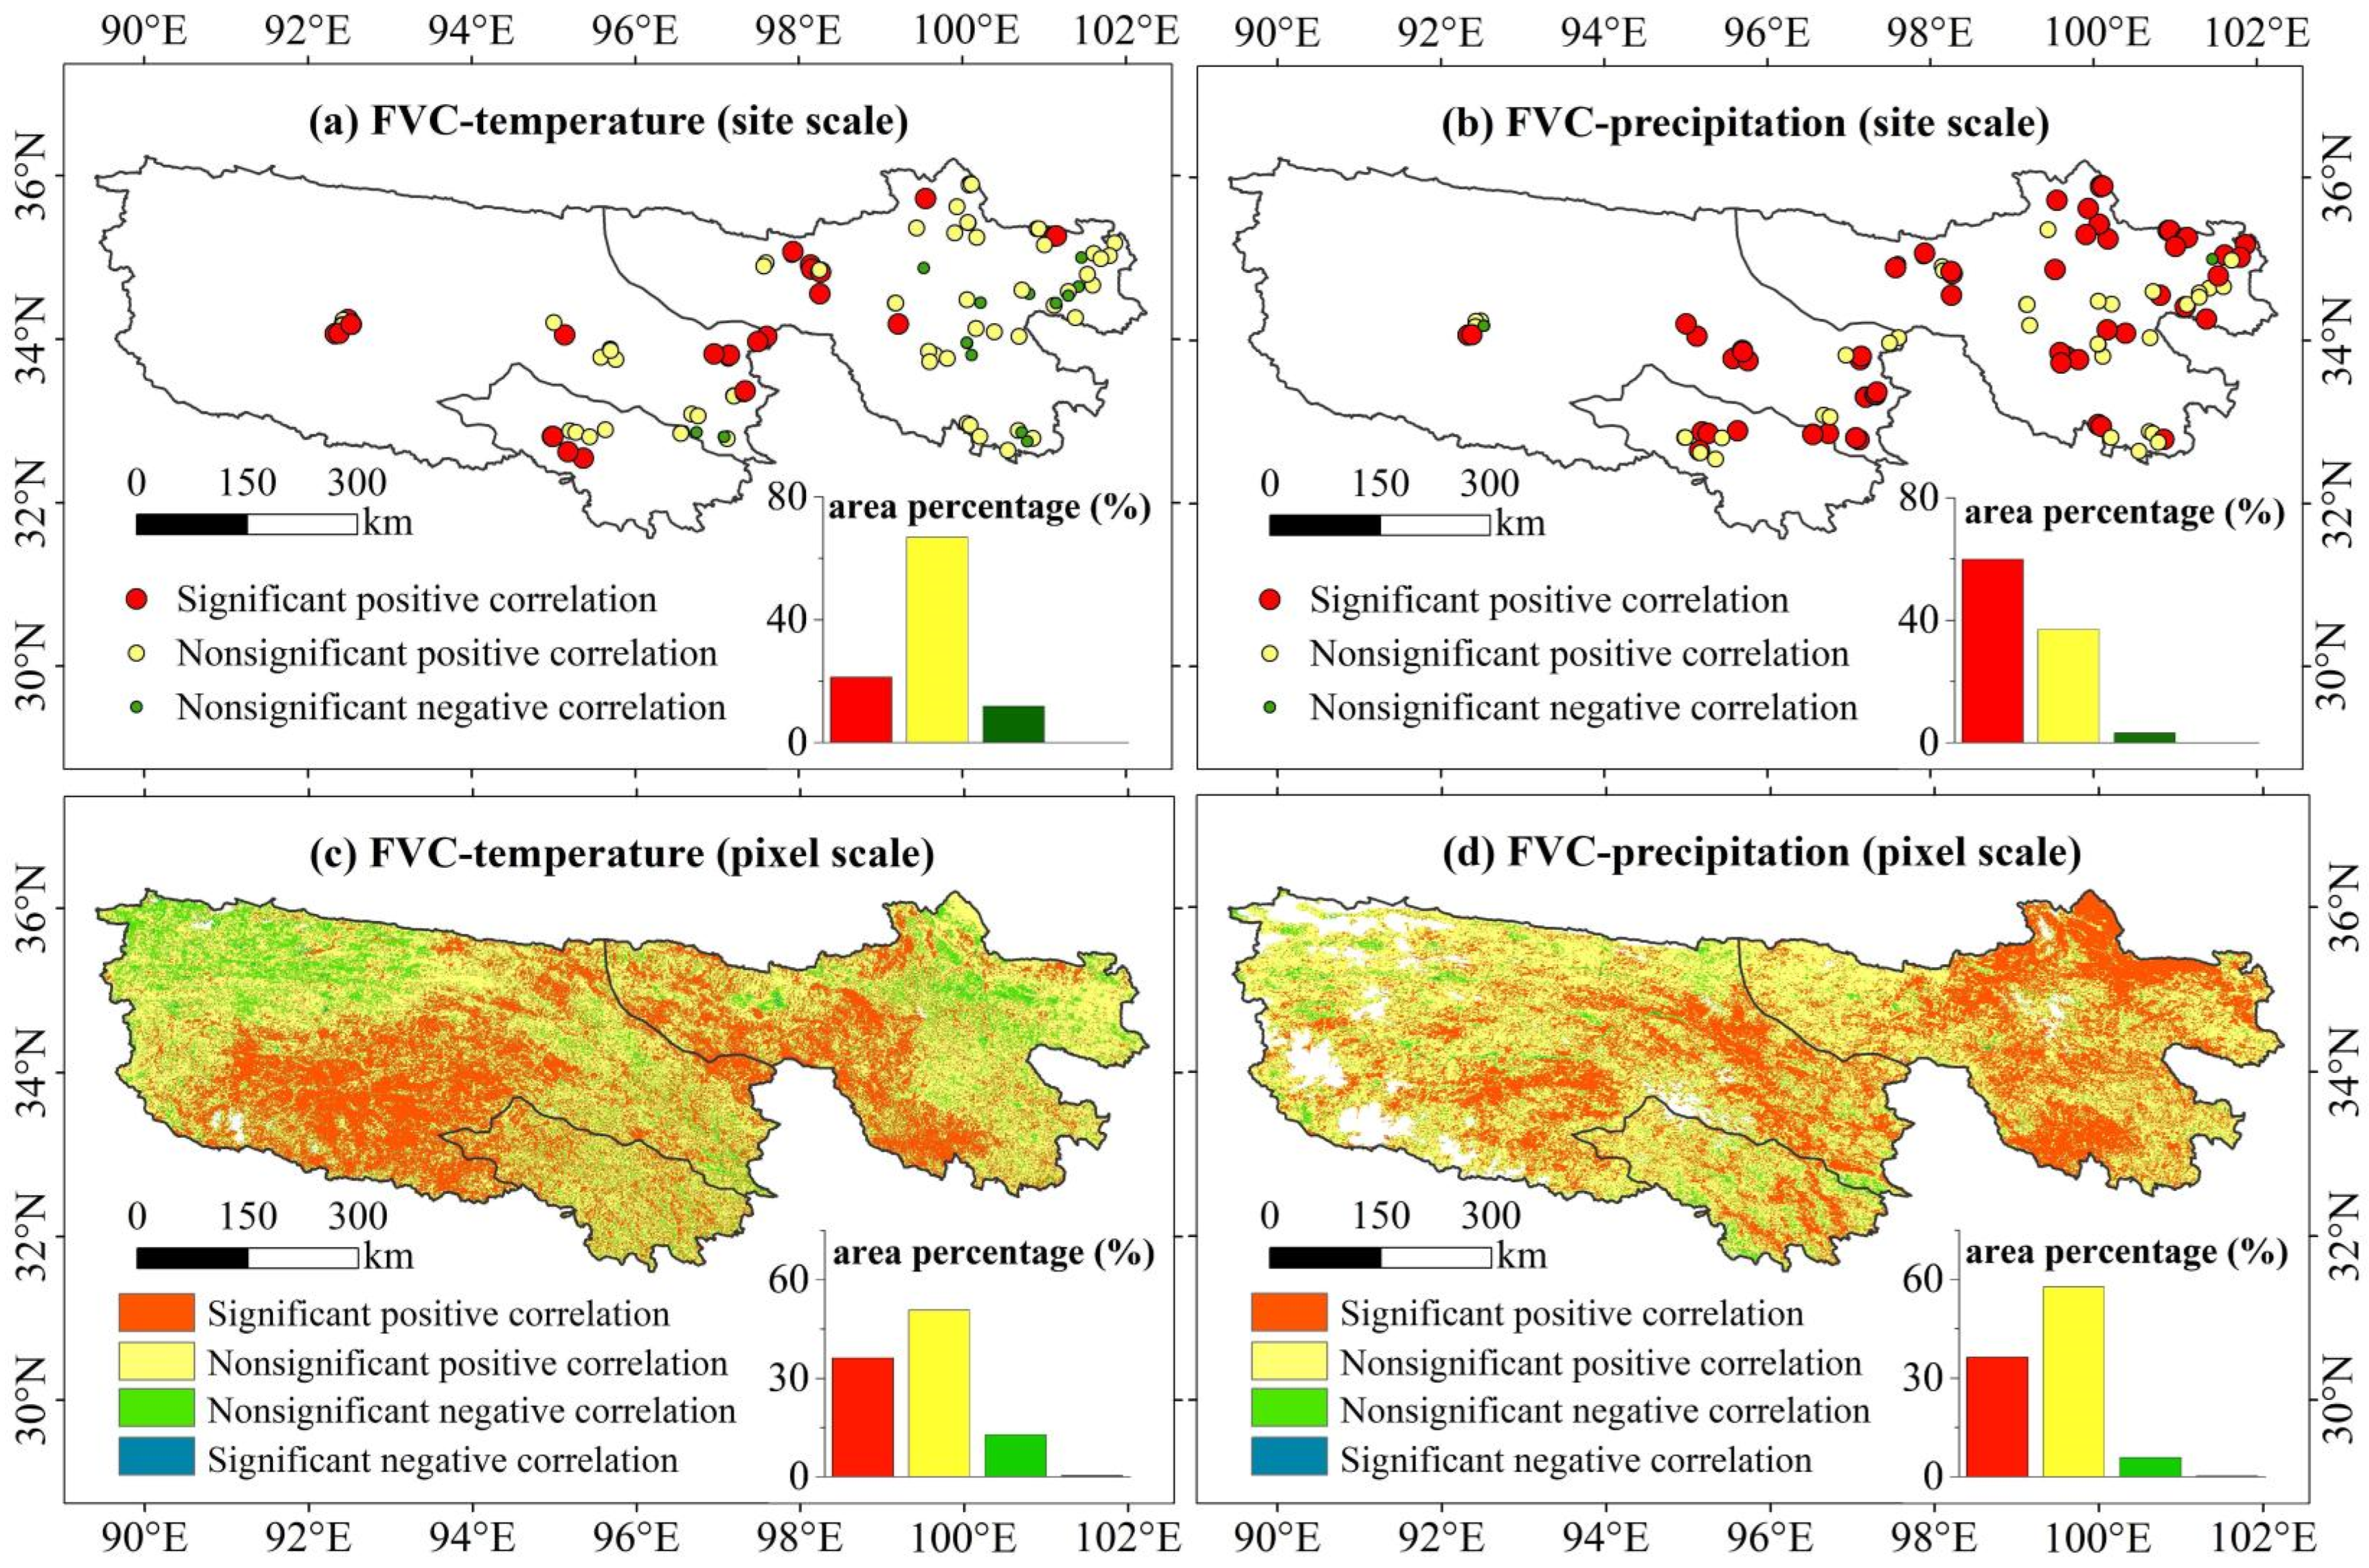
3.4.1. Climate Factors Affecting FVC
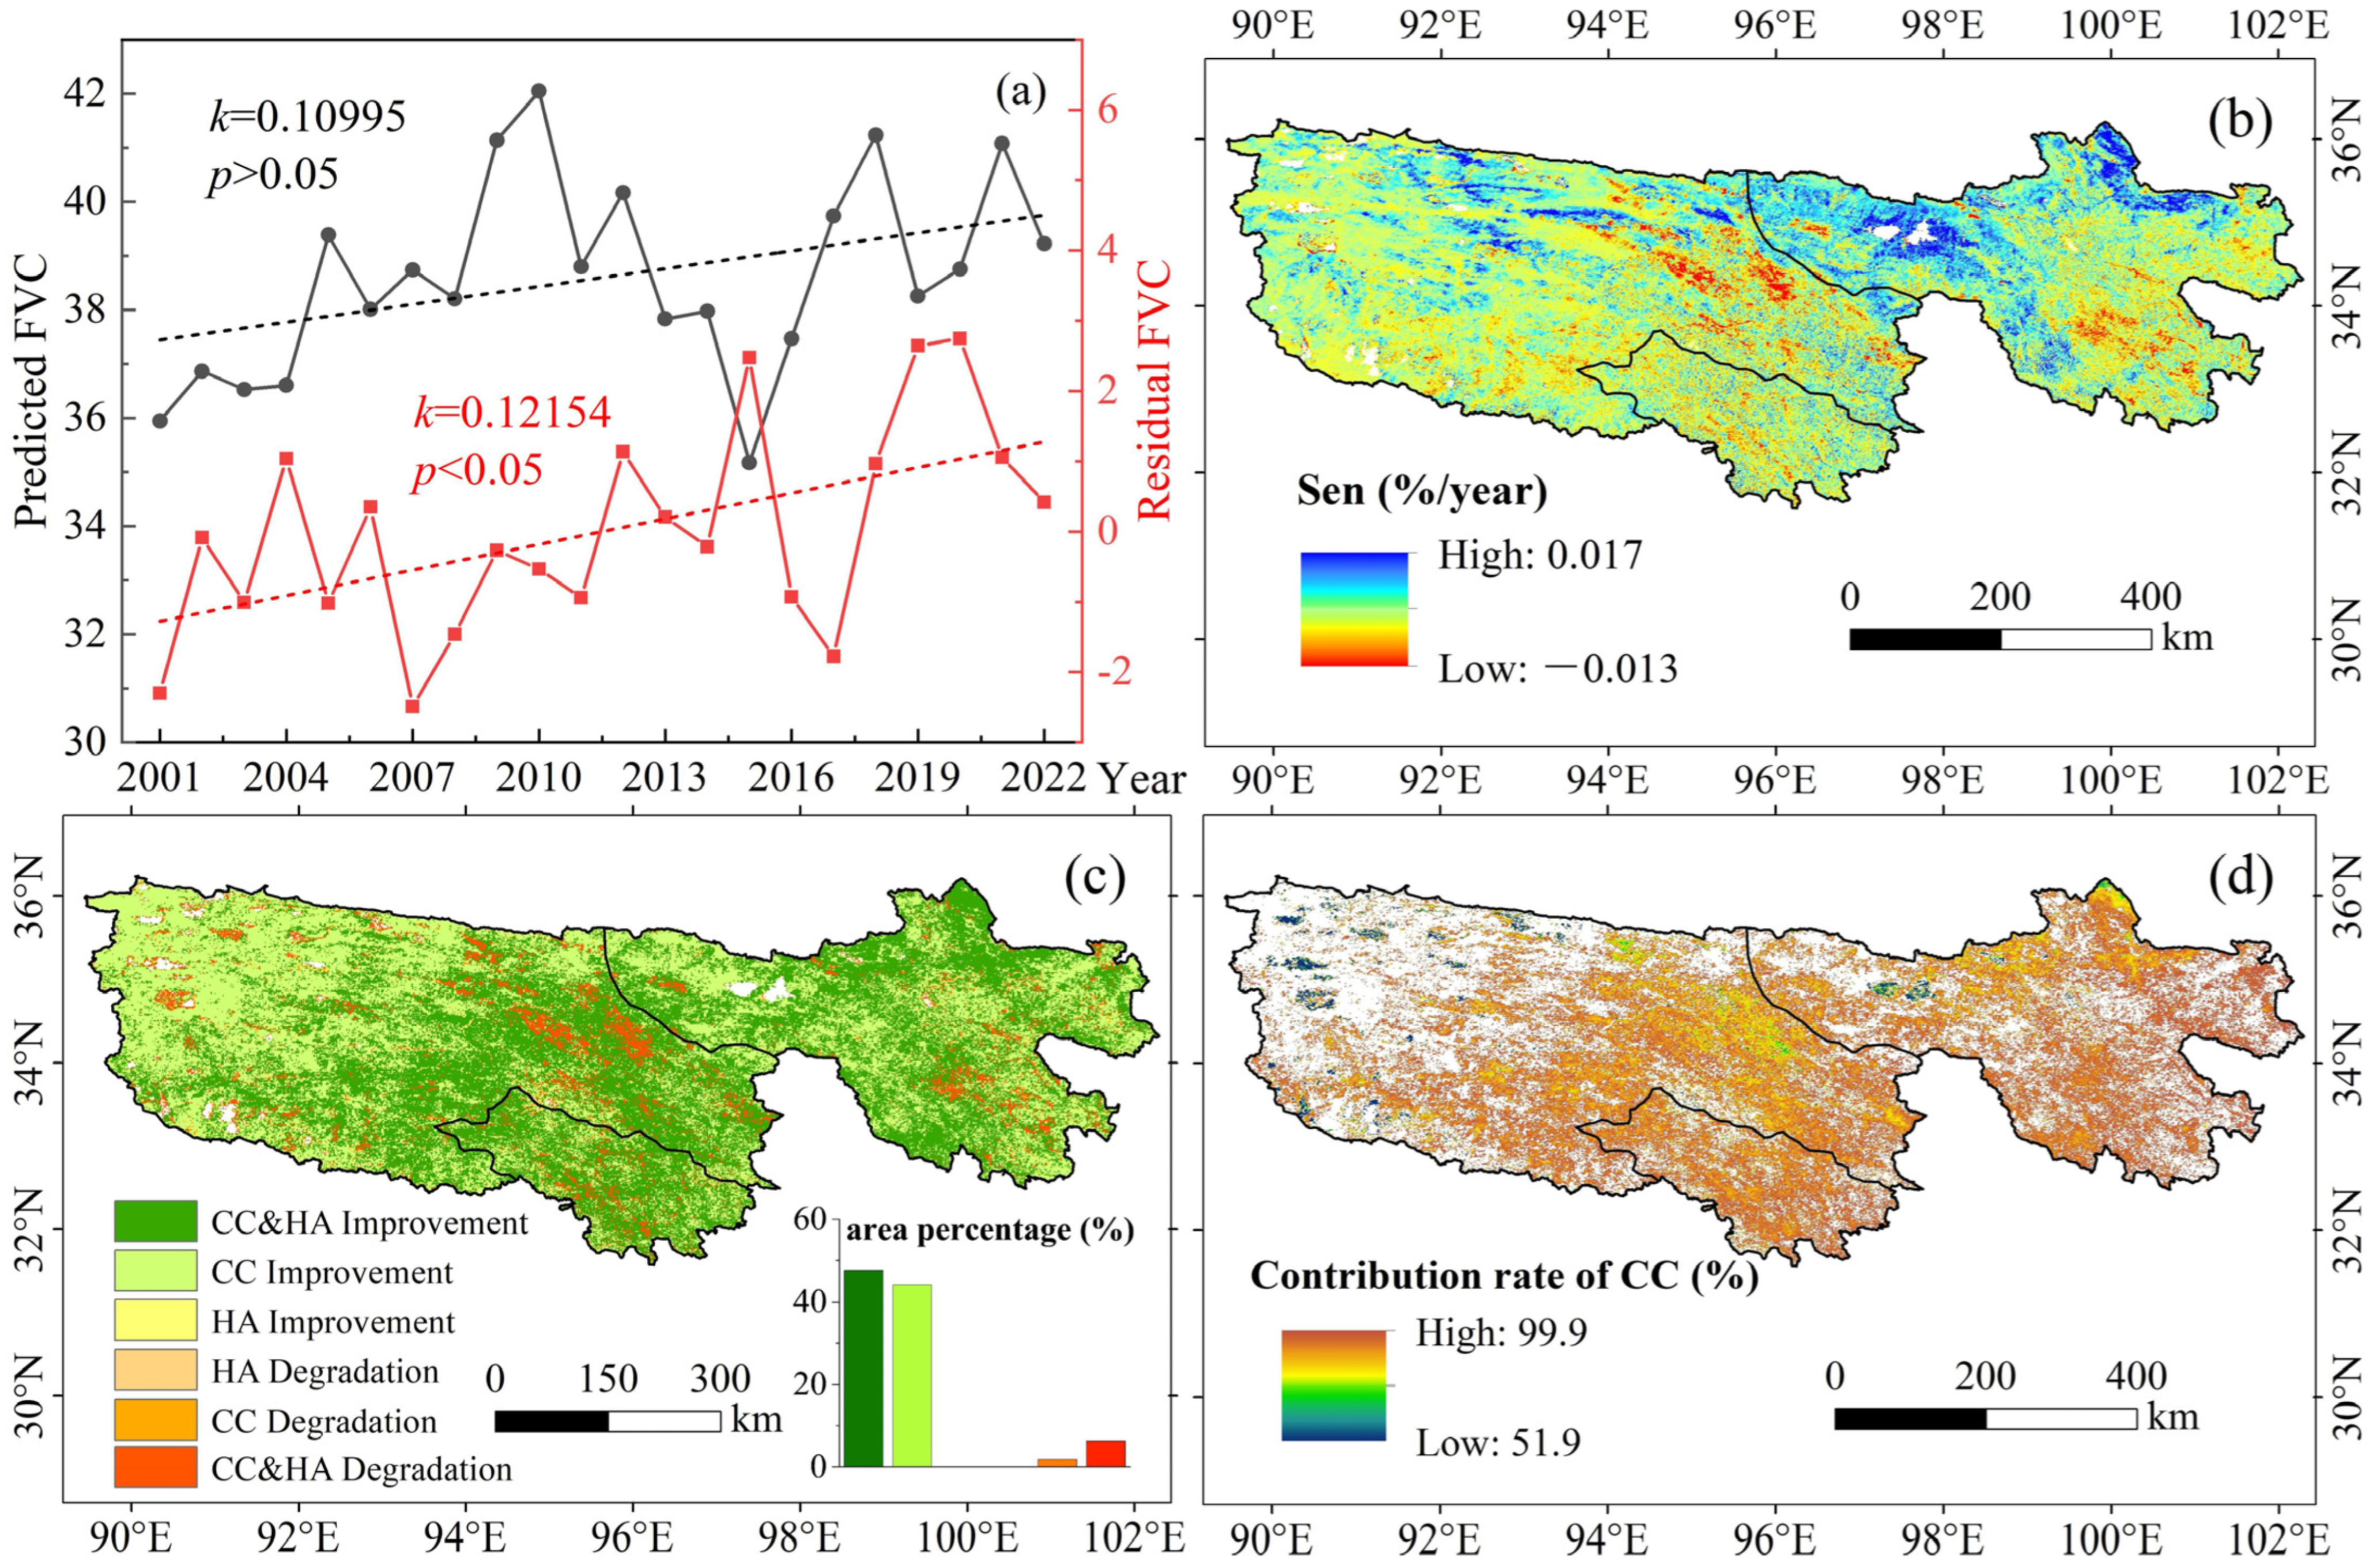
3.4.2. Contribution Rates of Climate Change and Human Activities
4. Discussion
4.1. Spatiotemporal Variation in FVC
4.2. Effects of Climate Change and Human Activities
4.3. Limitations and Prospects
5. Conclusions
- The dimidiate pixel model employed in this paper yielded an FVC estimation accuracy of 84.2%, indicating that the model is viable and exhibits strong correlation and high precision.
- The FVC in the TRHR exhibited a volatile yet growing trend from 2001 to 2022, with a mean annual increase of 0.23% (p < 0.01). Spatially, an increasing trend in FVC was detected in 87.11% of the area, of which 50.72% demonstrated significant increases in FVC. Notably, the origin area of the Yellow River experienced the greatest increase in vegetation coverage.
- The FVC displayed a direct connection with both rainfall and temperature, with the influences of these two climatic elements being approximately equivalent. The southwestern zone of the YeRB, as well as the southern zone of the YaRB, is mostly influenced by temperature, whereas the northeastern zone of the YeRB and the southeastern portion of the YaRB are mostly influenced by precipitation. Notably, Dari County exhibited a significant response to both temperature and precipitation.
- Residual analysis revealed that climate variability was the predominant influence on the FVC variations within the study area. Despite the vastness and low population density of the region, which results in minimal human impact, vegetation restoration efforts in the origin of the Yellow River have achieved success.
Author Contributions
Funding
Data Availability Statement
Acknowledgments
Conflicts of Interest
Abbreviations
| TRHR | Three-River Headwaters Region |
| FVC | Fractional vegetation cover |
| MODIS | Moderate Resolution Imaging Spectroradiometer |
| NDVI | Normalized Difference Vegetation Index |
| YaRB | Yangtze River Basin |
| YeRB | Yellow River Basin |
| LRB | Lancang River Basin |
References
- Fan, J.W.; Shao, Q.Q.; Liu, J.Y.; Wang, J.B.; Harris, W.; Chen, Z.Q.; Zhong, H.P.; Xu, X.L.; Liu, R.G. Assessment of effects of climate change and grazing activity on grassland yield in the Three Rivers Headwaters Region of Qinghai–Tibet Plateau, China. Environ. Monit Assess. 2010, 170, 571–584. [Google Scholar] [PubMed]
- Qian, S.; Fu, Y.; Pan, F.F. Climate change tendency and grassland vegetation response during the growth season in Three-River Source Region. Sci. China Earth Sci. 2010, 53, 1506–1512. [Google Scholar]
- Shao, Q.Q.; Zhao, Z.P.; Liu, J.Y.; Fan, J.W. The characteristics of land cover and macroscopical ecology changes in the source region of three-rivers on Qinghai-Tibet Plateau during last 30 years. Geogr. Res. 2010, 29, 1439–1451. (In Chinese) [Google Scholar]
- Cao, W.; Wu, D.; Huang, L.; Liu, L. Spatial and temporal variations and significance identification of ecosystem services in the Sanjiangyuan National Park, China. Sci. Rep. 2020, 10, 6151. [Google Scholar]
- Gao, J.; Jiao, K.; Wu, S.; Ma, D.; Zhao, D.; Yin, Y.; Dai, E. Past and future effects of climate change on spatially heterogeneous vegetation activity in China. Earth’s Future 2017, 5, 679–692. [Google Scholar]
- Zhang, X.; Jin, X. Vegetation dynamics and responses to climate change and anthropogenic activities in the Three-River Headwaters Region, China. Ecol. Indic. 2021, 131, 108223. [Google Scholar] [CrossRef]
- Nzabarinda, V.; Bao, A.; Xu, W.; Uwamahoro, S.; Xiaoran, H.; Habiyakare, T.; Sindikubwabo, C.; Habumugisha, J.M.; Itangishaka, A.C. A simple model to predict the spatiotemporally vegetation dynamics in terms of precipitation and temperature. Environ. Dev. 2022, 44, 100769. [Google Scholar]
- Zhang, X.; Liao, C.; Li, J.; Sun, Q. Fractional Vegetation Cover Estimation in Arid and Semi-Arid Environments Using HJ-1 Satellite Hyperspectral Data. Int. J. Appl. Earth Obs. Geoinf. 2013, 21, 506–512. [Google Scholar]
- Yang, L.; Jia, K.; Liang, S.; Liu, M.; Wei, X.; Yao, Y.; Zhang, X.; Liu, D. Spatio-Temporal Analysis and Uncertainty of Fractional Vegetation Cover Change over Northern China during 2001–2012 Based on Multiple Vegetation Data Sets. Remote Sens. 2018, 10, 549. [Google Scholar] [CrossRef]
- Wang, G.; Li, Q.; Cheng, G.; Shen, Y. Climate change and its impact on the Eco-environment in the Source Regions of the Yangtze and Yellow Rivers in recent 40 years. J. Glaciol. Geocryol. 2001, 23, 346–352. (In Chinese) [Google Scholar]
- Shen, X.; An, R.; Feng, L.; Ye, N.; Zhu, L.; Li, M. Vegetation changes in the Three-River Headwaters Region of the Tibetan Plateau of China. Ecol. Indic. 2018, 93, 804–812. [Google Scholar] [CrossRef]
- Shao, Q.; Fan, J.; Liu, J.; Huang, L.; Cao, W.; Xu, X.; Ge, J.; Wu, D.; Li, Z.; Gong, G.; et al. Assessment on the effects of the first-stage ecological conservation and restoration project in Sanjiangyuan region. J. Geogr. Sci. 2016, 71, 3–20. (In Chinese) [Google Scholar]
- Ning, X.; Zhu, N.; Liu, Y.; Wang, H. Quantifying impacts of climate and human activities on the grassland in the Three-River Headwater Region after two phases of Ecological Project. Geogr. Sustain. 2022, 3, 164–176. [Google Scholar] [CrossRef]
- Xie, Q.; Yang, X.; Hao, L. Spatio-temporal variation of vegetation cover and its driving factors in Three-River Headwaters Region during 2001-2020. Bull. Soil Water Conserv. 2022, 42, 202–212. (In Chinese) [Google Scholar]
- Gao, S.; Dong, G.; Jiang, X.; Nie, T.; Yin, H.; Guo, X. Quantification of Natural and Anthropogenic Driving Forces of Vegetation Changes in the Three-River Headwater Region during 1982–2015 Based on Geographical Detector Model. Remote Sens. 2021, 13, 4175. [Google Scholar] [CrossRef]
- Sun, X.; Xiao, Y. Vegetation Growth Trends of Grasslands and Impact Factors in the Three Rivers Headwater Region. Land 2022, 11, 2201. [Google Scholar] [CrossRef]
- Guo, B.; Wang, J.; Mantravadi, V.S.; Zhang, L.; Liu, G. Effect of climate and ecological restoration on vegetation changes in the “Three-River Headwaters” region based on remote sensing technology. Environ. Sci. Pollut. Res. 2022, 29, 16436–16448. [Google Scholar] [CrossRef]
- Wang, K.; Zhou, Y.; Han, J.; Chen, C.; Li, T. Long-Term Tibetan Alpine Vegetation Responses to Elevation-Dependent Changes in Temperature and Precipitation in an Altered Regional Climate: A Case Study for the Three Rivers Headwaters Region, China. Remote Sens. 2023, 15, 496. [Google Scholar] [CrossRef]
- Zhao, D.; Wang, Z.; Zhang, G.; Xu, Y.; Sun, L. Identifying factors affecting regional fractional vegetation cover based on a combination of factor regression and interaction—A case study on the Three-River Headwaters Region. China Environ. Sci. 2022, 42, 3903–3912. (In Chinese) [Google Scholar]
- Yu, X.; Yan, Q.; Liu, Z.; Xi, L.; Wang, Y. Quantitative estimation and dynamic changes of vegetation fractional coverage in the Sanjiangyuan region. Resour. Environ. Yangtze Basin 2013, 22, 66–74. (In Chinese) [Google Scholar]
- Liu, Z.; Shao, Q. Vegetation coverage change and its response to climate change in Three-River Headwaters Region. Res. Soil Water Conserv. 2014, 21, 334–339. (In Chinese) [Google Scholar]
- Zhang, Y.; Zhang, C.B.; Whang, Z.Q.; Yang, Y.; Li, J.L. Spatiotemporal dynamics of grassland coverage in response to climate change from 1982 to 2012 in the Three Rivers Source Region, China. Pratacult. Sci. 2017, 34, 1977–1990. (In Chinese) [Google Scholar]
- Zhang, X.; Ning, J. Patterns, Trends, and Causes of Vegetation Change in the Three Rivers Headwaters Region. Land 2023, 12, 1127. [Google Scholar] [CrossRef]
- Chen, Q.; Zhou, Q.; Zhang, H.; Liu, F. Spatial disparity of NDVI response in vegetation growing season to climate change in the Three-River Headwaters Region. Ecol. Environ. Sci. 2010, 19, 1284–1289. (In Chinese) [Google Scholar]
- Li, H.; Liu, G.; Fu, B. Response of vegetation to climate change and human activity based on NDVI in the Three-River Headwaters region. Acta Ecol. Sin. 2011, 31, 5495–5504. (In Chinese) [Google Scholar]
- Sun, Q.; Li, B.; Xu, L.; Zhang, T.; Ge, J.; Li, F. Analysis of NDVI change trend and its impact factors in the Three-River Headwater Region from 2000 to 2013. J. Geo-Inf. Sci. 2016, 18, 1707–1716. (In Chinese) [Google Scholar]
- He, X.; Yu, Y.; Cui, Z.; He, T. Climate Change and Ecological Projects Jointly Promote Vegetation Restoration in Three-River Source Region of China. Chin. Geogr. Sci. 2021, 31, 1108–1122. [Google Scholar]
- Yu, R.; Yao, Y.; Wang, Q.; Wan, H.; Xie, Z.; Tang, W.; Zhang, Z.; Yang, J.; Shang, K.; Guo, X.; et al. Satellite-Derived Estimation of Grassland Aboveground Biomass in the Three-River Headwaters Region of China during 1982–2018. Remote Sens. 2021, 13, 2993. [Google Scholar] [CrossRef]
- Zhao, Y.; Chen, Y.; Wu, C.; Li, G.; Ma, M.; Fan, L.; Zheng, H.; Song, L.; Tang, X. Exploring the contribution of environmental factors to evapotranspiration dynamics in the Three-River-Source region, China. J. Hydrol. 2023, 626, 130222. [Google Scholar]
- Zhang, L.X.; Fan, J.W.; Zhou, D.C.; Zhang, H.Y. Ecological protection and restoration program reduced grazing pressure in the three-river headwaters region, China. Rangel. Ecol. Manag. 2017, 70, 540–548. [Google Scholar]
- Liang, L.; Li, L.; Liu, C.; Cuo, L. Climate change in the Tibetan Plateau Three Rivers Source Region: 1960-2009. Int. J. Climatol. 2013, 33, 2900–2916. [Google Scholar]
- Xu, W.; Gu, S.; Zhao, X.; Xiao, J.; Tang, Y.; Fang, J.; Zhang, J.; Jiang, S. High positive correlation between soil temperature and NDVI from 1982 to 2006 in alpine meadow of the Three-River Source Region on the Qinghai-Tibetan Plateau. Int. J. Appl. Earth Obs. Geoinf. 2011, 13, 528–535. [Google Scholar]
- Jiang, C.; Zhang, L. Effect of ecological restoration and climate change on ecosystems: A case study in the Three-Rivers Headwater Region, China. Environ. Monit. Assess. 2016, 188, 382. [Google Scholar]
- Shao, Q.; Cao, W.; Fan, J.; Huang, L.; Xu, X. Effects of an ecological conservation and restoration project in the Three-River Source Region, China. J. Geogr. Sci. 2017, 27, 183–204. [Google Scholar]
- Lu, M.; Zhang, Q.; Li, X.; Yang, S.; Yang, Q. Temporal and spatial variation of vegetation coverage and its response to climate factors in Gansu section of Yellow River Basin. Bull. Soil Water Conserv. 2020, 40, 232–238. (In Chinese) [Google Scholar]
- Gillies, R.R.; Kustas, W.P.; Humes, K.S. A verification of the ‘triangle’ method for obtaining surface soil water content and energy fluxes from remote measurements of the Normalized Difference Vegetation Index (NDVI) and surface. Int. J. Remote Sens. 1997, 18, 3145–3166. [Google Scholar]
- Carlson, T.N.; Ripley, D.A. On the relation between NDVI, fractional vegetation cover, and leaf area index. Remote Sens. Environ. 1997, 62, 241–252. [Google Scholar]
- Rundquist, B.C. The influence of canopy green vegetation fraction on spectral measurements over native tallgrass prairie. Remote Sens. Environ. 2002, 81, 129–135. [Google Scholar]
- Li, M.; Wu, B.; Yan, C.; Zhou, W. Estimation of Vegetation Fraction in the Upper Basin of Miyun Reservoir by Remote Sensing. Resour. Sci. 2004, 26, 153–159. (In Chinese) [Google Scholar]
- Fernández-Guisuraga, J.M.; Calvo, L.; Suárez-Seoane, S. Comparison of Pixel Unmixing Models in the Evaluation of Post-Fire Forest Resilience Based on Temporal Series of Satellite Imagery at Moderate and Very High Spatial Resolution. ISPRS J. Photogramm. Remote Sens. 2020, 164, 217–228. [Google Scholar]
- Zhu, L.; Xie, S.; Yang, H.; Ma, M.; Xia, J. Relative effects of climate change and human activities on vegetation coverage change in Sichuan. J. West For. Sci. 2022, 51, 8–16. (In Chinese) [Google Scholar]
- Hao, X.; Zhang, Z.; Zheng, H.; Gao, N. Detection of spatial and temporal variation characteristics of vegetation cover in the economic zone of the northern slopes of Tianshan Mountains and the influencing factors. China Environ. Sci. 2024, 44, 1020–1031. (In Chinese) [Google Scholar]
- Gutman, G.; Ignatov, A. The derivation of the green vegetation fraction from NOAA/AVHRR data for use in numerical weather prediction models. Int. J. Remote Sens. 1998, 19, 1533–1543. [Google Scholar] [CrossRef]
- Peng, W.F.; Wang, G.J.; Zhou, J.M.; Xu, X.L.; Luo, H.L.; Zhao, J.F.; Yang, C.J. Dynamic monitoring of fractional vegetation cover along Minjiang River from Wenchuan County to Dujiangyan City using multi-temporal landsat 5 and 8 images. Acta Ecol. Sin. 2016, 36, 1975–1988. (In Chinese) [Google Scholar]
- Sen, P.K. Estimates of the regression coefficient based on Kendallś tau. J. Am. Stat. Assoc. 1968, 63, 1379–1389. [Google Scholar]
- Theil, H. A rank-invariant method of linear and polynomial regression analysis. In Henri Theil’s Contributions to Economics and Econometrics; Springer: Berlin, Germany, 1992; pp. 345–381. [Google Scholar]
- Mann, H.B. Nonparametric tests against trend. Econometrica 1945, 13, 245–259. [Google Scholar]
- Kendall, M.G. Rank Correlation Methods; American Psychological Association: Washington, DC, USA, 1948. [Google Scholar]
- Zhao, A.; Zhang, A.; Liu, H.; Liu, Y.; Wang, H.; Wang, D. Spatiotemporal variation of vegetation coverage before and after implementation of Grain for Green Project in the Loess Plateau. J. Nat. Resour. 2017, 32, 449–460. (In Chinese) [Google Scholar]
- Sun, R.; Chen, S.; Su, H. Spatiotemporal variations of NDVI of different land cover types on the Loess Plateau from 2000 to 2016. Prog. Geogr. 2019, 38, 1248–1258. (In Chinese) [Google Scholar]
- Gao, Y.; Sun, H.; Xu, Y.; Zhang, S. Temporal and spatial variation of vegetation cover and its response to extreme climate in Shaanxi Province. Acta Ecol. Sin. 2022, 42, 1022–1033. (In Chinese) [Google Scholar]
- HURST, H.E. Long-Term Storage Capacity of Reservoirs. Trans. Am. Soc. Civ. Eng. 1951, 116, 776–808. [Google Scholar]
- Zhang, H.; He, Z.; Xu, J.; Mu, W.; Chen, Y.; Wang, G. Analysis of Spatial and Temporal Changes in Vegetation Cover and Driving Forces in the Wuding River Basin, Loess Plateau. Forests 2024, 15, 82. [Google Scholar] [CrossRef]
- Yang, C.; Fu, M.; Feng, D.; Sun, Y.; Zhai, G. Spatiotemporal Changes in Vegetation Cover and Its Influencing Factors in the Loess Plateau of China Based on the Geographically Weighted Regression Model. Forests 2021, 12, 673. [Google Scholar] [CrossRef]
- He, Z.; Yue, T.; Chen, Y.; Mu, W.; Xi, M.; Qin, F. Analysis of Spatial and Temporal Changes in Vegetation Cover and Driving Forces in the Yan River Basin, Loess Plateau. Remote Sens. 2023, 15, 4240. [Google Scholar] [CrossRef]
- Lin, M.; Hou, L.; Qi, Z.; Wan, L. Impacts of climate change and human activities on vegetation NDVI in China’s Mu Us Sandy Land during 2000–2019. Ecol. Indic. 2022, 142, 109164. [Google Scholar] [CrossRef]
- Yin, L.; Dai, E.; Zheng, D.; Wang, Y.; Ma, L.; Tong, M. What drives the vegetation dynamics in the Hengduan Mountain region, southwest China: Climate change or human activity? Ecol. Indic. 2020, 112, 106013. [Google Scholar] [CrossRef]
- Wang, Y.; Kong, X.; Guo, K.; Zhao, C.; Zhao, J. Spatiotemporal change in vegetation cover in the Yellow River Basin between 2000 and 2022 and driving forces analysis. Front. Ecol. Evol. 2023, 11, 1261210. [Google Scholar] [CrossRef]
- Sun, Y.L.; Yang, Y.L.; Zhang, L.; Wang, Z.L. The relative roles of climate variations and human activities in vegetation change in North China. Phys. Chem. Earth 2015, 87–88, 67–78. [Google Scholar] [CrossRef]
- Qi, X.; Jia, J.; Liu, H.; Lin, Z. Relative importance of climate change and human activities for vegetation changes on China’s silk road economic belt over multiple timescales. Catena 2019, 180, 224–237. [Google Scholar] [CrossRef]
- Liu, Y.; Huang, T.; Qiu, Z.; Guan, Z.; Ma, X. Effects of precipitation changes on fractional vegetation cover in the Jinghe River basin from 1998 to 2019. Ecol. Inform. 2024, 80, 102505. [Google Scholar] [CrossRef]
- Shi, S.; Yu, J.; Wang, F.; Wang, P.; Zhang, Y.; Jin, K. Quantitative Contributions of Climate Change and Human Activities to Vegetation Changes over Multiple Time Scales on the Loess Plateau. Sci. Total Environ. 2021, 755, 142419. [Google Scholar] [CrossRef]
- Yue, M.; Geng, G.; Wang, T.; Yang, R.; Gu, Q. Spatiotemporal variation of vegetation NDVI and its driving factors in the Shaanxi section of the Yellow River Basin from 2000 to 2019. Res. Soil Water Conserv. 2023, 30, 238–246. (In Chinese) [Google Scholar]
- Zhang, Z.; Chang, J.; Xu, C.Y.; Zhou, Y.; Wu, Y.; Chen, X.; Jiang, S.; Duan, Z. The response of lake area and vegetation cover variations to climate change over the Qinghai-Tibetan Plateau during the past 30 years. Sci. Total Environ. 2018, 635, 443–451. [Google Scholar] [PubMed]
- Liu, X.; Zhang, J.; Zhu, X.; Pan, Y.; Liu, Y.; Zhang, D.; Lin, Z. Spatiotemporal changes in vegetation coverage and its driving factors in the Three-River Headwaters Region during 2000–2011. J. Geogr. Sci. 2014, 24, 288–302. [Google Scholar]
- Han, Z.; Song, W.; Deng, X.; Xu, X. Grassland ecosystem responses to climate change and human activities within the Three-River Headwaters region of China. Sci. Rep. 2018, 8, 9079. [Google Scholar]
- Sun, X.W.; Li, S.; Zhai, X.H.; Wei, X.X.; Yan, C.Z. Ecosystem changes revealed by land cover in the three-river headwaters region of Qinghai, China (1990–2015). Res. Cold Arid Reg. 2023, 15, 85–91. [Google Scholar]
- Shang, K.; Yao, Y.; Liang, S.; Zhang, Y.; Fisher, J.B.; Chen, J.; Liu, S.; Xu, Z.; Zhang, Y.; Jia, K.; et al. DNN-MET: A deep neural networks method to integrate satellite-derived evapotranspiration products, eddy covariance observations and ancillary information. Agric. For. Meteorol. 2021, 308–309, 108582. [Google Scholar]
- Shang, K.; Yao, Y.; Di, Z.; Jia, K.; Zhang, X.; Fisher, J.B.; Chen, J.; Guo, X.; Yang, J.; Yu, R.; et al. Coupling Physical Constraints with Machine Learning for Satellite-Derived Evapotranspiration of the Tibetan Plateau. Remote Sens. Environ. 2023, 289, 113519. [Google Scholar]
- Mu, B.; Zhao, X.; Wu, D.; Wang, X.; Zhao, J.; Wang, H.; Zhou, Q.; Du, X.; Liu, N. Vegetation Cover Change and Its Attribution in China from 2001 to 2018. Remote Sens. 2021, 13, 496. [Google Scholar] [CrossRef]
- Mu, B.; Zhao, X.; Zhao, J.; Liu, N.; Si, L.; Wang, Q.; Sun, N.; Sun, M.; Guo, Y.; Zhao, S. Quantitatively Assessing the Impact of Driving Factors on Vegetation Cover Change in China’s 32 Major Cities. Remote Sens. 2022, 14, 839. [Google Scholar] [CrossRef]
- Li, X.; Xu, X.; Tian, W.; Tian, J.; He, C. Contribution of climate change and vegetation restoration to interannual variability of evapotranspiration in the agro-pastoral ecotone in northern China. Ecol. Indic. 2023, 154, 110485. [Google Scholar]


| Class Name | Categorization Criteria |
|---|---|
| Lower | 0–15% |
| Low | 15–30% |
| Medium | 30–45% |
| High | 45–60% |
| Higher | 60–100% |
| β | Z | Categorization Standards |
|---|---|---|
| Significant decrease | ||
| Nonsignificant decrease | ||
| Basically stable | ||
| Nonsignificant increase | ||
| Significant increase |
| Nature of Change | Categorization Standards |
|---|---|
| Persistence | 0.5 < Hurst < 1 |
| Random | Hurst = 0.5 |
| Anti-persistence | 0 < Hurst < 0.5 |
| Impact Factors | |||
|---|---|---|---|
| >0 | >0 | >0 | CC 1 and HA 2 |
| >0 | <0 | CC | |
| <0 | >0 | HA | |
| <0 | <0 | <0 | CC and HA |
| <0 | >0 | CC | |
| >0 | <0 | HA |
| Start Date | Project |
|---|---|
| 19 August 2000 | Three-River Source Provincial Nature Reserve |
| 24 January 2003 | Three-River Source National Nature Reserve |
| 30 August 2005 | The first phase of Ecological Protection and Construction Project of the Three-River Headwaters (2005–2013) |
| 18 December 2013 | The second phase of Ecological Protection and Construction Project of the Three-River Headwaters (2013–2020) |
| 10 January 2014 | National Ecological Conservation Comprehensive Experimental Zone of Three-River Headwaters in Qinghai Province |
| 5 March 2016 | The pilot program of Three-River-Source National Park |
| 12 October 2021 | Three-River-Source Natural Park |
Disclaimer/Publisher’s Note: The statements, opinions and data contained in all publications are solely those of the individual author(s) and contributor(s) and not of MDPI and/or the editor(s). MDPI and/or the editor(s) disclaim responsibility for any injury to people or property resulting from any ideas, methods, instructions or products referred to in the content. |
© 2025 by the authors. Licensee MDPI, Basel, Switzerland. This article is an open access article distributed under the terms and conditions of the Creative Commons Attribution (CC BY) license (https://creativecommons.org/licenses/by/4.0/).
Share and Cite
Qiu, F.; Yao, Y.; Li, Y.; Yu, R.; Fan, J.; Zhang, X.; Kan, Y.; Liu, L.; Xie, Z.; Ning, J.; et al. Satellite-Derived Spatiotemporal Dynamics of Vegetation Cover and Its Driving Factors in the Three-River Headwaters Region from 2001 to 2022. Remote Sens. 2025, 17, 1187. https://doi.org/10.3390/rs17071187
Qiu F, Yao Y, Li Y, Yu R, Fan J, Zhang X, Kan Y, Liu L, Xie Z, Ning J, et al. Satellite-Derived Spatiotemporal Dynamics of Vegetation Cover and Its Driving Factors in the Three-River Headwaters Region from 2001 to 2022. Remote Sensing. 2025; 17(7):1187. https://doi.org/10.3390/rs17071187
Chicago/Turabian StyleQiu, Fei, Yunjun Yao, Yufu Li, Ruiyang Yu, Jiahui Fan, Xiaotong Zhang, Yixi Kan, Lu Liu, Zijing Xie, Jing Ning, and et al. 2025. "Satellite-Derived Spatiotemporal Dynamics of Vegetation Cover and Its Driving Factors in the Three-River Headwaters Region from 2001 to 2022" Remote Sensing 17, no. 7: 1187. https://doi.org/10.3390/rs17071187
APA StyleQiu, F., Yao, Y., Li, Y., Yu, R., Fan, J., Zhang, X., Kan, Y., Liu, L., Xie, Z., Ning, J., Zhang, L., & Xie, X. (2025). Satellite-Derived Spatiotemporal Dynamics of Vegetation Cover and Its Driving Factors in the Three-River Headwaters Region from 2001 to 2022. Remote Sensing, 17(7), 1187. https://doi.org/10.3390/rs17071187