Article

The First Experimental Validation of a Communication Base Station as a Ground-Based SAR for Deformation Monitoring

National Key Laboratory of Radar Signal Processing, Xidian University, Xi’an 710071, China
*
Author to whom correspondence should be addressed.
Remote Sens. 2025, 17(7), 1129; https://doi.org/10.3390/rs17071129
Submission received: 28 December 2024 / Revised: 10 March 2025 / Accepted: 11 March 2025 / Published: 22 March 2025

Abstract

:
Integrated Sensing and Communication (ISAC) is an important trend for future commutation networks. The Communication Base Station (CBS) can be used as a Ground-Based Synthetic Aperture Radar (GB-SAR). By using Synthetic Aperture Radar (SAR) images obtained at a different time, GB-SAR will have the ability to detect millimeter-level ground deformations with Interferometric SAR (InSAR) processing through a phase difference operation. In this paper, we investigated the observation and performance for millimeter-level ground deformation detection based on the CBS with Differential InSAR (D-InSAR) for the first time. Building on the characteristics of short temporal sampling intervals, an in-depth investigation was conducted into the process of detecting deformations using the CBS. A practical experimental scenario was established, and the high coherence between adjacent images resulting from short temporal sampling intervals was leveraged to enhance the phase Signal-to-Noise Ratios (SNRs) through time series Differential Interferometric Phase sample averaging. On this basis, the first experimental result is given, which indicates that CBS can accurately capture millimeter-level deformations with a maximum error of 0.3437 mm. The experimental results confirm the feasibility and accuracy of employing CBSs as GB-SAR systems for monitoring ground deformations.

1. Introduction

Communication technology has advanced significantly since its inception in the 1980s, with notable evolutions occurring approximately every decade [1]. Currently, 5th-Generation (5G) communication technology has established mature standards, and research efforts have shifted towards exploring innovative possibilities and applications [2]. The vision for the next generation of communication technology is “Intelligent Connectivity of All Things”, which will utilize higher frequency bands and larger-scale antenna arrays, leading to a closer similarity in spectrum and architecture between communication and sensing systems [3,4,5]. Consequently, Integrated Sensing and Communication (ISAC) systems have garnered significant attention among current researchers.
ISAC integrates sensing and communication through various techniques, including waveform design, Time-Division Multiplexing (TDM), and hardware resource sharing, ultimately enhancing overall system performance while reducing costs [6]. At the 2018 Global Communications Conference, ISAC was systematically elaborated for the first time, sparking widespread interest among enterprises and researchers both domestically and internationally [7]. The latest waveform design methods are statistically studied and classified into three categories: communication-centric waveform design, sensing-centric waveform design, and joint waveform optimization and design, as detailed in [8]. Several novel waveform design methods have been developed to enhance the performance of both sensing and communication [9,10,11,12], addressing the limitations of existing approaches. In addition to investigating ISAC methodologies, the exploration of ISAC application scenarios constitutes a significant aspect of research. Within the domain of autonomous driving, ISAC is capable of perceiving the surrounding environment and the movement parameters of other vehicles while facilitating communication with system devices. This integration provides substantial data support and precise control directives for autonomous driving, thereby markedly enhancing safety [13,14]. In the context of Unmanned Aerial Vehicles (UAVs), ISAC can enhance both communication and cooperative sensing capabilities within the UAV network. An individual UAV can detect changes in the surrounding environment to optimize its flight path while coordinating with other UAVs [15,16,17,18]. In remote sensing applications, ISAC is characterized by higher frequency bands and a more resilient infrastructure. High-frequency electromagnetic waves empower the ISAC system with enhanced superior spatial resolution. This robust infrastructure facilitates intricate observations of target areas across a broader spectrum of scenarios. Furthermore, during the observation process, ISAC can incorporate Synthetic Aperture Radar (SAR) signal processing techniques to obtain multi-dimensional SAR imagery of the target area [19,20,21]. Therefore, ISAC can significantly enhance sensing and communication capabilities, broaden application scenarios, and catalyze a paradigm shift in the evolution of these fields [22].
In the aforementioned discussion, the significant enhancement of communication and sensing performance by ISAC has been underscored, with waveform design methods recognized as the prevailing research direction that provides crucial support for system optimization. However, the challenges faced in waveform design, such as limited efficiency, high complexity, and insufficient adaptability, must be taken into account [8]. Therefore, a novel approach is proposed, leveraging TDM to realize ISAC, thereby enhancing the system’s flexibility and scalability to better meet the demands of various application scenarios. During its operational process, the Communication Base Station (CBS) may experience underutilization of time resources due to various factors. This presents an opportunity for the allocation of time slices to perception tasks [23]. Orthogonal Frequency Division Multiplexing (OFDM) waveforms are widely recognized as a common signal form in communication systems. They are characterized by strong multipath fading resilience, high frequency spectrum utilization, and other advantages that ensure optimal communication speed [6,24]. Furthermore, the ambiguity function of OFDM is highly desirable, exhibiting a significant degree of flexibility in the allocation of time and frequency resources, which enables effective radar target detection [25,26,27]. The operational mode of a communication system typically involves the transmission of signals from one CBS, followed by their reception by another [28]. This operational mode closely resembles the working principle of Ground-Based SAR (GB-SAR) [29]. Consequently, a CBS can be utilized as a GB-SAR system in conjunction with interferometric measurement techniques to monitor millimeter-level ground deformation.
It is undeniable that ground deformation monitoring can effectively predict geological disasters, such as landslides, debris flow, and collapses (which are typically accompanied by slight surface deformations or displacements prior to their occurrence), thereby reducing or avoiding damage to human life and property, which underscores its significant practical importance [30,31]. Traditional methods of millimeter-level deformation monitoring, such as leveling and Global Navigation Satellite Systems (GNSS), primarily observe pre-deployed target points to obtain information on deformation variables, deformation trends, etc. However, these conventional methods exhibit considerable limitations, including the ability to only capture deformation at monitoring points, high costs, and difficulties in deploying monitoring points [32,33,34]. Satellite-based Differential Interferometric SAR (D-InSAR) offers the advantage of wide-area coverage; however, its long revisit periods make it highly susceptible to atmospheric effects, orbital errors, and other influences, limiting its practical applications. To mitigate these challenges, the more widely adopted technique is Permanent Scatterer Interferometry (PSI) [35]. However, for scenarios with rapid deformation rates, the longer revisit periods of satellite-based InSAR render it challenging to accomplish high temporal resolution observations. In contrast, GB-SAR can perform multiple observations of the monitoring scene each hour (the specific frequency depending on the type of GB-SAR system used), effectively monitor ground deformation, and facilitate disaster prevention in such regions [36]. Over the past few decades, GB-SAR has been successfully applied in monitoring ground deformation in areas with landslides and mining subsidence, demonstrating high reliability and sensitivity [37,38,39,40,41]. Nevertheless, the development of GB-SAR in China has been relatively late, with most ground radar systems available for interferometric measurements still in the laboratory stage [42]. Currently, many deformation monitoring efforts rely on foreign equipment, which is costly and poses challenges for comprehensive deformation monitoring. By integrating ISAC technology, CBSs can be utilized as GB-SAR systems for millimeter-level deformation monitoring, thereby effectively addressing the limitations of current monitoring methods. Compared to satellite-based InSAR, a CBS exhibits a significant advantage in high temporal sampling rates. In relation to GB-SAR, a CBS is characterized by its low cost and extensive deployment capabilities. Given the extensive number of CBSs and their widespread distribution, high-density monitoring capabilities can be provided, enabling real-time observation of subtle ground deformations and significantly enhancing both the coverage and accuracy of monitoring efforts [43].
In this study, the feasibility of utilizing a CBS as a GB-SAR system for millimeter-level ground deformation detection is investigated for the first time. Furthermore, outdoor experiments are conducted to validate its reliability. The remainder of this paper is structured as follows: Section 2 presents a CBS system model for ground deformation detection. Section 3 outlines the data processing flow for detecting ground deformations based on a CBS. In Section 4, the outdoor experimental scenarios and results are discussed, along with considerations related to the CBS-based ground deformation detection methodology. Finally, conclusions are drawn in Section 5.

2. A CBS System Model with an EPC

The most commonly used array configurations for mobile CBS antennas are linear arrays and 2-Dimensional (2D) planar arrays [44]. In the subsequent work, the antenna array utilized for the CBS is a 2D planar array. However, due to the differing polarization modes of each linear array, only one linear array was employed in the experiments. Consequently, the discussion will focus solely on the linear array. A linear array refers to the arrangement where the antenna elements are uniformly distributed along a straight line, known as a Uniform Linear Array (ULA). By controlling the timing of signal transmission and reception, the operation mode of SAR can be simulated, enabling the observation of targets and the acquisition of echoes. Specifically, during the detection process, a signal is emitted by a designated source, and a single element on one side of the ULA is controlled to receive the echo signal, completing one azimuth sample. At the next moment, the signal emitted by the source is received by the subsequent element on the ULA. This process continues, with the timing of signal transmission and reception being manipulated to alter the position of the antenna phase center, simulating the movement of elements and thereby enabling SAR functionality.
In the work presented herein, two CBSs are utilized as transmitting and receiving antennas, respectively. In this configuration, one element of the transmitting CBS emits a signal, which is then reflected by the target and received by a ULA at the receiving CBS. This operational mode is equivalent to that of bistatic SAR. To simplify data processing, the Equivalent Phase Center (EPC) principle is employed to represent this configuration as a self-transmitting and self-receiving ULA. The EPC principle refers to the conceptualization of the separated transmitting and receiving elements as a single element shared for both functions, positioned at the central location of the transmitting and receiving elements (further details and limitations regarding the EPC principle can be found in [45]), as shown in Figure 1. T, R, C, and X respectively represent the positions of the transmitter, receiver, EPC, and target, R T X , R R X , and R C X represent the corresponding slant ranges.
During the observation process, the actual echo history can be expressed as follows:
R r e a l = R T X + R R X
The two-way slant range between the EPC and the target is as follows:
R E P C = 2 R C X
Therefore, the EPC error introduced due to the use of the EPC principle is as follows:
φ e r r o r = 2 π λ R T X + R R X 2 R C X
where λ is the wavelength. The EPC error will cause the phenomenon of “spurious peaks” in the azimuth imaging result of the target, resulting in the decrease of SAR image quality [46]. Consequently, during the imaging process, it is crucial to apply phase compensation to the target based on Equation (3) to guarantee the precision of the resulting image.
Following the aforementioned equivalence, data processing can be conducted according to the signal model of a ULA positioned at the EPC. Let us assume that the number of elements in the ULA is N and that the spacing between the elements is d , as illustrated in Figure 2. Thus, the signal model for the ULA can be expressed as follows:
x n t = a n θ s t + n n t
where s t is the transmitted signal, f is the carrier frequency, and θ is the incidence angle [47]. Here, a n θ represents the direction vector of the signal propagation to the n th element, and can be denoted as follows:
a n θ = e j ω τ n = e j 2 π f τ n
where τ n is the time delay of the signal propagating to the n th element, and is denoted as follows:
τ n = n 1 d sin θ c
where c is the light speed and n n t is noise. Therefore, the total output of the array is as follows:
x t = n = 1 N x n t = n = 1 N a n θ s t + n n t
Building upon the previously established system model, the OFDM phase-encoded signal is employed as the probing signal for the CBS. This signal demonstrates exceptional pulse compression performance, allowing for a high level of range resolution [29,48]. Additionally, the spacing of the elements within the ULA determines the overall length of the array aperture, with the azimuth resolution being directly related to this aperture length [49,50,51]. Consequently, 2D SAR images can be effectively formulated utilizing the ULA structure of the CBS, thereby enabling the observation of targets.

3. Data Processing Methods

Based on the equivalent ULA derived from a CBS, this section introduces a data processing framework designed for monitoring millimeter-level ground deformations using a CBS. The framework comprised four components, and the overall workflow is illustrated in Figure 3 (the four colors represent four processing sections, corresponding to the four subsections in this section). Initially, echoes are acquired by observing the target area using two CBSs. Based on the preceding analysis, these echoes can be regarded as SAR echo data, which, after Back Projection Algorithm (BPA) imaging processing, yield a 2D SAR image of the target area. Ultimately, differential interferometric processing is applied to multiple SAR images to extract the deformation values of the target region.

3.1. Communication Echo Signals Achievement with an EPC

This study employs two CBSs, with one serving as the transmitting antenna that emits signals through a single element, while the other functions as the receiving antenna, utilizing a ULA composed of eight elements. Furthermore, the configurations of both CBSs satisfy the conditions for the application of the EPC principle. Consequently, the echoes can be regarded as having been obtained from observations of the target area conducted by a ULA positioned at eight EPCs in a self-transmitting and self-receiving operational mode (details of the EPC phase compensation have been described in Section 2). In the experiment, observations of the two scenarios before and after deformation were conducted N times using a CBS, resulting in the acquisition of N echo data sets from the target area for subsequent processing.
After EPC processing and phase compensation, the communication echo signal is still not ready for imaging processing, thus necessitating the calculation of its Power Delay Profile (PDP). The PDP refers to the distribution of received signal power across various signal delays, which can be obtained by calculating the time-domain sliding correlation between the received signal and the local signal [52]. However, the computational complexity of time-domain correlation operations is significantly high. Therefore, it is generally performed by transforming the signals into the frequency domain for multiplication (i.e., frequency-domain matched filtering), followed by an inverse transformation to the time domain to obtain the PDP [53,54]. The calculation formula is given by the following:
P D P = I F F T X k S * k k = 0 , 1 , ... , K
where P D P represents the PDP of the signal, while I F F T denotes the Inverse Fast Fourier Transform. The local signal sequences and the received signal sequences are denoted as S k and X k , respectively. The asterisk * represents the complex conjugate, and K is the length of the signal sequences. Similarly, in the processing of radar signal data, pulse compression of Linear Frequency Modulated (LFM) signals is also achieved through frequency-domain matched filtering [55]. For the echo signal x t received by the radar, the result of pulse compression can be expressed in the time domain as follows:
x p c ( t ) = I F F T F F T x t · F F T s * t
where x p c ( t ) is the signal after pulse compression, F F T denotes the Fast Fourier Transform, and s t is local signal. It is evident that the PDP obtained from the echo signals collected by the CBS through frequency-domain matched filtering is equivalent to the pulse compression results of LFM signals. Therefore, the PDP of the echo signals can be regarded as the result of pulse compression, which can subsequently be utilized for azimuth focusing to obtain the 2D SAR image of the target.

3.2. SAR Images Formulation Based on ULA Communication Signals with the BPA

3.2.1. Availability Analysis of the BPA

From the preceding discussion, it can be concluded that the PDP derived from the echo signals collected by the CBS through frequency-domain matched filtering can be treated as the result of pulse compression for imaging processing. In this context, the BPA has been selected for azimuth focusing, thereby avoiding the construction of overly complex azimuth matched filters. It is well known that the BPA algorithm is a time-consuming time-domain imaging algorithm. However, the relatively small observation area of a CBS mitigates the need for excessive time resources. Verification of the data processing in this experiment has shown that obtaining a SAR image of the target area through the BPA requires only 0.4 s, which meets our data processing requirements.

3.2.2. The Principle and Procedure of the BPA

The BPA originated from computed tomography technology and is classified as a time-domain imaging method. McCorkle was the first to introduce computed tomography techniques into the field of SAR, providing a detailed exposition of the method [56,57]. As shown in Figure 4, the fundamental concept of the BPA involves projecting each azimuth echo onto a pre-partitioned spatial grid to generate sub-images. Ultimately, all azimuth echo data are coherently stacked to form the focused image [58]. The BPA is characterized by its high imaging accuracy and phase preservation capability, thereby establishing a solid foundation for interferometric processing.
The complete procedure of the BPA for SAR imaging is outlined below [59,60,61,62,63]:
(i).
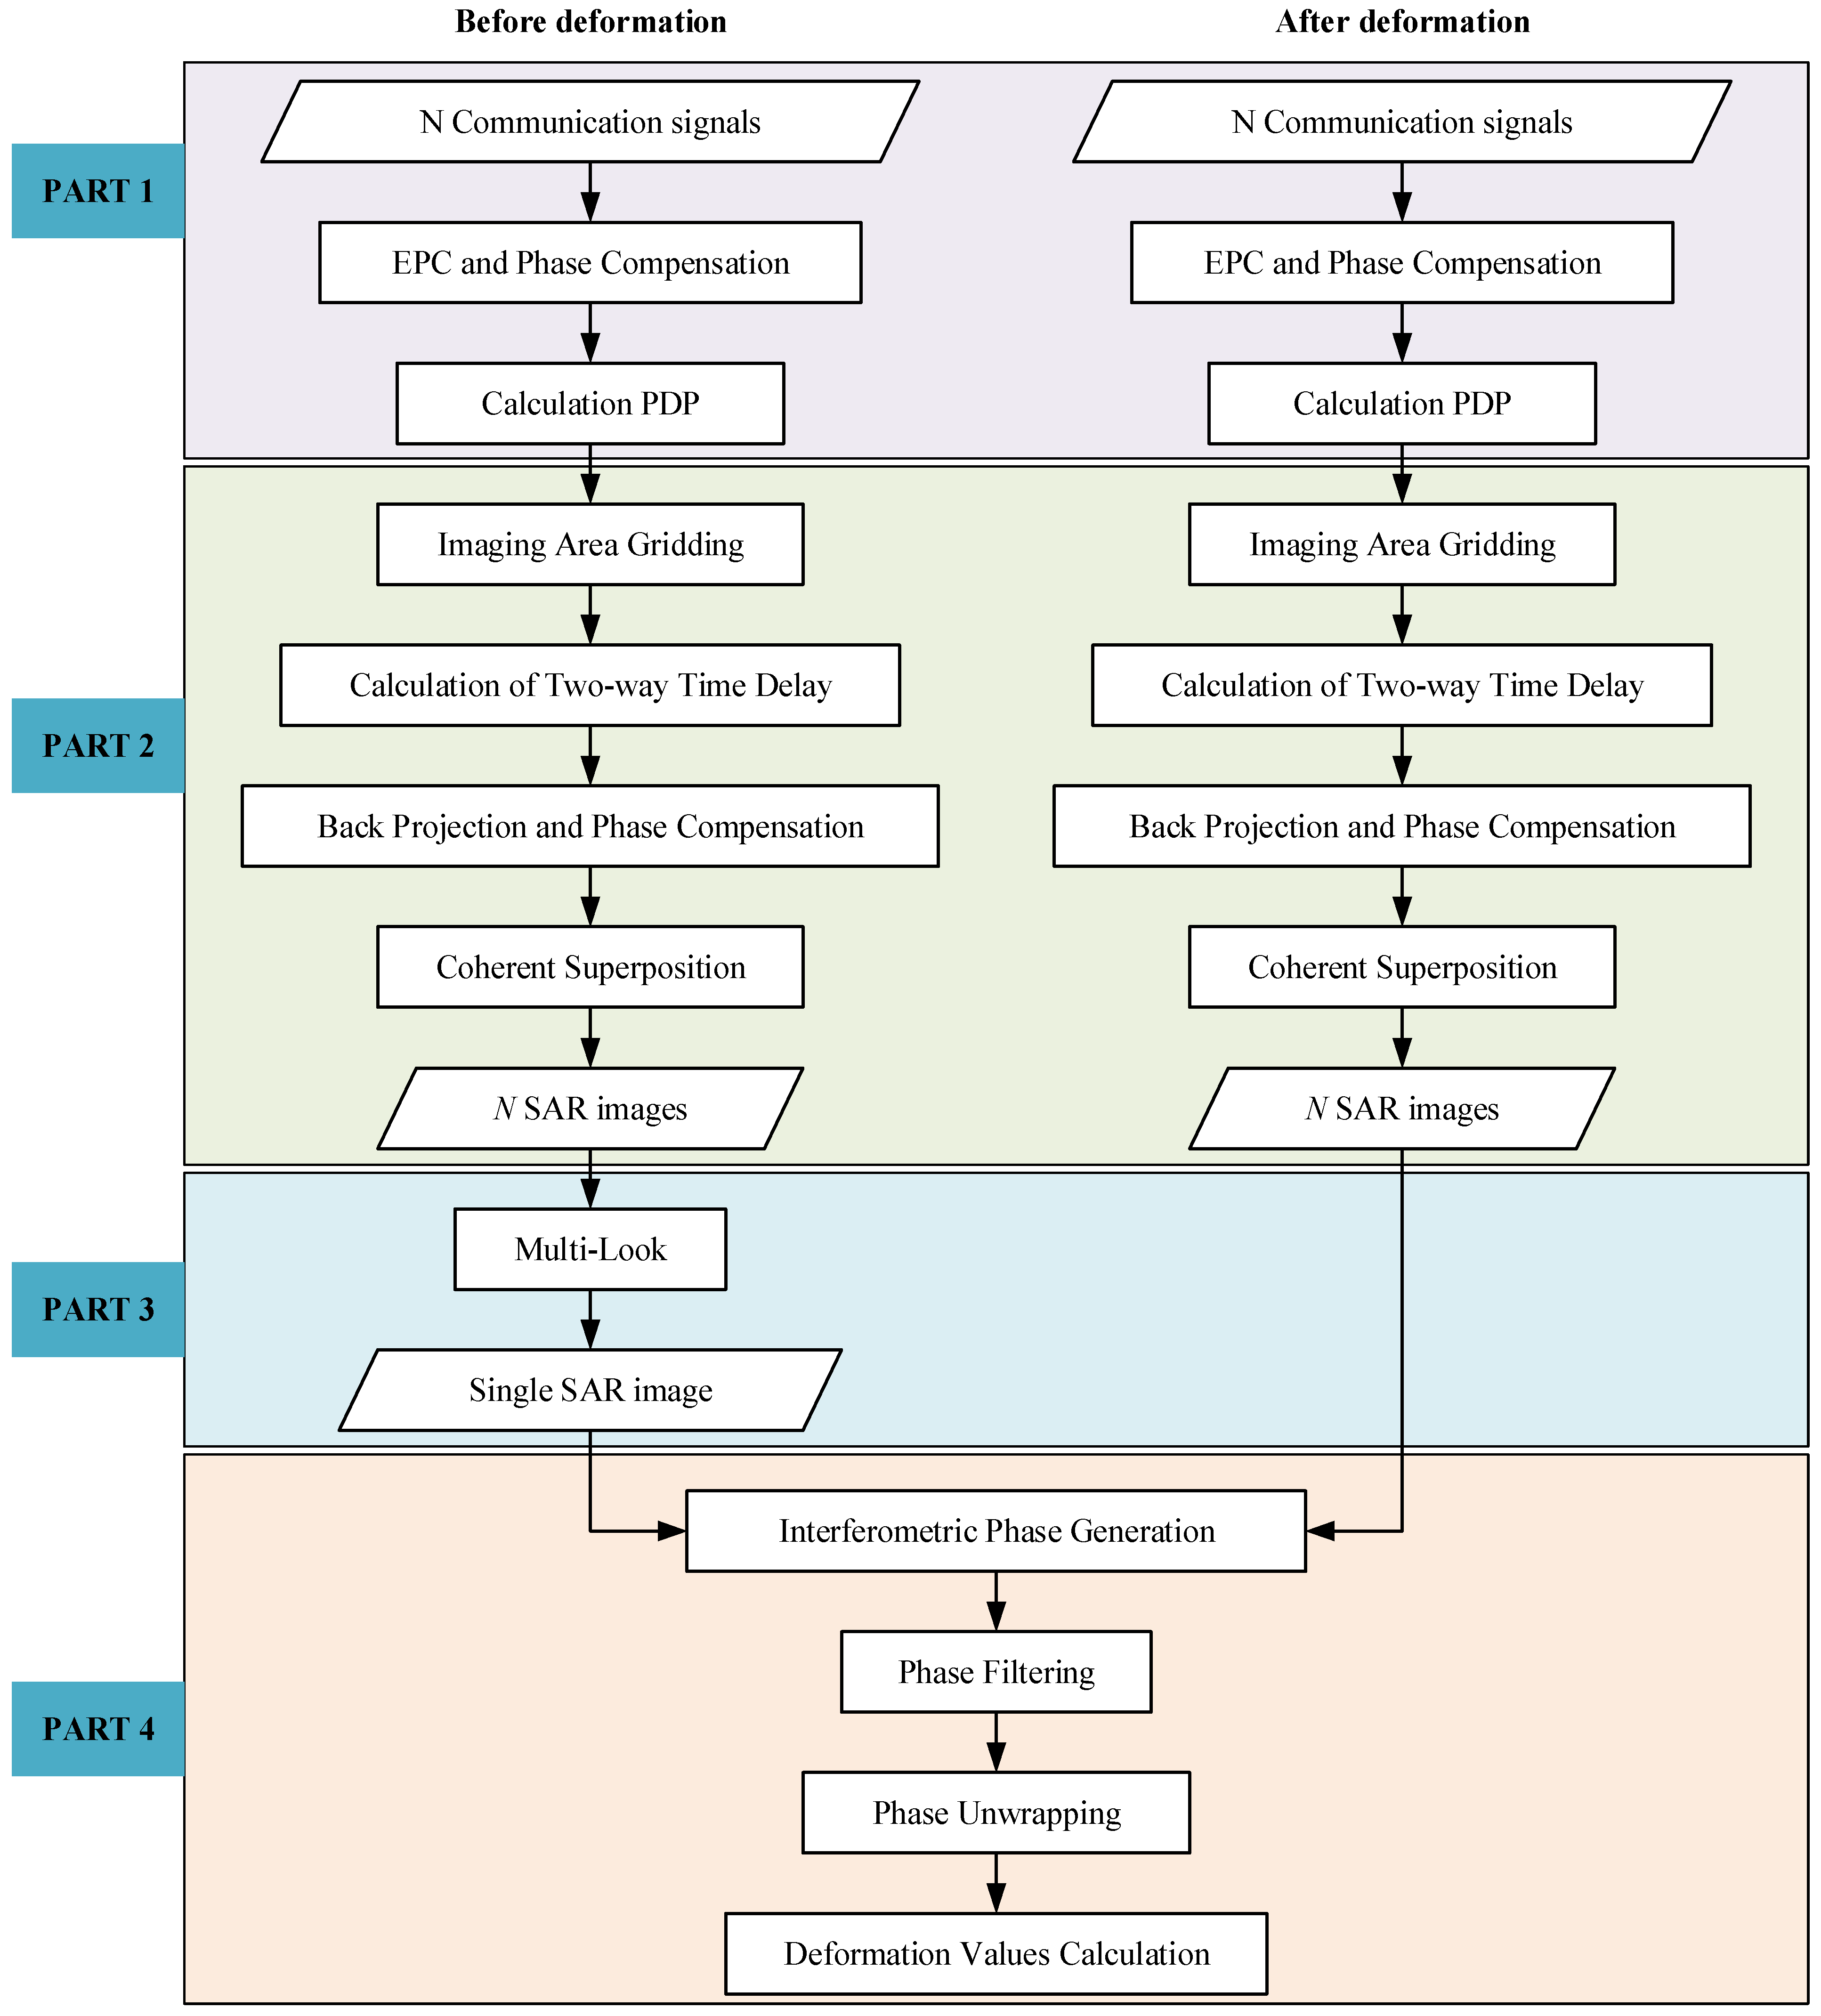
Range compression: Pulse compression processing is applied to the echo data in the range direction to achieve high resolution. This is typically accomplished using a matched filter. In this experiment, the PDP of the communication signal is equivalent to the result obtained from the radar echo signal after pulse compression, thereby rendering this step unnecessary.
(ii).
Imaging area gridding: The imaging area is divided into a grid under an appropriate coordinate system, with the grid size being slightly smaller than the resolution unit of the system.
(iii).
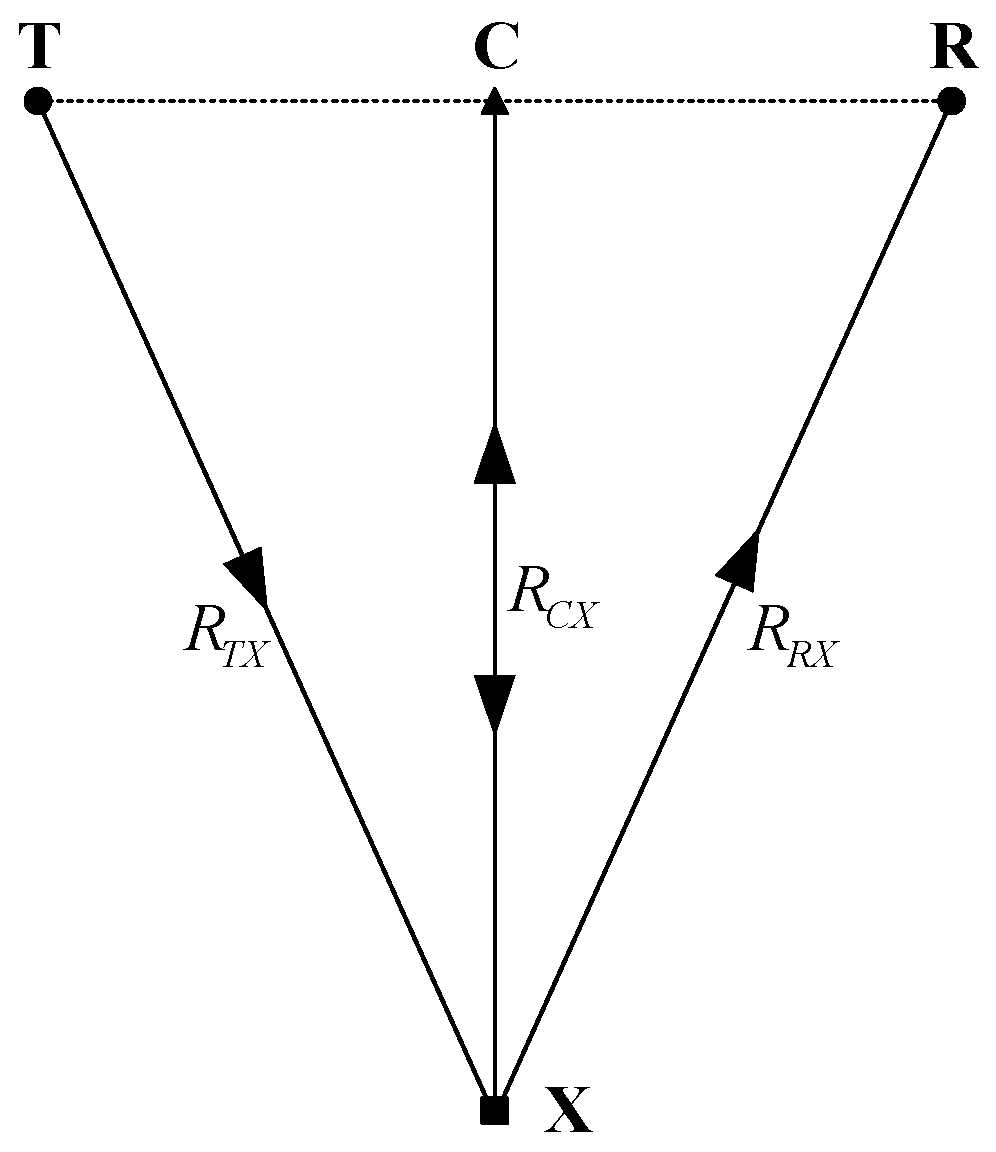
Calculation of the two-way time delay: The two-way slant range and time delay between each grid point and the antenna phase center are calculated for all azimuth times.
(iv).
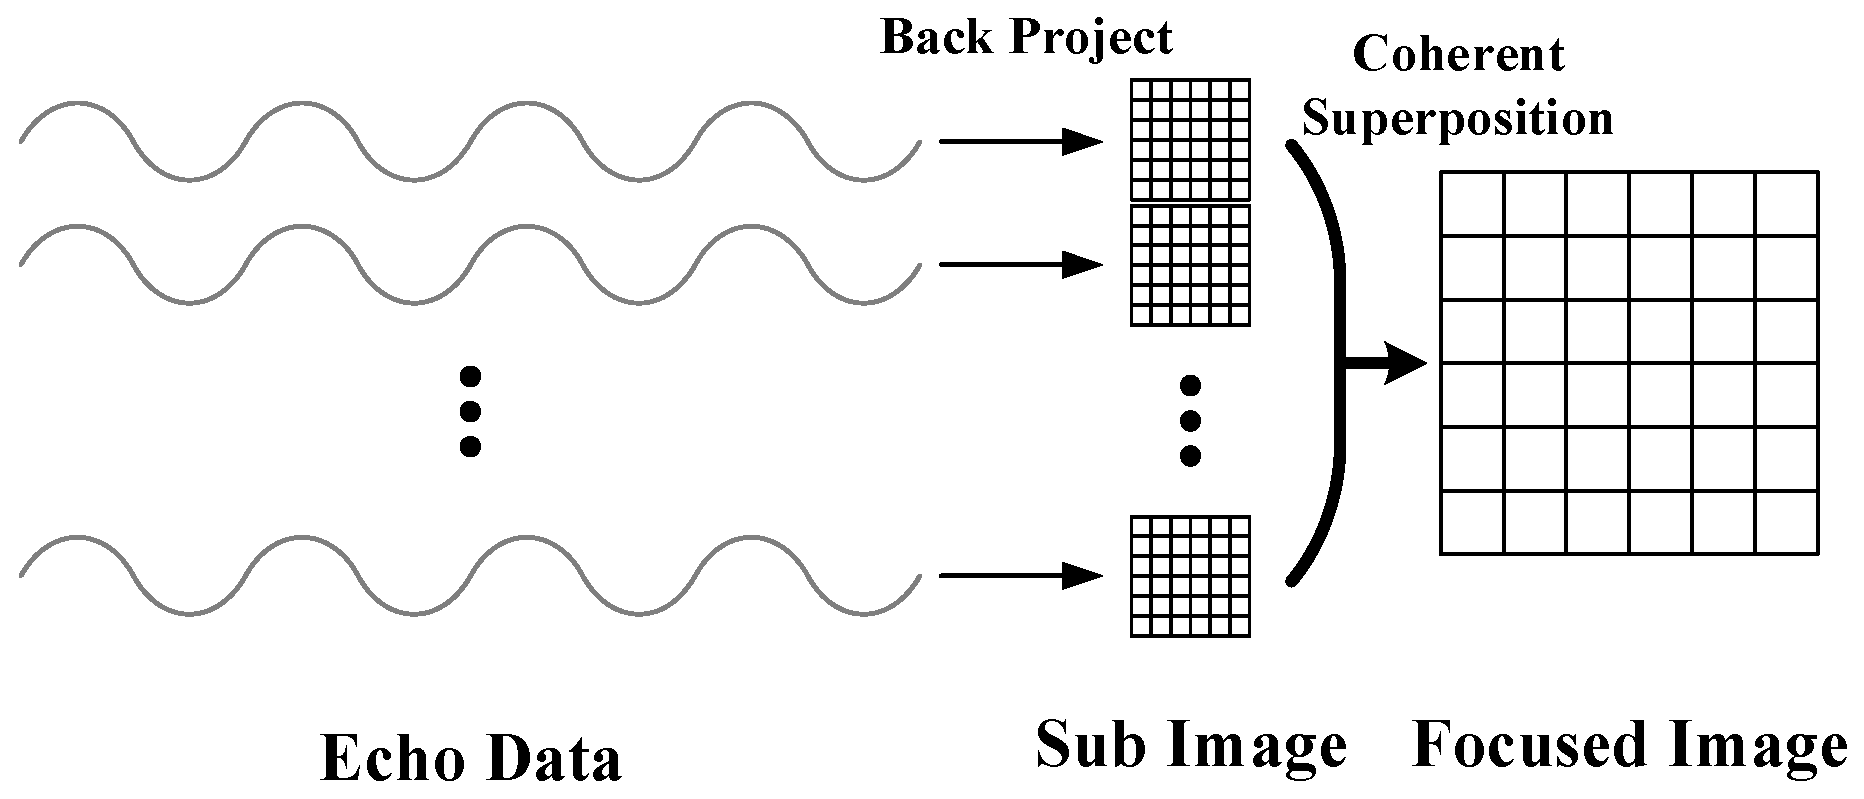
Back projection and phase compensation: Based on the time delay for each grid point, the echo data at each point are interpolated from the corresponding azimuth echo, and phase compensation is applied to all points. The phase compensation term is dependent on the two-way slant range between the grid point and the antenna phase center at the current azimuth time. Ultimately, the echo data at each azimuth time are back projected to produce a sub-image.
(v).
Coherent superposition: The focused SAR image is obtained by coherently superposing the sub-images generated at all azimuth times

3.3. Multi-Look Processing of the SAR Images

3.3.1. The Principle of Multi-Look Processing

Multi-look processing refers to the incoherent superimposition of multiple independent images of the same scene, with the primary objective of suppressing speckle noise [64]. Reference [65] investigated the statistical characteristics of the phase in InSAR images under both single-look and multi-look conditions, and presented an analytical expression for the phase probability density function:
p φ 0 φ 0 = Γ L + 1 2 1 ρ 2 L β 2 π Γ L 1 β 2 L + 1 / 2 + 1 ρ 2 L 2 π F L , 1 ; 1 2 ; β 2
where β = ρ cos φ 0 φ ¯ 0 , φ ¯ 0 is the peak value of the phase distribution, and F is the Gaussian hypergeometric function, expressed as follows:
F a , b ; c ; x = m = 0 a , m b , m c , m x m m !
where a , 0 = 1 , a , m = a ( a + 1 ) a + m 1 , m is an integer, ρ is the coherence coefficient, and L is the numbers of looks. The coherence coefficient is defined as the degree of similarity in phase and intensity information conveyed by two complex echo signals acquired from the same area. The coherence coefficient, which ranges from 0 to 1, indicates the level of noise in the SAR images, with higher values signifying reduced noise. This coefficient is calculated using the following method:
ρ = i = 1 m j = 1 n M i , j S * i , j i = 1 m j = 1 n M i , j 2 · i = 1 m j = 1 n S i , j 2
where M and S are the two complex SAR images, i and j are the index values of the current pixel, and m and n represent the number of rows and columns in the local window.
In this distribution, the relationship between the Standard Deviation (STD) of the phase distribution and the coherence coefficient as well as the number of looks can be observed. As illustrated in Figure 5, with the increase in both the coherence coefficient and the number of looks, the STD of the phase gradually decreases. Furthermore, when the coherence coefficient remains constant, an increase in the number of looks effectively reduces the STD of the phase. This indicates that multi-look processing can significantly mitigate the noise present in the phase, with the denoising effect becoming more pronounced as the number of looks increases.

3.3.2. The Experiment of Multi-Look Processing

Based on the analysis presented above, corresponding experiments were designed to evaluate the performance of multi-look processing in practical applications. In the experiment, a CBS was utilized to conduct 256 consecutive observations of a corner reflector target within the scene, with a time interval of 2.5 ms. After imaging processing, 256 SAR images were obtained. For these SAR images, different numbers of looks (L) were employed for multi-look processing, and the phase distribution of the corner reflector target under different look numbers is illustrated in Figure 6. Additionally, Table 1 presents the mean and STD of the phase distribution of the corner reflector following multi-look processing. The results indicate that the phase values obtained after multi-look processing exhibit a lower STD, thereby demonstrating that this processing technique can effectively suppress phase noise, enhance phase stability, and ensure the accuracy of deformation monitoring.
Due to the inherent characteristics of SAR imaging, the resulting SAR images often exhibit relatively low Signal-to-Noise Ratios (SNRs). Consequently, multi-look processing is employed to mitigate the effects of noise and enhance the accuracy of subsequent analyses. In the context of this study, the time interval between observations made by the CBS is only 2.5 milliseconds, enabling numerous observations of the target area within a short time frame. This characteristic facilitates the implementation of temporal multi-look processing, which effectively reduces phase noise without incurring the resolution loss typically associated with spatial multi-look processing. By leveraging this approach, the quality of the final images is significantly improved, ensuring that the results are both reliable and precise.

3.4. GB-SAR Deformation Detection with SAR Images

3.4.1. The GB-SAR Deformation Detection Principle

A GB-SAR system observes the target point both before and after deformation, thereby facilitating the acquisition of two distinct SAR images. Subsequently, the phase difference between these two SAR images can be expressed as follows [66]:
Δ φ = 4 π λ Δ r + φ a t m + φ n o i s e
where Δ r is the deformation value in the Line of Sight (LOS), φ a t m is the atmospheric phase, and φ n o i s e is the noise phase. Generally, if the time between two observations is short, atmospheric effects can be neglected. Meanwhile, by filtering to reduce the noise impact, the LOS deformation value can be expressed as follows:
Δ r = λ 4 π φ
Due to the specific working geometry of GB-SAR observations, major steps such as image registration, baseline estimation, and removal of flat-earth effects are not required in data processing [66]. Therefore, the main steps of GB-SAR are as follows:
(i).
Interferometric Phase Generation: An interferometric phase map, or interferogram, is generated by conjugate multiplying two GB-SAR images, which encapsulates the deformation information of the target area.
(ii).
Phase filtering: Phase noise can adversely affect the accuracy of phase measurements; thus, this issue is typically addressed using techniques such as mean filtering. When processing a large number of interferograms, temporal window filtering is employed. Conversely, for a smaller number of interferograms, spatial window filtering is preferred.
(iii).
Phase unwrapping: Since the interferometric phase value is wrapped within a certain range, it must be adjusted by adding integer multiples of 2 π . Phase unwrapping is a critical step in obtaining the true phase value of the target. Commonly used methods for this process include the branch-cut method and the region-growing algorithm.
(iv).
Deformation value calculation: Upon completion of the phase unwrapping process, the LOS deformation value of the target area can be computed from the true interferometric phase value using Equation (14).

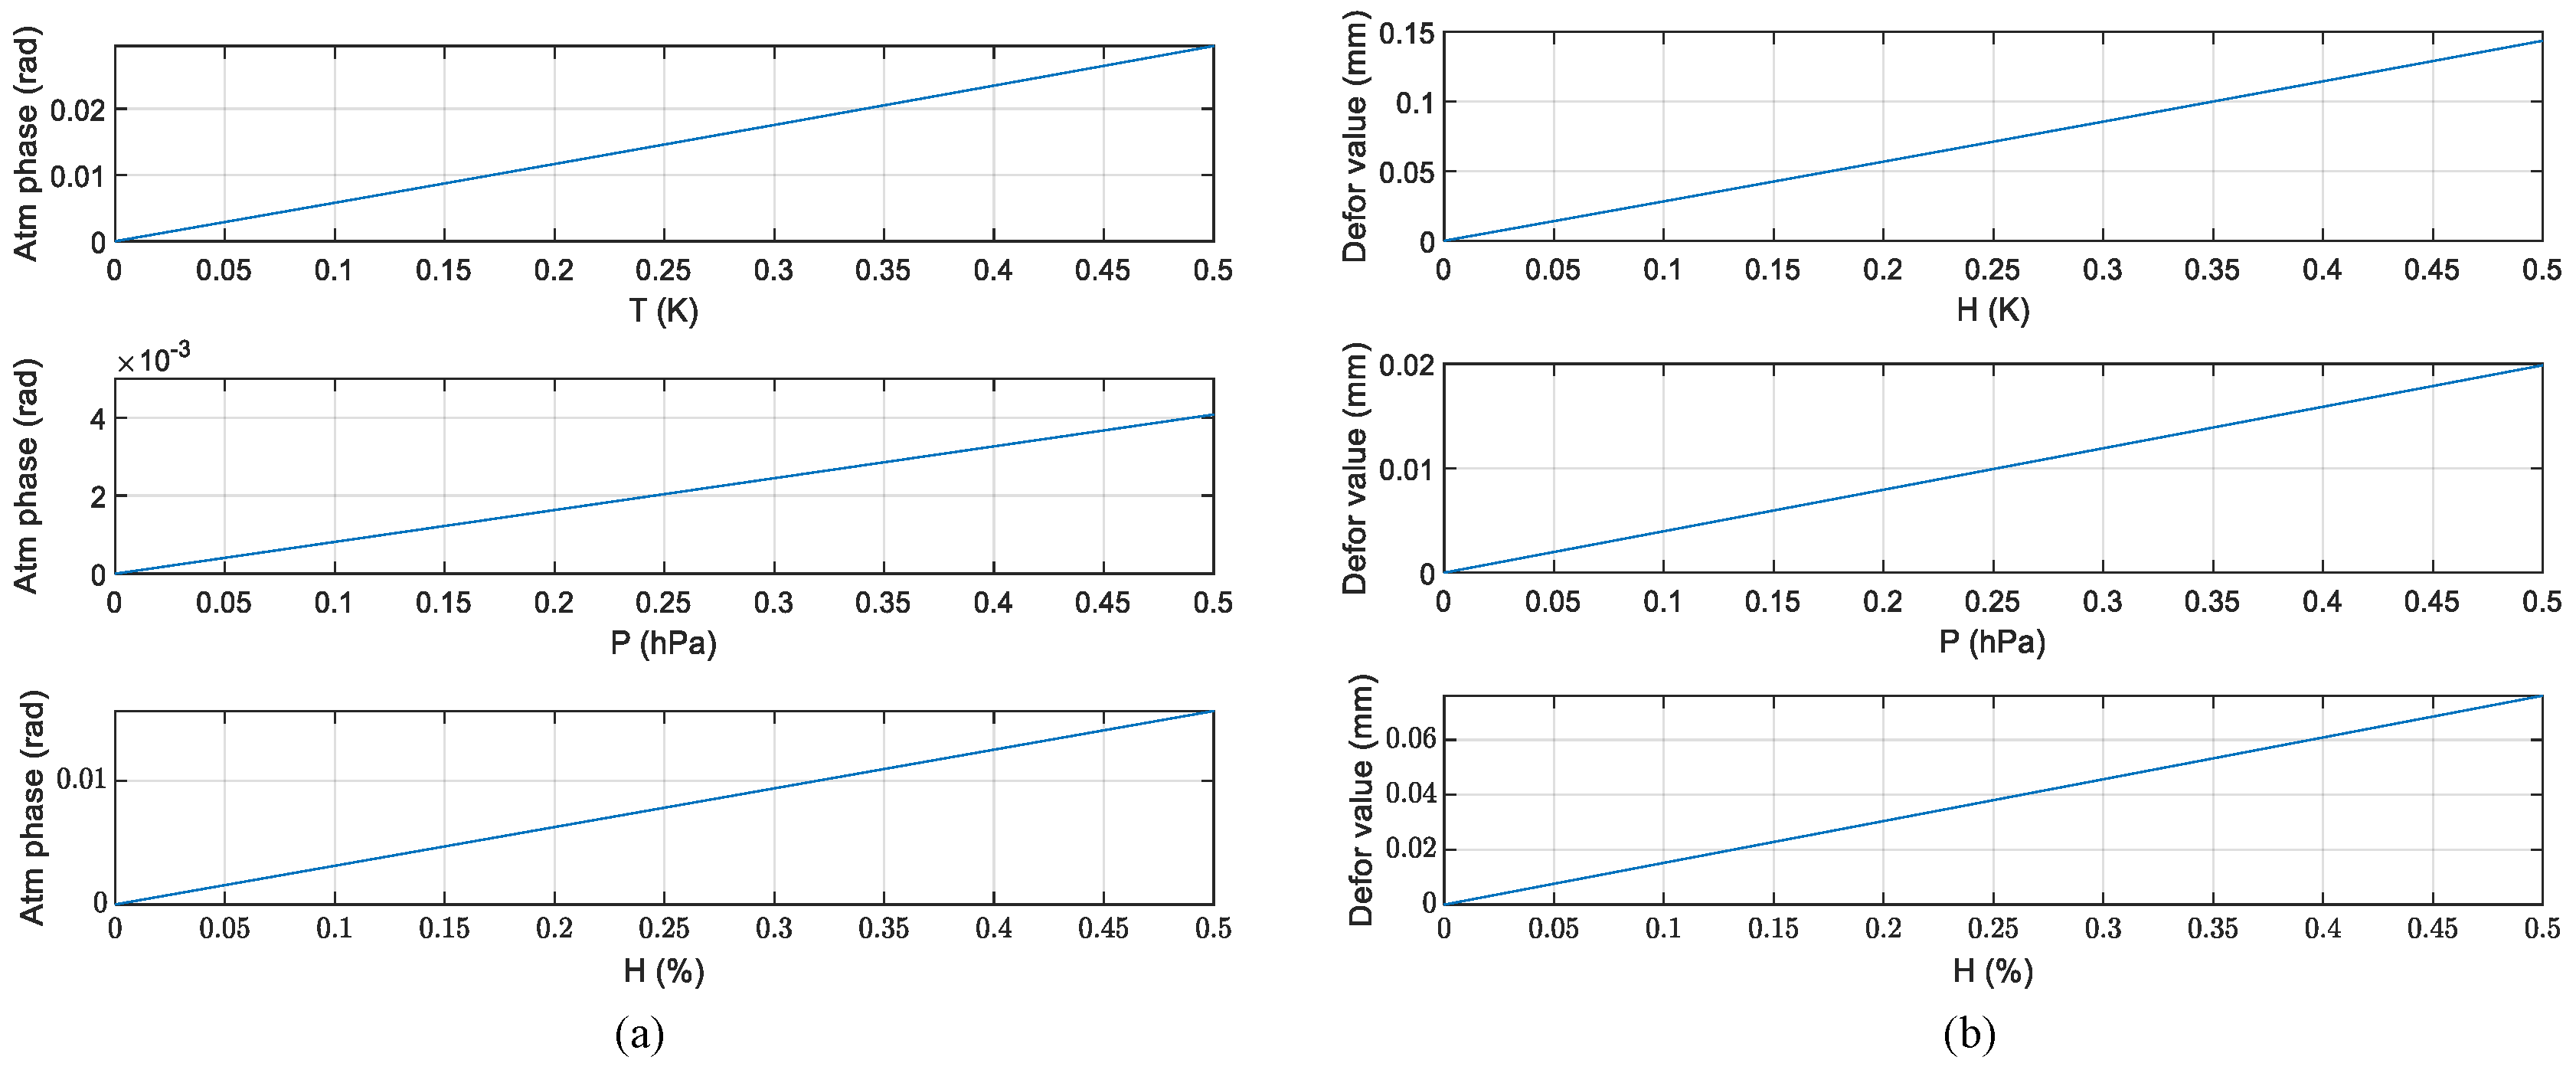
3.4.2. Atmospheric Phase Analysis and Simulation

When electromagnetic waves traverse the atmosphere, the diverse media encountered can significantly affect their propagation paths, resulting in phase differences (i.e., φ a t m in Equation (13)). The calculation of the atmospheric phase between the target and the antenna is conducted through integration along the propagation path [67]. Assuming that at that time, the atmospheric phase of a point target is as follows:
φ a = 4 π λ 0 r n t d r
where r is the distance between the point target and the antenna and n t is the atmospheric refractive index, which can be expressed as follows:
n t = 7.76 × 10 5 P T + 3.73 × 10 1 e T 2
where T is the dry temperature (in Kelvin), P is dry pressure (in millibars), and e is water vapor pressure (in millibars). The conversion relationship between water vapor pressure e and relative humidity H (percent per hundred) is as follows:
e = H 100 × 6.107 × e 17.27 × T 273.15 T 35.86
In the experiments, the area observed by the CBS is relatively small, and the time interval for data acquisition is exceedingly brief. Consequently, it can be assumed that the atmospheric distribution remains uniform and stable throughout the observation period; thus, the atmospheric phase can be simplified as follows:
φ a = 4 π r λ n t = 4 π r λ 7.76 × 10 5 P T + 3.73 × 10 1 H 100 × 6.107 × e 17.27 × T 273.15 T 35.86 T 2
As can be seen from the above analysis, the atmospheric phase is related to dry temperature, dry air pressure, and relative humidity. Based on the actual conditions of outdoor experiments, we analyzed the impact of changes in these parameters on the atmospheric phase through simulation. Assuming that at a distance of r = 150   m , T = 293.15   K , P = 1013   hPa , and H = 50 % , the atmospheric phase variations resulting from changes in these parameters and their impacts on deformation monitoring are shown in Figure 7. Based on the simulation results, it can be observed that when conducting observations over a small area, the observation time of the CBS typically does not exceed one second. During this brief duration, temperature, atmospheric pressure, and relative humidity remain relatively constant, resulting in a minimal influence of atmospheric phase on deformation detection. Consequently, the atmospheric phase can be disregarded during the data processing stage.

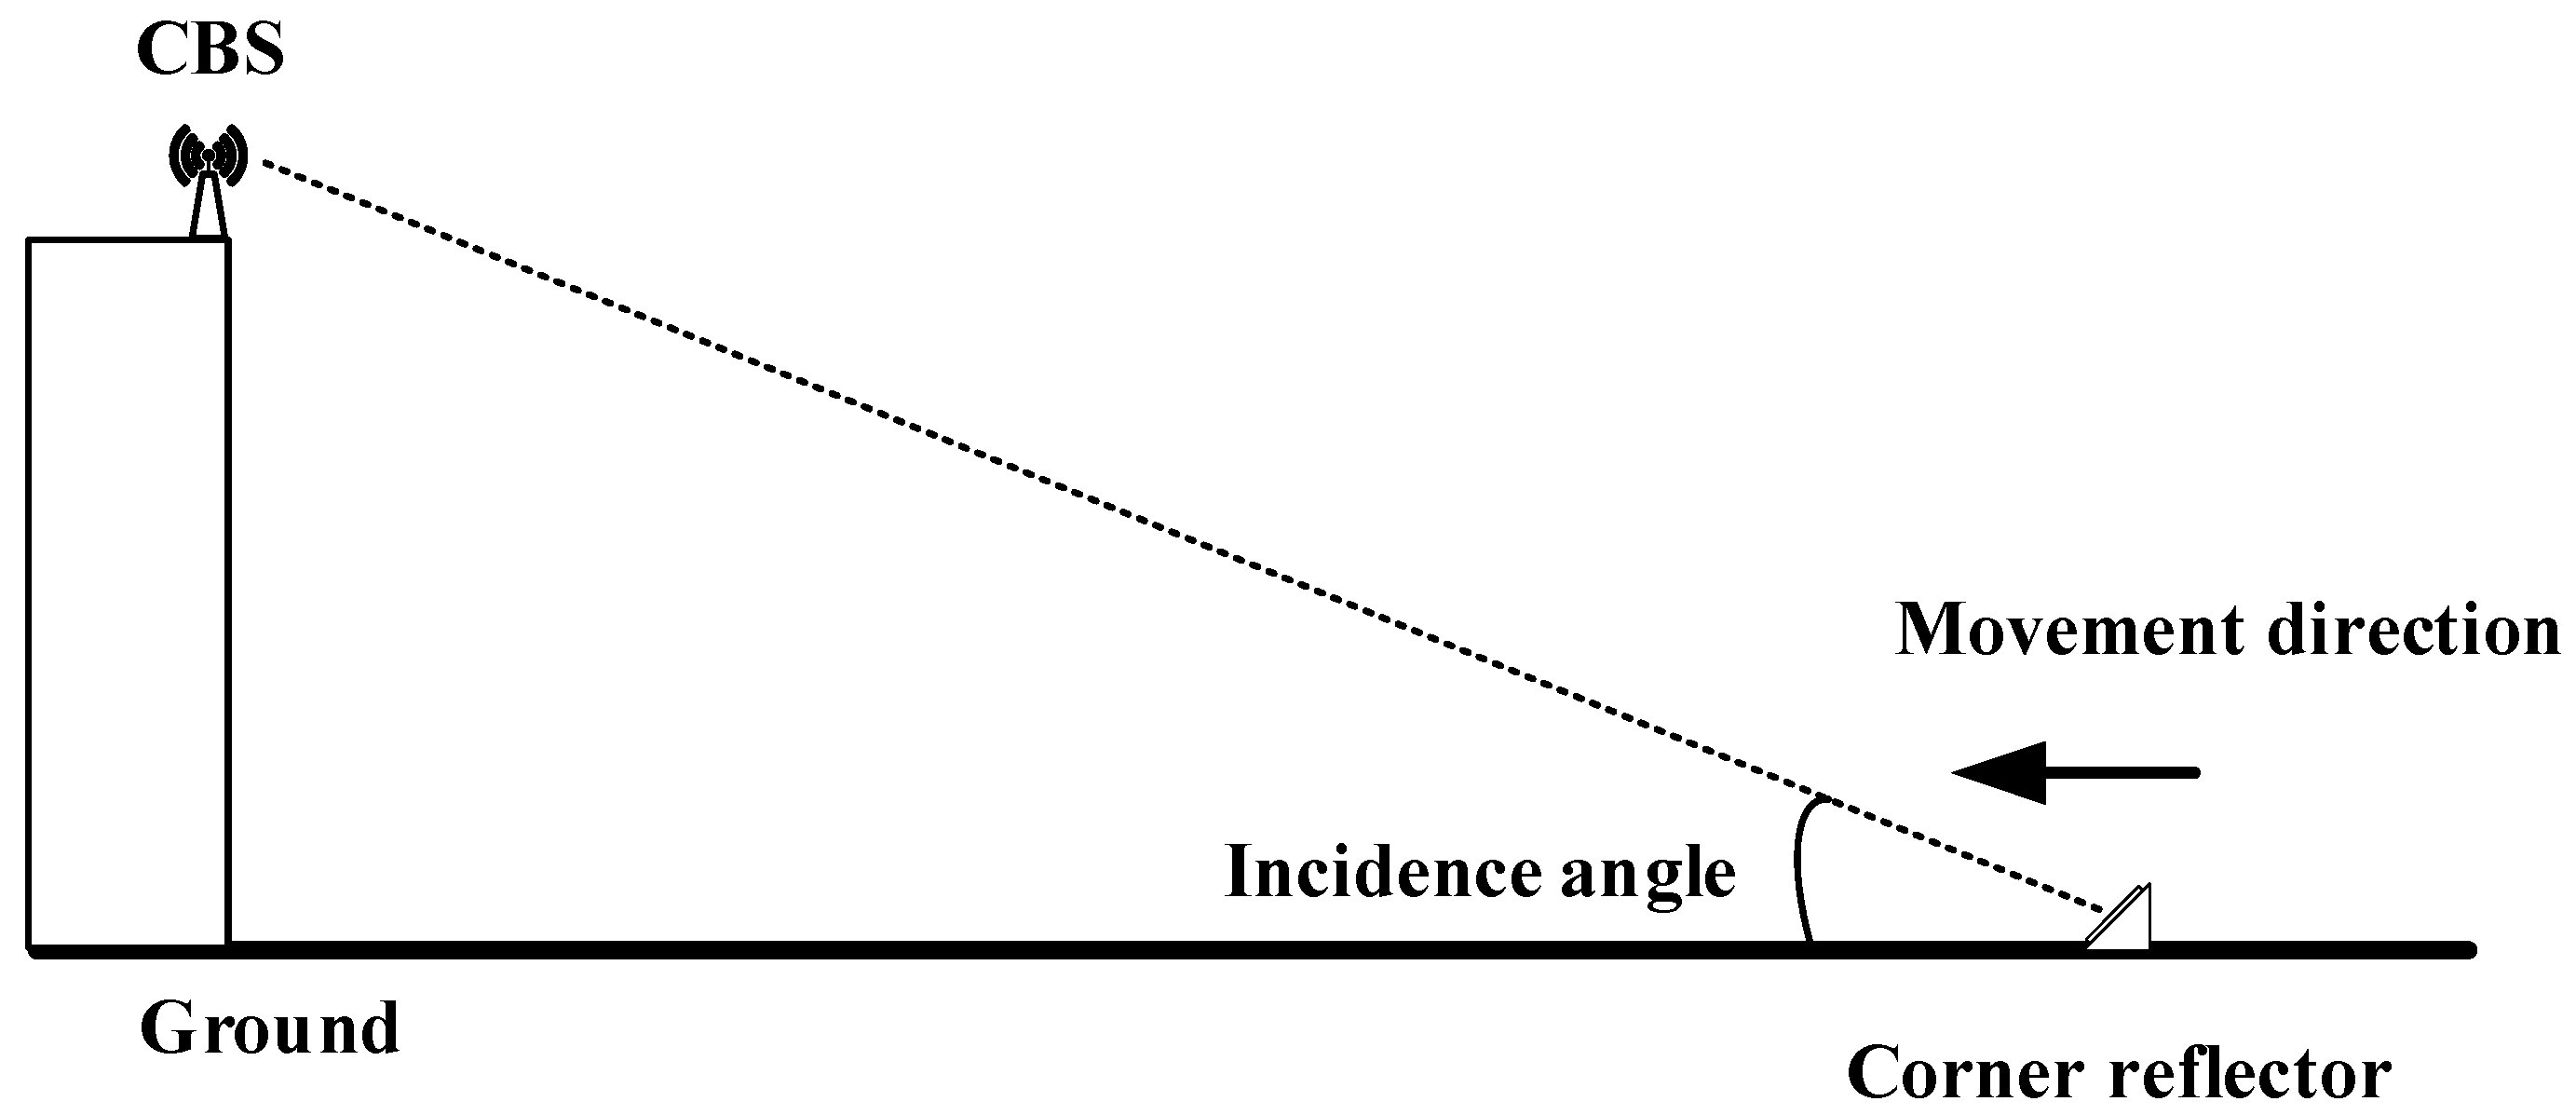
3.4.3. Observation Geometry Analysis

When the corner reflector is displaced, the slant range between it and the CBS alters, resulting in a corresponding change in the phase of the echo signal received from the corner reflector. The magnitude of this phase change is contingent upon the projection of the displacement along the LOS of the CBS. The geometric cross-section diagram illustrating the CBS observation is presented in Figure 8, depicting the displacement direction of the corner reflector as it moves horizontally along the ground towards the CBS.
0 illustrates the actual observation geometry of the outdoor experiment, revealing that the displacement direction of the corner reflector (horizontal) is not aligned with the LOS of the CBS (with an incidence angle greater than horizontal). In fact, the deformation values detected by the CBS represent the projection of the corner reflector’s displacement onto the LOS (referred to as the actual LOS deformation value). Therefore, to facilitate comparison with the detected LOS deformation values, the actual LOS deformation values ( d a c t L O S ) were calculated based on the corner reflector’s displacement ( d a c t H O R ) and the incidence angle ( θ i n ); the relationship between them is as follows:
cos θ i n = d a c t L O S d a c t H O R

4. The Deformation Detection Experiment and Results

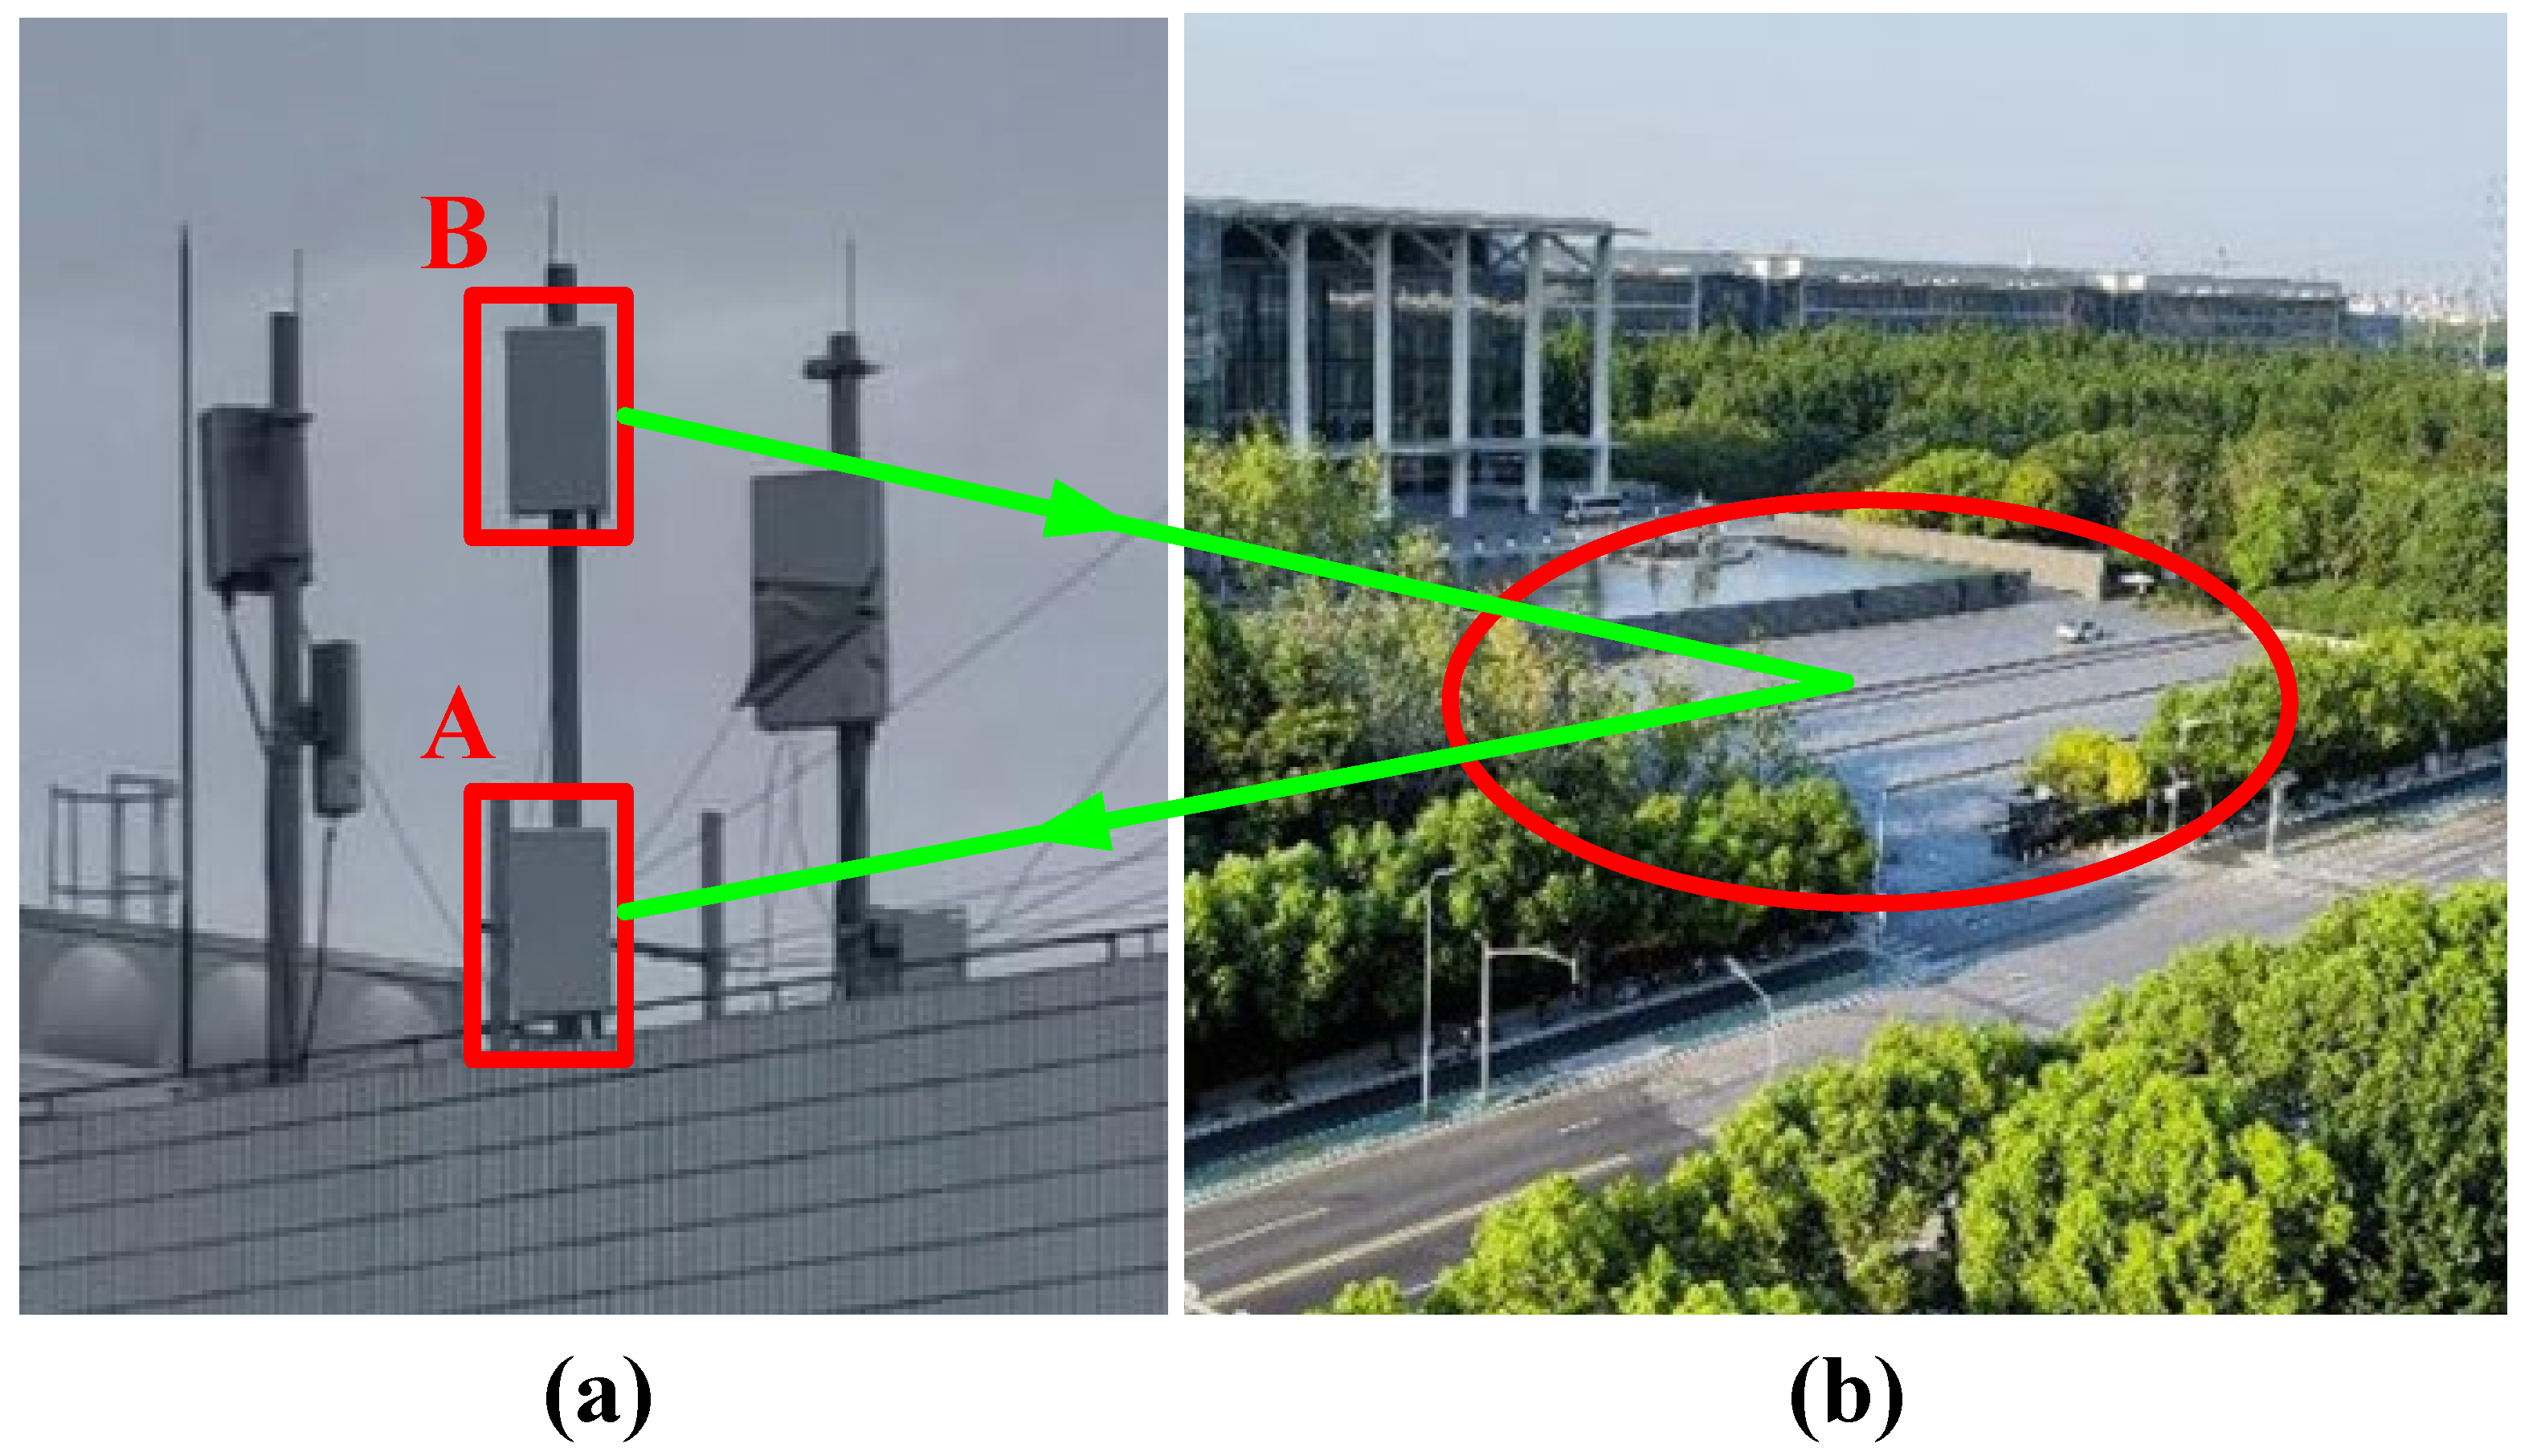
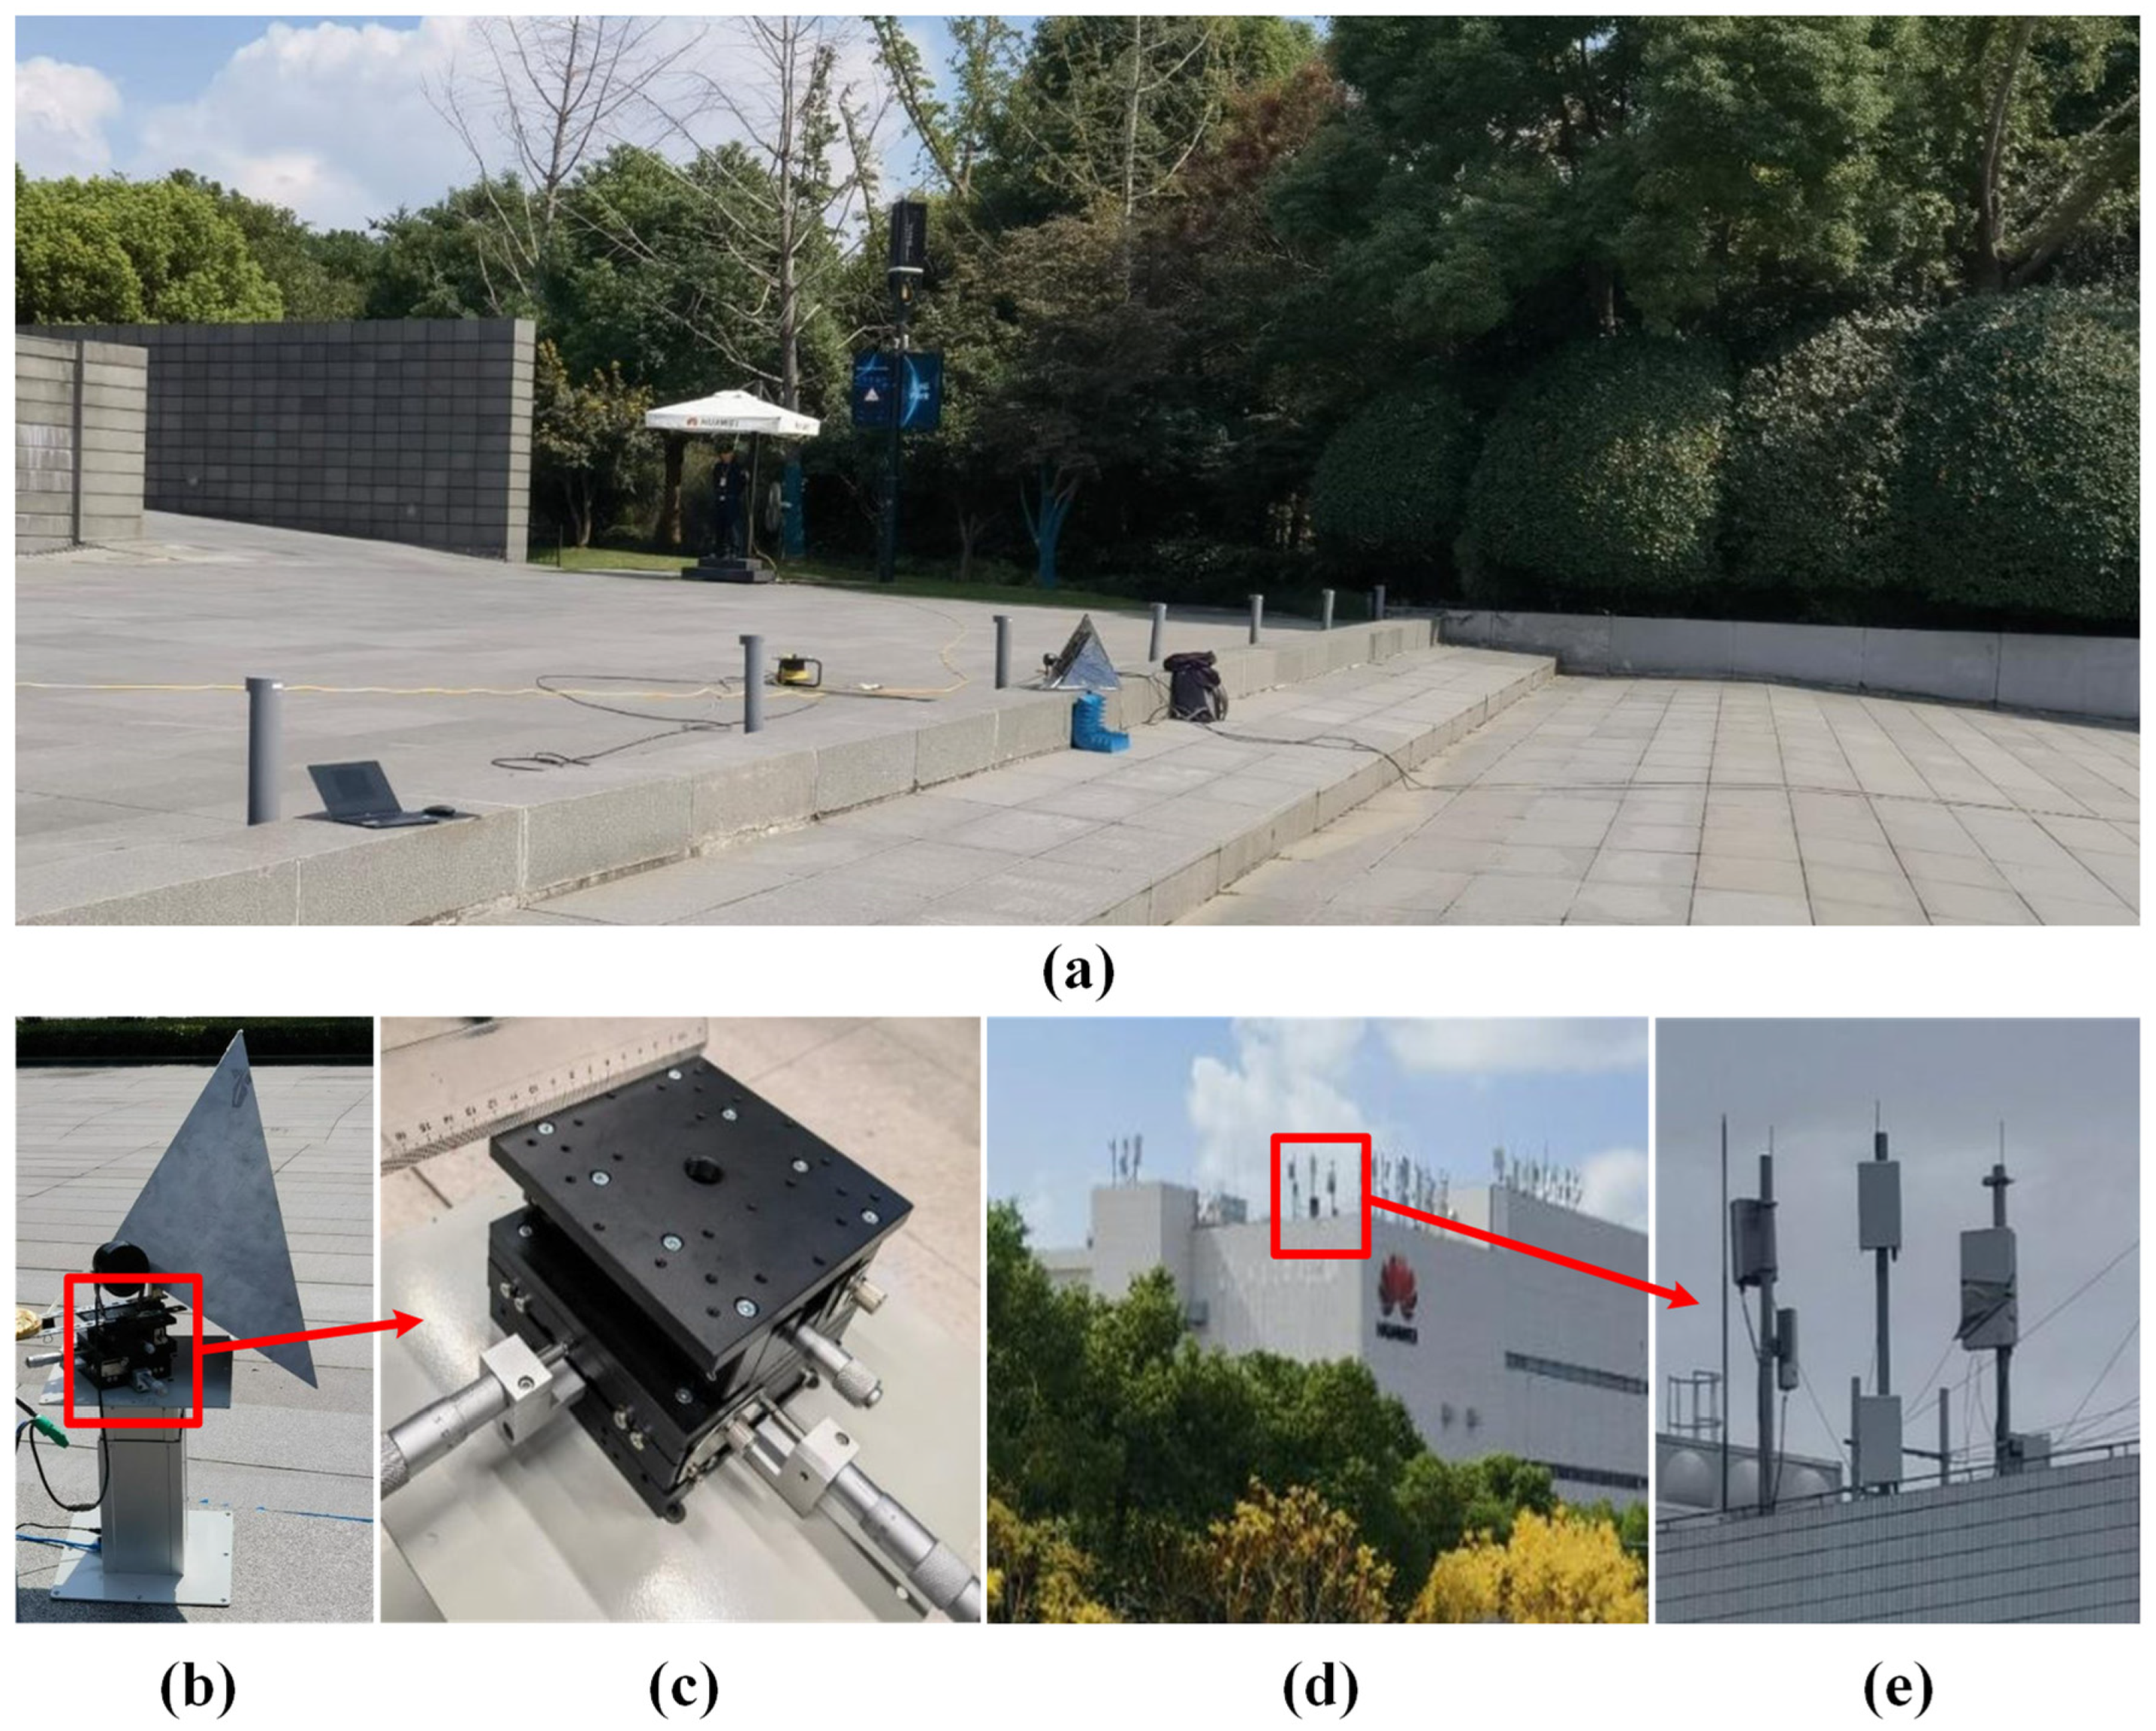
4.1. Deformation Detection Experiment Conditions

The primary experimental instruments are enumerated as follows: (a) transmitting CBS, (b) receiving CBS, (c) high-precision shift spiral micrometer, and (d) corner reflector. The geometric configuration of the CBS is illustrated in Figure 9a, where CBS-A (letter A in Figure 9) denotes the transmission station and CBS-B (letter B in Figure 9) denotes the reception station, with an altitude difference of 2 m. As depicted in Figure 9a, the SAR imaging configuration clearly exhibits a bistatic geometry. Figure 9b illustrates the LOS from the CBS to the observation target, with the red circle indicating the scene where the observation target of this experiment is located, and the green arrow line representing the history of the observation signal.
Meanwhile, Figure 10 depicts the deformation target within the observation scene. A corner reflector is affixed to a high-precision shift spiral micrometer, which makes the corner movement with utmost precision. To achieve the optimal SNR, we orient the corner reflector towards the CBS. With EPC principle, the communication signal data can be converted into the monostatic mode of a ULA. Therefore, in this experiment, data processing was conducted with the Equivalent Phase Center position as the reference.
The CBSs used in the experiment were a commercially available 5G CBS operating at a frequency of the carrier frequency of 4.9 GHz. Each unit had a power output of 8 W and a gain of 20 dBi. The horizontal Half-Power Beam Width (HPBW) was 80 degrees, and the vertical HPBW was 18 degrees. The data acquisition process involved placing corner reflectors at designated positions and controlling the transmitting CBS to emit detection signals. After reflection from the target, the echo signals were received by the receiving CBS. Continuous observations of the scene were conducted at 2.5 ms intervals, resulting in 256 echo data sets for the current scene. Subsequently, the corner reflectors were moved to simulate ground deformation, and another set of 256 echo data was acquired. By repeating the aforementioned steps, the necessary measured data for the experiment were obtained.

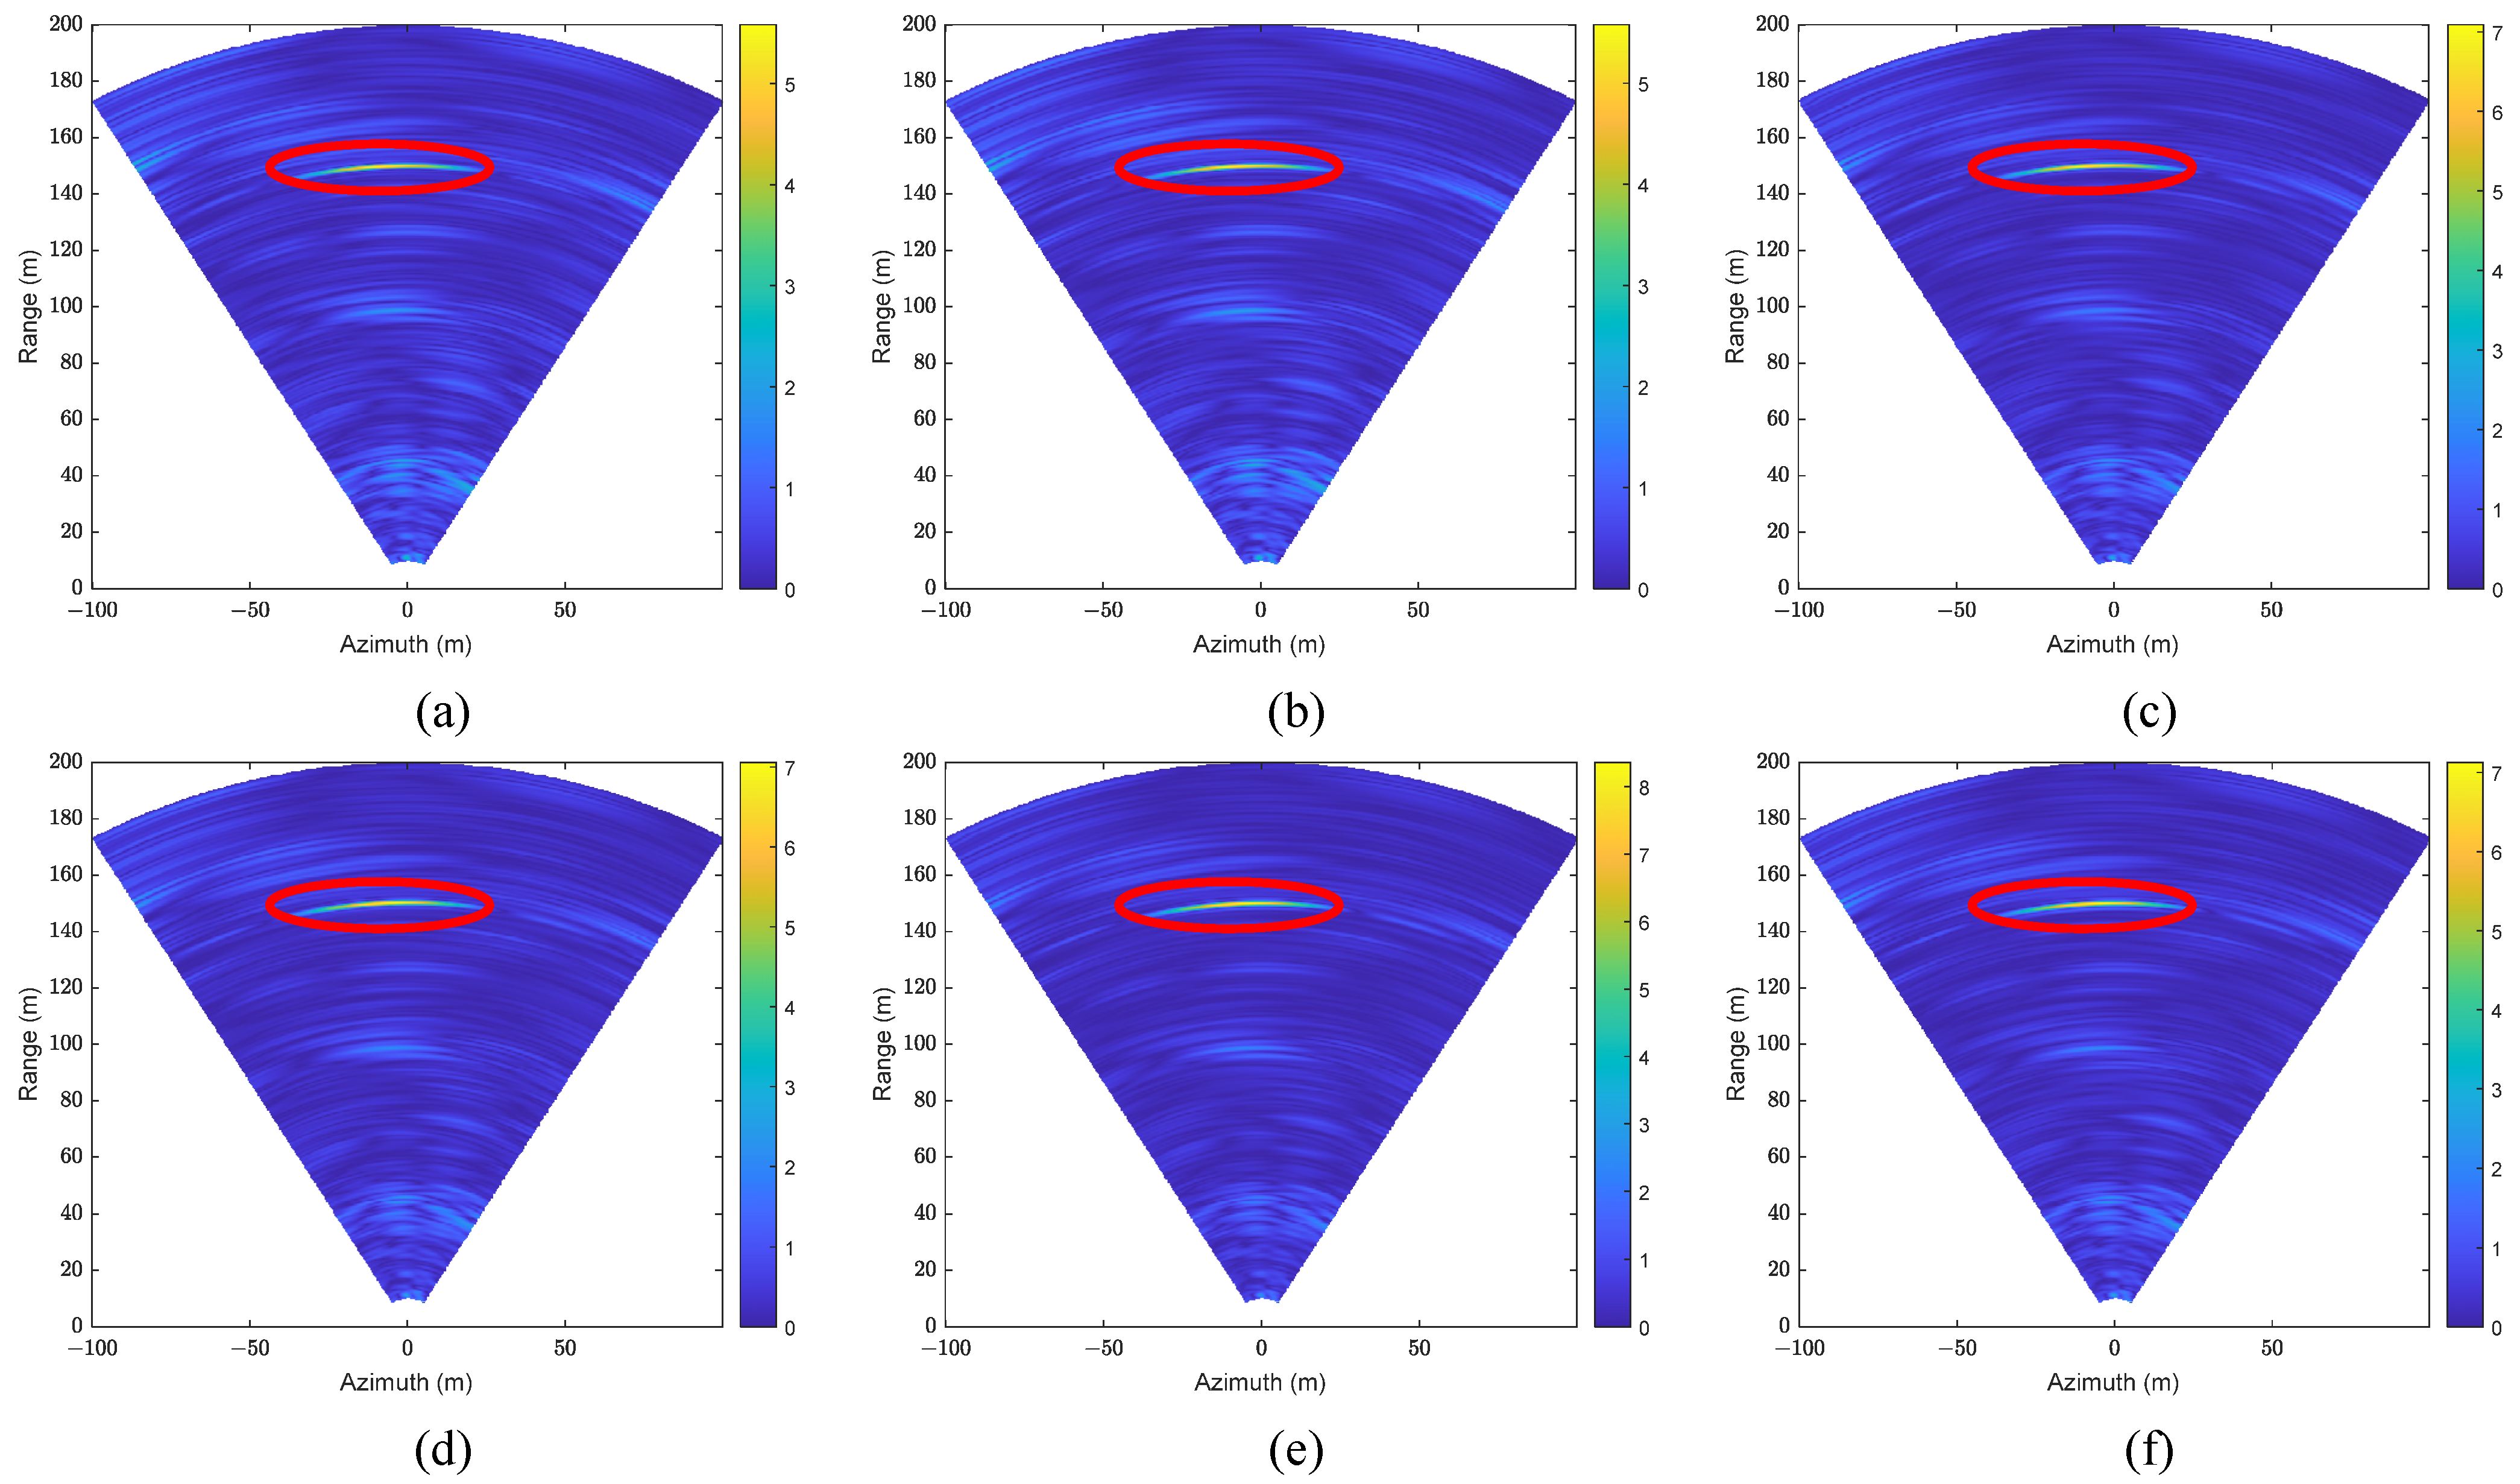
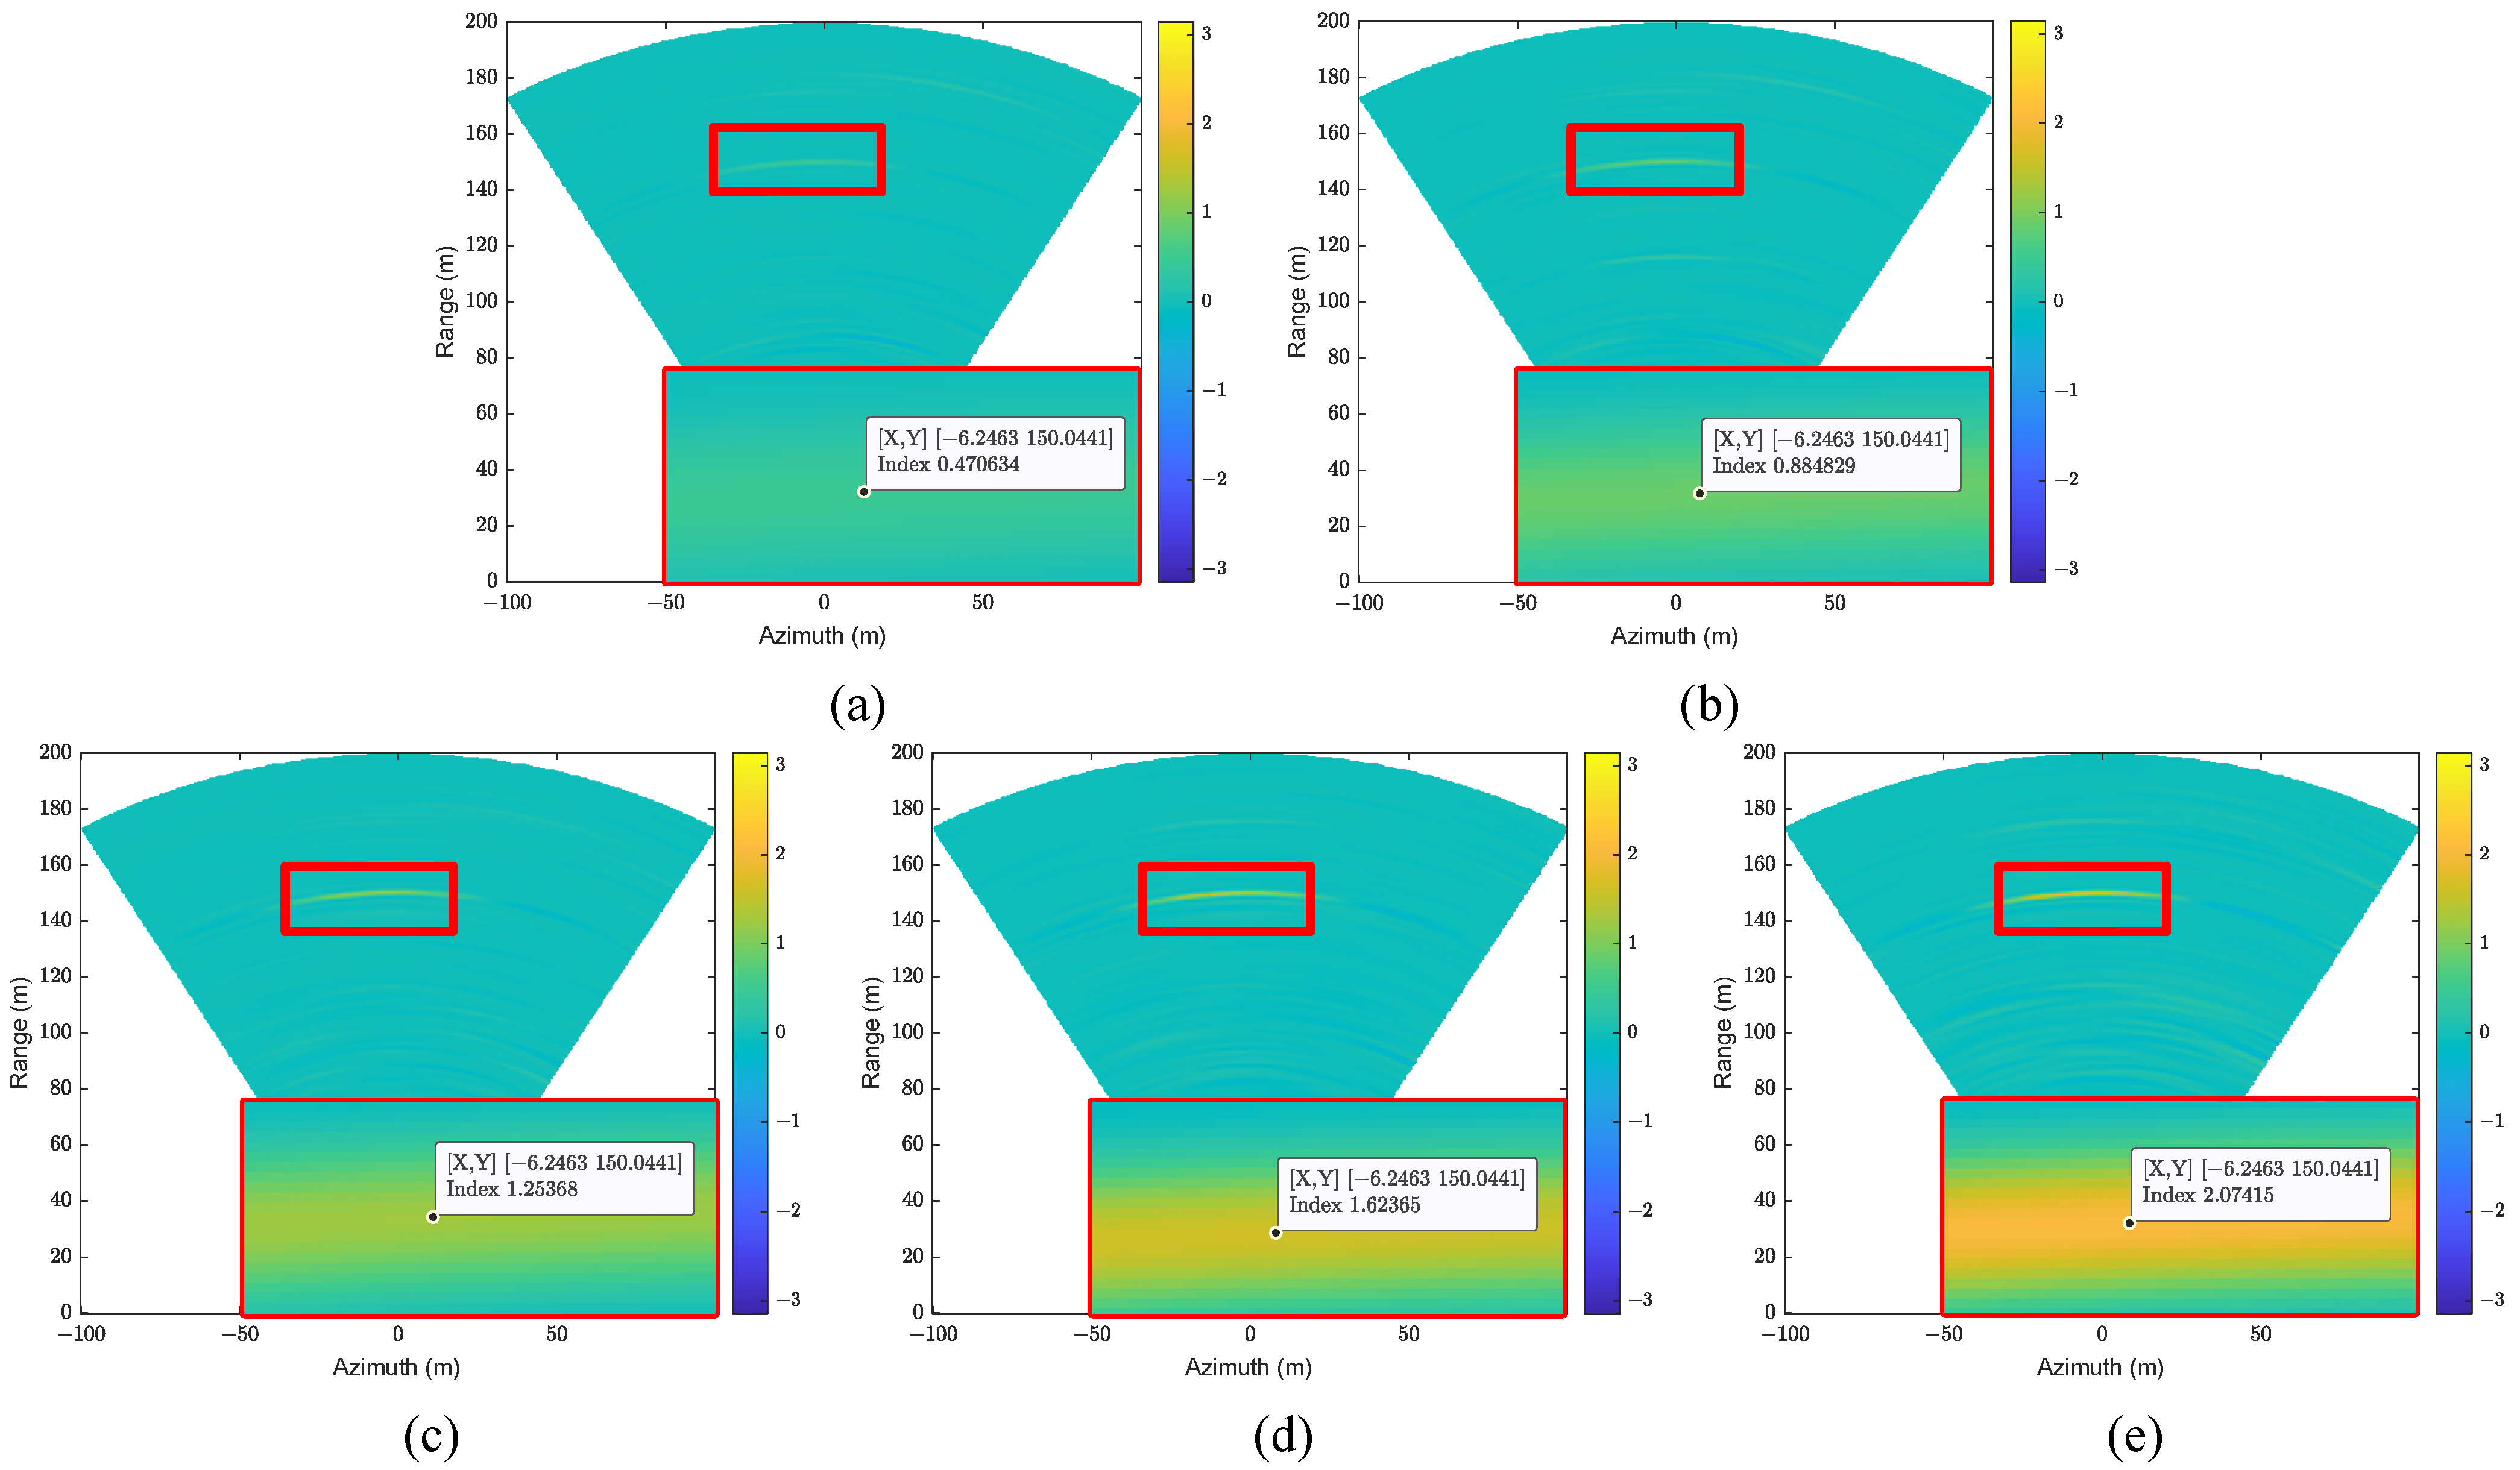
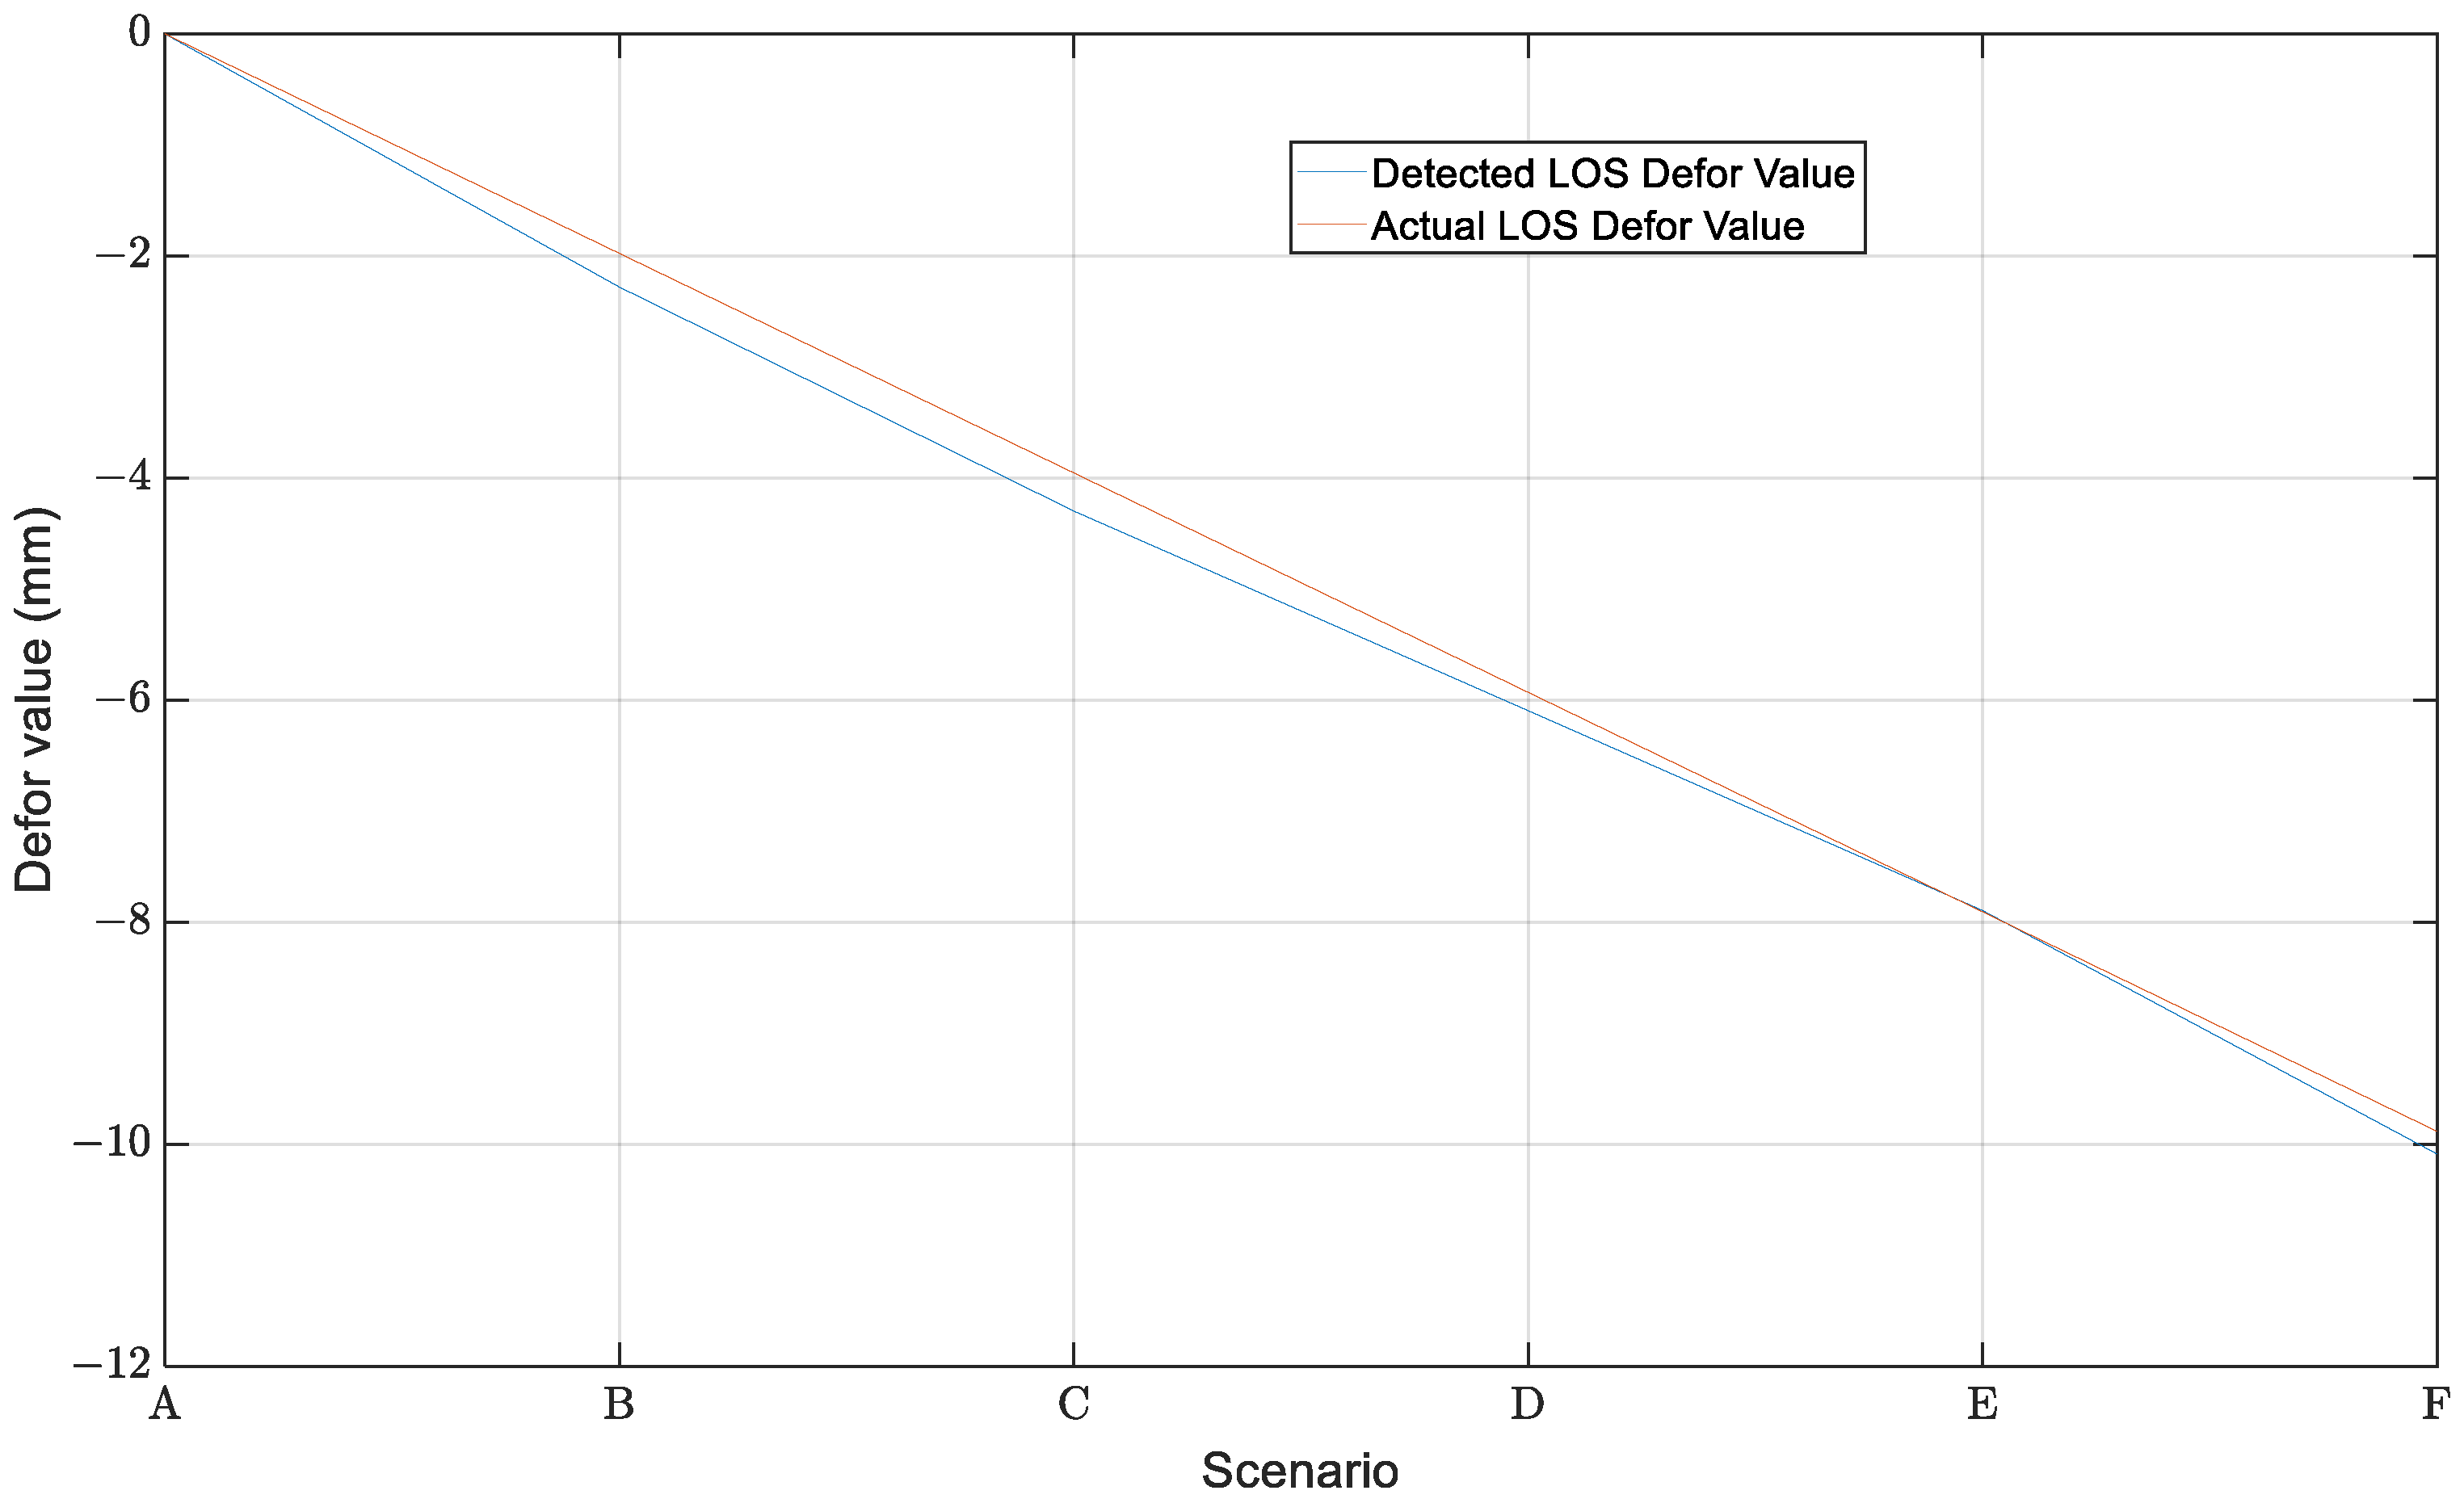
4.2. The Deformation Detection Experiment Results
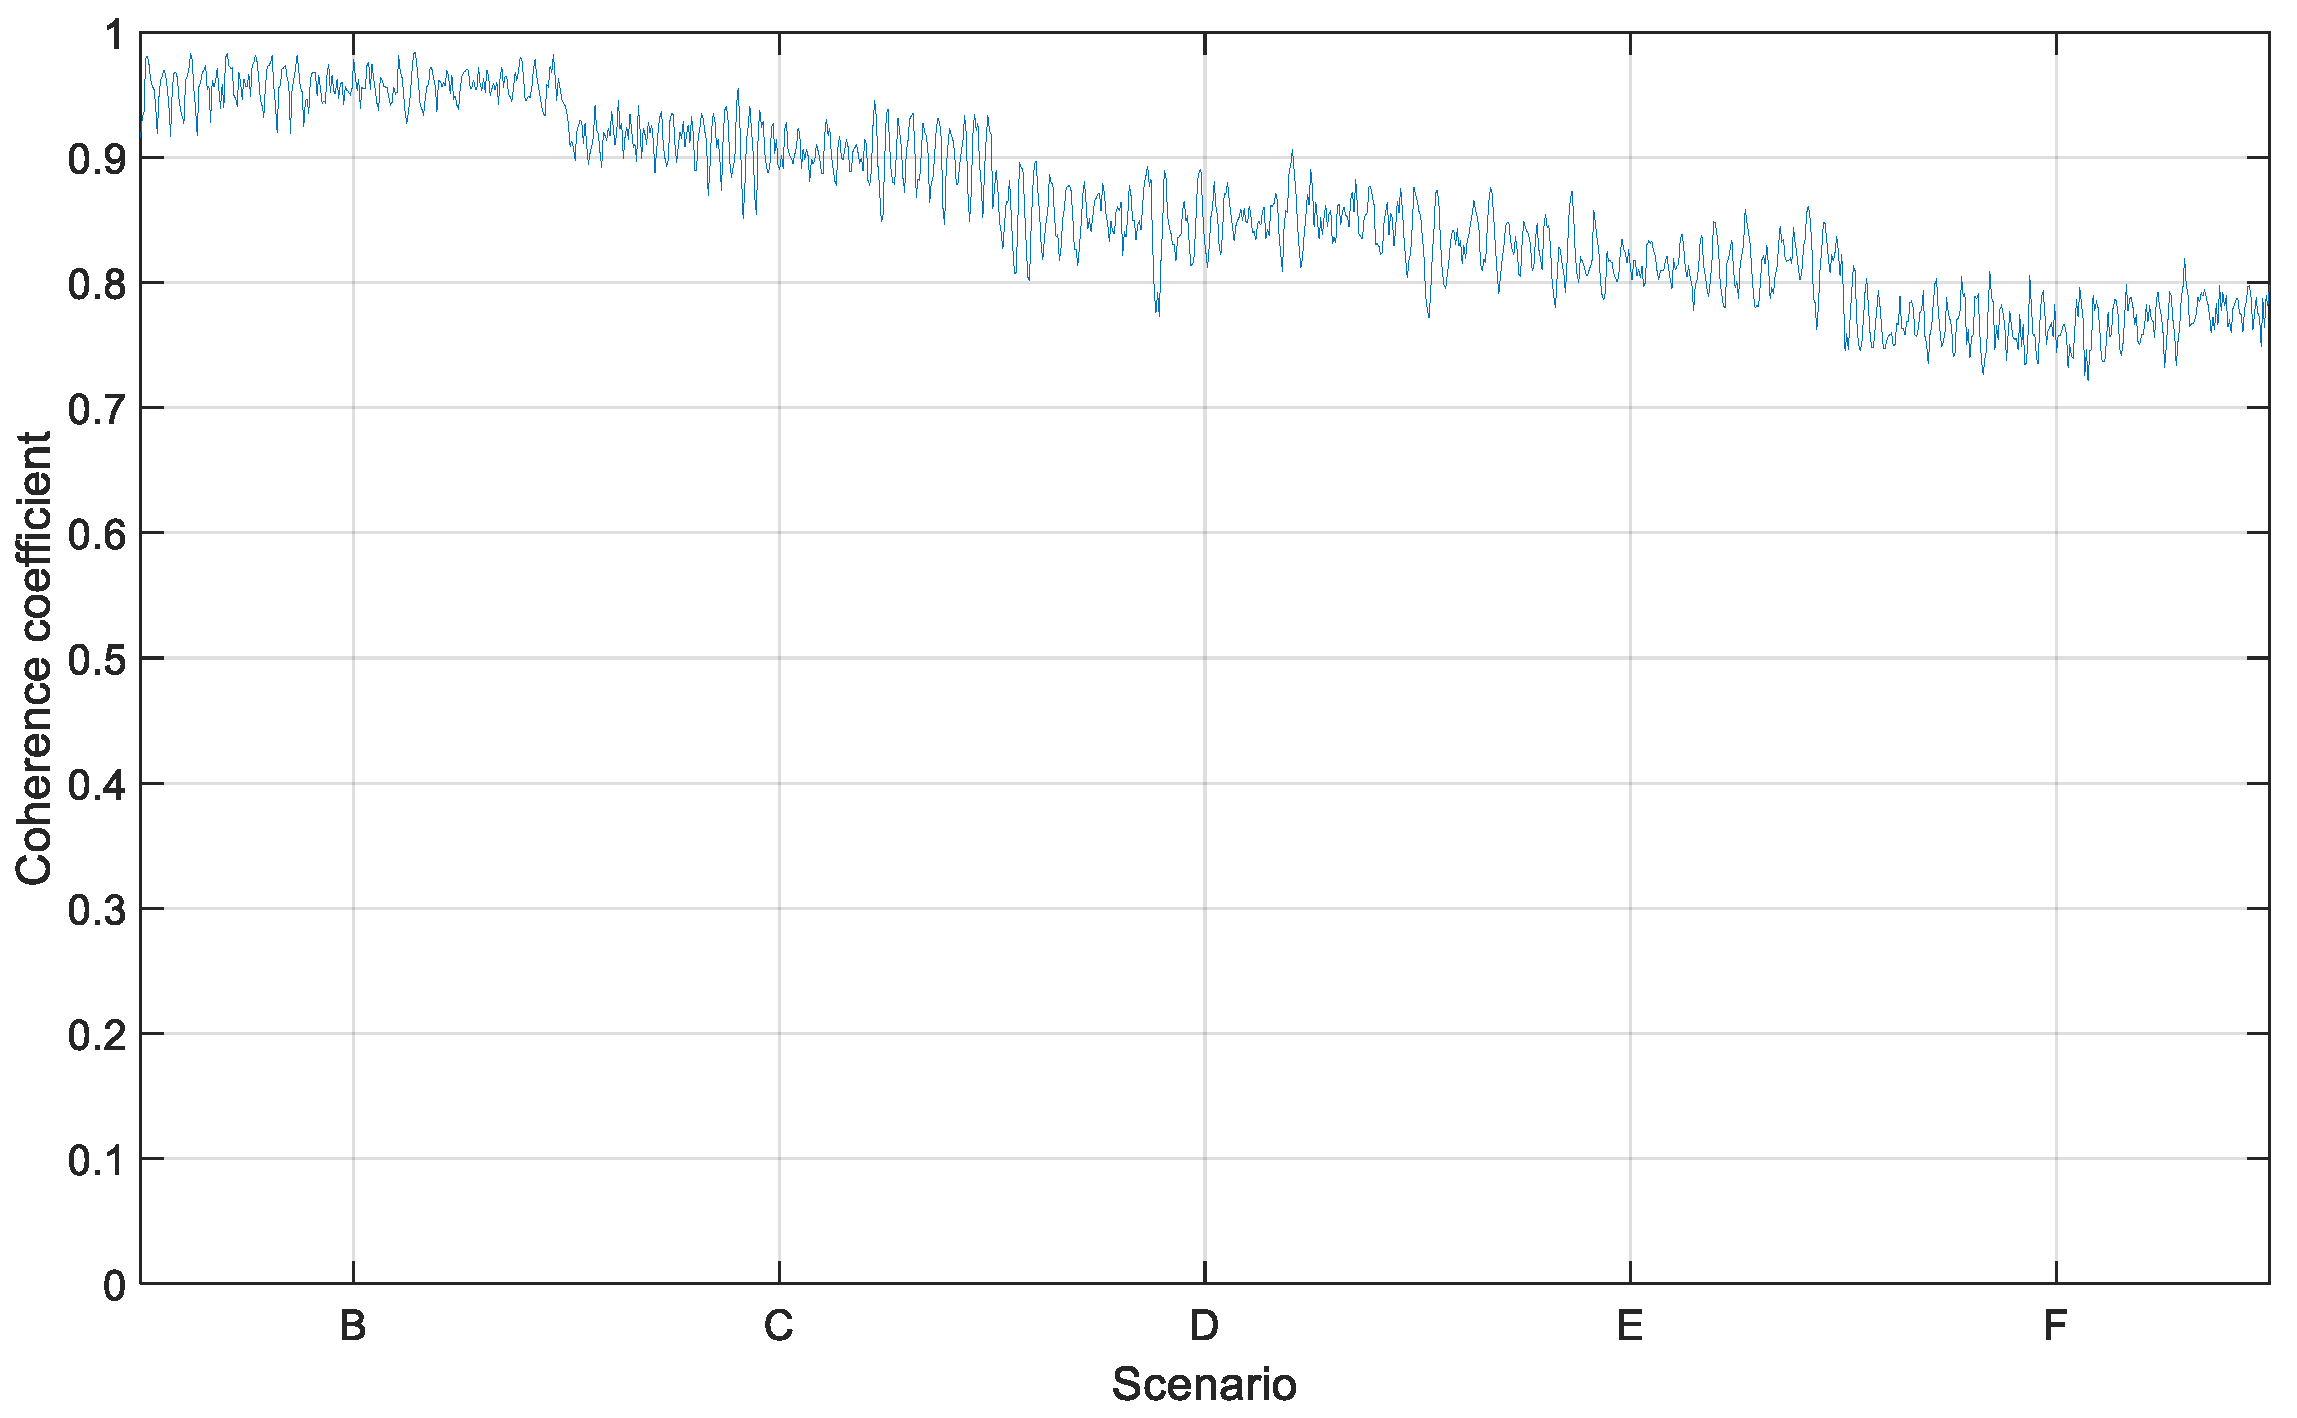
In this paper, six experimental scenarios were constructed, each corresponding to different displacements of the corner reflector, from which multiple echoes were obtained for data processing. The first scenario, designated as A, serves as the reference for deformation detection. Each subsequent scenario sequentially displaces the corner reflector by 2 mm relative to the previous one, simulating ground deformation, and they are labeled from B to F. (The principle analysis for selecting the 2 mm increment in displacement can be found in Appendix A). The relationship between the displacement of each observation scenario marker and the corner reflector target is shown in Table 2.
Similarly, 256 consecutive observations were conducted for each scenario at intervals of 2.5 milliseconds. The echo data were processed using the BPA imaging technique, resulting in 256 SAR images for each scenario. Subsequently, the 256 SAR images from each scenario underwent temporal multi-look processing to yield a single SAR image, as illustrated in Figure 11. Among these images, (a)–(f) correspond to scenarios A–F, with the corner reflectors highlighted by red circles, and the color bar represents SAR image amplitude.
Prior to performing interferometric processing, it is essential to verify the coherence between the SAR images to ensure the reliability of deformation measurements obtained through D-InSAR technology. Here, we performed multi-look processing on the 256 SAR images acquired for scenario A to obtain a multi-look SAR image of scenario A as the common reference image. Then, we calculated the coherence coefficients between all the single-look SAR images obtained from the remaining five scenarios and the common reference image, and statistically analyzed the coherence coefficients at the corner reflector targets. Its distribution is shown in Figure 12.
It is evident that the coherence coefficient of the corner reflector targets in the SAR images obtained from CBS observations is distributed above 0.7, with a minimum value of 0.72. A value of 0.7 is a typical threshold used when InSAR technology (especially PSI) is used for deformation detection applications. This indicates that the corner reflectors maintain good coherence during multiple observations in the experimental scenario, enabling reliable deformation monitoring. Two primary reasons account for the high coherence observed between SAR images. Firstly, the corner reflectors exhibit stable backscattering characteristics, ensuring consistent phase features during the observation period. Secondly, all imaging scenarios (A–F) in the experiment were completed within one hour, resulting in a short observation time that minimized the influence of atmospheric and other noise, thereby preserving good coherence throughout the observation.
Based on the analysis in Section 3.3, the SAR images obtained through multi-look processing in scenario A are utilized as a common reference image, which allows for a higher SNR. All remaining single-look SAR images serve as secondary images, which are processed separately with the reference image, resulting in 256 interferograms for each of the five scenarios. Subsequently, phase filtering and phase unwrapping are conducted on the interferograms to derive the absolute phase. The phase filtering technique employed is temporal multi-look filtering with a look number of 256, effectively reducing noise in the interferometric phase while preserving resolution. Figure 13 presents the Differential Interferometric Phase (DIP) for each scenario following multi-look processing (the target area is magnified within the red box, where the data labels X and Y represent the azimuth and range coordinates of the target in the SAR image, respectively, with units in meters, and Index indicates the phase value of the target point in radians). It can be observed that the DIP of the target area, where deformation is simulated, exhibits significant changes. Moreover, as the deformation value increases, the changes in the DIP become more pronounced, while other regions within the scene do not demonstrate this characteristic. Additionally, the DIP value at the location of the corner reflector is marked in the figure; the increment displayed by this value correlates with the preset deformation increment of 2 mm (corresponding to approximately 0.42 rad), thereby confirming the accuracy of the experimental results. Figure 14 illustrates the phase distribution of the corner reflector before and after multi-look filtering, where the blue line represents the single-look phase prior to filtering, and the red line denotes the multi-look phase subsequent to filtering.
The multi-look phase exhibits a higher SNR compared to the single-look phase, thereby ensuring the accuracy of deformation detection. Consequently, the LOS deformation value is calculated based on the multi-look phase, with the calculation method detailed in Section 3.4. Figure 15 compares the detected LOS deformation values obtained from the CBS with the actual LOS deformation values. Additionally, Table 3 presents the errors between these two sets of values. (The actual LOS deformation value displayed here is −1.977 mm (rather than −2 mm), which represents the projection of the corner reflector’s horizontal displacement of 2 mm onto the LOS of the CBS.)
Based on the processing results of the measured data, the CBS demonstrates excellent performance in deformation detection. In the experiment, the deformation value applied to the corner reflector exhibits a linear change, which aligns well with the linear distribution of the multi-look phases presented in Figure 14. Furthermore, although the SNR of the single-look phases prior to filtering is relatively low, the stepped changes corresponding to the deformation values remain observable. This observation confirms the accuracy of the CBS in capturing phase changes. The trend of the detected LOS deformation values illustrated in Figure 15 closely corresponds to the actual LOS deformation values, with a maximum error of only −0.3437 mm. This result indicates that the CBS is capable of accurately detecting the displacement of the corner reflector.
In the experiment, the CBS was able to continuously observe the ground area at an interval of just 2.5 ms. This not only ensured the acquisition of sufficient data for processing, thereby enhancing the reliability of the deformation monitoring results, but also met the demands of tasks requiring rapid deformation rate observations due to the CBS’s ultra-high observation frequency. A total of 1280 echo data points were processed during the experiment, taking 79 s in total. This allowed for real-time processing of the data obtained by the CBS, ensuring the timeliness of the observation tasks. Therefore, it can be concluded that the CBS can effectively function as a GB-SAR system, achieving millimeter-level deformation detection with high accuracy.

4.3. Error Analysis

From the experimental results presented above, it can be observed that CBSs, as a GB-SAR systems, are capable of effectively performing ground deformation detection tasks. However, certain errors remain evident in the detection results. Analyzing the data processing flow, it can be inferred that these errors may arise from three primary sources.
First, processing errors introduced during the imaging process. According to the description of the BPA in Section 3.2, the coordinates of the array elements relative to the target are required to calculate the slant range. However, deviations in the actual positions of the array elements are inevitable, leading to inaccuracies in the calculated slant range and consequently introducing phase errors in the SAR images. While the impact of this error on deformation detection is relatively minor, it cannot be completely eliminated and can only be mitigated through improved production precision.
Second, errors introduced by environmental change during interferometric processing. During multiple observations, the differential interferometric phase is affected by atmospheric variations, leading to atmospheric phase noise (as described in Section 3.4). Additionally, the CBS equipment may experience shifts due to factors such as wind, resulting in positional deviations during each observation that also introduce phase errors. These errors can significantly affect the accuracy of deformation detection and require the incorporation of external data sources for calibration.
Lastly, phase errors caused by low transmission power. Due to the relatively low transmission power of individual array elements, the SNR of the obtained SAR images tends to be low, resulting in larger errors in deformation detection. However, the CBS’s high temporal sampling rate ensures a high coherence between adjacent images, allowing for the enhancement of SNR through multi-look processing of time-series SAR image samples (refer to the analysis in Section 3.3), thereby improving the accuracy of deformation detection.

4.4. Comparison with Traditional Deformation Monitoring Methods

The integration of CBSs with D-InSAR technology provides a novel observational approach for ground deformation detection, significantly impacting both radar remote sensing and deformation monitoring fields. When comparing CBSs to traditional satellite SAR platforms and GB-SAR platforms, several key aspects emerge.
Cost: The design, launch, and maintenance of satellite SAR platforms require substantial financial investment. While GB-SAR platforms are less costly than satellite SAR platforms, their construction and maintenance still entail significant expenditure. In contrast, the extensive deployment of CBSs can effectively reduce the overall costs associated with radar system implementation.
Flexibility and Scalability: Satellite SAR platforms operate on fixed orbits, making it challenging to adapt to various observational tasks. Similarly, once GB-SAR platforms are established, their observation areas become fixed, limiting scheduling flexibility. CBSs, being densely distributed, allow for dynamic selection of observation areas and targets based on demand. Furthermore, cooperative observations among multiple CBSs represent an important future research direction. These CBSs can also simultaneously support communication and radar detection tasks, facilitating efficient resource utilization.
Temporal Sampling Rate: Due to its fixed orbital path, satellite SAR platforms exhibit longer revisit periods (typically at least several days), resulting in the lowest temporal sampling rate. In contrast, the time interval between successive observations in GB-SAR platforms can reach several seconds, while CBSs can achieve millisecond-level observation intervals. Furthermore, the observation time interval is closely related to temporal decorrelation. Consequently, the temporal decorrelation is most severe in satellite SAR platforms, while it is least pronounced in CBSs.
Observation Range and Accuracy: Satellite SAR platforms benefit from their orbital advantages, enabling wide-area observations, which is a capability difficult to achieve with GB-SAR platforms and CBSs. However, satellite SAR platforms are susceptible to significant atmospheric interference, necessitating complex correction algorithms to meet high accuracy requirements. Conversely, GB-SAR platforms and CBSs experience reduced atmospheric effects due to their shorter observation distances, resulting in higher deformation monitoring accuracy. However, this proximity also limits the observational range of GB-SAR platforms and CBSs.
The preceding paragraphs provide a detailed comparison of several key characteristics of CBSs in relation to traditional deformation monitoring methods. To facilitate a more intuitive understanding of the differences between these characteristics for the reader, Table 4 presents a summarized comparison.
In summary, the combination of CBSs with D-InSAR technology presents a compelling alternative for ground deformation monitoring. Consequently, the application of CBSs for ground deformation monitoring holds significant practical importance in mitigating the risks posed by natural disasters and addressing potential threats to urban infrastructure.

5. Conclusions

From the perspective of ISAC, this paper has explored the feasibility of detecting ground millimeter-level deformation using CBSs based on D-InSAR technology for the first time, including conducting outdoor experiments to validate this method. The experimental results demonstrate that the phase of the echo signal exhibits significant changes with each movement of the corner reflector, allowing for the precise calculation of the corresponding LOS deformation values based on these phase changes. The LOS deformation trends detected by the CBS closely align with the actual trends, with a maximum error of only 0.3437 mm, thereby confirming the feasibility and accuracy of CBSs in millimeter-level deformation detection.
This study has validated the feasibility of utilizing CBSs in conjunction with D-InSAR technology for ground deformation detection, but this novel detection approach still encounters several practical challenges. Firstly, CBSs are susceptible to wind-induced vibrations, which can significantly impact deformation detection accuracy; therefore, the development of corresponding calibration algorithms is necessary. Secondly, in long-term deformation monitoring tasks, atmospheric effects cannot be overlooked, making accurate atmospheric phase correction an essential future task. Lastly, the limited observational range of CBSs necessitates the exploration of multi-CBSs cooperative observation techniques to facilitate larger-scale deformation monitoring efforts.
In the future, as the deep integration of CBSs and D-InSAR technology, this method is expected to be applied in areas such as monitoring the subsidence of urban buildings, assessing the health of roads and bridges, and managing traffic in smart cities. Furthermore, this technology can be integrated with currently popular artificial intelligence and big data techniques, thereby enhancing data processing capabilities and establishing a multidimensional perception system. Simultaneously, with the proliferation of 5G or 6th-Generation (6G) communication networks and the increasing density of CBSs, CBSs are anticipated to become a vital component of urban sensing networks as GB-SAR platforms.
In conclusion, this study lays the groundwork for the application of CBSs in ground deformation monitoring and highlights the vast potential of ISAC technology for future developments. As technology continues to advance and applications deepen, CBSs are poised to become a vital tool for efficient, real-time deformation monitoring, contributing positively to societal sustainability and safety.

Author Contributions

Conceptualization, J.T.; methodology, J.X., Z.S. and J.T.; validation, J.X. and Z.S.; formal analysis, Z.S.; investigation, J.X.; writing—original draft preparation, J.X.; writing—review and editing, Z.S.; and project administration, Z.S. All authors have read and agreed to the published version of the manuscript.

Funding

This research received no external funding.

Data Availability Statement

The data presented in this study are available on request from the corresponding author due to privacy.

Acknowledgments

Special thanks to Huawei Technologies Co., Ltd. for providing us with valuable experimental resources and conditions, which enabled this experiment to proceed smoothly. At the same time, we would like to express our special thanks to Li’an Li from Huawei Technologies Co., Ltd., who has provided us with great assistance in experimental design and data analysis. His professional knowledge played a crucial role in the success of this study.

Conflicts of Interest

The authors declare no conflicts of interest.

Appendix A

Prior to conducting the deformation detection experiment, continuous observations of the observation scene (where no deformation occurred) were performed 256 times to obtain the echo data, with intervals of 2.5 ms. After imaging processing, 256 SAR images of the target area were generated. The phase STD for each pixel in the imaging was calculated over the time series, and a statistical histogram was created, as illustrated in Figure A1.
Figure A1. Standard Deviation of the phase noise for each pixel.
Remotesensing 17 01129 g0a1
From the statistical results, it can be observed that the phase noise standard deviation of the majority of pixels within the observation scene is less than 0.3 rad. Phase noise can introduce measurement errors in deformation, which consistent with the relationship described in Equation (1) of the main text. Under the experimental design presented in this study, the system’s deformation monitoring error is calculated to be approximately 1.43 mm. However, the primary objective of this experiment is to validate the feasibility of the theoretical framework; thus, a displacement increment of 2 mm was selected. On one hand, this increment exceeds the detection limit of 1.43 mm, ensuring that the deformation signal can be clearly detected without being obscured by phase noise. Additionally, the choice of an integer increment facilitates experimental design. On the other hand, the phase change induced by a 2 mm deformation is approximately 0.42 rad, which is significantly less than 2π, thereby avoiding issues related to phase wrapping. In fact, both smaller and larger deformations can significantly affect deformation detection. When the deformation value is small, the deformation signal may be obscured by noise, rendering the corresponding deformation undetectable. Conversely, when the deformation value is excessively large, phase wrapping issues may arise, which can also impact the accuracy of deformation detection. Additionally, during data processing, the EPC principle was employed, allowing the separated transmission and reception mode to be treated as a single-site operation mode. Consequently, the altitude differences between the CBSs do not influence the accuracy of deformation monitoring.

References

  1. Tan, D.K.P.; He, J.; Li, Y.; Bayesteh, A.; Chen, Y.; Zhu, P.; Tong, W. Integrated Sensing and Communication in 6G: Motivations, Use Cases, Requirements, Challenges and Future Directions. In Proceedings of the 2021 1st IEEE International Online Symposium on Joint Communications & Sensing (JC&S), Dresden, Germany, 23–24 February 2021; pp. 1–6. [Google Scholar]
  2. Liu, M.; Yang, M.; Zhang, Z.; Li, H.; Liu, F.; Nallanathan, A.; Hanzo, L. Sensing-Communication Coexistence vs. Integration. IEEE Trans. Veh. Technol. 2023, 6, 8158–8163. [Google Scholar] [CrossRef]
  3. Zhang, J.; Wang, X.; Fei, Z.; Liu, P.; Wang, R.; Xia, F. Physical Layer Security in Integrated Sensing and Communication Systems: Opportunities and Challenges. Mob. Commun. 2023, 3, 55–61. [Google Scholar] [CrossRef]
  4. Wang, Z.; Liu, Z.; Hao, S.; Chen, X.; Zhang, R. OTFS Waveform Design Based on WFRFT for Integrated Sensing and Communication. In Proceedings of the 2023 IEEE/CIC International Conference on Communications in China (ICCC), Dalian, China, 10–12 August 2023; pp. 1–6. [Google Scholar]
  5. Zhang, Z.; Xiao, Y.; Ma, Z.; Xiao, M.; Ding, Z.; Lei, X.; Karagiannidis, G.K.; Fan, P. 6G Wireless Networks: Vision, Requirements, Architecture, and Key Technologies. IEEE Veh. Technol. Mag. 2019, 3, 28–41. [Google Scholar] [CrossRef]
  6. Liu, Y.; Zhang, G.; Xu, L.; Sun, S. Towards 6G: Integrated sensing and communication. Appl. Electron. Tech. 2023, 5, 30–34. [Google Scholar] [CrossRef]
  7. Zhu, G.; Li, Y.; Chen, Y.; Chai, S.; Shi, Q.; Luo, Z. Global Competitive Situation of 6G Key Technology R&D and China’s Countermeasures. Strateg. Study CAE 2023, 6, 9–17. [Google Scholar] [CrossRef]
  8. Zhou, W.; Zhang, R.; Chen, G.; Wu, W. Integrated Sensing and Communication Waveform Design: A Survey. IEEE Open J. Commun. Soc. 2022, 3, 1930–1949. [Google Scholar] [CrossRef]
  9. Zhang, R.; Shim, B.; Yuan, W.; Renzo, M.D.; Dang, X.; Wu, W. Integrated Sensing and Communication Waveform Design with Sparse Vector Coding: Low Sidelobes and Ultra Reliability. IEEE Trans. Veh. Technol. 2022, 4, 4489–4494. [Google Scholar] [CrossRef]
  10. Xiao, Z.; Zeng, Y. Full-Duplex Integrated Sensing and Communication: Waveform Design and Performance Analysis. In Proceedings of the 2021 13th International Conference on Wireless Communications and Signal Processing (WCSP), Changsha, China, 20–22 October 2021; pp. 1–5. [Google Scholar]
  11. Liu, Y.; Liao, G.; Xu, J.; Yang, Z.; Zhang, Y. Adaptive OFDM Integrated Radar and Communications Waveform Design Based on Information Theory. IEEE Commun. Lett. 2017, 10, 2174–2177. [Google Scholar] [CrossRef]
  12. Xiao, Z.; Zeng, Y. Waveform Design and Performance Analysis for Full-Duplex Integrated Sensing and Communication. IEEE J. Sel. Areas Commun. 2022, 6, 1823–1837. [Google Scholar] [CrossRef]
  13. Yuan, W.; Wei, Z.; Li, S.; Yuan, J.; Ng, D.W.K. Integrated Sensing and Communication-Assisted Orthogonal Time Frequency Space Transmission for Vehicular Networks. IEEE J. Sel. Top. Signal Process. 2021, 6, 1515–1528. [Google Scholar] [CrossRef]
  14. Hieu, N.Q.; Hoang, D.T.; Luong, N.C.; Niyato, D. iRDRC: An Intelligent Real-Time Dual-Functional Radar-Communication System for Automotive Vehicles. IEEE Wirel. Commun. Lett. 2020, 12, 2140–2143. [Google Scholar] [CrossRef]
  15. Wang, X.; Fei, Z.; Zhang, J.A.; Huang, J.; Yuan, J. Constrained Utility Maximization in Dual-Functional Radar-Communication Multi-UAV Networks. IEEE Trans. Commun. 2021, 4, 2660–2672. [Google Scholar] [CrossRef]
  16. Jiang, W.; Wang, A.; Wei, Z.; Lai, M.; Pan, C.; Feng, Z.; Liu, J. Improve Sensing and Communication Performance of UAV via Integrated Sensing and Communication. In Proceedings of the 2021 IEEE 21st International Conference on Communication Technology (ICCT), Tianjin, China, 13–16 October 2021; pp. 644–648. [Google Scholar]
  17. Zhang, K.; Shen, C. UAV Aided Integrated Sensing and Communications. In Proceedings of the 2021 IEEE 94th Vehicular Technology Conference (VTC2021-Fall), Norman, OK, USA, 27–30 September 2021; pp. 1–6. [Google Scholar]
  18. Wu, Q.; Xu, J.; Zeng, Y.; Ng, D.W.K.; Al-Dhahir, N.; Schober, R.; Swindlehurst, A.L. A Comprehensive Overview on 5G-and-Beyond Networks with UAVs: From Communications to Sensing and Intelligence. IEEE J. Sel. Areas Commun. 2021, 10, 2912–2945. [Google Scholar] [CrossRef]
  19. Hu, Y.; Tang, L.; Zhuo, X.; Li, Z.; Wu, W.; Zhao, Y.; Bu, Z. Imaging Based on Communication-Assisted Sensing for UAV-Enabled ISAC. In Proceedings of the 2023 IEEE 98th Vehicular Technology Conference (VTC2023-Fall), Hong Kong, 10–13 October 2023; pp. 1–5. [Google Scholar]
  20. Zhou, L.; Gui, S.; Li, L.; Tian, Z. Bistatic OFDM ISAR Imaging Method for Non-cooperative Moving Target in ISAC Area. In Proceedings of the 2023 IEEE 11th Asia-Pacific Conference on Antennas and Propagation (APCAP), Guangzhou, China, 22–24 November 2023; pp. 1–2. [Google Scholar]
  21. Wang, C.; Li, Y.; Li, Z.; Zeng, K.; He, J.; Wang, G. A 3D imaging method for future communication and imaging integrated terminal. In Proceedings of the 2021 CIE International Conference on Radar (Radar), Haikou, China, 15–19 December 2021; pp. 774–777. [Google Scholar]
  22. Liu, F.; Cui, Y.; Masouros, C.; Xu, J.; Han, T.X.; Eldar, Y.C.; Buzzi, S. Integrated Sensing and Communications: Toward Dual-Functional Wireless Networks for 6G and Beyond. IEEE J. Sel. Areas Commun. 2022, 6, 1728–1767. [Google Scholar] [CrossRef]
  23. Xie, C. Research of Resources Allocation and Handover Technique Based on MIMO Ultra Dense Heterogeneous Network. Ph.D. Thesis, School of Microelectronics and Communication, Engineering of Chongqing University, Chongqing, China, 2018. [Google Scholar]
  24. Wei, Z.; Qu, H.; Wang, Y.; Yuan, X.; Wu, H.; Du, Y.; Han, K.; Zhang, N.; Feng, Z. Integrated Sensing and Communication Signals Toward 5G-A and 6G: A Survey. IEEE Internet Things J. 2023, 13, 11068–11092. [Google Scholar] [CrossRef]
  25. Tigrek, R.F.; De Heij, W.J.A.; Van Genderen, P. OFDM Signals as the Radar Waveform to Solve Doppler Ambiguity. IEEE Trans. Aerosp. Electron. Syst. 2012, 1, 130–143. [Google Scholar] [CrossRef]
  26. Wang, W.-Q. Mitigating Range Ambiguities in High-PRF SAR With OFDM Waveform Diversity. IEEE Geosci. Remote Sens. Lett. 2013, 1, 101–105. [Google Scholar] [CrossRef]
  27. Cui, Y.; Jing, X.; Mu, J. Integrated Sensing and Communications Via 5G NR Waveform: Performance Analysis. In Proceedings of the ICASSP 2022—2022 IEEE International Conference on Acoustics, Speech and Signal Processing (ICASSP), Singapore, 23–27 May 2022; pp. 8747–8751. [Google Scholar]
  28. Li, P.; Guo, X. Key Technologies and Application of ISAC. ZTE Technol. J. 2023, 2, 72–78. [Google Scholar] [CrossRef]
  29. Zheng, Y. Research on OFDM-based Radar Communication Sharing Method. Master’s Thesis, Information and Communication Engineering, Harbin Engineering University, Harbin, China, 2023. [Google Scholar]
  30. Hu, C.; He, Q.; Tian, W.; Deng, Y.; Dong, X. A performance analysis of typical imaging algorithms in Ground-Based Synthetic aperture radar. In Proceedings of the 2017 XXXIInd General Assembly and Scientific Symposium of the International Union of Radio Science (URSI GASS), Montreal, QC, Canada, 19–26 August 2017; pp. 1–4. [Google Scholar]
  31. Zhang, W.; Li, C.; Shi, Y.; Wang, H.; Li, H.; Shang, Y.; Zhou, M. A new portable 2D ground-based synthetic aperture radar system for micro-deformation monitoring and SAR imaging. In Proceedings of the 2023 35th Chinese Control and Decision Conference (CCDC), Yichang, China, 20–23 May 2023; pp. 5338–5342. [Google Scholar]
  32. Zhang, X.; Ge, D.; Zhang, L.; Wang, Y.; Qin, K.; Li, M.; Guo, X. Subsidence deformation monitoring in KaiLuan mining area by D- InSAR technique. In Proceedings of the World Automation Congress 2012, Puerto Vallarta, Mexico, 24–28 June 2012; pp. 1–4. [Google Scholar]
  33. Wang, Y.; Hong, W.; Zhang, Y.; Lin, Y.; Li, Y.; Bai, Z.; Zhang, Q.; Lv, S.; Liu, H.; Song, Y. Ground-Based Differential Interferometry SAR: A Review. IEEE Geosci. Remote Sens. Mag. 2020, 1, 43–70. [Google Scholar] [CrossRef]
  34. Qi, Y.; Zhang, M.; Qi, L.; Tan, W.; Sun, J.; Huang, P.; Xu, W. Application of Ground-based Deformation Monitoring Radar in Mine Slope Monitoring-Taking a mine in Inner Mongolia as an example. In Proceedings of the 2019 IEEE International Conference on Signal, Information and Data Processing (ICSIDP), Chongqing, China, 11–13 December 2019; pp. 1–4. [Google Scholar]
  35. Herrera, G.; Tomas, R.; Lopez-Sanchez, J.M.; Delgado, J.; Mallorqui, J.J.; Duque, S.; Mulas, J. Advanced DInSAR analysis on mining area: La Union case study (Murcia, SE Spain). Eng. Geol. 2007, 90, 148–159. [Google Scholar] [CrossRef]
  36. Wang, J.; Xiao, S.; Liu, D.; Wang, W.; Peng, J. Research on application of GB-SAR in slope deformation monitoring. Sci. Surv. Mapp. 2021, 5, 58–65. [Google Scholar]
  37. Florentino, A.; Charapaqui, S.; Jara, C.; Milla, M. Implementation of a ground based synthetic aperture radar (GB-SAR) for landslide monitoring: System description and preliminary results. In Proceedings of the IEEE XXIII International Congress on Electronics, Electrical Engineering and Computing, Piura, Peru, 2–5 August 2016; pp. 1–6. [Google Scholar]
  38. Dick, G.J.; Eberhardt, E.; Cabrejo-Liévano, A.G.; Stead, D.; Rose, N.D. Development of an early-warning time-of-failure analysis methodology for open-pit mine slopes utilizing ground-based slope stability radar monitoring data. Can. Geotech. J. 2015, 4, 515–529. [Google Scholar] [CrossRef]
  39. Traglia, F.; Intrieri, E.; Nolesini, T.; Bardi, F.; Del Ventisette, C.; Ferrigno, F.; Frangioni, S.; Frodella, W.; Gigli, G.; Lotti, A.; et al. The ground-based InSAR monitoring system at Stromboli volcano: Linking changes in displacement rate and intensity of persistent volcanic activity. Bull. Volcanol. 2014, 2, 786. [Google Scholar] [CrossRef]
  40. Farina, P.; Leoni, L.; Babboni, F.; Coppi, F.; Mayer, L.; Coli, N.; Thompson, C. Monitoring engineered and natural slopes by ground-based radar: Methodology, data processing and case studies review. In Proceedings of the SHIRMS2012: Southern Hemisphere International Rock Mechanics Symposium, Sun City, South Africa; pp. 15–17.
  41. Huang, Q.; Yue, J.; Gong, J. Monitoring of Geheyan Dam deformation using GBInSAR technology GBInSAR. Adv. Sci. Technol. Water Resour. 2016, 36, 47–51. [Google Scholar]
  42. Gao, Z.; Jia, Y.; Liu, S.; Zhang, X. Experimental study of SFCW interferometry radar applied to vehicle-bridge coupling vibration monitoring of high-speed railway bridge. China Meas. Test 2023, 3, 135–141. [Google Scholar]
  43. Liu, L.; Meng, X.; Xie, W. Research on 5G Base Station to Satellite Earth Station Interference and Mitigation Methods. In Proceedings of the 2023 IEEE International Symposium on Broadband Multimedia Systems and Broadcasting (BMSB), Beijing, China, 14–16 June 2023; pp. 1–6. [Google Scholar]
  44. Zhang, H. Broadband Base Station Antenna and its MIMO Array Design. Master’s Thesis, School of Electronic and Information Engineering, Anhui University, Hefei, China, 2023. [Google Scholar]
  45. Xing, M.; Li, Z.; Bao, Z.; Wang, T. Study of Distributed Microsatellites Radar Space-Time-Frequency Imaging Method. J. Astronaut. 2005, B10, 70–76+82. [Google Scholar]
  46. Wang, L.; Xu, J.; HuangFu, K.; Peng, Y.N. Analysis and Compensation of Equivalent Phase Center Error in MIMO-SAR. Acta Electron. Sin. 2009, 12, 2688–2693. [Google Scholar] [CrossRef]
  47. Shan, W.; Wang, J.; Xiang, K.; Wang, J.; Guan, J. Research on uniform linear array output signal and beamforming. In Proceedings of the 2020 IEEE International Conference on Signal Processing, Communications and Computing (ICSPCC), Macau, China, 21–24 August 2020; pp. 1–4. [Google Scholar]
  48. Lellouch, G.; Mishra, A.; Inggs, M. Impact of the Doppler modulation on the range and Doppler processing in OFDM radar. In Proceedings of the 2014 IEEE Radar Conference, Cincinnati, OH, USA, 19–23 May 2014; pp. 0803–0808. [Google Scholar]
  49. Liang, D. Imaging Experimental System Design and Algorithm Implementation for MIMO Radar. Master’s Thesis, Master of Engineering, Harbin Engineering University, Harbin, China, 2015. [Google Scholar]
  50. Pasternak, Y.G.; Pendyurin, V.A.; Popov, I.V.; Fedorov, S.M. Extrapolated Virtual Antenna Array for Enhancement of Resolution of Uniform Linear Array. In Proceedings of the 2022 Photonics & Electromagnetics Research Symposium (PIERS), Hangzhou, China, 25–29 April 2022; pp. 1045–1052. [Google Scholar]
  51. Han, G.; Cong, W.; Zhu, B. An Azimuth High Resolution Algorithm Based on Virtual Array and Spatial Resampling. In Proceedings of the 2019 IEEE International Conference on Signal, Information and Data Processing (ICSIDP), Chongqing, China, 11–13 December 2019; pp. 1–4. [Google Scholar]
  52. Shang, T. Research and Implementation of LEO Satellite Random Access Technology for 5G. Master’s Thesis, School of Telecommunciations Engineering, XiDian University, Xi’an, China, 2023. [Google Scholar]
  53. Gao, Y. Research on Key Technologies of Post-Disaster Search and Rescue Equipment Based on Mobile Communication. Ph.D. Thesis, School of Electronic Engineering Bupt, Beijing University of Posts and Telecommunications, Beijing, China, 2022. [Google Scholar]
  54. Yao, J. A LTE-PRACH Receiver Design and Implementation Based on TMS320C6670. Electron. Eng. Prod. World 2012, 8, 35–37. [Google Scholar]
  55. Wu, G. SAR Imaging Simulation and Detection of Ship Targets on Sea Surface. Master’s Thesis, School of Physics and Electronic Information, Yan’an University, Yan’an, China, 2024. [Google Scholar]
  56. McCorkle, J.W.; Rofheart, M. Order N2 log(N) backprojector algorithm for focusing wide-angle wide-bandwidth arbitrary-motion synthetic aperture radar. In Proceedings of the SPIE—The International Society for Optical Engineering, Orlando, FL, USA, 17 June 1996. [Google Scholar]
  57. Munson, D.C.; O’Brien, J.D.; Jenkins, W.K. A tomographic formulation of spotlight-mode synthetic aperture radar. Proc. IEEE 1983, 8, 917–925. [Google Scholar] [CrossRef]
  58. Yang, L.; Kuang, L. Multi-core DSP-based Acceleration of SAR BP Algorithm Imaging. In Proceedings of the 2022 2nd International Conference on Computer Science, Electronic Information Engineering and Intelligent Control Technology (CEI), Nanjing, China, 23–25 September 2022; pp. 728–731. [Google Scholar]
  59. Sun, G.; Zhang, F. Convolutional Neural Network (CNN)-Based Fast Back Projection Imaging with Noise-Resistant Capability. IEEE Access 2020, 8, 117080–117085. [Google Scholar] [CrossRef]
  60. Sowjanya, L.S.L.; Kumar, P.K. Performance comparison of DAS and BP algorithms for Synthetic Aperture Radar Imaging. In Proceedings of the 2022 IEEE Microwaves, Antennas, and Propagation Conference (MAPCON), Bangalore, India, 12–16 December 2022; pp. 1726–1731. [Google Scholar]
  61. Wang, G.; Qi, F.; Liu, Z.; Liu, C.; Xing, C.; Ning, W. Comparison Between Back Projection Algorithm and Range Migration Algorithm in Terahertz Imaging. IEEE Access 2020, 8, 18772–18777. [Google Scholar] [CrossRef]
  62. Liu, B. Research on Motion Compensation and GPU Parallel Implemetion of BP Algorithm Imaging for Airborne SAR. Master’s Thesis, School of Electronic Science and Engineering, University of Electronic Science and Technology of China, Chengdu, China, 2014. [Google Scholar]
  63. Hu, X.; Wang, B.; Xiang, M.; Wang, Z. InSAR elevation inversion method based on backprojection model with external DEM. J. Radars 2021, 3, 391–401. [Google Scholar] [CrossRef]
  64. Zhu, B.; Liu, T. Performance Evaluation in Subaperture Measurement of Synthetic Aperture Radar. Ship Electron. Eng. 2016, 2, 46–49. [Google Scholar] [CrossRef]
  65. Lee, J.S.; Hoppel, K.W.; Mango, S.A. Intensity and Phase Statistics of Multilook Polarimetric and Interferometric SAR Imagery. IEEE Trans. Geosci. Remote Sens. 1994, 5, 1017–1027. [Google Scholar]
  66. Chan, Y.-K.; Koo, V.-C.; Hii, W.H.-H.; Lim, C.-S. A Ground-Based Interferometric Synthetic Aperture Radar Design and Experimental Study for Surface Deformation Monitoring. IEEE Aerosp. Electron. Syst. Mag. 2021, 10, 4–15. [Google Scholar] [CrossRef]
  67. Dong, J.; Dong, Y. Atmospheric artifact compensation for deformation monitoring with ground-based radar. Eng. Surv. Mapp. 2014, 10, 72–75. [Google Scholar] [CrossRef]
Figure 1. Geometry of the Equivalent Phase Center.
Remotesensing 17 01129 g001
Figure 2. Geometric diagram of a Uniform Linear Array.
Remotesensing 17 01129 g002
Figure 3. Flowchart of ground deformation detection based on a Communication Base Station.
Remotesensing 17 01129 g003
Figure 4. Synthetic Aperture Radar imaging principle of the Back Projection Algorithm.
Remotesensing 17 01129 g004
Figure 5. The relationship between the phase noise standard deviation, coherence coefficient, and number of looks.
Remotesensing 17 01129 g005
Figure 6. Phase distribution of the corner reflector under different numbers of looks.
Remotesensing 17 01129 g006
Figure 7. The influence of temperature, atmospheric pressure, and relative humidity on (a) atmospheric phase and (b) deformation monitoring.
Remotesensing 17 01129 g007
Figure 8. Observation geometry diagram.
Remotesensing 17 01129 g008
Figure 9. (a) Communication Base Station placement status. (b) Observation scenario.
Remotesensing 17 01129 g009
Figure 10. The illustration of the deformation target (a) The Deformation target scene. (b) The Deformation target. (c) The high-precision shift spiral micrometer. (d) The Line of Sight direction of the deformation target towards the Communication Base Station. (e) The Communication Base Station. (The red box and arrow represent a partial enlargement of the content inside the box).
Remotesensing 17 01129 g010
Figure 11. Imaging results for each scenario. (a) 0 mm displacement. (b) 2 mm displacement. (c) 4 mm displacement. (d) 6 mm displacement. (e) 8 mm displacement. (f) 10 mm displacement.
Remotesensing 17 01129 g011
Figure 12. Coherence coefficient distribution of the corner reflector targets.
Remotesensing 17 01129 g012
Figure 13. Differential Interferometric Phase for each scenario (the red box represents the locally amplified target area). (a) 2 mm displacement. (b) 4 mm displacement. (c) 6 mm displacement. (d) 8 mm displacement. (e) 10 mm displacement.
Remotesensing 17 01129 g013
Figure 14. Distribution of the multi-look phase and the single-look phase.
Remotesensing 17 01129 g014
Figure 15. Comparison of the detected Line of Sight deformation values with the actual Line of Sight deformation values.
Remotesensing 17 01129 g015
Table 1. Mean and STD of the phase under different numbers of looks.
L1481632
Mean(rad)−1.7175−1.7173−1.7171−1.7171−1.7173
STD0.07300.05800.04640.04170.0387
Table 2. The correspondence between the observation scenario markers and the displacement of the corner reflector.
ScenariosABCDEF
Displacement0 mm2 mm4 mm6 mm8 mm10 mm
Table 3. Errors in deformation detection using the CBS.
ScenariosBCDEF
Actual LOS Deformation Value (mm)−1.9770−3.9540−5.9310−7.9080−9.8850
Detected LOS Deformation Value (mm)−2.2802−4.2977−6.0963−7.8961−10.0894
Error (mm)−0.3032−0.3437−0.16530.0119−0.2044
Table 4. Comparison of CBSs, satellite SAR platforms, and GB-SAR platforms.
CharacteristicCBSsSatellite SAR PlatformsGB-SAR Platforms
CostLowExtremeHigh
FlexibilityHighLowMedium
ScalabilityHighLowMedium
Temporal Sampling RateExtremeLowHigh
Temporal DecorrelationSlightSevereModerate
Observation RangeModerateExtensiveModerate
AccuracyHighModerateHigh
Disclaimer/Publisher’s Note: The statements, opinions and data contained in all publications are solely those of the individual author(s) and contributor(s) and not of MDPI and/or the editor(s). MDPI and/or the editor(s) disclaim responsibility for any injury to people or property resulting from any ideas, methods, instructions or products referred to in the content.

