Abstract
Characterizing the size distribution of raindrops is fundamental to a variety of applications, including radar-based quantitative precipitation estimation. Atmospheric radars or wind profilers can be used to measure the drop size distribution (DSD) by analyzing the Doppler spectrum, which is inherently linked to raindrop velocity. This is achieved by mapping the Doppler spectrum from velocity space into diameter space directly. Since the general Gamma distribution is extensively used to model the DSD characteristic by numerous researchers in the meteorological community, it can be retrieved from the Doppler spectrum by applying appropriate relationships between drop diameter and terminal velocity. In this study, a retrieval method based on an approximate analytical solution was validated with both simulated data and very-high-frequency (VHF) radar observations, where the DSD followed the Gamma distribution. The advantage of using analytical solutions is their computational efficiency for the real-time processing of large data sets. In order to verify the applicability of this method, the mass-weighted mean drop diameter , which is associated with the parameters of the Gamma DSD, was used to present the results. Simulations showed that the retrieval method is effective for 0.7 mm 4 mm, with errors decreasing as the signal-to-noise ratio (SNR) increases. Furthermore, comparisons between radar data and simultaneous disdrometer observations revealed that the precipitation parameters retrieved from the VHF radar at 1.65 km maintain moderate correlations with the ground-based in situ instrument measurements. Whether for stratiform or convective precipitation, this retrieval method produced reasonable estimates of aloft precipitation parameters.
1. Introduction
The measurement of the amount of precipitation is one of the most important of the various physical quantities that are measured by meteorological and atmospheric radars. In contrast to in situ instruments, which provide direct measurements at specific locations, radar remote sensing offers the advantage of capturing indirect measurements over a larger spatial domain. This capability makes radar an indispensable tool for studying the spatial evolution of precipitation. Key physical parameters of precipitation, such as rainfall rate, liquid water content, and mass-weighted mean drop diameter, are closely related to the drop size distribution (DSD) of precipitation particles, which describes the number and size of raindrops within a given volume of air. These parameters can be obtained from the precise DSD derived from radar observations via the relationship between the basic radar quantities and the DSD, which is common to both meteorological and atmospheric radars.
Atmospheric radars are valuable tools for studying a wide range of atmospheric phenomena [1,2]. Unlike meteorological radars, which typically scan horizontally or at an angle, the antenna beams of atmospheric radars are generally pointed vertically and near the zenith. This orientation allows for detailed observations of atmospheric processes as they evolve with height. Therefore, various types of atmospheric radars, such as very-high-frequency (VHF) radars, ultra-high-frequency (UHF) radars, and wind profilers have been applied to study precipitation, although precipitation measurement is not a routine application of these radars. In addition, specific techniques for estimating precipitation parameters from vertically pointing radars have been proposed. Atlas et al. [3] presented a review and extension of earlier work on the retrieval of precipitation parameters and derived analytical expressions for the Doppler spectrum in terms of the DSD.
Bragg scattering from refractive index irregularities is the primary mechanism that enables atmospheric radars to measure winds in clear-air conditions. These radars are also sensitive to Rayleigh scattering from precipitation particles. Both scattering mechanisms depend on the radar’s operating wavelength, which means that radars at different frequency bands exhibit varying sensitivities to these processes. When using single-frequency Doppler radar to study precipitation in the atmosphere, a crucial consideration is the trade-off regarding the choice of wavelength. At the VHF band, the radar returns from atmospheric turbulence and precipitation particles are generally comparable. Consequently, the Doppler spectra obtained from VHF radars can simultaneously provide information about both air motion and precipitation [4]. Only under conditions of heavy rainfall, the scattered signal from precipitation is expected to be greater than the clear-air return for VHF radars [5]. However, choosing a radar with a relatively long wavelength that can detect air motion limits the range of precipitation particles that can be observed.
The characteristics of the DSD provide essential insights into the microphysics of rain, which are important for improving numerical weather models and understanding the microphysical processes involved in rain formation and evolution. Additionally, accurate knowledge of the DSD is vital for assessing the effects of rain on radio wave propagation, particularly for microwave and millimeter-wave communication links. Several theoretical probability density functions have been proposed to model the observed DSD, including the Gaussian function [6], Weibull distribution [7], and lognormal distribution [8]. Among these, the three-parameter Gamma distribution, introduced by Ulbrich [9] for describing the measured DSD on short time scales on the order of a few minutes, has been widely accepted to model the DSD in atmosphere. It has been the basis for retrieving the parameters of the model using polarimetric radar measurements [10,11], dual frequency wind profiling radar measurements [12,13], and satellite-based radars [14]. Although the Gamma distribution has been used extensively by numerous researchers to model the DSD characteristic, obtaining accurate DSD estimates from radar measurements still remains a challenging task.
The interaction between atmospheric dynamics and precipitation microphysics is a complex process. Accurate estimation of both dynamical and microphysical variables is essential for quantitative estimation of precipitation. For vertically pointing radars, it is required to extract the precipitation signal from the Doppler spectra which contain the DSD information inherently. However, they are also affected by several factors. The spectra are not only shifted by vertical air motion, but also broadened as a result of atmospheric turbulence and wind shear. The extent of these broadening effects depends on the radar antenna beamwidth and range resolution, and may also be influenced by the mean vertical wind velocity [15,16]. The presence of vertical air motion can be a significant source of error in the estimation of precipitation parameters [17]. For instance, an uncorrected mean vertical velocity of 1 m can lead to an error exceeding 100% in the estimated rainfall rate [18]. Regardless of the technique used to extract the precipitation signal, it is imperative to consider the Doppler spectra which are affected by vertical wind, finite antenna beamwidth, turbulence, and wind shear. These factors should be taken into consideration for precipitation measurements using radars.
The retrieval of DSD using atmospheric radars is complicated by the presence of atmospheric turbulence and vertical wind. The process typically involves separating the fall velocity of the precipitation particles from the air motion of the atmosphere. After removing the aforementioned effects, the raindrop size information can be obtained by directly mapping the true precipitation spectra from velocity space to diameter space. However, several different expressions have been proposed to relate drop diameter to terminal fall speed [19], leading to uncertainty in the DSD retrieval process. The retrieval method assumes a single valid relationship between fall speed and drop diameter, meaning that the selection of different expressions will produce varying DSD estimates. Moreover, distinguishing the signals from the overlapping spectra of precipitation and clear air, or echoes merging near the bright band, remains a challenge [20,21]. These may further complicate the estimation of precipitation parameters, making it difficult to obtain precise DSD using atmospheric radars.
Over the past few decades, various methods have been explored to retrieve DSD using vertically pointing radars with a single or multiple operating frequencies such as VHF and UHF. Among these methods are two general approaches used to remove the broadening effects from the observed precipitation spectrum. The first approach is to fit the observed Doppler spectrum, which is modeled by convolving a known turbulence spectrum and a raindrop spectrum, allowing for a more accurate retrieval of the DSD. The turbulence spectrum is often modeled with a Gaussian model, but it is also necessary to further assume a functional form for the DSD, such as exponential [22,23], Gaussian [6], or Gamma [24]. Wakasugi et al. [22] developed the direct method of nonlinear least squares fitting to derive atmospheric and precipitation parameters using a VHF radar. Similar techniques have been applied to other frequency bands [25]. The second approach is based on a general deconvolution without any a priori assumption of the shape of the distribution, and the raindrop spectrum is obtained by directly deconvolving the observed precipitation spectrum with the clear-air turbulence spectrum [26,27]. Schafer et al. [13] compared these two different analysis approaches and found that the deconvolution method generally performed better, but was sensitive to noise. Moreover, Pang et al. [28] estimated the DSD using the deconvolution method combined with the prepared lookup tables. The sans air motion model was introduced by Williams [29] to estimate the ambient air motion, the spectral broadening, and the DSD using only the precipitation portion of the Doppler velocity spectrum from UHF profiler observation. Other approaches have also been proposed, such as cluster analysis [30].
Fang et al. [31] derived a generalized analytical expression for the Doppler spectra of precipitation particles observed with a vertically pointed beam. This expression accounted for the spectral broadening mechanisms of mean wind, turbulence, particle oscillation/wobble, and the dispersion of particle terminal velocity. Due to the potential of the analytical expression approaches for processing large data sets in real-time operation, Chen et al. [32] derived the approximate equations to describe the relationship between the parameters of the Gamma DSD and the moments of the Doppler spectrum. In their formulation, the slope and shape parameters of the Gamma DSD were not independent [33]. While the DSD can be retrieved from the Doppler spectrum by applying the appropriate expressions, further validation of the retrieval methods is necessary to ensure their accuracy and reliability.
Validation radar-based retrievals of precipitation parameters is challenging due to the scarcity of aloft in situ measurements. Consequently, radar measurements, including those from meteorological radars [34], are often compared with ground-based observations. Rain gauges, which provide relatively accurate and reliable measurements of precipitation at ground level, are commonly used as a reference. Additionally, various disdrometers have been developed, and their performance in measuring the DSD has been shown to be quite consistent [35,36]. However, disdrometer measurements are not without error. Moreover, discrepancies may exist between natural DSDs and their model representations. For instance, the Gamma distribution may not adequately capture certain features of the DSD, particularly under conditions of heavy rainfall. In such cases, large drops tend to be more frequent at higher rainfall rates, often leading to a heavy-tailed distribution [37].
In this study, the Gamma DSD retrieval method proposed by Chen et al. [32] was validated through both numerical simulation and experimental observations from a VHF radar and a disdrometer. The following section outlines the theoretical background and describes the retrieval method in detail. Section 3 presents the validation results of the precipitation parameter retrieval using simulated data. In Section 4, the experimental results from the Chung-Li VHF radar are compared with data from a co-located disdrometer. Finally, the discussion and summary are provided in Section 5.
2. Theoretical Background and Retrieval Method
The Rayleigh approximation can be applied to calculate the scattering properties of spherical particles. For the radar observation of precipitation, the wavelength is generally chosen to ensure the effectiveness of the approximation. The radar cross section is proportional to the sixth power of the particle diameter D. Thus,
where is the wavelength and is the scatter dielectric factor. For the precipitation particles having a size distribution of diameters in a unit volume, the radar reflectivity can be expressed by
where is the DSD, and are the minimum and maximum values of the raindropo diameter, respectively, and Z is called the radar reflectivity factor, which is defined as
Characterization of the DSD is essential for the radar-based precipitation measurement. While various functions have been proposed to represent the DSD, the general gamma distribution is the most popular one, which is expressed as [9]
where () is the intercept parameter of the distribution, is a dimensionless shape parameter, and () is the slope parameter. In Equation (4), becomes an exponential function by setting . In addition, by using the complete gamma function, the radar reflectivity can be expressed as
and the mass-weighted mean drop diameter is given by
In Doppler spectra observed with a vertically pointing radar, the frequency shift of precipitation particle is caused by both their fall velocity and the vertical air velocity. The power received at a frequency shift corresponds to the measurement of the radar reflectivity of the particles giving rise to that shift. For scattering by distributed particles, the radar reflectivity is the product of the radar cross section and the concentration. Therefore, the observed spectrum contains information about the Doppler velocity and size distribution of the precipitation particles. In stationary air, the normalized Doppler spectrum of precipitation is represented by [38]
where v is the terminal velocity of the precipitation particle.
For estimation of the DSD from the Doppler spectrum obtained from a vertically pointing radar, the relationship between the terminal velocity and diameter is indispensable. Although no simple form is valid for the entire range of raindrop sizes, the relation can be represented as follows [3]:
The error from Equation (8) is less than 2% compared to the actual measurement in the range of the drop diameter 0.6 mm 5.8 mm. Note that the terminal velocity changes according to the atmospheric density, and the factor for density correction should be applied to the right-hand side of Equation (8), where and are the atmospheric densities at the altitude of observation and at sea level, respectively.
From the aforementioned theoretical basis for precipitation observation with a single vertically pointing radar, the reflectivity-weighted mean terminal velocity and spectral width of the precipitation spectrum can be derived as
and
respectively. Equations (9) and (10) suggest that and are independent of and can determine and . Consequently, can be determined from Equation (5), allowing the three parameters of a Gamma DSD to be obtained from the three radar-measured quantities: Z, , and .
In addition to the least squares method, Chen et al. [32] derived a set of approximate analytical equations for the estimation of and from and .
where
Therefore, the values of and can be calculated directly from Equations (11) and (12) once and are obtained. The error caused by the approximate equations can be reduced by using ground truth data such as disdrometer measurements [32].
Considering that raindrops are in the real atmosphere, the spectrum of precipitation is smeared by various effects, including turbulence and beam broadening. These effects are influenced by the meteorological condition and radar system parameters such as beamwidth and pulse width. Additionally, these broadening processes also affect the air velocity spectrum in similar ways. For example, turbulence within the radar volume induces random motion of precipitation particles, leading to broadening of the observed spectrum. If raindrops of any size instantaneously respond to air motion, the radar-observed Doppler spectrum of precipitation can be expressed as [22]
where is the echo power associated with precipitation, ⊗ represents the convolution operator, and is the normalized spectrum of clear-air echo with vertical wind w. The probability distribution of clear-air velocity is assumed to have a Gaussian form; thus,
where is its spectral width, and is the mean vertical wind velocity. Therefore, the observed mean Doppler velocity and spectral width of precipitation are given below:
3. Validation of Precipitation Parameter Retrieval Using Simulated Data
In order to evaluate the applicability of the retrieval method using the approximate equations mentioned in the previous section, we analyzed the error in the estimating the mass-weighted mean drop diameter with simulated data. In the simulation, and were both set from 0.3 to 30 with an increment of 0.3, and was set to . Figure 1 shows the input domain of the simulation, the horizontal and vertical axes represent the slope and shape parameters, respectively, and the color scales indicate the resultant . For each combination of and , we generated the corresponding Doppler spectrum according to Equations (7) and (8) with the Gamma DSD. Additionally, Atlas et al. [3] noted that the terminal velocity of raindrops approaches an asymptote of 9.2 m for diameters greater than 6 mm. To create a more realistic Doppler spectrum, we further limited the maximum terminal velocity to this speed value. As a result, a total of 10,000 unique Doppler spectra of precipitation were produced.
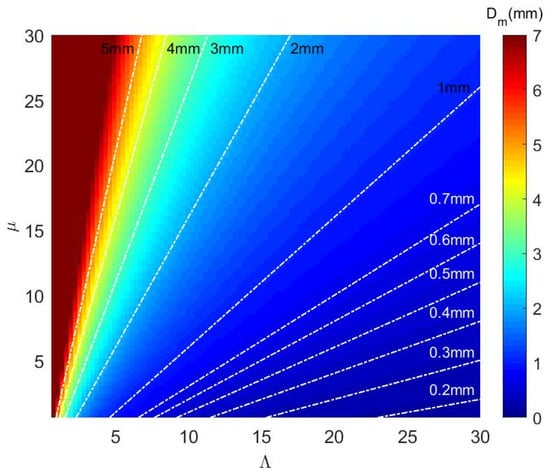
Figure 1.
Input domain of the simulation. The horizontal and vertical axes represent the slope parameter () and shape parameter (), respectively. and are both from 0.3 to 30 with an increment of 0.3, and the color scales are the resultant .
To account for the effect of air motion, the pure precipitation Doppler spectra were convoluted with a normalized spectrum of clear-air echo , which was assumed to follow a Gaussian form with zero mean vertical wind and m , as described in Equations (14) and (15). The resultant spectra were then converted to the time domain using the inverse Fourier transform, after which Gaussian random noise was added based on the given signal-to-noise ratio (SNR). The SNRs were set as 10 dB, 15 dB, 20 dB, and 25 dB in this study. This process yielded the simulated raw time series radar data. Subsequently, the means and spectral widths were estimated from the simulated raw data through spectrum analysis. Assuming that the spectral moments for the clear-air echo were measured precisely (as they were known in simulation), the reflectivity-weighted mean terminal velocity, , and spectral width, , of the precipitation spectrum were calculated according to Equations (16) and (17). Finally, the estimated and were obtained from Equations (11) and (12).
For each combination of , , and SNR, 100 realizations were generated each with an independent random noise series. Subsequently, the retrievals were performed for each individual Doppler spectra, and the error statistic for the retrieved parameters was calculated. Figure 2 shows the mean error of the retrieved as a percentage for different SNRs. The horizontal and vertical axes represent the input and values, respectively, with dashed lines corresponding to those in Figure 1. Positive and negative errors indicate that the retrieved were overestimated and underestimated, respectively. As illustrated, the distribution of the errors shown in Figure 2 was related to the magnitude of [39].
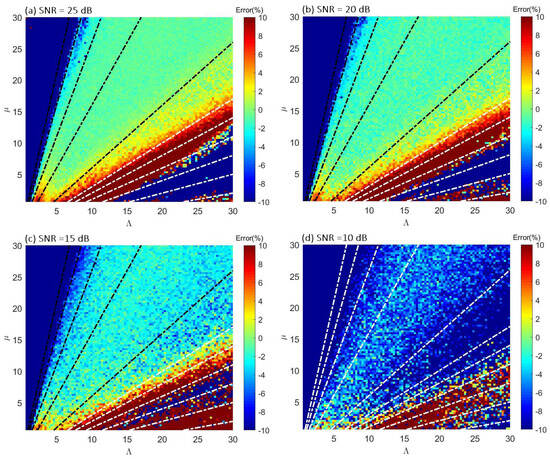
Figure 2.
Mean percentage errors of the retrieved for the conditions of different SNRs. The horizontal and vertical axes represent the input and , respectively, and the dash lines are the same as in Figure 1. The color scales represent the percentage errors.
For all SNRs, it appears that was underestimated severely when the true was greater than 4 mm. This tendency to underestimate was attributed to the setting of the maximum terminal velocity (9.2 m ) for the larger-diameter raindrops, and only a single valid diameter–velocity relationship expression (Equation (8)) was adopted in retrieval. This effect was more obvious when the input was larger. On the other hand, the errors also became larger for mm. In addition, the distribution of errors shown in the figure was more complicated in accordance with SNR when became smaller. As mentioned previously, the radar cross section is proportional to the sixth power of the particle diameter and fourth power of the radar-operated frequency. Therefore, VHF radars are insensitive to small precipitation particles. Small droplets are difficult to detect in the presence of noise. As a result, a noticeable retrieval error is induced when is small. In addition to the clear-air signal having a finite spectral width and potentially dominating the precipitation echo at fall velocities corresponding to small drops, it is typically limited in resolving drop sizes smaller than 1 mm in diameter using VHF radars [26].
Since and were derived from Equations (11) and (12), the errors introduced by these asymptotic approximation to the analytic equations were inherently included in the retrieval process. According to the analysis made by Chen et al. [32], these errors can be significant for small and . Consistent with this analysis, Figure 2 also shows that larger errors occurred in the regions where and are low. However, this type of error may be mitigated for real data, as mentioned by Chen et al. [32]. Moreover, the estimation of deteriorated at a lower SNR. Despite the influence of several factors, the errors in derived from the simulated data were less than for 0.7 mm 4 mm. These results indicated that the retrieval method is applicable for estimating precipitation parameters using VHF radars.
4. Experimental Results
4.1. Two-Dimensional Video Disdrometer (2DVD)
In this study, a 2DVD was employed to collect the ground-based data of raindrop properties at the radar site. As the raindrops fell through the virtual measuring area of the 2DVD, the created shadows were detected by video cameras. The signals were then processed to determine the size and oblateness of each drop. The resolution of the drop diameter measurement was approximately 0.2 mm, which was determined by the pixel size of the camera. Additionally, the time taken for a raindrop to fall from the first light sheet to the second was used to calculate its fall velocity, as the distance between the two parallel light planes was known. The observation with 2DVD enabled the collection of detailed information about precipitation particles, including the DSD. For more descriptions of the 2DVD system, see Kruger and Krajewski [40].
Various physical quantities and parameters of precipitation can be derived from the DSD without any assumption about the form. In addition to direct calculation with the disdrometer data, it is convenient to use the moments of measured DSD to express the estimators of them. For example, and . The general formula of the nth moment of the DSD is defined as
For a Gamma DSD, the nth moment of the DSD can be expressed as
As a result, a combination of three moments can be used to estimate the three parameters , , and [19,41]. In this study, we used the three lower-order moments in the estimation [42,43,44].
Figure 3a presents the time series of the rainfall rate with 1 min integration time, obtained from the 2DVD observation collected between 2200 LT on June 22 and 1800 LT on 23 June 2019. As shown, the rainfall rates remained below 10 mm , except for the time periods around 06:30 LT and after 13:00 LT on June 23. To further classify stratiform and convective rain types, the generalized intercept parameter , which is related to the ratio of rain water content to , was calculated. The scatter plot of and for this precipitation event is shown in Figure 3b. Using the classification scheme proposed by Bringi et al. [45], the data were separated by rain type, with convective rain represented by red dots in this figure. These convective periods are also marked by red circles in Figure 3a. As presented, the rainfall rates during the convection were typically higher (>10 mm ) and exhibited greater variability compared to the stratiform rain.
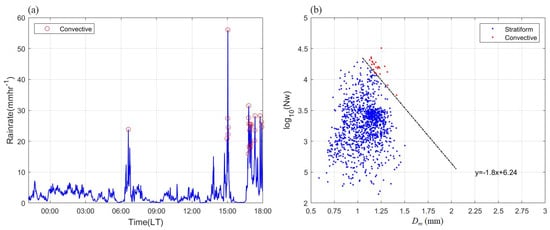
Figure 3.
Observation results with the 2DVD collected from 2200 LT on June 22 to 1800 LT on June 23 in 2019, with a 1 min integration time resolution. (a) The time series of rainfall rate. (b) The scatter plot of and . The types of precipitation are classified as stratiform and convective.
To analyze and correct the errors introduced by the approximation equations, the DSD data measured by the 2DVD were utilized. The moments of the DSDs were computed using Equation (18), and three parameters , , and were then estimated from the combination of three moments, assuming a Gamma DSD. The estimated parameters were substituted into Equations (9) and (10) to derive the corresponding mean terminal velocity, , and spectral width, . Subsequently, and were recalculated with the Equations (11) and (12). Figure 4 illustrates the differences (errors) in and as percentages relative to the original disdrometer measurement. It is evident that the errors were particularly large for small values of and . As mentioned by Chen et al. [32], these large errors may be associated with higher terminal velocities of precipitation particles. Further, the error can be approximately corrected using a second-order polynomial fit of and .
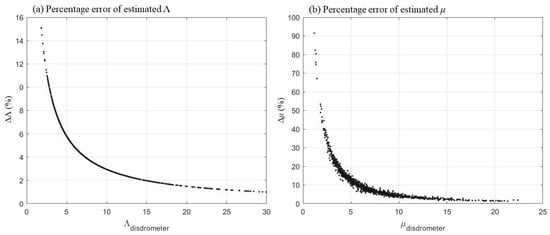
Figure 4.
Scatter plots of the errors (a) and (b) in percentages induced by the approximation equations, relative to the original disdrometer measurement.
Figure 5 presents the curves of the second-order polynomial fit results from the 2DVD data () and Chen et al. [32] (). As shown in the figure, the two curves are nearly identical, despite slight differences in their coefficients. It should be emphasized that we used only short-term data, and the resulting curve closely matches that presented by Chen et al. [32], which was based on long-term data (82 days). This suggests that the correction curve may remain stable and could potentially be used as an empirical formula for other precipitation events where disdrometer observations are unavailable. We used this formula to correct the retrieved results from the Chung-Li VHF radar observations. However, applying this formula in different geographical regions requires further validation.
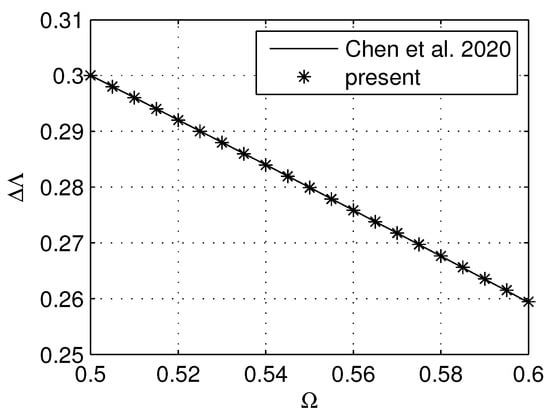
Figure 5.
Curves of the second-order polynomial fit of and from the present 2DVD data () and Chen et al. [32] (), which were used to correct the retrieved and from the VHF radar data.
4.2. Chung-Li VHF Radar
The Chung-Li VHF radar (24.9°N, 121°E) is located on the campus of the National Central University in Taiwan. It operates at 52 MHz and was used to estimate precipitation parameters in this study. The radar system is equipped with three different phased array antennas, each serving specific purposes [46,47]. For the present analysis, the stratosphere and troposphere arrays were employed, and the beamwidth for vertically pointed beam was 7.4°. A 128-point fast Fourier transform was applied to the in-phase and quadrature-phase time series data to obtain the raw Doppler spectrum, and four raw spectra were averaged incoherently for further analysis. It is important to note that both precipitation and clear-air echoes contribute to the Doppler spectrum observed by the VHF radar. Precipitation echoes essentially have negative velocities relative to the speed of the atmosphere, while the velocities of the clear-air echoes may show either positive (updraft) or negative (downdraft) velocities. Due to their different mean radial velocities, these two types of echoes can be distinguished and separated in the spectral domain in general. However, the spectra can become quite complex in the presence of external interference and clutter [48]. In this study, we manually inspected all spectra and discerned precipitation and clear-air echoes. Once their extents of the Doppler velocities were identified, two Gaussian functions were used to fit the spectra. From these fits, the echo powers, mean velocities, and spectral widths of both precipitation and clear-air echoes were estimated. The height–time intensity plots of these resultant parameters during the precipitation event are presented in Figure 6. The time resolution of the data was 1 min, with a height resolution of 150 m and a lowest detectable height of 1.65 km.
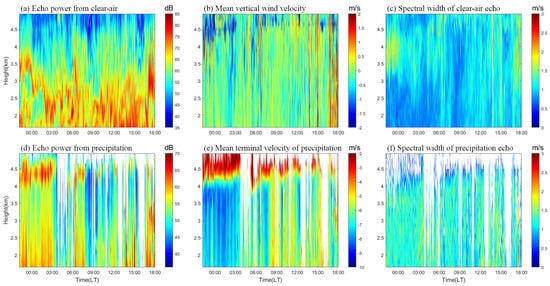
Figure 6.
Height–time intensity plots of the echo power (left panels), vertical mean velocity (central panels), and spectral width (right panels) of the clear-air echoes (top panels) and precipitation echoes (bottom panels), respectively. They were obtained from the Doppler spectra of the VHF radar, and the time periods are the same as in Figure 3a.
The upper panels in Figure 6 present the height–time intensity plots of the echo power from clear-air, mean vertical wind velocity (), and spectral width of the clear-air echoes (), respectively. As shown, the stronger atmospheric echoes were primarily concentrated below 4 km in height, corresponding to the spatial distribution and variability of water vapor. Additionally, the mean vertical wind velocities exhibited random fluctuations during the precipitation event with downdrafts and updrafts. Notably, an intermittent updraft appeared after 13:00 LT, with its height extending from near the surface to above 4 km. This pattern closely aligned with the timing of convection, as indicated in Figure 3b. In addition, the spectrum width tended to broaden as the mean vertical wind velocity increased on the whole, suggesting a relationship between stronger vertical motions and the broadening of the Doppler spectrum.
The lower panels in Figure 6 present the height–time intensity plots of the echo power from precipitation, reflectivity-weighted mean terminal velocity of raindrops (), and spectral width of the precipitation echoes (), respectively. Precipitation echoes were visible for most of the observation period, particularly at lower altitudes, indicating nearly continuous rainfall during this event. Stronger precipitation echoes were observed after 13:00 LT, aligning with the higher rainfall rates recorded by the 2DVD, as shown in Figure 3b. Additionally, a distinct bright band structure, characterized by intense echo power, occurred in the height range of approximately 4 to 4.8 km before 03:00 LT. Afterward, the bright band structure appeared intermittently and gradually diminished in prominence.
The bright band is a result of enhanced echoes caused by the melting of precipitation particles from ice crystals to liquid water, which is a characteristic phenomenon in stratiform precipitation. Within the melting layer, the precipitation particles experienced a rapid acceleration, as emerged from the changes in mean terminal velocity with height shown in Figure 6e. Furthermore, the spectral widths of precipitation echoes were generally broader than those of clear-air echoes and tended to narrow above the melting layer in the presence of bright bands. Based on the spatial and temporal distribution characteristics of clear-air and precipitation particles shown in this figure, along with the corresponding results from the 2DVD observations shown in Figure 3, we concluded that this precipitation event was stratiform before 3:00 LT, convective after 15:00 LT, and mixed-type between 3:00 and 15:00 LT.
As the same process used for the simulated radar data, the parameters and were derived from the reflectivity-weighted mean terminal velocity and spectral width of the precipitation spectrum with Equations (11) and (12). Further, the mass-weighted mean drop diameter was then calculated according to Equation (6). Figure 7 displays the radar-retrieved results during the experiment for the heights ranging from 1.65 km to 3.75 km. For comparison, the obtained from the 2DVD measurements are also presented. Although there were relatively large variations, the radar retrieval results at lower altitudes aligned with the magnitude and general trend of the 2DVD data measured on the ground. However, the radar-retrieved at higher altitudes were significantly larger than the 2DVD results and exhibited greater fluctuations, particularly before 04:00 LT. This discrepancy may be due to the variation in with altitude, which is challenging to confirm using ground-based data alone. The variation in with altitude reflects the change in the DSD. Kobayashi and Adachi [49] also reported a significant altitude variation in the observed aloft DSD during convective rain, when using a wind profiler. To further validate the radar-retrieved for different precipitation types, we compared the 2DVD measurements with results from only the lowest detectable height of the Chung-Li VHF radar, using two hours of data in the subsequent analysis. Specifically, one hour of data is during stratiform precipitation and another hour is during convective precipitation.
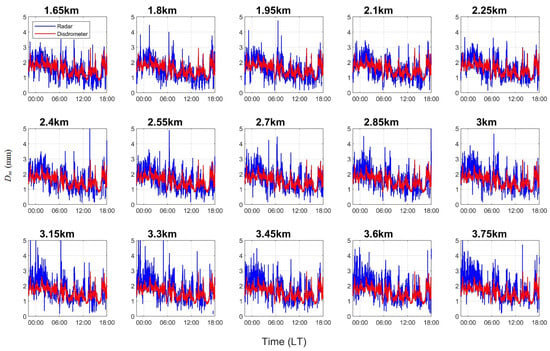
Figure 7.
The time series of the VHF radar-retrieved during the experiment for various heights, ranging from 1.65 km to 3.75 km. The red lines represent measured by the 2DVD on the ground for comparison.
Figure 8 shows the comparisons of the results from the radar and 2DVD for two time periods (a) 01:10–02:10 LT and (b) 16:30–17:30 LT, which are classified as stratiform and convective precipitation, respectively. The left panels display the time series of radar-retrieved at 1.65 km and 2DVD measurements on the ground. In case (a), varied between 1.4 and 2.9 mm, while in case (b), it varied between 0.5 and 3.0 mm. Considering the time required for the aloft raindrops to reach the ground, we estimated the delayed time by finding the maximum of the cross-correlation functions between the radar and 2DVD data. The radar data, after being time-shifted to account for this delay, are also shown in this figure. As expected, the time-shifted radar-retrieved time series closely resembles the 2DVD data in both magnitude and pattern. The delayed times for (a) and (b) were approximately 4 min and 6 min, respectively. The longer delay time in the convective precipitation was likely due to stronger updrafts.
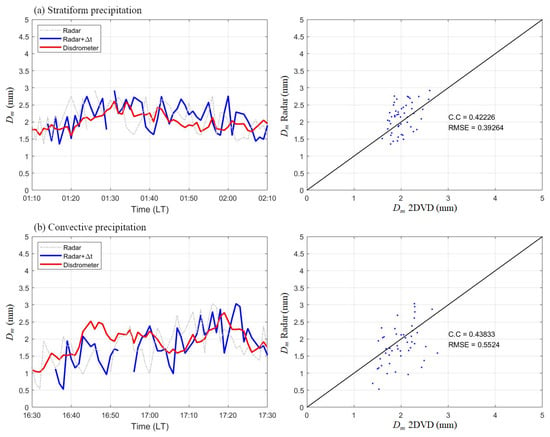
Figure 8.
Comparisons of the 2DVD measurement and radar-retrieved at 1.65 km for the cases of (a) stratiform precipitation and (b) convective precipitation, respectively. The left and right panels show the time series of and the correlation between 2DVD measurement and radar-retrieved , respectively.
The right panels in Figure 8 show the correlations between the estimated from the 2DVD measurements and the radar retrieval after time-shifting. Despite potential changes in the DSDs as raindrops fall, the resultant correlation coefficients remained similar, at 0.422 and 0.438 for cases (a) and (b), respectively. However, the root mean square error (RMSE) for case (b) was approximately 30% larger than that for case (a). This suggests that in convective precipitation, stronger vertical winds not only caused raindrops to take longer to reach the ground but also increased the uncertainty in the radar-retrieved . The impact of vertical wind on the precipitation parameter retrieval has been discussed extensively by Chen et al. [32]. In this study, the retrieved results for stratiform precipitation were relatively stable, likely due to the calmer atmospheric conditions. Nevertheless, this retrieval method yielded reasonable aloft precipitation parameters, maintaining moderate correlations with ground observations, regardless of the precipitation type.
5. Discussion and Summary
The DSDs aloft were retrieved from the echo power (), reflectivity-weighted mean terminal velocity (), and spectral width () of the Doppler spectrum associated with precipitation echoes observed by a vertically pointed radar in this study. Due to the lack of proper calibration of the Chung-Li VHF radar, it was difficult to measure the radar reflectivity factor Z and accurately obtain the intercept parameter through Equation (5). As a result, our focus remained on the estimations of , , and from radar-measured and , particularly for the impact of noise in the retrieval. Figure 9 shows the scatter plots of values derived from the 2DVD and Chung-Li VHF radar under varying SNR conditions for the radar signals. The red dots in all panels represent the results from the original 2DVD measurement of drop size and velocity for rainfall rates exceeding 1 mm . The second-order polynomial fits to the data are shown as black solid curves. As presented, the relationship between and can be effectively characterized by the polynomial curves. Meanwhile, the Gamma distribution parameters and were obtained from the original drop size data, as discussed in Section 4.1. Using Equations (9) and (10), and were sequentially calculated, and the results are represented by the green dots. It should be noted that the green and red dots are in agreement in their distributions, both exhibiting second-order polynomial patterns that are similar to the patterns shown by Williams [29] for the ideal cases. This indicates that the precipitation particle diameter with Gamma distribution and its relationship to terminal velocity provide a robust representation of raindrop characteristics on the ground.
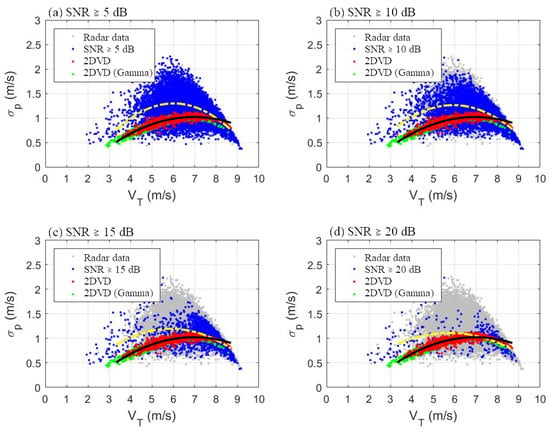
Figure 9.
Scatter diagrams of values for different SNRs of radar signals across all heights from 1.65 km to 3.75 km. The data obtained from the Chung-Li VHF radar and those after screening according to their SNRs are depicted with gray and blue dots, respectively. The red and green dots in all panels represent the original 2DVD measured data and the processed data with Gamma fits, respectively. The yellow and black curves show the second-order polynomial fits to blue and red dots, respectively.
Since the distribution patterns of versus provide insight into the performance of DSD retrieval from radar observations [32], we further investigated the correlations between radar-measured and under varying SNR conditions. The gray and blue dots represented the radar-measured and aloft, with the blue dots indicating the results after screening based on SNR. The yellow dashed lines represent the second-order polynomial fits to the blue dots. It was found that as the SNR increased from 5 dB to 20 dB, the overall distribution patterns of radar-measured and became increasingly similar to the ground-based 2DVD observations. In general, noise introduces variability in the estimations of and from the Doppler spectrum in actual observation [38]. The accuracy of the estimate is reduced due to the random nature of the noise. Consequently, the noise propagated into the retrieval of DSD and brought about a deterioration of the retrieved , , and , as vaguely revealed in the simulation results in Section 3. This suggests that the SNR of the radar signals is an important factor affecting the accuracy of this retrieval method.
In this study, the Gamma DSD retrieval method with an approximate analytical solution from vertically pointing VHF radar observations was validated. First of all, numerical simulations were conducted to assess the limitations and feasibility of the method. Pure precipitation Doppler spectra were generated from the set Gamma DSD, and time series data were produced by converting these spectra after convolution with a normalized spectrum of clear-air echoes. Reflectivity-weighted mean terminal velocity () and spectral width () were estimated from the simulated raw data after spectrum analysis. The Gamma distribution parameters, and , were derived from a set of approximate analytical equations. When compared with the given mass-weighted mean drop diameter (), the retrieval method proved to be applicable for 0.7 mm 4 mm. Although the analytic expressions are convenient for estimating precipitation particle parameters, the associated errors must be considered and can be corrected using an empirical formula derived from the existing 2DVD data.
Simultaneous observations were made using the Chung-Li VHF radar and a ground-based 2DVD from 2200 LT on 22 June to 1800 LT on 23 June 2019. The comparison results demonstrated that the precipitation parameters aloft can be successfully retrieved using the VHF radar, showing moderate correlations with the ground-based observations. This suggests that the retrieval method is applicable to VHF radars in general. However, the performance of the method may decline as the SNR decreases. To further study this problem, it would be advisable to consider the implementation of advanced signal processing methods to improve the estimation of spectral moments in lower-SNR conditions. Additionally, several factors, such as sensitivity to the precipitation particles and clear air, should be taken into consideration when applying this method to other radars operating at different frequency bands. Furthermore, it is necessary to carry out additional validations for different geographical regions and diverse climatic conditions.
Author Contributions
Conceptualization, M.-Y.C. and Y.-H.C.; methodology, M.-Y.C. and W.-S.J.; software, C.-L.S. and W.-S.J.; validation, M.-Y.C., W.-S.J. and Y.-H.C.; formal analysis, C.-L.S. and W.-S.J.; investigation, M.-Y.C. and Y.-H.C.; resources, C.-L.S.; data curation, C.-L.S.; writing—original draft preparation, M.-Y.C.; writing—review and editing, M.-Y.C. and Y.-H.C.; visualization, M.-Y.C. and W.-S.J.; supervision, Y.-H.C. and W.-N.C.; project administration, Y.-H.C. and W.-N.C.; funding acquisition, Y.-H.C. and W.-N.C. All authors have read and agreed to the published version of the manuscript.
Funding
This research was partially supported by the National Science and Technology Council of Taiwan (R.O.C.), under grants NSTC 111-2811-M-008-040.
Data Availability Statement
The data presented in this study are available on request from the corresponding author. The data are not publicly available due to funding restrictions.
Conflicts of Interest
The authors declare no conflicts of interest. The funders had no role in the design of the study; in the collection, analyses, or interpretation of data; in the writing of the manuscript; or in the decision to publish the results.
Abbreviations
The following abbreviations are used in this manuscript:
| DSD | Drop size distribution |
| VHF | Very high frequency |
| UHF | Ultra high frequency |
| SNR | Signal-to-noise ratio |
| 2DVD | Two-dimensional video disdrometer |
| RMSE | Root mean square error |
References
- Hocking, W.K. Recent advances in radar instrumentation and techniques for studies of the mesosphere, stratosphere and troposphere. Radio Sci. 1997, 32, 2241–2270. [Google Scholar] [CrossRef]
- Hocking, W.K. A review of mesosphere-stratosphere-troposphere (MST) radar developments and studies, circa 1997–2008. J. Atmos. Sol.-Terr. Phys. 2011, 73, 848–882. [Google Scholar] [CrossRef]
- Atlas, D.; Srivastava, R.C.; Sekhon, R.S. Doppler radar characteristics of precipitation at vertical incidence. Rev. Geophys. 1973, 11, 1–35. [Google Scholar] [CrossRef]
- Su, C.-L.; Chu, Y.-H.; Lo, I.-Y. Negative correlation between terminal velocity and VHF radar reflectivity: Observation and plausible explanation. Ann. Geophys. 2009, 27, 1631–1642. [Google Scholar] [CrossRef][Green Version]
- Ralph, F.M. Using radar-measured radial vertical velocities to distinguish Precipitation scattering from Clear-air scattering. J. Atmos. Ocean. Technol. 1995, 12, 257–267. [Google Scholar] [CrossRef]
- Maguire, W.B.; Avery, S.K. Retrieval of raindrop size distributions using two Doppler wind profilers: Model sensitivity testing. J. Appl. Meteor. 1994, 33, 1623–1635. [Google Scholar] [CrossRef]
- Wilks, D.S. Rainfall intensity, the Weibull distribution, and estimation of daily surface runoff. J. Appl. Meteor. 1989, 28, 52–58. [Google Scholar] [CrossRef]
- Feingold, G.; Levin, Z. Application of the lognormal raindrop distribution to differential reflectivity radar measurement (ZDR). J. Atmos. Ocean. Technol. 1987, 4, 377–382. [Google Scholar] [CrossRef]
- Ulbrich, C.W. Natural variation in the analytical form of the raindrop size distribution. J. Climate Appl. Meteor. 1983, 22, 1764–1775. [Google Scholar] [CrossRef]
- Zhang, G.; Vivekanandan, J.; Brandes, E.A. A method for estimating rain rate and drop size distribution from polarimetric radar measurements. IEEE Trans. Geosci. Remote Sens. 2001, 39, 830–841. [Google Scholar] [CrossRef]
- Brandes, E.A.; Zhang, G.; Vivekanandan, J. Comparison of Polarimetric Radar Drop Size Distribution Retrieval Algorithms. J. Atmos. Ocean. Technol. 1987, 4, 377–382. [Google Scholar] [CrossRef]
- Rajopadhyaya, D.K.; Avery, S.K.; May, P.T.; Cifelli, R.C. Comparison of precipitation estimation using single- and dual-frequency wind profilers: Simulations and experimental results. J. Atmos. Ocean. Technol. 1999, 16, 165–173. [Google Scholar] [CrossRef]
- Schafer, R.; Avery, S.; May, P.; Rajopadhyaya, D.; Williams, C. Estimation of rainfall drop size distributions from dual-frequency wind profiler spectra using deconvolution and a nonlinear least squares fitting technique. J. Atmos. Ocean. Technol. 2002, 19, 864–874. [Google Scholar] [CrossRef]
- Mardiana, R.; Iguchi, T.; Takahashi, N.; Hanado, H. Study of quantization effects on rainfall rate estimation from GPM dual-frequency radar. IEEE Geosci. Remote Sens. Lett. 2004, 1, 220–223. [Google Scholar] [CrossRef]
- Chu, Y.-H. Effects of along- and cross-radar-beam winds on Doppler radar spectrum. Ann. Geophys. 2005, 23, 681–692. [Google Scholar] [CrossRef][Green Version]
- Chen, M.-Y.; Chu, Y.-H. Beam broadening effect on Doppler spectral width of wind profiler. Radio Sci. 2011, 46, RS5031. [Google Scholar] [CrossRef]
- Kanofsky, L.; Chilson, P. An analysis of errors in drop size distribution retrievals and rain bulk parameters with a UHF wind profiling radar and a two-dimensional video disdrometer. J. Atmos. Ocean. Technol. 2008, 25, 2282–2292. [Google Scholar] [CrossRef]
- Rajopadhyaya, D.K.; May, P.T.; Cifelli, R.C.; Avery, S.K.; Williams, C.; Ecklund, W.L. The effect of vertical wind motions on rain rates and median volume diameter determined from combined UHF and VHF wind profiler measurements and comparisons with rain gauge measurements. J. Atmos. Ocean. Technol. 1998, 15, 1306–1319. [Google Scholar] [CrossRef]
- Zhang, G. Weather Radar Polarimetry, 1st ed.; CRC Press: Boca Raton, FL, USA, 2017; p. 304. [Google Scholar]
- Tsai, S.-C.; Chu, Y.-H.; Chen, J.-S. Identification of concurrent clear-air and precipitation Doppler profiles for VHF radar and an incorporating study of strongly convective precipitation with dual-polarized microwave radiometer. Atmosphere 2022, 13, 557. [Google Scholar] [CrossRef]
- Kumar, S.; Rao, T.N.; Radhakrishna, B. Identification and separation of turbulence echo from the multi peaked VHF radar spectra during precipitation. IEEE Trans. Geosci. Remote Sens. 2019, 57, 5729–5737. [Google Scholar] [CrossRef]
- Wakasugi, K.; Mizutani, A.; Matsuo, M.; Fukao, S.; Kato, S. A direct method for deriving drop-size distribution and vertical air velocities from VHF Doppler radar spectra. J. Atmos. Ocean. Technol. 1986, 3, 623–629. [Google Scholar] [CrossRef]
- Sato, T.; Doji, H.; Iwai, H.; Kimura, I.; Fukao, S.; Yamamoto, M.; Tsuda, T.; Kato, S. Computer processing for deriving drop-size distributions and vertical air velocities from VHF Doppler radar spectra. Radio Sci. 1990, 25, 961–973. [Google Scholar] [CrossRef]
- Currier, P.E.; Avery, S.K.; Balsley, B.B.; Gage, K.S. Use of two wind profilers for precipitation studies. Geophys. Res. Lett. 1992, 19, 1017–1020. [Google Scholar] [CrossRef]
- Kim, D.K.; Lee, D. Raindrop size distribution properties associated with vertical air motion in the stratiform region of a springtime rain event from 1290 MHz wind profiler, Micro Rain Radar and Parsivel disdrometer measurements. Meteor. Appl. 2016, 23, 562. [Google Scholar] [CrossRef]
- Rajopadhyaya, D.K.; May, P.T.; Vincent, R.A. A general approach to the retrieval of raindrop size distributions from wind profiler doppler spectra: Modeling results. J. Atmos. Ocean. Technol. 1993, 10, 710–717. [Google Scholar] [CrossRef]
- Kobayashi, T.; Adachi, A. Retrieval of Arbitrarily Shaped Raindrop Size Distributions from Wind Profiler Measurements. J. Atmos. Ocean. Technol. 2005, 22, 433–442. [Google Scholar] [CrossRef]
- Pang, S.; Ruan, Z.; Yang, L.; Liu, X.; Huo, Z.; Li, F.; Ge, R. Estimating raindrop size distributions and vertical air motions with spectral difference using vertically pointing radar. J. Atmos. Ocean. Technol. 2021, 38, 1697–1713. [Google Scholar] [CrossRef]
- Williams, C.R. Simultaneous ambient air motion and raindrop size distributions retrieved from UHF vertical incident profiler observations. Radio sci. 2002, 2, 1024. [Google Scholar] [CrossRef]
- Williams, C.R.; Ecklund, W.L.; Johnston, P.E.; Gage, K.S. Cluster analysis techniques to separate air motion and hydrometeors in vertical incident profiler observations. J. Atmos. Ocean. Technol. 2000, 17, 949–962. [Google Scholar] [CrossRef]
- Fang, M.; Doviak, R.J.; Albrecht, B.A. Analytical expressions for Doppler spectra of scatter from hydrometers observed with a vertically directed radar beam. J. Atmos. Ocean. Technol. 2012, 29, 500–509. [Google Scholar] [CrossRef]
- Chen, C.-H.; Su, C.-L.; Chen, J.-H.; Chu, Y.-H. Vertical Wind Effect on Slope and Shape Parameters of Gamma Drop Size Distribution. J. Atmos. Ocean. Technol. 2020, 37, 243–262. [Google Scholar] [CrossRef]
- Zhang, G.; Vivekanandan, L.; Brandes, E.; Meneghini, R.; Kozu, T. The shape-slope relation in observed gamma raindrop size distribution: Statistical error or useful information? J. Atmos. Ocean. Technol. 2003, 20, 1106–1119. [Google Scholar] [CrossRef]
- Tokay, A.; D’Adderio, L.P.; Marks, D.A.; Pippitt, J.L.; Wolff, D.B.; Petersen, W.A. Comparison of raindrop size distribution between NASA’s s-band polarimetric radar and two-dimensional video disdrometers. J. Appl. Meteor. Climatol. 2020, 59, 517–533. [Google Scholar] [CrossRef]
- Tokay, A.; Petersen, W.A.; Gatlin, P.; Wingo, M. Comparison of raindrop size distribution measurements by collocated disdrometers. J. Atmos. Ocean. Technol. 2013, 30, 1672–1690. [Google Scholar] [CrossRef]
- Tokay, A.; Wolff, D.B.; Petersen, W.A. Evaluation of the new version of the laser-optical disdrometer, OTT parsivel. J. Atmos. Ocean. Technol. 2014, 31, 1276–1288. [Google Scholar] [CrossRef]
- Ignaccolo, M.; De Michele, C. Phase space parameterization of rain: The inadequacy of gamma distribution. J. Appl. Meteor. Climatol. 2014, 53, 548–562. [Google Scholar] [CrossRef]
- Doviak, R.J.; Zrnić, D.S. Doppler Radar and Weather Observations, 2nd ed.; Dover: Mineola, NY, USA, 2006; p. 562. [Google Scholar]
- Williams, C.R.; Gage, K.S. Raindrop size distribution variability estimated using ensemble statistics. Ann. Geophys. 2009, 27, 555–567. [Google Scholar] [CrossRef]
- Kruger, A.; Krajewski, W.F. Two-dimensional video disdrometer: A description. J. Atmos. Ocean. Technol. 2002, 19, 602–617. [Google Scholar] [CrossRef]
- Ulbrich, C.W.; Atlas, D. Rainfall microphysics and radar properties: Analysis methods for drop size spectra. J. Appl. Meteor. 1998, 37, 912–923. [Google Scholar] [CrossRef]
- Chu, Y.-H.; Su, C.-L. An investigation of the slope-shape relation for Gamma raindrop size distribution. J. Appl. Meteor. Climatol. 2008, 47, 2531–2544. [Google Scholar] [CrossRef]
- Morrison, H.; Van Lier-Walqui, M.; Kumjian, M.R.; Prat, O.P. A Bayesian approach for statistical-physical bulk parameterization of rain microphysics. Part I: Scheme description. J. Atmos. Sci. 2019, 77, 1019–1041. [Google Scholar] [CrossRef]
- Bringi, V.N.; Mishra, K.V.; Thurai, M.; Kennedy, P.C.; Raupach, T.H. Retrieval of lower-order moments of the drop size distribution using CSU-CHILL X-band polarimetric radar: A case study. Atmos. Meas. Tech. 2020, 13, 4727–4750. [Google Scholar] [CrossRef]
- Bringi, V.N.; Chandrasekar, V.; Zrnić, D.S.; Ulbrich, C.W. Comments on “The need to represent raindrop size spectra as normalized gamma distributions for interpretation of polarization radar observations”. J. Appl. Meteor. 2003, 42, 1184–1189. [Google Scholar] [CrossRef]
- Röttger, J.; Liu, C.-H.; Chao, L.-K.; Chen, A.-J.; Chu, Y.-H.; Fu, I.-J.; Huang, C.-M.; Kiang, Y.-W.; Kuo, F.-S.; Lin, C.-H.; et al. The Chung-Li VHF radar: Technical layout and a summary of initial results. Radio Sci. 1990, 25, 487–502. [Google Scholar] [CrossRef]
- Su, C.-L.; Chen, H.-C.; Chu, Y.-H.; Chung, M.-Z.; Kuong, R.-M.; Lin, T.-H.; Tzeng, K.-J.; Wang, C.-Y.; Wu, K.-H.; Yang, K.-F. Meteor radar wind over Chung-Li (24.9°N, 121°E), Taiwan, for the period 10–25 November 2012 which includes Leonid meteor shower: Comparison with empirical model and satellite measurements. Radio Sci. 2014, 49, 597–615. [Google Scholar] [CrossRef]
- Chen, M.-Y.; Su, C.-L.; Chang, Y.-H.; Chu, Y.-H. Identification and removal of aircraft clutter to improve wind velocity measurement made with Chung-Li VHF radar. J. Atmos. Ocean. Technol. 2022, 39, 1217–1228. [Google Scholar] [CrossRef]
- Kobayashi, T.; Adachi, A. Measurements of rain-drop breakup by using UHF wind profilers. Geophys. Res. Lett. 2001, 28, 4071–4072. [Google Scholar] [CrossRef]
Disclaimer/Publisher’s Note: The statements, opinions and data contained in all publications are solely those of the individual author(s) and contributor(s) and not of MDPI and/or the editor(s). MDPI and/or the editor(s) disclaim responsibility for any injury to people or property resulting from any ideas, methods, instructions or products referred to in the content. |
© 2025 by the authors. Licensee MDPI, Basel, Switzerland. This article is an open access article distributed under the terms and conditions of the Creative Commons Attribution (CC BY) license (https://creativecommons.org/licenses/by/4.0/).