Article

Spatial–Temporal Heterogeneity of Wetlands in the Alpine Mountains of the Shule River Basin on the Northeastern Edge of the Qinghai–Tibet Plateau

1
State Key Laboratory of Cryospheric Science and Frozen Soil Engineering, Northwest Institute of Eco-Environment and Resources, Chinese Academy of Sciences, Lanzhou 730000, China
2
University of Chinese Academy of Sciences, Beijing 101408, China
3
School of Civil Engineering, Lanzhou Jiaotong University, Lanzhou 730070, China
4
Key Laboratory of Ecological Safety and Sustainable Development in Arid Lands, Northwest Institute of Eco-Environment and Resources, Chinese Academy of Sciences, Lanzhou 730000, China
*
Author to whom correspondence should be addressed.
Remote Sens. 2025, 17(6), 976; https://doi.org/10.3390/rs17060976
Submission received: 23 January 2025 / Revised: 1 March 2025 / Accepted: 7 March 2025 / Published: 10 March 2025

Abstract

:
Alpine wetland ecosystems, as important carbon sinks and water conservation areas, possess unique ecological functions. Driven by climate change and human activities, the spatial distribution changes in alpine wetlands directly affect the ecosystems and water resource management within a basin. To further refine the evolution processes of different types of alpine wetlands in different zones of a basin, this study combined multiple field surveys, unmanned aerial vehicle (UAV) flights, and high-resolution images. Based on the Google Earth Engine (GEE) cloud platform, we constructed a Random Forest model to identify and extract alpine wetlands in the Shule River Basin over a long-term period from 1987 to 2021. The results indicated that the accuracy of the extraction based on this method exceeded 90%; the main wetland types are marsh, swamp meadow, and river and lake water bodies; and the spatial–temporal distribution of each wetland type has obvious heterogeneity. In total, 90% of the swamp meadows areas were mainly scattered throughout the study area’s section 3700 to 4300 m above sea level (a.s.l.), and 80% of the marshes areas were concentrated in the Dang River source 3200 m above sea level. From 1987 to 2021, the alpine wetland in the study area showed an overall expansion trend. The total area of the wetland increased by 51,451.8 ha and the area increased by 53.5%. However, this expansion mainly occurred in the elevation zone below 4000 m after 2004, and low-altitude marsh wetland primarily dominated the expansion. The analysis of the spatial–temporal heterogeneity of alpine wetlands can provide a scientific basis for the attribution analysis of the change in alpine wetlands in inland water conservation areas, as well as for protection and rational development and utilization, and promote the healthy development of ecological environments in nature reserves.

1. Introduction

Wetlands, as one of the three most critical ecosystems on Earth, support biodiversity and maintain regional ecological balance. At the same time, wetlands are closely linked to terrestrial hydrological processes, serving as an essential regulator of the terrestrial water balance [1]. In the alpine mountains of the Tibetan Plateau, where glacier/snow meltwater is the main source of recharge, meltwater is collected in depressions and shallow valleys, eventually forming extensive wetlands [2]. The wetland’s vegetation barrier and geomorphological features result in a high water storage capacity and long drainage time, and the hydrological phenomenon of “fast catch and slow discharge” plays an important role throughout the basin in mitigating floods and droughts, adapting to seasonal variations and modulating the local climate, thus participating uniquely in the hydrological process of the whole basin, maintaining the regional water balance [3,4]. Second, these alpine wetlands, especially peatlands, distributed in high-altitude and cold-climate regions, have a significant impact on the global carbon cycle as a major soil “carbon reservoir”. Therefore, wetlands have an irreplaceable function in regulating the terrestrial water cycle and maintaining ecological balance, and they have a high ecological service value.
Under the influence of climate change, human activities, and other external factors, wetlands are in a state of flux, with unique regional heterogeneity. Existing studies have shown that wetland ecosystems in some regions such as the Prairie Pothole Region in North America and northeastern China have been affected by global warming, with wetlands in these regions fragmenting, shrinking, and becoming less productive [5,6]; however, there is some regional and wetland-type variability in wetland trends. For example, wetlands in the Erqis River Basin in Xinjiang increased from 1990 to 2010 [7]. Similarly, multiple monitoring results for wetlands in the Tibetan Plateau show that lakes, river water bodies, and floodplain wetlands in the Tibetan Plateau increased from 1976 to 2018 [8], while the total area of marsh wetlands decreased [9,10].
The rapid development of remote sensing technology is causing a paradigm of wetland monitoring research, causing a shift from local small-scale and short-term research to large-scale and long-term sequence monitoring, especially multispectral remote sensing data, which are the core data source in current wetland remote sensing research [11]. They have an irreplaceable position in the identification of features and vegetation types. Up to now, diversified optical remote sensing data, such as SPOT, Sentinel-2, TM/ETM+/OLI, and MODIS images, have been widely used for wetland identification, and good results have been achieved. The short-term extraction of wetland information at different landscape scales using high-resolution SPOT data shows that the overall accuracy is high enough to accurately obtain wetland coverage [12,13,14,15]. Some high-resolution images such as those from QUICKBIRD and IKONOS can identify the extent of wetlands. Still, the application of wetland identification is limited due to the constraints of data resources not yet being open and the complexity of image processing [16]. Sentinel-2 data have been favored by numerous scientists for the identification and monitoring of specific types of wetlands due to the advantage of higher resolution (10 m), as the extraction of wetlands in Newfoundland, Canada [17], the monitoring of temperate floodplain vegetation in the vicinity of Mont St. Michel Bay [18], and the mapping of the extent of tidal flats in China [19] have all yielded good extraction results. However, these data have a short period. MODIS images, characterized by their long-time-series and open-access nature, are extensively utilized for large-scale land use classification. Despite their advantages of a short revisit period and free availability, the relatively low spatial resolution of MODIS images imposes certain limitations on the accuracy of wetland patch extraction. The Landsat (TM/ETM+/OLI) remote sensing satellite has been extensively utilized in research on land use/cover, resources, and surface landscape due to its advantages of long-term data availability (1982–2024), moderate spatial resolution (30 m), and being open access, and a series of results have been identified in wetland change research [20,21].
With the development of remote sensing classification techniques, machine learning for supervised classification has become a mainstream wetland classification and monitoring method, with the Convolutional Neural Network, Random Forest, Bayes and Decision Tree, and other methods being used [22]. Random Forest integrates several decision trees, which have high prediction accuracy due to the integration of prior knowledge. At the same time, it can evaluate the importance of multiple selected feature variables and screen out the feature variables suitable for different ground objects’ extraction. This enables efficient and rapid training and prediction [23,24,25]. The development of cloud computing platforms has further promoted the application of remote sensing technology in the large-scale processing and analysis of geospatial data. The GEE cloud platform invokes and integrates multi-source remote sensing data, effectively utilizing the strengths of various sensors to improve classification accuracy, and it enables more automated processing of large-scale, long-time remote sensing data, thereby facilitating land cover monitoring [26,27].
At present, wetland research on the Qinghai–Tibet Plateau is mainly concentrated in eastern and southern Tibet [28,29], while the semi-arid Qilian Mountain alpine region in northern Tibet, as the water conservation area of several inland rivers, such as Heihe River, Shule River, and Shiyang River, also has a large area of wetlands, but there are few wetland studies in this area. The spatial distribution of alpine wetlands in the semi-arid areas directly affects the hydrological regimes of these inland rivers and the water supply in the middle and lower reaches [30]. At the same time, these alpine wetlands are home to many endemic and rare flora and fauna [31], which have unmatched importance in the hydrological and ecological functions of the whole region. To further understand the water resources service function of wetlands in the source area of inland rivers in semi-arid regions, the relationship between wetlands and the cryosphere, and the response of wetlands in the source area to climate change the Shule River, which is mainly replenished by glacier and permafrost meltwater, were selected as the study objects [32]. Combining the regional characteristics and enriching the field survey data to obtain information on alpine wetlands in semi-arid areas allowed for fully understanding the spatial–temporal heterogeneity of alpine wetlands in the region.
This study focuses on the cold alpine region of the Shule River in the Qilian Mountains. Based on multiple field surveys and the Landsat remote sensing dataset, and employing the GEE cloud computing platform, this research uses the Random Forest classification method, integrating the spectral, topographical, and textural features of the study area to generate detailed wetland distribution maps for the alpine region of the Shule River Basin from 1987 to 2021. Additionally, the spatial–temporal heterogeneity of alpine wetlands in the Shule River Basin is analyzed to provide a scientific basis for the conservation of alpine wetlands in the study area.

2. Materials and Methods
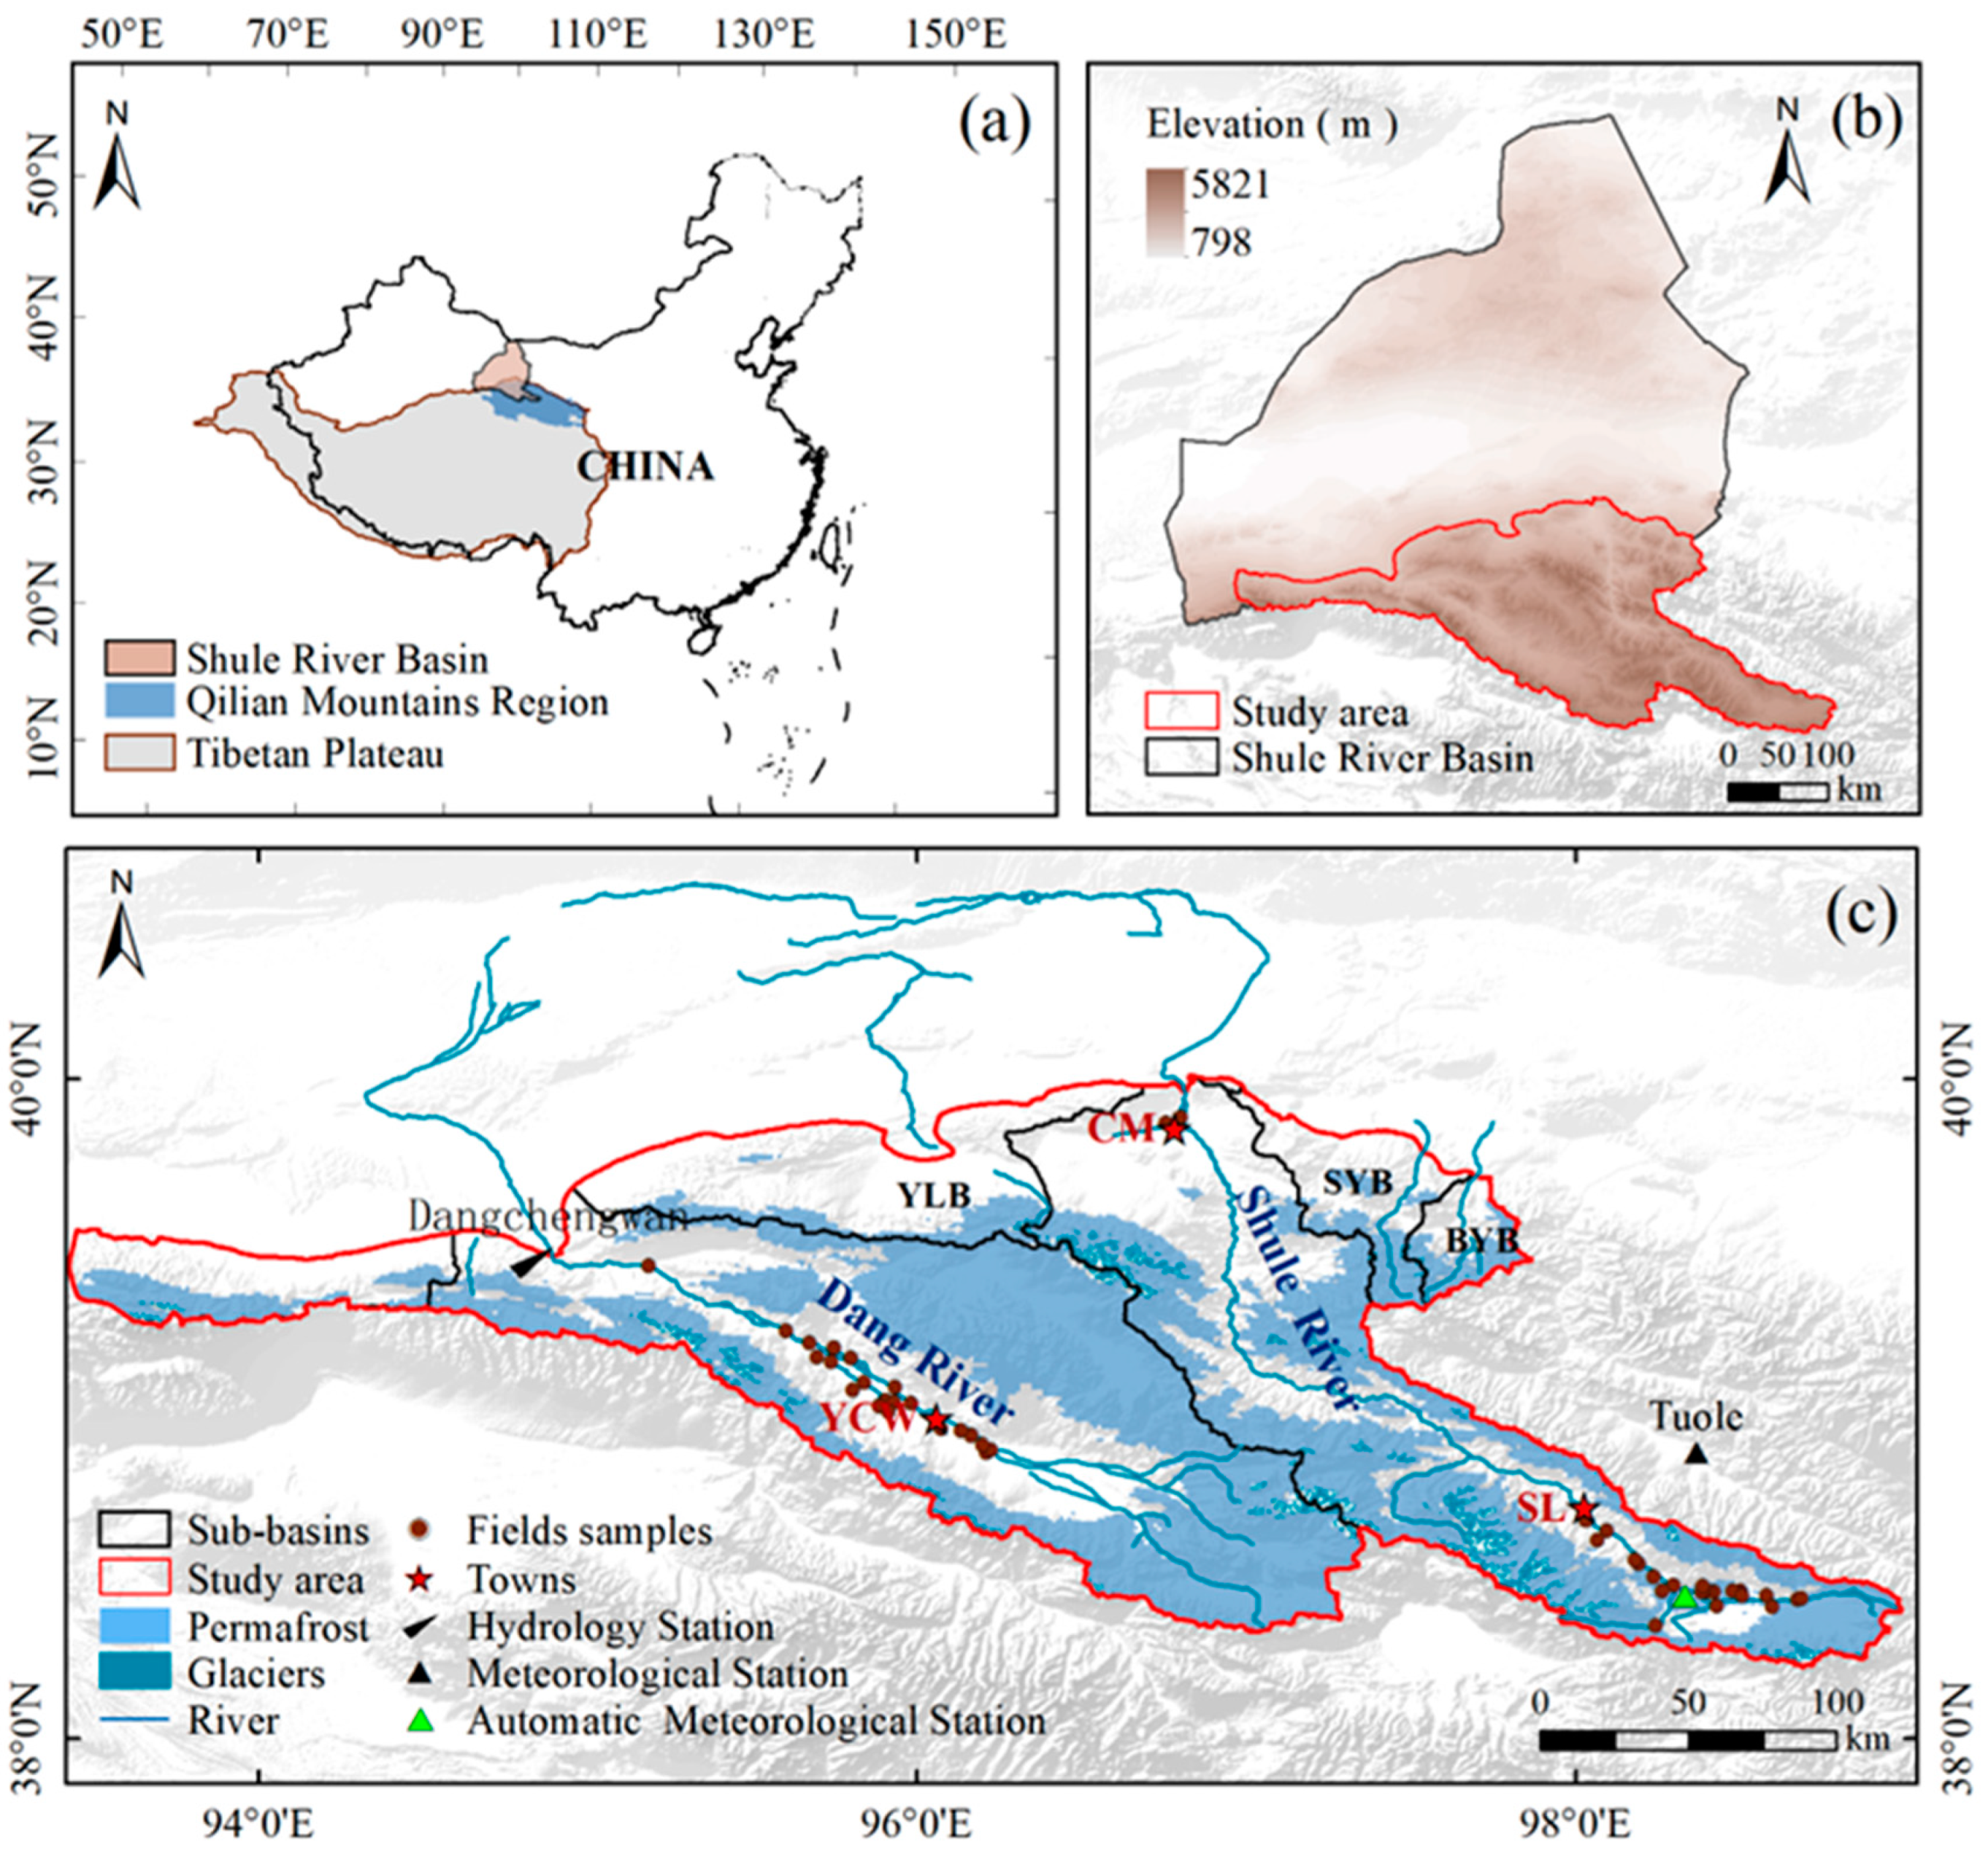
2.1. Study Area

The Shule River Basin is located in the Tibetan Plateau’s northern part and the Qilian Mountains’ western part (Figure 1a). The geographical position ranges from 92.18 to 99.00°E and 38.00 to 42.80°N with a basin area of 12.7 × 10⁴ km2. The elevation of this basin ranges from 798 to 5821 m, with the elevation decreasing from southeast to northwest (Figure 1b). It consists of five major sub-basins: the mainstream basin of the Shule River, the Dang River Basin, the Yulin River Basin (YLB), the Baiyang River Basin (BYB), and the Shiyou River Basin (SYB) (Figure 1c).
The study area, the alpine mountain area of the Shule River Basin (Figure 1c), is the area above the passes of the five major water systems in the basin, with an area of 38,193 km2, of which the basin area of the Shule River mainstream is 13,531 km2, the basin area of the main tributary Dang River is 15,798 km2, and the basin area of the other rivers is 8864 km2. The study area is located in the continental arid desert climate zone with a dry, cold, and windy climate. Influenced by the local topography and geomorphology, the vertical and horizontal distribution zones of precipitation, temperature, and total solar radiation are significantly different [33]. The average annual temperature at the source area of the Shule River mainstream is −4.0 °C, and the average annual precipitation is 388.2 mm, mainly concentrated in May and September, which accounts for 90% of the precipitation [34]. The Dang River Basin has an average annual temperature of 5.0 °C and an average annual precipitation of 150.0 mm. The Shule River, as a glacial permafrost recharge river, has a large glacier cover, accounting for 44.7% of the glaciers in the entire Qilian Mountain system. The glacier coverage area of the Shule River mainstream basin is 509.87 km2 and the glacier coverage area of the Dang River Basin is 203.77 km2 [35]. The river valleys in the source area are extensive, mainly being intermountain flood fan depressions and river floodplain depressions, with large areas of permafrost having developed. The distribution area of permafrost in the source area of the mainstream is 9447.16 km2 [36], and it is 11,603.10 km2 in the Dang River Basin [37]. The source of the Shule River mainstream and the Dang River, the river valley wide mountain and basin-shaped landform. The Shule River–Yangkangqu source has a large area of marsh and swamp meadow [38]; Yanchiwan, a typical wetland at the headwater of the Dang River, has a large area of marsh and is rich in various types of wetlands [39], and it was designated as a national nature reserve in 2006. In 2018, it was listed in the Ramsar Convention, which defines the reserve’s mandatory protection and prohibits any utilization activities such as grazing and mining, promoting the restoration of the ecosystem of the reserve.

2.2. Data Sources

This study was conducted on the GEE platform (https://earthengine.google.com, accessed on 1 December 2023) using radio-corrected and atmospheric-corrected Landsat-5 TM and Landsat-8 OLI images from 1987 to 2021; selected multiple remote sensing images from 1987 to 2021 with less than 20% cloud cover and better vegetation growth months (July to October) were composited for subsequent classification. In addition, because topographic features and most wetlands significantly influence the distribution of wetlands in gently sloping depressions [40], the new global 30 m resolution digital elevation model (DEM) from the National Aeronautics and Space Administration (NASA, Washington, DC, USA) was used to introduce elevation and topography as auxiliary data to improve the discrimination of wetlands from other landcover types [41]. The NASA DEM is an enhanced version of the Shuttle Radar Topography Mission (SRTM) data with improved accuracy generated by incorporating ancillary data from the Advanced Spaceborne Thermal Emission and Reflection Radiometer Global Digital Elevation Model (ASTER GDEM), Ice-Cloud-land Elevation Satellite-Geoscience Laser Altimeter System (ICESat/GLAS), and Panoramic Remote-Sensing Instrument for Stereo Mapping (PRISM) datasets. Thus, this study used elevation and slope terrain data as the classifier terrain feature indices that were input into the classification model to aid classification.
The Shule River mainstream alpine mountains were equipped in 2009 with a self-sited Shimi Tower automatic meteorological station (38.42°N, 98.30°E, 3885 m a.s.l.), but the time series is short. The Tuole National Meteorological Station (38.87°N, 98.37°E, 3360 m a.s.l.) is close to the Shule River mainstream source, and the data were sourced from the National Meteorological Science Data Center (https://data.cma.cn, accessed on 3 March 2024), selected as the main source of meteorological data due to the dataset’s long time series, high altitude, and high correlation. The meteorological data of the source of the Dang River tributary were obtained from the Dangchengwan Hydrology Station (39.50°N, 94.88°E, 2130 m a.s.l.).

2.3. Method

Based on the GEE cloud platform, this study selected the Landsat Surface Reflectance (SR) dataset provided by the platform, which has undergone radiometric and atmospheric correction and standardization. The cloud and shadow removal processes were applied to the selected images using GEE modules and merged multiple images to obtain a high-quality image collection. Field surveys and high-resolution imagery were used to acquire sample datasets (training and validation samples). Multiple features suitable for alpine wetland extraction were selected. Training samples and feature variables were randomly chosen to train models, construct multiple decision trees (Blue circles in the Figure 2 Step 3), and determine the final class through a majority voting process for the subsequent classification and prediction of land cover types. Finally, the confusion matrix was constructed using the verification sample set to evaluate the accuracy of the classification results. The flow chart of wetland information extraction in this study is shown in Figure 2. The post-processing of the classification map of the GEE cloud platform was carried out to obtain the classification results of the wetlands in the study area from 1987 to 2021, and then we analyzed the spatial–temporal heterogeneity of the wetland area and wetland type.

2.3.1. Land Cover Classification System and Sample Dataset

This study conducted several field surveys of the study area, and combined with the wetland classification system [42] of the Ramsar Convention and the classification system in existing studies, a classification system for different land cover features in the study area was established. Alpine swamp meadow on the Tibetan Plateau is a special wetland ecosystem. It is not only a transition zone between natural grassland and herbaceous marsh; its distribution is often closely related to permafrost [43]. This is quite different from the evolution and formation of herbaceous marsh. Therefore, this study divided the marsh wetland into herbaceous marsh and swamp meadow. In this study, the water depth of the marsh was between 15 cm and 1 m, and the marsh was dominated by aquatic and marsh herbaceous plants. The depth of the swamp meadow was less than 15 cm, including all swamp meadows in flat areas and high mountain areas. Due to the small lake area in the study area, the largest lake area is only 40 ha, and the lakes are essentially scattered around the river channels, with their water sources being consistent with those of the rivers. Thus, the lake and river water bodies were integrated. There are relatively few social activities in the alpine area of the study area, and agriculture is mainly nomadic herding, with a small amount of farmland distributed primarily in the mountain pass area. This study mostly analyzed the types of wetlands, so farmland was merged into the natural grassland category. The land cover types in the study area were finally classified into herbaceous marsh (abbr.marsh), swamp meadow, natural grassland, bare land, river, and lake water bodies, and glaciers, and the corresponding land cover classification system was established (Table 1). The field survey was carried out in August 2022 and August 2023, conducted from Changma Township (2015~2065 m a.s.l.) to Suli Town (3765~3907 m a.s.l.) in the mainstream basin and in Yanciwan Town (2622~3223 m a.s.l.) in the tributary basin. All wetland types and different elevations were covered, UAV flight points were evenly set (Figure 1c), and the distribution of land cover was located by combining digital cameras and Global Positioning System (GPS) recorders to ensure the even distribution and representativeness of the samples. Detailed aerial coverage is provided in Table 2. To carry out long-term wetland classification and improve the accuracy of the classification, this work combined the field sample with the visual interpretation of high-resolution images such as World Imagery Wayback and Google Earth. On average, more than 2100 samples of various wetland types and more than 350 other land cover types were obtained every year, totaling more than 2450 samples, which constituted the training sample (70%) and verification sample (30%) dataset.

2.3.2. Feature Selection and Extraction

Considering the differences in vegetation cover, surface moisture, textural features, and topography between wetland and non-wetland land types, as well as between marsh and swamp meadow and between marsh and water, multiple feature variables were selected based on previous research findings. Based on the training samples, feature selection using the Random Forest model identified 24 classification variables suitable for alpine wetland classification in the study area, including spectral bands, spectral indices, textural features, and topographic features (Table 3). The spectral bands were 6 bands of Landsat image. To improve the identification ability of wetlands, 12 spectral indices were obtained by enhancing image information based on band operation. The water index, vegetation index, brightness index (BI), green index (GI), and wetness index (WI) of the first three components obtained via tassel-cap transformation were used for classifying and extracting wetland information as classification features [44].
In addition, this study used the Gray level co-occurrence matrix (GLCM) to calculate 4 parameter statistics (second-order moment and variance, energy, average, and contrast matrix) to reflect the texture features of the image and called the module glcmTexture () on the GEE cloud platform to calculate the texture features of the image NDVI. Finally, elevation and slope were selected as the topography features of land cover-type classification in the study area.

2.3.3. Random Forest Classification Model

Random Forest is an integrated classifier based on decision trees proposed by Leo Breiman and Adele Culter in 2001. In the classification process of Random Forest, first, the training set for building the decision tree model is determined, and a tree corresponds to a training subset. Forest mainly uses the Bagging random sampling and put-back technique to determine the training subset, where 70% of the original samples are randomly selected as the training sample dataset, and the remaining 30% samples are called Out-of-Bag data (OOB) and are used to evaluate internal errors. The smaller the errors, the higher the classification accuracy of the Random Forest model. Second, when building the decision tree, node splitting is performed according to certain rules without pruning, and each node is split with the criterion of minimizing the GINI coefficient (GINI index). Assuming that each sample has M features, then m (m ≪ M) features are randomly selected from M features at each node of the decision tree for node splitting, and because the Random Forest is an integrated learning method, it is not prone to the overfitting phenomenon. Therefore, no pruning is required during the decision tree construction process [47]. Again, the above steps are repeated N times to obtain a Random Forest classifier consisting of N decision tree models, and the classification results of each classification sample are decided by the N decision trees via majority voting. Finally, the classification results of each tree are averaged to obtain the prediction results.

2.3.4. Accuracy Assessment Methods

The overall and different types of land cover results were validated for accuracy using the confusion matrix. We randomly selected 30% of the sample dataset as validation samples, and the overall accuracy (OA), kappa coefficient, producer accuracy (PA), and user accuracy (UA) indicators of the classification results were calculated for accuracy evaluation. Confusion matrix calculations were performed on the classification results for each year to obtain the multi-year average user accuracy and producer accuracy, as well as the overall accuracy and kappa coefficient for each type of land cover.

3. Results

3.1. Wetland Types and Classification Accuracy

The main wetland types in the study area are swamp meadows, marsh, and river and lake water bodies. The accuracy of the classification results was verified using validation sample datasets obtained through high-resolution imagery, UAV photography, and digital cameras (Figure 3), which showed an overall classification accuracy of 94.8% with a kappa coefficient of 0.932 on a multi-year average (Table 4). The user and producer accuracy of each land cover type was above 90%. Among the various wetland types in the study area, river and lake water bodies are scattered throughout the study area, and the extraction accuracy is relatively high, with user accuracy and producer accuracy reaching being over 96%, but for the entire basin, the extraction accuracy of flat open waters is higher than that of fine rivers in mountainous areas. The water depth of the marsh in the study area is about 30 cm, the flow is slow, and aquatic vegetation such as Najadacea, Zannichelliaceae, and Triglochin maritimum grow there; swamp meadows are dominated by Blysmus sinocompressus and Kobresia littledale. Marsh and swamp meadows have high spatial heterogeneity at smaller scales and rich spectral information, and the extraction accuracy is low, with user and producer accuracies of around 90%. All other non-wetland land cover types achieved greater than 90% classification accuracy, with glacier extraction being the best.

3.2. Spatial Heterogeneity of Wetlands

Taking the classification results of 2021 as an example (Figure 4), the results show the following: The total area of wetlands in the study area is about 16.5 × 10⁴ ha, accounting for 4.4% of the total area of the basin. Among all wetland types, swamp meadow occupies the largest area, accounting for 73.4% of all wetland areas, and is mainly distributed in the high-altitude Shule River mainstream source area. The second largest is marsh, accounting for 15.1% of all wetland area, which is distributed in the source area of Dang River at low altitudes. The river and lake water bodies are the smallest, 10.4%, being mainly distributed in the Shule River mainstream and the Dang River basin, with the area in the mainstream being slightly large more than that in the Dang River.
The distribution of wetlands is strongly influenced by topography, which directly affects the direction and degree of accumulation of water flow and determines the formation and development of wetlands. The elevation of this study area is in the range of 932~5821 m, with a wide range of elevation bands. To analyze the surface cover of different elevation bands, based on the DEM elevation, different wetland types, as well as the distribution characteristics of permafrost in this area, were studied [48]. From low to high, the study area was successively divided into areas 932~2500 m, 2500~2800 m, 2800~3200 m, 3200~3700 m, 3700~4000 m, 4000~4300 m, 4300~4700 m, and 4700~5821 m a.s.l. Wetlands in the study area are mainly distributed in the elevation range of 2800~4300 m a.s.l. For the elevation from low to high, different wetland types show high spatial heterogeneity (Figure 5). The distribution of marsh is relatively concentrated compared to other types of wetlands, 82.1% of which are distributed in the 3200 m altitude band in the sources of the Dang River, spreading along the river channel in a strip-like manner, scattered in the valleys, on the edges of the alluvial fan on both sides of the river channel, and in the washland; about 15% is also distributed in the valley area in the 3700~4000 m altitude band in the Shule River mainstream source area. Swamp meadows are widely distributed in the elevation band of 3700~4300 m throughout the region and often distributed in the river headwaters of each water system, river floodplains, and the catchment areas of gently sloping zones, alpine shady slopes, or semi-shady slopes. Moreover, their distribution zone has a high overlap with the permafrost distribution zone of the study area, and 94% of it is distributed in the transitional permafrost zone. Too-high or too-low elevations affected by glaciers and permafrost distribution are unsuitable for the formation of this wetland type, with 4000 m being the center point, showing a good normal distribution trend throughout the elevation band. The river and lake water bodies are distributed throughout the study area, but the largest area is formed in the ranges of 3700~4000 m in the Shule River mainstream basin and 2800~3200 m in the Dang River Basin, and the area decreases as the altitude of each sub-basin decreases.

3.3. Temporal Heterogeneity of Wetlands

From 1987 to 2021, the wetland area in the study area obviously increased. The total wetland area increased by 51,451.8 ha and the area expanded by 53.5%, with a growth rate of 2149.8 ha. a−1. Two typical wetland distribution areas, SL in the mainstream of the Shule River and YCW in the Dang River, were selected to demonstrate wetland changes in the wetland classification results in 1987, 2003, and 2021 (Figure 6).
Among the wetland types in the whole study area, the marsh wetland showed the most obvious growth (Figure 7), with the total area increasing from 6824.1 ha to 29,741.9 ha. However, the marsh wetlands in different altitudinal zones showed different trends. The growth rate of the marsh at a lower altitude of 2800~3200 m (370 ha · a−1) was slightly higher than that of the marsh at higher altitudes of 3200~3700 m (160 ha · a−1) and 3700~4000 m (100 ha · a−1).
The area of river and lake water bodies also obviously increased during 1987–2021, but the increase occurred in certain stages, with a slow increase from 1987 to 2000 and a rapid increase after 2000. Among them, the increase trend of river and lake water bodies in the Shule River mainstream basin in the altitude zone of 3700~4000 m was the most obvious, and the number of lakelets in the source area increased significantly, with an increase trend rate of 112.22 ha · a−1. The changes in the river and lake water bodies in the source area of the Dang River in the elevation zone of 2800~3200 m also occurred in certain stages. There was a slight decrease from 1987 to 2003 and a clear increase after 2003, with an overall trend rate of 54.4 ha · a−1.
The total area of swamp meadows increased during the study period, increasing from 86,810.2 ha in 1987 to 100,340 ha in 2021, an increase of 15.6% with a slope of 999.9 ha · a−1. As swamp meadows are mainly distributed in the 3700~4300 m altitude band, with a normal distribution to the left and right centering on the 4000 m altitude band, they are a typical alpine wetland type. In this study, the heterogeneity of the increase in swamp meadows in different altitudinal zones was analyzed (Figure 8); the results showed that with the 4000 m altitude zone as the demarcation point, the swamp meadows in the zone below 4000 m were basically in a stable state before 2004, and then began to expand rapidly at an average rate of 820 ha per year after 2004. The trend for the swamp meadows in the altitude zone above 4000 m was the opposite, increasing before 2004, but starting to decrease after 2004, leading to a change in the proportion of swamp meadows at different altitudes in the whole study area, with the peak shifting from the right side of the high-altitude zone at 4000 m to the left side of the low altitude zone at 4000 m. To summarize, the temporal heterogeneity values of wetlands across the study area, wetlands distributed at lower elevations, and gently sloping river valleys show a clear trend of increase, while wetlands distributed at higher elevations and in certain slope zones show decreasing or smooth changing trends.

4. Discussion

4.1. Comparison with Products

There are several sets of product data in the wetland area extracted via different methods and data. To explore the differences between different data, this study selected two 30 m and two 10 m resolution land cover datasets for analysis and comparison, namely the 2020 global 30 m land cover dataset Globeland 30 [49], Global Land Cover product with Fine Classification System at 30 m (GLC_FCS30) [50], 10 m global land cover data product of European Space Agency WorldCover (ESA Worldcover 2020) [51] and Finer Resolution Observation and Monitoring of Global Land Cover (FROM_GLC 2017) [52]. Numerous studies have shown that products with short-term differences are analyzed in such a way that changes in their land cover have a negligible effect on the comparison results [53,54], so the land cover of the two typical wetland distribution areas (SL and YCW) of this study in 2020 was selected for spatial consistency, as well as for area comparisons with the products.
Firstly, the values of land cover types were harmonized. Several selected data product classification systems were used as wetlands is a large category, encompassing a variety of wetland types, such as marsh, salt marsh, mangrove, etc., while the wetland classification system used in this study classified marsh and swamp meadow as separate categories, and to further carry out the analysis of the overall extraction of spatial consistency, the swamp meadow in this study was converted into the natural grassland category. Comparison results show that the consistency of this study’s land cover with other land cover products in terms of spatial distribution is better overall (Figure 9), with 80% of the spatial distribution in SL being quantitatively consistent. The wetland extent result in YCW has good spatial consistency with the 30 m spatial resolution data product but poor spatial consistency with the 10 m product. This is because the typical area is only 80,531.8 ha; however, the land cover types are rich and complex [55] and the spatial heterogeneity is high, leading to a large difference in the classification of high- and low-resolution images. Second, different land cover products have different definitions and classification systems for wetlands, which can lead to different classification results despite using the same classification method and imagery [56] and the selected surface data coverage products are based on a global scale. Achieving a more refined classification of wetland types relies more on the wetland’s environment [49].

4.2. Differing Spatial Distribution of Wetland Types

Throughout the study area, the main distribution areas of wetlands are all river headwaters, adjacent to the glacier group, with similar geomorphological terrain, and the water source of the river mainly comes from the meltwater recharge of the glacier group on both sides. However, the heterogeneity between wetland types at different altitudes is relatively significant, with the swamp meadow mainly distributed in the 3700~4300 m altitude zone in the headwaters of the Shule River mainstream and the marsh mainly distributed in the 2800~3200 m altitude zone in the headwaters of the Dang River. Total precipitation in the Qilian Mountains decreases from southeast to northwest and from high altitude to low altitude, with more precipitation in the 3700~4300 m altitude band in the headwaters of the Shule River mainstream and lower temperatures and evaporation. Secondly, there is a large amount of permafrost in this region. The water-retaining layer formed by the permafrost, the adjacent glacial meltwater, the abundant precipitation and low temperature, and the low evaporation make the soil water sink in the gentle slope and low depression, which cannot be excluded in time, and the groundwater level rises and remains in a humid and saturated state for a long time, making the Shule River mainstream source area suitable for the development of alpine swamp meadow [57,58]. The Dang River source area on both sides of the river channels a large volume of glacier/snow meltwater in the form of surface water and underground spring supply to the low-lying land before the mountain and the alluvial flood fan edge of the depression. The river valley in the source area has a small specific gradient, and the river network is intricate and complex, so it is easy to have stagnant water and semi-stagnant water; secondly, the Dang River source area has a lower elevation and higher average annual temperature, which is beneficial for the growth of wet vegetation such as submerged vegetation and so on, so the Dang River source area is better for the development of herbaceous marsh wetland than the headwaters of the Shule River mainstream.

4.3. Factors Influencing Temporal Changes in Wetlands

The wetland area on the Tibetan Plateau showed an overall decrease from 1969 to 2000 [59], though after 2000, the shrinkage of wetlands slowed down and reversed to some extent [60]. Several studies have shown that rising temperatures, the accelerated melting of glacial permafrost, and human activities such as increased precipitation and livestock farming are the main causes of wetland changes on the Tibetan Plateau.
The mean annual temperatures in the study area all increased from 1987 to 2021, with more significant warming in the headwaters of the Shule River mainstream (Figure 10a), with a climatic tendency rate of 0.33 °C/10 year, and a slower warming in the source of the Dang River, with 0.15 °C/10 year. The continuous increase in temperature has led to a general retreat of glaciers at high altitudes [61,62], and an increase in the average annual glacial snowmelt, which increases water recharge to the wetlands [63]. The temperature increase also leads to the degradation of permafrost and the thickening of active layers widely distributed in the Tibetan Plateau [64]. This study found that the temperature increase rate in the study area was lower than the average temperature increase rate for the Tibetan Plateau (0.51 °C/10 years) [65]. The results indicating that permafrost degradation in the study area is weaker than that in other permafrost areas of the Qinghai–Tibet Plateau, and the expansion of wetlands in the study area confirm some observations and research results gathered in the Arctic: permafrost degradation within a certain threshold range leads to the wetting of arid habitats and a gradual increase in soil water content [66] and vegetation cover [67]. Further analysis of the change trend of the high-altitude swamp meadow in the permafrost zone shows that the high-altitude swamp meadow above 4000 m has decreased in area since 2004, while the swamp meadow below 4000 m has continued to increase in area. As the temperature increases, the active layer thickens and the groundwater level decreases, resulting in the degradation of the swamp meadow in the high-altitude zone. Meanwhile, the permafrost meltwater at high altitudes collects in the flat land at the low altitude, increasing soil moisture in the flat land at low altitudes, thus promoting the expansion of the swamp meadow in the low-altitude zone, and the plateau ecosystem evolves into an arid community. Thus, the evolution of lowland ecosystems to moist communities occurs [68].
The average annual precipitation in the study area also increased (Figure 10b), and the precipitation increase trend of the two sub-basins was significant, among which the growth rate in the Shule River mainstream source area was 35 mm/10 year and that in the Dang River source area was 19.5 mm/10 years. Therefore, the soil water content of the wetland distribution area in the study area showed an overall increase, which is also beneficial to the development and expansion of wetlands [43]. Human activities are also one of the major factors affecting the change in wetland areas on the Tibet Plateau [69]. In 1988, Qilian Mountain Nature Reserve was approved by the State as a national nature reserve, and in 2006, Gansu Yanchiwan National Nature Reserve was established with the approval of the State Council. The resources of the protected area are under mandatory protection, and any utilization activities such as grazing and mining are prohibited, which promotes the recovery of the ecosystem of the protected area.

4.4. Uncertainty Analysis

The complex topography and geomorphology of the study area, the high degree of fragmentation of surface objects, and the limitation of image resolution lead to misclassification and leakage in wetland extraction [70,71]; this study demonstrates that integrating field surveys with drones can effectively enhance the quality of training samples, thereby improving the accuracy of classification and extraction. However, for long-term historical samples, a reliance on high-resolution imagery for selection may compromise sample quality, ultimately leading to inaccuracies in classification outcomes. Additionally, there are transitional zones between marshes, swamp meadows, and natural grasslands, which exhibit high spatial heterogeneity. This can introduce biases during the delineation of wetland types, resulting in a certain degree of confusion in the classification results [72]. Therefore, to better obtain high-precision long-term wetland information, it is crucial to improve image resolution, enhance the quality and quantity of training samples, and establish a scientific and reasonable wetland classification standard.

5. Conclusions

Relying on the Google Earth Engine cloud platform and the long-time-series Landsat remote sensing dataset, this study integrates the field survey and UAV high-quality sample dataset and adopts the Random Forest method to extract wetland information in the alpine mountainous area of the Shule River Basin from 1987 to 2021 through the spectral, topographic, textural, and vegetation features.
There is significant spatial–temporal heterogeneity in the distribution of wetlands in the study area, and the main types of wetlands in the alpine mountainous area of the Shule River Basin are marsh, swamp meadow, and river and lake water bodies. Of these, the marshes are mainly distributed in the headwaters of the Dang River Basin at an elevation of 2800~3200 m, the swamp meadows are mainly distributed in the Shule River mainstream at an elevation of 3700~4300 m, and the river and lake water body are distributed in the Shule River mainstream and the Dang River Basin. From 1987 to 2021, the alpine wetlands in the study area expanded in all types and sub-basins. The expansion of wetlands in the lower elevation zone was more pronounced than that of wetlands in the higher elevation zone, and it occurred mainly after 2004.
Through this study, the long time series of wetland distribution and more refined wetland types in the alpine mountainous area of the Shule River basin were obtained, which improved the accuracy of the long-time-series analysis of wetland changes in the study area and made the extraction results more responsive to the spatial–temporal heterogeneity of wetlands in the area. Future work can further improve the methods for wetland classification and extraction, as well as the classification criteria for alpine wetlands, and analyze the driving mechanisms of the spatial–temporal heterogeneity of wetlands in the study area. Future work could also provide scientifically sound and rational information on the protection of alpine wetlands, simulation of the water cycle, development and utilization of water resources, and conservation of biodiversity.

Author Contributions

S.T. and D.L. carried out the fieldwork for sample collection; S.T. and D.S. conducted the analysis and prepared the manuscript; D.S., J.W. and R.W. provided overall supervision and contributed to the writing and editing. All authors have read and agreed to the published version of the manuscript.

Funding

This research was funded by the National Natural Science Foundation of China (42330512) and the program of the Key Laboratory of Cryospheric Science and Frozen Soil Engineering, CAS (No. CSFSE-ZZ-2402).

Data Availability Statement

Data sharing is not applicable.

Acknowledgments

We are grateful to the anonymous reviewers and editors for appraising our manuscript and for offering instructive comments. We also appreciate the free access to datasets from the National Tibetan Plateau Data Center, the National Meteorological Science Data Center, the Dangchengwan Hydrology Station, and the Google Earth Engine platform.

Conflicts of Interest

The authors declare no conflicts of interest.

References

  1. Mitsch, W.; Gosselink, J. Wetlands, 5th ed.; John Wiley & Sons: Hoboken, NJ, USA, 2015. [Google Scholar]
  2. Bai, J.H. Alpine Wetlands in China; China Forestry Publishing House: Beijing, China, 2008; pp. 14–22. [Google Scholar]
  3. Dong, L.; Zhang, G. The dynamic evolvement and hydrological driving factors of marsh in Nenjiang River basin. Adv. Water Sci. 2013, 24, 177–183. [Google Scholar]
  4. Chang, Q.; Sun, Z.; Pan, Z. Stream runoff formation and hydrological regulation mechanism in mountainous alpine regions: A review. Earth Sci. 2022, 47, 4196–4209. [Google Scholar]
  5. Werner, B.A.; Johnson, W.C.; Guntenspergen, G.R. Evidence for 20th century climate warming and wetland drying in the North American Prairie Pothole Region. Ecol. Evol. 2013, 3, 3471–3482. [Google Scholar] [CrossRef] [PubMed]
  6. Wang, Y.; Shen, X.; Lü, X. Change characteristics of landscape pattern and climate in marsh areas of Northeast China during 1980–2015. Earth Environ. 2020, 48, 348–357. [Google Scholar]
  7. Han, Y.; Xuegang, C.; Yaqi, W. Dynamic change of Wetland Landscapes in the Ertix River Basin, Xinjiang during the period of 1990–2010. Arid. Zone Res. 2013, 30, 211–218. [Google Scholar]
  8. Zhang, G.; Mengmeng, W.; Tao, Z.; Wenfeng, C. Progress in remote sensing monitoring of lake area, water level, and volume changes on the Tibetan Plateau. Natl. Remote Sens. Bull. 2022, 26, 115–125. [Google Scholar] [CrossRef]
  9. Tong, L.; Xu, X.; Fu, Y.; Li, S. Wetland Changes and Their Responses to Climate Change in the “Three-River Headwaters” Region of China since the 1990s. Energies 2014, 7, 2515–2534. [Google Scholar] [CrossRef]
  10. Lang, Q.; Niu, Z.; Hong, X.; Yang, X. Remote sensing monitoring and change analysis of wetlands in the Tibetan Plateau. Geomat. Inf. Sci. Wuhan Univ. 2021, 46, 230–237. [Google Scholar]
  11. Abdelmajeed, A.Y.A.; Juszczak, R. Challenges and Limitations of Remote Sensing Applications in Northern Peatlands: Present and Future Prospects. Remote Sens. 2024, 16, 591. [Google Scholar] [CrossRef]
  12. Gong, H.; Jiao, C.; Zhou, D.; Li, N. Scale issues of wetland classification and mapping using remote sensing images: A case of Honghe National Nature Reserve in Sanjiang Plain, Northeast China. Chin. Geogr. Sci. 2011, 21, 230–240. [Google Scholar] [CrossRef]
  13. Hubert-Moy, L.; Fabre, E.; Rapinel, S. Contribution of SPOT-7 multi-temporal imagery for mapping wetland vegetation. Eur. J. Remote Sens. 2020, 53, 201–210. [Google Scholar] [CrossRef]
  14. Niculescu, S.; Lardeux, C.; Grigoras, I.; Hanganu, J.; David, L. Synergy Between LiDAR, RADARSAT-2, and Spot-5 Images for the Detection and Mapping of Wetland Vegetation in the Danube Delta. IEEE J. Sel. Top. Appl. Earth Obs. Remote Sens. 2016, 9, 3651–3666. [Google Scholar] [CrossRef]
  15. Tong, X.; Zhu, B.; Gan, H.; Xia, Z.; Wang, K.; Yue, Y.; Li, R. Wetland change in Wangning during 2002 and 2013. In Proceedings of the 19th National Symposium on Remote Sensing of China—Remote Sensing of the Environment, Xian, China, 20–23 September 2014. [Google Scholar]
  16. Li, J.; Bo, Z.; Leng, Z. Current status and prospect of researches on wetland monitoring based on remote sensing. Prog. Geogr. 2007, 26, 33–43. [Google Scholar]
  17. Mahdianpari, M.; Salehi, B.; Mohammadimanesh, F.; Homayouni, S.; Gill, E. The First Wetland Inventory Map of Newfoundland at a Spatial Resolution of 10 m Using Sentinel-1 and Sentinel-2 Data on the Google Earth Engine Cloud Computing Platform. Remote Sens. 2019, 11, 43. [Google Scholar] [CrossRef]
  18. Rapinel, S.; Mony, C.; Lecoq, L.; Clement, B.; Thomas, A.; Hubert-Moy, L. Evaluation of Sentinel-2 time-series for mapping floodplain grassland plant communities. Remote Sens. Environ. 2019, 223, 115–129. [Google Scholar] [CrossRef]
  19. Jia, M.; Wang, Z.; Mao, D.; Ren, C.; Wang, C.; Wang, Y. Rapid, robust, and automated mapping of tidal flats in China using time series Sentinel-2 images and Google Earth Engine. Remote Sens. Environ. 2021, 255, 112285. [Google Scholar] [CrossRef]
  20. Fisher, A.; Flood, N.; Danaher, T. Comparing Landsat water index methods for automated water classification in eastern Australia. Remote Sens. Environ. 2016, 175, 167–182. [Google Scholar] [CrossRef]
  21. Jiao, L.; Sun, W.; Yang, G.; Ren, G.; Liu, Y. A Hierarchical Classification Framework of Satellite Multispectral/Hyperspectral Images for Mapping Coastal Wetlands. Remote Sens. 2019, 11, 2238. [Google Scholar] [CrossRef]
  22. Aslam, R.W.; Naz, I.; Shu, H.; Yan, J.; Quddoos, A.; Tariq, A.; Davis, J.B.; Al-Saif, A.M.; Soufan, W. Multi-temporal image analysis of wetland dynamics using machine learning algorithms. J. Environ. Manag. 2024, 371, 123123. [Google Scholar] [CrossRef]
  23. Breiman, L. Random Forests. Mach. Learn. 2001, 45, 5–32. [Google Scholar] [CrossRef]
  24. Cutler, A.; Cutler, D.; Stevens, J. Random Forests. In Ensemble Machine Learning; Springer: Berlin/Heidelberg, Germany, 2011; Volume 45, pp. 157–176. [Google Scholar] [CrossRef]
  25. Gislason, P.O.; Benediktsson, J.A.; Sveinsson, J.R. Random Forests for land cover classification. Pattern Recognit. Lett. 2006, 27, 294–300. [Google Scholar] [CrossRef]
  26. Alonso, A.; Muñoz-Carpena, R.; Kennedy, R.E.; Murcia, C. Wetland Landscape Spatio-Temporal Degradation Dynamics Using the New Google Earth Engine Cloud-Based Platform: Opportunities for Non-Specialists in Remote Sensing. Trans. Asabe 2016, 59, 1333–1344. [Google Scholar] [CrossRef]
  27. Farda, N.M.; IOP. Multi-temporal Land Use Mapping of Coastal Wetlands Area using Machine Learning in Google Earth Engine. In Proceedings of the 5th Geoinformation Science Symposium (GSS) on Bridging Geospatial Industries and Scientific Research, Univ Gadjah Mada, Yogyakarta, Indonesia, 27–28 September 2017. [Google Scholar]
  28. Yang, L.; Zhengyang, H.; Liqiang, Z.; Ying, Q.; Guoqing, Z.; Jintai, L.; Jingwen, L.; Ke, H. Long-term spatio-temporal changes of wetlands in Tibetan Plateau and their response to climate change. Int. J. Appl. Earth Obs. Geoinf. 2023, 121, 103351. [Google Scholar] [CrossRef]
  29. Liu, Q.; Zhang, Y.; Liu, L.; Wang, Z.; Nie, Y.; Rai, M.K. A novel Landsat-based automated mapping of marsh wetland in the headwaters of the Brahmaputra, Ganges and Indus Rivers, southwestern Tibetan Plateau. Int. J. Appl. Earth Obs. Geoinf. 2021, 103, 102481. [Google Scholar] [CrossRef]
  30. Wu, Y.; Sun, J.; Blanchette, M.; Rousseau, A.N.; Xu, Y.J.; Hu, B.; Zhang, G. Wetland mitigation functions on hydrological droughts: From drought characteristics to propagation of meteorological droughts to hydrological droughts. J. Hydrol. 2023, 617, 128971. [Google Scholar] [CrossRef]
  31. Zhang, L.X.; An, B.; Shu, M.L.; Yang, X.J. Nest-site selection, reproductive ecology and shifts within core-use areas of Black-necked Cranes at the northern limit of the Tibetan Plateau. PeerJ 2017, 5, e2939. [Google Scholar] [CrossRef]
  32. Wu, J.; Li, H.; Zhou, J.; Tai, S.; Wang, X. Variation of Runoff and Runoff Components of the Upper Shule River in the Northeastern Qinghai–Tibet Plateau under Climate Change. Water 2021, 13, 3357. [Google Scholar] [CrossRef]
  33. Lan, Y.; Hu, X.; Xiao, S.; Wen, J.; Wang, G.; Zou, S.; La, C.; Song, J. Study on climate change in mountainous region of Shulehe River Basin in past 50 years and its effect to mountainous runoff. Plateau Meteorol. 2012, 31, 1636–1644. [Google Scholar]
  34. Wu, J.; Chen, J.; Wu, H.; Zhang, S.; Gao, M.; Qin, H. Comparative study of evapotranspiration in an alpine meadow in the upper reach of Shulehe River Basin. Sci. Geogr. Sin. 2013, 33, 97–103. [Google Scholar]
  35. Shiyin, L.; Wanqin, G.; Junli, X. The Second Glacier Inventory Dataset of China (Version 1.0) (2006–2011); National Tibetan Plateau/Third Pole Environment Data Center: Bejing, China, 2012. [Google Scholar] [CrossRef]
  36. Sheng, Y. Distribution patterns of permafrost in the upper area of Shule River with the application of GIS technique. J. China Univ. Min. Technol. 2010, 1, 32–39. [Google Scholar]
  37. Youhua, R.; Xin, L. The Mean Annual Ground Temperature (MAGT) and Permafrost Thermal Stability Dataset over Tibetan Plateau for 2005–2015; National Tibetan Plateau/Third Pole Environment Data Center: Bejing, China, 2019. [Google Scholar] [CrossRef]
  38. Jiang, M.; Zhao, K. Records of Mires in China, 2nd ed.; Science Press: Beijing, China, 2023; pp. 540–549. [Google Scholar]
  39. Hongxia, Z.; Chengzhang, Z.; Yufang, W. Landscape pattern evolution and its influencing factors of alpine wetland in Yanchi Bay. Arid. Zone Res. 2021, 38, 1771–1781. [Google Scholar]
  40. Lv, X. Wetlands and Wetland in China; Hebei Science & Technology Press: Shijiazhuang, China, 2008; pp. 187–203. [Google Scholar]
  41. Zhou, D.; Cheng, J.; Xiong, L. Digital Extraction of Surface Hydrological Elements from DEM Data in the Wetland Area of a Flood Plain. Sci. Geogr. Sin. 2008, 28, 776–781. [Google Scholar]
  42. GB/T 24708-2009; Wetland Classification. National Standards of People’s Republic of China: Bejing, China, 2009.
  43. Shengyun, C.; Wenjie, L.; Xiang, Q.; Yushuo, L.; Tongzuo, Z.; Kelong, C.; Fengzu, H.; Jiawen, R.; Dahe, Q. Response characteristics of vegetation and soil environment to permafrost degradation in the upstream regions of the Shule River Basin. Environ. Res. Lett. 2012, 7, 045406. [Google Scholar] [CrossRef]
  44. Ge, X.; Sun, X.; Liu, Z. Object-Oriented Coastline Classification and Extraction from Remote Sensing Imagery; SPIE: Bellingham, WA, USA, 2014; Volume 9158. [Google Scholar]
  45. Chen, W.; Ding, J.; Li, Y.; Niu, Z. Extraction of water information based on China-made GF-1 remote sense image. Resour. Sci. 2015, 37, 1166–1172. [Google Scholar]
  46. Yang, W.; Kobayashi, H.; Wang, C.; Shen, M.; Chen, J.; Matsushita, B.; Tang, Y.; Kim, Y.; Bret-Harte, M.S.; Zona, D.; et al. A semi-analytical snow-free vegetation index for improving estimation of plant phenology in tundra and grassland ecosystems. Remote Sens. Environ. 2019, 228, 31–44. [Google Scholar] [CrossRef]
  47. Yun, H.; Chong, H.; He, L.; Qingsheng, L.; Gaohuan, L.; Zhenchao, Z.; Chenchen, Z. Land-cover classification of random forest based on Sentinel-2A image feature optimization. Resour. Sci. 2019, 41, 992–1001. [Google Scholar]
  48. Wu, J.; Sheng, Y.; Li, J.; Wang, J. Permafrost in source areas of Shule River in Qilian Mountains. Acta Geogr. Sin. 2009, 64, 571–580. [Google Scholar]
  49. Chen, J.; Chen, J.; Liao, A.; Cao, X.; Chen, L.; Chen, X.; He, C.; Han, G.; Peng, S.; Lu, M.; et al. Global land cover mapping at 30 m resolution: A POK-based operational approach. ISPRS J. Photogramm. Remote Sens. 2015, 103, 7–27. [Google Scholar] [CrossRef]
  50. Zhang, X.; Liu, L.; Chen, X.; Gao, Y.; Xie, S.; Mi, J. GLC_FCS30: Global land-cover product with fine classification system at 30 m using time-series Landsat imagery. Earth Syst. Sci. Data 2021, 13, 2753–2776. [Google Scholar] [CrossRef]
  51. Zanaga, D.; Van De Kerchove, R.; De Keersmaecker, W.; Souverijns, N.; Brockmann, C.; Quast, R.; Wevers, J.; Grosu, A.; Paccini, A.; Vergnaud, S.; et al. ESA WorldCover 10 m 2020 v100. 2021. Available online: https://zenodo.org/records/5571936 (accessed on 1 January 2020).
  52. Gong, P.; Wang, J.; Huang, H. Stable classification with limited samples in global land cover mapping: Theory and experiments. Sci. Bull. 2024, 69, 1862–1865. [Google Scholar] [CrossRef]
  53. Bai, Y.; Feng, M.; Jiang, H.; Wang, J.; Zhu, Y.; Liu, Y. Assessing Consistency of Five Global Land Cover Data Sets in China. Remote Sens. 2014, 6, 8739–8759. [Google Scholar] [CrossRef]
  54. Wang, Y.; Xu, Y.; Xu, X.; Jiang, X.; Mo, Y.; Cui, H.; Zhu, S.; Wu, H. Evaluation of six global high-resolution global land cover products over China. Int. J. Digit. Earth 2024, 17, 2301673. [Google Scholar] [CrossRef]
  55. Liu, X.-J.; Zhang, Y.-B.; Wang, Y.-M.; Yang, H.-R.; Ma, Z.-B.; Dong, W.-T.; Yang, J.-C.; Dabuxilite; Wuliji. Spermatophyte diversity and flora in wetland of Yanchiwan National Nature Reserve in Gansu. J. Gansu Agric. Univ. 2018, 53, 18–126. [Google Scholar]
  56. Comber, A.; Fisher, P.; Wadsworth, R. Integrating land-cover data with different ontologies: Identifying change from inconsistency. Int. J. Geogr. Inf. Sci. 2004, 18, 691–708. [Google Scholar] [CrossRef]
  57. Wang, Z.-W.; Wang, Q.; Zhao, L.; Wu, X.-D.; Yue, G.-Y.; Zou, D.-F.; Nan, Z.-T.; Liu, G.-Y.; Pang, Q.-Q.; Fang, H.-B.; et al. Mapping the vegetation distribution of the permafrost zone on the Qinghai-Tibet Plateau. J. Mt. Sci. 2016, 13, 1035–1046. [Google Scholar] [CrossRef]
  58. Zou, D.; Zhao, L.; Liu, G.; Du, E.; Hu, G.; Li, Z.; Wu, T.; Wu, X.; Chen, J. Vegetation Mapping in the Permafrost Region: A Case Study on the Central Qinghai-Tibet Plateau. Remote Sens. 2022, 14, 232. [Google Scholar] [CrossRef]
  59. Wang, G.; Li, Y.; Wang, Y.; Chen, L. Typical alpine wetland system changes on the Qinghai-Tibet Plateau in recent 40 years. Acta Geogr. Sin. 2007, 62, 481–491. [Google Scholar]
  60. Liu, Z.-W.; Li, S.-N.; Wei, W.; Song, X.-J. Research progress on alpine wetland changes and driving forces in Qinghai-Tibet Plateau during the last three decades. Chin. J. Ecol. 2019, 38, 856. [Google Scholar]
  61. Liu, S.; Ding, Y.; Li, J.; Shangguan, D.; Zhang, Y. Glaciers in Response to Recent Climate Warming in Western China. Quat. Sci. 2006, 26, 762–771. [Google Scholar]
  62. Meiping, S.U.N.; Shiyin, L.I.U.; Xiaojun, Y.A.O.; Wanqin, G.U.O.; Junli, X.U. Glacier changes in the Qilian Mountains in the past half century: Based on the revised First and Second Chinese Glacier Inventory. Acta Geogr. Sin. 2015, 70, 1402–1414. [Google Scholar] [CrossRef]
  63. Li, H.; Zhao, Q.; Wu, J.; Ding, Y.; Qin, J.; Wei, H.; Zeng, D. Quantitative simulation of the runoff components and its variation characteristics in the upstream of the Shule River. J. Glaciol. Geocryol. 2019, 41, 907–917. [Google Scholar]
  64. Lin, Z.; Guojie, H.; Defu, Z.; Xiaodong, W.; Lu, M.; Zhe, S.; Liming, Y.; Huayun, Z.; Shibo, L. Permafrost changes and its effects on hydrological processes on Qinghai-Tibet Plateau. Bull. Chin. Acad. Sci. (Chin. Version) 2019, 34, 1233–1246. [Google Scholar]
  65. Xue, Z.; Lyu, X.; Chen, Z.; Zhang, Z.; Jiang, M.; Zhang, K.; Lyu, Y. Spatial and Temporal Changes of Wetlands on the Qinghai-Tibetan Plateau from the 1970s to 2010s. Chin. Geogr. Sci. 2018, 28, 935–945. [Google Scholar] [CrossRef]
  66. Jorgenson, M.T.; Shur, Y.L.; Pullman, E.R. Abrupt increase in permafrost degradation in Arctic Alaska. Geophys. Res. Lett. 2006, 33. [Google Scholar] [CrossRef]
  67. Beck, P.S.A.; Goetz, S.J. Satellite observations of high northern latitude vegetation productivity changes between 1982 and 2008: Ecological variability and regional differences. Environ. Res. Lett. 2011, 6, 045501. [Google Scholar] [CrossRef]
  68. Jin, X.-Y.; Jin, H.-J.; Iwahana, G.; Marchenko, S.S.; Luo, D.-L.; Li, X.-Y.; Liang, S.-H. Impacts of climate-induced permafrost degradation on vegetation: A review. Adv. Clim. Change Res. 2021, 12, 29–47. [Google Scholar] [CrossRef]
  69. Hou, M.-J.; Gao, J.-L.; Ge, J.; Li, Y.-C.; Liu, J.; Yin, J.-P.; Feng, Q.-S.; Liang, T.-G. An analysis of dynamic changes and their driving factors in marsh wetlands in the eastern Qinghai-Tibet Plateau. Acta Prataculturae Sin. 2020, 29, 13. [Google Scholar]
  70. Li, J.; Warner, T.; Wang, Y.; Bai, J.; Bao, A. Mapping glacial lakes partially obscured by mountain shadows for time series and regional mapping applications. Int. J. Remote Sens. 2018, 40, 615–641. [Google Scholar] [CrossRef]
  71. Niu, Z.-G.; Jing, Y.-H.; Zhang, D.-Q.; Zhang, B. An overview and the outlook for wetland ecosystems in the Qinghai-Tibetan Plateau under climate change. Adv. Clim. Change Res. 2024, 20, 509. [Google Scholar]
  72. Kassawmar, T.; Eckert, S.; Hurni, K.; Zeleke, G.; Hurni, H. Reducing landscape heterogeneity for improved land use and land cover (LULC) classification across the large and complex Ethiopian highlands. Geocarto Int. 2018, 33, 53–69. [Google Scholar] [CrossRef]
Figure 1. A study area diagram showing the following: (a) the location of the Shule River Basin in China, the dashed line indicates the coastline of China; (b) the location of the study area on the Shule River Basin; (c) study area information and field samples taken with a UAV and digital camera. The towns Suli (SL), Yanchiwan (YCW), and Changma (CM) are indicated by the red pentagram.
Remotesensing 17 00976 g001
Figure 2. A workflow for wetland mapping.
Remotesensing 17 00976 g002
Figure 3. Wetland types (the red lines show the example areas). (a,b) classification maps of the examples; (c,d) higher-resolution images of the examples; (e,f) UAV images of the examples; (g,h) field photos of the examples corresponding to the red line areas.
Remotesensing 17 00976 g003
Figure 4. Land cover distribution of the study area in 2021 and the proportion of different land cover types, the proportion of different wetland types in the study area.
Remotesensing 17 00976 g004
Figure 5. Elevation distribution of wetlands in 2021. Lines in corresponding colors indicate the fitted lines of the columnar distribution.
Remotesensing 17 00976 g005
Figure 6. Spatial distribution characteristics of wetlands in typical areas in 1987, 2003, and 2021.
Remotesensing 17 00976 g006
Figure 7. Trends in the marsh at different altitudes.
Remotesensing 17 00976 g007
Figure 8. Trends in swamp meadows at different altitudes.
Remotesensing 17 00976 g008
Figure 9. Spatial consistency analysis: (a) SL classification results vs. Globeland30 and GLC_FCS30; (b) SL classification results vs. ESA worldcover and FROM_GLC; (c) YCW classification results vs. Globeland30 and GLC_FCS30; (d) YCW classification results vs. ESA worldcover and FROM_GLC.
Remotesensing 17 00976 g009
Figure 10. Annual average temperature (a) and precipitation (b) in Tuole National Meteorological Station and Dangchengwan Hydrology Station from the 1987 to 2021.
Remotesensing 17 00976 g010
Table 1. Classification system for remote sensing.
Land Cover TypesDescriptionDigital CameraUAVHigh-Resolution Image
marshFreshwater marshes with dominant aquatic and marshy herb communities dominated by Najadacea, Zannichelliaceae, and Triglochin maritimum, shallow water depthRemotesensing 17 00976 i001Remotesensing 17 00976 i002Remotesensing 17 00976 i003
swamp meadowThe soil is developed under an excessively humid environment, the water depth is shallow, and plants such as Blysmus sinocompressus, and Kobresia littledaleiRemotesensing 17 00976 i004Remotesensing 17 00976 i005Remotesensing 17 00976 i006
natural grasslandVarious types of grassland mainly growing herbaceous plants with a coverage of more than 5%, including shrubland grassland mainly grazing and sparsely forested grassland with a canopy of less than 10%
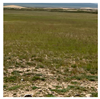
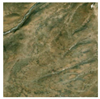
Remotesensing 17 00976 i007Remotesensing 17 00976 i008Remotesensing 17 00976 i009
bare landSoil cover, vegetation coverage below 5% of the land Remotesensing 17 00976 i010Remotesensing 17 00976 i011Remotesensing 17 00976 i012
glacierLand that is covered by glaciers and snow all year roundRemotesensing 17 00976 i013Remotesensing 17 00976 i014Remotesensing 17 00976 i015
river and lake water bodyNaturally formed rivers and waterlogged areas and land below the perennial water levelRemotesensing 17 00976 i016Remotesensing 17 00976 i017Remotesensing 17 00976 i018
Table 2. UAV aerial survey details.
Wetland TypesElevation/mLocation
river and lake water body, swamp meadow202096.80°E, 39.88°N
river and lake water body, swamp meadow206196.76°E, 39.86°N
river and lake water body262095.11°E, 39.44°N
swamp meadow383998.31°E, 38.46°N
marsh385098.43°E, 38.45°N
river and lake water body385698.40°E, 38.46°N
marsh390498.55°E, 38.46°N
Table 3. Description of the features.
ClassVariableDescription and Equation
Spectral bandsBandBand1, Band2, Band3, Band4, Band5, Band7 (TM)
Band2, Band3, Band4, Band5, Band6, Band7 (OLI)
Spectral indexNormalized Difference Water Index (NDWI)NDWI = (GREEN − NIR)/(GREEN + NIR)
Modified Soil adjusted Vegetation Index (MSAVI) M S A V I = [ 2 N I R + 1 2 N I R + 1 2 8 N I R R E D ] / 2
Shadow Water Index (SWI) [45]SWI = BLUE + GREEN − NIR
Normalized Difference Vegetation Index (NDVI)NDVI = (NIR − RED)/(NIR + RED)
Redness Index (RI)RI = (RED − GREEN)/(RED + GREEN)
Normalized Difference Greenness Index (NDGI) [46]NDGI = (0.65GREEN + 0.35NIR − RED)/(0.65GREEN + 0.35NIR + RED)
Difference Vegetation Index (DVI)DVI = NIR − RED
Ratio Vegetation Index (RVI)RVI = NIR/RED
Transformed Vegetation Index (TVI) T V I = N D V I + 0.5
Wetness Index (WI)Tasseled Cap Wetness
Brightness Index (BI)Tasseled Cap Brightness
Green Index (GI)Tasseled Cap Greenness
TextureGLCMASM, IDM, SAVG, SVAR
TopographyElevationDEM
SlopeDEM
Table 4. Precision Evaluation.
LandcoverRiver and Lake Water BodySwamp MeadowMarshNatural GrasslandBare LandGlacier
User
accuracy
97.2%91.3%93.4%95.0%94.57%99.16%
Producer accuracy96.6%90.8%93.9%96.5%93.72%96.19%
Overall accuracy = 94.8%, Kappa coefficient = 0.932.
Disclaimer/Publisher’s Note: The statements, opinions and data contained in all publications are solely those of the individual author(s) and contributor(s) and not of MDPI and/or the editor(s). MDPI and/or the editor(s) disclaim responsibility for any injury to people or property resulting from any ideas, methods, instructions or products referred to in the content.

