Abstract
Changes in carbon stock are a key indicator for assessing the carbon-pool function and the impact of regional carbon cycling on climate. Mangroves, as an essential component of coastal ecosystems, play a critical role in carbon sequestration. However, traditional carbon-sink assessments often overlook biophysical differences between mangrove species and depend on field measurements, which are constrained by the challenging geographical conditions of the intertidal zone. This leads to biases and operational difficulties in estimating carbon stock. To address these challenges, this study proposes a fine-scale method for inter-species carbon-stock assessment, integrating mangrove three-dimensional structural information and spectral characteristics through Google Earth Engine (GEE). By combining GEDI data and Sentinel-2 imagery, this approach incorporates both vertical structure and spectral characteristics, overcoming the limitations of traditional models that neglect inter-species differences and vertical structural information. As a result, the accuracy of carbon-stock estimation is significantly improved. Unlike previous studies, this paper achieves a fully remote sensing-based partial carbon-stock assessment for mangrove species and quantifies carbon stock using the InVEST model, addressing the limitations of previous carbon-sink models. Specifically, on the GEE platform, Sentinel-2 imagery is used for inter-species classification through a random forest (RF) model, while a relationship model between canopy height and biomass is established using GEDI data to estimate biomass. To optimize feature selection, this study introduces a forward feature selection (FFS) approach, which incrementally selects the most predictive features, enhancing the stability and accuracy of the model. By combining biomass and classification results, a remote sensing-based carbon-sink assessment for mangroves is achieved. The study quantifies and visualizes the carbon stock of different mangrove species in Dongzhaigang, revealing that the region’s annual carbon stock totals 302,558.77 t. This validates the superiority and accuracy of the proposed method.
1. Introduction
Globally, the protection and restoration of coastal wetlands have been widely recognized and implemented by governments and international organizations as strategic measures to combat climate change [1]. Mangroves, along with other coastal wetlands, play a crucial role in carbon sequestration, with their carbon capture per unit area significantly exceeding that of adjacent forest ecosystems and most inland wetlands [2]. Consequently, mangroves are essential to the global carbon cycle and in reducing atmospheric levels [3], making them a key nature-based solution for mitigating climate change [4]. Accurate research methods for detecting mangrove carbon sequestration and its changes are vital for improving the precision of carbon-stock estimates [5]. Furthermore, the precise classification of mangrove species aids in understanding the spatial distribution and biomass of different vegetation types [6], which is crucial for both accurate carbon-stock estimation and effective wetland management [7]. Currently, mangroves in China are facing severe threats, with the area of mangrove forests having decreased by 30–50% over the past half-century, leading to a significant loss of carbon stocks [4]. Since 2000, the government has implemented a series of conservation and restoration measures, gradually reversing this trend [8]. Among them, Dongzhaigang stands out as the largest and earliest mangrove nature reserve in China, with a rich diversity of species and comprehensive interspecies classification research, making it highly representative and widely applicable.
Early traditional carbon-stock estimation methods, such as the felling method [9] and the average tree method [10], rely heavily on field sampling. However, these methods are costly and inefficient, which limits their ability to estimate and monitor mangrove carbon stocks over medium to large-scale regions [2] with the advancement of observational technologies, numerous carbon-stock models have been developed. Among them, the allometric growth equation model [11], a widely used empirical model [4], is based on in-situ measurements of tree height, diameter at breast height, and density [12]. Although this model is environmentally friendly, efficient, and cost effective, it overlooks the underground carbon pool, dead carbon pool, and litter carbon pool, which are important components of the overall carbon stock. In recent years, the Natural Capital Project at Stanford University developed the InVEST model [13], which provides a more comprehensive assessment of carbon stock across entire ecosystems [14]. However, this model often neglects the influence of vegetation type on carbon density. The integration of remote sensing technology with carbon-stock models has become a key trend for medium to large-scale carbon-stock assessments [2]. In particular, statistical models have gained widespread use in remote sensing-based mangrove biomass estimation [15], encompassing both parametric and non-parametric approaches [16,17]. By establishing a relationship between remote sensing features and biomass, these models significantly improve estimation accuracy [18]. Studies have shown that non-parametric statistical models offer greater precision in biomass estimation for mixed tree species [19,20]. For instance, Cao [21] used the K-nearest neighbor algorithm combined with multivariate stepwise regression analysis to estimate mangrove biomass at various scales. Additionally, Tian [22] compared the performance of the RF model with other regression models in estimating mixed forest biomass, finding that the RF model significantly outperforms the other parametric models in prediction accuracy. Given these considerations, this paper combines the InVEST model and the RF model, accounting for inter-species differences without disrupting the vegetation, and fully leverages remote sensing observation data to create an efficient framework for biomass estimation.
The carbon stock of the mangrove ecosystem consists mainly of vegetation carbon stock and sediment carbon stock [23]. Among these, the vegetation carbon pool includes three components: aboveground live biomass carbon pool, belowground live biomass carbon pool, and aboveground dead biomass carbon pool [24]. The aboveground carbon pool can be measured using remote sensing techniques [25], while the belowground carbon stock is difficult to directly measure through remote sensing due to its concealment and depth. Consequently, it is typically estimated using indirect methods such as soil sampling analysis, ground surveys, and model calculations [26,27]. Therefore, existing research often focuses solely on estimating aboveground carbon stock, neglecting the comprehensive assessment of belowground carbon stock and other carbon pools within the ecosystem.
The biodiversity of mangrove species leads to differences in carbon stock, and the common occurrence of mixed-species populations and spectral similarities further complicate the classification process [28] making accurate classification and evaluation of mangroves challenging [29]. Since existing studies primarily rely on optical remote sensing data, achieving high-precision inter-species classification is difficult. Consequently, mangroves are often treated as a single entity, neglecting the impact of species differences on carbon sequestration estimates. This issue is particularly evident in the Dongzhaigang area. For mangroves with mixed-species populations, accurately defining their distribution and classifying species are key tasks in carbon sequestration research [24]. This study addresses the limitations of traditional models that overlook inter-species differences by combining multi-source imagery data with the high-precision RF algorithm, revealing the distribution of different mangrove species. The classification accuracy of the RF model is closely related to the quality and selection of input features [30]. Previous studies often used fixed feature sets without optimizing the selection of features. In this study, we applied the forward feature selection with random forest (FFS-RF) method, which iteratively adds features that maximize model performance and eliminates irrelevant features, ultimately selecting the optimal feature subset. This approach effectively improved the model performance and generalization ability.
The accurate estimation of mangrove carbon stock relies on precise biomass measurements, which are closely related to the biophysical parameters of mangrove trees, such as diameter at breast height and tree height [31,32]. Canopy height, as a core parameter for estimating aboveground biomass (AGB), is crucial for assessing mangrove carbon-storage capacity [33]. However, due to the inaccessibility of the intertidal zone where mangroves grow, traditional field measurement methods face operational difficulties and are prone to human influence. Although airborne radar offers high precision and flexibility in small-scale areas, its coverage is limited, and the cost is high. With the rapid development of satellite remote sensing technology, optical satellites and LiDAR satellites have become effective tools for obtaining key parameters such as the distribution of mangrove ecosystems and canopy height [34]. These technologies offer broad coverage, high efficiency, and repeatability, effectively overcoming the limitations of the airborne radar. In particular, spaceborne LiDAR has demonstrated significant advantages in estimating canopy height, providing high-precision, high-density three-dimensional spatial information, and accurately capturing vertical structural information of vegetation, thus addressing the limitations of traditional models that ignore vertical structure data. However, the lack of spectral information remains a major drawback in species classification. Therefore, combining LiDAR data with optical remote sensing data can complement each other to mitigate the impact of human factors on field measurements, thus enhancing the accuracy and efficiency of mangrove biomass estimation.
In recent years, with the rapid development of remote sensing technology and cloud computing platforms, GEE has been widely applied in environmental monitoring and ecological research due to its powerful data processing and analysis capabilities. This study utilizes the GEE platform, as it provides access to global open remote sensing datasets and can efficiently process multi-source remote sensing data without requiring high-performance local computing resources. This enables long-term, large-scale mangrove monitoring and carbon-stock estimation. In the Dongzhaigang region, a method combining spaceborne LiDAR data and optical imagery has been proposed, using Sentinel-2 remote sensing imagery data to determine the extent and species of mangroves. By selecting features for input into the RF model, the accuracy of mangrove species classification has been significantly improved. Additionally, GEDI point-cloud data are used to retrieve canopy-height information, and a tree height–biomass model is established to estimate biomass. As a result, the distribution and species-specific classification of mangroves in Dongzhaigang are determined, and the biomass and carbon stock in the region are quantified and visualized.
The main contributions of this study are as follows:
- This study proposes an FFS-RF method for accurately classifying different mangrove species. By integrating spectral, texture, terrain, and band features, the feature-selection process of the RF algorithm is optimized. This approach not only enhances the classification accuracy between species, but also significantly improves the precision of mangrove carbon-stock estimation.
- A method combining spaceborne LiDAR data and optical imagery for assessing mangrove carbon stocks is proposed. By integrating high-resolution canopy structure data from GEDI with rich spectral features from Sentinel-2 imagery, the limitations of using each data source are overcome independently. This fusion improves the accuracy of canopy-height inversion, as well as the estimation of both AGB and belowground biomass (BGB), and the carbon stocks of the entire ecosystem.
- Spatial Trend Analysis of Dongzhaigang Mangroves:Using GEE remote sensing imagery and the FFS-RF classification model, this study mapped the mangrove distribution in Dongzhaigang. The results showed a total mangrove area of 1837.18 hectares (ha) in 2020, with a classification accuracy of 97.13%. The main species identified include Bruguiera sexangula, Bruguiera sexangular rhynchopetala (BS-BG), Rhizophora stylosa (RS), and Ceriops tagal (CT), among others. The spatial distribution of biomass and carbon stocks revealed an increasing trend from the coast to the inland, with higher values in the south and lower in the north, providing valuable data for carbon-stock estimation and species conservation.
2. Material and Method
2.1. Study Area
Dongzhaigang is located in northeastern Hainan Province, China, at geographic coordinates 19°51′–20°01′N latitude and 110°32′–110°37′E longitude (Figure 1). It lies between Haikou City and Wenchang City and is the first mangrove nature reserve in China. Dongzhaigang is notable for its abundance of mangrove resources and diversity of tree species, making it one of the most valuable mangrove reserves in China for research. The reserve hosts 11 species from 8 genera across 5 families, demonstrating its ecological significance. The dominant mangrove species include BG, BS, CT, Kandelia candel (KC), RS, Sonneratia apetala (SA), Avicennia marina (AM), Aegiceras corniculatum (AC), and Lumnitzera racemosa (LR). The climate is tropical monsoon, with an average annual temperature of 23.8 °C and annual precipitation of 1615 mm [35].
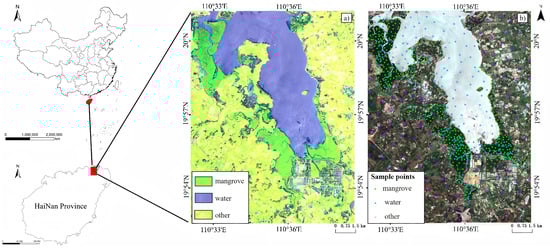
Figure 1.
The location of Dongzhaigang in Hainan Province, China, with Sentinel-2 satellite imagery covering the area: (a) using the B11, B8, and B3 band combination; (b) showing the distribution of sample points for mangroves and other land covers.
2.2. Remote Sensing Data and Preprocessing
2.2.1. Optical Dataset Collection
Sentinel-2: Sentinel-2 provides 10m medium-high resolution multispectral imagery, widely used in vegetation, soil, and ocean monitoring and classification. This study selected the Level-2A surface reflectance dataset of Sentinel-2 for 2020, which has undergone atmospheric correction, geometric correction, and orthorectification, including 9 bands (B2-B8, B11 and B12). Images from this year with cloud coverage below 20% were filtered and median composites were generated.
2.2.2. Radar Data Collection
SRTM(Shuttle Radar Topography Mission): The digital elevation model (DEM) is a reliable tool for accurately extracting topographic features of mangroves and other coastal objects [28]. SRTM DEM, acquired from the SRTM, offers global elevation data at a 30 m resolution, covering nearly all of the world’s terrain. In this study, the SRTM DEM was employed to derive elevation, shade, aspect, and slope, which served as feature parameters for modeling.
GEDI: The GEDI mission, which uses laser pulses from the International Space Station, provides key biomass data for precise measurement of forest three-dimensional structure [36]. These data are crucial for ecosystem research and carbon cycle assessments. GEDI surpasses the widely used ICESat/GLAS satellite radar project in terms of waveform precision and sampling density, offering more comprehensive coverage of global forest ecosystems [37]. GEDI data products are available in seven levels, and this study utilizes Level 2A data, which includes detailed forest parameters such as canopy height and profile metrics [38]. In this research, the relative height 95 (RH95) is used as a relative height indicator, which is a key parameter for assessing mangrove canopy height. The footprint resolution of the GEDI data is usually 25 m. It accurately captures the upper canopy cover, reduces the impact of extreme values, and ensures the stability of the data and the accuracy of biomass estimates. Through this method, GEDI data provide robust support for the comprehensive analysis and carbon-stock assessment of mangrove ecosystems.
2.2.3. Data Preprocessing
The data used in this study include Sentinel-2, GEDI, and SRTM data. The 2020 Sentinel-2 data were processed and analyzed using the GEE platform. To eliminate the influence of clouds and cirrus clouds, the QA60 quality assessment band of Sentinel-2 images was utilized. This band stores quality information for each pixel using a 16-bit mask, specifically detecting clouds and cirrus clouds. By analyzing the 10th and 11th bits of the QA60 band, a cloud-masking function was developed to mask out cloud and cirrus pixels and normalize the reflectance values to a range of 0–1. To improve the image quality and accuracy, the median value of each pixel in the image collection was calculated to generate an annual median composite image. By taking the median value of the same pixel across all images in a year, extreme values caused by short-term cloud cover or noise are effectively removed, reducing short-term noise interference and partially compensating for missing image data. This process results in a more complete and cloud-free composite image. Finally, the composite image was reprojected and clipped to the specified boundaries for visualization.
For the GEDI data, preprocessing involved selecting Level 2A products, which provide detailed canopy-height information and vertical structure metrics. The data were filtered to exclude low-quality echoes and non-vegetated surfaces, ensuring high precision in canopy-height measurements. The RH95 index, a relative height metric, was extracted for canopy-height modeling in the study area.
For the SRTM DEM data, the global elevation data with a 30 m resolution were used to extract terrain features, including elevation, slope, and aspect. By combining these terrain features with the Sentinel-2 optical image data, a more comprehensive representation of the physical environment in the mangrove area was achieved, providing richer input features for subsequent classification. During the feature extraction process, spectral features from the Sentinel-2 images and terrain features from the SRTM DEM were integrated, and a RF algorithm was used for detailed mangrove classification. The RF algorithm, which can handle high-dimensional data, demonstrates excellent classification performance and generalization ability, helping to accurately distinguish between different mangrove species.
2.3. Method
This study used multi-source remote sensing data (Sentinel-2, SRTM, and GEDI) on the GEE platform to analyze the distribution, biomass, and carbon stock of mangroves in Dongzhaigang. Our overall research is divided into four main parts: data processing, feature extraction and selection, modeling and classification, and carbon-stock estimation and visualization. The technical workflow is illustrated in Figure 2.
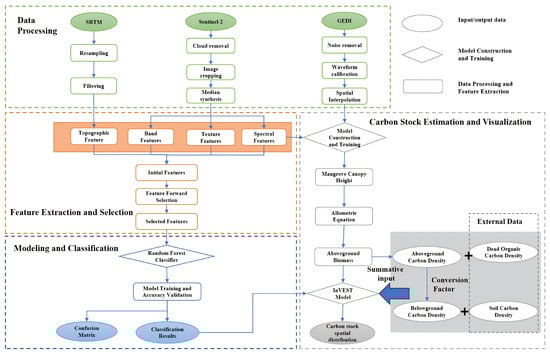
Figure 2.
Methodology flow chart.
Data Processing: Sentinel-2 data were filtered and clipped based on annual imagery, generating high-quality, cloud-free images through cloud removal and median compositing. SRTM DEM terrain data were resampled and filtered to ensure the accurate extraction of terrain features, while GEDI data underwent noise removal and waveform calibration to reflect the canopy-height distribution accurately.
Feature Extraction and Selection: In the feature-extraction and selection stage, terrain features were extracted from the SRTM data, and spectral, band, and texture features were derived from the Sentinel-2 imagery. These features were initially used as input to the model, and then the FFS-RF method was applied to progressively add the most predictive features. This process continued until the model performance no longer improved significantly or the predefined number of features was reached.
Modeling and Classification: In the modeling and classification stage, a RF classifier was employed to identify the spatial distribution of mangrove species based on the selected features. Model training, validation, and confusion matrix evaluation were performed to assess classification accuracy. The spatial distribution and coverage area of each species were output, providing essential data for subsequent biomass estimation.
Carbon-Stock Estimation and Visualization: The optical features from Sentinel-2 were combined with GEDI data, and an RF regression model was applied to invert canopy height. Using allometric growth equations, aboveground biomass was estimated from canopy height, and combined with spatial distribution results and species-specific carbon content coefficients to estimate both aboveground and belowground carbon stocks. The InVEST model was further used to comprehensively analyze aboveground, belowground, dead organic matter, and soil carbon, providing a complete estimate of the study area’s carbon stock and generating a spatial distribution map to visualize the carbon-storage patterns and changes.
2.3.1. Feature Introduction for Mangrove Species Classification
Until now, RF has been recognized as one of the most widely used algorithms for mangrove species classification, achieving high accuracy in tasks such as mangrove range extraction [39] and species identification [40]. Most existing studies rely on empirical feature selection, where selecting the appropriate features is critical for improving mangrove extraction accuracy [41]. While RF algorithms are known for their robustness to high-dimensional data [42], using too many features can increase the computational complexity of both model training and prediction [43]. Therefore, key features need to remove noise and unimportant features to improve computational efficiency and reduce redundancy. Retaining key features can significantly improve the model interpretation power, reduce the risk of overfitting, and enhance the model performance [44].
In this study, 26 features were initially used for Dongzhai Harbor mangrove interspecies classification, including 9 Sentinel-2 L2A bands, 9 spectral indices, 4 texture features, and 4 topographic features, as shown in Table 1. The selected bands include blue (B2), green (B3), red (B4), near-infrared (NIR, B8), short-wave infrared 1 (SWIR1, B11), and short-wave infrared 2 (SWIR2, B12) to provide information most relevant to the characteristics of mangrove vegetation while avoiding unnecessary data-processing complexity. The nine selected spectral indices, including Normalized Difference Vegetation Index (NDVI), Normalized Difference Water Index (NDWI), Enhanced Vegetation Index (EVI), Normalized Difference Moisture Index (NDMI), Mangrove Vegetation Index (MVI), Modified Normalized Difference Water Index (MNDWI), Enhanced Vegetation Index (EVI), Inundated Mangrove Forests Index (IMFI), Difference Vegetation Index (DVI), and Red-Edge Normalized Difference Vegetation Index (RENDVI), can provide key information on vegetation health, moisture conditions, growth conditions, and biodiversity. The combination of topographic features (such as slope and elevation) with optical remote sensing data helps to better analyze the surface characteristics and three-dimensional structure of mangroves. Texture features extracted using the Gray-Level Co-occurrence Matrix (GLCM) [45], such as correlation, variance, inverse difference moment, and contrast, contribute to improving the accuracy of species classification.

Table 1.
The list of indices derived from Sentinel-2 and SRTM data. (Note: N represents the number of gray levels; denotes the probability of transition from gray level to gray level ; and represent the mean and standard deviation of gray level , respectively).
While single spectral information has limitations in distinguishing mangroves from other vegetation types, incorporating texture and terrain features can significantly improve model accuracy and precision [31]. During model construction, the optimal feature combination was selected through cross-validation and performance evaluation methods to enhance classification accuracy. These features were used for the mangrove classification feature combination optimization experiment.
2.3.2. Inter-Species Classification Based on Forward Feature Selection Combined with the Random Forest
The feature-selection method used in this study is FFS-RF, which is a dynamic and interactive greedy algorithm. It can effectively consider the interactions between features.
Initialization is performed first, starting with an empty feature set ; the RF classifier is defined as , where X represents the feature matrix of the training samples and y corresponds to their labels. Next, FFS is applied. In each iteration, a feature is selected from the unchosen feature set such that adding this feature maximizes the model performance . Specifically, RF are used as the classifier to evaluate the performance of each candidate feature.
Then, the current feature set is updated:
The most predictive features are gradually added through forward feature selection until the optimal feature set is gradually constructed. At each step, we train the RF classifier against the feature subset and evaluate the classification performance:
where is the training subset generated by automatic sampling, and only the features in the feature set are used for each tree in the training process.
Through FFS, the most predictive features are progressively added until the optimal feature set is built. At each step, the RF classifier is trained using the feature subset, and the classification performance is evaluated:
where N is the number of samples, is the geographic location information (latitude and longitude) of the species, T() is the prediction made by the RF model for sample , and is the class label of sample k, representing the species category. Finally, we evaluated the classification performance of the selected feature set by using the classification accuracy A().
Finally, the feature set selected by FFS is used to train the RF classifier, generating the final classification model.
The experimental results are presented in Section 3.1. Through an iterative process, the most predictive feature set was retained, which significantly improved classification accuracy and reduced computational complexity. Feature selection effectively delineates the spatial distribution of different mangrove species, offering valuable data for estimating the spatial distribution of carbon stocks. This process highlights the importance of the FFS-RF model in improving classification precision and optimizing computational efficiency.
2.3.3. Incorporating Canopy-Height Extrapolation Using GEDI and Sentinel-2
GEDI data, with their high spatial and vertical resolution, offer consistent three-dimensional structural information across large areas, making it particularly useful for measuring canopy height in complex mangrove regions. Compared to traditional ground-based methods, this approach helps avoid biases that can arise from variations in measurement conditions or personnel experience. However, GEDI data alone have some limitations. Previous studies have demonstrated that combining optical and LiDAR data can enhance both the spatial continuity and accuracy of canopy-height inversion [55,56]. Thus, in this study, the spectral data from Sentinel-2 are integrated with the height measurements from GEDI to improve the overall estimation.
This study developed a mangrove height inversion model on the GEE platform. The GEDI L2A data product, which provides preprocessed laser waveforms and height metrics, was obtained from the GEE platform for the period from January 2020 to December 2020. To map the continuous canopy-height distribution in the mangrove area, the canopy-height metric RH95 was first extracted from the GEDI footprint data and added as an attribute to the dataset. RH95, a commonly used height percentile metric in forestry studies, effectively reflects the canopy top height.
This study first conducted spatial extrapolation on the discrete GEDI footprint data. Using Kriging interpolation, the gaps in the GEDI data were filled, and the entire area was fitted to convert the discrete GEDI data points into a continuous spatial distribution, ensuring that each pixel had an estimated canopy height. The canopy-height metric RH95 was extracted from the GEDI footprint data and added as an attribute to the dataset. RH95 is a commonly used height percentile metric in forest studies that effectively reflects the top height of the canopy. On this basis, the Sentinel-2 imagery was resampled to match the spatial resolution of the GEDI data for spatial alignment with the interpolated GEDI data. Finally, the Sentinel-2 spectral data, matched in time with the GEDI data, were integrated to optimize the canopy-height estimation through spatial extrapolation. In this regard, the spectral reflectance values from Sentinel-2 (including bands B2, B3, B4, B5, B6, B7, B8, B11, and B12) corresponding to the GEDI data points were extracted for model training. A total of 10,000 random sampling points were selected, and the data were divided into training and validation sets in an 80:20 ratio. Key parameters for the RF regression model, such as the number of decision trees, maximum tree depth, and the maximum number of features considered at each split, were fine-tuned. Finally, the trained model was applied to the Sentinel-2 imagery to generate canopy-height estimates, and model performance was validated and visualized.
2.3.4. Establishment of the Biomass Model
The establishment of biomass models is crucial for accurately estimating mangrove carbon stocks, with canopy height being the core parameter for estimating AGB. In this study, the AGB was inversely estimated by combining GEDI canopy-height data with allometric growth equations, and a relationship model between canopy height and biomass was developed. Based on the inter-species classification results, the average biomass for each species was calculated. By incorporating the BGB ratio, the carbon stock of the entire mangrove ecosystem was finally estimated.
When conducting growth studies on mangrove species, due to the incomplete construction of species-specific allometric growth equations for this region, more general allometric growth equations are often used for growth prediction and calculation [57]. Therefore, this study selected an allometric growth equation for mangrove biomass suitable for medium- and large-scale studies [58] (RMSE = 43.8 t/hm2, R2 = 0.59):
where refers to the AGB(t/hm2), and represents the canopy height (m) of the i-th statistical unit of mangroves.
Based on mangrove canopy-height data and the allometric growth equation, a tree height–biomass model was established, and the mean biomass of each species was calculated according to the interspecies classification results. By integrating the fine-scale interspecies classification results of mangroves, the biomass distribution map obtained from the inversion was segmented to calculate the mean AGB for each species. For the BGB, this study cites data from Zhang [59], which indicates that the AGB of mangrove communities accounts for 67.1% of the total biomass, while BGB accounts for 32.9%. Therefore, the ratio of BGB to AGB in mangroves is 0.49. The biomass calculation results are shown in Table 2.
Table 2.
Estimated values of AGB and BGB.
2.3.5. Carbon-Stock Estimation
LiDAR can accurately estimate the aboveground carbon stock of mangroves but cannot provide estimates for soil carbon and dead organic carbon. In contrast, the InVEST model allows for a comprehensive assessment of carbon stocks, including aboveground carbon, belowground carbon, soil carbon, and dead organic carbon. Therefore, this study combines the strengths of LiDAR and the InVEST model. By utilizing the aboveground and BGB obtained earlier, along with measured data on soil carbon and dead organic carbon, the InVEST model was used to perform a comprehensive carbon stock estimation.
The Carbon Storage and Sequestration module of the InVEST model uses land-use data as the primary data source, providing a quick and intuitive method for carbon-stock estimation, which is widely used in regional carbon-storage assessments. The model estimates carbon stock by inputting the density data of aboveground carbon, belowground carbon, soil carbon, and dead-organic-matter carbon, and substitutes the previously calculated carbon density values into the InVEST model for estimation. In this study, aboveground and belowground carbon were obtained through remote sensing image analysis and calculation, while soil carbon and dead-organic-matter carbon-stock data were derived from field measurements in the literature.
In the formula: represents the total carbon stock, represents the aboveground vegetation carbon stock, represents the belowground vegetation carbon stock, and represents the soil carbon stock, represents the carbon stock of dead organic matter.
To calculate the total carbon stock of each species, this study collected carbon density data for mangrove species within the study area. The measured carbon content data of mangroves in Dongzhaigang, reported by Li [60], indicates a carbon content of 45.65%. Based on this, the formula for calculating aboveground and belowground carbon stock is:
In addition to aboveground and belowground carbon, soil carbon stock and dead organic matter carbon stock were also included in the estimation. The soil carbon stock data was obtained from Xin [61] who measured the soil carbon stock at a depth of 1 m in Dongzhaigang. Meanwhile, the dead-organic-matter carbon stock data were collected from the research of Li [60] on litterfall in mangrove communities in the same area. The carbon density of litter and deadwood was calculated to be 5.49 t C/ha.
The carbon stock was calculated based on the InVEST model by inputting , , soil carbon stock , and , resulting in for each mangrove species. As shown in Table 3, there are significant differences in carbon stock among the various species. These data are based on biomass estimated through remote sensing inversion, with carbon stocks calculated using conversion factors, and combined with measured soil carbon and dead-organic-matter carbon content data from the literature, thereby improving the accuracy of carbon-stock estimation.
Table 3.
Carbon density of different mangrove species in Dongzhaigang.
2.3.6. Evaluation Metrics
To assess the accuracy of mangrove species classification, we utilized the confusion matrix to calculate the overall accuracy (OA), producer accuracy (PA), user accuracy (UA), and the Kappa coefficient. These metrics provide an objective evaluation of the model’s overall performance, classification errors, and consistency in the task of classifying mangrove species. The corresponding equations are as follows:
where P represents the total number of samples, n is the number of samples for mangrove species, represents the number of correctly classified samples for species i on the diagonal of the confusion matrix, represents the total number of samples that actually belong to mangrove species i, and represents the number of samples predicted by the model as mangrove species i.
To evaluate the prediction accuracy of the RF regression model for mangrove canopy height, the coefficient of determination () and root mean square error (RMSE) were used. These two indicators are used to measure the degree of fit between the predicted and actual values, as well as the size of the error. The specific formulas are as follows:
where represents the actual canopy height of mangrove species at sample point, is the predicted canopy height, is the average true canopy height, and n is the total number of samples.
3. Results
3.1. Spatial Distribution and Fine-Grained Classification Results of Mangroves in Dongzhaigang
The feature-selection optimization process was carried out using FFS to filter and rank the 26 initial prediction features. During this process, features were ranked according to their importance for model performance, with the most significant features being progressively added to the model. This iterative approach systematically eliminated features that had minimal or negative impact on accuracy, retaining only the most relevant predictors, which greatly enhanced the model performance.
The results, presented in Figure 3, show that there were initially 26 features to choose from, with each feature selection tested in a separate experiment. As the number of selected features grew, the pool of remaining features diminished, leading to fewer experiments over time. Consequently, the initial feature selection points are densely clustered, while the later ones become increasingly sparse. The black circles represent the average accuracy for each feature selection, and the trend line illustrates the performance changes.
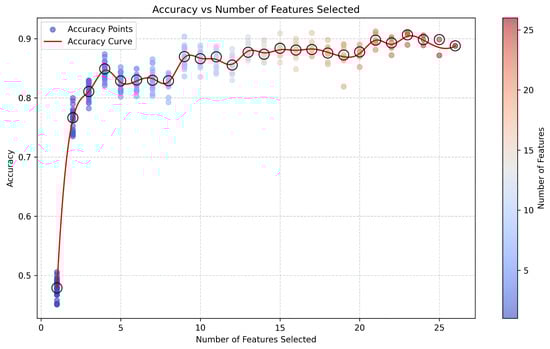
Figure 3.
Ranking of feature importance.
Ultimately, 23 features were selected as the most significant for mangrove species classification. This suggests that the model performance was nearly optimal with these 23 features. Adding more predictors beyond this point did not enhance performance further, instead, additional features introduced the risk of overfitting and increased computational complexity. The final feature set, which included all spectral, texture, band, and selected terrain features, achieved the highest classification accuracy, with strong identification performance, precision, and stability. This highlights the importance of feature optimization in refining the classification of mangrove species with higher precision.
As shown in Table 4, the proposed FFS-RF outperforms other commonly used machine learning methods for mangrove species extraction in terms of classification accuracy. Specifically, the FFS-RF model was compared to RF without feature selection, support vector machines (SVM), and maximum likelihood classification. The results indicate that FFS-RF achieved a significant accuracy improvement in mangrove species classification, with an OA of 92.01% and a Kappa coefficient of 0.8981, both of which are substantially higher than those of the RF model without feature selection and other conventional machine learning approaches. This enhancement notably strengthens the predictive capability of the model, providing a robust foundation for the precise estimation of carbon stocks in subsequent analyses. The findings underscore the critical role of feature selection in improving the accuracy of detailed mangrove species classification.
Table 4.
Comparison of accuracy between forward feature selection with random forest and other common machine learning methods.
3.2. Mangrove Distribution and Species Classification Results
3.2.1. Mangrove Distribution Extraction and RF Classification Model Validation
The selection of sample points combined high-resolution Google Earth imagery with ground truth maps from previous studies. Using visual interpretation and following the principle of uniform distribution, 400 mangrove samples and 350 non-mangrove samples were selected. All samples were randomly divided into training and validation sets at a ratio of 7:3. The RF classification model was then used to extract and mask the mangrove distribution in the Dongzhaigang area, and the area was statistically analyzed, as shown in Figure 4a. The results indicate that the total mangrove area in 2020 was 1837.18 ha. The RF classification model performed excellently in distinguishing mangroves from non-mangroves, with an OA of 97.13%. The high classification accuracy demonstrates the reliability of the model (Table 5).
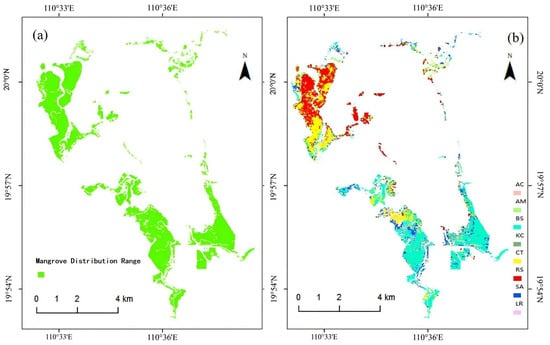
Figure 4.
(a) Mangrove distribution in Dongzhaigang; (b) fine-scale species classification of mangroves in Dongzhaigang.
Table 5.
Confusion matrix for mangrove classification.
3.2.2. Mangrove Species Classification and Spatial Distribution Analysis
In terms of mangrove species classification, this study optimized the input features using the RF algorithm combined with the selected features to achieve a more refined classification of different species within the mangrove area. The generated reference map, shown in Figure 4b, visually presents the spatial distribution of various species in the mangrove and provides a statistical analysis of the area occupied by each species. The classification results indicate that the OA of the inter-species classification is 92.01%, with a Kappa value of 0.8974. The classification accuracy for each species and the confusion matrix can be found in Figure 5. The results reveal that the dominant species in the Dongzhaigang mangrove include AM (36.09%), BS-BG (21.96%), and RS (16.22%), with other species such as Ceriops tagal and Sonneratia alba also contributing to the overall distribution. The area distribution of these species not only provides important data for subsequent carbon-stock estimation but also offers scientific support for mangrove management and species-conservation strategy development.
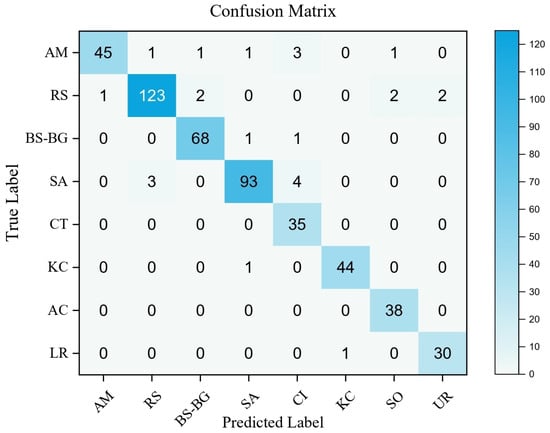
Figure 5.
Confusion matrix and classification accuracy for mangrove species.
3.3. Spatial Distribution Patterns of Biomass and Carbon Storage in Mangrove Forests of Dongzhaigang and Their Ecological Function Evaluation
To evaluate the performance of the RF regression model, RMSE and R2 were used as evaluation metrics. As shown in Figure 6, the results indicate that the average mangrove canopy height in the area is 10.17 m, with an RMSE of 1.45 m and an R2 of 0.87, demonstrating the model high prediction accuracy and good fitting ability. Furthermore, Figure 7 presents the spatial distribution map of the mangrove canopy height, quantifying the variation in canopy height across the region.
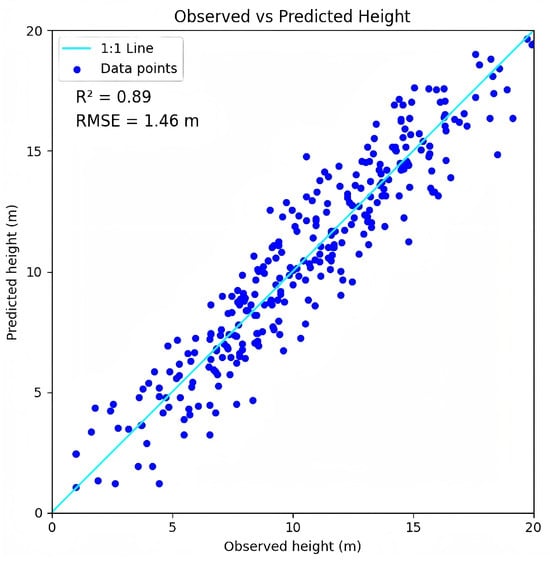
Figure 6.
Regression analysis of observed and predicted tree heights.
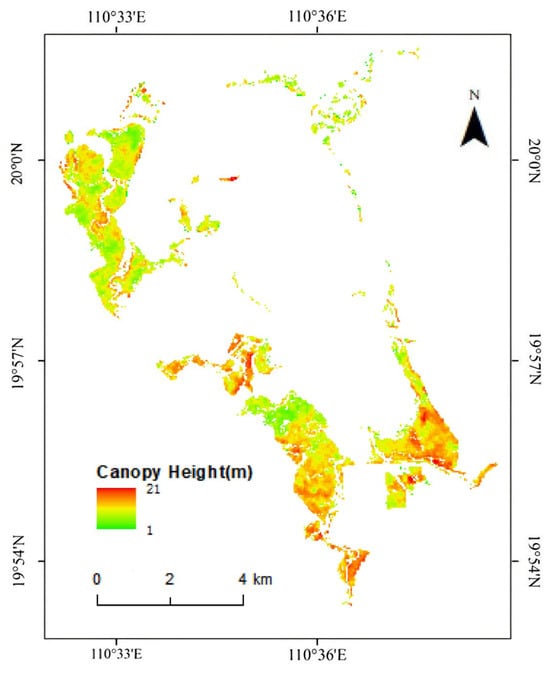
Figure 7.
Distribution of mangrove canopy height.
After obtaining the mangrove canopy-height distribution, the corresponding biomass distribution map was generated using the allometric growth equation. To achieve this, the previously extracted mangrove range data wwew used as vector data for the study area, and the imagery used for biomass inversion was clipped accordingly. Based on the fine-scale mangrove species classification results, the biomass map generated from the inversion was then segmented. The total AGB was calculated by multiplying the average biomass per unit area of the data for the year in Dongzhaigang by the distribution area. The results showed that the average AGB of the mangroves in Dongzhaigang, Hainan, was 118.38 t/hm2, with a total biomass of 217,747.57 t.
Finally, the carbon-storage results for each species were calculated and visualized. The Hainan Dongzhaigang Mangrove Reserve plays a significant role in carbon sequestration, with the vegetation portion accounting for 125,297 t of the total carbon sequestration, and the overall carbon sequestration amount reaching 302,558.77 t. As shown in Table 6, different mangrove species exhibit varying biomass and carbon-storage values, which provides strong evidence for evaluating the contributions of different species to overall carbon storage.
Table 6.
Area, biomass, and carbon storage of mangrove species.
As shown in Figure 8, the distribution of mangroves in Dongzhaigang follows distinct patterns. The AGB in the southern region is significantly higher than in the northern part, with high-biomass areas mainly concentrated in the central and southern sections of the reserve. This variation is largely influenced by the geographical environment. Inland areas generally have higher biomass than coastal regions. In the southern part, mangrove species such as SA, BS, and BG thrive due to the stable inland environment and fertile soil, leading to taller, more robust plants and an increase in biomass. In contrast, the northern region is primarily inhabited by species like CT and RS, which are adapted to high salinity and significant tidal influences. These species are relatively smaller, resulting in lower biomass.
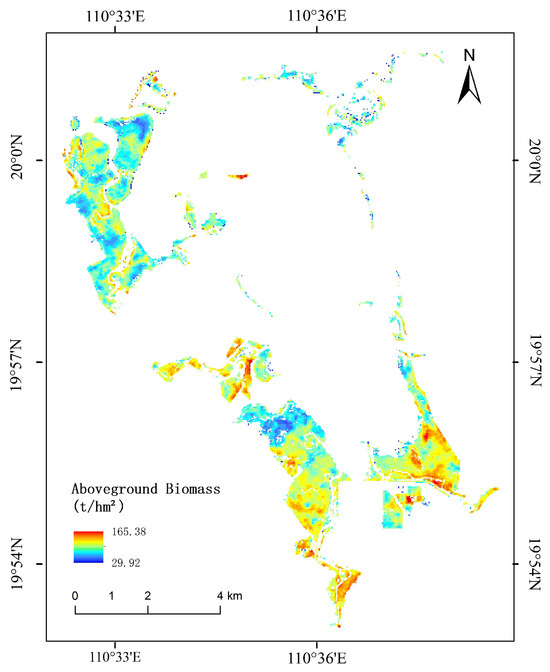
Figure 8.
Carbon-stock distribution of mangroves in Dongzhaigang.
The distribution of mangroves in coastal and outer sandbank areas is heavily influenced by tides and fluctuating salinity, which favors salt-tolerant species like CT to grow steadily. Inland areas, on the other hand, are less directly affected by tides and waves, resulting in more stable hydrological conditions and higher soil oxygen and nutrient levels. These conditions are more suitable for the growth of taller mangrove species such as SA and BG. Biomass is relatively low near estuaries and bay edges, where constant tidal and wave action causes significant water loss and reduces soil moisture and nutrient levels. Consequently, these areas are dominated by smaller, salt-tolerant and wind-resistant mangrove species like AM and CT. These gradient changes illustrate the successional process of mangrove communities, showing how environmental conditions shape species distribution and biomass accumulation.
As shown in Figure 9, the spatial distribution of carbon stock closely mirrors that of biomass, with the highest carbon stock found in the southern region where taller mangrove species grow. In contrast, the northern estuaries exhibit lower carbon stock due to less favorable environmental conditions. The distribution of biomass and carbon stock in mangroves demonstrates the ecosystem’s ability to dynamically adapt to environmental changes and reflects the community succession process. Over time, pioneer species improve soil conditions, enabling the growth of taller mangrove species, which further enhances the overall carbon stock and ecological function of the ecosystem. This process exemplifies how mangroves contribute to carbon sequestration under varying habitat conditions.
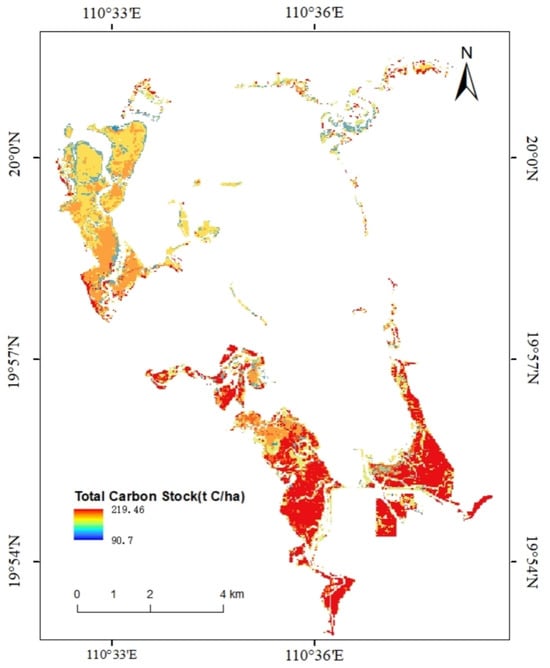
Figure 9.
Carbon-stock distribution of mangroves in Dongzhaigang.
4. Disscussion
4.1. Key Findings
Sentinel-2 enhances the accuracy of mangrove species classification through high-resolution spectral information and, with its high spatial resolution and multispectral data, allows for more precise canopy-height extraction. GEDI provides three-dimensional structural data, which enhances the precision of canopy-height inversion, and the topographic features offered by SRTM assist in boosting classification accuracy. By integrating multisource remote sensing data, this study significantly enhances both canopy-height inversion and species classification, effectively addressing the limitations of single data sources and enabling accurate estimations of canopy height and species classification in complex mangrove ecosystems. Compared to the carbon-stock assessments by Hu [63] and Huang [64], which relied on field surveys and sampling, this study not only achieves higher efficiency in carbon-stock estimation through the integration of remote sensing data and the InVEST model, but also significantly improves the scalability of the research and the accuracy of the results.
In this study, FFS-RF was compared with RF, SVM, and maximum likelihood classification models without feature selection, resulting in substantial performance improvements. Unlike the RFE method developed by Wang et al. [65], which removes features step by step, FFS avoids overfitting by progressively adding features, thereby better identifying optimal feature combinations and enhancing model generalization and interpretability [66]. Additionally, FFS-RF exhibits higher computational efficiency and superior feature independence processing capabilities when applied to complex multisource remote sensing data. Compared to SHAP [67] and feature selection combined with Genetic Algorithms [68], FFS offers greater flexibility and effectiveness in feature selection. Overall, the FFS-RF method provides significant advantages in mangrove feature extraction, enhancing model prediction performance and accuracy.
Choosing an appropriate modeling method is crucial for improving the accuracy of carbon-stock estimation. The non-parametric RF regression model offers significant advantages when handling the complex interactions of multisource data [69,70]. Compared to parametric multiple-linear-regression models, the RF model better addresses nonlinear relationships and high-dimensional data. Chen [71] used RF, linear regression, and k-nearest neighbors to model forest AGB in Yunnan Province, China, confirming that RF outperforms the other two models in terms of performance. In this study, the RF model, integrated with the three-dimensional structural information from GEDI and spectral data from Sentinel-2, not only improves the accuracy of height inversion but also effectively reduces overfitting issues [72]. Hemati et al. [73] further validated the superiority of RF in biomass estimation. In this study, the RMSE was 1.45 m, with an R2 of 0.87. In contrast, Wang et al. [74] used Sentinel-2 to invert mangrove height in Hainan Island, obtaining an RMSE of 1.90 m and an R2 of 0.67. The higher RMSE could be attributed to the different ecological conditions of the mangrove areas across the entire island, as well as the generally higher canopy height on Hainan Island compared to Dongzhaigang. This demonstrates that RF excels in forest height estimation, especially when combined with spectral remote sensing data, where prediction accuracy is significantly enhanced.
In biomass estimation, Li et al. [75] used multi-temporal remote sensing imagery combined with ICESat-2 vegetation canopy photon data to estimate the AGB of mangroves in Hainan Province in 2019, yielding a value of 114.56 t/hm2. Wen et al. [76] estimated the average biomass in the Dongzhaigang Conservation Area in 2019 based on airborne LiDAR data, which reached 110.5 t/hm2. Comparing these results with the mangrove AGB estimated in this study using 2020 data, it is evident that the results align with the growth patterns of mangroves. The discrepancies observed may be attributed to the different data sources used, thus validating the feasibility and application potential of the method applied in this study. By using the InVEST model, the carbon stock of the entire mangrove ecosystem was comprehensively estimated, resulting in more accurate and systematic carbon sink assessments. This method demonstrates the potential of remote sensing data in evaluating ecosystem carbon-sink functions, providing a more systematic and precise framework for carbon-stock estimation.
This study provides an in-depth analysis of mangrove-ecosystem carbon stocks, not only assessing AGB and carbon stocks but also estimating underground carbon stocks using conversion factors. In addition, by incorporating measured soil carbon and dead organic carbon stocks, the study provides a comprehensive evaluation of the overall carbon stocks in the Dongzhaigang mangrove area, along with a visualized carbon-stock distribution output. Li [40] estimated biomass using a sample plot approach combined with field surveys of mangrove biophysical parameters based on field-measured mangrove samples. Subsequently, by interpreting remote sensing imagery to determine community distribution and area, an estimated carbon stock of 412.586 t/C ha for the Dongzhaigang community in 2018 was derived. Bai [77] et al. measured the carbon storage in a specific plot in the southwestern part of the Dongzhai Port Nature Reserve on Hainan Island, and the results showed that the carbon storage reached 242 t C/ha. The significant difference between this result and other estimates is attributed to the complexity of the mangrove ecosystem and the diversity of species structure. The method of combining plot quantity and range relies heavily on human experience, leading to larger estimation errors in plot values and thus affecting the accuracy of carbon-storage estimation. In contrast, Meng [7] et al. combined multi-year field surveys, soil sampling analysis, and the mathematical modeling of remote sensing imagery to derive an average total carbon storage of 191.2 t C/ha in the region. Although differences in data sources and model usage may lead to deviations in results, this value is close to the total carbon density of 164.69 t C/ha calculated in our study. The spectral characteristics of different mangrove types are heterogeneous, resulting in significant variations in the spectral features observed in remote sensing imagery. In this study, we used LiDAR data to invert canopy height, effectively overcoming these human-induced errors and improving the accuracy of carbon-storage estimation.
4.2. Limitations and Potential of the Study
This study demonstrates the significant advantages of the FFS-RF method, but certain limitations remain. For instance, redundant features still exist during the feature fusion process, indicating room for improvement in handling high-dimensional data and removing redundant features. Future research could explore integrating FFS with other feature selection methods or adopting ensemble approaches, such as combining cross-validation with FFS-RF, to enhance the stability of feature selection. Such efforts aim to address issues like model overfitting, instability in feature selection, and poor generalization performance.
Although this study improves the accuracy of mangrove carbon stock assessment, the spatial resolution of the data still imposes limitations on pixel-based analysis methods, leading to issues such as mixed-pixel problems and spatial heterogeneity. Future research could consider incorporating Object-Based Image Analysis methods for comparison, which would involve image segmentation and object feature extraction to further improve accuracy. However, this would increase computational complexity. In addition to the integration of high-resolution data, techniques such as spectral mixture analysis could be combined to enhance the classification accuracy and reliability of remote sensing imagery in complex land-cover areas.
In addition, the applicability of the allometric growth equation may vary among different species. It is recommended to select representative plots and trees for field measurements in the study area to obtain high-precision data, which can be used to develop region- and species-specific equations. This would help optimize the biomass estimation model and enhance its applicability and accuracy. Moreover, the inclusion of temporal data can facilitate dynamic monitoring of long-term changes in mangrove carbon stocks, enhancing both the precision and applicability of the monitoring. However, the impact of mangrove growth characteristics on carbon-stock changes should also be taken into account. Future research could combine machine learning with geographic models, including process-based models, to simulate plant-growth processes and estimate carbon fixation and biomass changes. Specifically, by examining physiological processes such as photosynthesis and using multi-source remote sensing data to invert physiological and ecological parameters of mangroves, it would be possible to establish ecologically meaningful remote sensing process models. These models can effectively account for biomass changes in ecosystems like mangroves and provide more comprehensive scientific evidence for addressing climate change.
With the advancement of technology, the application of deep learning models in carbon-stock monitoring has gradually increased. Although GEE has shown significant advantages in the field of machine learning, its current limitations in functions and interfaces prevent the deployment of deep learning models. In the future, cloud platform-based deep learning models can be explored to further optimize the carbon-stock estimation process and enhance the adaptability of the models.
The framework proposed in this study is not only applicable to carbon-stock monitoring in mangrove ecosystems but can also be extended to the monitoring of other coastal wetlands and ecosystems, offering valuable data support for broader environmental management applications. In the future, the research framework will be further optimized and applied to the dynamic monitoring of mangrove ecosystems on a larger, even global, scale, thereby providing more comprehensive scientific evidence for global carbon-cycle modeling and environmental management decision-making.
5. Conclusions
This study proposes an innovative remote sensing-based carbon-sink assessment framework, integrating GEDI, LiDAR, and Sentinel-2 data, and utilizing the GEE platform for efficient data processing and analysis. The FFS-RF algorithm significantly improved the accuracy of mangrove species classification, providing reliable support for biomass estimation. The results indicate that this data fusion method enables more accurate inversion of mangrove canopy height and establishes a biomass–carbon-stock estimation model. The study reveals a positive correlation between the expansion of mangrove area and the increase in carbon stock, demonstrating the significant application potential of remote sensing technology in carbon dynamics monitoring, and offering important technical support for ecosystem monitoring in other regions or on a larger scale. Furthermore, the natural growth process and community succession of mangroves have a significant impact on changes in carbon stock. This study overcomes the limitations of traditional models that overlook species differences and vertical structural information, providing valuable data support for optimizing carbon-cycle models such as InVEST, and offering scientific evidence for global carbon-cycle modeling and environmental management decisions.
Author Contributions
Conceptualization, R.Z. and J.F.; Methodology, R.Z.; Software, R.Z.; Validation, R.Z. and J.F.; Formal Analysis, R.Z.; Investigation, R.Z.; Resources, R.Z.; Data Curation, R.Z.; Writing—Original Draft Preparation, R.Z.; Writing—Review and Editing, R.Z. and J.F.; Visualization, R.Z.; Supervision, J.F.; Project Administration, J.F. and R.Z.; Funding acquistion, J.F. All authors have read and agreed to the published version of the manuscript.
Funding
This work was supported in part by the National Natural Science Foundation of China under Grant 42076184, Grant 41876109, and Grant 41706195; in part by the National Key Research and Development Program of China under Grant 2021YFC2801000; in part by the National High Resolution Special Research under Grant 41-Y30F07-9001-20/22; in part by the Fundamental Research Funds for the Central Universities under Grant DUT23RC(3)050; and in part by the Dalian High Level Talent Innovation Support Plan under Grant 2021RD04.
Institutional Review Board Statement
Not applicable.
Informed Consent Statement
Not applicable.
Data Availability Statement
The Sentinel-2, GEDI, and SRTM datasets used in this study are openly available and freely accessible through the GEE platform. The sources of carbon stock field measurements and relevant literature are properly cited within the manuscript.
Acknowledgments
The authors would like to thank Google, United States, for providing the GEE platform, as well as the Sentinel, SRTM, and GEDI datasets.
Conflicts of Interest
The authors declare no conflict of interest.
References
- Duarte, C.M.; Losada, I.J.; Hendriks, I.E.; Mazarrasa, I.; Marbà, N. The role of coastal plant communities for climate change mitigation and adaptation. Nat. Clim. Change 2013, 3, 961–968. [Google Scholar] [CrossRef]
- Goldberg, L.; Lagomasino, D.; Thomas, N.; Fatoyinbo, T. Global declines in human-driven mangrove loss. Glob. Change Biol. 2020, 26, 5844–5855. [Google Scholar] [CrossRef] [PubMed]
- Rahman, M.M.; Zimmer, M.; Ahmed, I.; Donato, D.; Kanzaki, M.; Xu, M. Co-benefits of protecting mangroves for biodiversity conservation and carbon storage. Nat. Commun. 2021, 12, 3875. [Google Scholar] [CrossRef]
- Donato, D.C.; Kauffman, J.B.; Murdiyarso, D.; Kurnianto, S.; Stidham, M.; Kanninen, M. Mangroves among the most carbon-rich forests in the tropics. Nat. Geosci. 2011, 4, 293–297. [Google Scholar] [CrossRef]
- Shi, X.; Wu, L.; Zheng, Y.; Zhang, X.; Wang, Y.; Chen, Q.; Sun, Z.; Nie, T. Dynamic Estimation of Mangrove Carbon Storage in Hainan Island Based on the InVEST-PLUS Model. Forests 2024, 15, 750. [Google Scholar] [CrossRef]
- Meng, Y.; Bai, J.; Gou, R.; Cui, X.; Feng, J.; Dai, Z.; Diao, X.; Zhu, X.; Lin, G. Relationships between above- and below-ground carbon stocks in mangrove forests facilitate better estimation of total mangrove blue carbon. Carbon Balance Manag. 2021, 16, 8. [Google Scholar] [CrossRef]
- Meng, Y.; Gou, R.; Bai, J.; Moreno-Mateos, D.; Davis, C.C.; Wan, L.; Song, S.; Zhang, H.; Zhu, X.; Lin, G. Spatial patterns and driving factors of carbon stocks in mangrove forests on Hainan Island, China. Glob. Ecol. Biogeogr. 2022, 31, 1692–1706. [Google Scholar] [CrossRef]
- Jia, K.; Chen, S.S.; Jiang, W.G. Long time-series remote sensing monitoring of mangrove forests in the Guangdong-Hong Kong-Macao Greater Bay Area. Natl. Remote Sens. Bull. 2022, 26, 1096–1111. [Google Scholar] [CrossRef]
- Woodroffe, C.D. Studies of a mangrove basin, Tuff Crater, New Zealand: I. Mangrove biomass and production of detritus. Estuar. Coast. Shelf Sci. 1985, 20, 265–280. [Google Scholar] [CrossRef]
- Duke, N.C.; Meynecke, J.O.; Dittmann, S.; Ellison, A.M.; Anger, K.; Berger, U.; Cannicci, S.; Diele, K.; Ewel, K.C.; Field, C.D.; et al. A World Without Mangroves? Conserv. Biol. 2007, 21, 90–100. [Google Scholar] [CrossRef]
- Jachowski, N.R.A.; Quak, M.S.Y.; Friess, D.A.; Duangnamorn, D.; Webb, E.L.; Ziegler, A.D. Mangrove biomass estimation in Southwest Thailand using machine learning. Appl. Geogr. 2013, 45, 311–321. [Google Scholar] [CrossRef]
- Komiyama, A.; Ong, R.C.; Poungparn, S. Allometric equations for predicting above-ground biomass in mangrove forests. For. Ecol. Manag. 2008, 255, 3788–3796. [Google Scholar]
- Huang, C.; Zhang, C.; Li, H. Assessment of the Impact of Rubber Plantation Expansion on Regional Carbon Storage Based on Time Series Remote Sensing and the InVEST Model. Remote Sens. 2022, 14, 6234. [Google Scholar] [CrossRef]
- Piyathilake, I.D.U.H.; Udayakumara, E.P.N.; Ranaweera, L.V.; Gunatilake, S.K. Modeling predictive assessment of carbon storage using InVEST model in Uva province, Sri Lanka. J. Environ. Manag. 2022, 8, 2213–2223. [Google Scholar] [CrossRef]
- Pham, T.D.; Yokoya, N.; Bui, D.T.; Yoshino, K.; Friess, D.A. Remote Sensing Approaches for Monitoring Mangrove Species, Structure, and Biomass: Opportunities and Challenges. Remote Sens. 2019, 11, 230. [Google Scholar] [CrossRef]
- Sanam, H.; Thomas, A.A.; Kumar, A.P.; Lakshmanan, G. Multi-sensor Approach for the Estimation of Above-Ground Biomass of Mangroves. J. Indian Soc. Remote Sens. 2024, 52, 903–916. [Google Scholar] [CrossRef]
- Maurya, K.; Mahajan, S.; Chaube, N. Remote Sensing Techniques: Mapping and Monitoring of Mangrove Ecosystem—A Review. Complex Intell. Syst. 2021, 7, 2797–2818. [Google Scholar] [CrossRef]
- Tian, L.; Wu, X.; Tao, Y.; Li, M.; Qian, C.; Liao, L.; Fu, W. Review of Remote Sensing-Based Methods for Forest Aboveground Biomass Estimation: Progress, Challenges, and Prospects. Forests 2023, 14, 1086. [Google Scholar] [CrossRef]
- Li, L.; Zhou, B.; Liu, Y.; Wu, Y.; Tang, J.; Xu, W.; Wang, L.; Ou, G. Reduction in Uncertainty in Forest Aboveground Biomass Estimation Using Sentinel-2 Images: A Case Study of Pinus densata Forests in Shangri-La City, China. Remote Sens. 2023, 15, 559. [Google Scholar] [CrossRef]
- Wu, C.; Tao, H.; Zhai, M.; Lin, Y.; Wang, K.; Deng, J.; Shen, A.; Gan, M.; Li, J.; Yang, H. Using Nonparametric Modeling Approaches and Remote Sensing Imagery to Estimate Ecological Welfare Forest Biomass. J. For. Res. 2018, 29, 151–161. [Google Scholar] [CrossRef]
- Cao, Q.-X.; Xu, D.-P.; Ju, H.-B. Biomass Estimation of Five Kinds of Mangrove Community in Beibu Gulf Based on Remote Sensing. Guangxi Sci. 2011, 18, 289–293. [Google Scholar]
- Tian, Y.; Huang, H.; Zhou, G.; Zhang, Q.; Tao, J.; Zhang, Y.; Lin, J. Estimation of Aboveground Biomass of Mangroves in the Beibu Gulf Based on Machine Learning and UAV Remote Sensing. Sci. Total Environ. 2021, 772, 146816. [Google Scholar] [CrossRef]
- Mcleod, E.; Chmura, G.L.; Bouillon, S.; Salm, R.; Björk, M.; Duarte, C.M.; Silliman, B.R. A Blueprint for Blue Carbon: Toward an Improved Understanding of the Role of Vegetated Coastal Habitats in Sequestering CO2. Front. Ecol. Environ. 2011, 9, 552–560. [Google Scholar] [CrossRef]
- Alongi, D.M. Carbon Cycling and Storage in Mangrove Forests. Annu. Rev. Mar. Sci. 2014, 6, 195–219. [Google Scholar] [CrossRef] [PubMed]
- Simard, M.; Fatoyinbo, L.; Smetanka, C.; Rivera-Monroy, V.H.; Castañeda-Moya, E.; Thomas, N.; Van der Stocken, T. Mangrove Canopy Height Globally Related to Precipitation, Temperature and Cyclone Frequency. Nat. Geosci. 2019, 12, 40–45. [Google Scholar] [CrossRef]
- Sanderman, J.; Hengl, T.; Fiske, G.J.; Cheney, E.; O’Rourke, S. A Global Map of Mangrove Forest Soil Carbon at 30 m Spatial Resolution. Environ. Res. Lett. 2018, 13, 055002. [Google Scholar] [CrossRef]
- Atwood, T.B.; Connolly, R.M.; Almahasheer, H.; Carnell, P.E.; Duarte, C.M.; Ewers Lewis, C.J.; Lovelock, C.E. Global Patterns in Mangrove Soil Carbon Stocks and Losses. Nat. Clim. Change 2017, 7, 523–528. [Google Scholar] [CrossRef]
- Kuenzer, C.; Bluemel, A.; Gebhardt, S.; Vo Quoc, T.; Dech, S. Remote Sensing of Mangrove Ecosystems: A Review. Remote Sens. 2011, 3, 878–928. [Google Scholar] [CrossRef]
- Alongi, D.M. Carbon Sequestration in Mangrove Forests. Carbon Manag. 2014, 3, 313–322. [Google Scholar] [CrossRef]
- Zhang, F.; Yang, X. Improving land cover classification in an urbanized coastal area by random forests: The role of variable selection. Remote Sens Environ. 2020, 251, 112105. [Google Scholar] [CrossRef]
- Kumar, L.; Sinha, P. Mapping Saltmarsh Vegetation Using High-Spatial and Hyperspectral Satellite Data to Assist Wetland Inventory. ISPRS J. 2014, 94, 228–243. [Google Scholar]
- Fatoyinbo, T.E.; Simard, M. Height and Biomass of Mangroves in Africa from ICESat/GLAS and SRTM. Int. J. Remote Sens. 2013, 34, 668–681. [Google Scholar] [CrossRef]
- Yang, Y.; Meng, Z.; Zu, J.; Cai, W.; Wang, J.; Su, H.; Yang, J. Fine-Scale Mangrove Species Classification Based on UAV Multispectral and Hyperspectral Remote Sensing Using Machine Learning. Remote Sens. 2024, 16, 3093. [Google Scholar] [CrossRef]
- Aye, W.N.; Tong, X.; Li, J.; Wunna Tun, A. Assessing the Carbon Storage Potential of a Young Mangrove Plantation in Myanmar. Forests 2023, 14, 824. [Google Scholar] [CrossRef]
- Zhen, J.; Liao, J.; Shen, G. Mapping Mangrove Forests of Dongzhaigang Nature Reserve in China Using Landsat 8 and Radarsat-2 Polarimetric SAR Data. Sensors 2018, 18, 4012. [Google Scholar] [CrossRef] [PubMed]
- Hancock, S.; Marselis, S.; Dubayah, R.; Hofton, M.; Tang, H.; Sun, X. GEDI Waveform Processing for Forest Biomass Estimation. Remote Sens. Environ. 2021, 255, 112276. [Google Scholar]
- Tang, H.; Armston, J.; Hancock, S.; Marselis, S.; Goetz, S.J.; Dubayah, R. Characterizing Global Forest Canopy Structure Using Spaceborne Lidar. Remote Sens. Environ. 2019, 231, 111262. [Google Scholar] [CrossRef]
- Duncanson, L.; Neuenschwander, A.; Hancock, S.; Thomas, N.; Fatoyinbo, T.; Simard, M.; Silva, C.A.; Armston, J.; Luthcke, S.B.; Hofton, M.; et al. Biomass Estimation from Simulated GEDI, ICESat-2 and NISAR Across Environmental Gradients in Sonoma County, California. Remote Sens. Environ. 2020, 242, 111779. [Google Scholar] [CrossRef]
- Hu, T.; Zhang, Y.; Su, Y.; Zheng, Y.; Lin, G.; Guo, Q. Mapping the Global Mangrove Forest Aboveground Biomass Using Multisource Remote Sensing Data. Remote Sens. 2020, 12, 1690. [Google Scholar] [CrossRef]
- Li, H.; Jia, M.; Zhang, R.; Ren, Y.; Wen, X. Incorporating the Plant Phenological Trajectory into Mangrove Species Mapping with Dense Time Series Sentinel-2 Imagery and the Google Earth Engine Platform. Remote Sens. 2019, 11, 2479. [Google Scholar] [CrossRef]
- Zhou, M.; Xu, A.; Yang, C.; Liang, L. Mangrove Information Extraction and Precision Analysis Based on Multi-Feature Combination. Am. J. Remote Sens. 2023, 11, 36–43. [Google Scholar] [CrossRef]
- Iranzad, R.; Liu, X. A Review of Random Forest-Based Feature Selection Methods for Data Science Education and Applications. Int. J. Data Sci. Anal. 2024. [Google Scholar] [CrossRef]
- Pelletier, C.; Valero, S.; Inglada, J.; Champion, N.; Dedieu, G. Assessing the Robustness of Random Forests to Map Land Cover with High Resolution Satellite Image Time Series over Large Areas. Remote Sens. Environ. 2016, 187, 156–168. [Google Scholar] [CrossRef]
- Pereira, F.R.D.; Kampel, M.; Soares, M.L.G.; Estrada, G.C.D.; Bentz, C.; Vincent, G. Reducing Uncertainty in Mapping of Mangrove Aboveground Biomass Using Airborne Discrete Return Lidar Data. Remote Sens. 2018, 10, 637. [Google Scholar] [CrossRef]
- Ali, N.; Khati, U. Forest Aboveground Biomass and Forest Height Estimation Over a Sub-Tropical Forest Using Machine Learning Algorithm and Synthetic Aperture Radar Data. J. Indian Soc. Remote Sens. 2024, 52, 771–786. [Google Scholar] [CrossRef]
- Satyanarayana, B.; Muslim, A.M.; Horsali, N.A.I.; Zauki, N.A.M.; Otero, V.; Nadzri, M.I.; Ibrahim, S.; Husain, M.-L.; Dahdouh-Guebas, F. Status of the Undisturbed Mangroves at Brunei Bay, East Malaysia: A Preliminary Assessment Based on Remote Sensing and Ground-Truth Observations. Peer J. 2018, 6, e4397. [Google Scholar] [CrossRef]
- Baloloy, A.B.; Blanco, A.C.; Sta. Ana, R.R.C.; Nadaoka, K. Development and Application of a New Mangrove Vegetation Index (MVI) for Rapid and Accurate Mangrove Mapping. ISPRS J. Photogramm. Remote Sens. 2020, 166, 95–117. [Google Scholar] [CrossRef]
- Xu, H. Modification of Normalized Difference Water Index (NDWI) to Enhance Open Water Features in Remotely Sensed Imagery. Int. J. Remote Sens. 2006, 27, 3025–3033. [Google Scholar] [CrossRef]
- Jia, M.M. Remote Sensing Analysis of China’s Mangrove Forests Dynamics During to 2013. Ph.D. Dissertation, Northeast Institute of Geography and Agroecology, Chinese Academy of Sciences, Changchun, China, 2014. [Google Scholar]
- Behera, M.D.; Barnwal, S.; Paramanik, S.; Das, P.; Bhattyacharya, B.K.; Jagadish, B.; Roy, P.S.; Ghosh, S.M.; Behera, S.K. Species-Level Classification and Mapping of a Mangrove Forest Using Random Forest Utilisation of AVIRIS-NG and Sentinel Data. Remote Sens. 2021, 13, 2027. [Google Scholar] [CrossRef]
- Kamal, M.; Phinn, S.; Johansen, K. Object-based approach for multi-scale mangrove composition mapping using multi-resolution image datasets. Remote Sens. 2015, 7, 4753–4783. [Google Scholar] [CrossRef]
- Diniz, C.G.; Souza-Filho, P.W.M.; Silva, M.G.S. Topographic influence on mangrove vegetation detected by ALOS/PALSAR imagery and SRTM data in Amazon Coastal Plain. Remote Sens. 2019, 11, 70. [Google Scholar]
- Green, E.P.; Mumby, P.J.; Clark, C.D.; Edwards, T.M. Remote Sensing Handbook for Tropical Coastal Management, 1st ed.; UNESCO Publishing: Paris, France, 2000; pp. 1–316. [Google Scholar]
- Haralick, M.; Shanmugam, K.; Dinstein, I. Textural Features for Image Classification. TSMC 1973, 3, 610–621. [Google Scholar] [CrossRef]
- Kacic, P.; Hirner, A.; Da Ponte, E. Fusing Sentinel-1 and -2 to Model GEDI-Derived Vegetation Structure Characteristics in GEE for the Paraguayan Chaco. Remote Sens. 2021, 13, 5105. [Google Scholar] [CrossRef]
- Xu, C.; Morgenroth, J.; Manley, B. Integrating Data from Discrete Return Airborne LiDAR and Optical Sensors to Enhance the Accuracy of Forest Description: A Review. Curr. For. Rep. 2015, 1, 206–219. [Google Scholar] [CrossRef]
- Wicaksono, P.; Danoedoro, P.; Hartono, U.; Nehren, U. Mangrove Biomass Carbon Stock Mapping of the Karimunjawa Islands Using Multispectral Remote Sensing. Int. J. Remote Sens. 2016, 37, 26–52. [Google Scholar] [CrossRef]
- Saenger, P.; Snedaker, S.C. Pantropical Trends in Mangrove Above-Ground Biomass and Annual Litterfall. Oecologia 1993, 96, 293–299. [Google Scholar] [CrossRef]
- Zhang, H.; Chen, G.; Liu, Z.; Zhang, S.Y. Study on the Mangrove Wetland Ecosystem in Futian, Shenzhen; Guangdong Science and Technology Press: Guangzhou, China, 1998; pp. 15–40. [Google Scholar]
- Li, C.; Cai, H.; Yan, X. Analysis of Changes in Carbon Budget of Mangrove Wetlands in Dongzhai Harbor, Hainan from 2010 to 2018. Bull. Mar. Sci. 2020, 39, 488–497. [Google Scholar]
- Xin, K.; Yan, K.; Gao, C.; Li, Z. Carbon storage and its influencing factors in Hainan Dongzhagang mangrove wetlands. Mar. Freshw. Res. 2018, 69, 771–779. [Google Scholar] [CrossRef]
- Cao, J.; Leng, W.; Liu, K.; Liu, L.; He, Z.; Zhu, Y. Object-Based Mangrove Species Classification Using Unmanned Aerial Vehicle Hyperspectral Images and Digital Surface Models. Remote Sens. 2018, 10, 89. [Google Scholar] [CrossRef]
- Hu, J.; Xin, K.; Li, Z.; Gao, C.; Yan, K. Carbon Storage and Sequestration Function Evaluation in Dongzhaigang Mangrove Reserve of Hainan. Wetl. Sci. 2015, 13, 338–343. [Google Scholar]
- Huang, X.; Wang, X.P.; Li, X.Z.; Xin, K.; Yan, Z.Z.; Sun, Y.G.; Bellerby, R. Distribution Pattern and Influencing Factors for Soil Organic Carbon (SOC) in Mangrove Communities at Dongzhaigang, China. J. Coast. Res. 2018, 34, 434–442. [Google Scholar] [CrossRef]
- Wang, X.; Tan, L.; Fan, J. Performance Evaluation of Mangrove Species Classification Based on Multi-Source Remote Sensing Data Using Extremely Randomized Trees in Fucheng Town, Leizhou City, Guangdong Province. Remote Sens. 2023, 15, 1386. [Google Scholar] [CrossRef]
- Mengistu, F.; Hailu, B.T.; Abera, T.A.; Heiskanen, J.; Zeleke, T.T.; Johansson, T.; Pellikka, P. Improving the accuracy of honey bee forage class mapping using ensemble learning and multi-source satellite data in Google Earth Engine. Sci. Afr. 2024, 26, e02415. [Google Scholar] [CrossRef]
- Marcílio, W.E.; Eler, D.M. From Explanations to Feature Selection: Assessing SHAP Values as Feature Selection Mechanism. In Proceedings of the 33rd SIBGRAPI Conference on Graphics, Patterns and Images (SIBGRAPI 2020), Porto de Galinhas, Brazil, 7–10 November 2020; IEEE: Porto de Galinhas, Brazil, 2020; pp. 340–347. [Google Scholar]
- Razavi-Termeh, S.V.; Sadeghi-Niaraki, A.; Seo, M.B.; Choi, S.-M. Application of genetic algorithm in optimization parallel ensemble-based machine learning algorithms to flood susceptibility mapping using radar satellite imagery. Sci. Total Environ. 2023, 873, 162285. [Google Scholar] [CrossRef]
- Belgiu, M.; Dragut, L. Random forest in remote sensing: A review of applications and future directions. Isprs J. 2016, 114, 24–31. [Google Scholar] [CrossRef]
- Shataee, S.; Kalbi, S.; Fallah, A.; Pelz, D. Forest attribute imputation using machine-learning methods and ASTER data: Comparison of k-NN, SVR and random forest regression algorithms. Int. J. Remote Sens. 2012, 33, 6254–6280. [Google Scholar] [CrossRef]
- Chen, H.; Qin, Z.; Zhai, D.-L.; Ou, G.; Li, X.; Zhao, G.; Fan, J.; Zhao, C.; Xu, H. Mapping Forest Aboveground Biomass with MODIS and Fengyun-3C VIRR Imageries in Yunnan Province, Southwest China Using Linear Regression, K-Nearest Neighbor and Random Forest. Remote Sens. 2022, 14, 5456. [Google Scholar] [CrossRef]
- Ren, C.; Jiang, H.; Xi, Y.; Liu, P.; Li, H. Quantifying Temperate Forest Diversity by Integrating GEDI LiDAR and Multi-Temporal Sentinel-2 Imagery. Remote Sens. 2023, 15, 375. [Google Scholar] [CrossRef]
- Hemati, M.; Mahdianpari, M.; Shiri, H.; Mohammadimanesh, F. Integrating SAR and Optical Data for Aboveground Biomass Estimation of Coastal Wetlands Using Machine Learning: Multi-Scale Approach. Remote Sens. 2024, 16, 831. [Google Scholar] [CrossRef]
- Wang, D.; Wan, B.; Qiu, P.; Zuo, Z.; Wang, R.; Wu, X. Mapping Height and Aboveground Biomass of Mangrove Forests on Hainan Island Using UAV-LiDAR Sampling. Remote Sens. 2019, 11, 2156. [Google Scholar] [CrossRef]
- Li, W.; Xue, Z.; Zhu, J.; Tian, Z. Estimating Carbon Storage of Mangroves on Hainan Island Based on Multi-Source Remote Sensing Data from the Google Earth Engine (GEE) Platform. Remote Sens. Nat. Resour. 2024; in press. Available online: https://link.cnki.net/urlid/10.1759.P.20240424.1642.010 (accessed on 26 April 2024).
- Wen, X.; Liu, K.; Cao, J.; Zhu, Y.; Wang, Z. Estimation of Mangrove Aboveground Biomass in China Using Forest Canopy Height through an Allometric Equation. Trop. Geogr. 2023, 43, 1–11. [Google Scholar]
- Bai, J.; Meng, Y.; Gou, R.; Lyu, J.; Dai, Z.; Diao, X.; Zhang, H.; Luo, Y.; Zhu, X.; Lin, G. Mangrove diversity enhances plant biomass production and carbon storage in Hainan island, China. Funct. Ecol. 2021, 35, 774–786. [Google Scholar] [CrossRef]
Disclaimer/Publisher’s Note: The statements, opinions and data contained in all publications are solely those of the individual author(s) and contributor(s) and not of MDPI and/or the editor(s). MDPI and/or the editor(s) disclaim responsibility for any injury to people or property resulting from any ideas, methods, instructions or products referred to in the content. |
© 2025 by the authors. Licensee MDPI, Basel, Switzerland. This article is an open access article distributed under the terms and conditions of the Creative Commons Attribution (CC BY) license (https://creativecommons.org/licenses/by/4.0/).