Abstract
China’s first L-band fully polarimetric Synthetic Aperture Radar (SAR) constellation, LuTan-1 (LT-1), was designed for terrain mapping and geohazard monitoring. This study evaluates LT-1’s capability in identifying landslides in the southern hilly regions of China, focusing on Longshan County, Hunan Province. Using both ascending and descending orbit data from LT-1, we conducted landslide identification experiments. First, deformation was obtained using Differential Interferometric SAR (D-InSAR) technology, and the deformation rates were derived through the Stacking technique. A landslide identification method that integrates C-index, slope, and ascending/descending orbit deformation information was then applied. The identified landslides were validated against existing geohazard points and medium-to-high-risk slope and gully unit data. The experimental results indicate that LT-1-ascending orbit data identified 88 landslide areas, with 39.8% corresponding to geohazard points and 65.9% within known slope units. Descending orbit data identified 90 landslide areas, with 37.8% matching geohazard points and 61.1% within known slope units. The identification results demonstrated good consistency with existing data. Comparative analysis with Sentinel-1 data revealed that LT-1’s combined ascending and descending orbit data outperformed Sentinel-1’s single ascending orbit data. LT-1’s L-band characteristics, comprehensive ascending and descending orbit coverage, and high-precision deformation detection make it highly promising for landslide identification in the southern hilly regions. This study underscores LT-1’s robust technical support for early landslide identification, highlighting its potential to enhance geohazard monitoring and mitigate risks in challenging terrains.
1. Introduction
The LT-1 Group 01 satellites mark China’s first L-band fully polarimetric SAR satellite system specifically designed for interferometric applications. Comprising two L-band SAR satellites with identical parameters, the system features high ground resolution, strong penetration capability, and a short revisit cycle [1,2,3]. Launched in 2022, the LT-1 system aims to provide critical data support for natural disaster monitoring and early warning in regions with complex terrain [4,5]. Landslides are prevalent in the densely vegetated hilly areas of southern China. However, traditional Sentinel-1 satellites often struggle in these regions due to their wavelength characteristics and data coverage limitations, leading to numerous undetected or misidentified geohazards [6]. In contrast, the L-band signals from LT-1 satellites can effectively penetrate vegetation to capture surface deformation, offering a vital technological advantage for landslide monitoring [7]. Therefore, a comprehensive evaluation of the LT-1 satellite’s capabilities in landslide monitoring in southern hilly regions holds significant scientific value. It also has profound implications for disaster early warning and risk assessment.
The southern hilly regions, characterized by steep and rugged terrain, complex geological and meteorological conditions, dense vegetation cover, and diverse disaster mechanisms, present significant challenges to geohazard monitoring. Commonly used SAR data from C-band and X-band satellites are limited in these areas due to issues with coherence, spatial resolution, time resolution, geometric distortion, and data availability [8,9,10,11]. Currently, internationally available L-band SAR satellites for deformation monitoring include Japan Aerospace Exploration Agency’s (JAXA) ALOS-2 satellite, launched in 2014, and Argentina’s SAOCOM-1A satellite, launched in 2018 [12,13,14,15,16]. However, the high costs of commercial data, coupled with the uneven and uncontrollable distribution of ascending and descending orbit data, make it difficult to meet the monitoring demands in landslide-prone areas [17]. The launch of the LT-1 satellite addresses these challenges by providing SAR data with wide coverage, high frequency, high resolution, and autonomous controllability, at lower cost. In addition, the combination of ascending and descending orbit data of LT-1 can overcome geometric limitations such as overlay and shadow effects common in steep and rugged terrain. This capability enables LT-1 to provide continuous monitoring of landslide-prone areas in complex mountainous regions. This enhances the identification and monitoring of geological hazards [18], offering significant improvements in early warning and risk assessment.
Currently, several studies have explored the capability and application of LT-1 satellite in various fields. Tang et al. [19] conducted an in-orbit testing of the LT-1 satellite, confirming its stable operating conditions and readiness for widespread applications. Gao et al. [20] proposed a phase unwrapping method based on phase quality fusion estimation and information filtering. Their results validated the effectiveness of this method and demonstrated the LT-1 dual-satellite system’s performance in terrain mapping. Li et al. [21] utilized LT-1 satellite data for D-InSAR processing to capture coseismic deformation from the Luding County earthquake in the Gongga Mountain region. They further integrated Sentinel-1A imagery to analyze pre- and post-earthquake glacier surface velocities, highlighting the LT-1 satellite’s advantages in monitoring large deformation gradients, such as those associated with earthquakes and glaciers. Liu et al. [22] examined the Xieliupo landslide in Zhouqu County, Gansu Province, using LT-1 satellite data by employing D-InSAR and time-series InSAR methods. They confirmed the LT-1 satellite’s ability to detect large-scale deformations under moderate vegetation cover. Yang et al. [23] used ascending and descending orbit data from the LT-1 satellite for InSAR deformation inversion. By combining geometric distortion identification methods and line-of-sight sensitivity estimation, they demonstrated LT-1’s feasibility for geohazard identification and identification in complex terrains, outperforming Sentinel-1 data. Han et al. [24] employed LT-1 satellite data with D-InSAR technology to extract deformation in the Ankang area, identifying landslide risks in the eastern section of the Qinba Mountains. Their study verified the LT-1 satellite’s coherence and deformation monitoring effectiveness in regions with high vegetation cover, complex terrain, and long temporal baselines.
Although existing studies have demonstrated the potential of the LT-1 satellite in landslide monitoring [25,26], they primarily rely on deformation data combined with visual interpretation of optical imagery [7]. These studies are often limited to areas with high image overlap and small-scale landslides, lacking a focus on wide-area landslide identification. Furthermore, there is a notable absence of systematic evaluations of the LT-1 satellite’s landslide identification capabilities in the southern hilly regions of China. To address this gap, this study aimed to systematically evaluate LT’s performance in landslide identification and monitoring within Longshan County, a typical southern hilly area in western Hunan. By combining data from both ascending and descending orbits of the LT-1 satellite and using a landslide identification method that integrates C-index, slope, and deformation from both orbits, we seek to assess the satellite’s capabilities comprehensively. Additionally, we will compare and analyze the results with those obtained from Sentinel-1 data. Through this study, we aim to explore the potential application of the LT-1 satellite in the region and provide a new technological path for the early identification, monitoring, early warning, and risk assessment of landslide disasters in southern hilly and mountainous areas.
The structure of this article is as follows. Firstly, the study area of Longshan County and the LT-1 and Sentinel-1 data used were introduced. Subsequently, the InSAR data processing method and landslide identification method were described, and the landslide identification results were presented. Then, an in-depth analysis and discussion were conducted on the identification capability and application potential of the LT-1 landslide, while summarizing the limitations and challenges faced by the research and providing corresponding prospects. Finally, the main conclusions of this study were summarized.
2. Study Area and Data
2.1. Overview of the Study Area
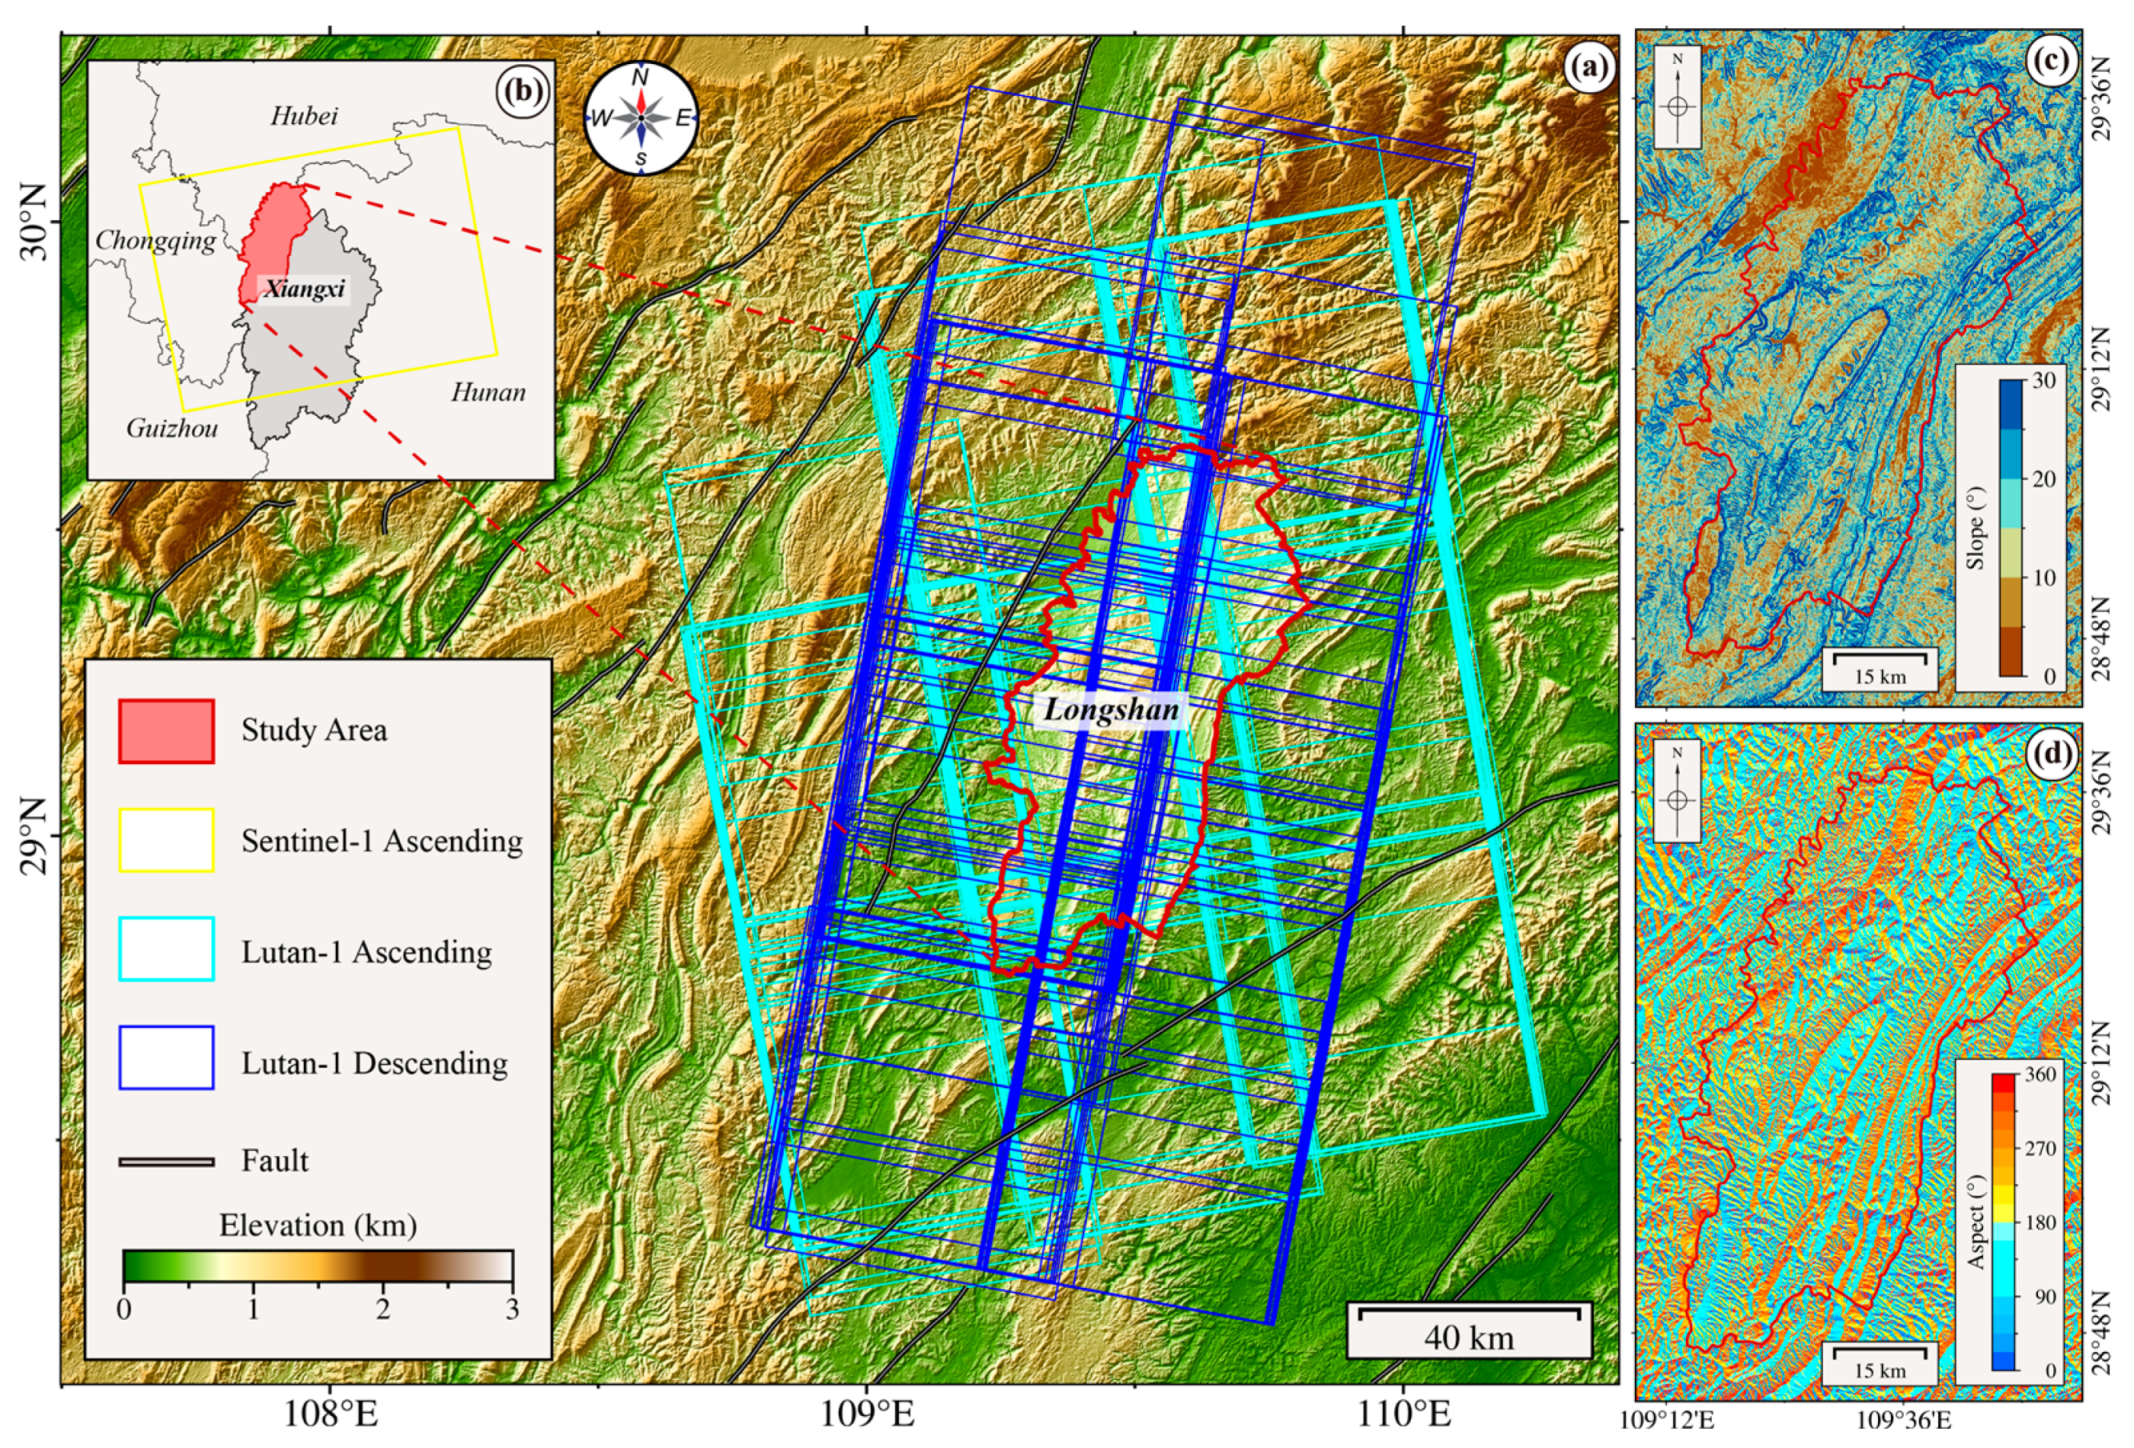
Longshan County, located in the Wuling Mountains of Xiangxi, Hunan Province, features complex geological structures. It is a transitional region between the Yangtze Paraplatform and the Jiangnan Orogenic Belt, characterized by well-developed fault structures such as the Huayuan–Cili Fault Zone (Figure 1). These faults govern regional stratigraphic distribution and geomorphic formation.

Figure 1.
Overview of the study area and SAR image coverage. (a) An enlarged view of (b), with the cyan solid line box representing the LT-1 ascending pass image coverage, the blue solid line box representing the LT-1 descending pass image coverage, and the red thick solid line outlining the administrative boundary of Longshan County in the study area. The background map shows the surface elevation information, (b) Geographic location of Longshan County (light red area) in the Xiangxi Tujia and Miao Autonomous Prefecture, Hunan Province (light gray area), located at the junction of the Hunan, Hubei, Chongqing, and Guizhou provinces. The yellow solid line box represents the Sentinel-1 ascending pass image coverage. (c,d) show the slope and aspect generated using the SRTM DEM.
The surface lithology predominantly consists of Paleozoic carbonate rocks and clastic rocks. The carbonate rock regions are marked by significant karst processes with abundant caves and fractures, resulting in low rock mass integrity. In clastic rock regions, interbedded shale and sandstone are common. Shale, being prone to softening and disintegration upon water exposure, often creates potential sliding planes along contact surfaces.
Hydrogeologically, Longshan County experiences a subtropical monsoon humid climate with an annual rainfall of 1300–1500 mm, primarily concentrated in spring and summer (May to September). This period is characterized by frequent heavy rains and intense groundwater activity, further destabilizing rock and soil masses. Collectively, the region’s geomorphic, lithological, and hydrological characteristics provide favorable conditions for geological disasters such as landslides and collapses [27,28], making it a critical area for geohazard monitoring and risk assessment.
The primary geological disasters in Longshan County include landslides and collapses, with debris flows being secondary. These disasters exhibit distinct regional and seasonal characteristics. Landslides frequently occur in carbonate rock areas and clastic interbedded zones, especially near fault zones and steep slopes. High-risk areas, such as Liye Town and Xichehe Town, experience frequent landslides during the rainy season, posing significant threats to residents’ safety and property. Collapse disasters mainly occur in steep metamorphic rock areas, such as in Luota Town, where schist and slate with developed foliation structures are prone to collapse under rainfall or external disturbances. Debris flows often develop in valley regions, where loose deposits are mobilized by water flow following heavy rainfall. These disaster types and their distribution patterns are closely related to Longshan County’s geological structures, lithology, and hydrological conditions, providing critical insights for identifying and monitoring geological hazards.
2.2. SAR Data
The LT-1 satellite constellation is China’s first SAR system specifically designed for interferometric applications. Consisting of two satellites, A and B, each equipped with L-band SAR payloads, the constellation offers all-weather, day-and-night, and multi-polarization imaging capabilities. These features make LT-1 suitable for a wide range of applications, including geological exploration, land use, earthquake monitoring, disaster mitigation, surveying, and forestry resource investigations [29]. The LT-1 constellation operates in a formation configuration, enabling high-precision, all-weather, all-time terrain measurement, surface deformation monitoring, and geological disaster detection tasks. It provides support for rapid responses to geological hazards and delivers crucial data and technical assurance for natural resource management and related industries [30,31].
Longshan County, characterized by its mountainous and hilly terrain and dense vegetation cover, presents significant challenges for remote sensing. Short-wavelength C-band data from Sentinel-1 struggle with penetration in this region, often resulting in coherence loss. Additionally, the data are limited to a single geometry for ascending orbit data. These limitations restrict the Sentinel-1’s ability to detect landslides. In contrast, LT-1’s long-wavelength L-band data is more resistant to coherence loss in environments and offers multi-geometry ascending and descending orbit data. With a spatial resolution of 3 m in StripMap Mode, LT-1 is particularly well-suited for landslide identification and monitoring in the study area. In this study, 117 ascending orbit scenes and 88 descending orbit scenes covering the study area were collected (Figure 1). The ascending orbit data spans from 24 June 2023 to 29 November 2024, and the descending orbit data covers 25 June 2023 to 10 November 2024. Detailed image information is provided in Table 1.

Table 1.
SAR data information.
The Sentinel-1 satellite, a key component of the European Space Agency (ESA)’s Copernicus Program, is equipped with a C-band SAR sensor, and is widely used for Earth observation [32,33,34,35]. However, its orbit design and mission planning lead to non-uniform distribution of ascending and descending data globally. In southern China, only ascending data from Sentinel-1 are available, limiting the complete extraction of landslide deformation (Figure 1). Additionally, the C-band characteristics of Sentinel-1 result in weak penetration through dense vegetation, making it difficult to effectively detect surface deformation beneath the vegetation. This limitation is particularly evident in the southern hilly regions, where dense vegetation and complex topography cause low coherence in Sentinel-1 images, further affecting the accuracy and reliability of deformation detection.
3. InSAR Data Processing and Landslide Identification
3.1. InSAR Data Processing
The data were primarily processed by GAMMA software. Given the limited data archived from the LT-1 satellite, this study employs a two-step approach to obtain the deformation rate for the entire Longshan County. First the D-InSAR technique is used to compute deformation, followed by the Stacking technique to derive the deformation rate.
To fully utilize the LT-1 satellite imagery, images covering Longshan County are first divided into different paths based on center incidence angle and the coordinates of four corner points. The image overlap rate is set to 0.5, with a spatial baseline threshold of 300m and a temporal baseline threshold of 56 days. Interferometric pairs are formed from any two images meeting these conditions. Since some LT-1 images do not provide precise orbit data, which may result in image registration failure, a feature-based initial registration algorithm, Scale Invariant Feature Transform Like (SIFT-Like) algorithm, is applied for image registration [36].
A multi-look technique with a range-to-azimuth ratio of 5:5 is applied to generate interferometric pairs. Baseline files are used to remove reference surface phases, and a 30 m resolution SRTM DEM is used to remove topographic phases, ultimately resulting in differential interferogram. To reduce noise, the Goldstein filter with a filter exponent of 0.5 is applied. A coherence threshold of 0.3 is set before phase unwrapping to mask decorrelated areas. Phase unwrapping uses the minimum cost flow algorithm.
Subsequently, a polynomial fitting method is used to remove orbital errors, and spatiotemporal filtering is applied to eliminate atmospheric phases, ultimately producing the deformation phase. Finally, given that LT-1 has only one year of data, we assume there will be linear surface deformation and randomly distributed atmospheric delay errors. Consequently, the Stacking technique is employed to perform a time-weighted average on multiple temporally separated interferograms, effectively mitigating the atmospheric delay errors. The specific calculation formula is as follows:
In the equation, V represents the average deformation rate, N is the number of interferometric pairs, is the wavelength, is the deformation phase value at the i-th differential interferogram point, and is the time difference between the i-th interferometric pair. After calculating the average deformation rate in the line-of-sight (LOS) direction, the results are geocoded and converted into the geographic coordinate system.
3.2. Landslide Identification Method Considering C-Index, Slope, and Ascending/Descending Orbit Deformation
The average surface deformation rate of Longshan County, derived from both the ascending and descending orbit LT-1 data, serves as the foundational data for landslide identification in this study. However, the study area is located in the densely vegetated and topographically rugged mountainous region, where InSAR deformation results can be significantly affected by decorrelation noise, atmospheric delay phases, and unwrapping errors. These factors introduce non-deformation signals into the InSAR deformation field, complicating accurate landslide detection. To accurately detect landslide deformations from the InSAR deformation field, this study first employs deep learning to detect suspected landslide deformation areas. Subsequently, the suspected deformation areas are further assessed based on the geometric relationship (C-index) between the deformation direction and the LOS deformation obtained from InSAR. The method flow and principles are as follows:
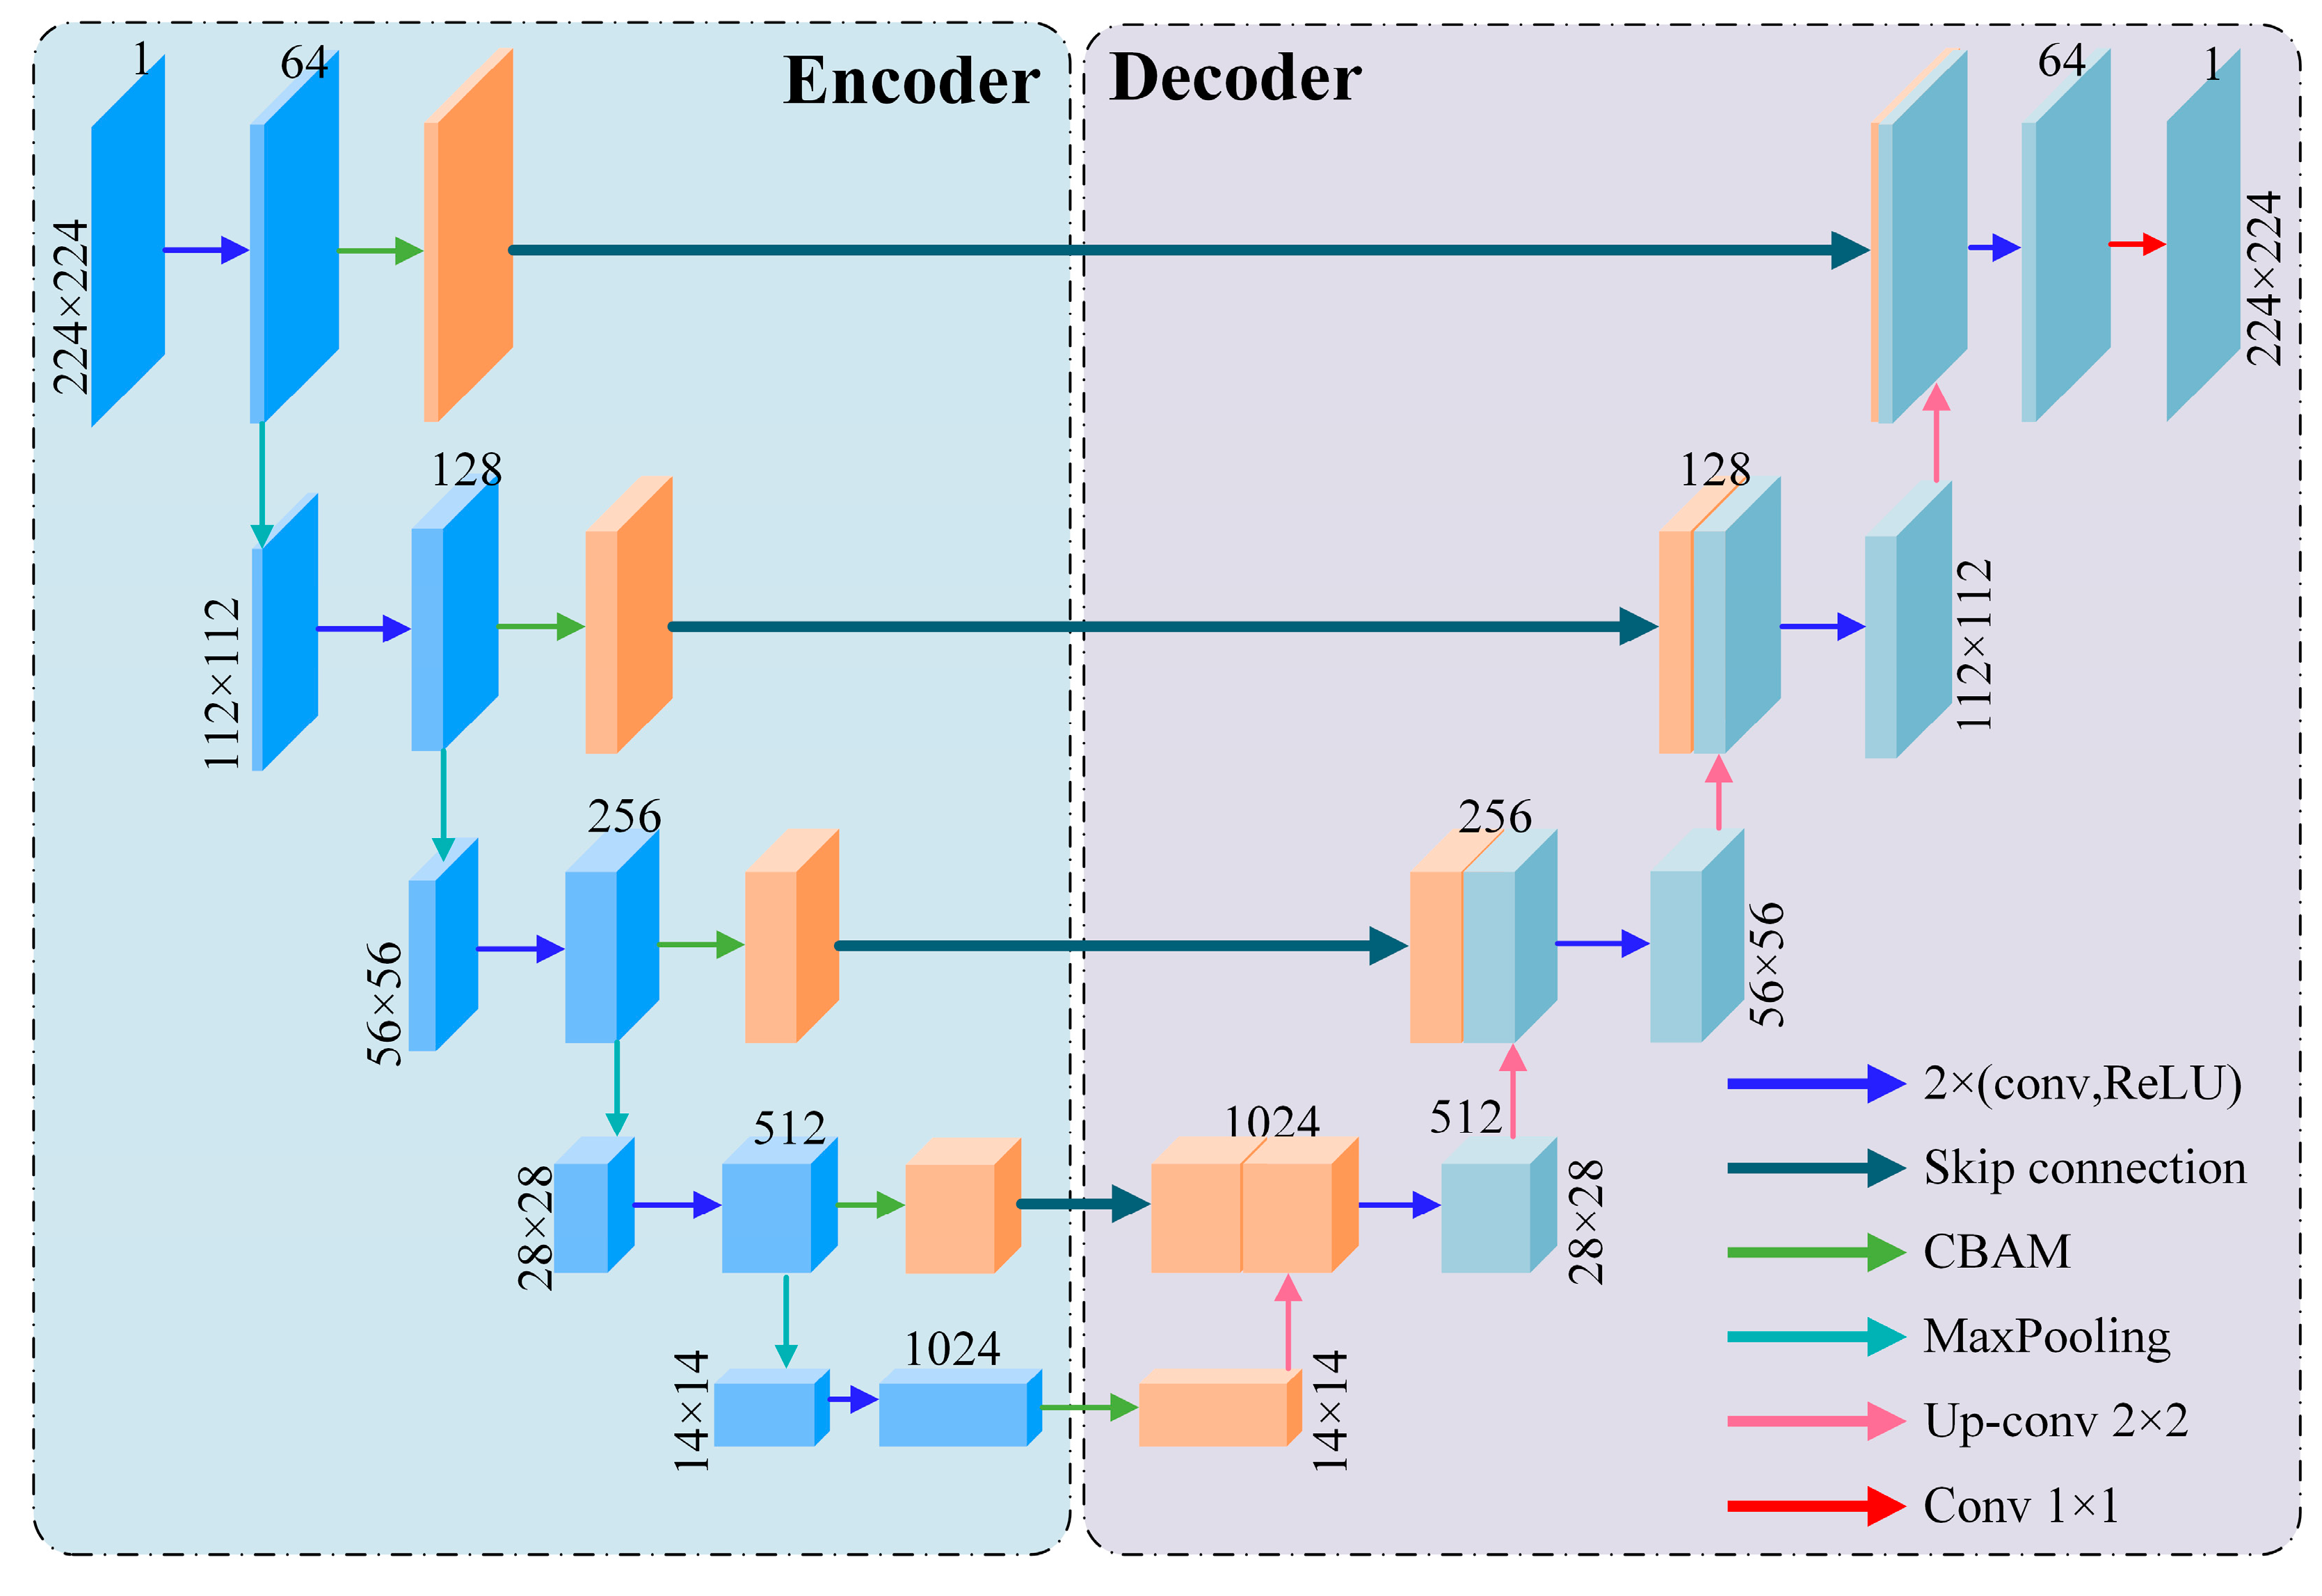
(1) Deep learning for suspected deformation area identification. Manual interpretation of InSAR deformation fields is time-consuming, labor-intensive, and prone to misjudgments and omissions. To address these challenges, this study utilizes the DeforNet convolutional neural network for efficient detection of suspected deformation areas [37]. The structure of DeforNet is shown in Figure 2, which follows a typical U-shaped encoder decoder architecture.
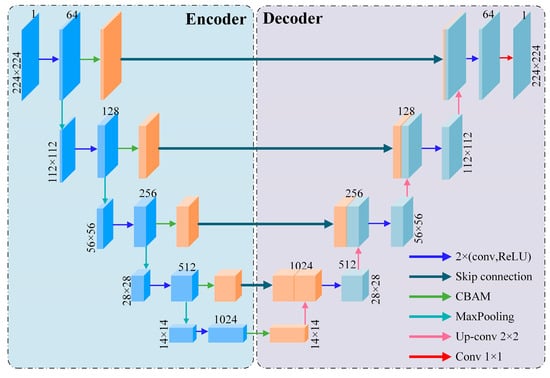
Figure 2.
Architecture of DeforNet.
Encoder: Utilizes depthwise separable convolutions (DSCs) for efficient feature extraction and incorporates a Convolutional Block Attention Module (CBAM) to weight these features.
Decoder: Features bilinear upsampling, skip connections, and convolutional blocks to perform feature fusion and gradually restore image details. Outputs the recognition result through a 1 × 1 convolutional layer.
We enhance the initial DeforNet network by training it on a large dataset of InSAR deformation samples, significantly improving its accuracy [38]. Specifically, we construct a sample library containing approximately 13,000 deformed samples and divide it into a training set and a validation set to an 8:2 ratio. During the training process, the hyperparameters are set as follows: initial learning rate of 0.0002, loss function cross-entropy loss, optimizer Adam, and batch size of 8. The model is trained for 50 epochs and an Early Stopping strategy is introduced to prevent overfitting. The software and hardware configurations used for model training are shown in Table 2. During the deformation area detection process, the average deformation rate obtained from InSAR is first wrapped and then converted into several grayscale images of size 224 × 224, with 25% overlap between adjacent images. The DeforNet network is then used to detect deformation in each image, and the individual detection results are stitched together to obtain several suspected landslide deformation areas.
Table 2.
Configuration of core hardware and software.
(2) C-Index landslide discrimination. Landslide deformation generally occurs downhill along the slope, while InSAR measures LOS deformation, which may differ from the true deformation direction. As a result, different SAR images may have varying sensitivities to the same landslide deformation. The C-index, which quantifies the relationship between landslide deformation and LOS deformation, helps determine whether a deformation area corresponds to a landslide.
Specifically, after identifying suspected deformation areas with a threshold of 1 cm/y and slopes greater than 5°, the corresponding C-index is calculated using formula (4). Based on the C-index results, the suspected deformation areas are divided into three categories: (1) Mainly positive: Indicates that the direction of landslide deformation aligns with the LOS, resulting in a negative deformation rate. (2) Mainly negative: Indicates that the landslide deformation direction is opposite to the LOS, resulting in a positive deformation rate. (3) Mixed positive and negative values: Indicates that the deformation rate has both positive and negative values. Subsequently, based on the C-index results, false deformation areas that do not conform to the deformation characteristics of landslides are automatically excluded. If the deformation rate sign does not match the sign predicted by C-index, the region is considered a pseudo deformation region. Finally, the remaining suspected deformation areas are visually interpreted using optical images (such as Google Earth) to confirm whether they are landslides. For a more detailed identification process, refer to [39].
In Equations (2)–(4), Dslope and DLOS represent the slope direction deformation and the InSAR LOS deformation, respectively. DE, DN and DV represent the eastward, northward, and vertical deformations, respectively. α and β represent the slope and aspect, respectively. θ and γ represent the incidence angle and azimuth angle, respectively. C denotes the C-index.
When a landslide moves downhill along the slope, the relationship between slope direction deformation and the three-dimensional (3D) deformation field is described by Equation (2). The relationship between LOS deformation and the 3D deformation field is given by Equation (3). Using these equations, the projection coefficient of landslide deformation in the LOS direction, known as the C-index, can be calculated using Equation (4). The C-index ranges from −1 to 1, with a larger absolute value of the C-index indicating greater InSAR sensitivity to landslide deformation. A positive C-index indicates the landslide is moving away from the radar, resulting in negative InSAR deformation. Conversely, a negative C-index indicates that the landslide is moving toward the radar, leading to positive InSAR deformation values. Using the C-index and analyzing the suspected landslide deformation, non-landslide deformations that do not conform to these relationships can be excluded.
3.3. Deformation Results and Accuracy Evaluation
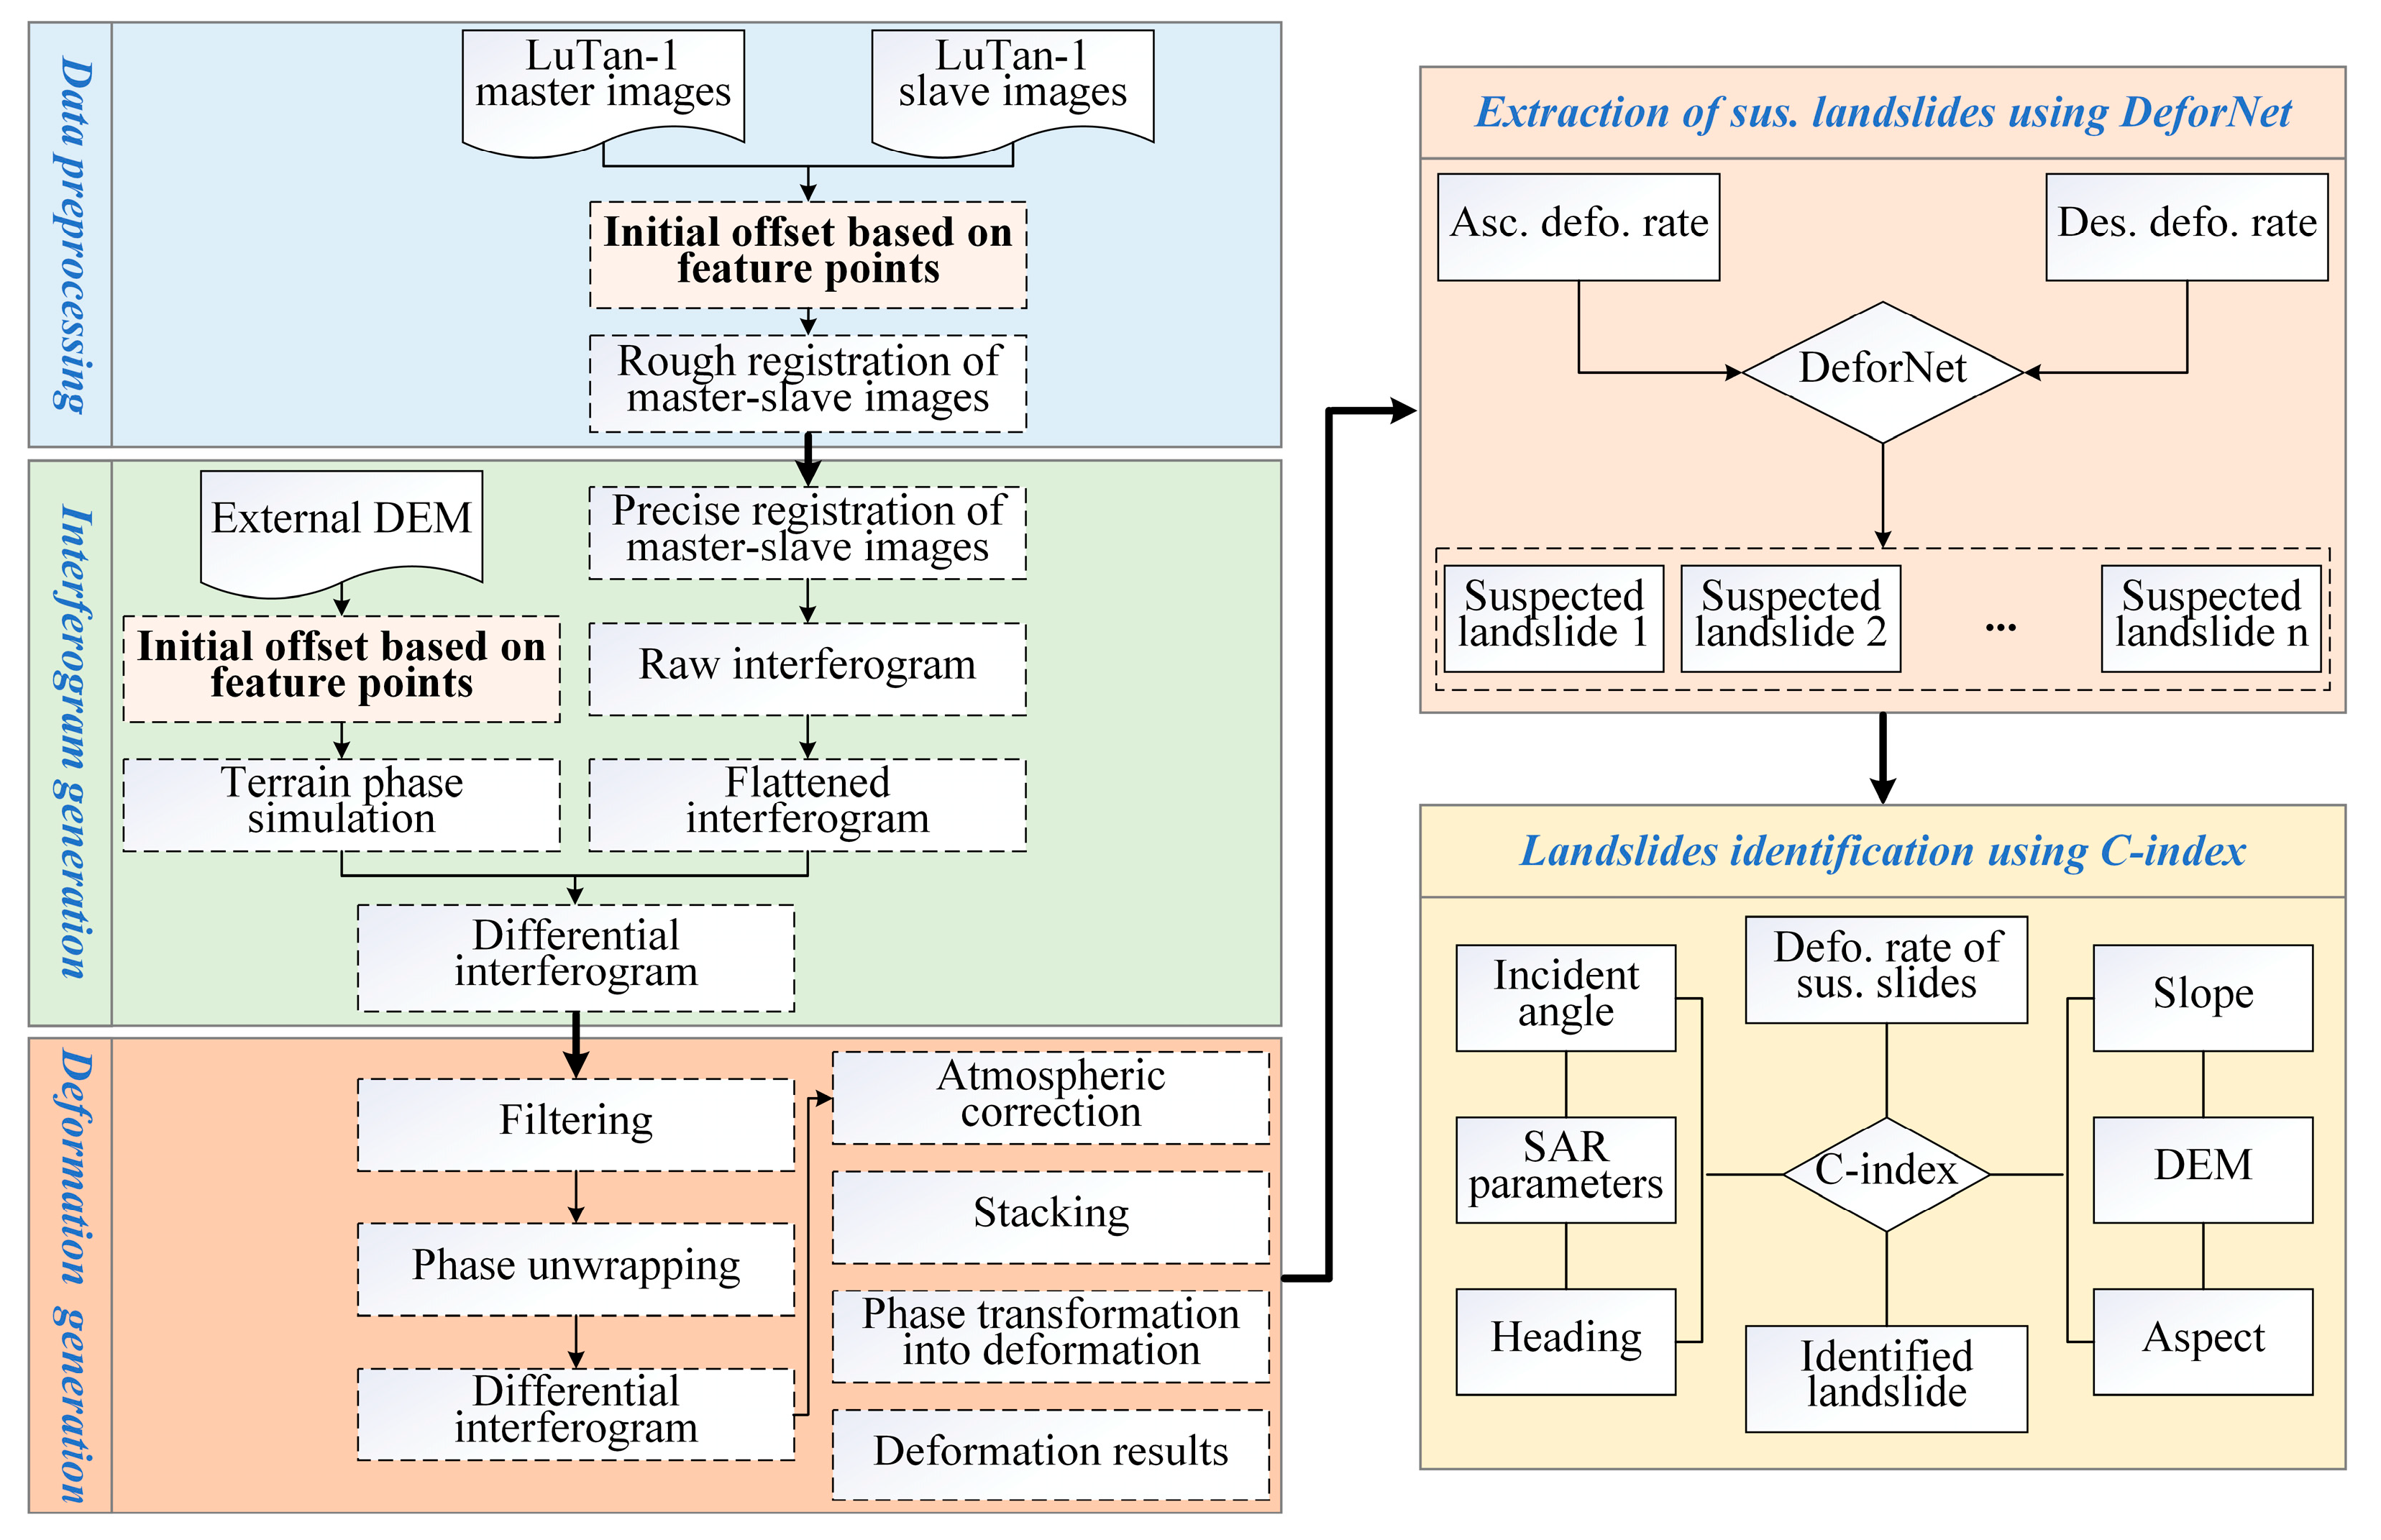
Following the data processing workflow outlined in Figure 3, we first determined the average surface deformation rate for Longshan County (Figure 4), then conducted accuracy verification (Figure 5). Figure 4a–c display the deformation rate results obtained from LT-1 ascending and descending orbit data and Sentinel-1 ascending orbit data, respectively. The overall deformation in Longshan County is minimal, with most regions being stable, and the deformation rate is generally between −20 mm/yr and +20 mm/yr. The spatial distribution of deformation areas is relatively consistent across the three datasets, though some mountainous areas exhibit incoherent phenomena. Measurement points obtained from coherence selection are relatively sparse.
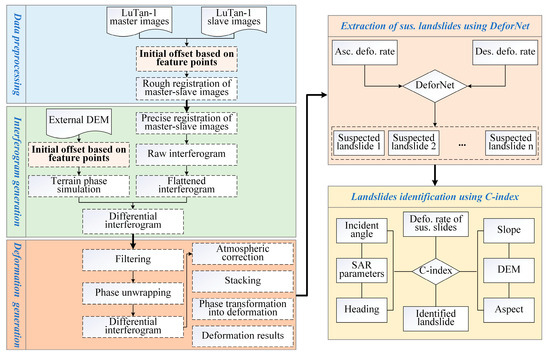
Figure 3.
Flowchart of landslide identification using combined LT-1 ascending and descending orbit imagery.
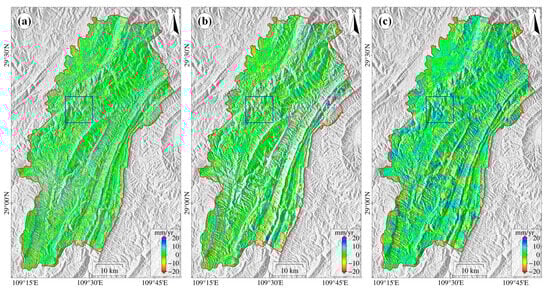
Figure 4.
Average deformation rate map of Longshan County from LT-1 and Sentinel-1. (a) LT-1 ascending orbit deformation rate; (b) LT-1 descending orbit deformation rate; (c) Sentinel-1 ascending orbit deformation rate.
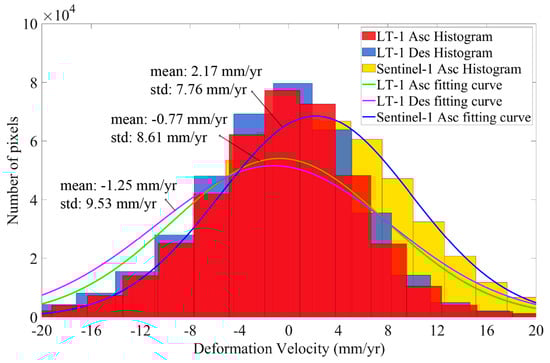
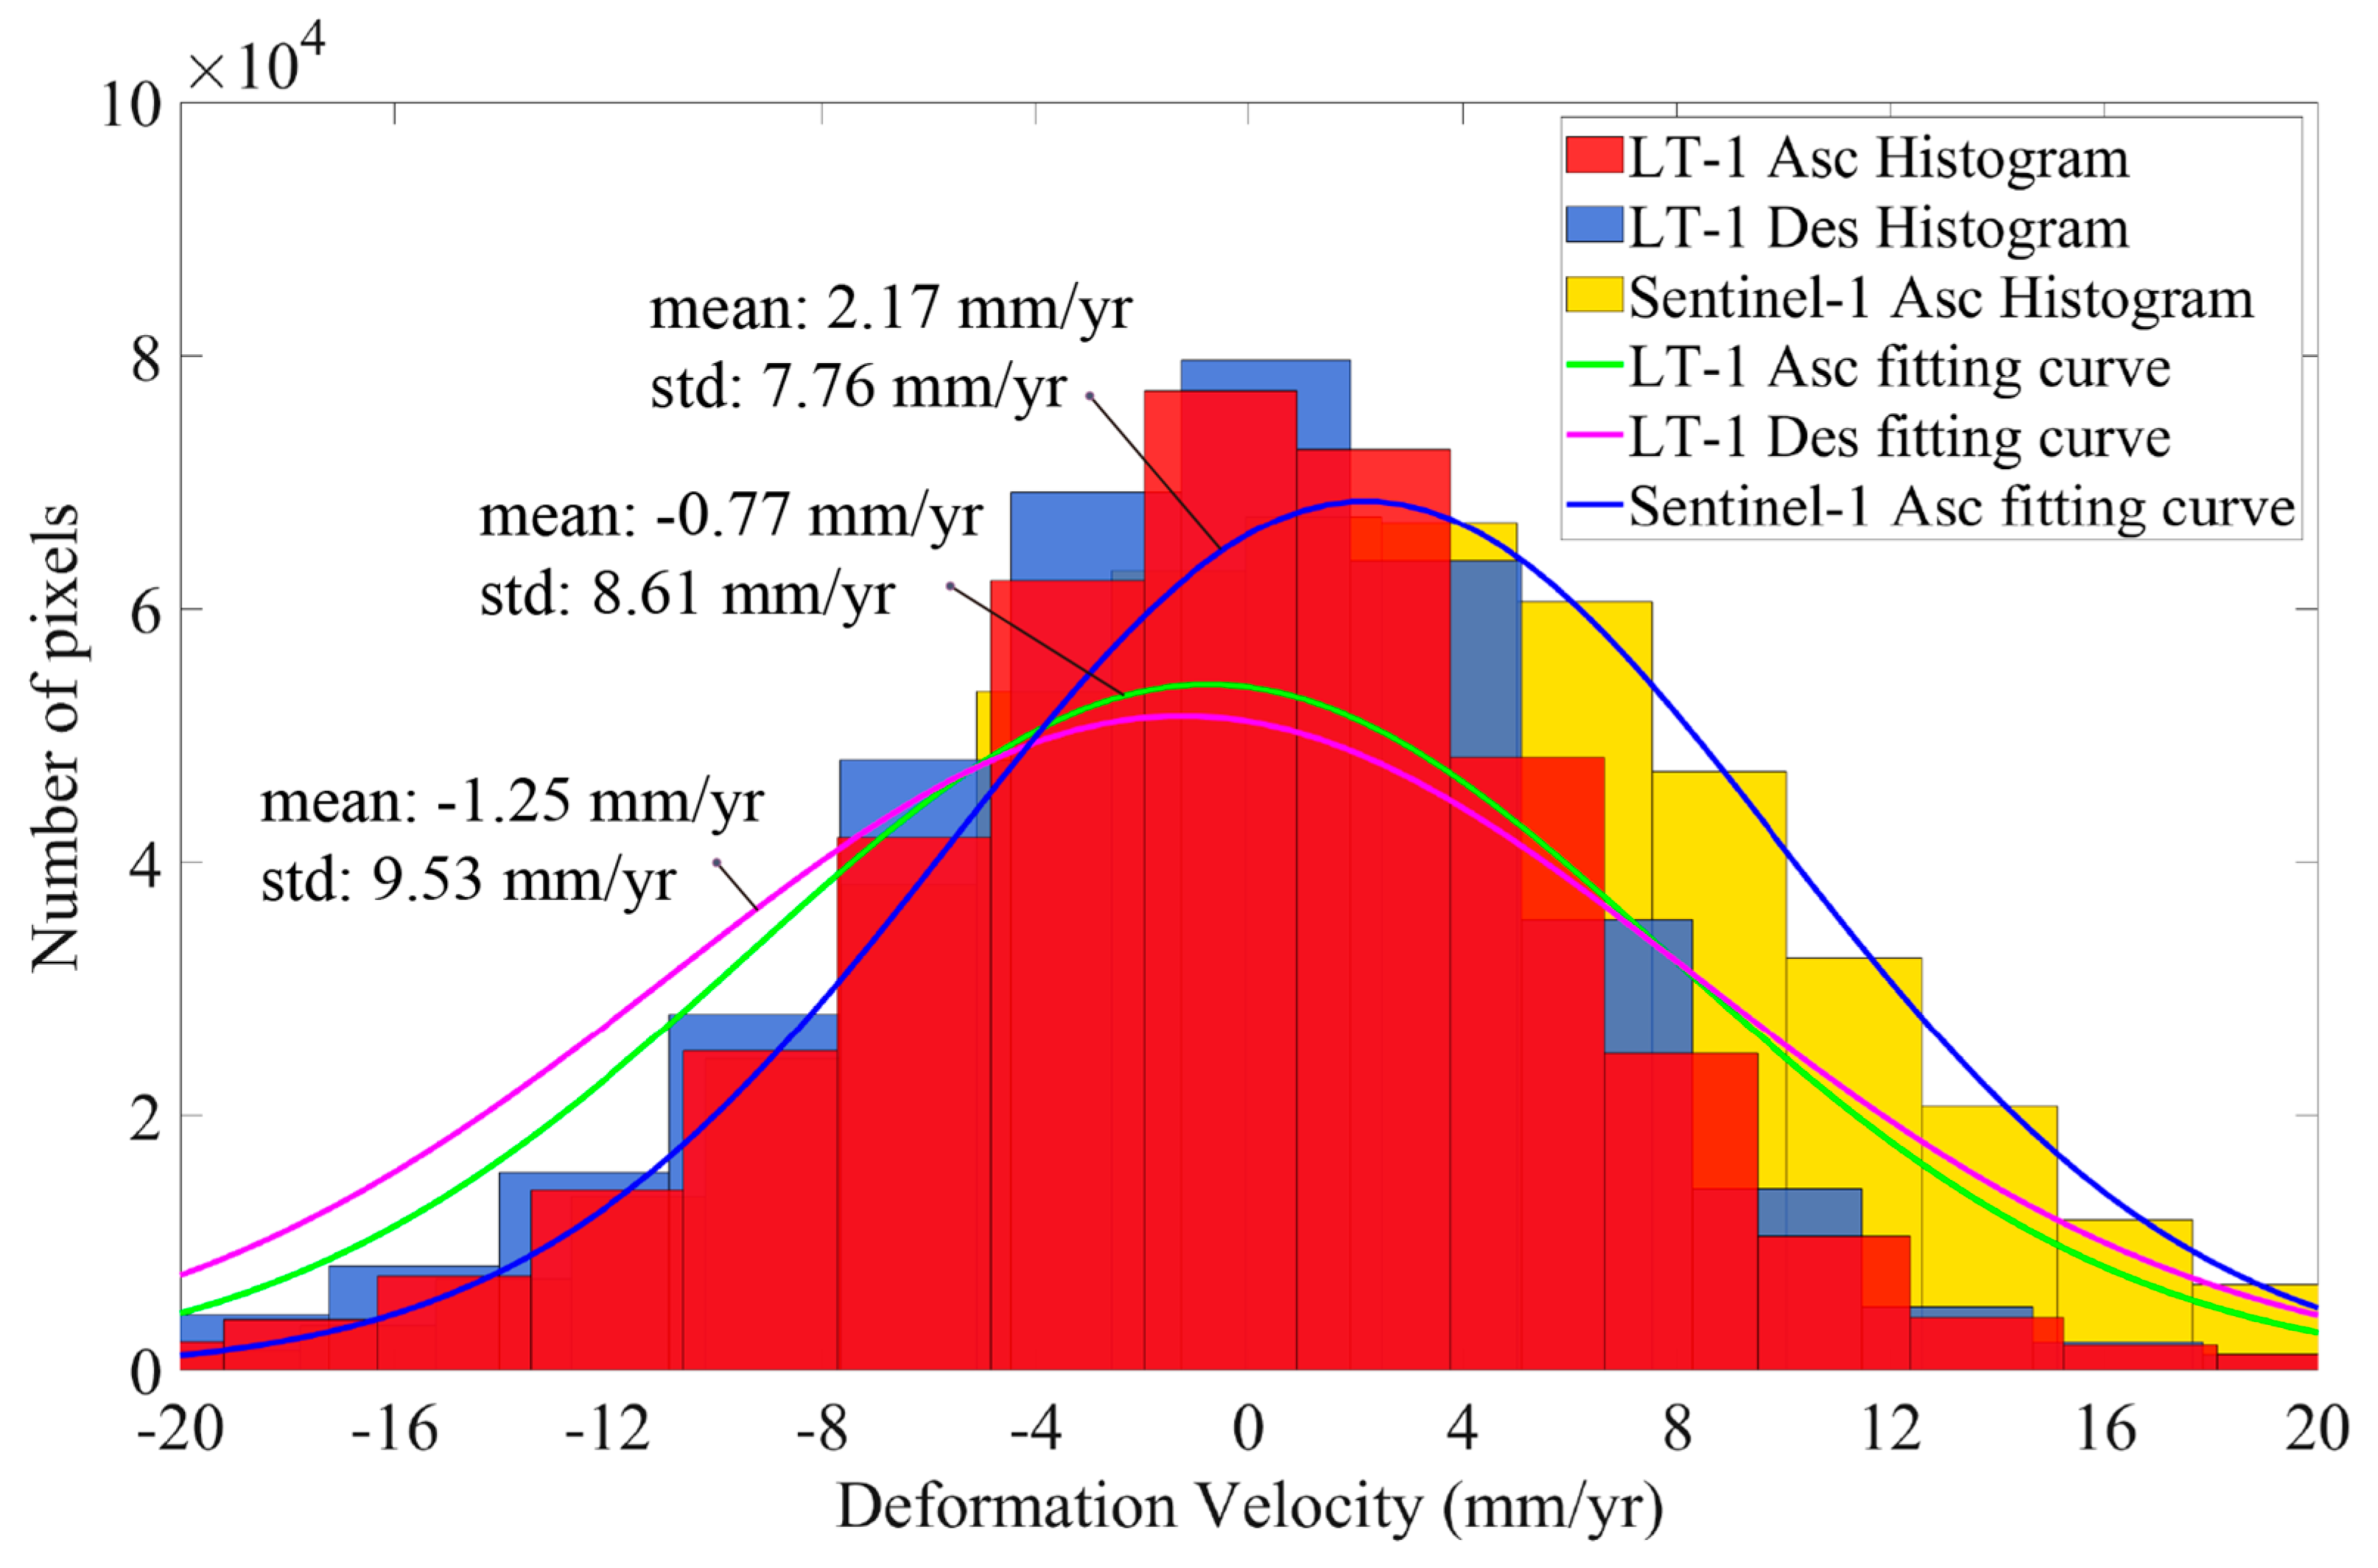
Figure 5.
Statistical histogram of deformation rates for LT-1 and Sentinel-1 in Longshan County.
Sentinel-1 identified more deformation areas than LT-1 (Figure 4), which may be related to the influence of vegetation on radar signals. The C-band (Sentinel-1) has a shorter wavelength, making it more susceptible to coherence degradation in high vegetation coverage areas, leading to increased phase noise and potential deformation errors. Additionally, observations were mainly conducted during the rainy season, exacerbating atmospheric delay errors. In contrast, the L-band (LT-1) has a longer wavelength, stronger penetration ability, and coherence preservation ability. This allows LT-1 to more reliably obtain surface deformation in densely vegetated areas, resulting in fewer but more reliable detected deformation areas.
Moreover, there is a significant difference in monitoring levels between LT-1 and Sentinel-1. The deformation rates from LT-1 ascending and descending orbit range from −482 mm/yr to +393 mm/yr and −502 mm/yr to +596 mm/yr, respectively, while Sentinel-1 results range from −67 mm/yr to +63 mm/yr. The large discrepancies are primarily due to the longer wavelength of the L-band (23.8 cm) compared to the C-band (5.6 cm), which allows LT-1 to capture larger deformation magnitudes and offer better penetration and anti decoherence capabilities, giving LT-1 a significant advantage in deformation monitoring in Longshan County.
To evaluate the accuracy of the deformation rates obtained from the LT-1 ascending and descending orbit data and Sentinel-1 ascending orbit data, this study selected a common region for comparison. The accuracy of the results was assessed using histogram statistics and the calculation of the standard deviation of the average deformation rate. The formula for calculating the standard deviation of the average deformation rate is:
where represents the standard deviation of the average deformation rate, λ is the wavelength, N is the number of interferometric pairs, is the deformation phase value at the i-th differential interferogram point, represents the average deformation rate, and is the time difference between the i-th interferometric pair.
The statistical results shown in Figure 5 indicate that most deformation rates in this region fall between −10 mm/yr and +10 mm/yr, with the curves of deformation rate fitting a normal distribution. The average values of LT-1 ascending and descending orbits are closer to zero, suggesting greater stability compared with Sentinel-1, which exhibits more noise.
From the perspective of standard deviation, LT-1’s broader monitoring range results in more scattered data distribution. Although the L-band has stronger penetration, this also leads to lower monitoring accuracy, suggesting that LT-1’s standard deviation should be larger than Sentinel-1. However, the results show that the standard deviations of the three datasets are not significantly different. This indicates that while Sentinel-1’s deformation rates are confined to a narrower range, they are distributed very discretely with larger errors, likely due to significant atmospheric delays during the rainy season.
3.4. Landslide Identification
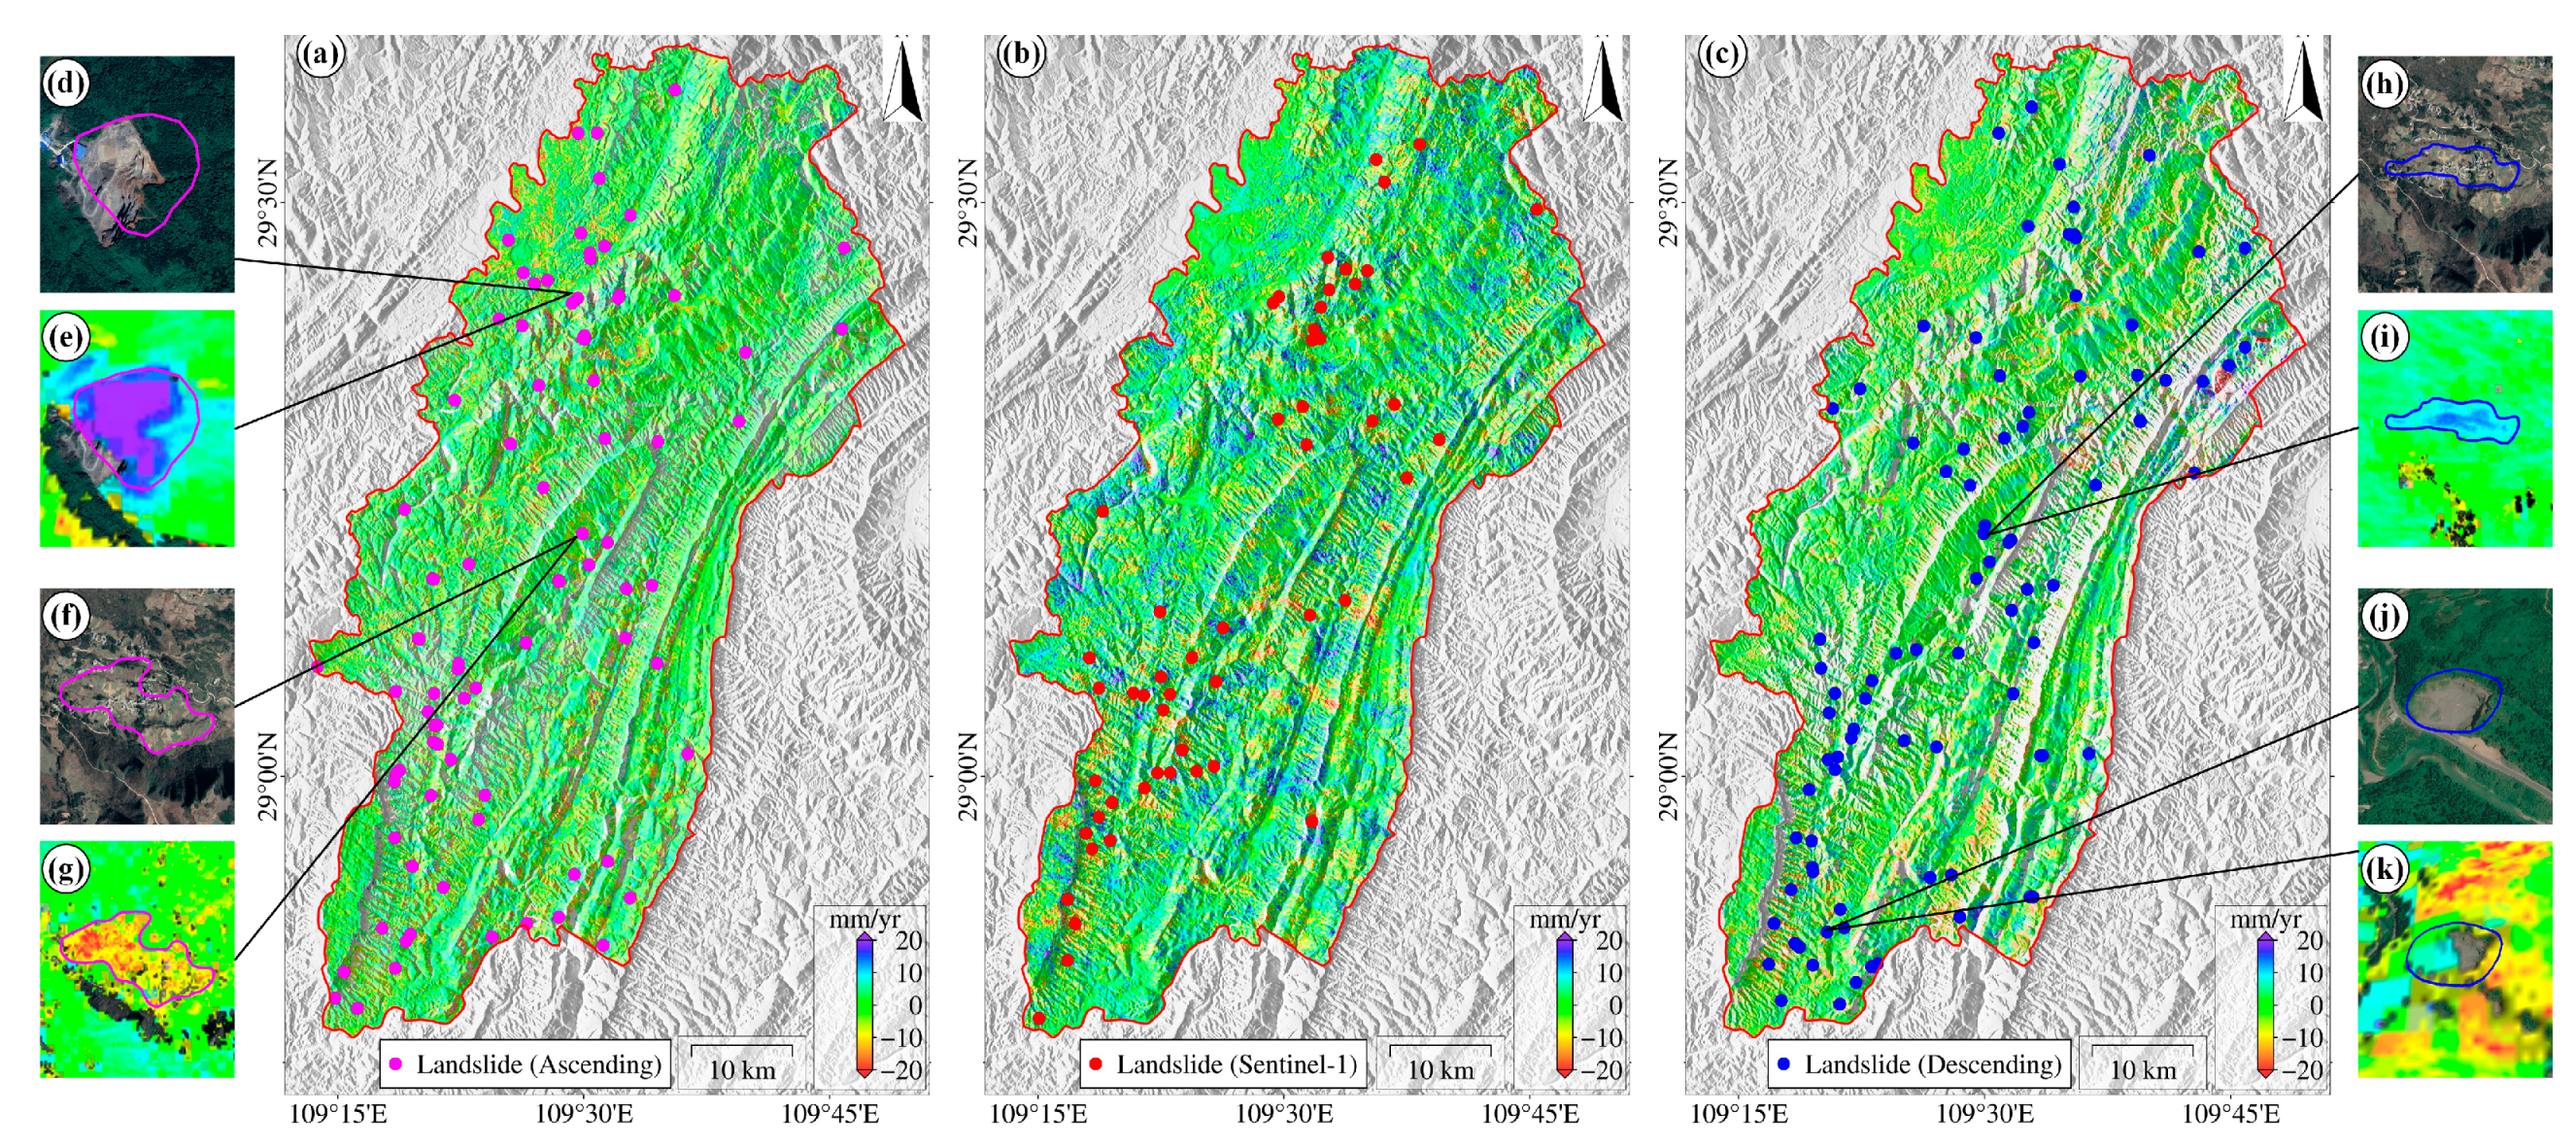
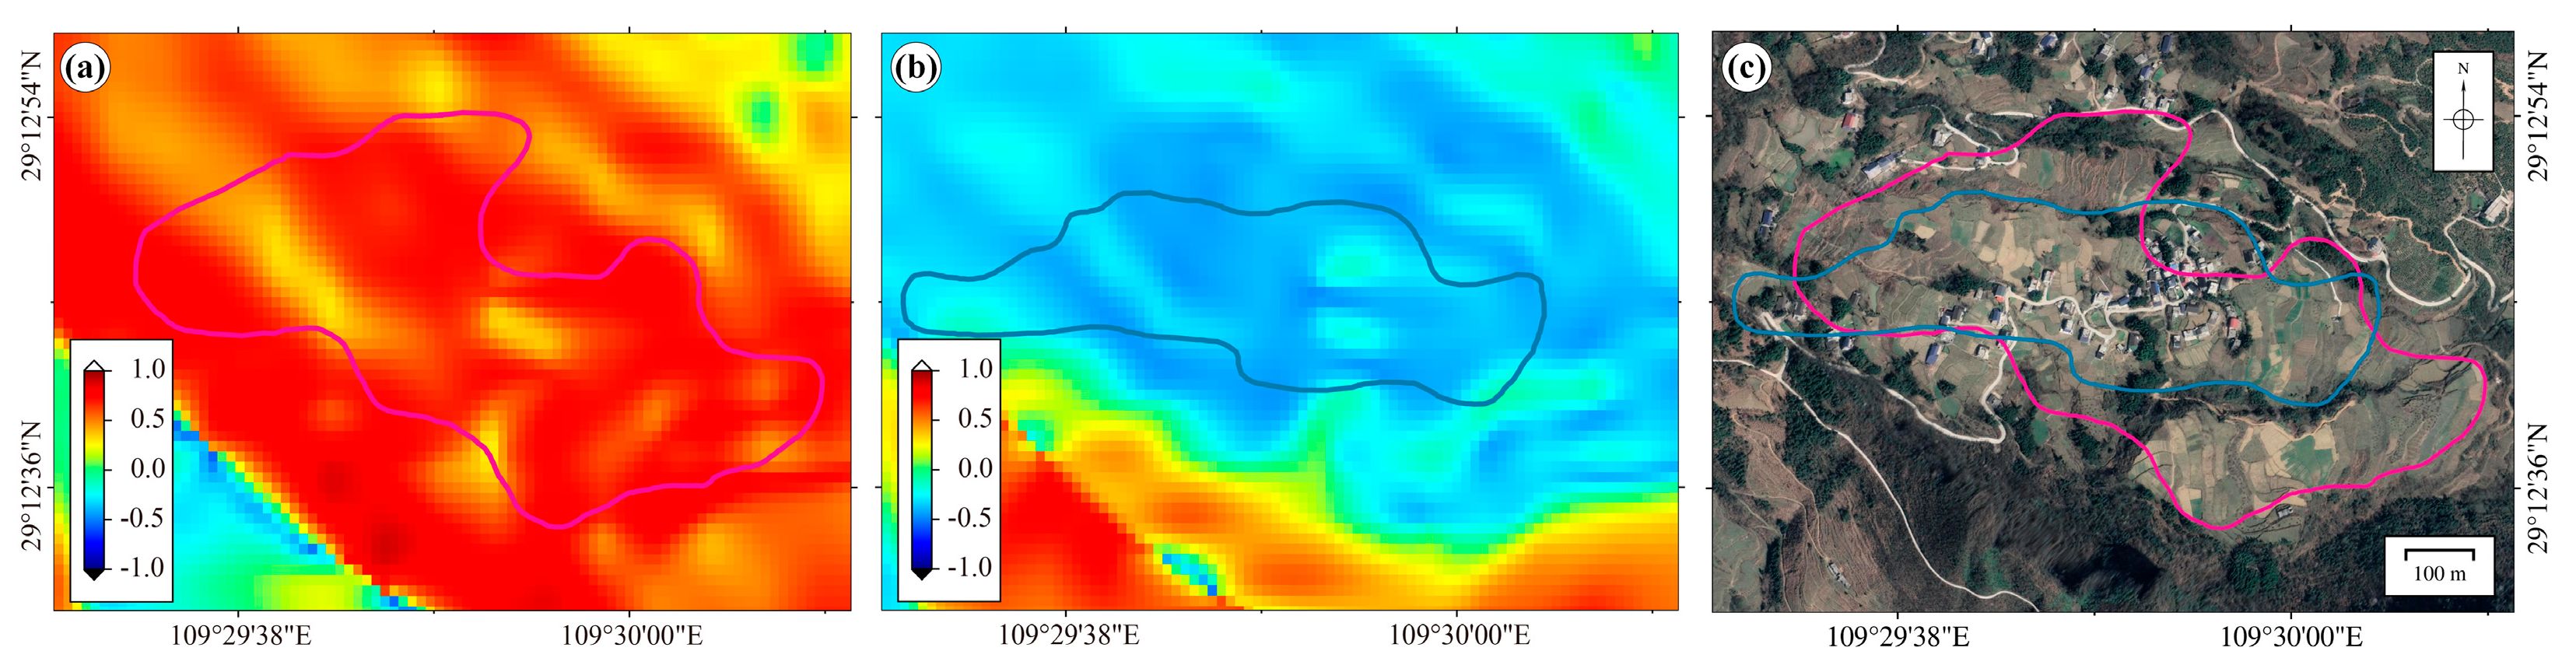
Using the C-index, slope, and ascending/descending orbit deformation methods, we identified landslide areas in Longshan County through processing and analysis of the LT-1 ascending and descending orbit data as well as Sentinel-1 data. A total of 88 landslide areas were identified using the LT-1 ascending orbit data, 90 landslide areas were identified using the descending orbit data, and 17 landslide areas were identified from both ascending and descending orbit data. Sentinel-1 data identified a total of 53 landslide areas (Figure 6). In addition, we selected a typical landslide area and plotted its C-index (Figure 7). The interpretation results show that LT-1 exhibits excellent interferometric capability, with notably strong deformation detection performance in the densely vegetated southern hilly regions.
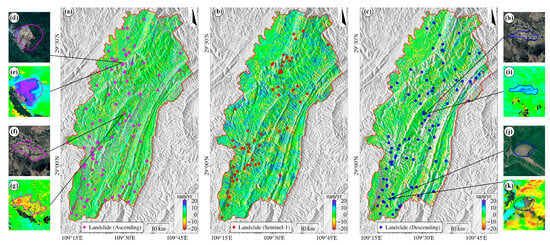
Figure 6.
Landslide identification results from LT-1 ascending and descending orbit data. (a) Ascending orbit identification results; (b) Sentinel-1 identification results; (c) descending orbit identification results; (d–g) optical images and deformation rate maps of two typical landslides identified in ascending orbit data; (h–k) optical images and deformation rate maps of two typical landslides identified in descending orbit data.
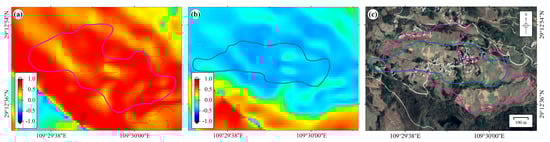
Figure 7.
C-index of a typical landslide area. (a) LT-1 ascending orbit results; (b) LT-1 descending orbit results; (c) optical image.
Due to differences in observational geometry between ascending and descending orbit satellites, as well as variations in surface slope, aspect, and deformation distribution, the deformation results from ascending and descending orbits are not entirely consistent. This inconsistency not only presents challenges for landslide identification but also highlights the advantages of using both ascending and descending orbit data in combination.
4. Discussion
4.1. LT-1 Satellite Landslide Identification Capability
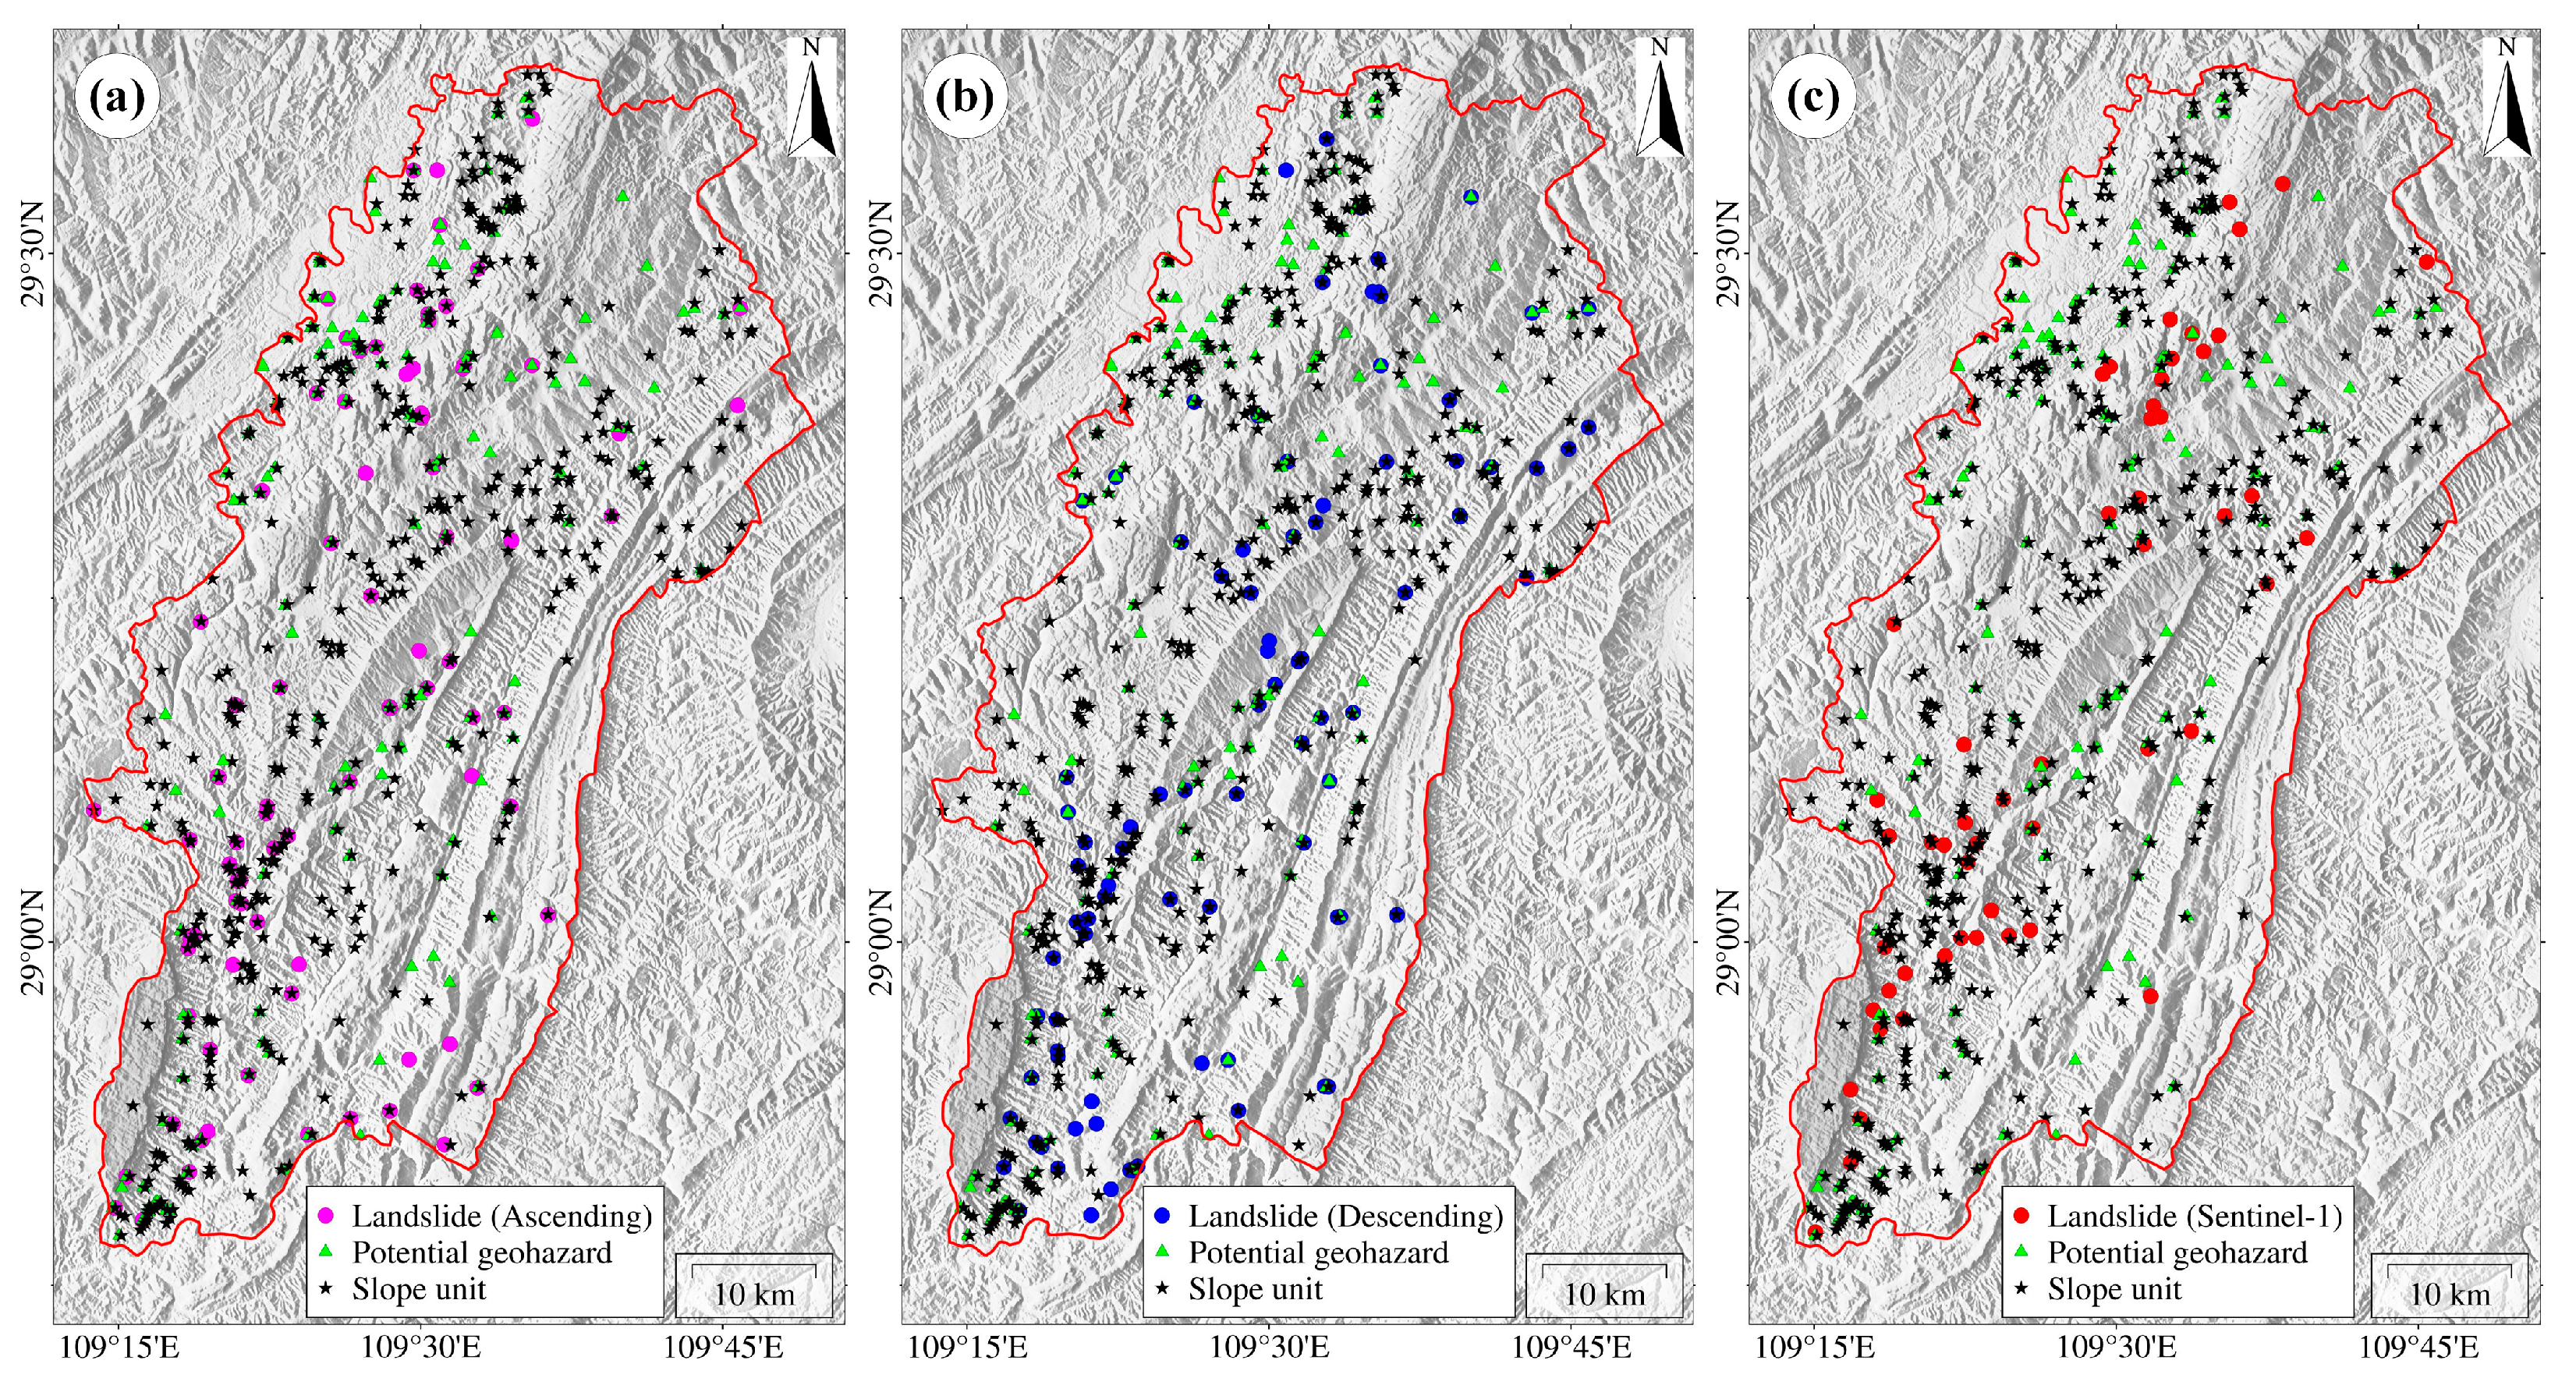
To evaluate the performance of the LT-1 satellite in landslide identification in the southern hilly mountainous areas, this study compared the identification results with 173 geological hazard hidden points and 463 medium-to-high-risk slope valley units in Longshan County (Figure 8). We also compared the results with those from Sentinel-1 data.
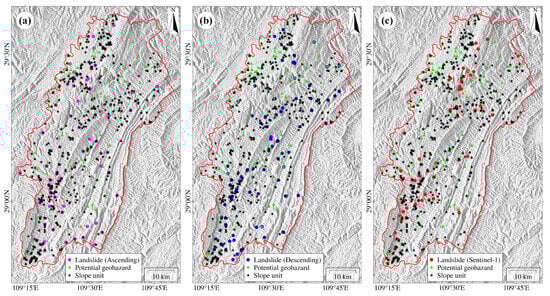
Figure 8.
Analysis of landslide identification results from LT-1 ascending and descending orbit data. (a) Ascending orbit results; (b) descending orbit results; (c) Sentinel-1 results.
The LT-1 ascending orbit data successfully identified 35 landslide areas related to existing geological hazard risk points, accounting for approximately 39.8% of the total landslides identified. The descending orbit data successfully identified 34 landslide areas, accounting for approximately 37.8% of the total identified landslides (Table 3). These findings indicate that the LT-1 ascending and descending orbit data are effective in detecting geological hazard risk areas, particularly in regions with significant deformation rates, where they align well with existing geological hazard risk points. The undetected points may be due to deformation concentrated over a long time window or insignificant deformation signals within the current time period. This suggests that supplementary analysis, combining high-resolution imagery and ground surveys, is needed.
Table 3.
Statistical results of landslide identification from LT-1 ascending and descending orbit data, Sentinel-1 data, and known risk points.
By overlaying the landslide areas determined by the ascending and descending trajectory data of LT-1 with existing slope units, it can be found that 58 of the landslide areas identified by the ascending orbit data fall within the slope units, accounting for approximately 65.9% of the total landslides identified; 55 of the landslide areas identified by the descending orbit data fall within the slope units, accounting for approximately 61.1% of the total identified landslides (Table 3). These results suggest that LT-1 has good application potential for deformation monitoring in complex terrain conditions, especially in gully areas.
We also compared the landslide identification results with those from Sentinel-1 data. The results showed that Sentinel-1 data identified a total of 53 landslides, of which 19 were related to existing geological hazards, accounting for approximately 35.8% of the total number of identified landslides. Additionally, 30 of the identified landslide areas fell within the slope units, accounting for approximately 56.6% of the total number of identified landslides. The analysis indicates that Sentinel-1’s C band has limited penetration ability in high vegetation areas and is more susceptible to noise, leading to inferior recognition performance compared to LT-1.
In particular, when comparing the ascending orbit data of LT-1 and Sentinel-1, LT-1 demonstrated a significantly higher detection rate for landslide areas (88 vs. 53) and a greater proportion of landslides related to existing geological hazards (39.8% vs. 35.8%). Additionally, LT-1’s ascending orbit data identified a higher percentage of landslides within slope units (65.9% vs. 56.6%), further highlighting its superior performance in complex terrains. This enhanced capability is attributed to the LT-1’s L-band SAR, whose longer wavelength allows it to better penetrate vegetation than the Sentinel-1’s C-band SAR.
These results demonstrate that LT-1 excels in detecting deformation in areas with steep slopes and dense vegetation, making it suitable for landslide monitoring in the complex terrain of the southern hilly regions. Moreover, the combined observations of ascending and descending orbit compensate for the limitations of single orbit observations, providing the possibility for rapid and comprehensive surface deformation detection. This approach establishes a data foundation for landslide monitoring. Based on the results of this study, scientific evidence can be provided to assist government agencies in verifying geological hazard risk points and delineating slope unit risk zones.
4.2. Application Potential of LT-1 Ascending and Descending Orbit Data in Landslide Identification
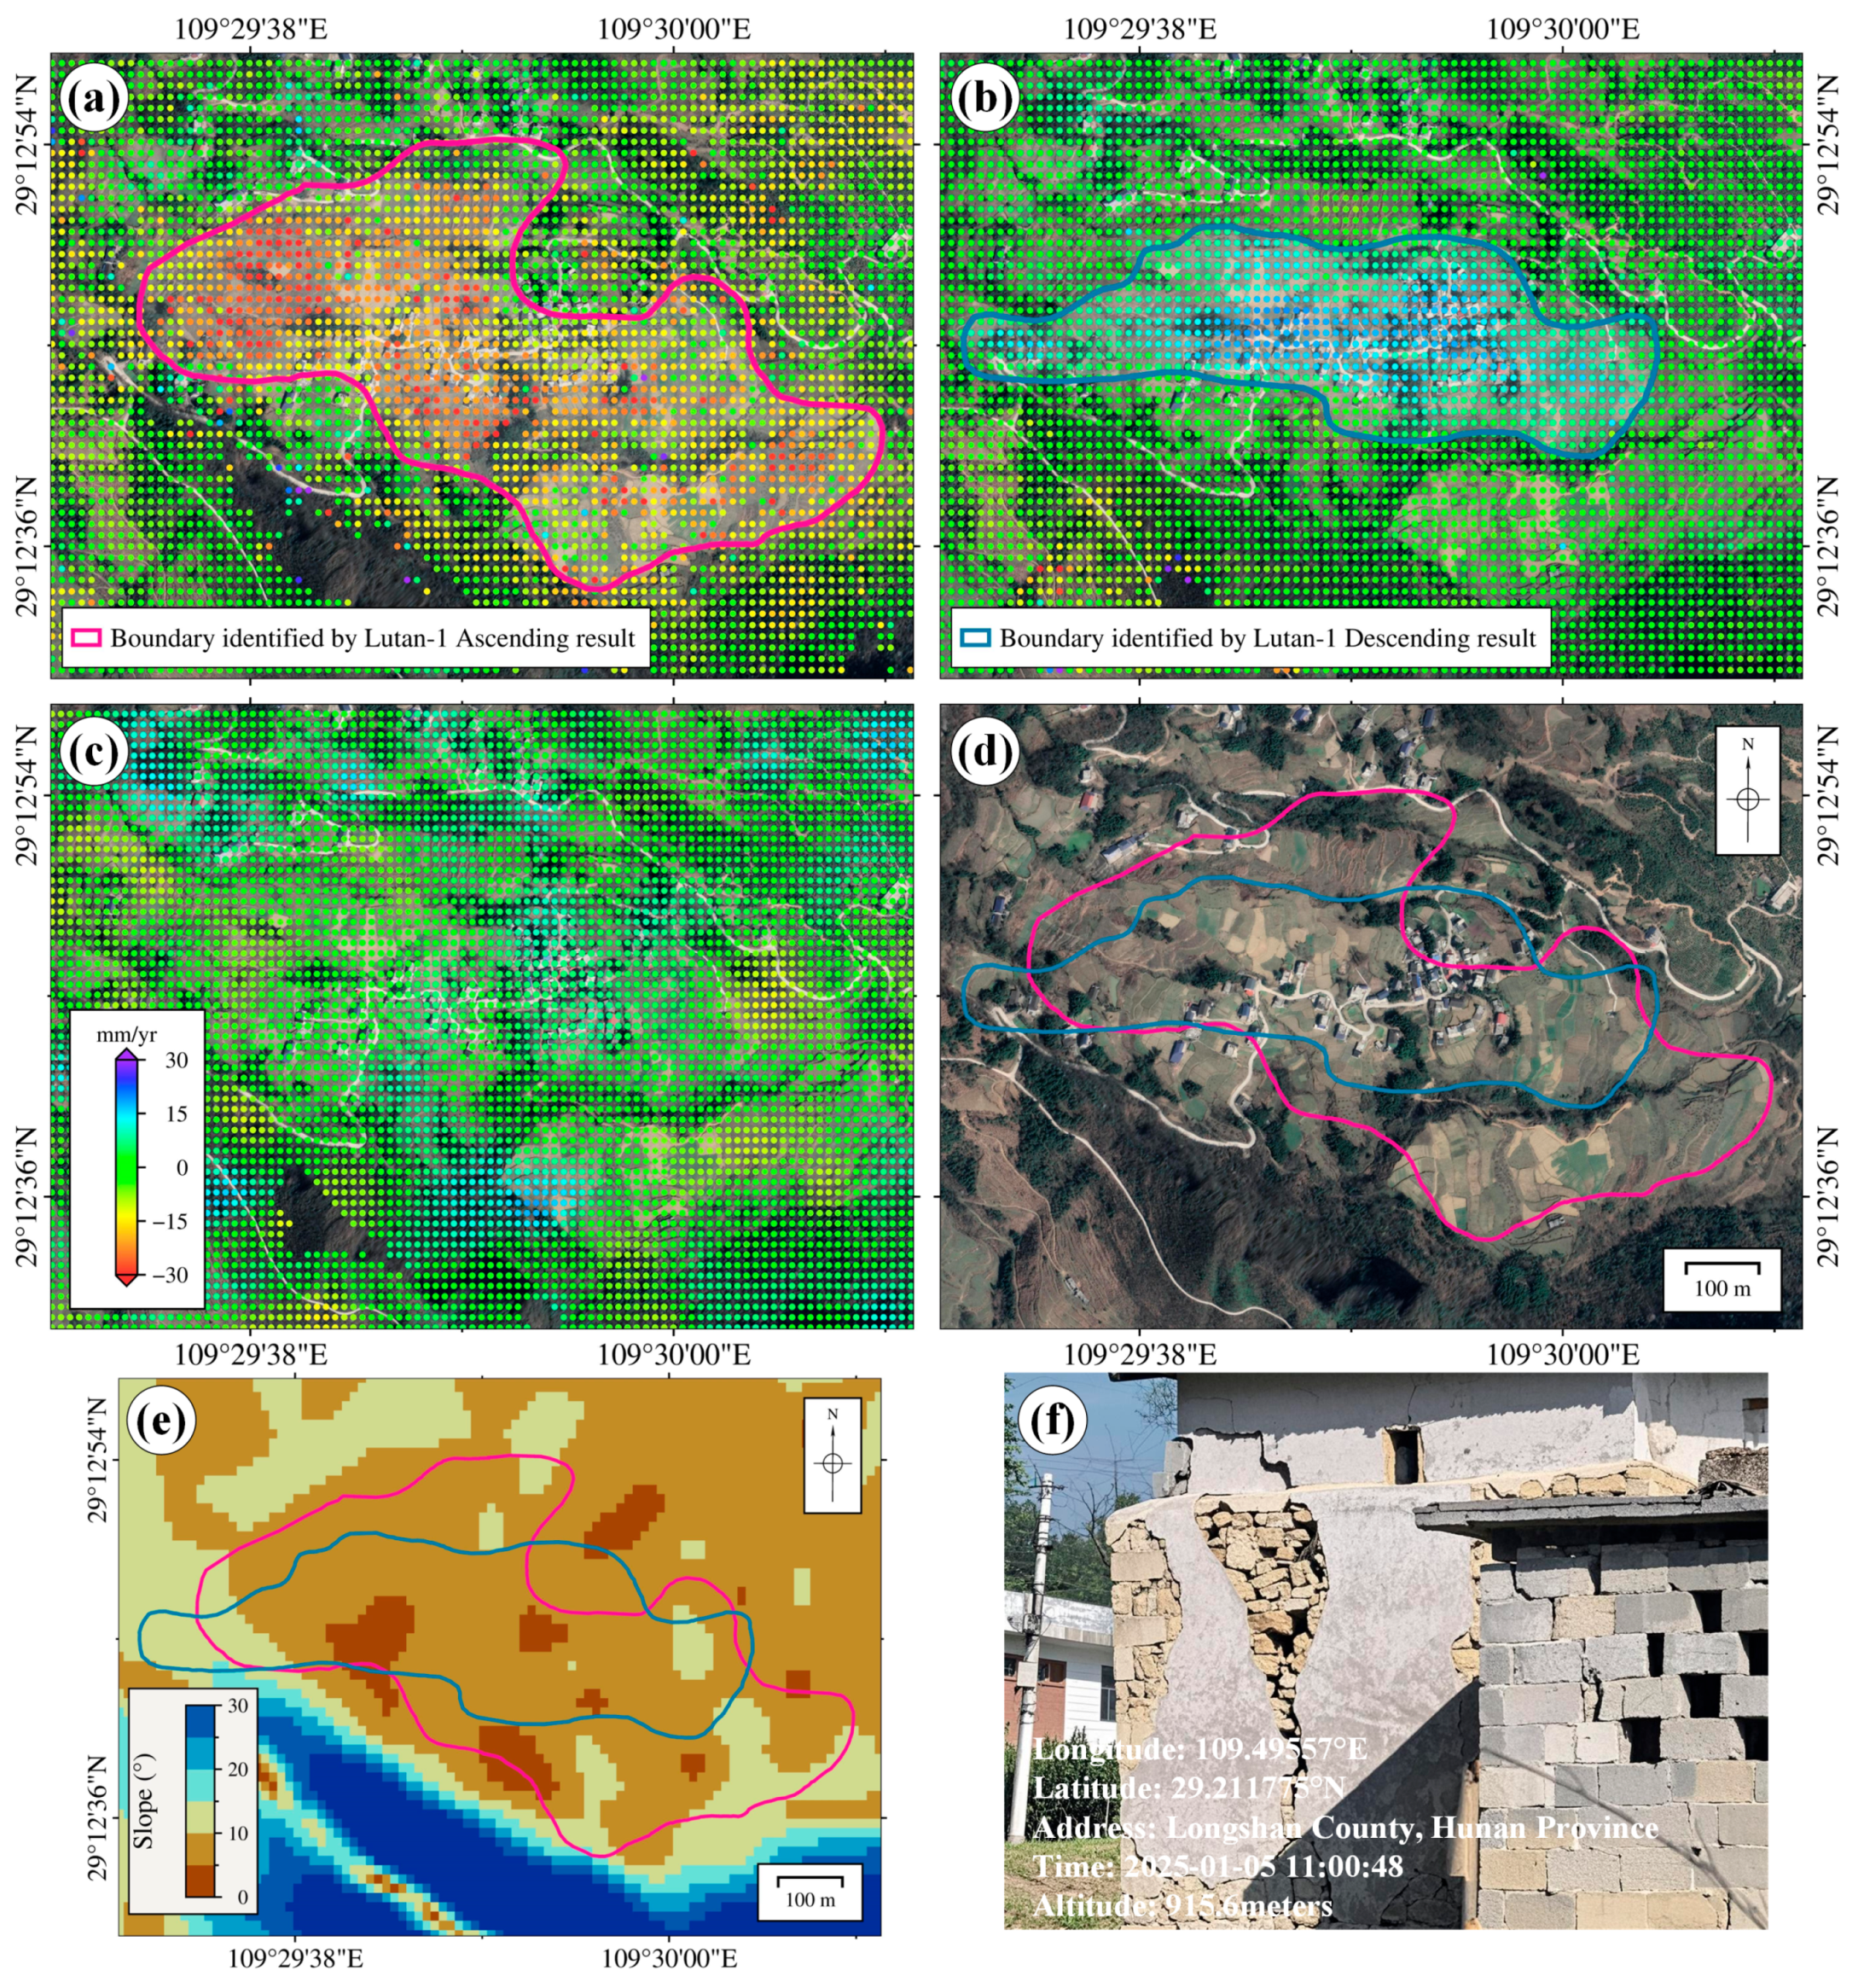
To further validate the application potential of LT-1 data in landslide identification, this study selected a typical landslide area within the study region for analysis, comparing LT-1 ascending orbit, LT-1 descending orbit, and Sentinel-1 ascending orbit data.
In Figure 9, it can be seen that the LT-1 ascending orbit data effectively captures the overall deformation characteristics of the landslide area. Notably, in the middle and lower sections, LT-1 ascending data show a clear deformation trend, consistent with the actual deformation pattern (Figure 9a). The LT-1 descending data can also detect the deformation of the landslide well, which is particularly concentrated in the upper and middle regions, showing deformation distribution characteristics consistent with the ascending orbit data (Figure 9b). Importantly, certain deformation features that were not captured by the descending orbit data were captured by the ascending orbit data.
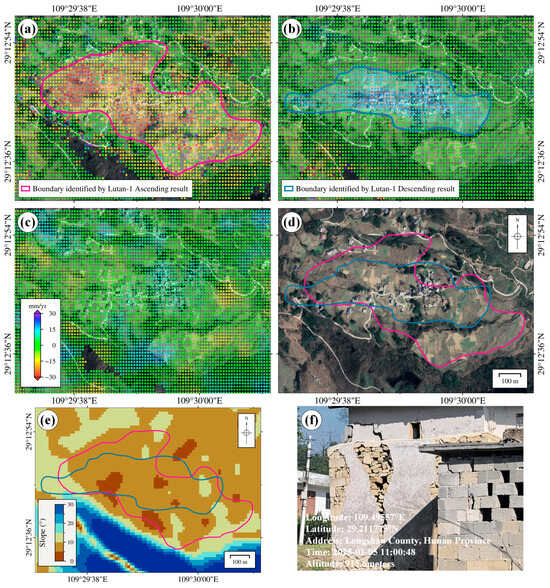
Figure 9.
Comparison of three InSAR monitoring results for a typical landslide in Longshan County. (a) LT-1 ascending orbit result; (b) LT-1 descending orbit result; (c) Sentinel-1 ascending orbit result; (d) optical basemap of the landslide; (e) slope; (f) field survey photographs in Longshan County.
In contrast, Sentinel-1 ascending orbit data has poor monitoring performance in the landslide area and cannot effectively capture landslide characteristics (Figure 9c). In this study area, the distribution of Sentinel-1’s data is uneven, with only ascending orbit data available. This single orbit limitation restricts the acquisition of comprehensive landslide deformation, reducing the integrity and reliability of monitoring results. LT-1 provides both ascending and descending orbit observation data, which can effectively address the shortcomings of single orbit observation. In addition, LT-1 is equipped with an L-band SAR (wavelength ≈ 23.6 cm), offering superior penetration capability compared to Sentinel-1’s C-band (wavelength 5.6 cm). This is particularly advantageous in areas with dense vegetation or complex terrain, especially in the hilly and mountainous areas of southern China, where the C-band radar is often hindered by vegetation and terrain cover [40,41,42]. While the ALOS-2 satellite also utilizes L-band and possesses similar monitoring capabilities as LT-1, its data coverage in China is relatively limited. Furthermore, ALOS-2 primarily operates in the ascending orbit geometry, and the data acquisition costs are higher [43].
LT-1, as a domestically developed satellite in China, offers lower data acquisition costs and more comprehensive observation data [44,45], making it ideal for long-term, continuous landslide monitoring. Its high-frequency observation capabilities are especially valuable for disaster early warning and emergency response. In summary, the application of LT-1 in landslide identification in southern hilly and mountainous areas has superiority and potential.
The method proposed in this study, which combines LT-1 dual orbit data with C-index and slope information, exhibits high scalability for landslide monitoring projects. The L-band characteristics of LT-1, comprehensive coverage from both ascending and descending orbits, high-precision deformation detection capability, and lower data acquisition costs make this method particularly valuable for a wide range of geological disaster scenarios, such as earthquakes, landslides, urban ground subsidence, mining subsidence, and volcanic deformation. Furthermore, this method also has the potential for implementation and promotion in other areas with frequent geological disasters.
4.3. Limitations and Challenges of the Study
Although LT-1 satellite data has demonstrated strong landslide identification capabilities in the hilly and mountainous areas of southern China, several challenges remain in practical applications.
Firstly, LT-1 mainly conducts routine observations using Band 1, which needs further parallel computing research for massive data and the adjustment and stitching of deformation results for wide-area monitoring. In addition, the L-band SAR of LT-1 can effectively suppress incoherent phenomena in complex terrain and improve the quality of interferograms, but the L-band is less sensitive to small deformation signals compared to the C-band SAR. Therefore, additional research is needed to enhance the detection of small deformations [3,31]. Secondly, severe terrain undulations in mountainous areas can cause geometric distortions, such as shadows and overlapping in radar images. LT-1’s wide incident angle coverage makes it particularly sensitive to these distortions, resulting in ineffective detection in some areas with excessive slopes or facing away from the satellite. This affects the spatial continuity of deformation results. In addition, inaccurate real-time orbit data result in low initial registration accuracy, increasing registration failure and affecting the efficiency of image automation processing [36]. Lastly, landslide identification typically requires multi-source data integration, including topographic information, geological data, and optical imagery [39,46], which adds complexity to the analysis.
To address these limitations, future efforts should focus on optimizing data processing and interpretation techniques. For example, joint landslide identification could be conducted using both LT-1 and Sentinel-1 data. Additionally, efficient LT-1 image registration algorithms and processing strategies should be developed to improve the success rate of image registration. Furthermore, integrating multi-source data, such as optical imagery and geological monitoring data, for joint analysis can significantly boost the accuracy of landslide identification. For future application scenarios, improving time resolution, through additional satellites or optimized task planning, will enhance the ability to monitor rapid or short-term landslide geological hazard events. Incorporating machine learning models can enable automatic landslide detection and deformation prediction, further enhancing landslide monitoring capabilities.
5. Conclusions
This study evaluates the ability of LT-1 ascending and descending orbit data to identify landslides in the hilly areas of southern China, using Longshan County, Xiangxi as a case study. The focus is on analyzing the complementarity of ascending and descending orbit data and its effectiveness in complex terrain. A landslide identification experiment was conducted in Longshan County, integrating the C-index, slope, and LT-1 ascending and descending orbit deformation data. The results were compared with existing geological hazard points and medium- to high-risk slope valley unit data, typical landslide areas were analyzed alongside Sentinel-1 landslide identification results.
LT-1’s dual-orbit data performed exceptionally well, detecting 88 landslides using ascending data and 90 landslides using descending data. The identified landslides showed strong spatial consistency with known geological hazard points (39.8% for ascending, 37.8% for descending) and slope units (65.9% for ascending, 61.1% for descending). This verifies LT-1’s effectiveness in complex terrain. Compared to Sentinel-1, LT-1 achieved better identification performance, particularly through the joint application of ascending and descending orbit data, which significantly improved accuracy and reliability.
The differences between ascending and descending orbit data effectively addressed the limitations of single orbit observations in terrain masking, observation geometry, and deformation direction, providing more comprehensive deformation monitoring. Additionally, this study confirmed the interferometric ability of LT-1’s L-band data in densely covered vegetation areas, demonstrating its applicability and potential for landslide monitoring in southern hilly and mountainous areas.
These findings promote the development of regional landslide disaster monitoring technology, providing a reference for future landslide risk assessment and disaster monitoring using LT-1 ascending and descending orbit data.
Author Contributions
Conceptualization, H.C., Z.Q., B.L. and T.Y.; methodology, H.C., R.P., Z.Y. (Zhiyi Yu), Z.Y. (Zefa Yang) and G.F.; writing—original draft preparation, H.C., Z.Q., R.P. and W.W.; writing—review and editing, H.C., Z.Y. (Zefa Yang) and W.W.; visualization, H.C., Z.Y. (Zhiyi Yu) and W.W.; funding acquisition, T.Y. All authors have read and agreed to the published version of the manuscript.
Funding
This research was supported by Open Fund (NO. hndzgczx202403) of Hunan Geological Disaster Monitoring, Early Warning and Emergency Rescue Engineering Technology Research Center. It was also supported by Hunan Provincial Natural Science Foundation of China (2024JJ8375, 2023JJ60562). It was also supported by major scientific and technological projects of Hunan Geological Institute (No. HNGSTP202303).
Data Availability Statement
The Sentinel-1 SAR data used in this study are copyrighted by the European Space (https://dataspace.copernicus.eu, accessed on 1 March 2022). The GAMMA commercial software was obtained from https://www.gamma-rs.ch/gamma-software, accessed on 22 August 2023.
Acknowledgments
The authors would like to thank the European Space Agency for providing Sentinel-1 data and appreciate the plotting support provided by Generic Mapping Tool v6.4 [47].
Conflicts of Interest
The authors declare no conflicts of interest.
References
- Shi, K.; Wang, Q.; Liu, Z.; Hu, W.; Weng, H.; Mo, Y.; Lai, T.; Huang, H. A Novel Geometric Calibration Method of Spaceborne SAR for Rugged Terrain: A Case Study of LuTan-1 Images. IEEE J. Sel. Top. Appl. Earth Obs. Remote Sens. 2024, 17, 16030–16040. [Google Scholar] [CrossRef]
- Jin, G.; Liu, K.; Liu, D.; Liang, D.; Zhang, H.; Ou, N.; Zhang, Y.; Deng, Y.; Li, C.; Wang, R. An Advanced Phase Synchronization Scheme for LT-1. IEEE Trans. Geosci. Remote Sens. 2020, 58, 1735–1746. [Google Scholar] [CrossRef]
- Hu, L.; Tang, X.; Tomás, R.; Li, T.; Zhang, X.; Li, Z.; Yao, J.; Lu, J. Monitoring surface deformation dynamics in the mining subsidence area using LT-1 InSAR interferometry: A case study of Datong, China. Int. J. Appl. Earth Obs. Geoinf. 2024, 131, 103936. [Google Scholar] [CrossRef]
- Ji, Y.; Zhang, X.; Li, T.; Fan, H.; Xu, Y.; Li, P.; Tian, Z. Mining Deformation Monitoring Based on Lutan-1 Monostatic and Bistatic Data. Remote Sens. 2023, 15, 5668. [Google Scholar] [CrossRef]
- Yang, F.; Shi, X.; Dai, K.; Zhang, W.; Yang, S.; Han, J.; Wen, N.; Deng, J.; Li, T.; Yao, Y.; et al. Utilizing LuTan-1 SAR Images to Monitor the Mining-Induced Subsidence and Comparative Analysis with Sentinel-1. Remote Sens. 2024, 16, 4281. [Google Scholar] [CrossRef]
- Cao, C.; Zhu, K.; Song, T.; Bai, J.; Zhang, W.; Chen, J.; Song, S. Comparative Study on Potential Landslide Identification with ALOS-2 and Sentinel-1A Data in Heavy Forest Reach, Upstream of the Jinsha River. Remote Sens. 2022, 14, 1962. [Google Scholar] [CrossRef]
- Liu, J.; Xu, C.; Zhao, B.; Yang, Z.; Liu, Y.; Zhang, S.; Kong, X.; Lan, Q.; Xu, W.; Qi, W. Deformation Slope Extraction and Influencing Factor Analysis Using LT-1 Satellite Data: A Case Study of Chongqing and Surrounding Areas, China. Remote Sens. 2025, 17, 156. [Google Scholar] [CrossRef]
- Strozzi, T.; Farina, P.; Corsini, A.; Ambrosi, C.; Thüring, M.; Zilger, J.; Wiesmann, A.; Wegmüller, U.; Werner, C. Survey and monitoring of landslide displacements by means of L-band satellite SAR interferometry. Landslides 2005, 2, 193–201. [Google Scholar] [CrossRef]
- Usami, S.; Ishimaru, S.; Tadono, T. Advantages of High-Temporal L-Band SAR Observations for Estimating Active Landslide Dynamics: A Case Study of the Kounai Landslide in Sobetsu Town, Hokkaido, Japan. Remote Sens. 2024, 16, 2687. [Google Scholar] [CrossRef]
- Zhang, R.; Zhao, X.; Dong, X.; Dai, K.; Deng, J.; Zhuo, G.; Yu, B.; Wu, T.; Xiang, J. Potential Landslide Identification in Baihetan Reservoir Area Based on C-/L-Band Synthetic Aperture Radar Data and Applicability Analysis. Remote Sens. 2024, 16, 1591. [Google Scholar] [CrossRef]
- Wang, Y.; Dong, J.; Zhang, L.; Deng, S.; Zhang, G.; Liao, M.; Gong, J. Automatic detection and update of landslide inventory before and after impoundments at the Lianghekou reservoir using Sentinel-1 InSAR. Int. J. Appl. Earth Obs. Geoinf. 2023, 118, 103224. [Google Scholar] [CrossRef]
- Liu, X.; Zhao, C.; Zhang, Q.; Lu, Z.; Li, Z. Deformation of the Baige Landslide, Tibet, China, Revealed Through the Integration of Cross-Platform ALOS/PALSAR-1 and ALOS/PALSAR-2 SAR Observations. Geophys. Res. Lett. 2020, 47, e2019GL086142. [Google Scholar] [CrossRef]
- Dong, J.; Zhang, L.; Li, M.; Yu, Y.; Liao, M.; Gong, J.; Luo, H. Measuring precursory movements of the recent Xinmo landslide in Mao County, China with Sentinel-1 and ALOS-2 PALSAR-2 datasets. Landslides 2018, 15, 135–144. [Google Scholar] [CrossRef]
- Delgado, F.; Shreve, T.; Borgstrom, S.; León-Ibáñez, P.; Castillo, J.; Poland, M. A Global Assessment of SAOCOM-1 L-Band Stripmap Data for InSAR Characterization of Volcanic, Tectonic, Cryospheric, and Anthropogenic Deformation. IEEE Trans. Geosci. Remote Sens. 2024, 62, 1–21. [Google Scholar] [CrossRef]
- Yang, S.; Zhang, J.; Fu, L.; Chen, C.; Liu, Z.; Zhang, W. Adaptability Analysis of Sentinel−1A and ALOS/PALSAR−2 in Landslide Detection in the Qinling-Daba Mountains. Appl. Sci. 2023, 13, 12080. [Google Scholar] [CrossRef]
- Dai, K.; Feng, Y.; Zhuo, G.; Tie, Y.; Deng, J.; Balz, T.; Li, Z. Applicability Analysis of Potential Landslide Identification by InSAR in Alpine-Canyon Terrain—Case Study on Yalong River. IEEE J. Sel. Top. Appl. Earth Obs. Remote Sens. 2022, 15, 2110–2118. [Google Scholar] [CrossRef]
- Zhang, T.; Xie, S.; Huang, B.; Fan, J.; Chen, J.; Tong, L. Detection of active landslides in central Maoxian County using Sentinel-1 and ALOS-2 data. Remote Sens. Land Resour. 2021, 33, 213–219. [Google Scholar] [CrossRef]
- Jiao, Y.; Liu, K.; Yue, H.; Zhang, H.; Zhao, F. An Innovative Internal Calibration Strategy and Implementation for LT-1 Bistatic Spaceborne SAR. Remote Sens. 2024, 16, 2965. [Google Scholar] [CrossRef]
- Tang, X.; Tao, L.; Zhang, X.; Zhou, X.; Lu, J.; Zhang, X. In-orbit application parameters test and analysis of L-band differential interferometric SAR satellite constellation. Acta Geod. Cartogr. Sin. 2024, 53, 1863–1872. [Google Scholar] [CrossRef]
- Gao, Y.; Zheng, N.; Zhang, Y.; Li, S.; Yang, H.; Bian, H.; Zhang, Q.; Zhang, S.; Tian, Y. A phase unwrapping method based on phase quality fusion estimation and information filtering. Acta Geod. Cartogr. Sin. 2024, 53, 1910–1919. [Google Scholar] [CrossRef]
- Li, H.; Li, B.; Li, Y.; Duan, H. The Stability Analysis of Mt. Gongga Glaciers Affected by the 2022 Luding MS 6.8 Earthquake Based on LuTan-1 and Sentinel-1 Data. Remote Sens. 2023, 15, 3882. [Google Scholar] [CrossRef]
- Liu, B.; Zhang, L.; Ge, D.; Li, M.; Zhou, X.; Guo, Z.; Shi, P.; Zhang, L.; Jin, D.; Wan, X.; et al. Application of InSAR Monitoring Large Deformation of Landslides Using Lutan-1 Constellation. Geomat. Inf. Sci. Wuhan Univ. 2024, 49, 1753–1762. [Google Scholar] [CrossRef]
- Yang, J.; Wang, J.; Guo, J.; Xie, H.; Feng, H. Analysis of geological hazard potential detection in Guizhou mountainous area based on L-SAR data. Sci. Surv. Mapp. 2024, 49, 174–182. [Google Scholar] [CrossRef]
- Han, J.; Yang, S.; Yang, T.; Zhu, N.; Ma, Y.; Zhang, W. Identification of potential landslide hazards in the Ankang area using L-band differential interferometric SAR satellite. Remote Sens. Nat. Resour. 2024, 36, 254–259. [Google Scholar] [CrossRef]
- Xiong, J.; Chen, T.; Yang, G.; Wang, R.; Li, M.; Zhao, L.; Chen, C. Discussion on the effectiveness of landslide hazard identification and factors affecting the effectiveness of LT-1 satellite based on InSAR technology. Geocarto Int. 2025, 40, 2461539. [Google Scholar] [CrossRef]
- Wang, Z.; Li, T.; Tang, W.; Yang, B.; Yuan, Y.; Wen, X.; Lu, J.; Li, Y. Identification Capability Analysis of Landslide Hazards for LT-1 and Sentinel-1 Using Time Series SAR Interferometry: A Case Study of Maoxian, Sichuan. In Proceedings of the 2023 SAR in Big Data Era (BIGSARDATA), Beijing, China, 20–22 September 2023; pp. 1–4. [Google Scholar]
- Xu, Q.; Dai, L.; Peng, Z.; Zhang, J.; Xiao, K.; Gong, H.; Wu, H. Characteristics and health risk evaluation of soil heavy metals in Longshan County. Geol. China 2024. [Google Scholar] [CrossRef]
- Xiao, K.; Xu, H.; Li, Y.; Guo, W.; Dai, L.; Peng, Z.; Gong, H.; Xu, Q. Characteristics and influencing factors of soil se content in cultivated land in Longshan County, Hunan Province. Environ. Chem. 2024, 43, 464–474. [Google Scholar]
- Cai, Y.; Li, J.; Wang, Y.; Yang, Q.; Zhang, Y.; Chen, Y.; Lu, P.; Wang, R. Detecting and Removing Phase Jitters for the Phase Synchronization of LT-1 Bistatic SAR. IEEE Geosci. Remote Sens. Lett. 2023, 20, 1–5. [Google Scholar] [CrossRef]
- Li, T.; Tang, X.; Li, S.; Zhou, X.; Zhang, X.; Xu, Y. Classification of basic deformation products of L-band differential interfero-metric SAR satellite. Acta Geod. Cartogr. Sin. 2023, 52, 769–779. [Google Scholar] [CrossRef]
- Li, Y.; Li, Q.; Jiao, Q.; Jiang, W.; Li, B.; Zhang, J.; Luo, Y. Application of Lutan -1 SAR Satellite Constellation to Earthquake Industry and Its Prospect. Geomat. Inf. Sci. Wuhan Univ. 2024, 49, 1741–1752. [Google Scholar] [CrossRef]
- Wang, L.; Marzahn, P.; Bernier, M.; Ludwig, R. Sentinel-1 InSAR measurements of deformation over discontinuous permafrost terrain, Northern Quebec, Canada. Remote Sens. Environ. 2020, 248, 111965. [Google Scholar] [CrossRef]
- Sha, P.; He, X.; Wang, X.; Gao, Z. Large-Scale Crustal Deformation of the Tianshan Mountains, Xinjiang, from Sentinel-1 InSAR Observations (2015–2020). Remote Sens. 2023, 15, 4901. [Google Scholar] [CrossRef]
- Zhao, F.; Zhang, L.; Wang, T.; Wang, Y.; Yan, S.; Fan, H. Polarimetric Persistent Scatterer Interferometry for Urban Ground Deformation Monitoring with Sentinel-1 Dual Polarimetric Data. Geomat. Inf. Sci. Wuhan Univ. 2022, 47, 1507–1514. [Google Scholar] [CrossRef]
- Jiang, H.; Feng, G.; Wang, Y.; Xiong, Z.; Chen, H.; Li, N.; Lin, Z. Land Subsidence in the Yangtze River Delta, China Explored Using InSAR Technique From 2019 to 2021. IEEE J. Sel. Top. Appl. Earth Obs. Remote Sens. 2025, 18, 4174–4187. [Google Scholar] [CrossRef]
- Wang, W.; Yang, D.; Li, L.; Li, W.; Feng, G.; He, L.; Xiong, Z.; Li, N.; Jiang, H.; Luo, W.; et al. Image Initial Registration Algorithm for Lutan-1 Satellite Based on Scale-Invariant Feature Transform-Like Algorithm—A Case Study of the Jishishan Earthquake. Geomat. Inf. Sci. Wuhan Univ. 2024, 50, 377–390. [Google Scholar] [CrossRef]
- Zhao, Y.; Feng, G.; Wang, Y.; Wang, X.; Wang, Y.; Lu, H.; Xu, W.; Wang, H. A new algorithm for intelligent detection of geohazards incorporating attention mechanism. Int. J. Appl. Earth Obs. Geoinf. 2022, 113, 102988. [Google Scholar] [CrossRef]
- Li, N.; Feng, G.; Zhao, Y.; Xiong, Z.; He, L.; Wang, X.; Wang, W.; An, Q. A Deep-Learning-Based Algorithm for Landslide Detection over Wide Areas Using InSAR Images Considering Topographic Features. Sensors 2024, 24, 4583. [Google Scholar] [CrossRef] [PubMed]
- Xiong, Z.; Zhang, M.; Ma, J.; Xing, G.; Feng, G.; An, Q. InSAR-based landslide detection method with the assistance of C-index. Landslides 2023, 20, 2709–2723. [Google Scholar] [CrossRef]
- Cai, J.; Zhang, L.; Dong, J.; Guo, J.; Wang, Y.; Liao, M. Automatic identification of active landslides over wide areas from time-series InSAR measurements using Faster RCNN. Int. J. Appl. Earth Obs. Geoinf. 2023, 124, 103516. [Google Scholar] [CrossRef]
- Dong, J.; Lai, S.; Wang, N.; Wang, Y.; Zhang, L.; Liao, M. Multi-scale deformation monitoring with Sentinel-1 InSAR analyses along the Middle Route of the South-North Water Diversion Project in China. Int. J. Appl. Earth Obs. Geoinf. 2021, 100, 102324. [Google Scholar] [CrossRef]
- Mu, M.; Li, Z.; Xu, B.; He, X.; Han, K.; Du, X.; Han, Q.; Wang, A. LT-1A/B Satellite SAR Geometric Calibration and Absolute Location Error Analysis. IEEE J. Sel. Top. Appl. Earth Obs. Remote Sens. 2024, 17, 16497–16510. [Google Scholar] [CrossRef]
- Li, Z.; Zhu, W.; Yu, C.; Zhang, Q.; Zhang, C.; Liu, Z.; Zhang, X.; Chen, B.; Du, J.; Song, C.; et al. Interferometric synthetic aperture radar for deformation mapping: Opportunities, challenges and the outlook. Acta Geod. Cartogr. Sin. 2022, 51, 1485–1519. [Google Scholar] [CrossRef]
- Deng, Y.; Wang, Y.; Liu, K.; Ou, N.; Liu, D.; Zhang, H.; Wang, J. Key technologies for spaceborne SAR payload of LuTan-1 satellite system. Acta Geod. Cartogr. Sin. 2024, 53, 1881–1895. [Google Scholar] [CrossRef]
- Wang, R.; Liu, K.; Liu, D.; Ou, N.; Yue, H.; Chen, Y.; Yu, W.; Liang, D.; Cai, Y. LuTan-1: An innovative L-band spaceborne bistatic interferometric synthetic aperture radar mission. IEEE Geosci. Remote Sens. Mag. 2024, 2, 22. [Google Scholar] [CrossRef]
- Chen, H.; He, Y.; Zhang, L.; Yang, W.; Liu, Y.; Gao, B.; Zhang, Q.; Lu, J. A Multi-Input Channel U-Net Landslide Detection Method Fusing SAR Multisource Remote Sensing Data. IEEE J. Sel. Top. Appl. Earth Obs. Remote Sens. 2024, 17, 1215–1232. [Google Scholar] [CrossRef]
- Wessel, P.; Luis, J.F.; Uieda, L.; Scharroo, R.; Wobbe, F.; Smith, W.H.F.; Tian, D. The Generic Mapping Tools Version 6. Geochem. Geophys. Geosyst. 2019, 20, 5556–5564. [Google Scholar] [CrossRef]

Disclaimer/Publisher’s Note: The statements, opinions and data contained in all publications are solely those of the individual author(s) and contributor(s) and not of MDPI and/or the editor(s). MDPI and/or the editor(s) disclaim responsibility for any injury to people or property resulting from any ideas, methods, instructions or products referred to in the content. |
© 2025 by the authors. Licensee MDPI, Basel, Switzerland. This article is an open access article distributed under the terms and conditions of the Creative Commons Attribution (CC BY) license (https://creativecommons.org/licenses/by/4.0/).