


Extraction Method for Factory Aquaculture Based on Multiscale Residual Attention Network


Abstract
1. Introduction
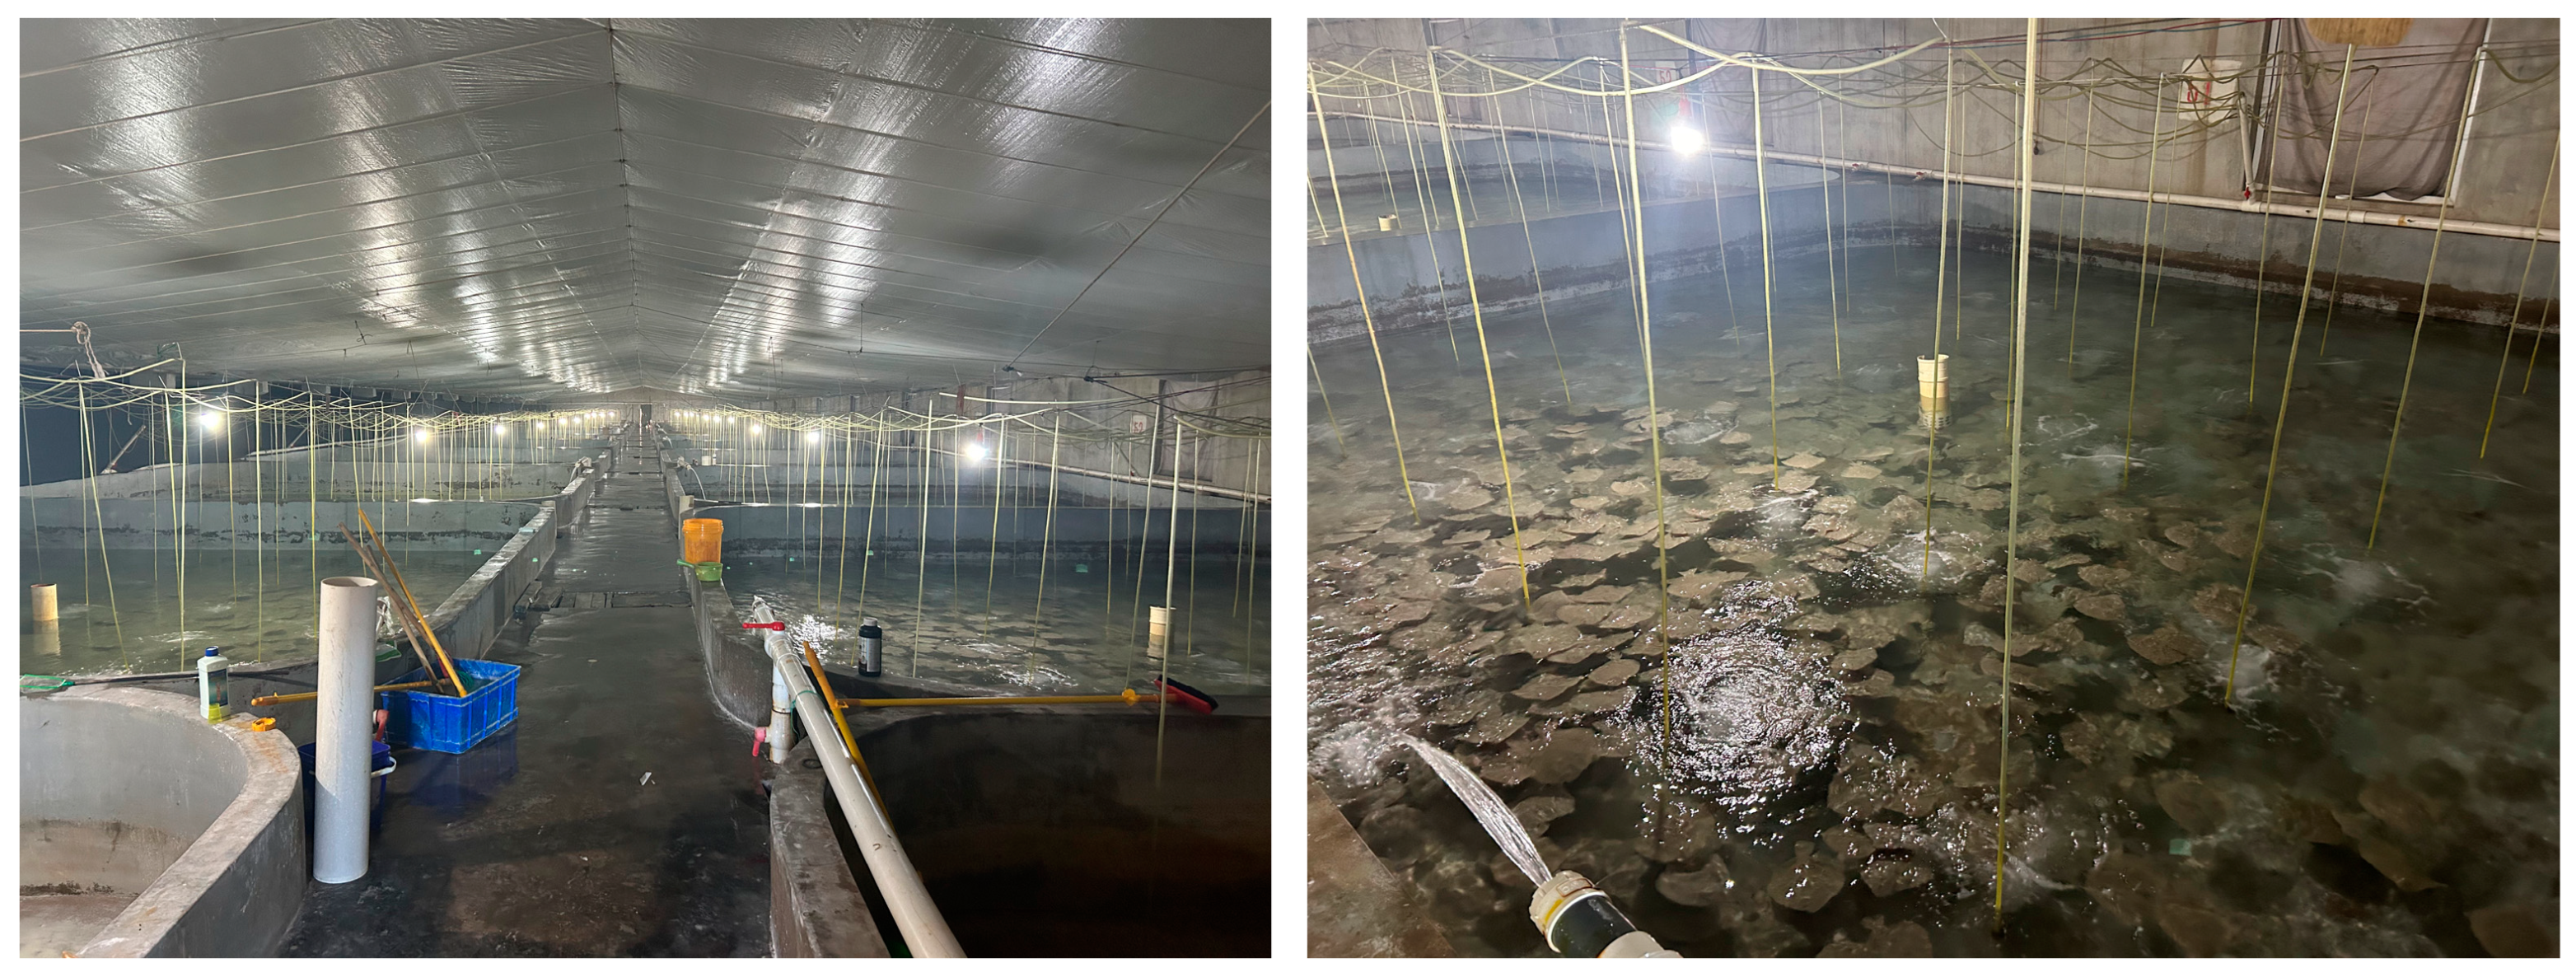
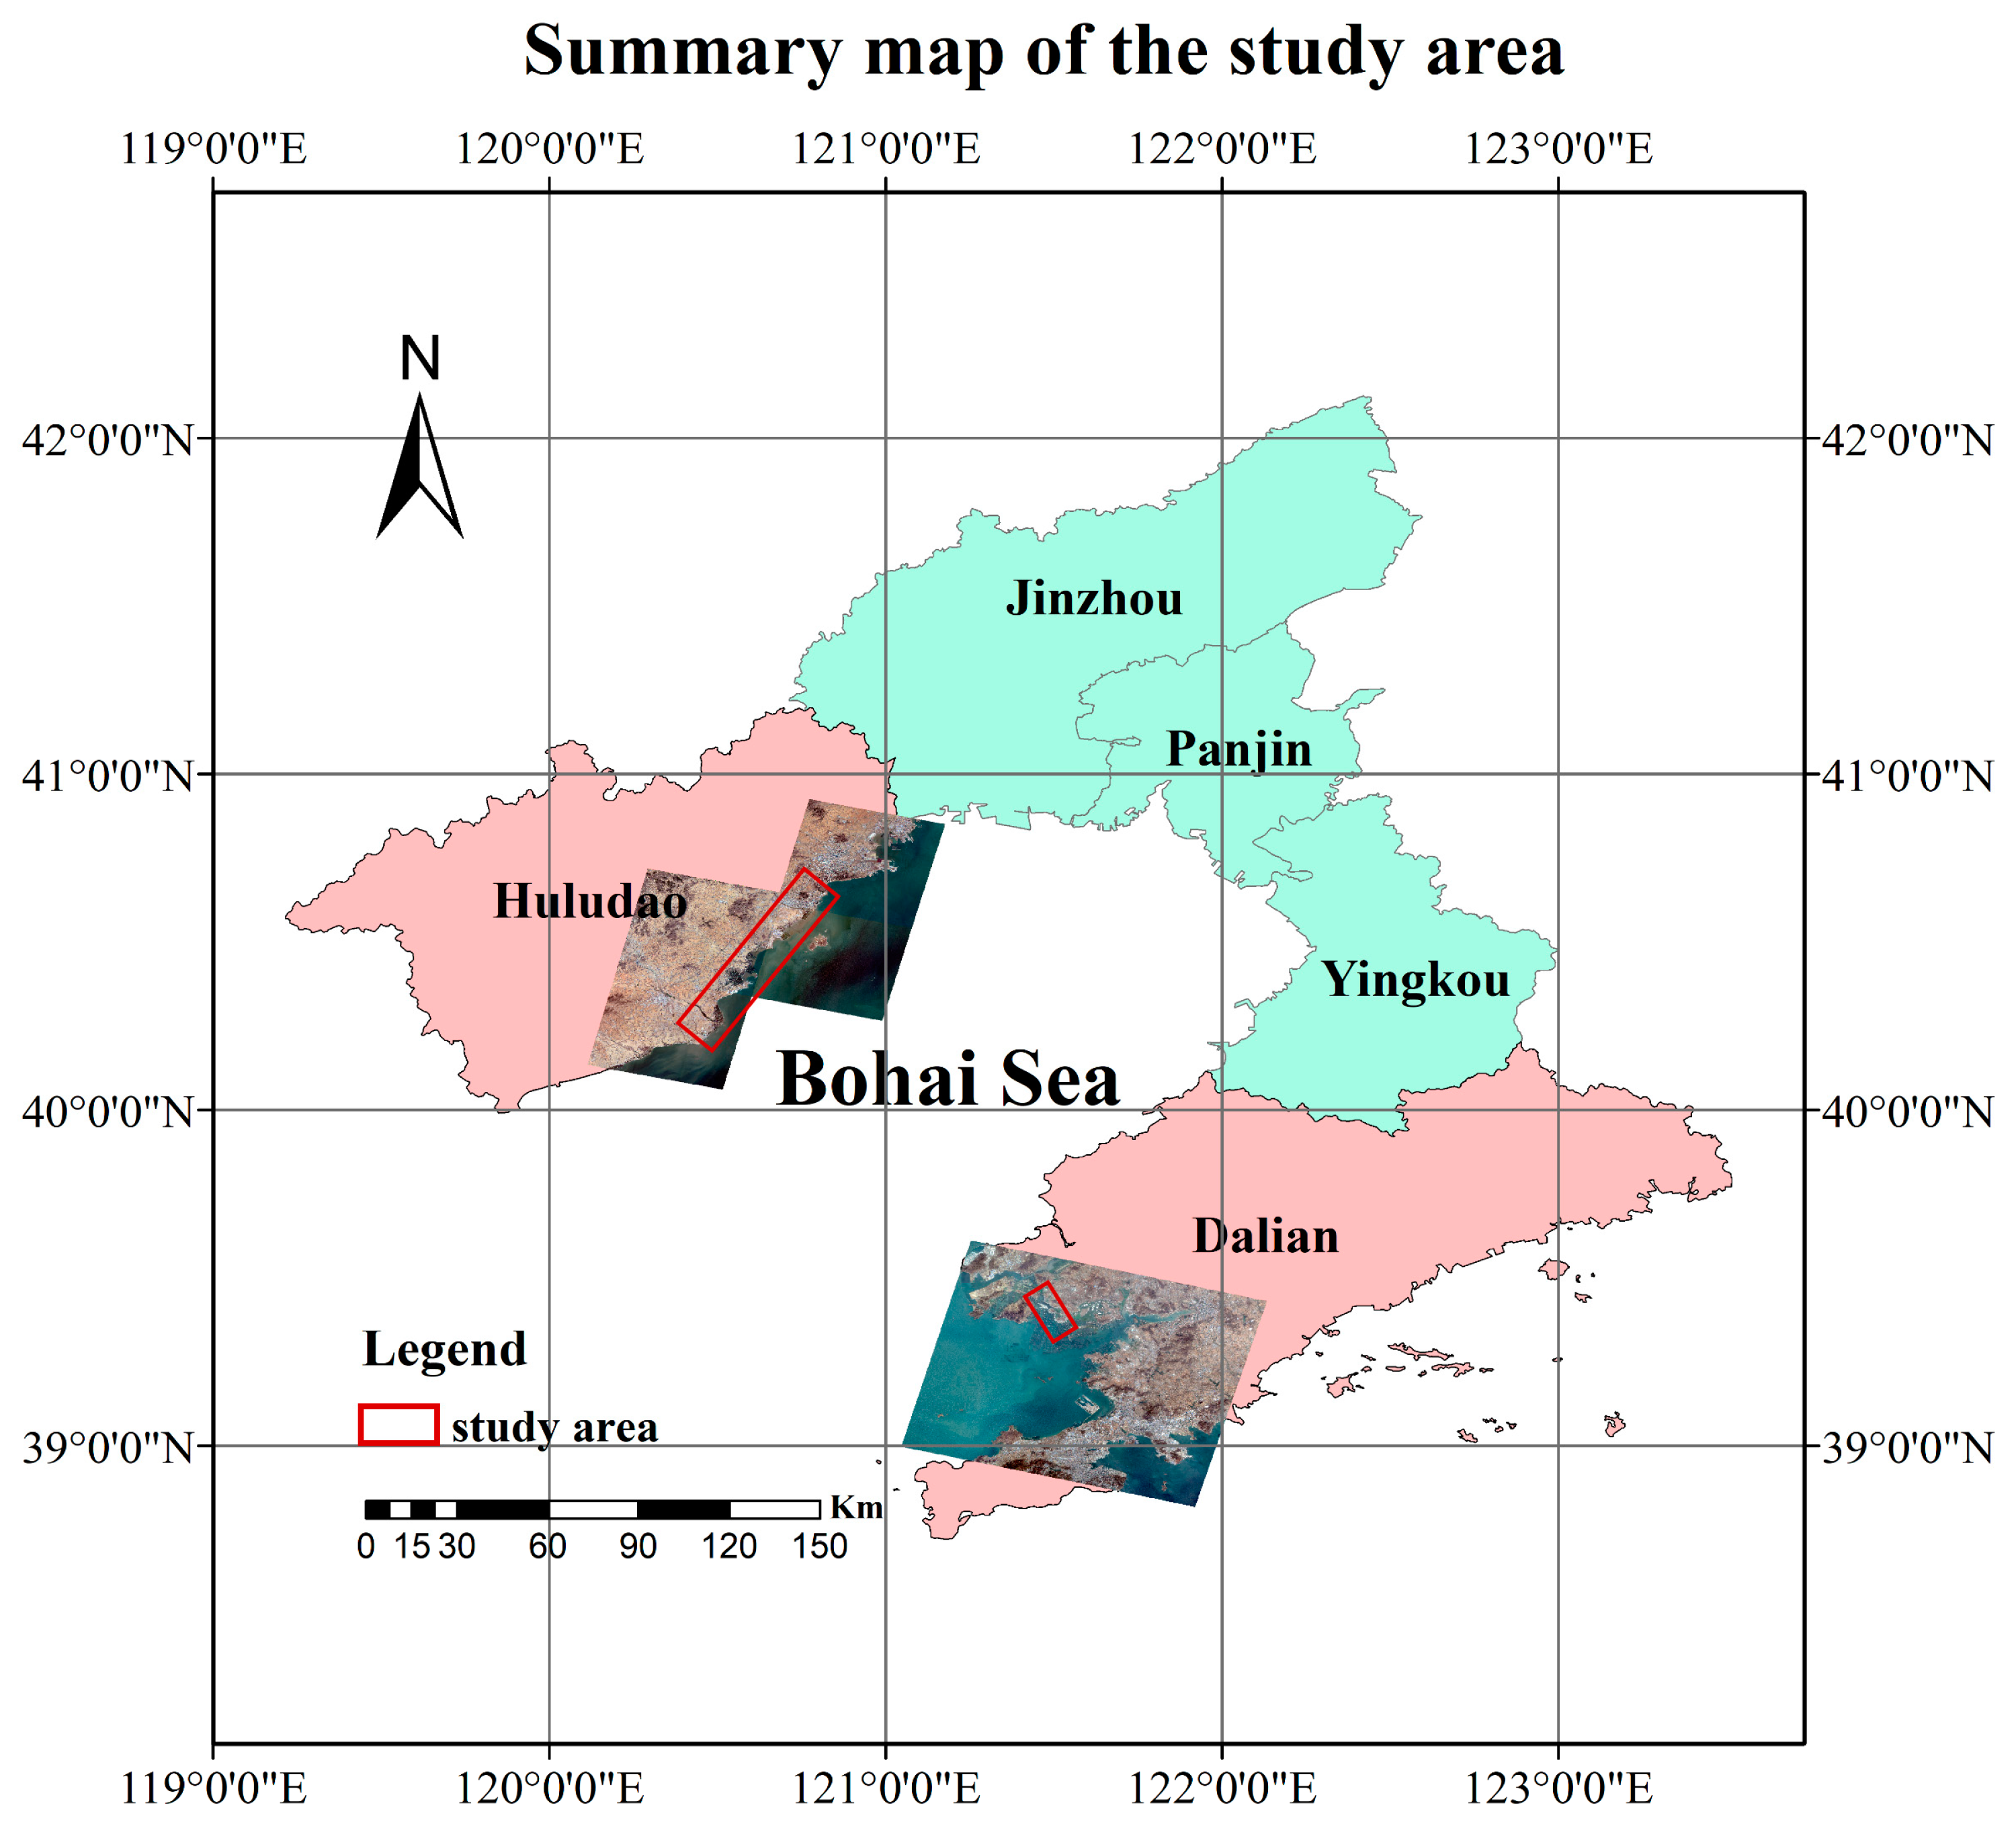
2. Materials
3. Research Method
3.1. Technical Process
3.2. Overall Network Structure
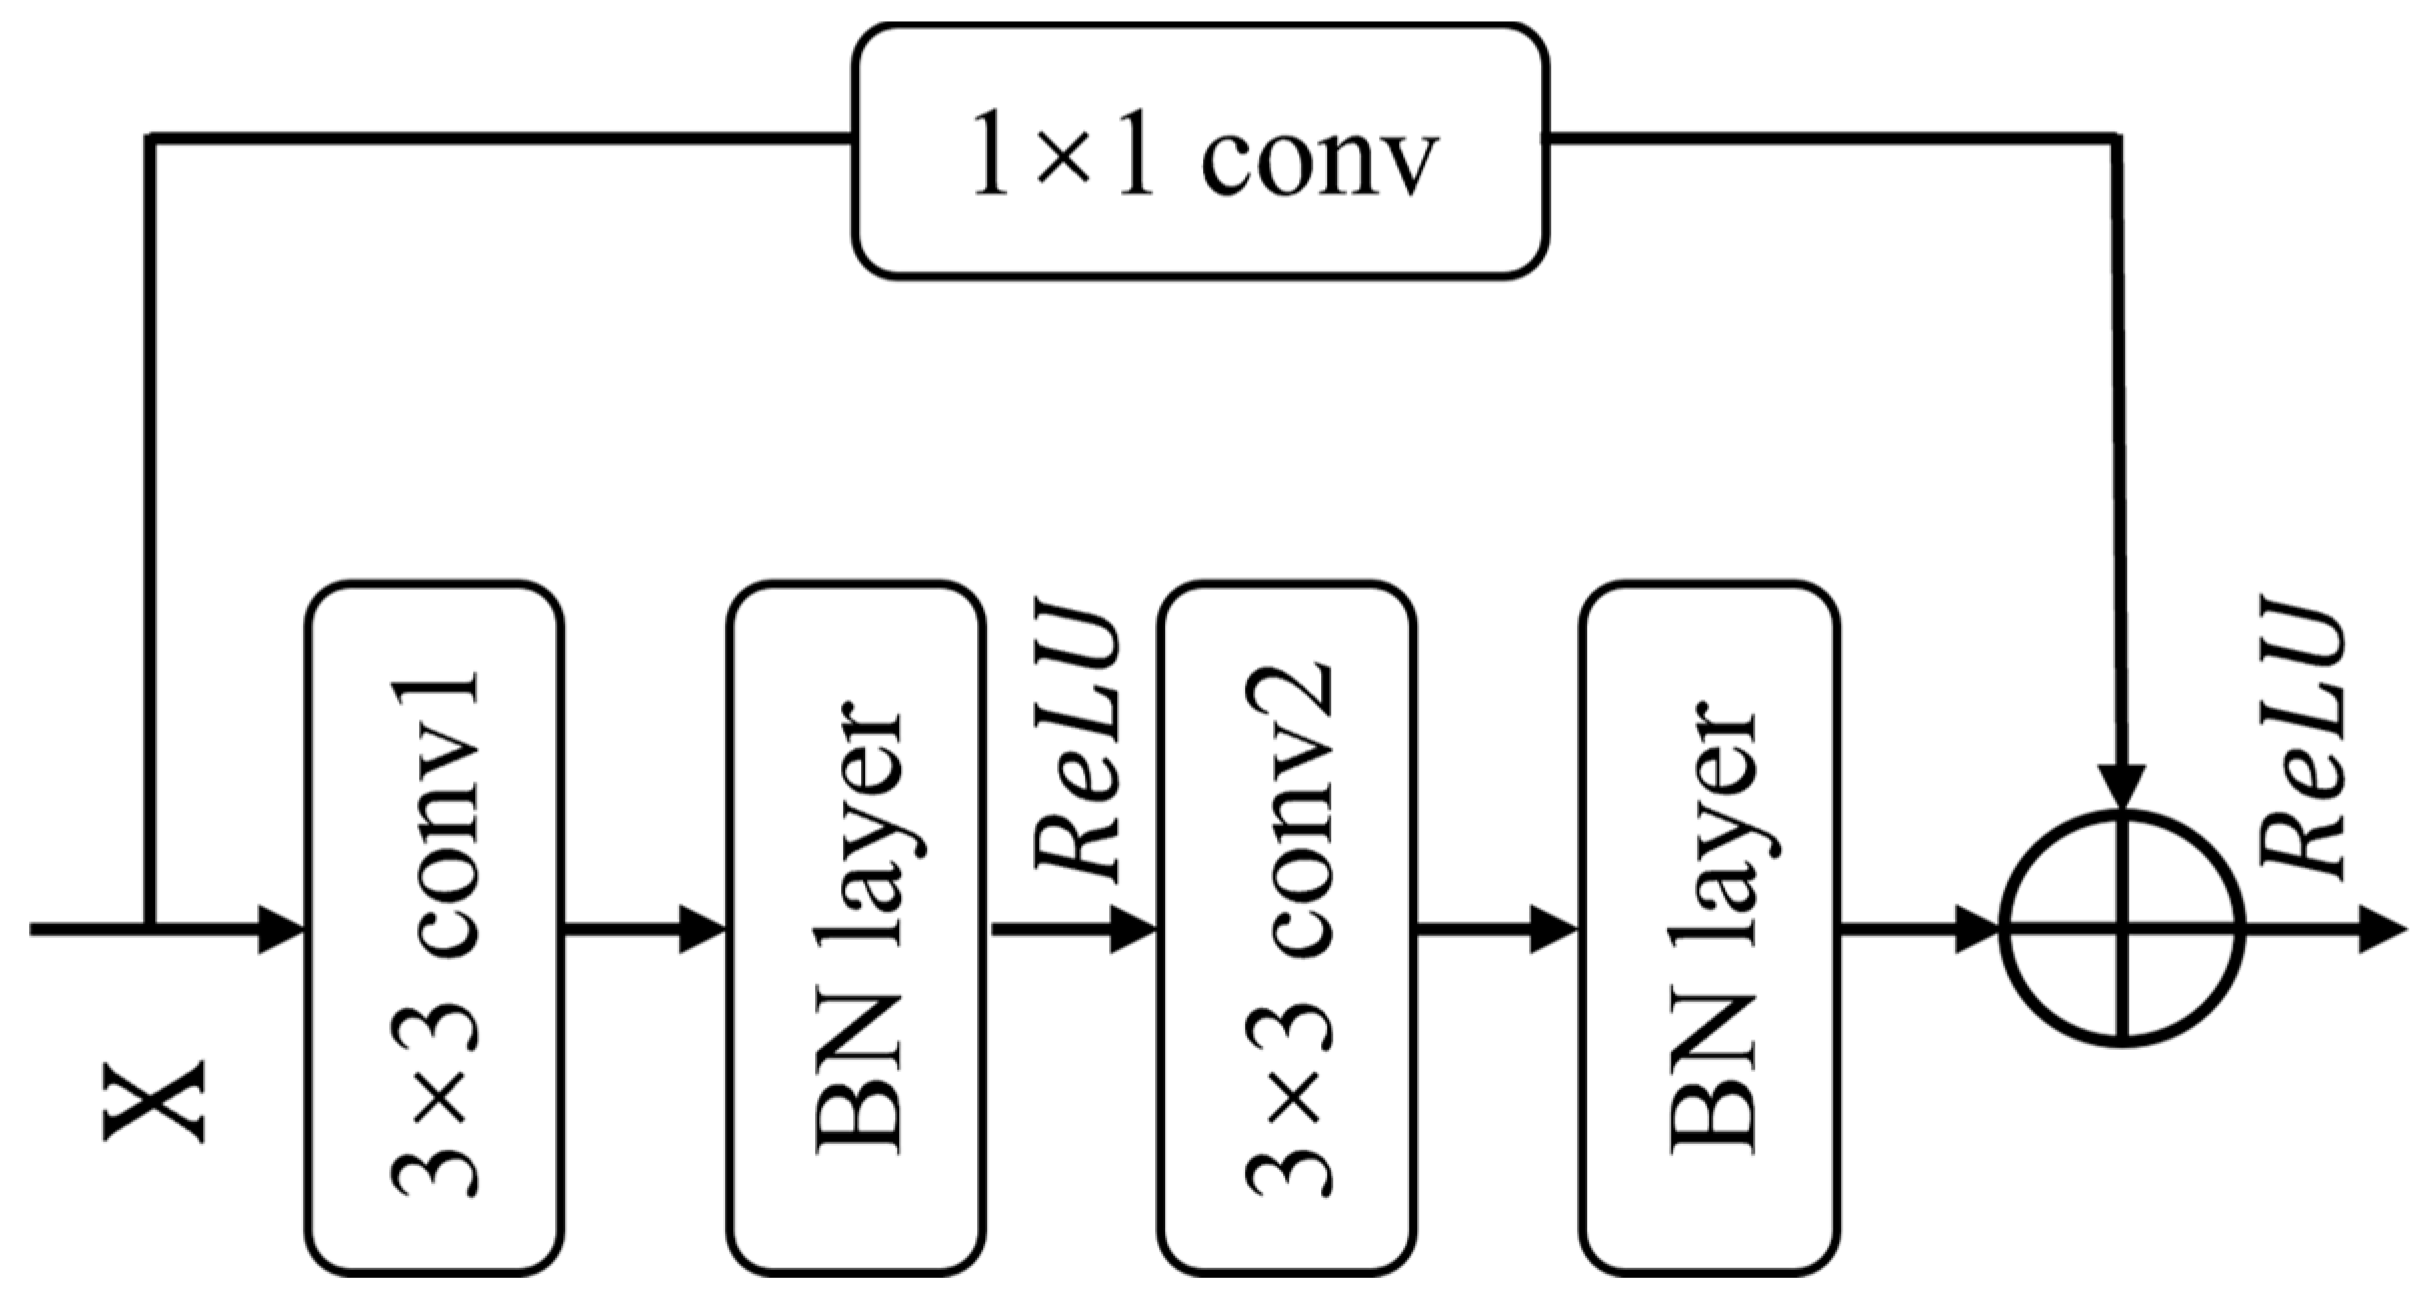
3.3. Residual Structure
3.4. Attention Module
3.5. Multiscale Connection
4. Experiment and Analysis
4.1. Experimental Environment
4.2. Evaluation Metrics
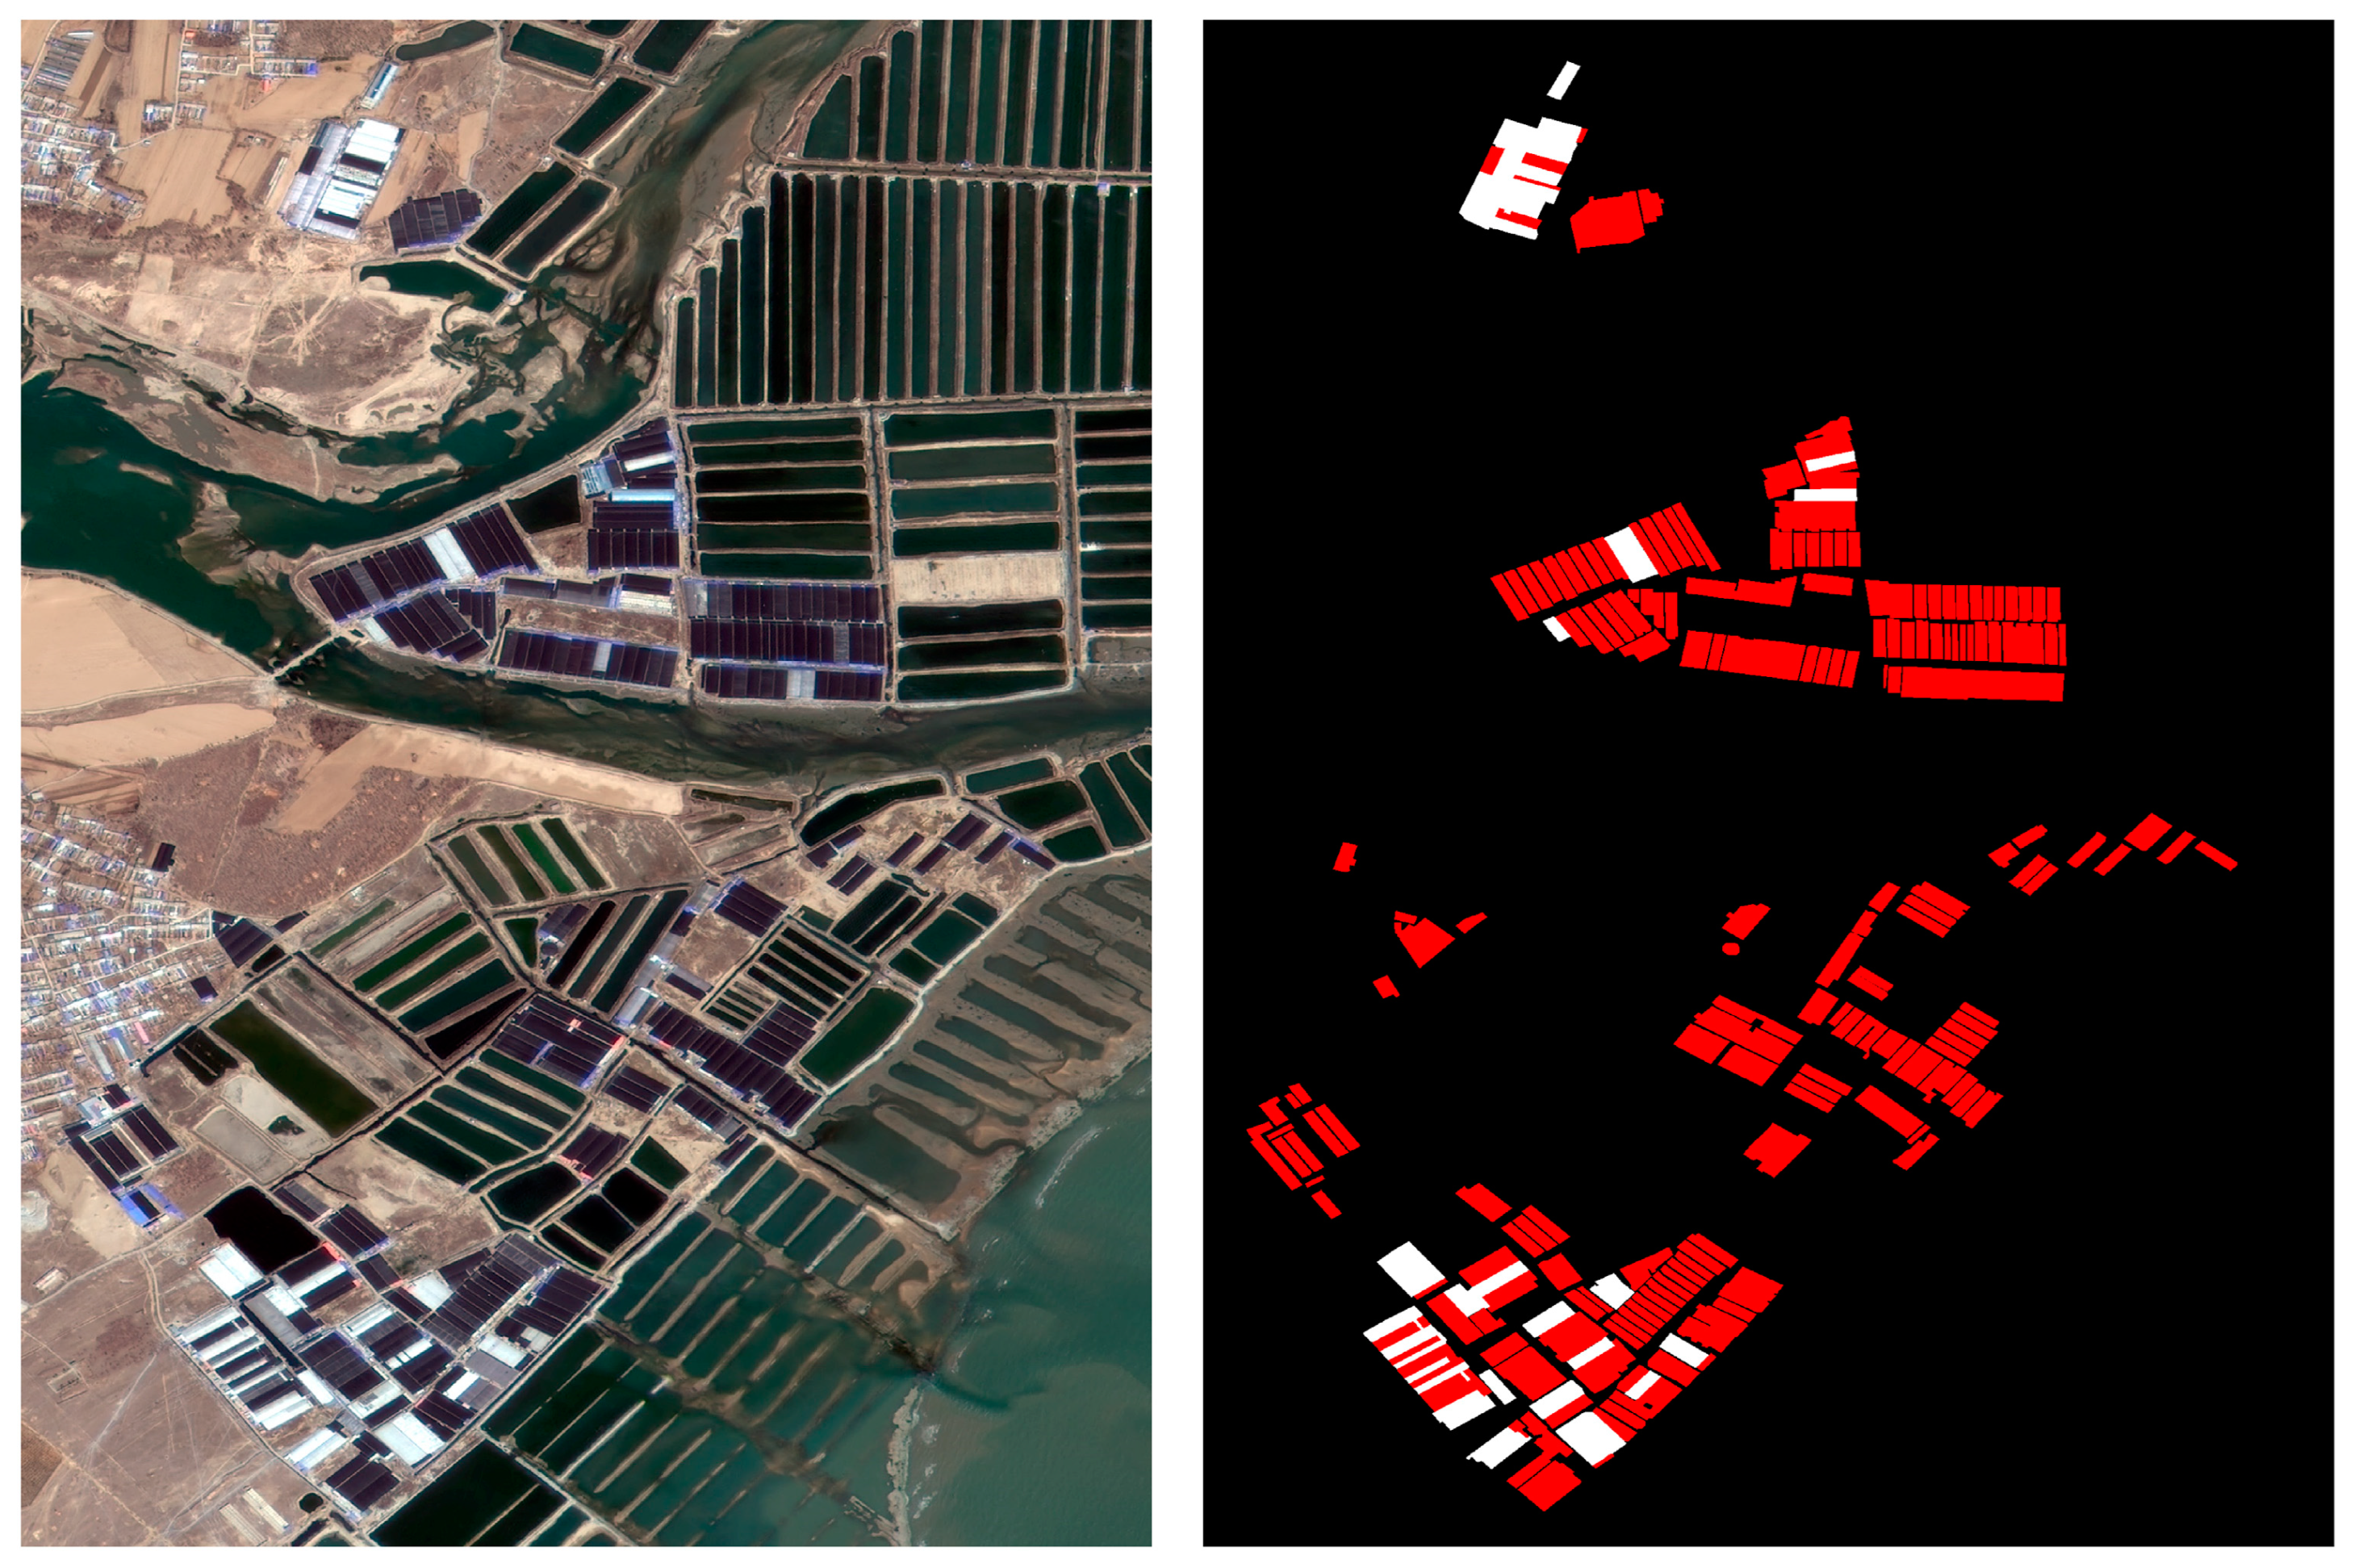
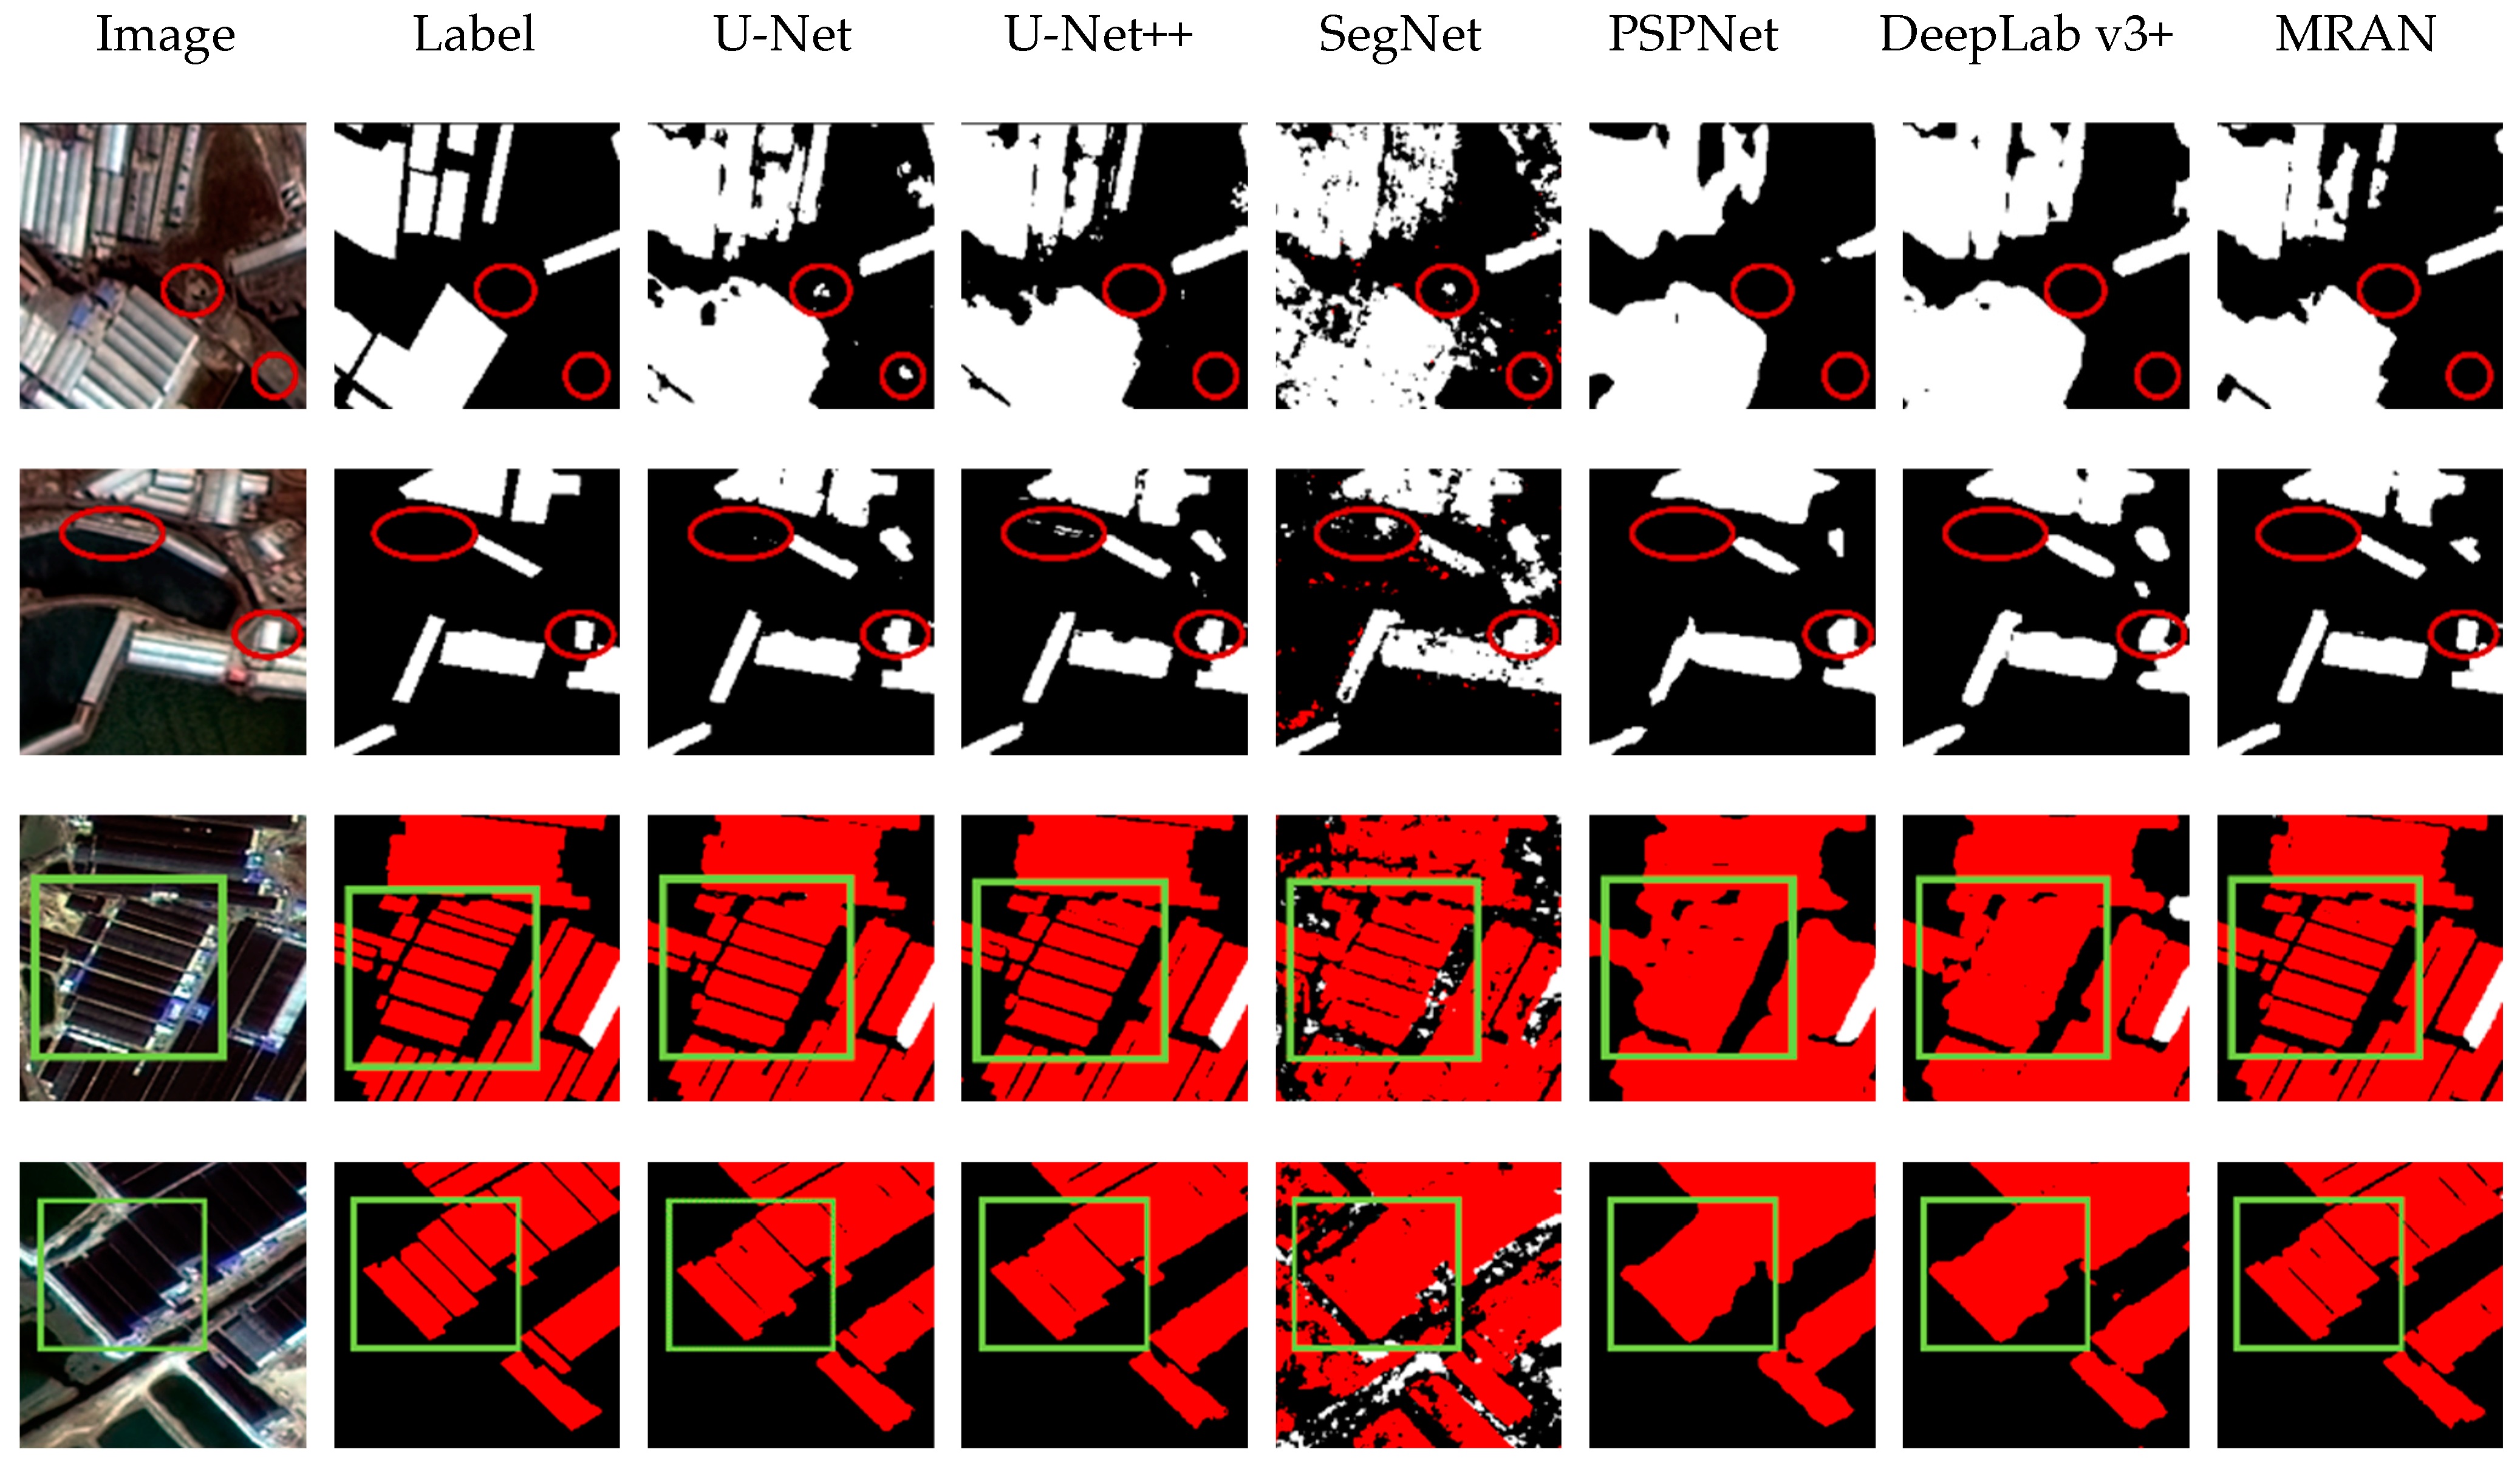
4.3. Results and Analysis
4.4. Ablation Experiment
5. Conclusion and Discussion
Author Contributions
Funding
Data Availability Statement
Conflicts of Interest
Abbreviations
| CBAM | Convolutional block attention module |
| MPA | Mean pixel accuracy |
| MRAN | Multiscale residual attention network |
| PA | Pixel accuracy |
References
- Luo, Q.; Li, J.; Chang, Z.Q.; Chen, Z.; Qiao, L.; Yang, L.G. Changes in zooplankton community structure in industrial shrimp farming ponds. Prog. Fish. Sci. 2020, 41, 131–139. [Google Scholar]
- Qiu, R.S.; Han, L.M.; Yin, W. Green development evaluation and time-space evolution characteristics of mariculture industry in China. Sci. Geogr. Sin. 2023, 43, 1793–1802. [Google Scholar]
- Ahmed, N.; Thompson, S.; Glaser, M. Global Aquaculture Productivity, Environmental Sustainability, and Climate Change Adaptability. Environ. Manag. 2019, 63, 159–172. [Google Scholar] [CrossRef] [PubMed]
- Zhang, C.; Meng, Q.H.; Chu, J.L.; Liu, G.Z.; Wang, C.J.; Zhao, Y.Y.; Zhao, J.H. Analysis on the status of mariculture in China and the effectiveness of mariculture management in the Bohai Sea. Mar. Environ. Sci. 2021, 40, 887–897. [Google Scholar]
- Zhang, X.C.; Huang, J.F.; Ning, T. Progress and Prospect of Cultivated Land Extraction from High-Resolution Remote Sensing Images. Geomat. Inf. Sci. Wuhan Univ. 2023, 48, 1582–1590. [Google Scholar]
- Ren, C.Y.; Wang, Z.M.; Zhang, Y.Z.; Zhang, B.; Chen, L.; Xi, Y.B.; Xiao, X.M.; Doughty, R.B.; Liu, M.Y.; Jia, M.M.; et al. Rapid expansion of coastal aquaculture ponds in China from Landsat observations during 1984–2016. Int. J. Appl. Earth Obs. Geoinf. 2019, 82, 101902. [Google Scholar] [CrossRef]
- Wang, M.; Mao, D.H.; Xiao, X.M.; Song, K.S.; Jia, M.M.; Ren, C.Y.; Wang, Z.M. Interannual changes of coastal aquaculture ponds in China at 10-m spatial resolution during 2016–2021. Remote Sens. Environ. 2023, 284, 113347. [Google Scholar] [CrossRef]
- Lacaux, J.P.; Tourre, Y.M.; Vignolles, C.; Ndione, J.A.; Lafaye, M. Classification of ponds from high-spatial resolution remote sensing: Application to Rift Valley Fever epidemics in Senegal. Remote Sens. Environ. 2007, 106, 66–74. [Google Scholar] [CrossRef]
- Rahman, A.F.; Dragoni, D.; Didan, K.; Barreto-Munoz, A.; Hutabarat, J.A. Detecting large scale conversion of mangroves to aquaculture with change point and mixed-pixel analyses of high-fidelity MODIS data. Remote Sens. Environ. 2013, 130, 96–107. [Google Scholar] [CrossRef]
- Cui, B.G.; Fei, D.; Shao, G.H.; Lu, Y.; Chu, J.L. Extracting Raft Aquaculture Areas from Remote Sensing Images via an Improved U-Net with a PSE Structure. Remote Sens. 2019, 11, 2053. [Google Scholar] [CrossRef]
- Wen, K.; Yao, H.M.; Huang, Y.; Chen, H.Q.; Liao, P.R. Remote sensing image extraction for coastal aquaculture ponds in the Guangxi Beibu Gulf based on Google Earth Engine. Trans. Chin. Soc. Agric. Eng. 2021, 37, 280–288. [Google Scholar]
- Chu, J.L.; Shao, G.H.; Zhao, J.H.; Gao, N.; Wang, F.; Cui, B.G. Information extraction of floating raft aquaculture based on GF-1. Sci. Surv. Mapp. 2020, 45, 92–98. [Google Scholar]
- Shi, T.Y.; Zou, Z.X.; Shi, Z.W.; Chu, J.L.; Zhao, J.H.; Gao, N.; Zhang, N.; Zhu, X.Z. Mudflat aquaculture labeling for infrared remote sensing images via a scanning convolutional network. Infrared Phys. Technol. 2018, 94, 16–22. [Google Scholar] [CrossRef]
- Long, L.H.; Zhu, Y.T.; Yan, J.W.; Liu, J.J.; Wang, Z.Y. New building extraction method based on semantic segmentation. Natl. Remote Sens. Bull. 2023, 27, 2593–2602. [Google Scholar] [CrossRef]
- He, Z.M.; Ding, H.Y.; An, B.Q. E-Unet: A atrous convolution-based neural network for building extraction from high-resolution remote sensing images. Acta Geod. Cartogr. Sin. 2022, 51, 457–467. [Google Scholar]
- Ronneberger, O.; Fischer, P.; Brox, T. U-Net: Convolutional Networks for Biomedical Image Segmentation. In Proceedings of the International Conference on Medical image Computing and Computing-Assisted Intervention, Munich, Germany, 5–9 October 2015; Spring: Berlin/Heidelberg, Germany, 2015; pp. 234–241. [Google Scholar]
- He, K.M.; Zhang, X.Y.; Ren, S.Q.; Sun, J. Deep Residual Learning for Image Recognition. In Proceedings of the IEEE Conference on Computer Vision and Pattern Recognition (CVPR), Las Vegas, NV, USA, 27–30 June 2016; pp. 770–778. [Google Scholar]
- Woo, S.; Park, J.; Lee, J.Y.; Kweon, I.S. CBAM: Convolutional Block Attention Module. In Proceedings of the European Conference on Computer Vision (ECCV), Munich, Germany, 8–14 September 2018; pp. 3–19. [Google Scholar]
- Dosovitskiy, A.; Beyer, L.; Kolesnikov, A.; Weissenborn, D.; Zhai, X.H.; Unterthiner, T.; Dehghani, M.; Minderer, M.; Heigold, G.; Gelly, S.; et al. An Image is Worth 16 × 16 Words: Transformers for Image Recognition at Scale. In Proceedings of the International Conference on Learning Representations (ICLR), Virtual Enent, 3–7 May 2021. [Google Scholar]
- Ma, C.F.; Xu, Q.S.; Wang, X.F.; Jin, B.; Zhang, X.Y.; Wang, Y.F.; Zhang, Y. Boundary-Aware Supervoxel-Level Iteratively Refined Interactive 3D Image Segmentation with Multi-Agent Reinforcement Learning. IEEE Trans. Med. Imaging 2021, 40, 2563–2574. [Google Scholar] [CrossRef] [PubMed]
- Wang, L.F.; Wang, S.S.; Qi, J.; Suzuki, K. A Multi-Task Mean Teacher for Semi-Supervised Facial Affective Behavior Analysis. In Proceedings of the IEEE International Conference on Computer Vision Workshops (ICCVW), Montreal, BC, Canada, 11–17 October 2021; pp. 3596–3601. [Google Scholar]


| Metric | U-Net | U-Net++ | SegNet | PSPNet | DeepLab v3+ | MRAN |
|---|---|---|---|---|---|---|
| PA (%) | 97.39 | 97.68 | 80.00 | 95.88 | 95.26 | 98.31 |
| MPA (%) | 97.10 | 97.14 | 85.42 | 94.58 | 95.88 | 97.85 |
| mIoU (%) | 88.69 | 89.84 | 54.04 | 84.00 | 82.14 | 92.46 |
| Metric | Background | Factory Aquaculture 1 | Factory Aquaculture 2 |
|---|---|---|---|
| P (%) | 99.62 | 94.66 | 88.63 |
| R (%) | 98.38 | 98.81 | 96.37 |
| F1-score (%) | 98.99 | 96.69 | 92.34 |
| Model | Training Duration (min) | Parameter Quantity |
|---|---|---|
| U-Net | 10 | |
| U-Net++ | 28 | |
| SegNet | 15 | |
| PSPNet | 25 | |
| DeepLab v3+ | 43 | |
| MRAN | 17 |
| PA (%) | MPA (%) | mIoU (%) | U-Net | CBAM | Residual | Multi |
|---|---|---|---|---|---|---|
| 97.39 | 97.10 | 88.69 | √ | |||
| 97.89 | 97.36 | 90.80 | √ | √ | ||
| 98.06 | 97.79 | 91.50 | √ | √ | √ | |
| 98.26 | 97.50 | 92.25 | √ | √ | ||
| 98.27 | 97.83 | 92.34 | √ | √ | √ | |
| 98.31 | 97.85 | 92.46 | √ | √ | √ | √ |
Disclaimer/Publisher’s Note: The statements, opinions and data contained in all publications are solely those of the individual author(s) and contributor(s) and not of MDPI and/or the editor(s). MDPI and/or the editor(s) disclaim responsibility for any injury to people or property resulting from any ideas, methods, instructions or products referred to in the content. |
© 2025 by the authors. Licensee MDPI, Basel, Switzerland. This article is an open access article distributed under the terms and conditions of the Creative Commons Attribution (CC BY) license (https://creativecommons.org/licenses/by/4.0/).
Share and Cite
Zhang, H.; Chu, J.; Liu, G.; Chen, Y.; He, K. Extraction Method for Factory Aquaculture Based on Multiscale Residual Attention Network. Remote Sens. 2025, 17, 1093. https://doi.org/10.3390/rs17061093
Zhang H, Chu J, Liu G, Chen Y, He K. Extraction Method for Factory Aquaculture Based on Multiscale Residual Attention Network. Remote Sensing. 2025; 17(6):1093. https://doi.org/10.3390/rs17061093
Chicago/Turabian StyleZhang, Haiwei, Jialan Chu, Guize Liu, Yanlong Chen, and Kaifei He. 2025. "Extraction Method for Factory Aquaculture Based on Multiscale Residual Attention Network" Remote Sensing 17, no. 6: 1093. https://doi.org/10.3390/rs17061093
APA StyleZhang, H., Chu, J., Liu, G., Chen, Y., & He, K. (2025). Extraction Method for Factory Aquaculture Based on Multiscale Residual Attention Network. Remote Sensing, 17(6), 1093. https://doi.org/10.3390/rs17061093