1. Introduction
Coal is in high demand as an energy source [
1] due to industrialization and urbanization. The vast and remote nature of mining sites presents monitoring challenges. Coal mining has both positive and negative impacts on the environment and communities. On the positive side, coal mining provides employment opportunities and contributes to local and national economies [
2,
3]. It is a valuable source of energy that supports industrialization and urbanization, meeting the growing demand for power generation and heating [
3,
4,
5]. Additionally, coal mining can also lead to the development of infrastructure and support the growth of related industries. To better understand the impact of coal mining, it is essential to first outline the key mining processes involved.
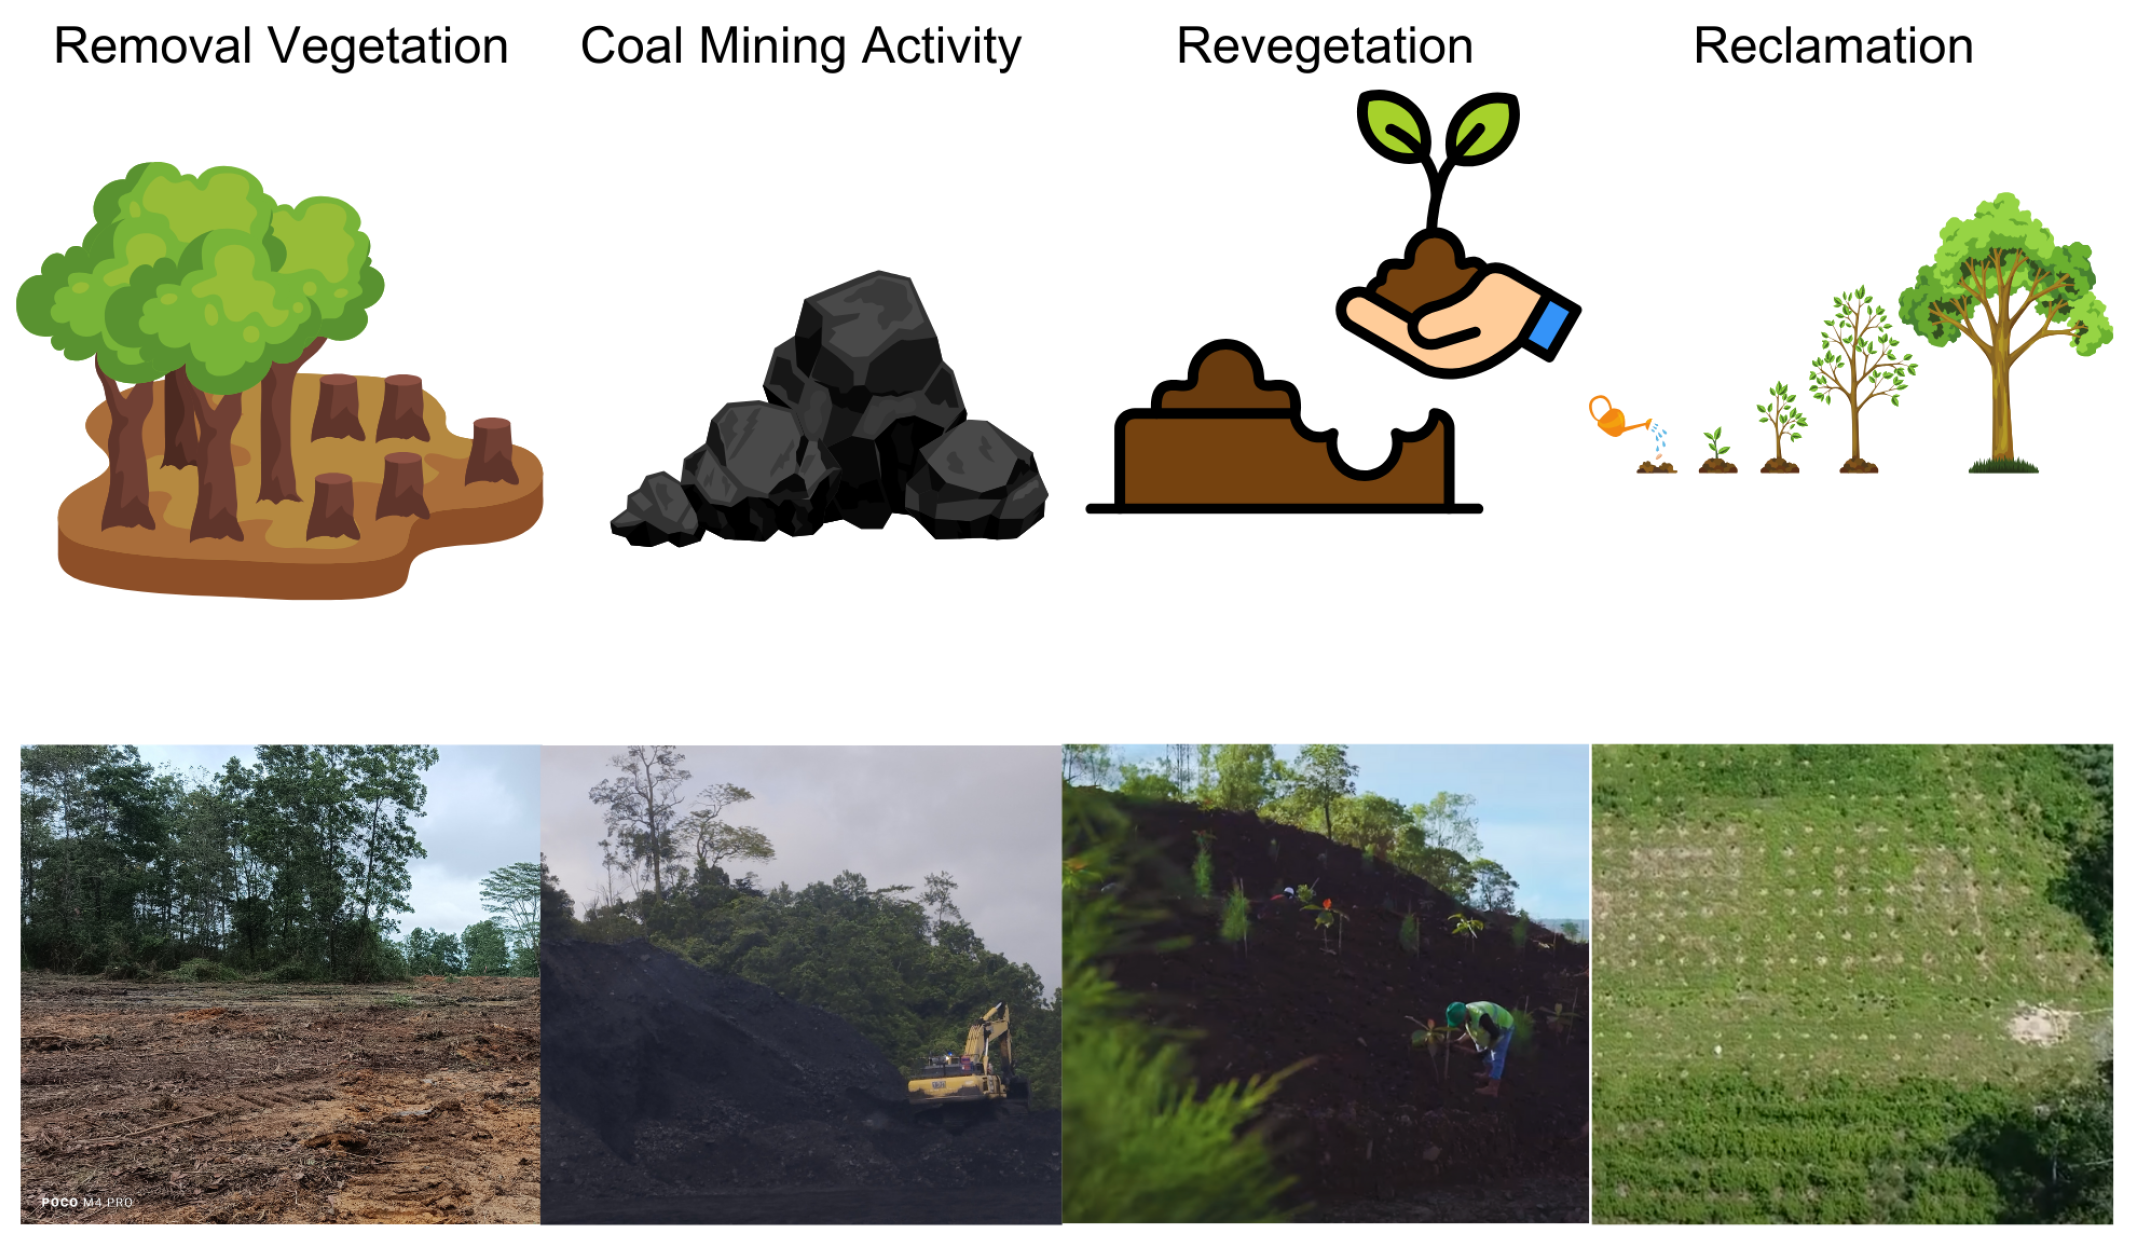
Opencast processes encompass strip mining, mountaintop removal mining, and open-pit mining. The coal mining process, from start to finish, consists of several consecutive stages. These stages include the removal of vegetation cover, the removal of topsoil, the removal of overburden, the extraction of coal, the transportation of coal, the dumping of waste material, the preparation of the mining site, and the restoration of vegetation [
6]. Removing excess soil and extracting coal is categorized as coal mining, while preparing the site and restoring flora is defined as reclamation [
7].
However, the negative impacts of coal mining are significant and should not be overlooked. Deforestation, land degradation, and water pollution are some of the key environmental consequences of mining activities. These activities can lead to the destruction of natural habitats and biodiversity loss, affecting the ecosystem and wildlife in the region. Moreover, coal mining can contribute to air and water pollution, posing health risks to local communities and damaging overall ecosystem health.
In Kalimantan, Indonesia where the impact of coal mining is significant, it is crucial to closely monitor and manage these activities to reduce their negative effects. Effective reclamation efforts are essential in restoring the land to its original state and minimizing the environmental impact of mining operations. Implementing sustainable land use practices and environmental management can mitigate the adverse effects of coal mining, ensuring the well-being of local communities and preserving the region’s biodiversity and ecosystem health. Monitoring the extent of mining activities and reclamation progress is essential for effective land management. Remote sensing, combined with computational techniques, provides a practical approach for analyzing land-use changes, enabling a scalable and data-driven assessment of mining activities and reclamation efforts.
The classification of coal mining and reclamation areas using remote sensing data is a crucial task for monitoring and managing these environments effectively. Monitoring coal mining and reclamation activities is especially important in Kalimantan due to the significant impact of these activities on the environment and on local communities [
8]. Specific spatial datasets for mining and reclamation are not openly available, with only general land cover data accessible. Reclamation guarantees are required, refunded upon verification, ensuring compliance while mitigating environmental impacts. Traditional methods of monitoring can be time-consuming and labor-intensive. Alternative remote sensing approaches, such as object-based image analysis (OBIA) and threshold-based classification, have been used to differentiate land cover types, while these methods can be effective, deep learning generally achieves higher classification accuracy due to its ability to leverage larger training datasets and more complex model architectures [
9]. However, distinguishing between vegetation and reclamation in coal mining areas can be challenging, especially when using remote sensing data. Our method can be implemented using ArcGIS Pro, a user-friendly tool for satellite imagery analysis and deep learning, even for those with limited coding skills. It supports models like U-Net and ResNet to monitor mining and reclamation areas using freely available satellite data, such as the Sentinel mission from the ESA’s Copernicus program. Additionally, this approach can support the development of open access environmental data platforms, encouraging public and researcher participation in monitoring and protecting natural resources. By involving communities and researchers, this method promotes transparency, accountability, and collaborative environmental governance. Traditional classification methods often struggle to differentiate between areas undergoing reclamation and natural vegetation due to spectral similarities. Moreover, the manual verification of the reclamation progress remains resource-intensive, further highlighting the need for automated approaches. To address these challenges, deep learning is employed as a classification tool to enhance the accuracy of identifying mining and reclamation areas by learning spatial and temporal patterns from multitemporal satellite imagery. By analyzing the changes over time from mined areas into non-mined areas, the areas can be considered in the transition of reclamation. This method provides a reliable way to differentiate between areas undergoing reclamation and those still affected by mining activities, thus aiding in the effective monitoring and management of the environments.
To address these challenges, this study proposes a multitemporal deep learning approach for the classification of coal mining and reclamation using satellite imagery [
10,
11]. To develop an effective model for the classification of coal mining and reclamation areas using remote sensing data, the proposed approach leverages the UNet architecture, with ResNet as a backbone. This combination of deep learning techniques allows for the extraction of intricate spatial and temporal features from satellite imagery, enabling the accurate differentiation between coal mining and non coal mining. By integrating the UNet architecture, which is well-suited for semantic segmentation tasks, with the ResNet backbone known for its feature extraction capabilities, the model can effectively capture the complex temporal changes associated with coal mining and reclamation activities. The utilization of multitemporal data further enhances the model’s ability to discern subtle variations over time, facilitating the precise identification of areas undergoing reclamation and those still impacted by mining activities. Additionally, the incorporation of deep learning methodologies aligns with the study’s objective to provide a reliable and automated approach for monitoring and managing coal mining and reclamation environments in Kalimantan.
Previous studies utilizing object-oriented decision trees on Sentinel imagery for the classification of coal mining area obtained 97.07% accuracyand Kappa 0.80 [
12]. Another study utilized the Normalized Difference Vegetarian Index (NDVI) and Land Cover Mapping with unsupervised classification to monitor surface coal mining and reclamation in Pakistan to monitor vegetation change in the coal mining areas [
13]. Another research paper analyzed vegetation change in coal mine reclamation using NDVI to distinguish vegetation health in coal mine reclamation areas [
14]. The above methods can be improved upon, providing us with a greater accuracy through the further development of an advanced model to obtain result from multitemporal coal mining change and reclamation.
This study, utilized the Sentinel-1 Synthetic Aperture Radar (SAR) and Sentinel-2 Multispectral imagery to collect a multitemporal dataset for analyzing the changes over time to effectively differentiate between coal mining and reclamation areas. Leveraging satellite imagery and a deep learning model facilitates the precise identification of areas undergoing reclamation and those still impacted by mining activities. This approach allows for a better classification technique of coal mining and reclamation areas, addressing the need to monitor and manage these environments effectively in Kalimantan.
In summary, this research aims to implement a deep learning approach for monitoring and managing coal mining activities with multitemporal satellite imagery. The proposed model, which combines a UNet architecture with a ResNet backbone, is designed to effectively identify the intricate spatial and temporal features necessary for the accurate classification of coal mining and reclamation areas.
2. Materials and Methods
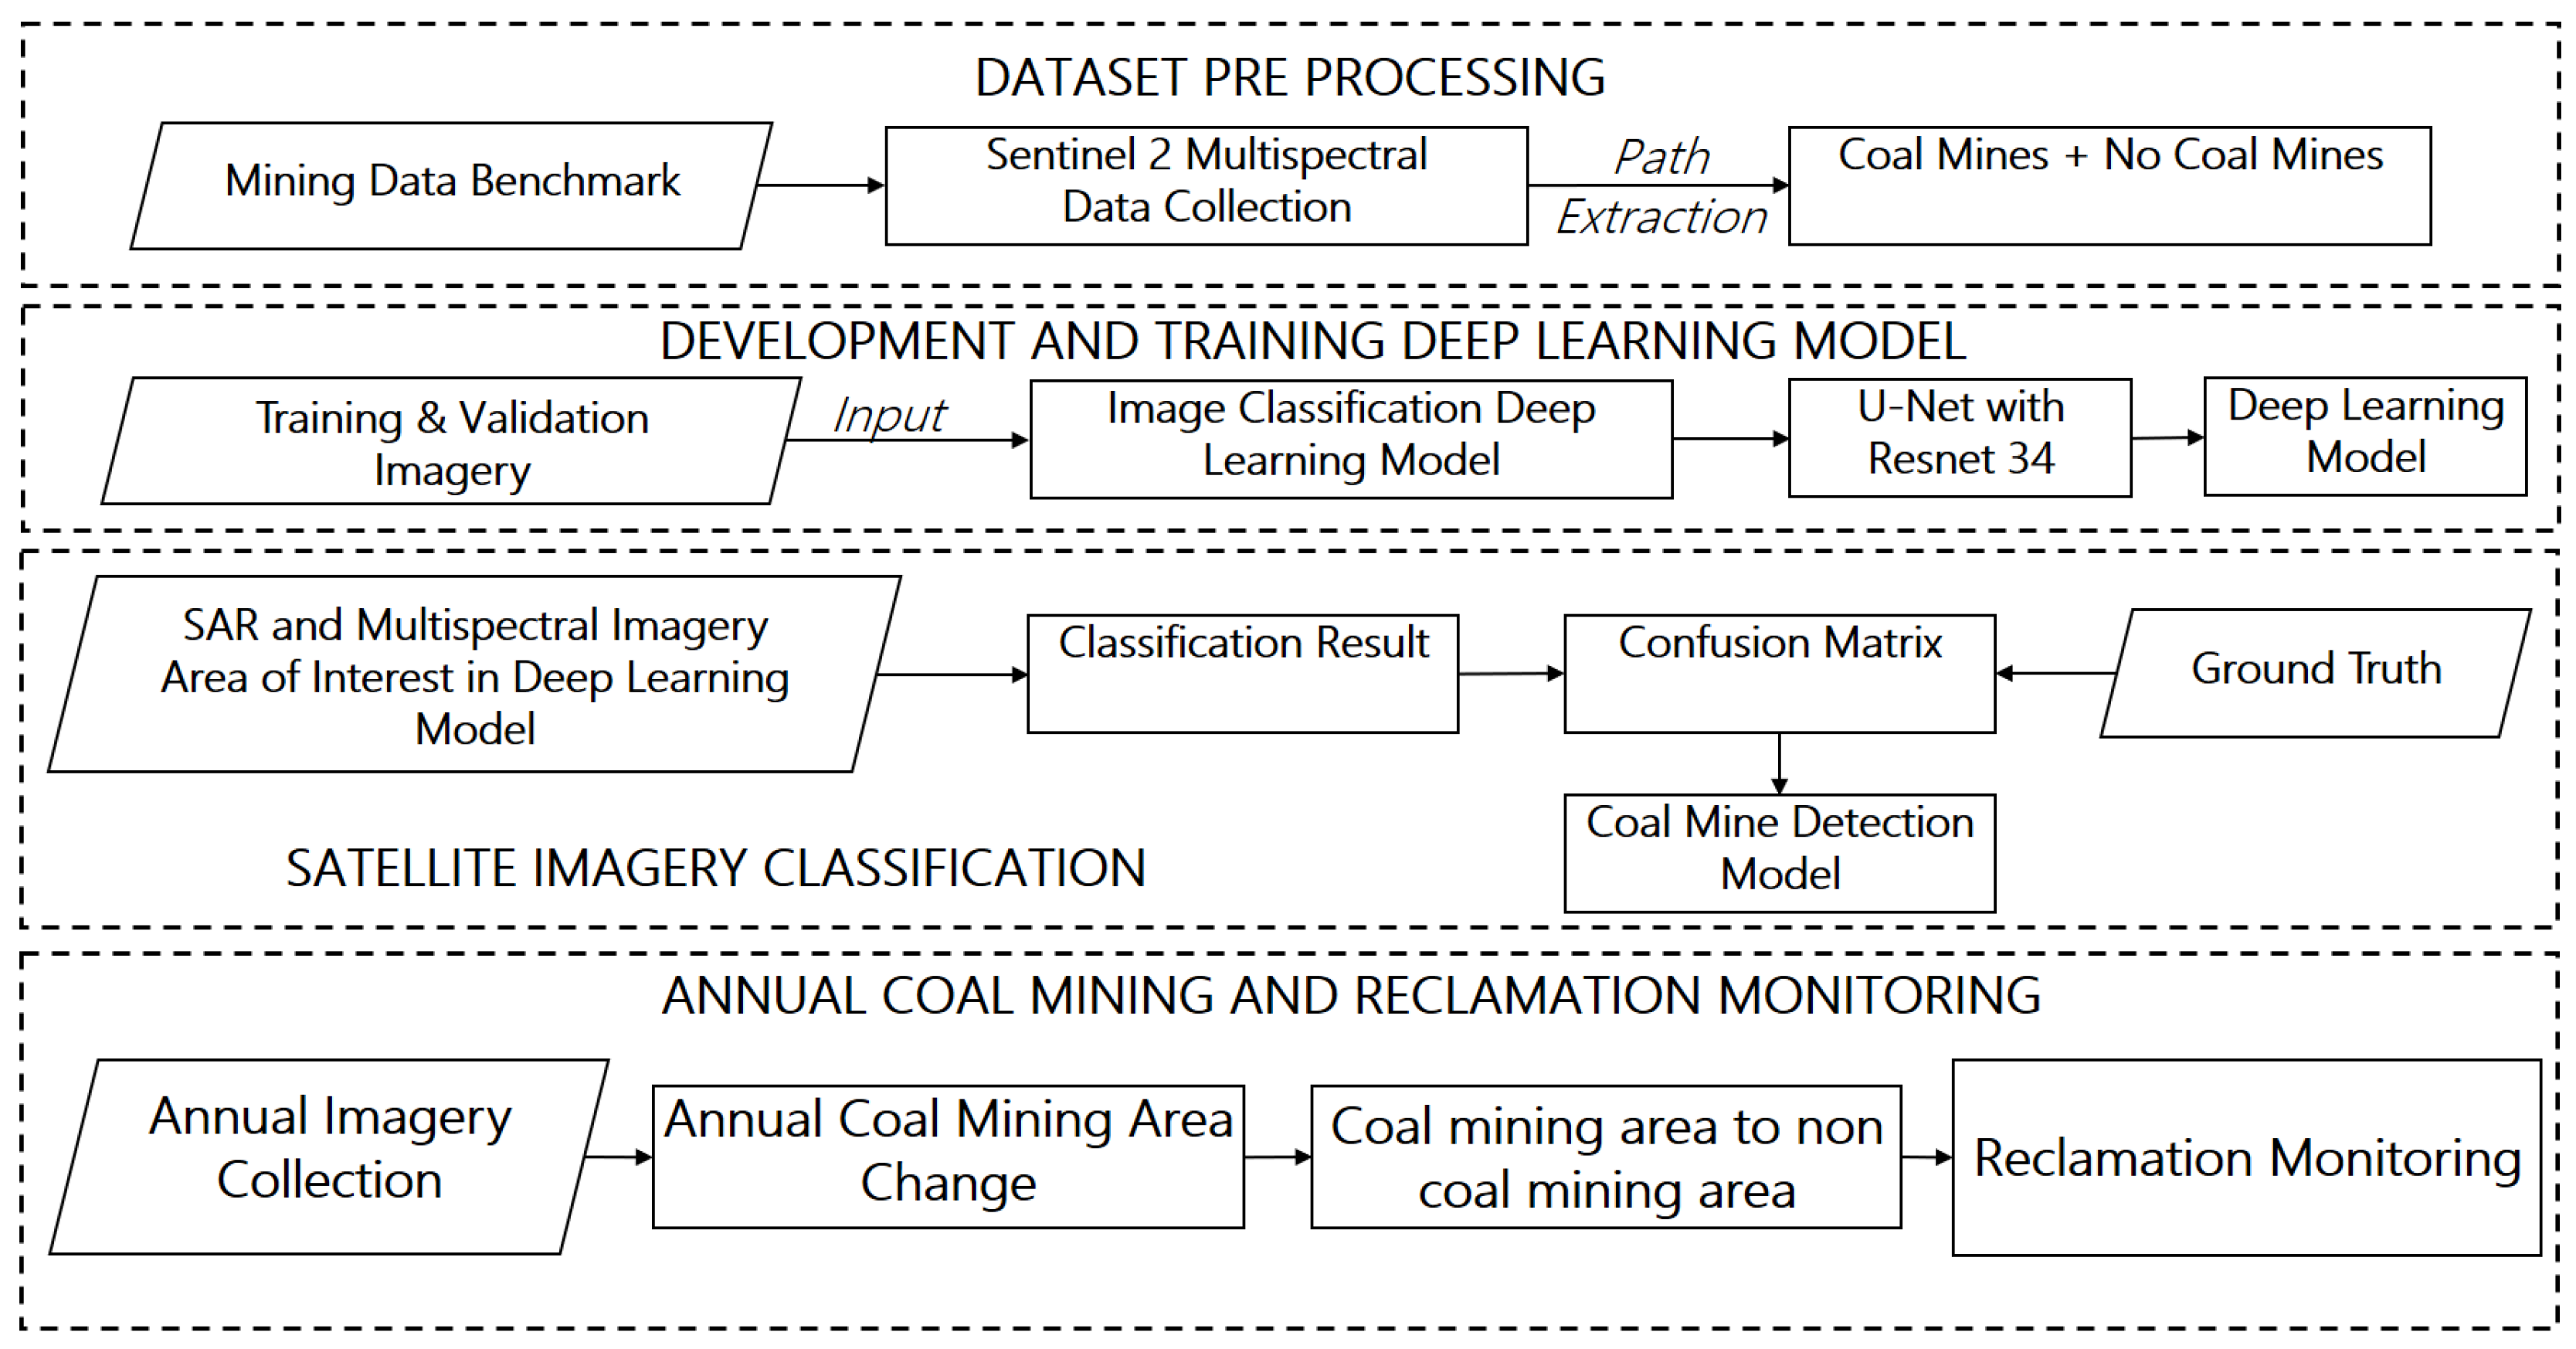
The work stages in this study are divided into dataset atmospheric correction, setting into motion the development of a deep learning model, the classification of satellite imagery, and annual coal mining and reclamation monitoring, as shown in
Figure 1. The dataset preprocessing included collecting and preprocessing Sentinel-1 Synthetic Aperture Radar (SAR) data to obtain sigma dB and the Gray Level Co-Occurence Matrix (GLCM), then collecting and making spectral indices from Sentinel-2 preprocessed from Top of Atmosfer (TOA) to surface reflectance to maintain the spectral consistency at the same time. The multispectral images produce visually interpreted labels and collect reference samples for map accuracy, followed by assessments. Training a deep learning model includes splitting the input data into training and validation data. U-Net and ResNet-34 models were integrated and implemented to classify the prepared datasets. The accuracy of the deep learning model was evaluated with a confusion matrix based on a visually interpreted label and compared with the classification result. After the training and validation are confirmed to be satisfactory, the model is applied to obtain an evaluation of annual coal mining by a combination of annual imagery collection and the coal mine detection model. After this, we obtain the annual coal mining change. The reclamation based on the change from a coal mining area into a non-coal mining area is identified.
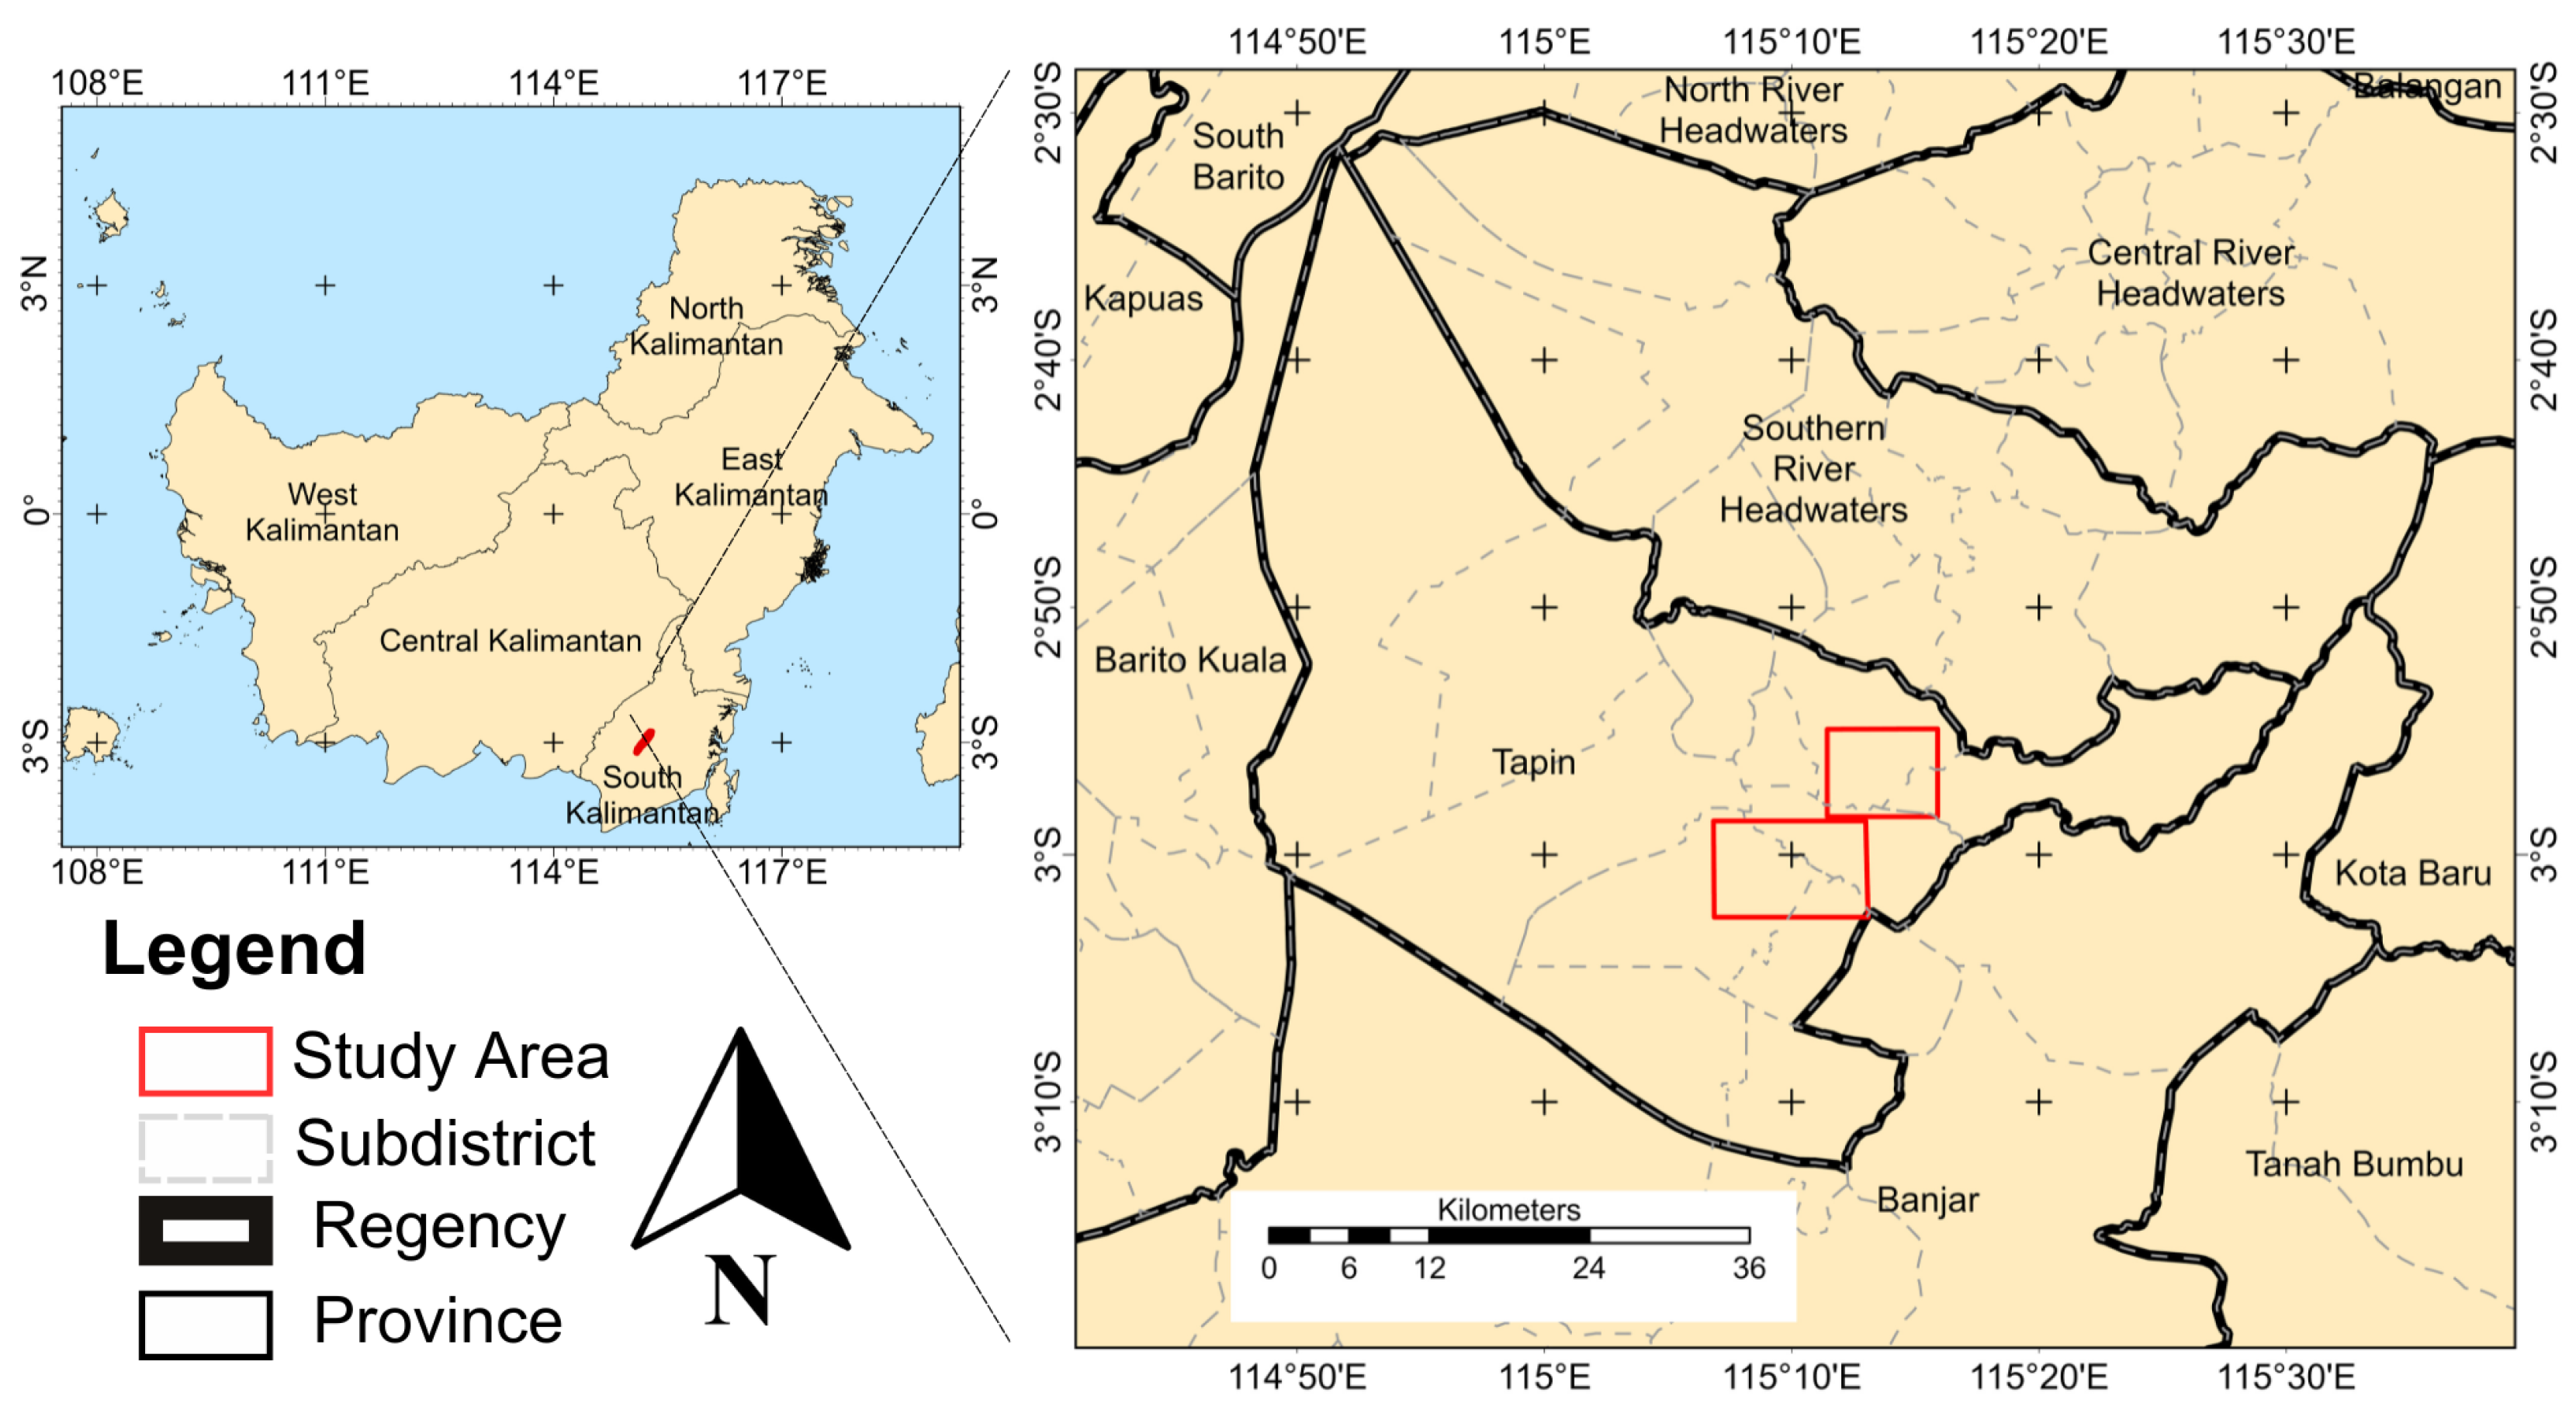
2.1. Study Area
The study site is located in Kalimantan, Indonesia, as illustrated in
Figure 2. This research focuses on two mined areas in Tapin Regency, South Borneo, Indonesia, which lies between 2°32′43″ and 3°00′43″ south latitude and 114°46′13″–115°30′33″ east longitude. The Lokpaikat and South Tapin mined areas are situated in the South Kalimantan province of Indonesia. Tapin Regency is recognized for its substantial coal reserves, with an estimated 8 billion tons, based on one mining license area alone, which holds approximately 3.5 million tons [
15]. The region contains around 1000 mining license areas, highlighting its role as an important coal-producing area.
Tapin Regency is characterized by predominantly flat terrain, with 67.34% of the land at an elevation of 0–7 m above sea level, making it highly accessible for large-scale land use activities. Only 1.21% of the area exceeds 500 m, and gentle slopes of 0–2% cover 82.93% of the region, facilitating both agriculture and mining [
16]. The climate follows a tropical savanna pattern (Aw), with significant seasonal rainfall variability, which can influence both mining activities and reclamation efforts, particularly in managing soil stability and revegetation progress. The land cover composition of Tapin Regency is mainly dominated by plantations (37.03%), rice fields (30.56%), and shrublands (21.02%), reflecting the region’s reliance on agriculture and forestry-related industries. Mining areas account for 3.86% of the total land area, while urban settlements (1.73%), open land (0.22%), and water bodies (0.70%) remain relatively minor based on guidance from the Ministry of Forestry [
17]. Although mining covers a small proportion of the total area, it plays a significant role in the local economy, contributing between 26% and 28% of the Gross Regional Domestic Product (GRDP) from 2016 to 2020, as shown in
Table 1. Mining reached its peak at 28.62% in 2018, followed by a gradual decline to 27.19% in 2019 and 26.64% in 2020, which may be influenced by market conditions, regulatory policies, or shifts in reclamation efforts [
16].
The expansion of mining activities in Tapin has led to significant land cover transformations, with large areas being converted into active mining zones, while reclamation efforts attempt to restore mined-out lands. The economic importance of mining underscores the need for the effective monitoring of land-use changes, particularly in tracking the transition from mining to reclaimed land. However, the effectiveness of reclamation remains a critical question, as some areas may not fully recover due to incomplete revegetation or delayed rehabilitation efforts.
Given the dynamic nature of mining operations, multitemporal remote sensing and deep learning approaches provide an essential tool for monitoring the mining expansion and reclamation progress over time. Such an approach enables the detailed classification of land cover changes, helping to evaluate whether reclamation efforts are keeping pace with mining activities. Ensuring compliance with government regulations and promoting sustainable reclamation practices is crucial for balancing economic development with environmental restoration. Therefore, continued research is necessary to analyze the rate and effectiveness of post-mining land recovery, ensuring that Tapin’s mining sector remains productive while minimizing long-term environmental impacts.
2.2. Sentinel 1 Preprocessing
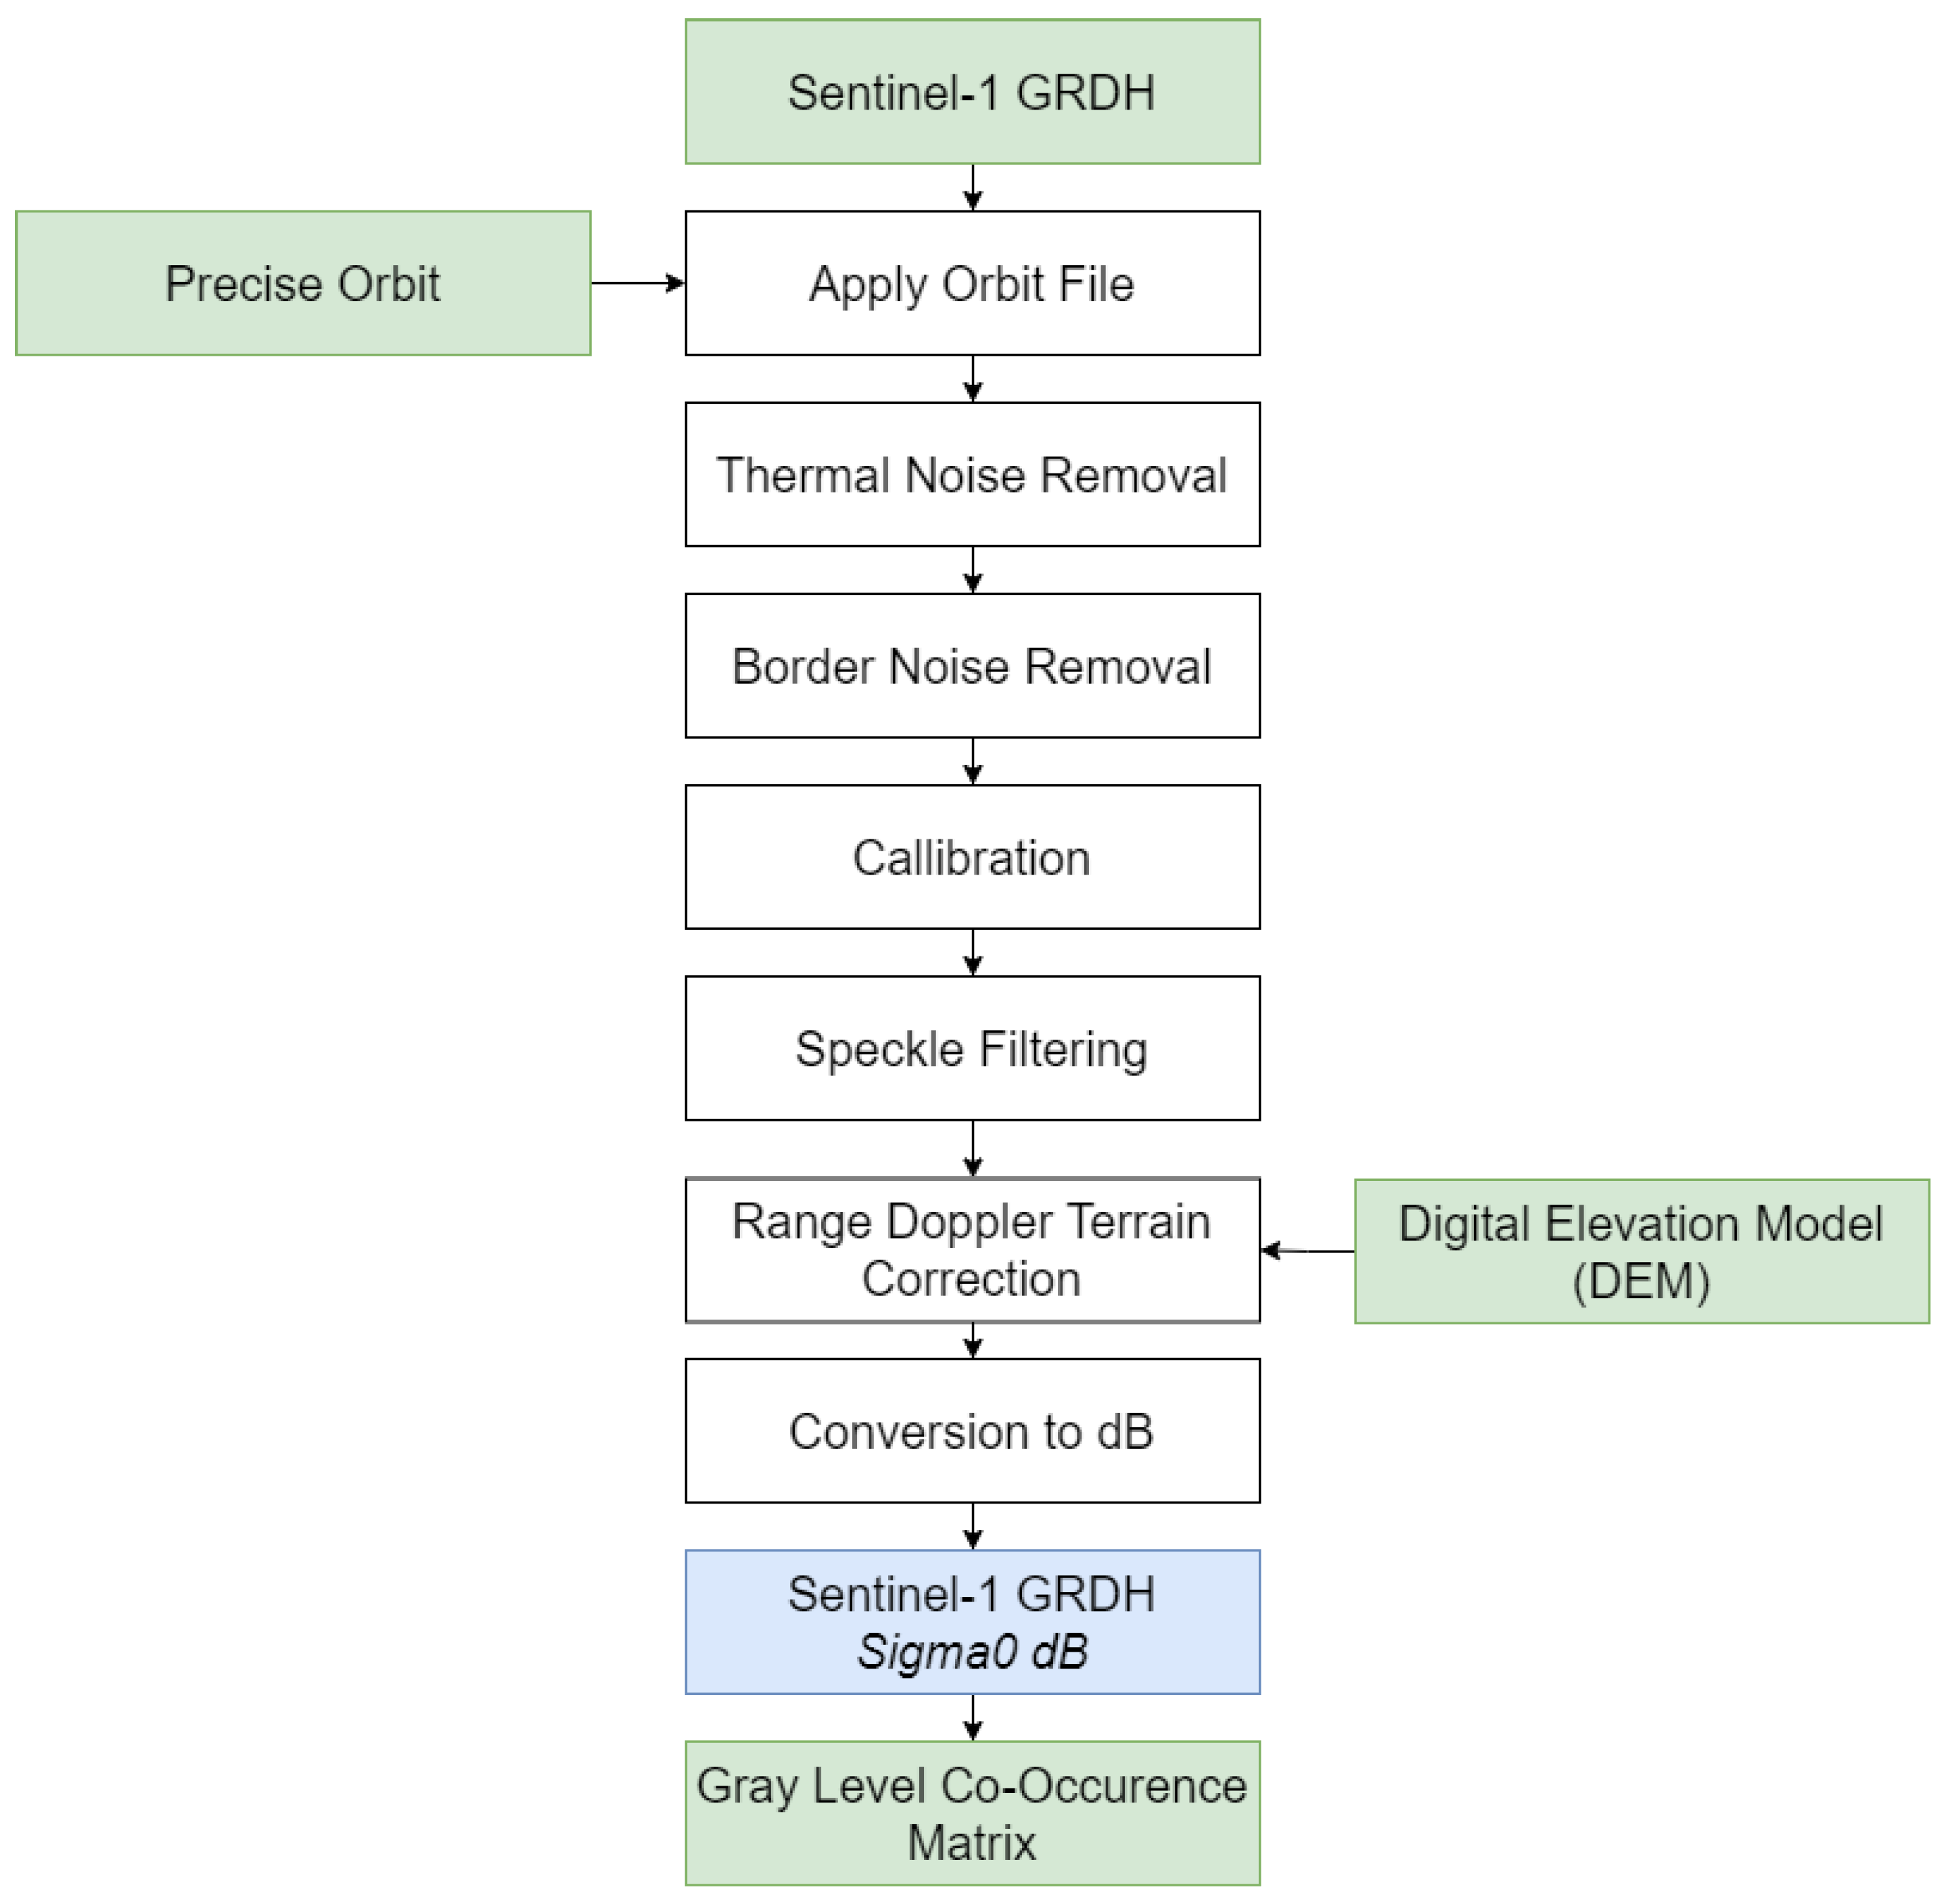
A standard method for preprocessing Copernicus Sentinel-1 GRD data, as shown in
Figure 3, was developed for use within the Sentinel application platform [
18]. The processing graph in ‘XML’ format enables batch processing using a command-line framework. Preprocessing includes seven steps to minimize error propagation in subsequent processes. Apply Orbit File metadata of SAR products can be automatically updated by applying a precise orbit [
19]. Thermal Noise Removal helps mitigate its impact on texture between different sub-swaths within a scene by removing thermal noise from Sentinel-1 image intensity [
20]. Border Noise Removal eliminates low-intensity noise and invalid data on scene perimeters caused by adjustments made during level-1 product generation [
21]. Calibration involves converting digital pixel values to radiometrically calibrated SAR backscatter [
22]. Speckle filtering aims to enhance image quality by reducing speckles [
23]. Range-Doppler terrain correction compensates for geometric distortions caused by topography in SAR images with varying viewing angles more significant than 0 degrees [
24]. Conversion to dB involves converting the unitless backscatter coefficient to decibels using a logarithmic conversion [
25]. The preprocessing of Sentinel-1 imagery was conducted using the Sentinel Application Platform (SNAP) 11.0.0, a software developed by the European Space Agency (ESA) to facilitate SAR data analysis. The entire workflow, including orbit correction, thermal noise removal, speckle filtering, and terrain correction, was performed within SNAP. After the preprocessing steps, Gray Level Co-occurrence Matrix (GLCM) extraction was carried out to generate textural features. These textural bands provide additional information to enhance classification accuracy by capturing spatial patterns within the SAR imagery.
2.3. Gray Level Co-Occurence Matrix (GLCM)
The Gray Level Co-occurrence Matrix provides statistical measures for extracting texture features [
26]. This algorithm determines the likelihood of a pixel with a gray value
i appearing at a defined distance and angle from another pixel with a gray value
j within a specified window [
27].
GLCM matrices were created for each of the eight directions to produce omnidirectional textures and then averaged. The resulting averaged GLCM maintains directional structures but reduces impact due to averaging. However, the specific orientation of structures is no longer represented in the average GLCM. The methodology of this study creates 10 bands of the GLCM as shown on Formulas (1)–(10) [
26], obtained from preprocessing the Sentinel 1 sigma db dataset. The remaining parameters are often selected manually or optimized for a particular study and kept constant afterwards. The following formula can calculate individual scalar texture features from the GLCM.
2.4. Sentinel 2 Preprocessing
The European Space Agency offers freely accessible satellite image data through Sentinel-2 [
28].
Table 2 demonstrates the characteristics of these images, which include 13 bands as follows: 4 with a spatial resolution of 10 m, 6 with a resolution of 20 m, and 3 with a resolution of 60 m, as listed in
Table 1. This study only used bands with a 10–20 m resolution because a high resolution can provide better results. All Sentinel-2 images were acquired from the Sentinel Scientific Data Hub from 2016 to 2021. More specifically, Level-1C images with minimal cloud cover were selected to ensure high quality. The sen2cor v2.12 software provided by the ESA was used to convert the Level-1C images into Level-2A orthoimages corrected for bottom-of-atmosphere reflectance products [
29]. The Sentinel-2 images were preprocessed before training, including atmospheric correction using Sen2Cor to remove effects such as aerosols and water vapor. This ensures that the spectral values accurately represent surface conditions, improving classification reliability. Sentinel-2 imagery preprocessing was performed using Sen2Cor, a tool provided by the ESA to convert Level-1C imagery into Level-2A surface reflectance products. Additionally, image compositing and dataset preparation for deep learning model training were conducted using ArcGIS Pro. ArcGIS Pro was utilized to generate input feature stacks, merge Sentinel-1 and Sentinel-2 bands, and prepare the dataset for classification.
Regarding the input bands for the training model, this study utilized both the original bands from Sentinel-2 data and bands generated using spectral indices based on prior studies related to coal mining mapping. Spectral indices consist of mathematical formulas used to assess remote-sensing image bands to improve the distinguishability of the observed objects. We computed the following three spectral indices: the normalized difference vegetation index, normalized difference coal index, and built area index, as shown in Formulas (11)–(13) [
30,
31,
32]. These indices can aid in identifying areas associated with either coal mining or non-coal mining based on earlier findings. The NDVI is commonly employed for evaluating various vegetation elements [
30]. Therefore, calculating the NDVI for the Sentinel-2 images can identify areas with reduced vegetation cover, indicating potential coal mining sites. The NDCI was developed to improve the distinction between mined areas and other land cover types by normalizing the difference between NIR and SWIR-1 bands, which are linked to the characteristics of mined areas in satellite imagery [
31]. The BAI was created to enhance the contrast between built-up areas, coal mining sites, and vegetation areas, facilitating the faster identification of coal mining spaces. It uses normalized differences between the blue and NIR band [
32]. A total of 23 input bands were utilized in this study, from Sentinel 1, 1 sigma band and 10 GLCM bands, and 12 Sentinel 2 bands (all bands were in 10 and 20 m resolution). Spectral indices and GLCM were incorporated into the band selection process to enhance classification performance, as discussed in
Section 3.2. Although spectral indices improve land cover differentiation, they have inherent limitations. NDVI primarily distinguishes vegetated from non-vegetated areas, but it may struggle in regions where vegetation health is affected by factors such as soil moisture or seasonal variations. NDCI, designed to enhance the separability of coal mining sites, can sometimes misclassify non-mining barren land as mining areas, particularly in dry, sandy regions. BAI, while useful for highlighting built-up and disturbed areas, may be influenced by atmospheric conditions and shadow effects, which can lead to classification errors. To mitigate these limitations, integrating textural features from Sentinel-1 and additional spectral indices could further improve classification performance.
2.5. Coal Mining Classification Deep Learning Model
With the growing use of deep learning in remote sensing, particularly through models like U-Net and ResNet, artificial neural networks (ANNs) have demonstrated notable improvements in land use and land cover (LULC) classification, particularly for coal mine detection. According to Md. Sharafat Chowdhury, ANN has shown higher classification accuracy compared to traditional methods such as Maximum Likelihood (MaxL), Random Forest (RF), and Support Vector Machine (SVM). ANN achieved the highest overall accuracy of 0.95 with a Kappa coefficient of 0.93, consistently outperforming other models across various LULC categories. Traditional classifiers like RF and SVM exhibited greater variations in accuracy, particularly when distinguishing spectrally similar land cover types such as bare land and built-up areas, while MaxL struggled with mixed LULC classes due to its reliance on statistical assumptions [
33]. These findings highlight the advantages of deep learning models in capturing complex spatial and spectral patterns, making them a more effective approach for large-scale land use classification, including coal mine monitoring. In addition to LULC classification, deep learning has been applied in environmental studies, such as detecting extreme weather patterns and tracking land cover changes over time [
34]. This ability to analyze large-scale remote sensing data makes deep learning a useful tool for monitoring mining activities and reclamation efforts more efficiently.
The use of deep learning techniques has expanded with advancements in computing power and the growing availability of remote sensing data. In satellite image analysis, deep learning has helped improve classification accuracy and automate land cover monitoring. However, training these models for remote sensing applications remains challenging, as they require large amounts of labeled data and careful tuning to ensure reliable results. Different architectures, such as U-Net and ResNet, have been developed to enhance feature extraction and classification performance. In this study, Sentinel-2 images, corrected for atmospheric effects using Sen2Cor, were used to train the deep learning model. The dataset was divided into training and validation sets, with 10% used for validation. During training, U-Net with ResNet-34 as a feature extractor was optimized to recognize spatial and spectral patterns related to mining and non-mining areas. The validation phase assessed the models’ performance on new data and adjusted the parameters to improve accuracy. The trained model was then used to classify mining and reclamation areas, supporting the analysis of changes over time.
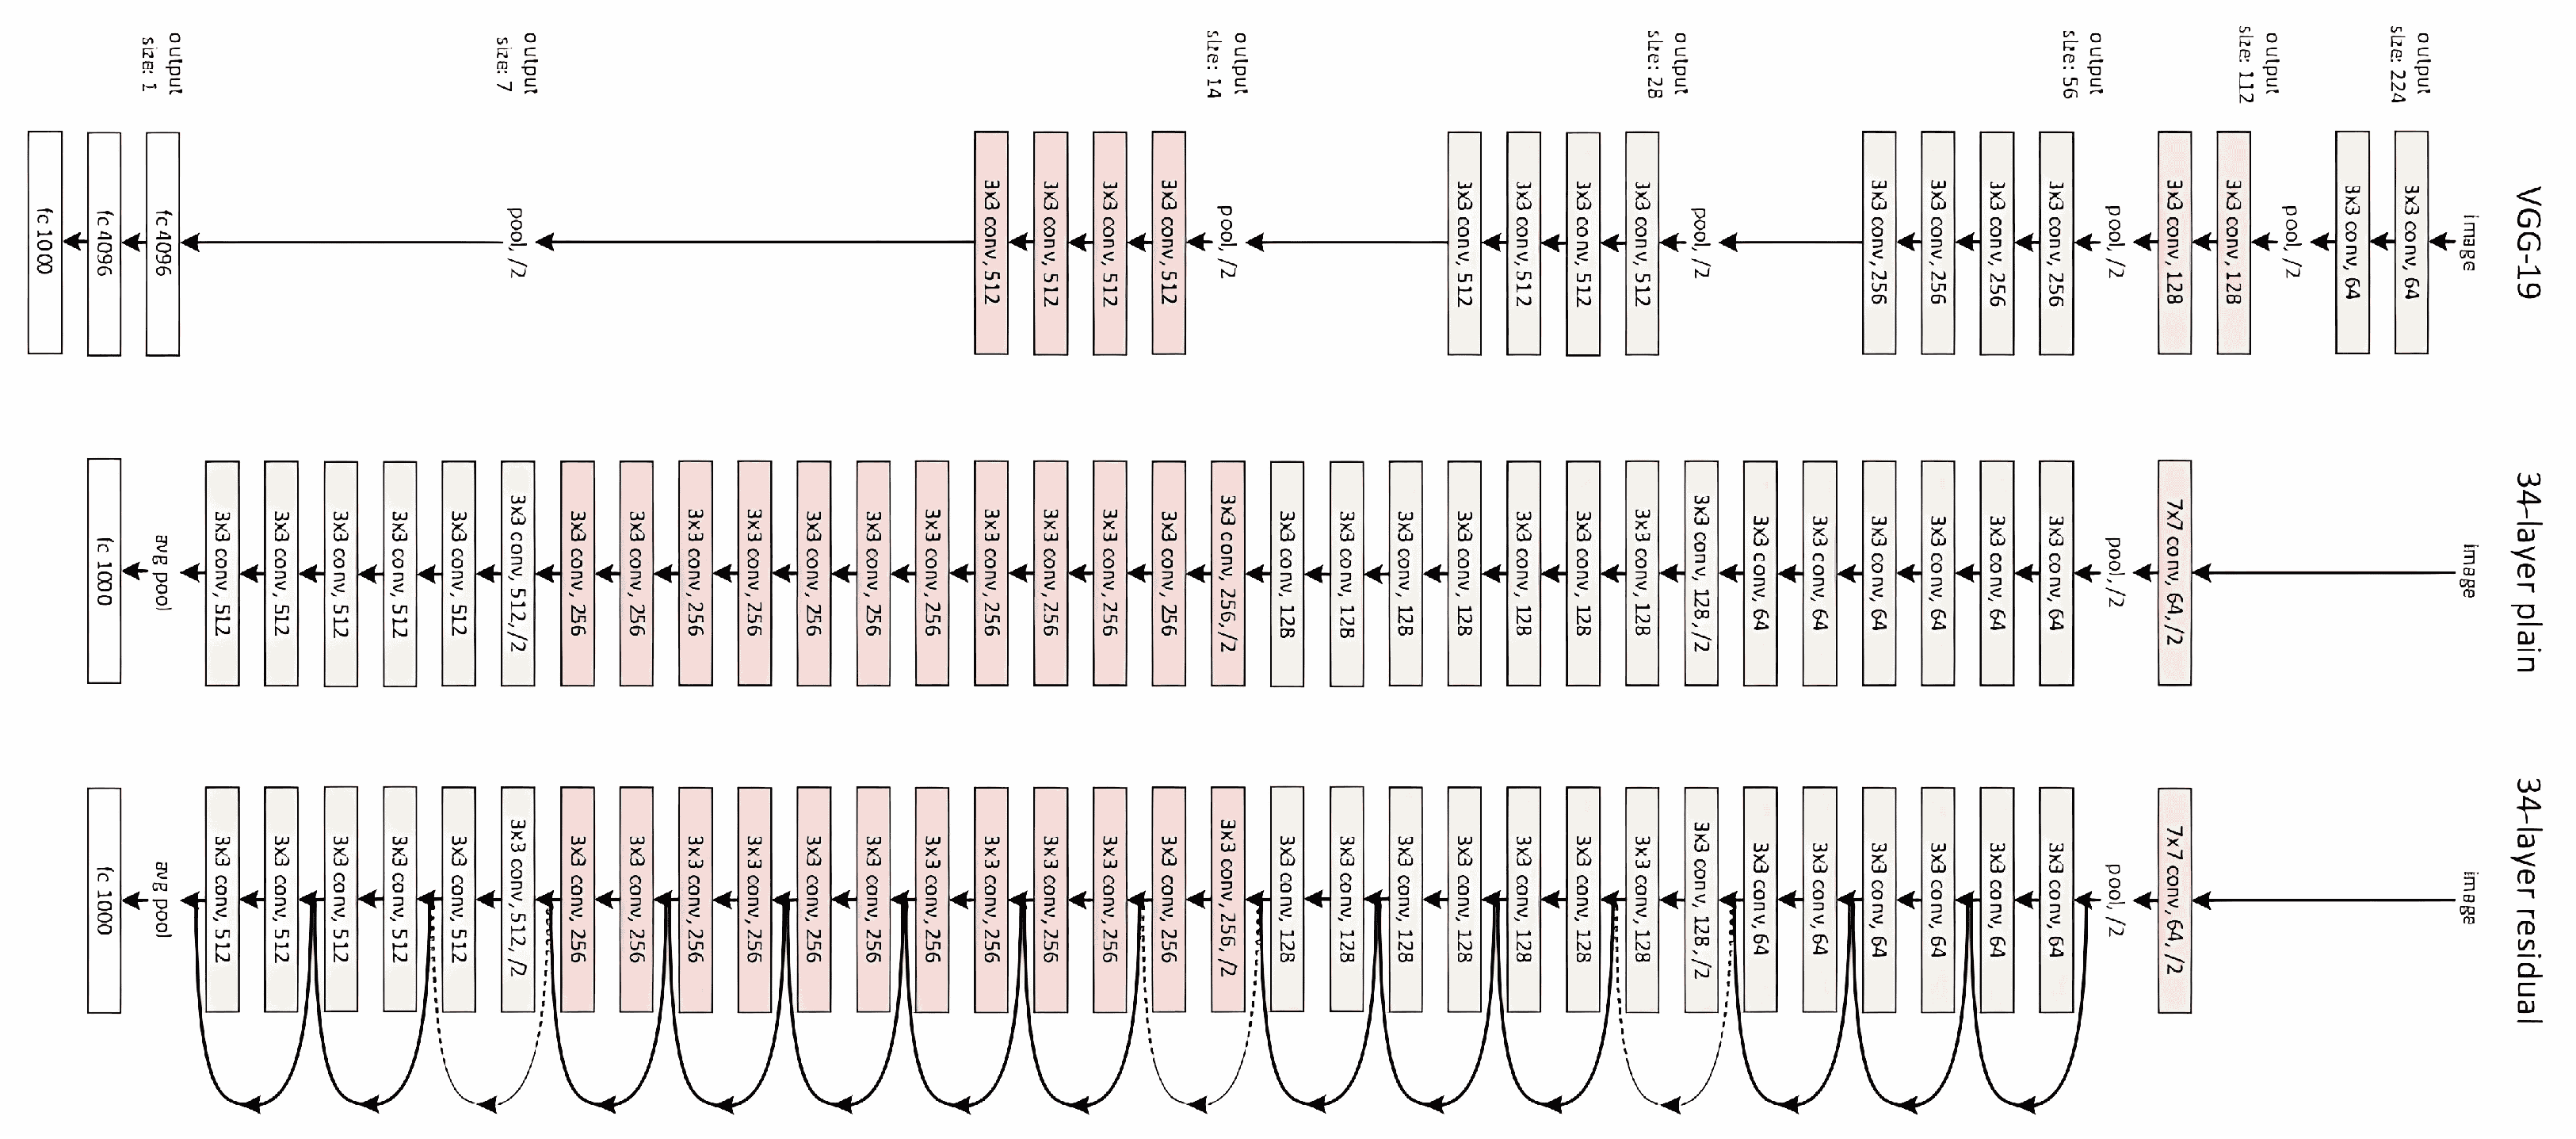
The architecture designed explicitly for semantic segmentation combines a contracting path and an expansive path following the typical convolutional network architecture. This research combines U-Net (as shown in
Figure 4) with ResNet-34 (as shown in
Figure 5), where additional details about how this combination enhances performance can be observed [
35]. ResNet was introduced by the Kaiming team at the Microsoft Research Institute to address degradation issues associated with training error rates in deeper neural networks, balancing time constraints often found when training more extensive models limited by their number of layers [
36]. Additionally, it is essential to note that this combination shows promise for classification tasks on remote sensing applications, with good accuracy and robustness against variations encountered during real-world usage scenarios.
2.6. Confusion Matrix Accuracy Assessments
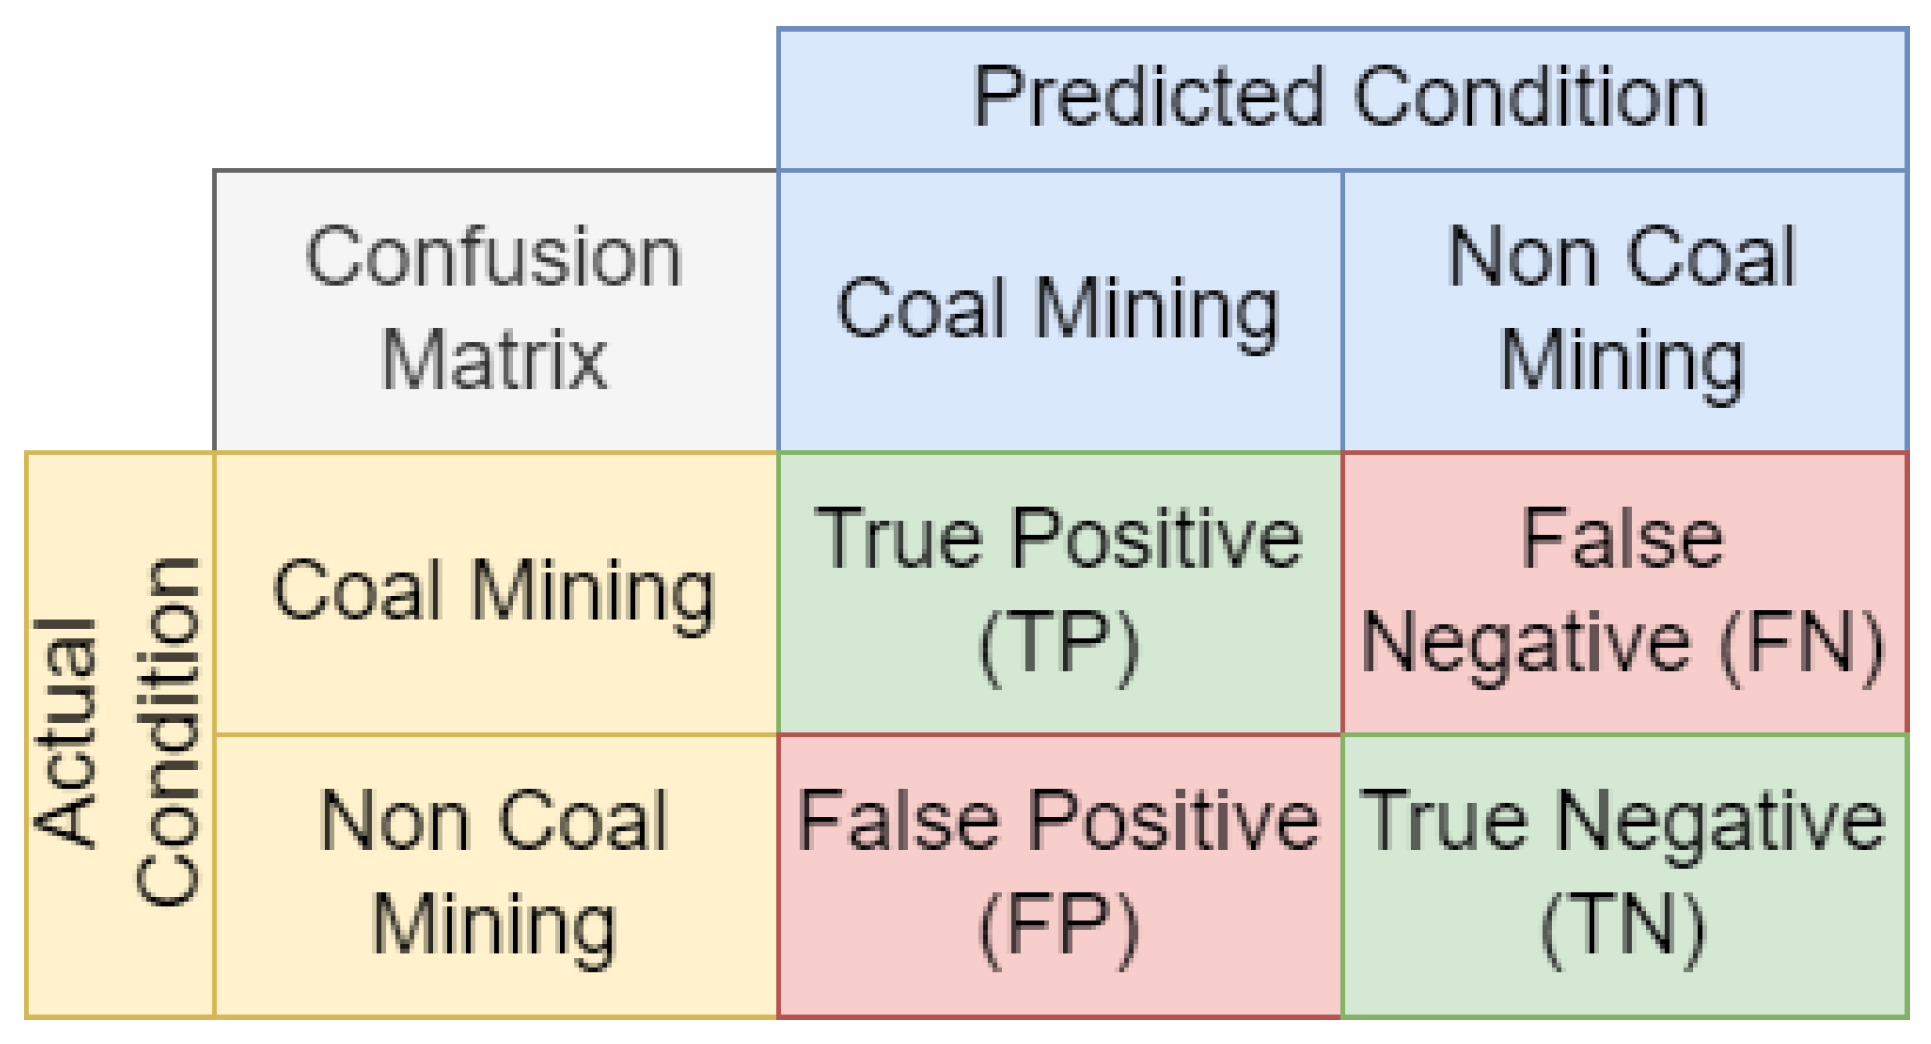
Deep learning models have become increasingly widespread in various domains, including coal mining classification. However, evaluating the performance of these models requires a robust and comprehensive approach. One such tool that provides valuable insights is the confusion matrix, which not only gives an overview of the model’s accuracy but also reveals the types of errors it makes. The confusion matrix is a visualization that represents the performance of a classification model.
The confusion matrix consists of a table with rows and columns representing the predicted and actual classes, respectively. The four main metrics derived from the confusion matrix are true positives (TP), false positives (FP), true negatives (TN), and false negatives (FN), as shown in
Figure 6 [
37]. These metrics provide a more nuanced understanding of the model’s performance, going beyond the simplistic accuracy measure [
38]. The Kappa value and overall accuracy of the classification model are important metrics in evaluating the performance of deep learning models for coal mining activity detection [
39].
For example, in the case of coal mining classification, a model may achieve a high overall accuracy, but this could be due to the model consistently predicting the majority class (e.g., non-coal) while struggling to identify the minority class. The confusion matrix would reveal this issue, allowing researchers to address the underlying biases and improve the model’s performance.
where
The Kappa value and overall accuracy of the classification model are important metrics in evaluating the performance of deep learning models for coal mining activity detection, as shown in Formulas (14)–(16) [
39]. The Kappa value measures the degree of agreement between the predicted and actual classes, taking into account the possibility of agreement occurring by chance. Overall accuracy refers to the ratio of correctly classified samples to the total number of samples. Additionally, producer and user accuracies for individual classes provide further insights into the model’s strengths and weaknesses. Furthermore, the confusion matrix can be particularly useful in scenarios where there is a significant class imbalance, a common occurrence in real-world datasets [
37,
40,
41]. In such cases, the confusion matrix can help identify the model’s strengths and weaknesses, enabling researchers to make informed decisions about model refinement or the need for additional data collection. In conclusion, the confusion matrix is a valuable tool for assessing the performance of deep learning models in coal mining classification.
2.7. Mined Area and Reclamation
The mining activity in Kalimantan mostly employs the opencast method in surface coal mining sites. The opencast mining process frequently leads to environmental problems, including the loss of soil and water, the sinking of pits, the destruction of biodiversity, and the contamination of groundwater with chemical-laden wastewater.
These issues significantly impact the ecological environment and can result in geological disasters such as mudslides and slope sliding in open-pit mining areas.
Figure 7 presents a simplified illustration of the processes involved in coal mining and reclamation. The coal mining reclamation model classifies annual satellite imagery into two categories as follows: mined areas and non-mined areas. The reclamation model classifies the land that transitions from coal mining to non-coal mining as reclamation with the use of the eraser tool, as shown in
Figure 8.
3. Results
3.1. Deep Learning Classification
The output of the U-Net deep learning model, which was trained to distinguish between the two categories of coal mine and no coal mine, is displayed in
Figure 9. The training process of the model lasted for a total of 2 h and 20 min. This model was implemented using a system equipped with an NVIDIA RTX 2060 GPU, with a memory capacity of 6 GB. The U-Net deep learning model shown in
Figure 5 was built using 205 tiles, each with dimensions of 128 by 128 pixels, and trained for 200 epochs. The model was trained using a batch size of 8 and a learning rate of 0.001.
To balance the number of training samples between mined and non-mined areas, the tile size was reduced from the typical 256 by 256 pixels to 128 by 128 pixels. Additionally, the stride was decreased from 128 by 128 to 64 by 64 pixels to increase the number of training samples. The training dataset was selected from coal mining regions with minimal cloud cover to ensure the data were suitable for analysis. To mitigate overfitting, the training process was extended to 200 epochs, ensuring better adaptation to variations in the dataset, while Dropout layers and L2 Regularization were not explicitly configured, ArcGIS Pro’s built-in optimization manages weight adjustments to improve model stability and reduce overfitting. A validation dataset was used, consisting of two classes and imagery with 22 bands, providing a comprehensive representation of the study area. During training, various monitoring metrics were available to assess model performance, including validation loss, average precision, accuracy, corpus BLEU, and multi-label F-beta. Validation loss was chosen, as it provides a direct measure of model performance on unseen data, allowing for better tracking overfitting and ensuring stable learning. Additionally, the optimization method followed the default setting, as ArcGIS Pro does not offer alternative optimizers.
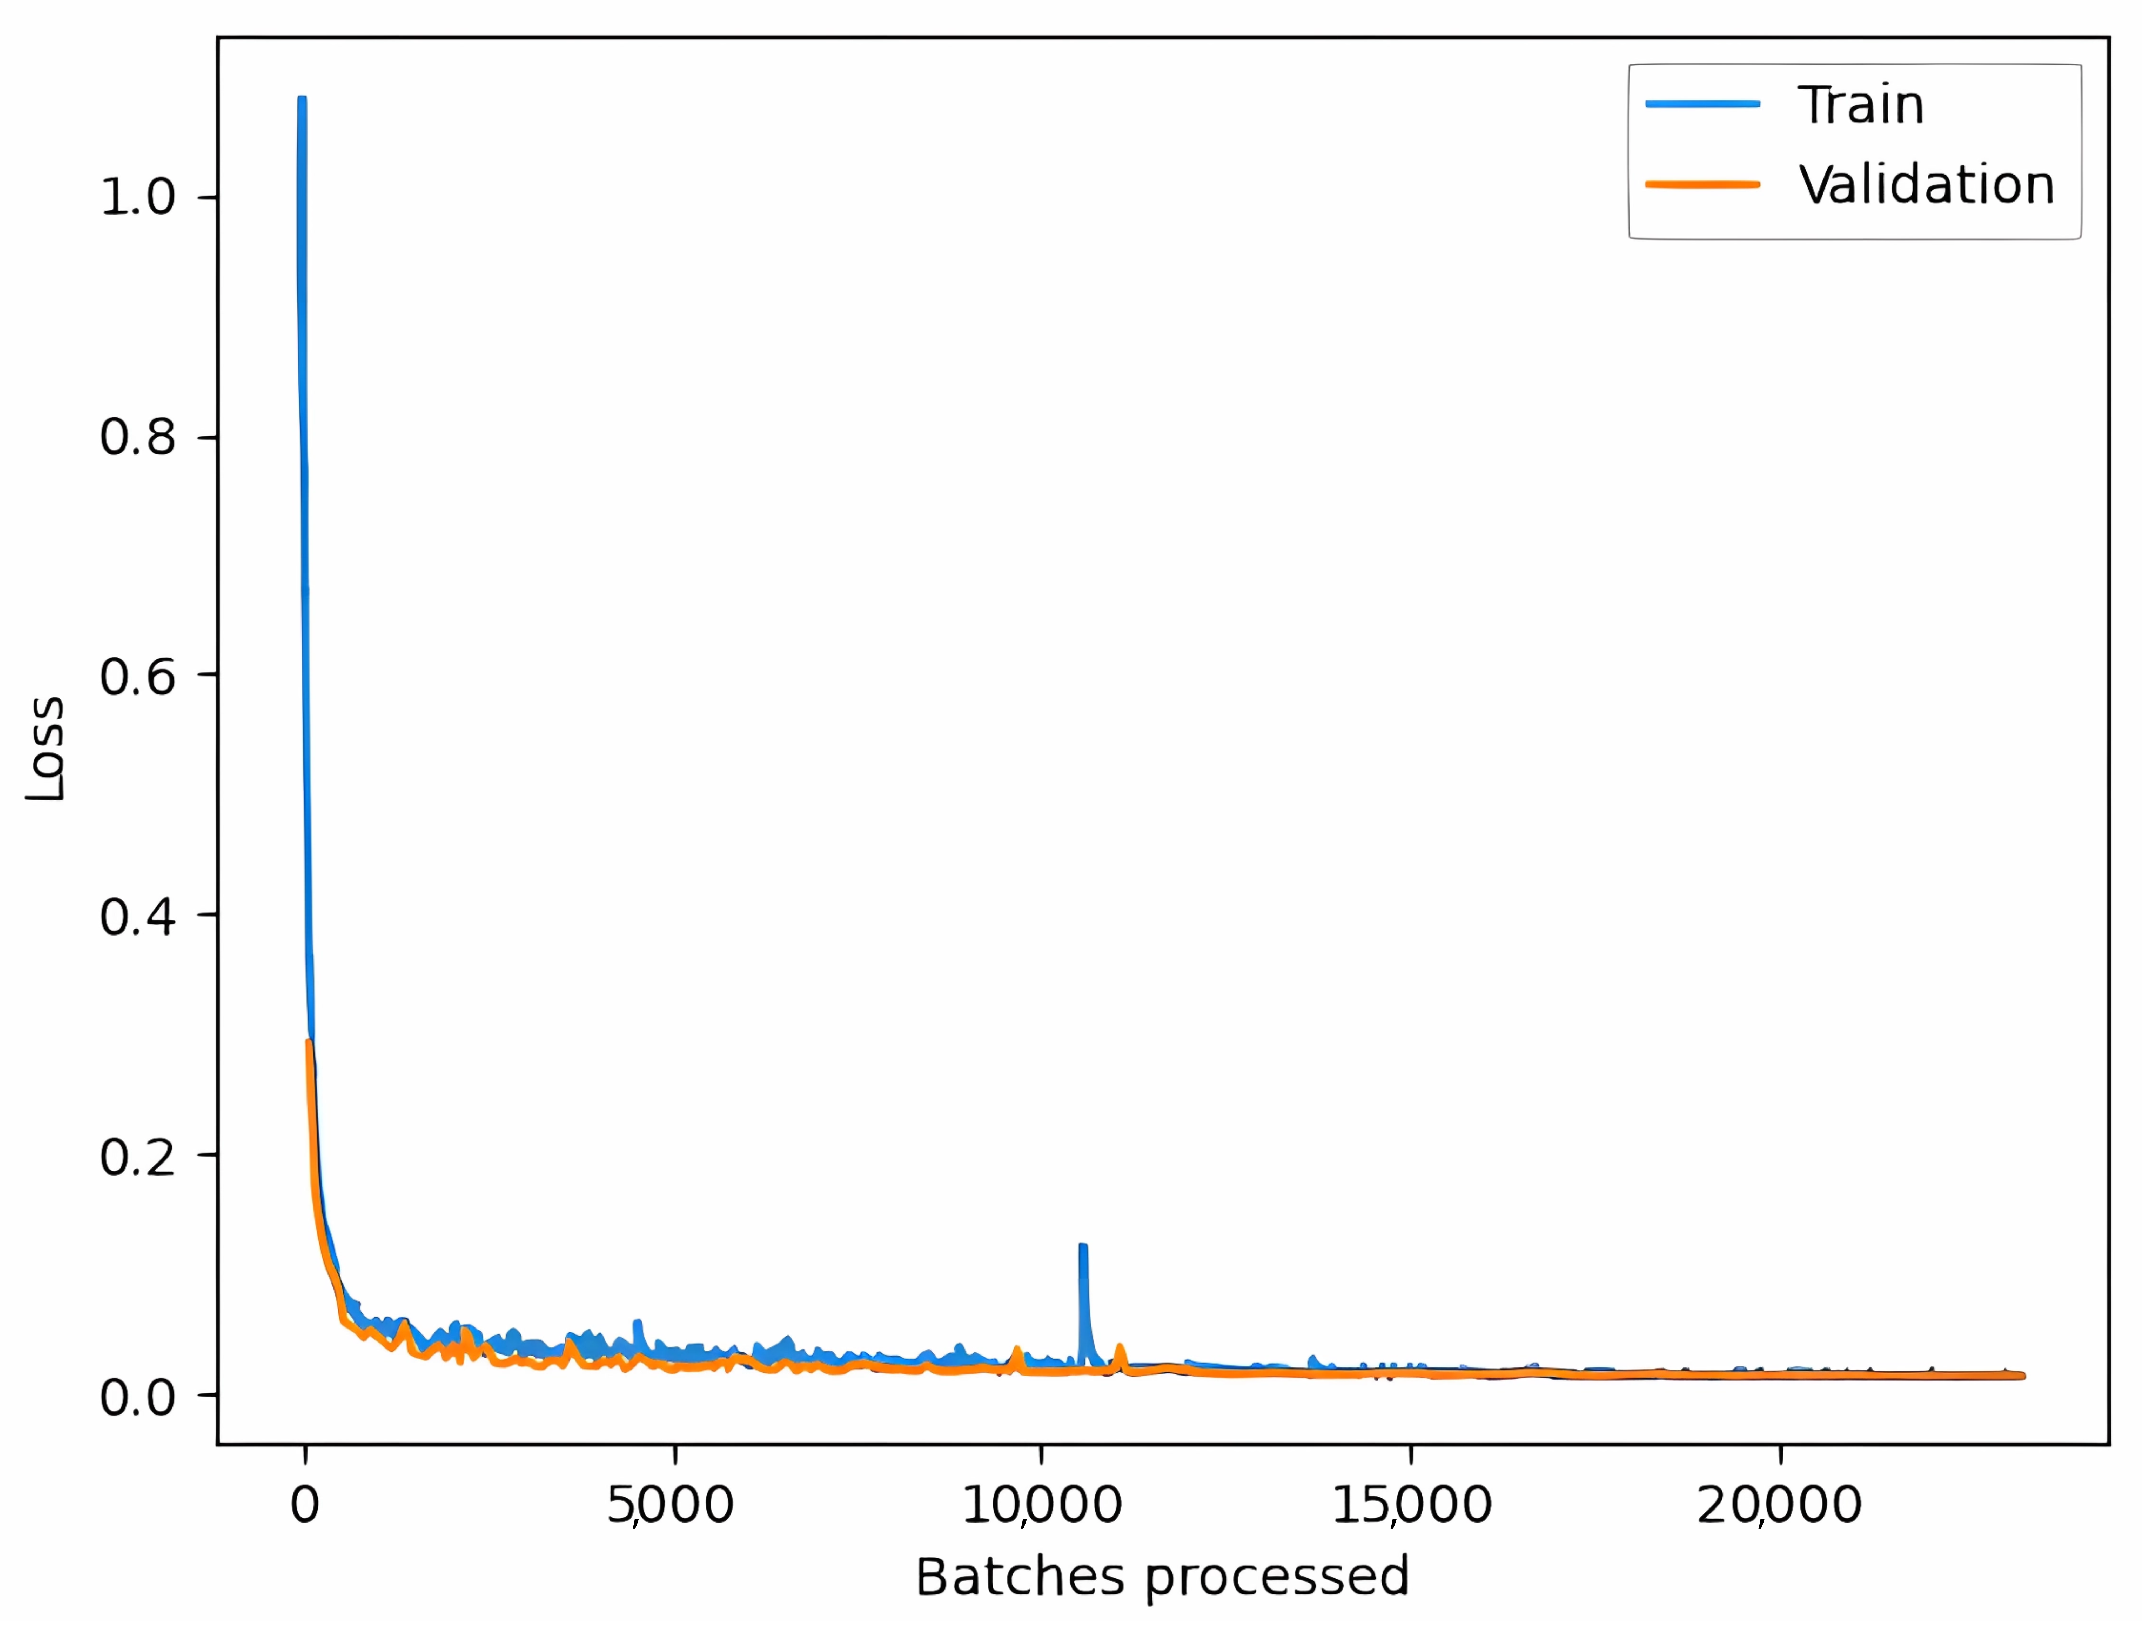
The graph illustrates the training and validation loss of a deep learning model that utilizes U-Net and ResNet backbones to categorize coal mining locations in remote sensing data. The Y-axis displays the loss, quantifying the discrepancy between predicted and actual values, while the X-axis indicates the number of batches processed during training. Initially, the training (blue line) and validation (orange line) losses are elevated, suggesting more prediction errors. As the training advances, both losses significantly decline, indicating that the model is acquiring knowledge and enhances its predictive capabilities.
Over time, the losses become stable and converge, indicating that the model has reached a stage when additional training does not substantially decrease the number of error. Intermittent increases in the validation loss can be detected, most likely caused by difficult data instances, although they do not substantially impact the general pattern. The close convergence of the training and the validation loss curves indicates that the model effectively applies its learned knowledge to new, unknown data, without the occurrence of any notable problems of overfitting or underfitting.
3.2. Deep Learning Result Comparison with Reference
The image shown in
Figure 10 presents a comparison of the classification outcomes of a deep learning model with the ground truth data produced from the visual interpretation of coal mining regions. The figure is shown in three columns, representing two specific regions as follows: Lokpaikat and South Tapin. The first column displays Sentinel-2 satellite images. The second column shows the results of the deep learning model’s classification. The third column presents the reference ground truth. The Sentinel-2 image comprehensively depicts the coal mining area in the Lokpaikat region. The deep learning model’s classification output accurately identifies mining regions, depicted in red, almost identical with the human-annotated reference map. The model’s output closely aligns with the ground truth, demonstrating effective performance, but some minor differences may exist.
As shown in
Table 3, the model’s classification performance further reinforces its accuracy, achieving high precision, recall, and F1-score values across both coal and non-coal classes. The coal class attained a precision of 0.953 and recall of 0.927, indicating that most of the predicted mining areas correctly correspond to actual mining sites, with minimal false positives and false negatives. Similarly, the non-coal class exhibited a precision of 0.987 and recall of 0.991, confirming the model’s reliability in distinguishing mining regions from the surrounding land cover. The high F1-scores of 0.940 for coal and 0.989 for non-coal indicate a balanced classification, minimizing misclassification errors. These quantitative results align with the visual assessments of the Sentinel-2 imagery, validating the model’s ability to consistently detect and classify mined areas with minimal discrepancies.
Similarly, the Sentinel-2 image reveals the presence of large coal mining operations in the South Tapin region. The deep learning model’s classification result corresponds closely with the manually assessed ground truth, accurately capturing the bulk of the mining locations. The discrepancies between the classification and the ground truth are negligible, indicating the model’s strong performance. The significant overlap between the classification and reference areas demonstrates a high rate of correctly identified positives and low rates of incorrectly identified positives and negatives, reinforcing the model’s correctness. To summarize, the visual evaluation confirms the efficiency of the deep learning algorithm in detecting coal mining regions in remote sensing images. The strong correspondence between the categorized and reference maps in both regions demonstrates the model’s capacity to extrapolate over diverse geographical areas, which is crucial for practical purposes in monitoring and controlling coal mining operations.
3.3. Quantitative Evaluation
The confusion matrix, as shown in
Table 4, displays the efficacy of the deep learning model created explicitly for the classification of coal mining regions in the Tapin area of Indonesia. True positives indicate the number of pixels correctly identified as coal mining sites. In contrast, true negatives refer to pixels reliably classified as non-coal areas. On the other hand, false positives refer to places that are not coal mines but are mistakenly classed as such, while false negatives are coal mining sites that are incorrectly labeled as non-coal ones.
The model’s overall accuracy is 97.4%, meaning that most of the pixels are accurately categorized. The model’s high accuracy indicates that it is well trained and proficient at differentiating between coal mining and non-coal areas. Furthermore, the user accuracy for the coal mining class is 90.7%. This confusion matrix indicates that the model correctly identifies a pixel as coal mining areas approximately 90.7% of the time. The user accuracy for the non-coal class is exceptionally high, reaching 98.8%, which indicates the model’s impressive ability to identify accurately locations that are not coal mining areas.
Producer accuracy, or recall, quantifies the model’s capacity to accurately detect all actual instances of a given class. In coal mining regions, the producer accuracy is 94%, signifying that the model effectively identifies 94% of the actual coal mining pixels. The producer accuracy for non-coal areas is 98%, indicating that the model is highly proficient in identifying non-coal pixels. The high recall values indicate that the model has a low rate of missing actual occurrences, which is crucial for applications that depend on a precise mapping of coal mining activities.
The Kappa statistic measures how well the models’ classifications match the actual data, with a value of 0.91, indicating strong agreement beyond what could be attributed to chance. This suggests that the model performs well and is reliable for monitoring and managing coal mining activities.
However, despite its high accuracy, some errors remain. A common issue is misclassifying vegetation, especially in reclaimed areas where young plants can look like natural forests. This can lead to reclaimed land being mistakenly labeled as untouched vegetation, affecting the accuracy of reclamation tracking. Similarly, bare soil or exposed land in mining areas can sometimes be confused with newly reclaimed sites, especially when relying only on spectral characteristics. To reduce these errors, additional techniques such as texture analysis or using topographic data could improve classification accuracy.
The confusion matrix results show that the model is effective in distinguishing coal mining areas. However, this method is still more practical and scalable than manual field surveys, making it useful for large-scale environmental monitoring. While it may not be as precise as direct field measurements, it serves as a helpful tool for tracking mining and reclamation activities, supporting environmental research and land management despite its limitations.
3.4. Annual Coal Mining Change and Reclamation
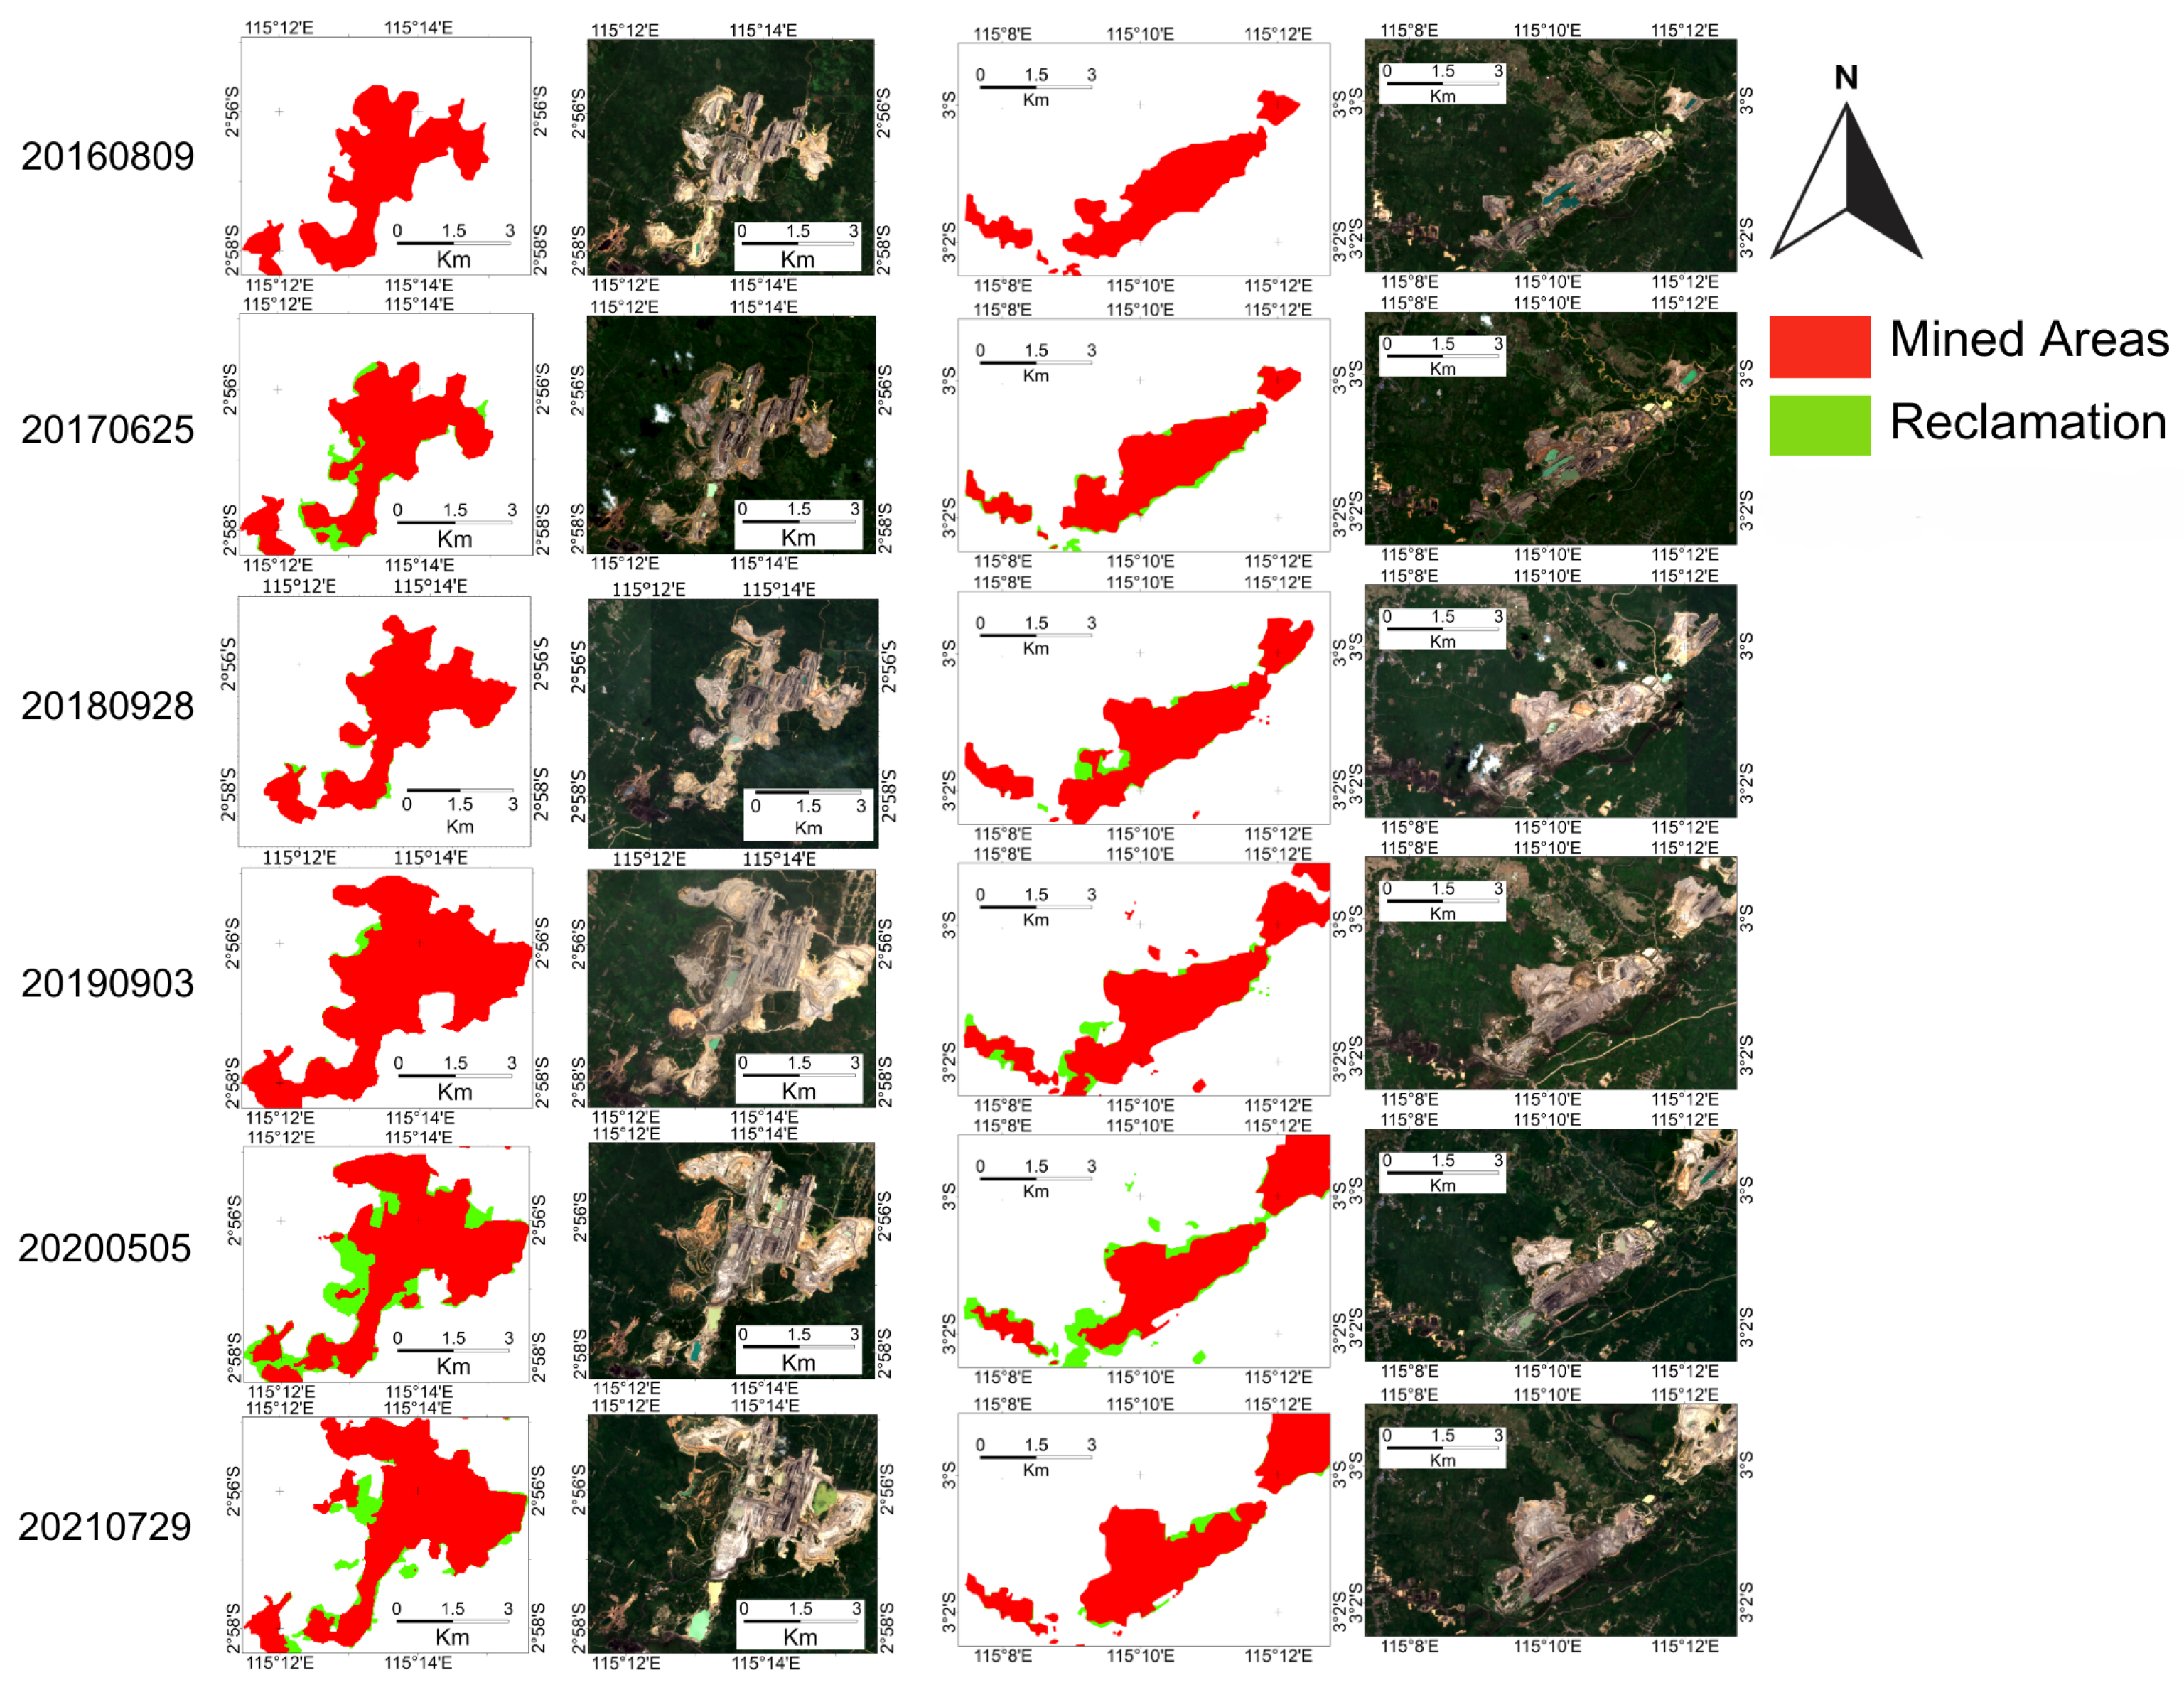
The role of annual coal mining change and reclamation, obtained by the use of a deep learning model on annual remote sensing imagery, are displayed in
Figure 11. The coal mining change and reclamation from 2016 to 2017 intensely depicts the early phases of coal mining operations in the Lokpaikat Coal Mining Area. In 2016, substantial red patches on the map indicated significant land disturbance, as confirmed by the RGB composite images that reveal large portions of the terrain impacted by mining activities. By 2017, the expansion of the mining regions continued; however, the rate of the increase was minimal compared to the first data. In addition, discernible reclamation initiatives started to arise, manifesting as sparse vegetation within the mining areas. These initial reclamation works, however limited, indicate the early efforts to alleviate the environmental consequences of coal mining. In 2018 and 2019, there was a noticeable increase in the intensity of coal mining activities. The red-marked areas showed substantial expansion, particularly in 2019, suggesting a surge in mining activities. Simultaneously, a discernible surge in reclamation endeavors resulted in additional verdant spaces within the extensively excavated regions. Nevertheless, despite this rise, the magnitude of reclamation endeavors remained relatively limited compared to the extensive scope of mining operations. The RGB composite images for these years clearly emphasize the noticeable difference between the extensively disrupted mining sites and the developing reclamation zones.
By 2020, the growth of coal mining activities had reached a stable point, as indicated by the areas outlined in red, which show no significant rise compared to the previous year. On the contrary, reclamation activities were expanding, resulting in additional green spaces in the previously mined areas, which signifies a heightened focus on restoring the land. In 2021, although coal mining continued to be widespread, the ongoing reclamation efforts indicated significant advancements, indicating a more equitable strategy for mitigating the impacts of mining. The RGB composite images for 2020 and 2021 depict disrupted and partially restored fields, highlighting the continuous efforts to rehabilitate mined areas and alleviate environmental harm.
3.5. Coal Mining and Reclamation Change Analysis
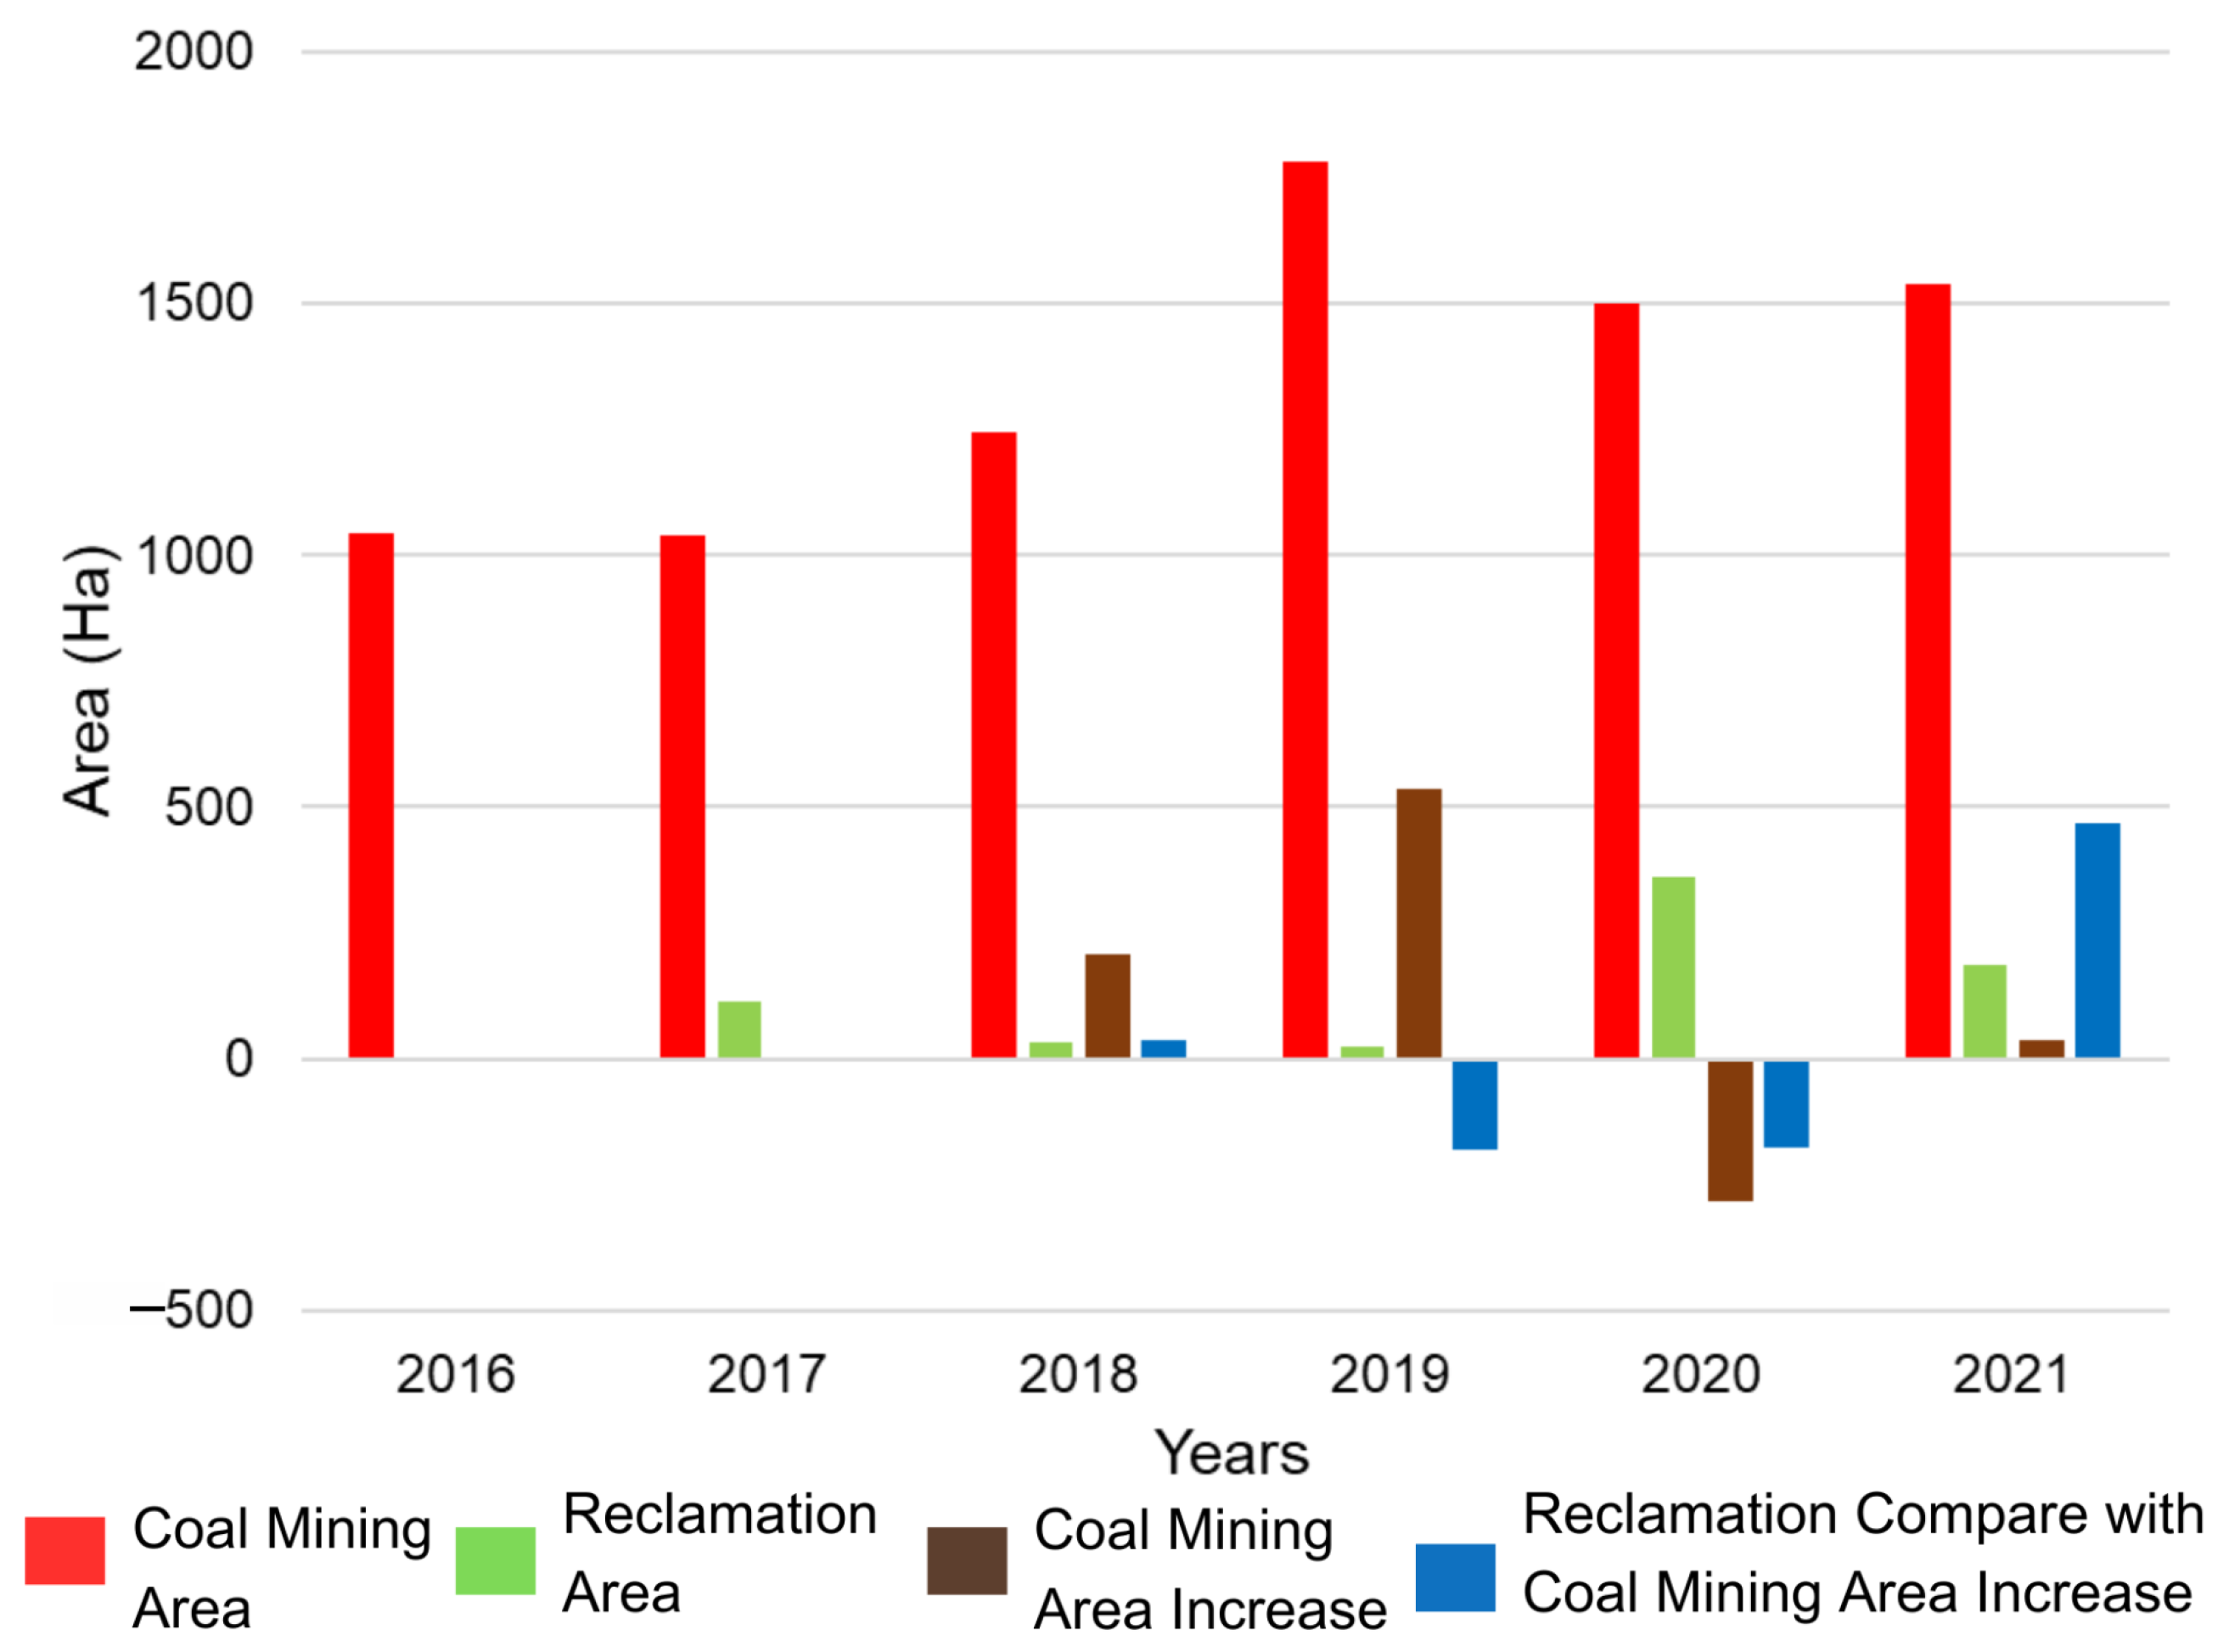
The statistics illustrated in
Figure 12 provide an overview of the coal mining and reclamation operations in the Lokpaikat Coal Mining Area between 2016 and 2021. They illustrate the variations and patterns in these activities across the years. The data table has columns that display the total extent of mined areas, reclamation areas, the year-on-year increase in mined areas, and the comparison between reclamation areas and the increase in mined areas.
In 2016, the coal mining area in Lokpaikat spanned 1046 hectares. However, more information should be given regarding reclamation efforts or comparisons with previous years. In 2017, the coal mining area decreased slightly to 1039 hectares, 6 hectares less than the previous year. Notwithstanding this decline, the reclamation area measured 113 hectares, demonstrating a steady restoration of mined land, even as the mining area diminished.
In 2018, there was a notable surge in mining operations, resulting in a 207-hectare expansion of the coal mining area, bringing the total to 1246 hectares. Despite this, reclamation operations were limited, encompassing a mere 31 hectares. As a result, there was a deficit of 37 hectares in reclamation efforts compared to the growth of mining areas, indicating that the expansion of mining activities was outpacing the efforts to restore the land.
In 2019, the coal mining area experienced a significant growth of 538 hectares, resulting in 1784 hectares. Nevertheless, the reclamation showed a further decline, reaching a mere 26 hectares, which led to a substantial deficit of 181 hectares compared to the expansion of mining areas. This disparity underscores the increasing divergence between the expansion of mining activities and the measures taken to restore and rehabilitate the affected area.
In 2020, there was a significant decline in the coal mining area, which decreased by 282 hectares to 1501 hectares. Although mining activities decreased, reclamation efforts increased significantly to cover an area of 360 hectares. This coal mining activity on Lokpaikat signifies an active and forward-thinking commitment to restoring the land.
By 2021, the coal mining area experienced a marginal rise of 39 hectares, reaching a cumulative total of 1540 hectares. The reclamation works were extensive, encompassing 187 hectares, surpassing the expansion of mining sites by 470 hectares. The substantial surplus demonstrates a firm dedication to restoring the land, exceeding the requirements caused by mining operations and potentially rectifying some of the prior deficiencies.
The data from the Lokpaikat Coal Mining Area shows a pattern of coal mining activity that fluctuates, with different levels of attempts made towards reclamation. Although there were specific years where reclamation efforts fell behind the pace of mining expansion, the current trend suggests a favorable change towards more assertive and preemptive land rehabilitation. In recent years, there has been a noticeable rise in the understanding and dedication to reducing the environmental impact of coal mining in Lokpaikat.
A detailed summary of coal mining and reclamation activities in South Tapin from 2016 to 2021 is displayed in
Figure 13. This study emphasizes the variations and patterns in both industries across the years. In 2016, the coal mining area covered 890 hectares, but unfortunately, we have no reclamation information for this year. In 2017, the coal mining area expanded to 913 hectares, representing a 22-hectare increase compared to the previous year. As a counter to this, there was, in 2017, a reclamation effort of 79 hectares. In 2018, there was a substantial increase in coal mining operations, resulting in the expansion of the area by 186 hectares to a total of 1098 hectares. However, reclamation efforts marginally fell to 71 hectares. That year’s reclamation area was 48 hectares less than the expansion of the mining area, suggesting a delay in reclamation efforts.
In 2019, the coal mining area expanded to 1372 hectares, which represents a growth of 273 hectares. Additionally, reclamation activities climbed to 101 hectares. Nevertheless, the reclaimed area was 85 hectares smaller than the new mining area, underscoring a significant disparity. In 2020, there was an unusual occurrence where the coal mining area decreased by 184 hectares, resulting in a total area of 1188 hectares. Notably, during this time, there was a significant increase in reclamation efforts, with 283 hectares reclaimed. That was 10 hectares more than the preceding increase.
In 2021, the coal mining area expanded to 1396 hectares, representing a growth of 208 hectares compared to the previous year. The reclamation efforts decreased to 61 hectares, but the comparative data indicated a substantial surplus of 245 hectares. This phenomenon suggests that the reclamation efforts finally matched and even exceeded the growth in mining activity. In summary, the analysis demonstrates a consistent pattern of rising coal mining operations in South Tapin, occasionally interrupted by different attempts at reclamation. Although there were some years of slower progress, the overall data indicate a focused endeavor to reduce the environmental consequences of coal mining by intensifying reclamation efforts, especially in recent years.
5. Conclusions
This study utilizes remote sensing techniques with Sentinel-2 imagery to monitor coal mining activities and reclamation efforts in Tapin Regency, Indonesia. Deep learning is used as a classification tool to distinguish between mining and non-mining areas over time. Sentinel-2 data provide frequent and wide-area coverage at no cost, but their moderate spatial resolution limits the detection of small-scale land cover changes. Additionally, deep learning models require a large amount of labeled data and computational resources, which can increase processing time and complexity. Compared to UAV-based monitoring, which offers higher spatial detail, satellite-based methods are more suitable for large-scale analysis but may not capture finer disturbances. Despite these limitations, this approach remains a practical and scalable option for assessing land use changes in mining areas to support environmental management and reclamation planning.
The deep learning model achieved an overall accuracy of 97.4% and a Kappa value of 0.91, which aligns with expectations for a binary classification task distinguishing mining and non-mining areas. These results suggest that the model performs reliably in identifying land cover changes associated with mining activities and reclamation efforts. While the approach provides a practical means for monitoring surface mining dynamics, its effectiveness remains dependent on the quality of training data, spatial resolution, and the temporal availability of satellite imagery.
An analysis of the annual changes in coal mining and reclamation areas from 2016 to 2021 revealed significant trends in land use dynamics in Lokpaikat. The data indicate a clear pattern of fluctuating coal mining expansion, with notable peaks during certain periods, reflecting intensified mining activities. However, a promising shift was observed in reclamation efforts, which progressively increased over time. By the latter years of the study, reclamation activities not only caught up with but also surpassed the rate of mining expansion, demonstrating a growing commitment to environmental restoration. This trend highlights a positive transition toward sustainable land management, where the focus on mitigating environmental impacts and restoring mined lands has become increasingly prioritized, aligning with broader goals of ecological balance and sustainable development. While the primary focus of the study is on the total area of reclamation, future work may explore the quality of these reclaimed areas and their broader environmental and economic impacts. The deep learning approach presented here offers a practical tool for government and industry stakeholders to remotely monitor and assess coal mining activities, supporting compliance with reclamation requirements, while also providing researchers with spatial data for land use analysis and offering mining industries a consistent method for tracking reclamation progress.
Mining regulations require companies to conduct land reclamation after extraction, with capital guarantees allocated to ensure compliance. These guarantees are returned once the reclamation process meets the environmental standards based on the periodic assessments. Currently, monitoring relies on company reports and environmental impact assessments, supplemented by occasional field inspections. However, on-site verification requires significant resources, making frequent inspections challenging. As an alternative, independent mapping using satellite imagery provides a scalable and cost-effective approach to track reclamation progress while increasing data availability for researchers and the public. This study shows that reclamation efforts increased in 2020, following a surge in mining activity in 2019, demonstrating how satellite-based monitoring can support long-term observations of land recovery.
For researchers, this method offers access to large-scale reclamation data with sufficient resolution for land use studies, providing an alternative for when government spatial data are limited or unavailable. The ability to analyze multitemporal satellite imagery allows for broader assessments of reclamation patterns and land cover changes over time. While ground truth data remain essential for validation, deep learning models trained on satellite imagery can assist in large-scale assessments by reducing reliance on manual classification. This approach broadens the scope for environmental studies, allowing for the further examination of reclamation progress and land cover transitions.
For the mining industry, UAV-based monitoring and aerial photography are commonly used due to their high spatial resolution. However, these methods depend on scheduled data collection, meaning that past conditions cannot be reviewed if the imagery was not captured at the right time. In contrast, satellite-based monitoring ensures regular data collection, enabling consistent observations. The deep learning model developed in this study facilitates automated monitoring, reducing the need for repeated manual digitization. This approach can be considered a supplementary tool for mining companies in managing post-mining land use and overseeing reclamation activities.
Extending the monitoring period and integrating additional data sources could enhance the effectiveness of this methodology. Such advancements would provide a more comprehensive framework for the sustainable management of coal mining regions, supporting long-term ecological and economic stability. To further refine reclamation monitoring, future work could focus on differentiating specific mining components, such as topsoil, subsoil, and orebody, which are crucial in the reclamation process. Topsoil refers to the uppermost layer of soil that contains essential nutrients and organic matter, playing a key role in vegetation regrowth. Subsoil, located under topsoil, has lower organic content but contributes to soil structure and drainage. Orebody consists of the mineral deposit being extracted, and its removal creates voids that require rehabilitation. Distinguishing between these components using remote sensing could improve land restoration assessments by identifying areas where topsoil replacement is inadequate or where subsoil conditions may hinder revegetation.
Additionally, testing alternative deep learning architectures for satellite image classification, such as Transformer-based models or hybrid CNN-RNN architectures, could enhance feature extraction and classification accuracy. Transformer models, which have demonstrated strong performance in spatial and temporal feature learning, may be particularly beneficial for capturing multitemporal variations in mining and reclamation areas. Exploring such approaches could provide a more detailed and reliable assessment of land recovery, aiding policymakers, environmental agencies, and industry stakeholders in making informed decisions. The dataset used for this study is available at GitHub 3.16
https://github.com/koni01/koni.github.io (accessed on 18 March 2025), for further exploration and implementation.


