Article

The Spatial Distribution and Transition of Meteorological and Ecological Droughts in the Shendong Mining Area

School of Surveying and Land Information Engineering, Henan Polytechnic University, Jiaozuo 454000, China
*
Author to whom correspondence should be addressed.
Remote Sens. 2025, 17(6), 1064; https://doi.org/10.3390/rs17061064
Submission received: 10 February 2025 / Revised: 9 March 2025 / Accepted: 15 March 2025 / Published: 18 March 2025

Abstract

:
Arid and semi-arid regions are highly sensitive and vulnerable to climate change and human activities. Clarifying their spatial distribution is of great significance for understanding regional drought dynamics. This research examines the Shendong mining region, employing time series data of vegetation growth anomalies derived from total primary productivity data to delineate ecological drought. The SPI dataset, representing meteorological drought, is utilized to identify drought frequency, duration, and intensity for both types of droughts based on the run theory. The drought characteristics of different land use patterns are analyzed, and the center of gravity of meteorological and ecological droughts in the study area are calculated. The results show the following: (1) The frequency, duration, and intensity of meteorological drought in the Shendong mining area are 0.74 times per year, 9.2 months, and 0.91, respectively. The frequency, duration, and intensity of ecological drought are 0.33 times per year, 18.2 months, and 0.09, respectively. (2) The intensity of meteorological and ecological droughts is generally consistent across different land use types. The frequency of meteorological drought is minimal for croplands and high-coverage grasslands. The duration of meteorological drought is shortest for high-coverage grasslands. High- and medium-to-high-coverage grasslands and cultivated lands have lower ecological drought frequencies. Low- and medium-to-low-coverage grasslands have relatively shorter ecological drought durations. (3) In regions where land use alterations are evident, the frequency and duration of meteorological drought in areas where cropland has been converted to grassland are relatively low. The frequency, duration, and intensity of ecological drought for croplands converted to grasslands and grasslands converted to croplands are similar. (4) The average incidence of meteorological drought transitioning into ecological drought in the study area is roughly 55%, with areas of stable land use demonstrating a more robust correlation between meteorological and ecological drought in croplands. In the converted areas, the correlation between meteorological drought and ecological drought is higher for croplands converted to grasslands. (5) The transition frequency from meteorological drought to ecological drought exceeds 60% in mining areas. Compared to other mining areas, the meteorological drought intensity near Jitu well and Daliuta well is notably higher. The research findings reveal the spatial distribution attributes and transition dynamics of meteorological and ecological droughts in the Shendong coal mining region, providing reference for the implementation of ecological restoration projects and protection measures in the area.

1. Introduction

At present, global climate change is posing unprecedented challenges. As global climate change intensifies, drought, a significant natural disaster, has garnered considerable attention from experts both domestically and internationally [1,2]. Drought not only has a significant impact on agricultural production, but also may lead to ecological degradation, water shortages, and a series of environmental and social problems. Generally, drought can be divided into meteorological drought, agricultural drought, hydrological drought, socioeconomic drought, and other types according to their characteristics and impacts [3]. Among them, ecological drought is an emerging research hotspot. By examining the spatiotemporal characteristics of ecological drought and the transition mechanisms from meteorological to ecological drought, we can more effectively delineate and describe the regional vegetation growth patterns and the overall status of drought in the area.
Meteorological drought is the basis for the formation and development of other drought types [4]. It explains the formation of drought from a macro perspective, often focusing on the meteorological drought caused by global warming [5], abnormal atmospheric circulation [6], thermal anomalies [7], and aerosols [8]. Meteorological drought is defined by the meteorological drought index, which typically comprises single-factor and multi-factor assessments, with precipitation being the primary determinant influencing drought conditions. The single-factor drought index only considers precipitation, such as the Munger drought index [9], Standardized Precipitation Index (SPI) [10,11], positive and negative anomaly drought index [12], etc. These single-factor indices are relatively easy to calculate. However, meteorological drought indices that only consider a single factor have many limitations in the practical application processes. The multi-factor meteorological drought index accounts for the primary determinant of drought (precipitation) as well as the effects of additional variables including temperature, evaporation, and antecedent precipitation. This category includes the Palmer Drought Severity Index (PDSI) [13], Meteorological Comprehensive Drought Index (MCI) [14], and Standardized Precipitation Evapotranspiration Index (SPEI) [15]. Among them, the Standardized Precipitation Evapotranspiration Index (SPEI) is the most widely used [16]. Researchers have fully studied the spatiotemporal evolution characteristics of drought by using different meteorological drought indices, and many studies have revealed the changing trend of drought in the Yellow River Basin, providing certain references for drought prevention and control in the area [17,18,19]. Nonetheless, the meteorological drought index’s response to vegetation drought conditions is slow, failing to accurately represent the internal mechanisms of drought. Additionally, its depiction of precipitation changes is limited, as it does not adequately consider evaporation and underlying surface conditions. The use of the meteorological drought index alone is not enough to fully explain the regional drought situation.
Ecological drought was first proposed by the Ecological Drought Working Group, which was established by the American People and Nature Cooperation Organization (SNAPP). It is defined as “the development and change of hydrometeorological conditions caused by the periodic water supply shortage caused by natural or human management, so that the vegetation under water stress constitutes a xerophytic environment in the soil environment in which it lives”. It is a complex process that feeds back into other systems [20]. Abnormal air circulation and water vapor transfer can result in significantly less precipitation in a certain region, potentially leading to meteorological drought. Meteorological drought spreads down the disaster chain. Through the exchange of water and energy between the land and the atmosphere, soil moisture and heat flux change and soil moisture is insufficient, causing vegetation to suffer physiological drought. Prolonged drought will result in ecological drought of vegetation, degradation of plant life, alterations in vegetation structure and function, and effects on the water cycle, carbon cycle, photosynthesis, and cellular respiration [21,22]. Human activities have an impact on natural systems, causing land cover change, changing land–water vapor coupling processes, altering the global hydrothermal cycle, and amplifying extreme weather and climate events. At present, ecological drought research is mostly divided into micro and macro perspectives. Most micro-ecological drought studies are based on experiments, aiming at the response of specific vegetation communities to drought [23]. Most macro-ecological drought studies are based on drought indices [24] such as the Normalized Difference Vegetation Index (NDVI) [25], Enhanced Vegetation Index (EVI) [26], Temperature Vegetation Drought Index (TVDI) [27], and so on. From the macro perspective, remote sensing is used to carry out research, which is more convenient to obtain data and has a wider research scope.
Researchers have found that there is a certain conduction effect between different drought types. Meteorological drought often has a certain impact on hydrological drought and ecological drought. Eltahir et al. used drought propagation to explain the asymmetric response of groundwater content to drought in the study area when monitoring drought signals that change over time in the whole hydrological cycle of Illinois, USA. He was the first to define the progression from meteorological drought to hydrological drought as “drought propagation” [28]. In 2003, Peters continued to use drought propagation on the basis of previous studies to describe the transformation of drought in groundwater circulation systems [29]. Subsequently, this definition has been widely recognized and quoted by the academic community [30]. Over the past two decades, the transition from meteorological droughts to hydrological or agricultural droughts has emerged as a focal point of research, leading to the development of numerous analytical tools for studying this phenomenon. There are two main categories of these methods: the first is the hydrological model or crop model method based on the transition process of drought events; the second is the statistical method based on the characteristics of drought events. Among them, the hydrological model/crop model method can effectively reflect the transition process of drought and reveal the transition mechanism. Mishra et al. used the crop simulation model (CSM) to assess the impact of different meteorological drought events on agricultural drought in Storey County, Iowa, USA [31]. Due to the large number of parameter-tuning processes involved in model training, these methods are difficult to be applied to large spatiotemporal scales. In contrast, statistical methods, which do not need to set boundary conditions and are not limited by the scope of time and space, are the main methods in drought transition research. These include the cross-wavelet method [32], the multi-variate joint distribution method [33], Granger causality analysis [34], correlation analysis [35], etc. Currently, the research of drought event transition predominantly employs statistical approaches grounded in run recognition theory, utilizing the time series of the mean drought index for the study area or its subdivisions. This method efficiently accounts for the linkage of various drought events throughout time and accurately illustrates the transition characteristics and interrelation of distinct drought types.
However, there are still few spatial studies on the mechanism of meteorological drought driving ecological drought, and it is difficult to reveal the response relationship between ecological and meteorological droughts. At the same time, the response of the vegetation ecosystem in typical mining areas to ecological drought driven by meteorological drought is also insufficient. The mining history of the Shendong mining area dates back to the 1920s, with significant expansion commencing in 1985. Since the onset of this century, the Shendong mining area’s urbanization has accelerated significantly due to extensive coal mining activities, resulting in a rapid expansion of industrial and mining land. After 2013, coal mining and ecological restoration work in the Shendong mining area began to advance simultaneously. The Shendong mining area has limited surface cover and a singular variety, making it a critical focus for national oversight over soil erosion and ecological management. Due to the delicate ecological context, urban development, and coal industry operations, the Shendong mining area has the dual problem of safeguarding national energy security while preserving the ecological environment [36]. To enhance the presentation of the research findings, this study encompasses counties and cities adjacent to the Shendong mining area, covering an area over 3500 km2, thereby maximizing the acquisition of research data. Combined with the development history of the Shendong mining area, this paper aims to examine the temporal and spatial distribution characteristics of meteorological and ecological drought events in the Shendong mining area from 2001 to 2020, and explore the fundamental characteristics and influencing factors of the transition process from meteorological to ecological drought, to inform ecological restoration efforts in the region.

2. Materials and Methods
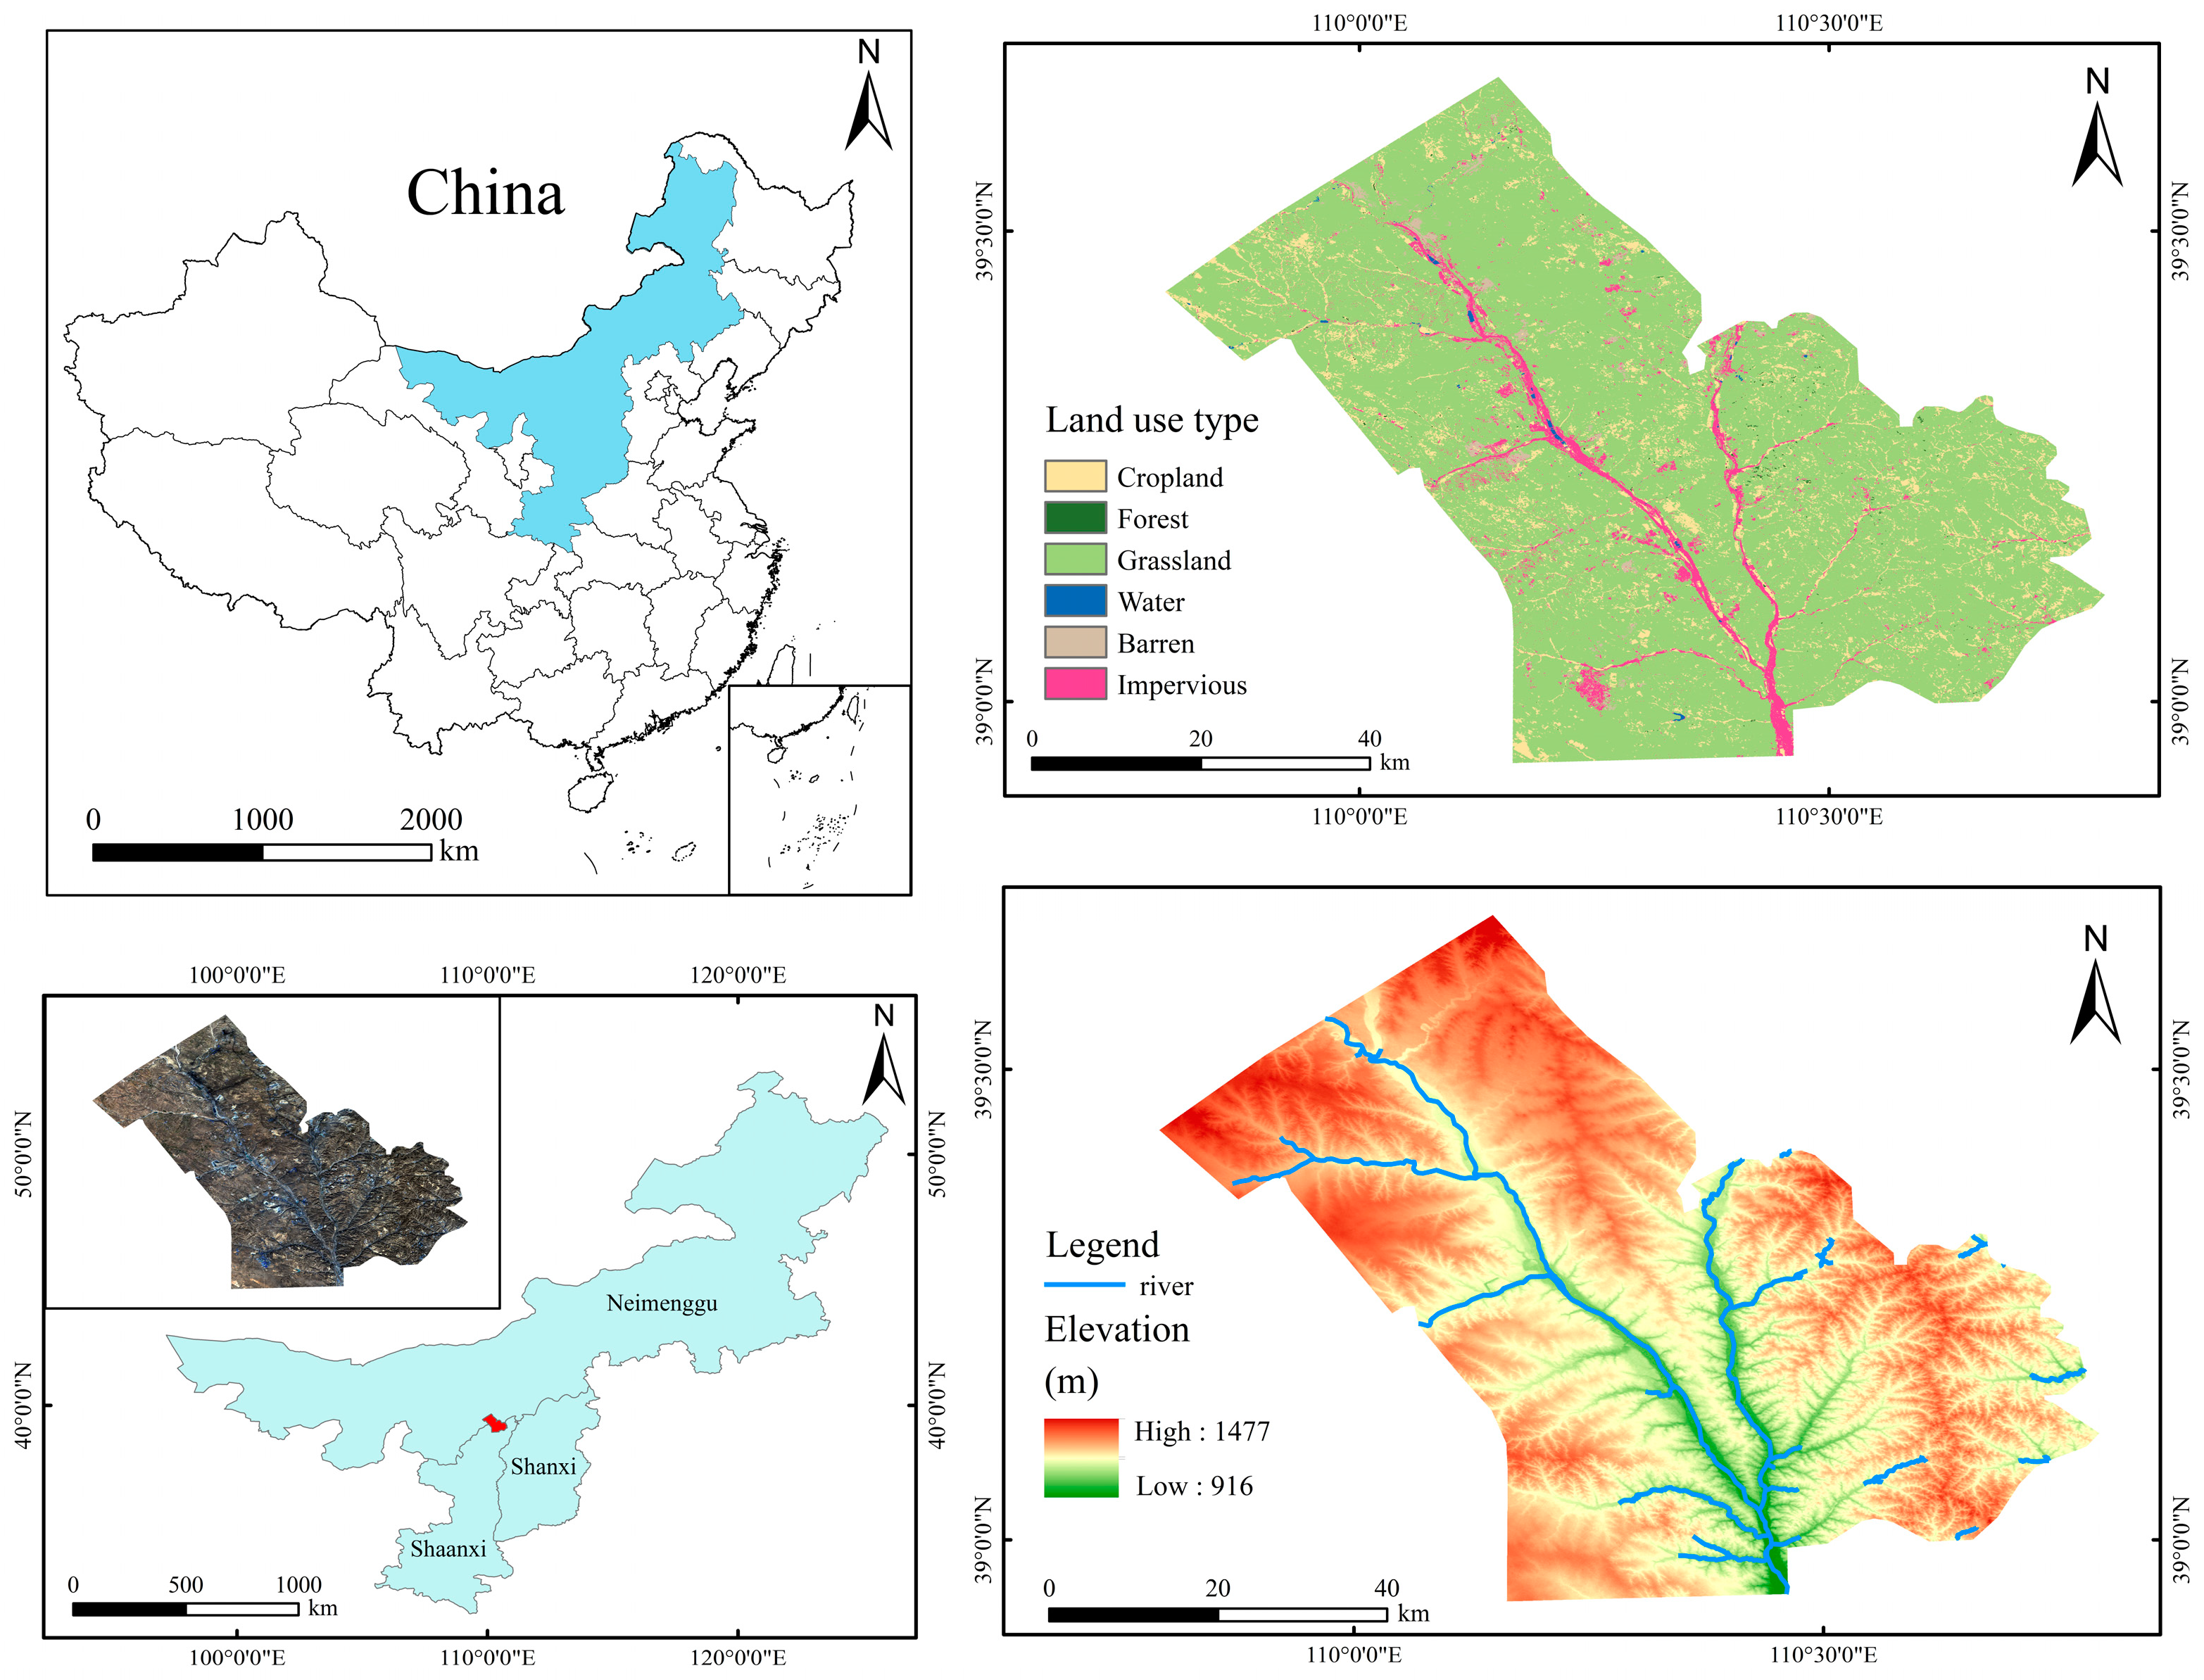
2.1. Study Area

As shown in Figure 1, the Shendong mining area is located at the junction of northern Yulin City of Shaanxi Province and southeastern Ordos City of the Inner Mongolia Autonomous Region, in the transition zone of the Loess Plateau and Ordos Plateau, belonging to the Wulan Mulun River Basin of the Yellow River system [37]. The study area covers about 3539 km2 and mainly includes Shenmu City, Fugu County, and Yijin Horuo Banner. It is located between 38°52′ and 39°41′N, 109°51′ and 110°46′E, about 916–1477 m above sea level, and belongs to the temperate semi-arid continental climate. This region is defined by an average annual temperature of 6.6 °C, arid conditions, and minimal rainfall, with an average annual precipitation ranging from 300 to 400 mm, predominantly occurring from June to September each year. The growing season for vegetation is brief, the dormant phase is extended, and the coverage rate is minimal. The main species include Salix cheilophila, Artemisia desertorum Spreng, and Mongolian pine. The main soil types are loess and chestnut soil. To the east and northeast of the mining area are the Loess Hills and mountainous areas, with gullies and ridges forming three landforms: ridges, gullies, and tablelands with active erosion and serious soil loss. Psammophytes and pioneering plant communities such as Artemisia ordosica Krasch are distributed on the flowing, semi-fixed and fixed sandy land in the west and southwest and on sandy vegetation. Moisture-loving plants are distributed around the depressions, beaches, and lakes. As of 2020, the Shendong mining region has established a production framework of 10 million tons, concentrated around 14 mines including Daliuta, Halagou, Yujialiang, and Buertai, yielding a coal output of 200 million tons. This makes the Shendong mining area the largest coal production base in China and even the world [38].

2.2. Data Sources

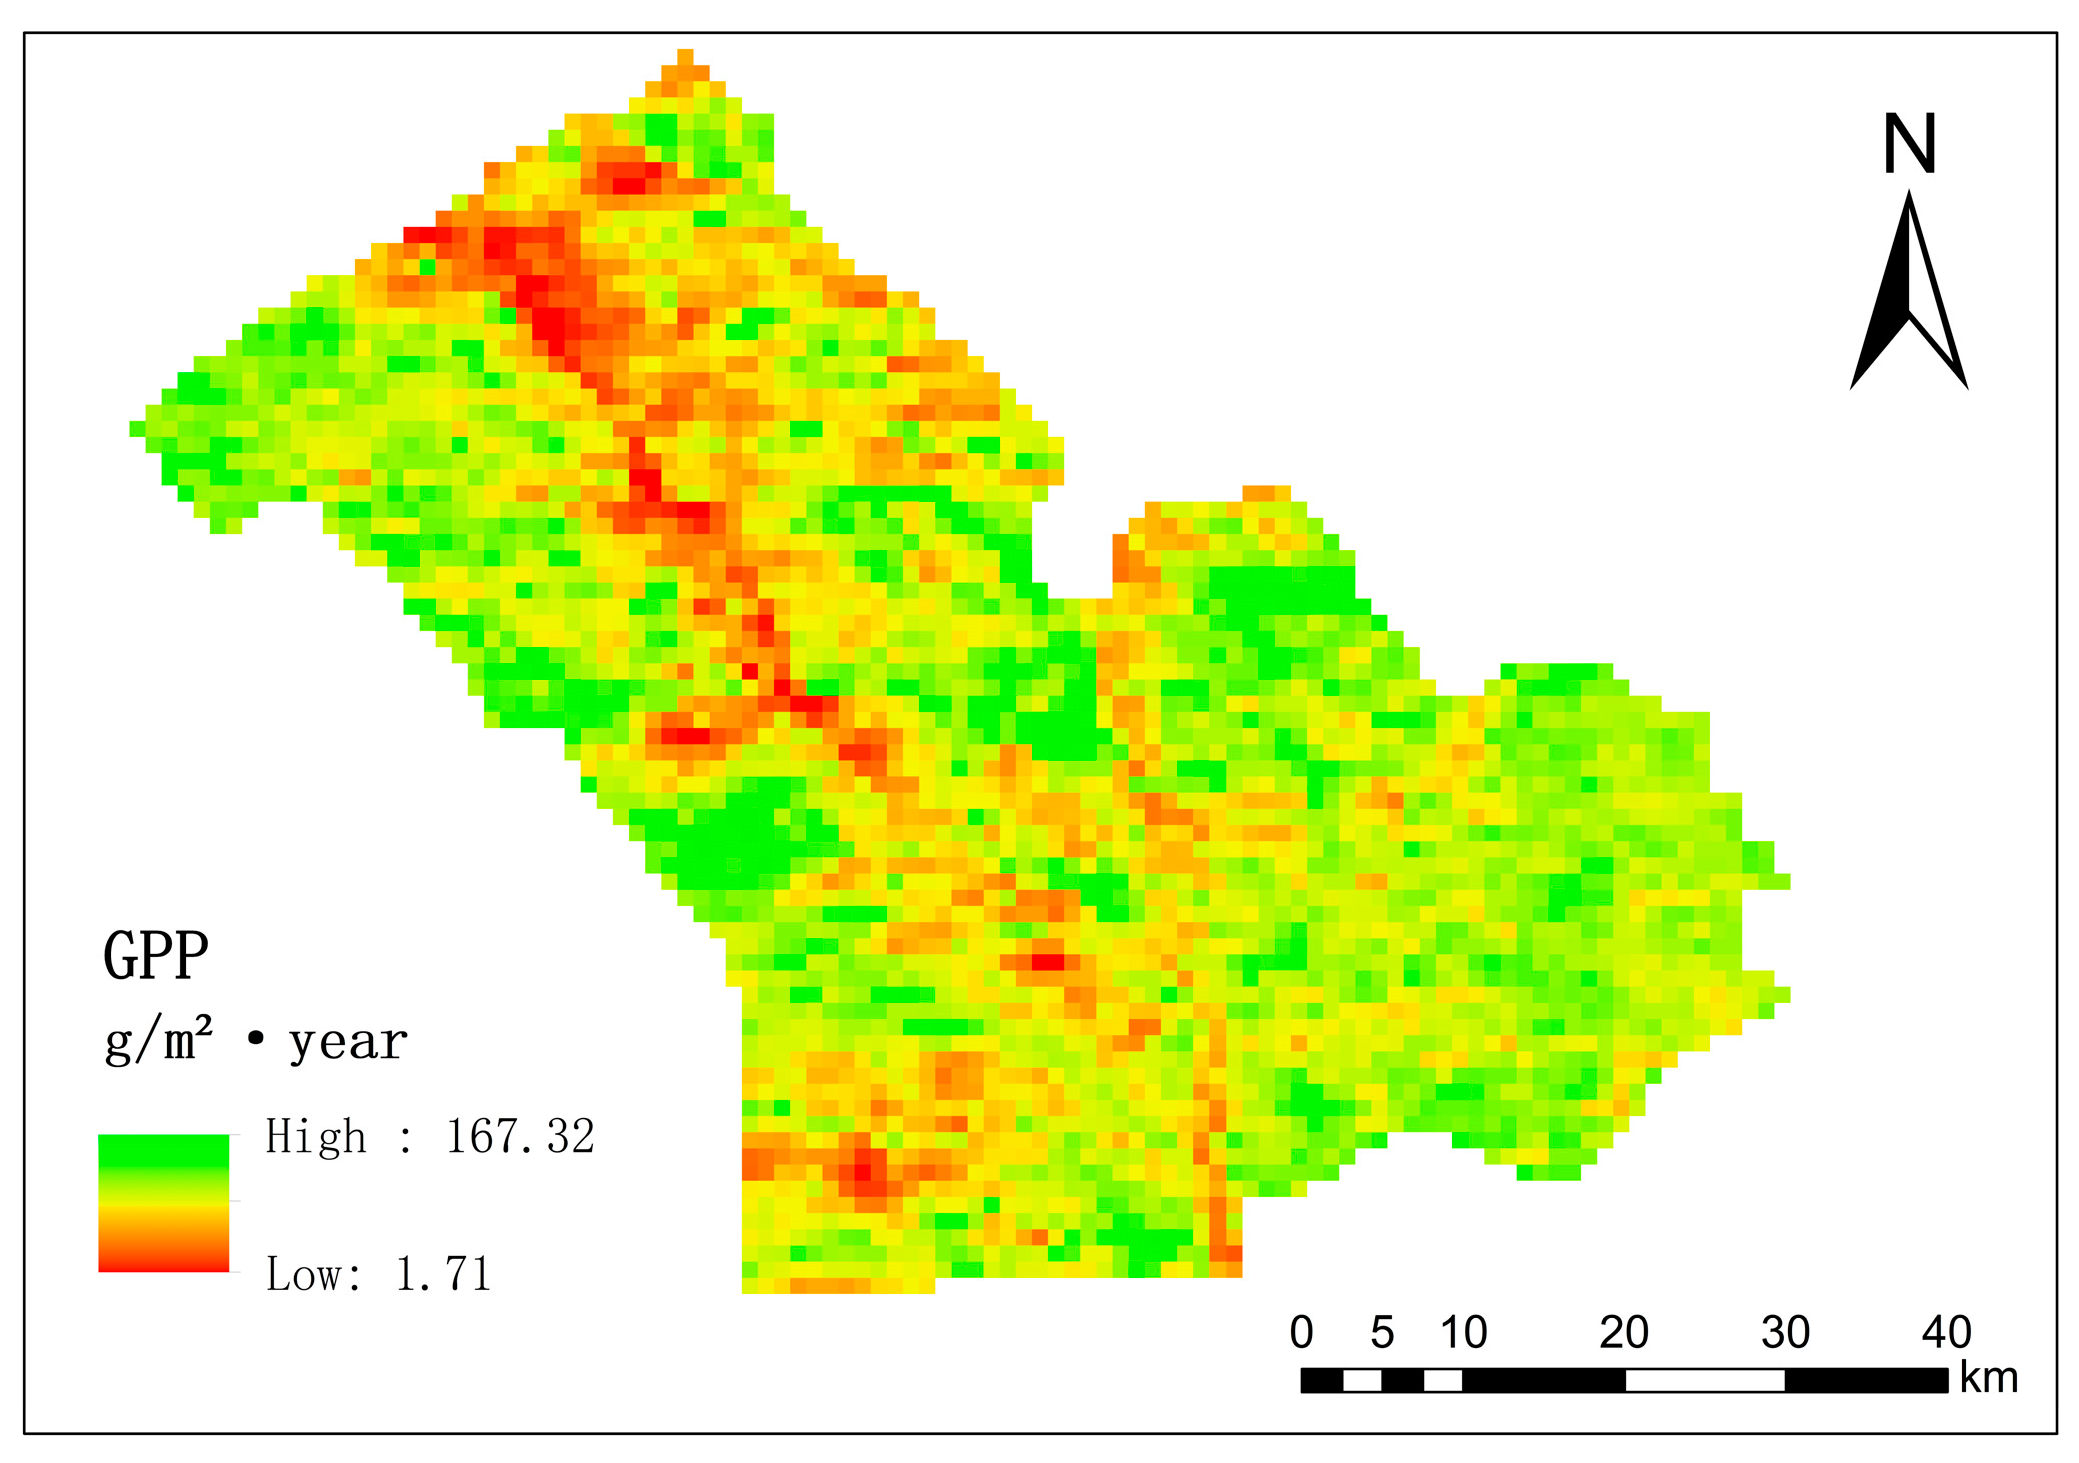
2.2.1. Gross Primary Production (GPP) Data
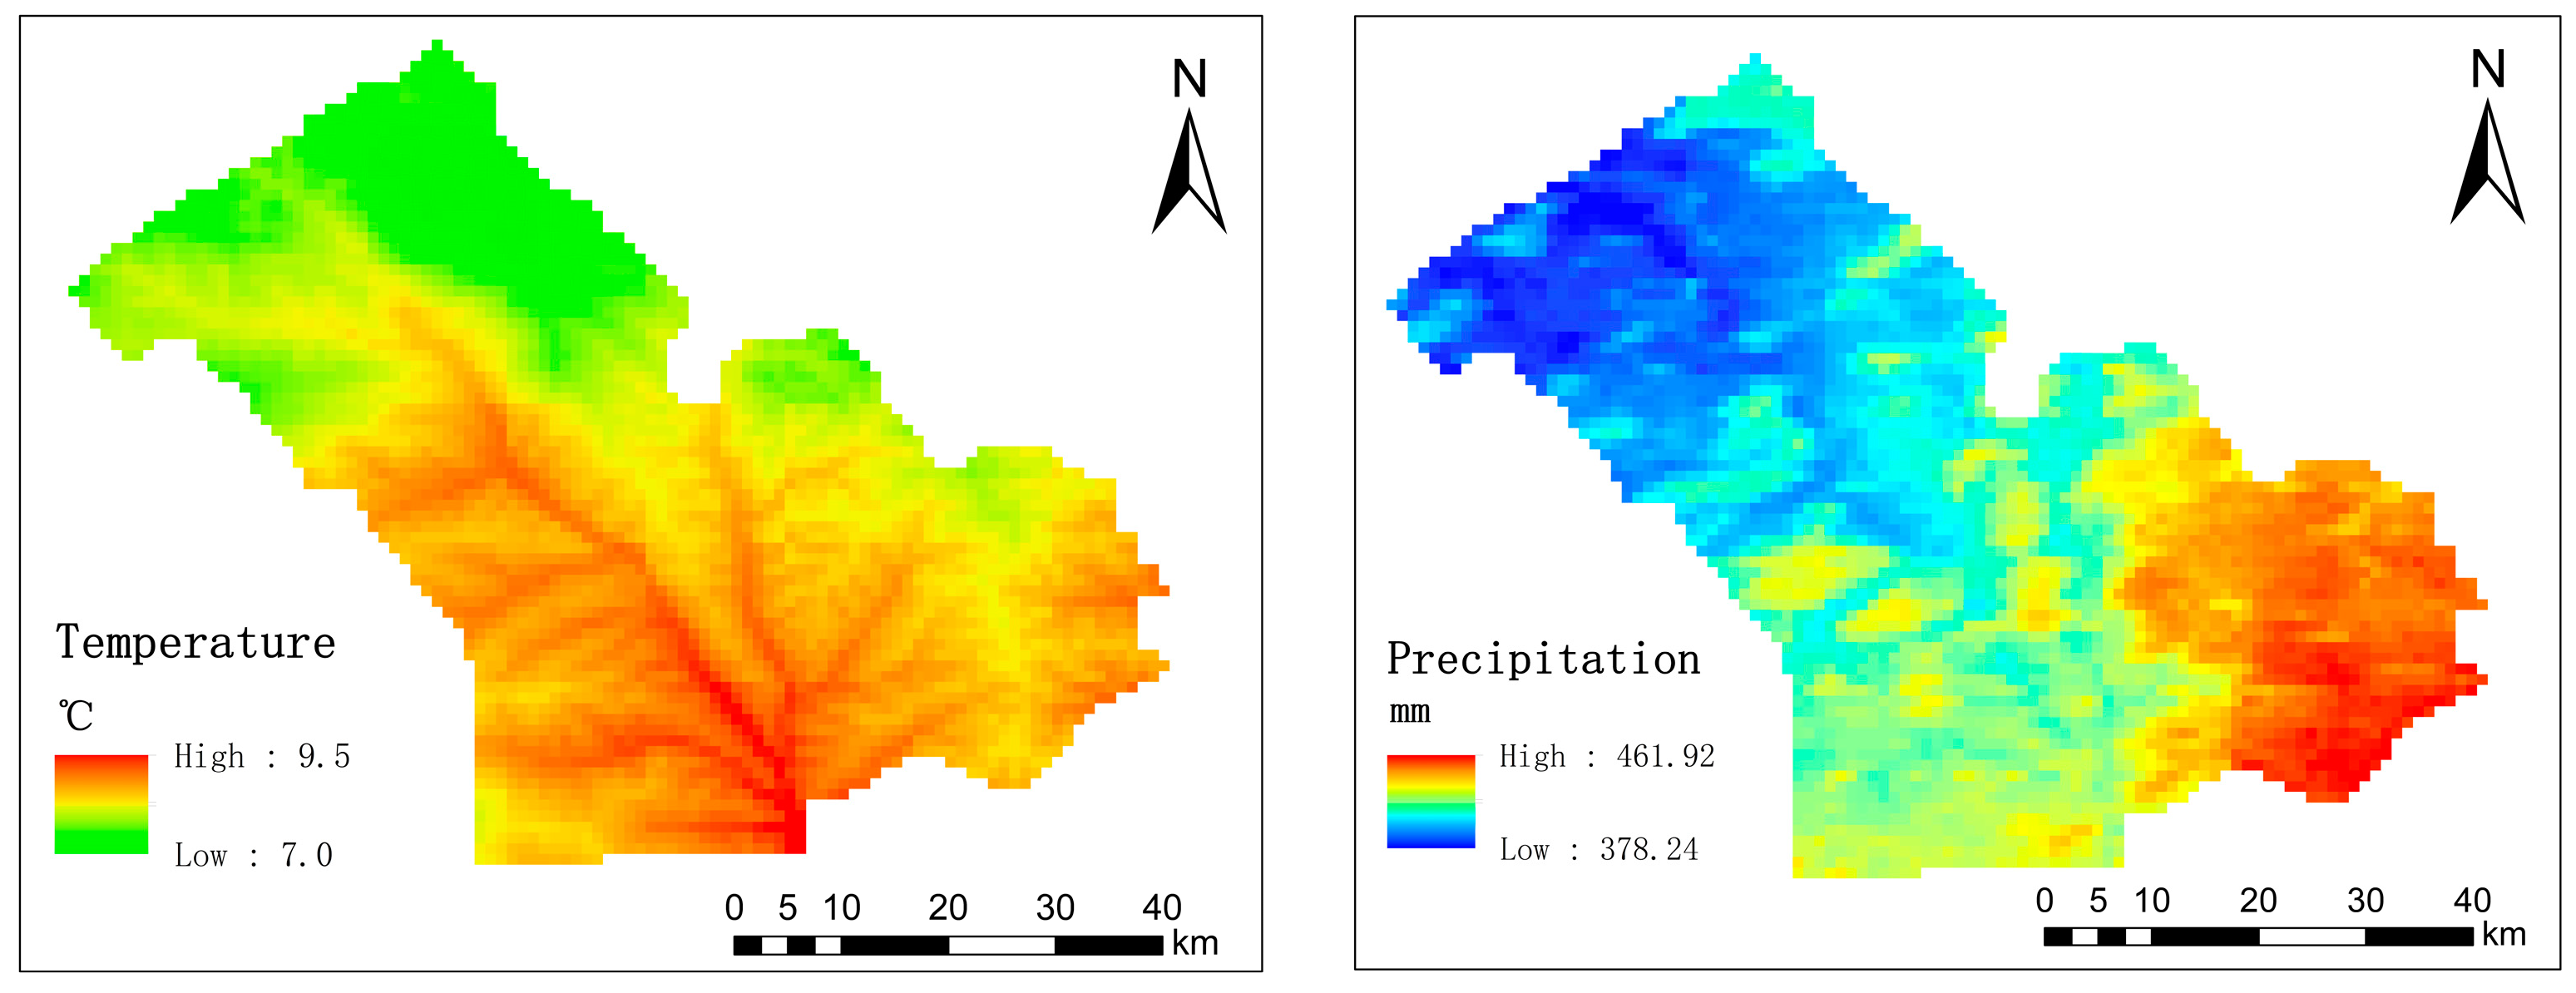
The data of the total primary productivity of vegetation were obtained from the China Regional PML-V2 Land Evapotranspiration and Total Primary Productivity Dataset (2000–2020) of the National Tibetan Plateau Scientific Data Center (https://data.tpdc.ac.cn/zh-hans/data/ (accessed on 16 September 2024)) [39,40,41]. The dataset includes the total primary productivity, vegetation transpiration (Ec), soil evaporation (Es), canopy-intercepted rainfall evaporation (Ei), and evaporation from water, ice, and snow (ET_water). The spatiotemporal resolution is one day and 500 m. The observed data are collected from 26 eddy flux stations in China. The under-canopy cover of 9 plants, including deserts with sparse vegetation, were synchronously used for parameter calibration of the model. Compared to the global version, the accuracy of the dataset has been improved [42]. The average annual values of the total primary productivity of vegetation in the research area from 2001 to 2020 are shown in Figure 2.

2.2.2. Climate Data

The climatic data are derived from the “1-km monthly precipitation dataset for China (1901–2023)” and “1-km monthly mean temperature dataset for China (1901–2023)” of the National Tibetan Plateau Scientific Data Center, with a spatial resolution of 1 km (https://data.tpdc.ac.cn/home (accessed on 17 September 2024)) [43,44,45,46,47]. This dataset is generated by Delta spatial downscaling to a resolution of 1 km and other methods based on the global 0.5° climate dataset released by CRU and the global high-resolution climate dataset released by WorldClim. In addition, 496 independent meteorological observation points were used to verify the dataset. This study utilizes climatic data to compute the SPI, encompassing a production scale of 1-to-24 months of SPI datasets. Considering that the research area is close to 4000 km2, which is large and suitable for research with 1 km resolution, this study uses this dataset to calculate the SPI (Standardized Precipitation Index) and to generate the SPI dataset. The average annual temperature and precipitation in the research area from 2001 to 2020 are shown in Figure 3.

2.2.3. Land Use/Land Cover Data

A land use type map of China for the period 1985-to-2022 was provided by professors Yang Jie and Huang Xin from Wuhan University. It contained provincial annual land surface cover data (https://zenodo.org/records/4417809 (accessed on 17 September 2024)) [48]. This dataset encompasses all Landsat data accessible on the GEE platform, from which spatiotemporal features were derived and integrated with a random forest classifier to achieve classified maps, alongside a proposed post-processing technique involving spatiotemporal filtering and logical reasoning. The dataset was compared with the existing land cover products. There was a good agreement with the global forest change, global surface water, and impervious water time series datasets. The dataset classifies land use types into the following nine categories: cropland, forest, shrub, grassland, water, snow/ice, barren, impervious, and wetland. In this study, the six land use types of grassland, woodland, cultivated land, water body, bare land, and impervious areas were selected to study the response of vegetation to climatic drought. The meteorological drought and ecological drought values of different land use types were analyzed in ArcGIS software 10.8. The main data used in this study are shown in Table 1.

2.3. Methodology

2.3.1. Ecological Drought Identification Method

The gross primary production of vegetation (GPP) refers to the photosynthetically active radiation energy fixed by the green vegetation per unit area through photosynthesis in a certain period of time. It is then converted into the total amount of organic matter, as a key component of the energy and carbon cycle in terrestrial ecosystems. The GPP reflects the productive capacity of the ecosystem. In this study, GPP anomalies were used to characterize ecological drought by first calculating the average monthly GPP of each raster pixel during the study period [49,50,51,52]. The calculation formula for the monthly average GPP of each grid is as follows [50]:
G P P j , i = 1 D t = 1 D G P P j , i , t ,
where GPPj,i is the GPP of the i-th month in the j-th year, D is the number of days in a certain month, and GPPj,i,t represents the GPP value of the i-th month and t-th day in the j-th year.
The average GPP calculation formula for a certain month during the research period is as follows [50]:
G P P i ¯ = 1 20 j = 1 20 G P P j , i
where G P P i ¯   is the average GPP for the month i, j represents the year, and i represents the month.
The seasonal GPP series can be obtained by subtracting the monthly average GPP during the study period. The formula for calculating the GPP series excluding seasonal trends is as follows [50]:
G P P d s , j , i = G P P j , i G P P i ¯       i = 1,2 , , 12     j = 1,2 , , n
where G P P d s is the GPP series excluding seasonal trends, G P P j , i is the GPP of the i-th month of the j-th year, and G P P i is the mean of the GPP for the month i. If the deficit of G P P d s exceeds 10% of the average GPP of the growing season in the same month for three consecutive months, ecological drought is believed to have occurred [50,51].

2.3.2. Meteorological Drought Identification Method

The Standardized Precipitation Index (SPI) is used to assess the degree of drought in a region and to predict the trend of future drought. The SPI takes precipitation as the only input. According to the needs of this research, the sliding window of 1-to-24 months was selected to describe the precipitation deficit at different time scales [53,54,55]. The processed precipitation data must also undergo fitting and normalization of the probability density function of the Γ distribution, which can characterize meteorological drought across various regions and time scales [51]. The SPI is calculated as follows:
α ^ = 1 + 1 + 4 3 ln x ¯ 1 n i = 1 n ln x i 4 ln x ¯ 1 n i = 1 n ln x i ; β ^ = x ¯ α ^
H x = q + 1 q G x
t = ln 1 H ( x ) 2 ; S P I = S t c 2 t + c 1 t + c 0 d 3 t + d 2 t + d 1 t + 1.0
In Equation (4), x ¯ represents the average precipitation; n is the length of the time series; and α ^ and β ^ are the shape parameter α and scale parameter β of the Gamma distribution, respectively. In Equation (5), q is the probability of zero precipitation and G(x) is the cumulative distribution function of the Gamma distribution. In Equation (6), H(x) is the cumulative probability function; t is an intermediate variable; and S is the sign function, where S = 1 when F > 0.5 and S = −1 when F ≤ 0.5. c0, c1, c2, d1, d2, and d3 are constants used to adjust the transformation formula to better fit the standard normal distribution.

2.3.3. Estimation of Drought Event Characteristics

In this study, meteorological and ecological drought events are estimated on the basis of the run theory. Run theory, also known as the cycle theory, is a time series analysis method used to analyze similar events that occur continuously [52]. In drought analysis, the run course theory can be used to identify the beginning and end of drought events, as well as their characteristics, such as the duration, intensity, and frequency. In this study, the threshold of meteorological drought was set at −0.5, and the threshold of ecological drought was set at −10%. The setting of the former is determined by reference to Section 2.3.2 above and the SPI classification table (Table 2) [54,55], and the setting of the latter is determined by the definition of ecological drought anomalies in Section 2.3.1 above [49].
This study will identify drought events by following the following steps:
Step 1: The initial phase involves organizing each raster image chronologically, identifying those with an SPI value below −0.5 or exhibiting an abnormal GPP (abGPP), and annotating them accordingly.
Step 2: The preceding procedure is executed for all raster images across all months, identifying raster pixels with corresponding values for three or more consecutive months, signifying a drought occurrence.
Step 3: According to the basic definition of drought event characteristics, the characteristics of drought events are identified and the results are output.
Combined with previous research results, this study gives the basic definition of drought characteristics as follows [49]:
(1) Drought frequency
D F = N d T s
where N d is the total number of drought events occurring on the same grid pixel during the study period and T s is the study years (total time). Unit: times/year.
(2) Drought duration
D D = D i N d
where D i is the duration of the i drought event of the same grid element. Unit: month/time.
(3) Drought intensity
D I = I i D i
where I i is the cumulative value of drought degrees in each month on the same grid pixel where the drought index in the i drought event is lower than the threshold value (positive). Drought intensity is a dimensionless index.
As shown in Figure 4, taking meteorological drought as an example, it is assumed that only three places have one meteorological drought event each in 2020.
The example study period Ts is 1 year, and the drought frequency Nd of the three places is 1 time each, so the drought frequency DF of the three places is 1 time/year.
The duration of drought in place A is 4 months/times, the duration of drought in place B is 3 months/times, and the duration of drought in place C is 4 months/times.
The aridity degree values of the four months in which drought occurred in place A were −0.6, −0.75, −0.6, and −0.9, respectively, so the DI in place A was 0.71. Similarly, the DI at D was 0.87 and the DI at C was 0.85.

2.3.4. Event Transition Identification Method

In fact, not all meteorological droughts lead to ecological events. There are many factors that cause ecological droughts, and the transition of meteorological drought is only one of them. The correlation between meteorological and ecological drought events is fundamental to the transition of droughts. As shown in Figure 5, there are several main causes of event delivery:
(1) During a meteorological drought (A), the onset of an ecological drought (a) implies that the former has generated the latter.
(2) If two discontinuous ecological (b1, b2) droughts occur within a meteorological drought (B), they are considered to be the same ecological drought.
(3) If the termination of an ecological drought (c) occurs after the initiation of a subsequent meteorological drought (D), and no ecological drought occurs during that meteorological drought, it is deemed that only one ecological drought has been recorded; conversely, if an ecological drought does occur, it is regarded as a distinct ecological drought event [49]. The gray area here represents the transition from a reasonable meteorological drought to an ecological drought.
According to the association between meteorological drought and ecological drought occurrence, the characteristics of meteorological drought and ecological drought in the Shendong mining area were further analyzed, including drought frequency, duration, and intensity. The frequency and correlation between meteorological droughts and ecological droughts were also analyzed. The transition frequency is the number of ecological drought events divided by the number of meteorological drought events, and the transition effect is expressed by the Pearson correlation coefficient of meteorological and ecological drought characteristics [50].

3. Results

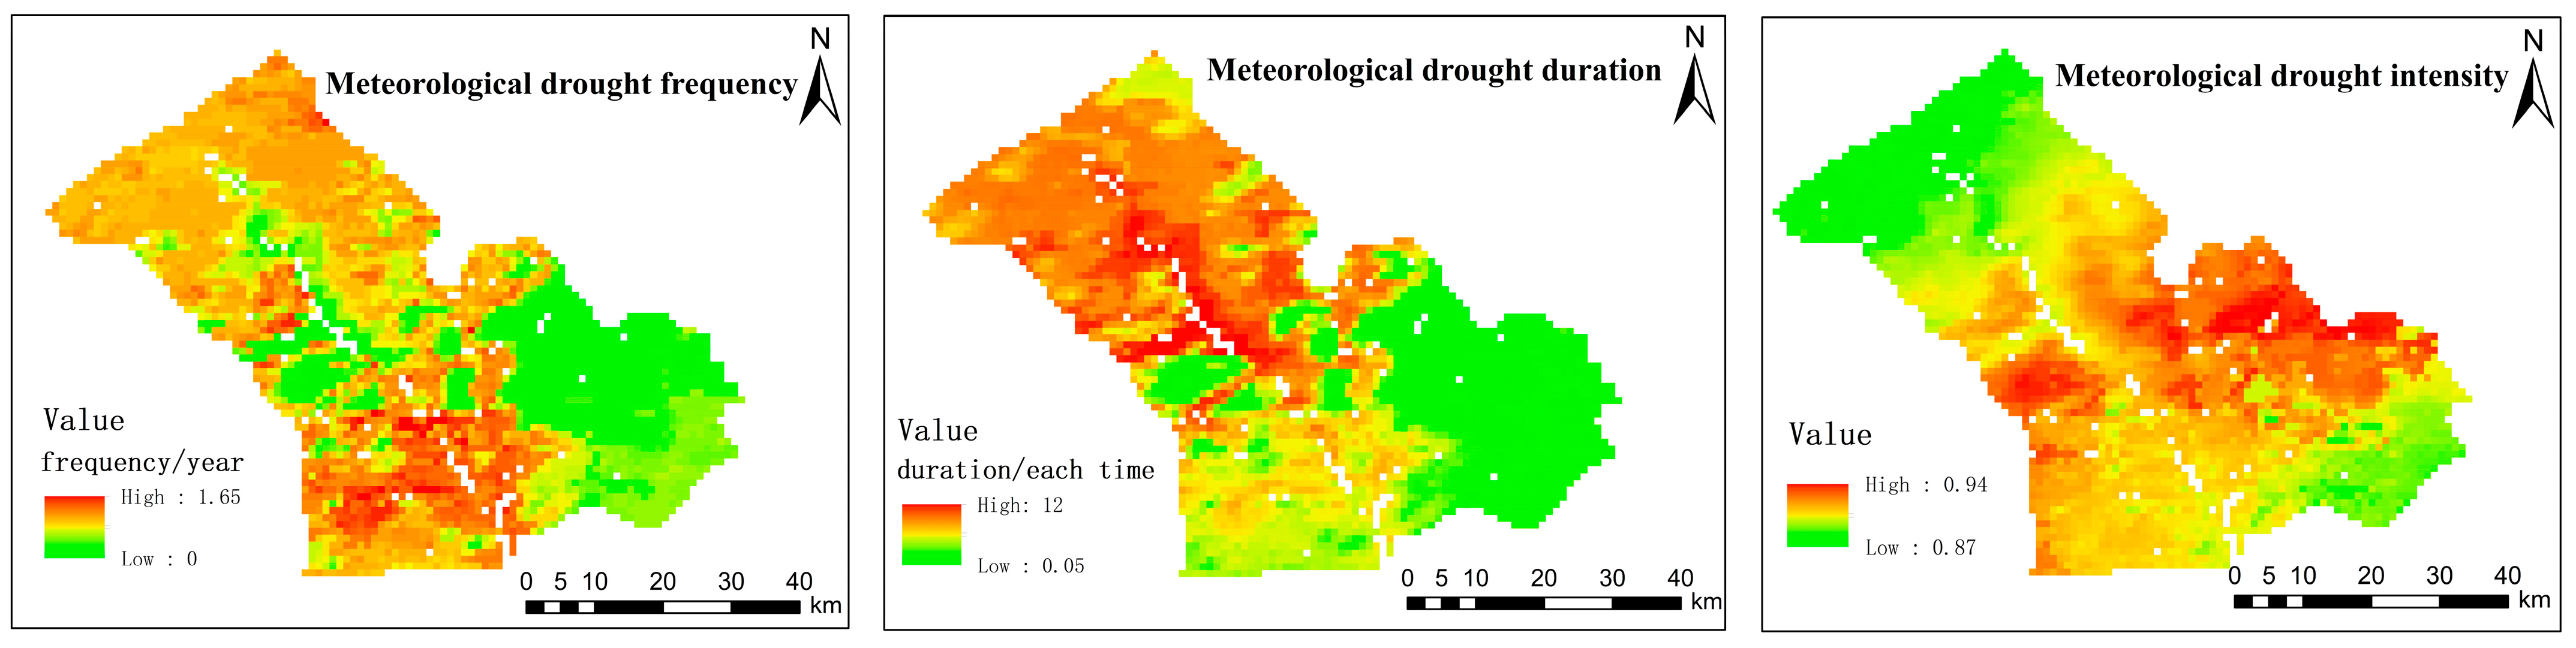
3.1. Spatial Distribution of Meteorological Drought Characteristics in the Shendong Mining Area

Meteorological drought has a great impact on the change in surface vegetation [56]. This study focuses on the characteristics of meteorological drought in the land covered by vegetation after removing water bodies and constructions. As shown in Figure 6, on the whole the frequency of meteorological droughts in the Shendong mining area was about 0.78 times/year, the duration of meteorological drought was 6.1 months, and the average drought intensity was 0.92. The blank area mainly presents the characteristics of linear distribution in the middle of the study area, indicating that the vegetation covered in this area is sparse. The incidence of meteorological drought in the study area exhibited a pattern of “high in the west, low in the east, high in the north, and low in the central region”, with an area in the eastern central region marked in light green, signifying a near absence of meteorological drought in this region. The north and the south sides of the study area showed a red color, indicating that the frequency of meteorological drought in these areas was relatively high, possibly reaching the degree of annual occurrence. The duration of meteorological drought in the study area showed an increasing pattern from southeast to northwest. In the regions with a low frequency of meteorological drought, the duration of drought was shorter. In regions with a higher drought frequency, the drought duration was not necessarily longer. The drought intensity in the study area was high in the middle and low on both sides. However, from the numerical point of view the meteorological drought intensity of the study area is relatively high, both above 0.85, which has a great impact on vegetation growth. Numerous substantial mines in the Shendong mining region are situated in the upper middle section of the study area. The prevalence of meteorological drought in the mining region is notably high, with an extended duration of drought conditions. The meteorological drought intensity near Jitu well and Daliuta well is greater than that of other mining locations. This suggests that the extensive degradation of surface vegetation due to mining activities exacerbates the incidence of meteorological drought and hinders the recovery of surface vegetation.

3.2. Spatial Distribution of Ecological Drought Characteristics in the Shendong Mining Area

As shown in Figure 7, the ecological drought frequency in the Shendong mining area was approximately 0.31 occurrences per year, the duration of meteorological drought was 18.8 months, and the average drought intensity was 0.08. Compared with the meteorological drought, although ecological droughts occurred less frequently they lasted longer and were less severe than in the past. From Figure 7, it can be clearly found that the regions with a higher ecological drought frequency and intensity presented lower values in duration, indicating that the ecological drought in the study area was characterized by a low frequency, long duration, and low intensity. Ecological drought is characterized by a degree of dispersion, and it diminishes the autonomous recovery capacity of vegetation, resulting in impaired normal growth. The frequency and intensity of ecological drought in mining-dominated regions are comparatively low; however, the duration of ecological drought is notably long, indicating a relatively weak capacity for vegetation recovery in these areas. On the contrary, at the border of mining area the duration of ecological drought was shorter, but the frequency and intensity were relatively higher.

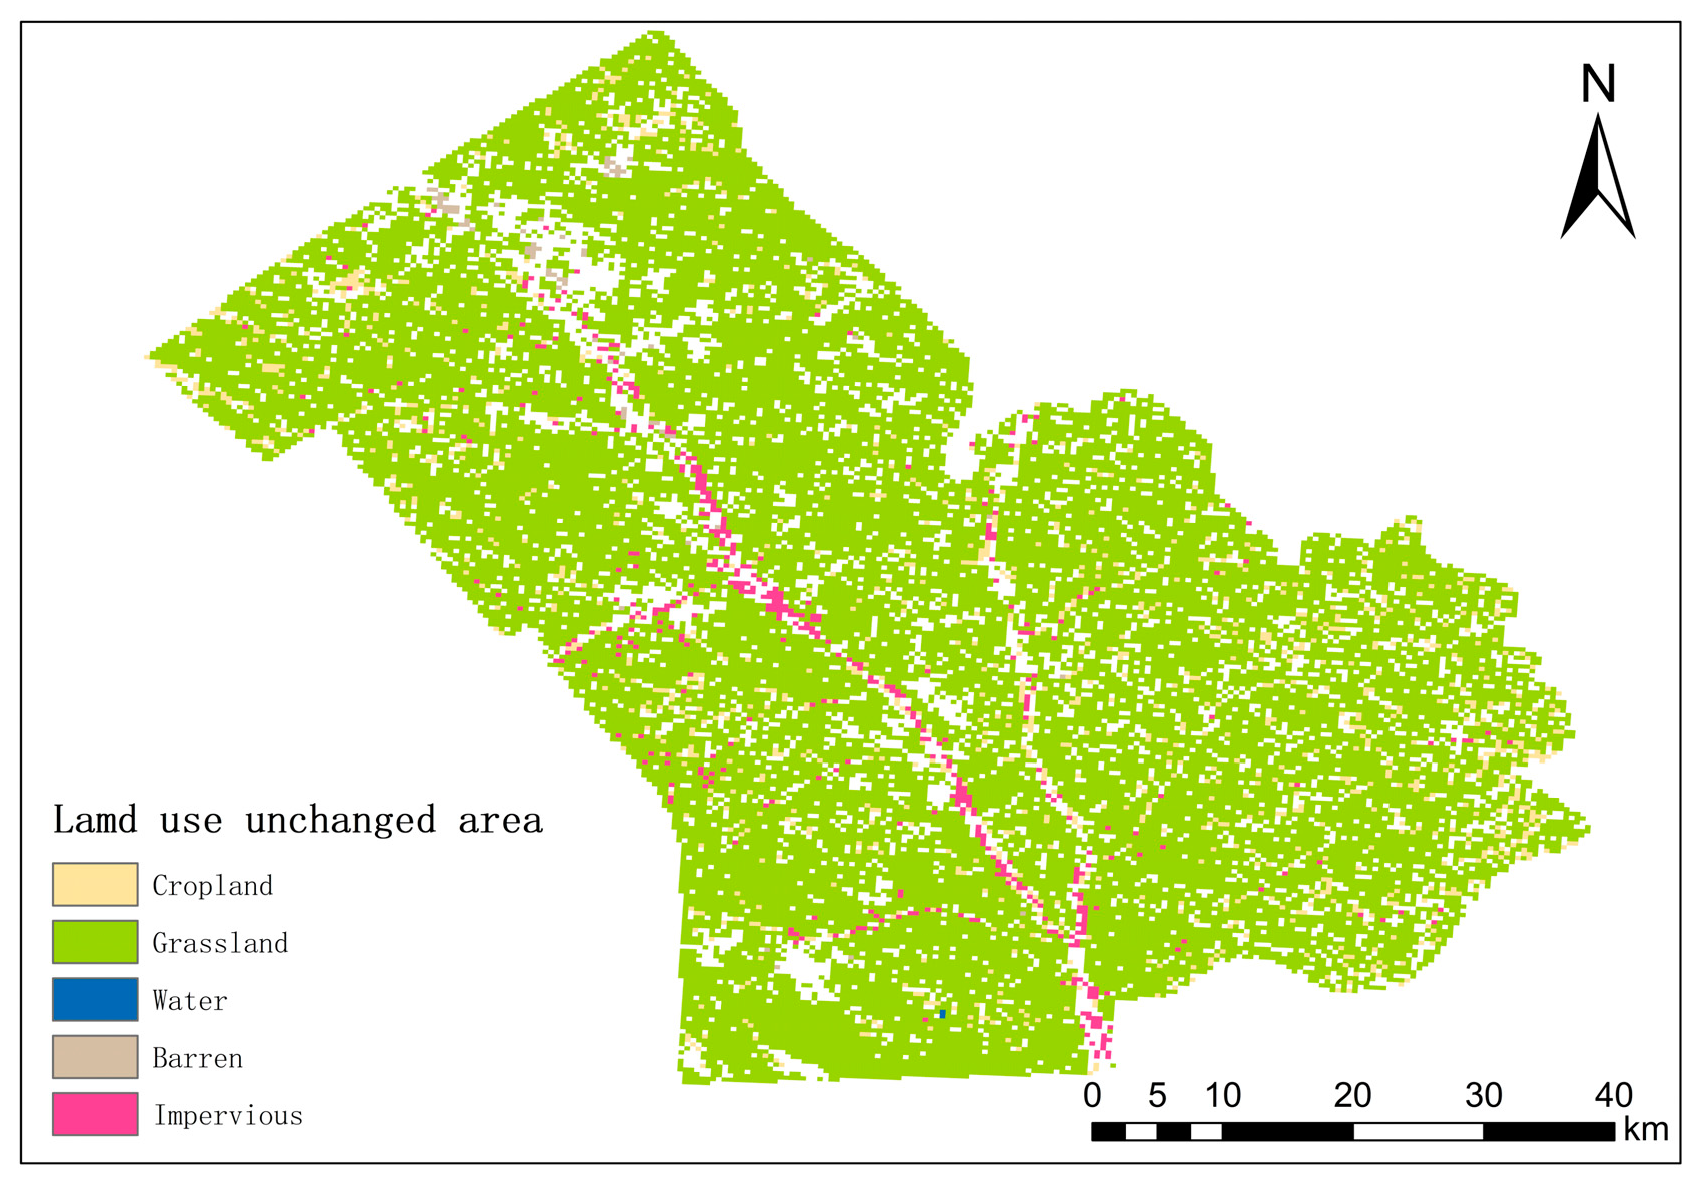
3.3. Analysis of Drought Characteristics of Stable Land Uses in the Shendong Mining Area

As shown in Figure 8, stable land use, mainly grassland, in the Shendong mining area accounted for 81.67% of the total. The stable grassland area accounted for 75.5% of the study area. This was followed by farmlands, which accounted for about 4.2% of the study area. Other stable land use types accounted for only 2% of the study area. The stable region of main land use types in the study area is shown in Figure 8. According to the definition of the ecological drought, they mainly refer to water shortage in vegetation ecosystems. Therefore, combined with the area of different land use types, this study further analyzed the drought characteristics of croplands and grasslands. To effectively illustrate the characteristics of droughts in grasslands, the extensive grassland area was classified into five categories based on varying vegetation cover rates: low cover (0–30%), medium-to-low cover (30–45%), medium cover (45–60%), medium-to-high cover (60–75%), and high cover (more than 75%). The differences and similarities of drought characteristics in grasslands under different vegetation covers are discussed. The land use of the study area has considerably changed in the past 20 years. Therefore, we used ArcGIS software to extract the regions with stable land uses and areas with evident land use changes over the past 20 years and studied their drought characteristics, respectively.

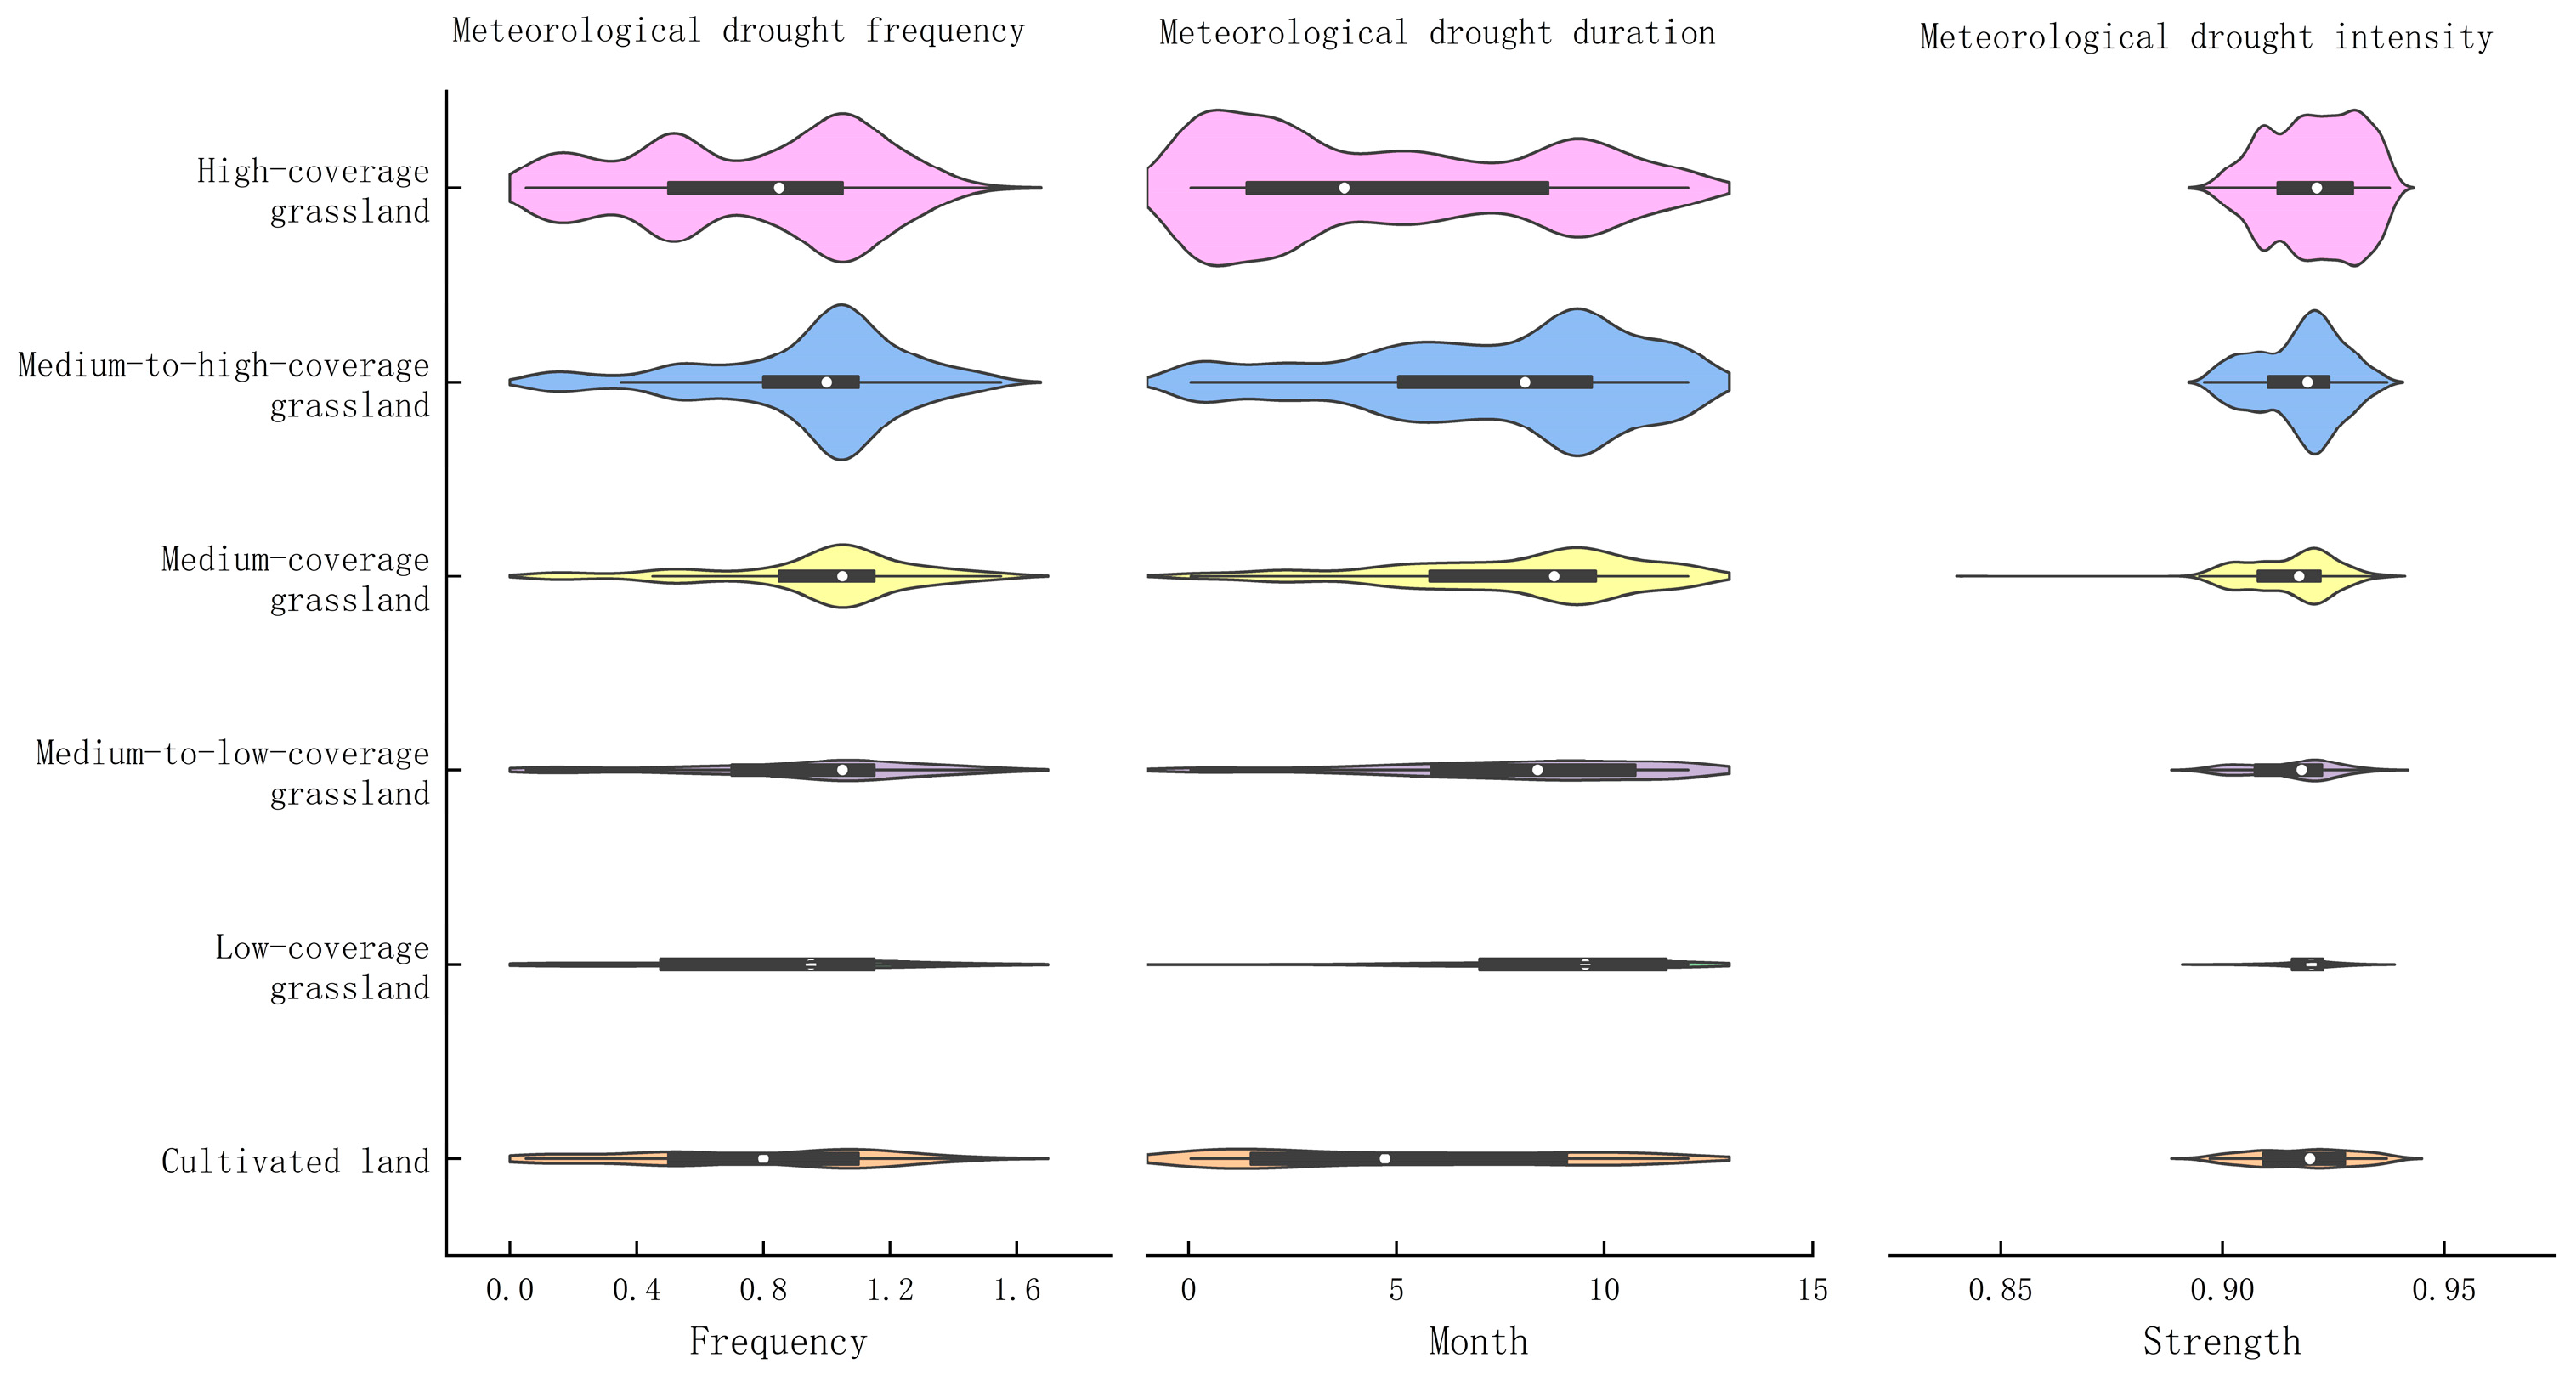
3.3.1. Stable Region Meteorological Drought Characteristics

A violin map combines the advantages of the boxplot and kernel density map, and can more intuitively distribute data and compare the distribution characteristics between different land uses. This helps us to find the trends in data more intuitively. In Figure 9, the drought characteristics in areas with stable land uses are illustrated. The figure indicates that the median of drought frequency of cropland is approximately 0.83 times per year, which is lower than that of grassland types with varying vegetation coverages. Among the various grassland types characterized by differing vegetation covers, those exhibiting higher medians of meteorological drought frequency were in the ranges of 30–45% and 45–60%, with a frequency of occurrence for both categories being 1.05 times per year. The category with vegetation coverage exceeding 75% exhibits a drought frequency of 0.85 occurrences per year. This suggests that an increase in grassland vegetation coverage correlates with a decrease in the frequency of meteorological droughts. The graph in the middle shows the duration of the meteorological drought. It can be found from the figure that the median duration of meteorological drought in croplands is much shorter than that in other grassland types, except for the high-coverage grasslands, as 5.75 months. In contrast, the median duration of drought in high-coverage grasslands was lower as 4.7 months. The median duration of drought in various grassland types with differing coverages ranged from 8 to 10 months, with low-coverage grasslands experiencing the longest drought duration of 9.75 months during periods of high drought intensity. On the contrary, the drought duration of croplands and high-coverage grasslands was more dispersed. In summary, increased vegetation cover in grasslands correlates with a reduced duration of meteorological dryness. This indicates that both vegetation coverages and land use types have certain effects on the duration of meteorological drought. The graph on the right shows meteorological drought intensity. Specifically, the median, quartile, and quartile quantiles of drought intensity of different land use types and different coverages in the study area had no significant differences. Only the medium-coverage grassland had a low value, and the meteorological drought intensity of other types was concentrated above 0.9, which indicated that the meteorological drought intensity in the study area was relatively stable and had low correlation with land use type and vegetation coverage.

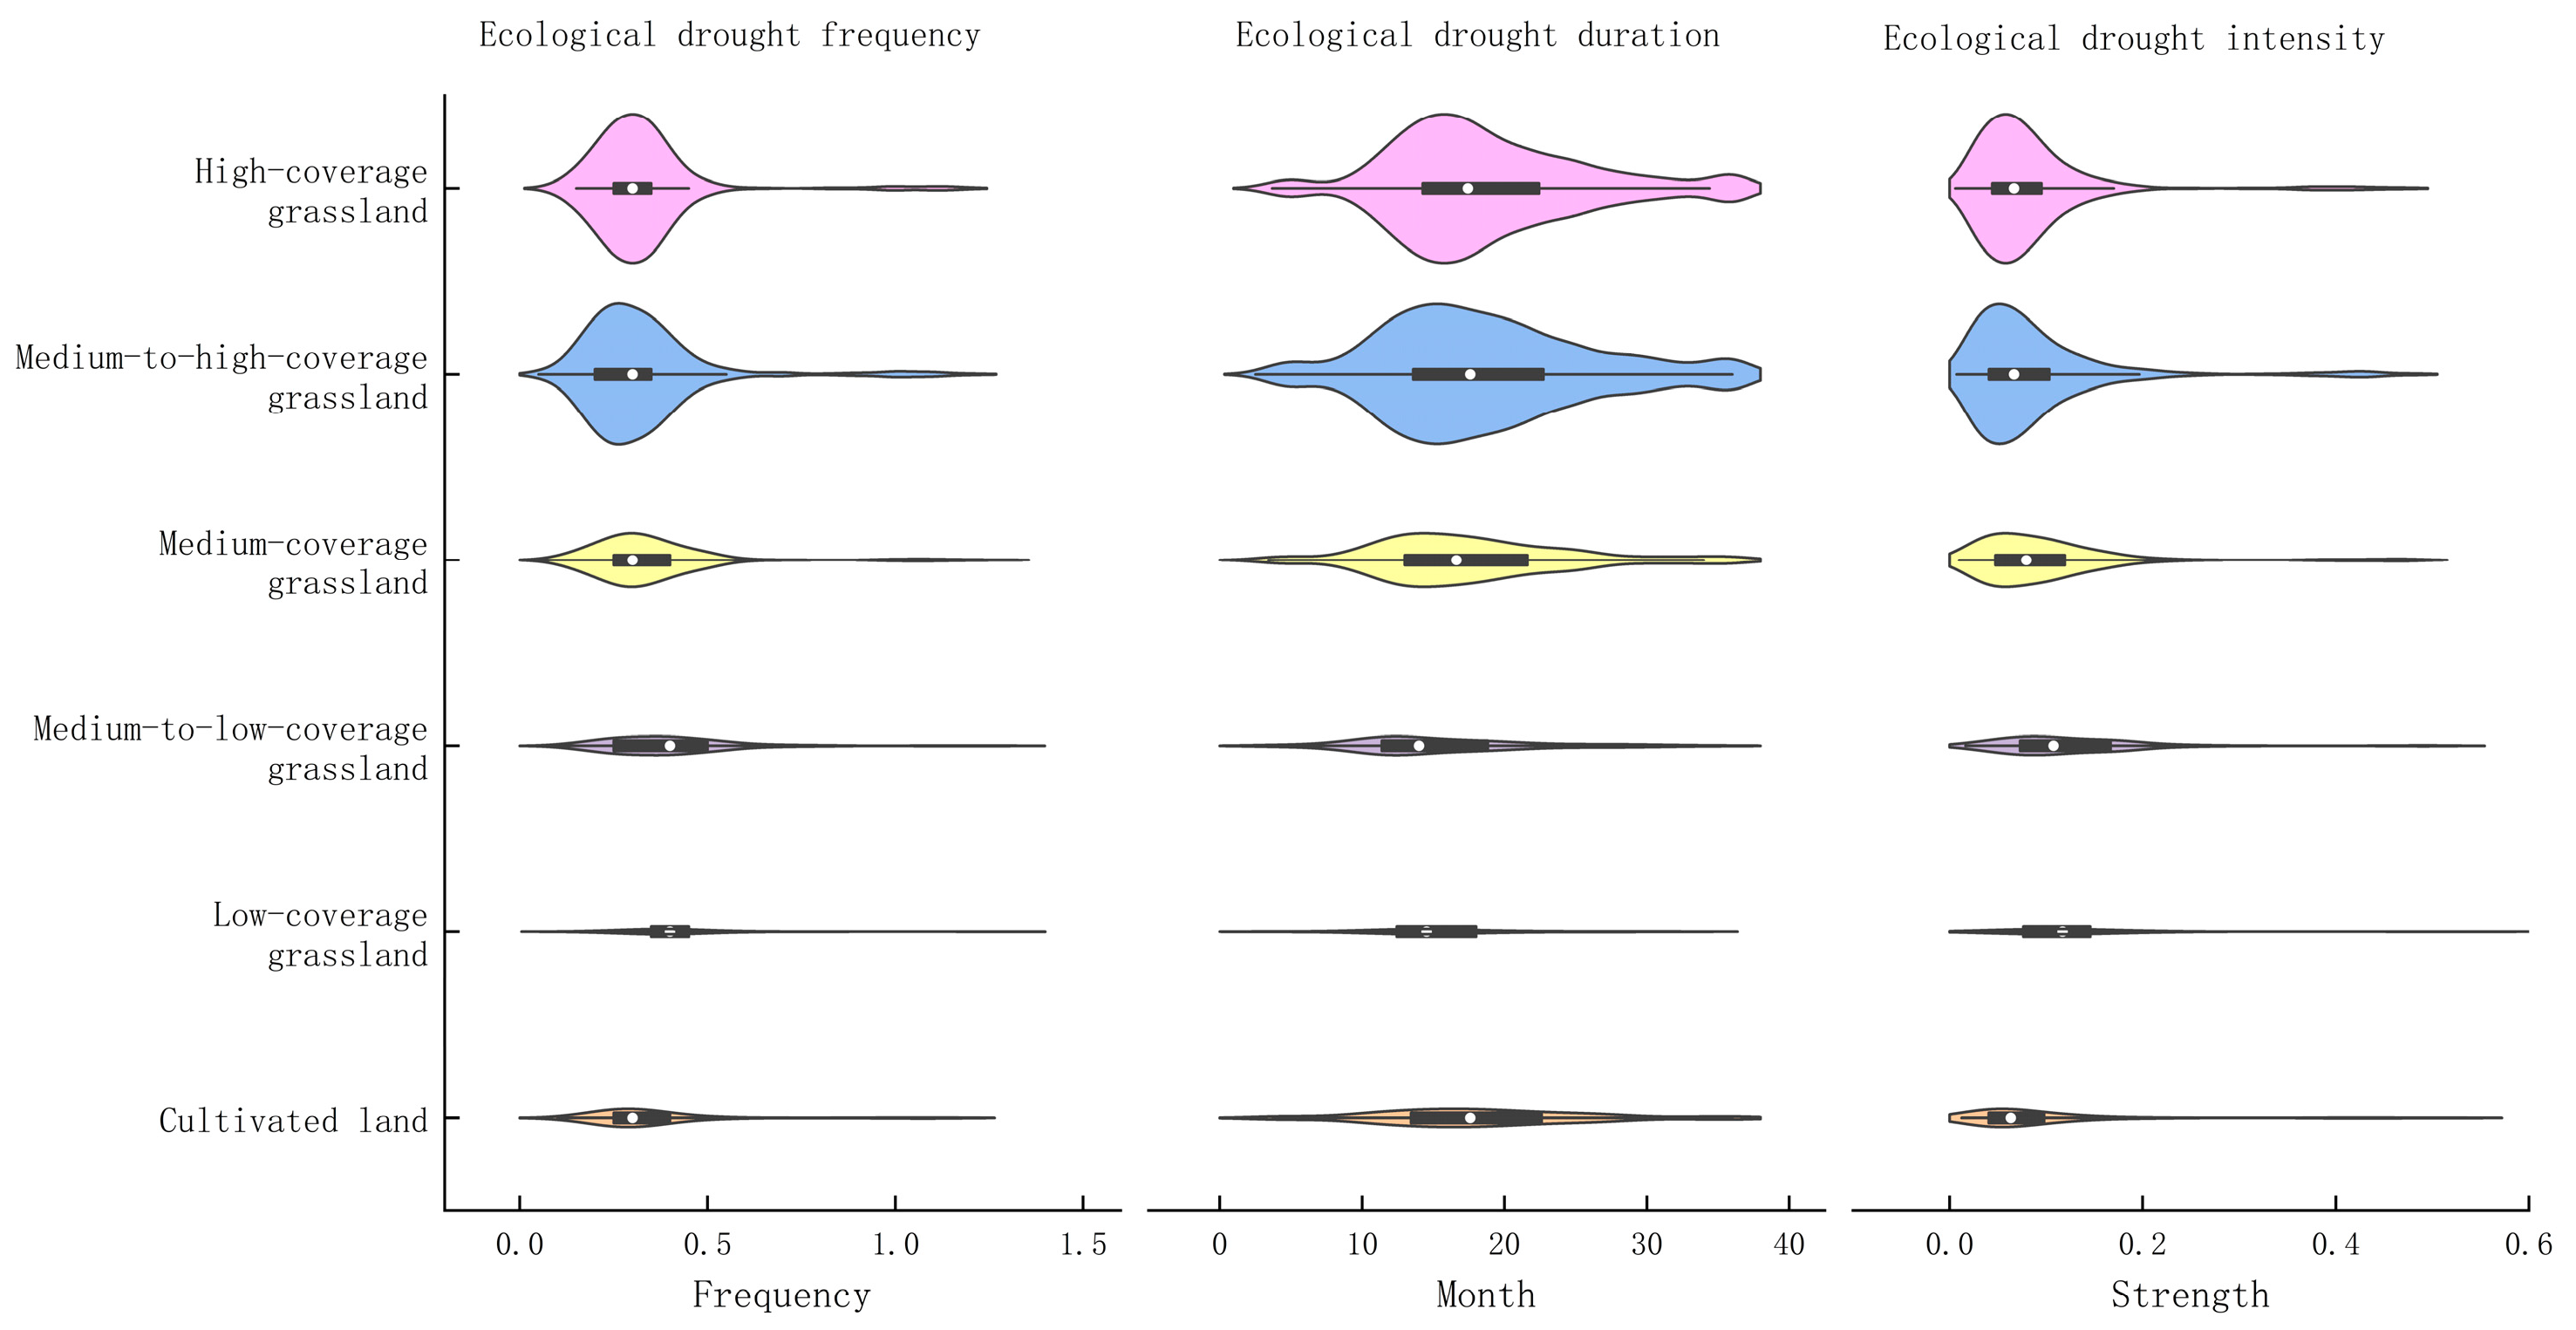
3.3.2. Stable Region Ecological Drought Characteristics

Similar to meteorological drought characteristics, ecological drought characteristics are mainly studied in three categories: drought frequency, duration, and intensity. From the drought frequency graph on the left in Figure 10, we can find that the ecological drought frequency is generally low, with the median of each type being between 0.3 and 0.4, with no significant differences. On the whole, most of them are concentrated in the range of 0–0.5, and only a few cases are higher than 0.5, which means that only a few regions have a high frequency of ecological drought. The ordinate of the drought duration chart in the middle ranges from 0 to 40, indicating that an average ecological drought can occur for up to 40 months. The drought duration of grassland with different coverages showed a certain regularity: that is, the higher the coverage, the longer the drought duration. The average median duration of drought in the medium-to-high- and high-coverage grasslands was 18 months, and the median duration of drought in cropland was about 17.5 months, which was similar to that of high-coverage grasslands. The relatively long duration of ecological drought is related to the cumulative effect of drought and the resilience of vegetation. Contrary to the duration of drought, the drought intensity of grasslands with different coverages tended to decrease with the increase in coverage. Therefore, ecological drought duration and intensity are negatively correlated. The median ecological drought intensity of low-coverage grasslands was relatively high, reaching approximately 0.12. The ecological drought intensity of croplands was about 0.06, which is consistent with that of grassland with higher vegetation coverage. Consequently, we can infer that the attributes of cropland are roughly analogous to those of grasslands with increased vegetation density during instances of ecological drought. Generally, with the exception of croplands, increased grassland coverage correlates with a reduced frequency of ecological drought, an extended duration of ecological drought, and diminished ecological drought intensity.

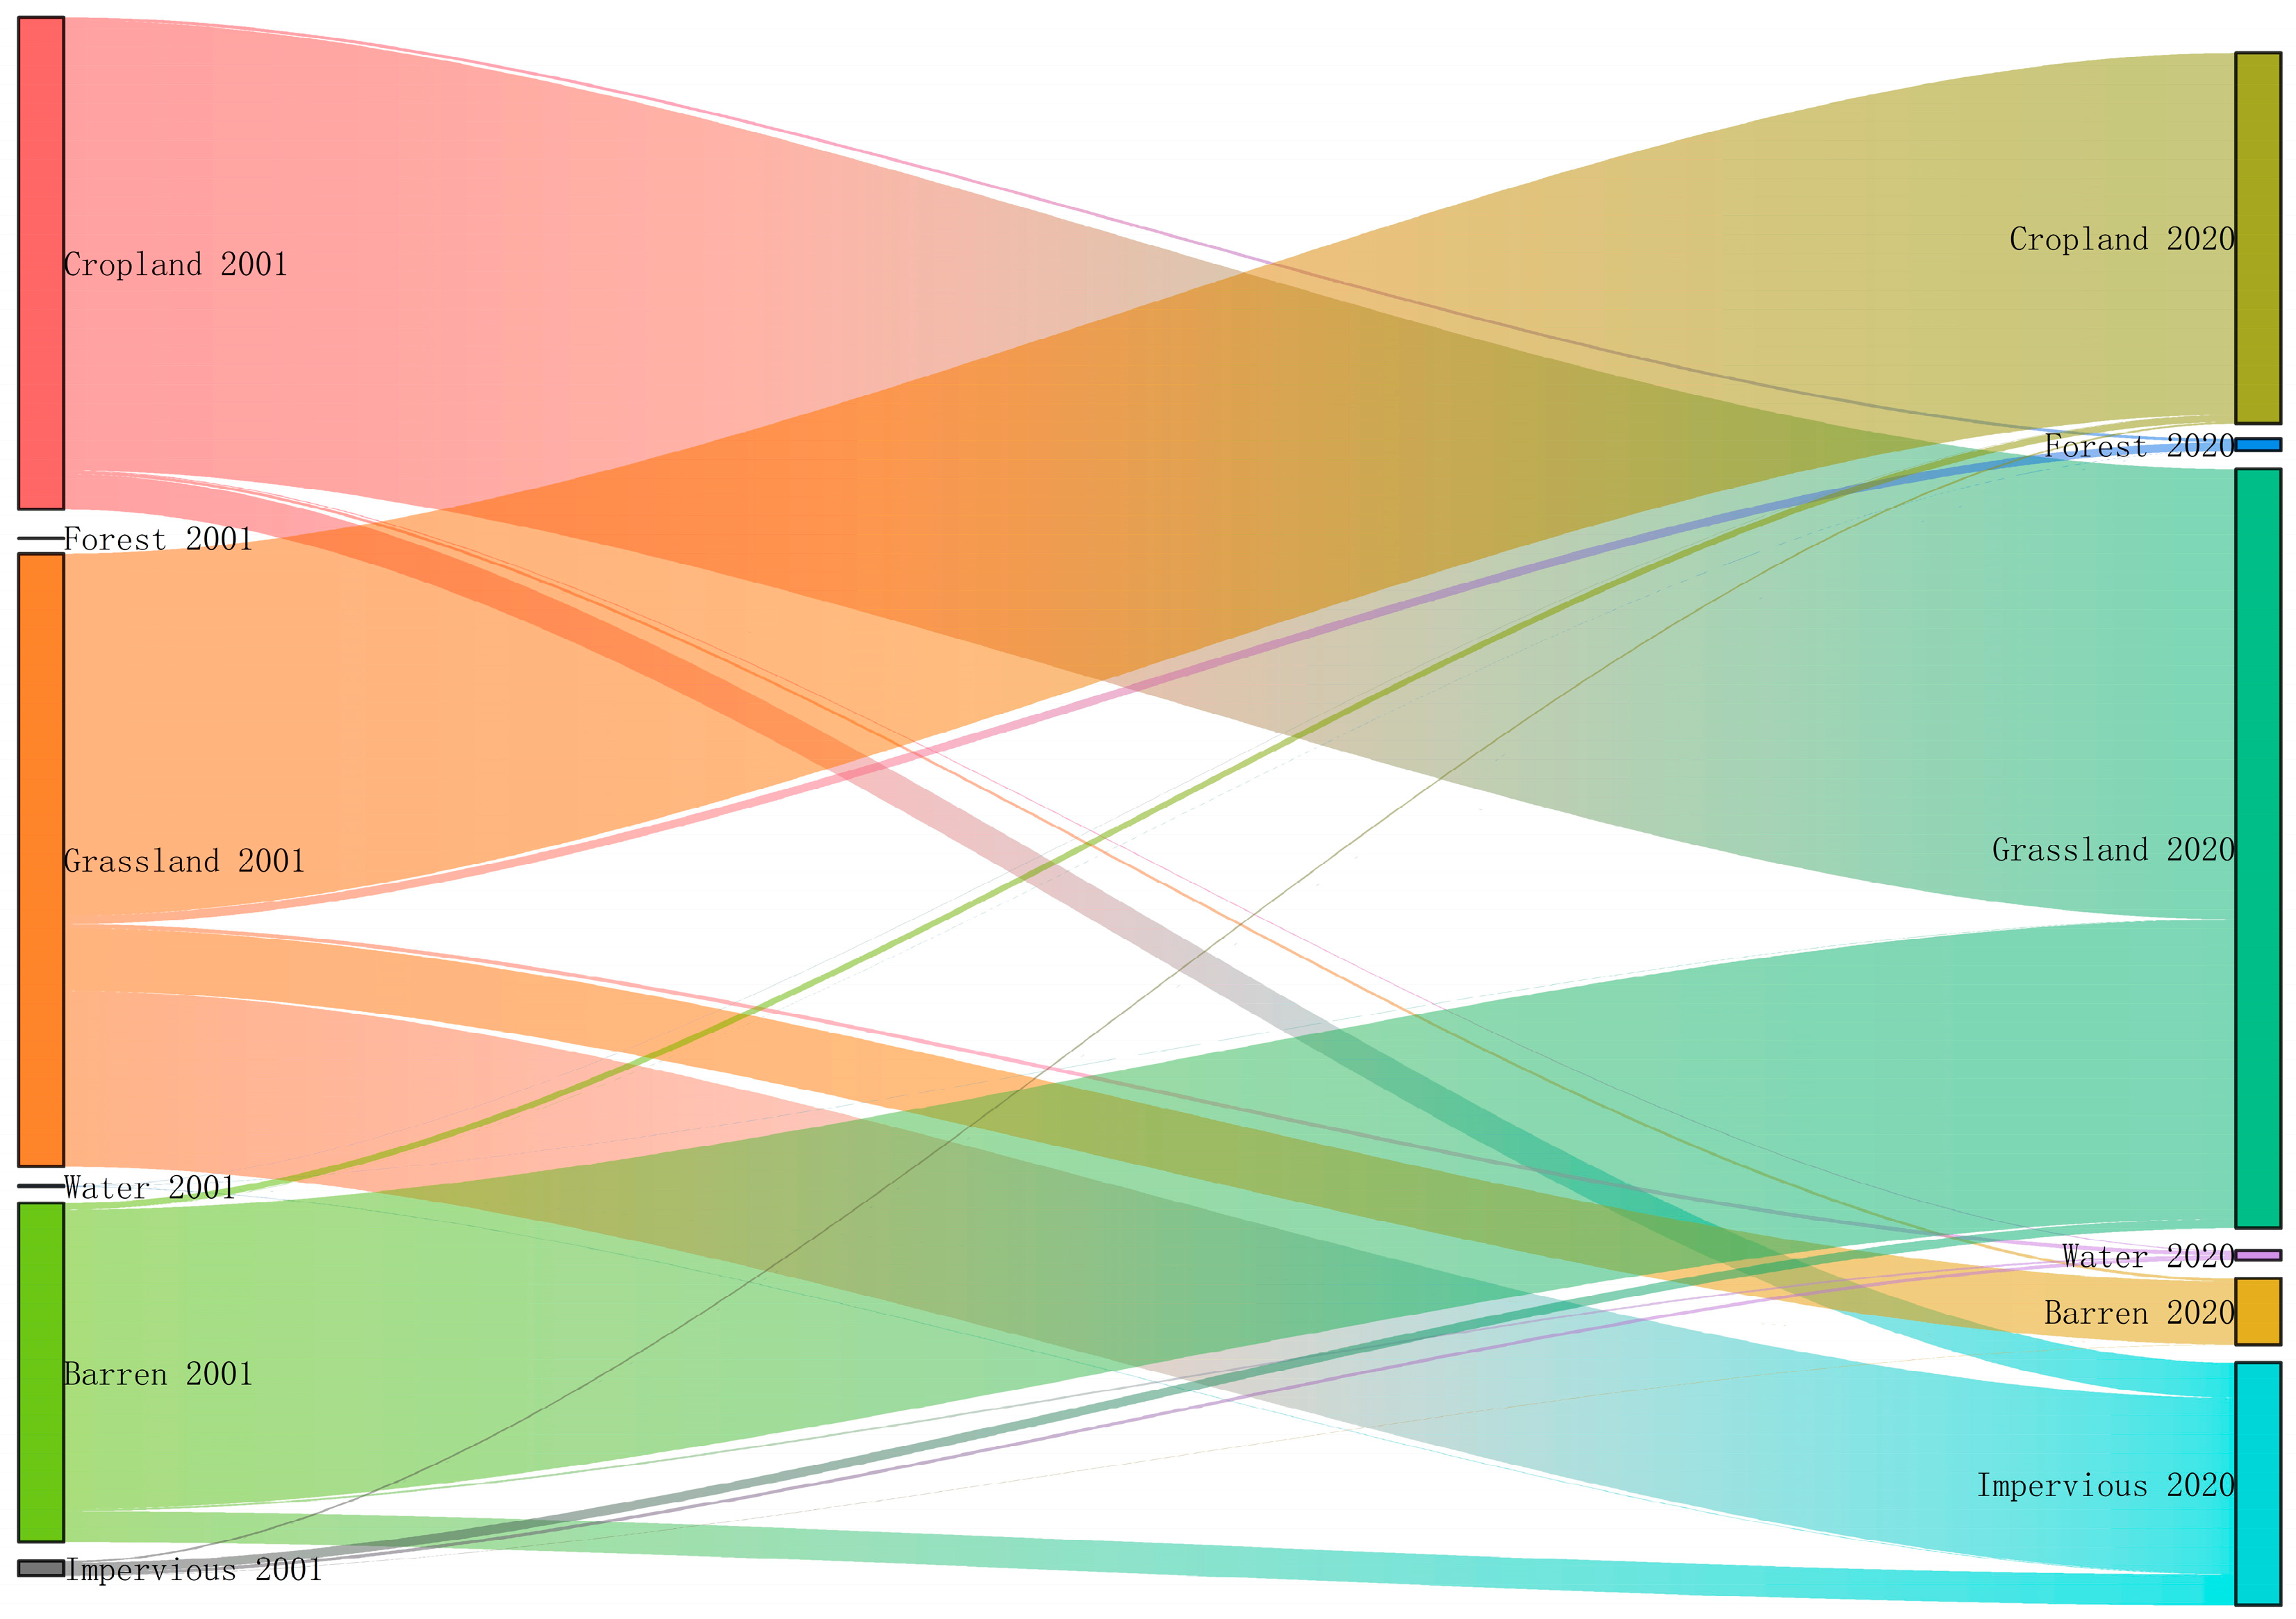
3.4. Analysis of Regional Drought Characteristics of Converted Land Uses in the Shendong Mining Area

The provincial-level China Land Cover Dataset (CLCD) divides land use types into nine categories. From 2001 to 2020, there are mainly five types of land use in the study area—cultivated land, forest, grassland, water body, bare land, and impervious surface—and the transfer among different land uses is also very complicated. In this study, ArcGIS was used to extract land use changes, and it was found that there were 27 different changes. The converted area constituted approximately 18.33% of the total study area, while the initial six categories represented around 97% of the overall converted lands. As shown in Figure 11, these regions encompass transitions from cropland to grassland, cropland to impervious, grassland to cropland, grassland to barren, grassland to impervious, and barren to grassland. The mutual transformation relationship between these land use types is shown in Figure 12. This study analyzes the drought characteristics associated with six significant land use changes.

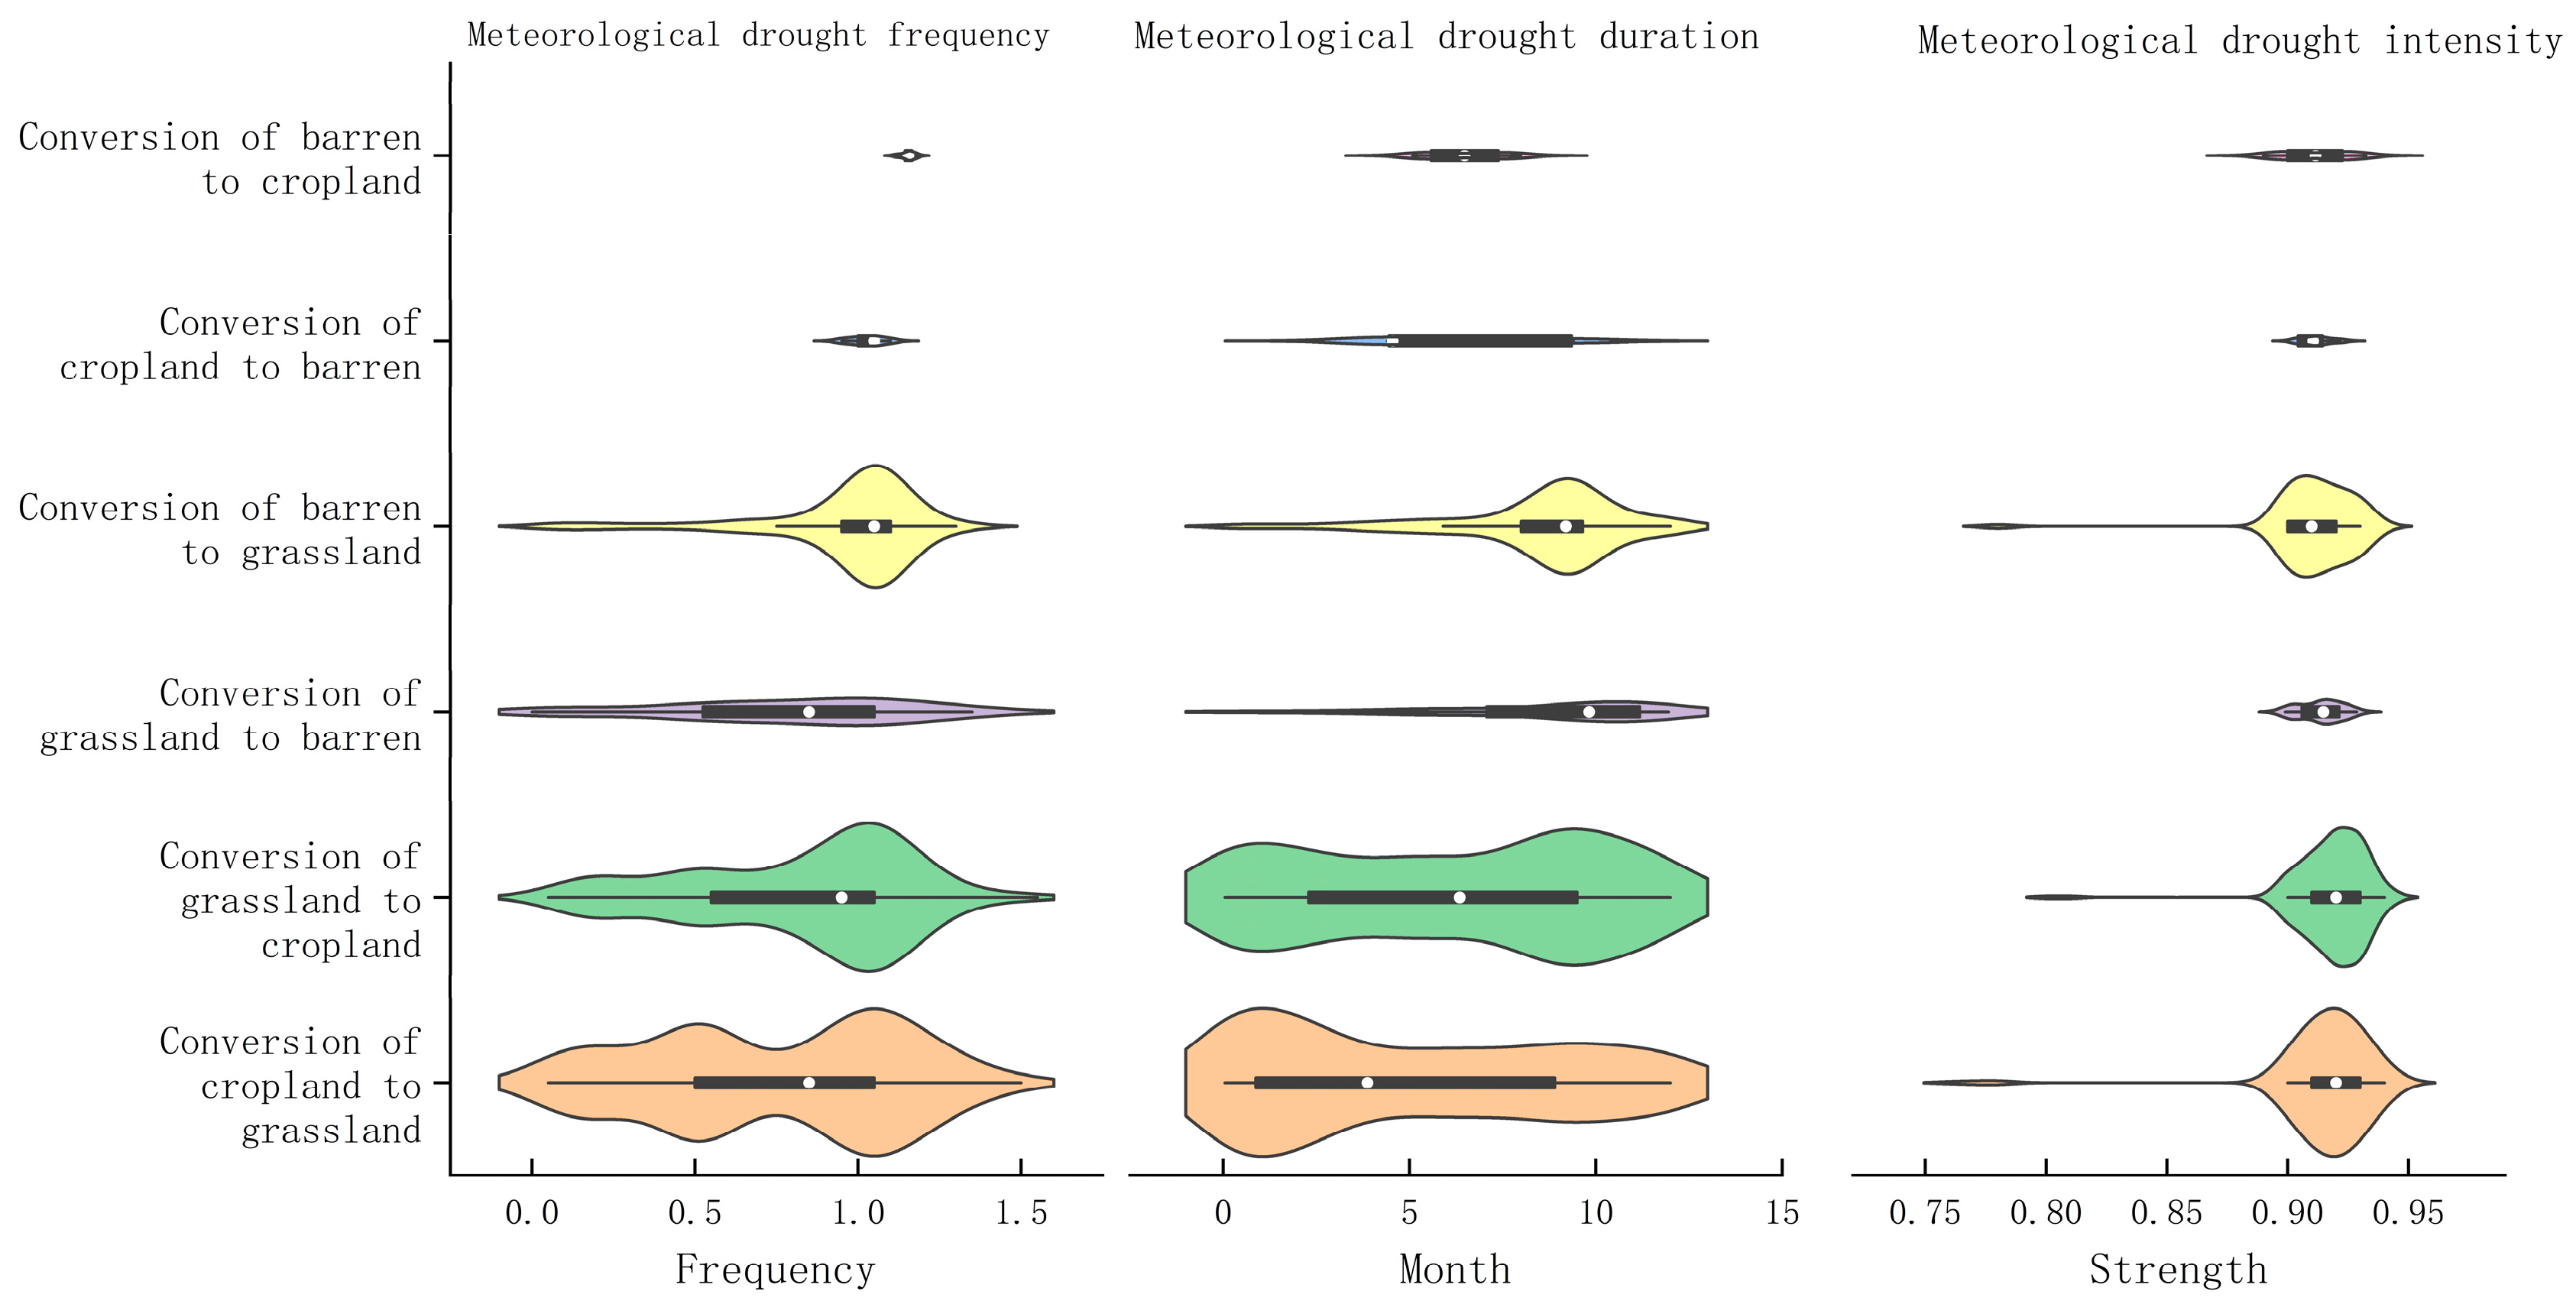
3.4.1. Change Region Meteorological Drought Characteristics

The characteristics of meteorological drought exhibit distinct patterns during the pairwise conversion processes among grassland, cultivated land, and bare land. As shown in Figure 13, overall, the frequency of meteorological drought in regions undergoing land use changes fluctuated around 1, indicating a relatively high probability of meteorological drought in the study area. The duration of meteorological drought shows significant variations: when cultivated land is converted to grassland or bare land, the duration is less than 5 months; conversely, when grassland is converted to cultivated land or bare land, the duration exceeds 5 months. This suggests that the seasonal characteristics of cultivated land have a notable influence on drought duration. Meteorological drought intensity generally remains above 0.9, indicating a consistently high intensity.
Specifically, the extent of mutual conversion between cultivated land and grassland is substantial. The frequency and duration of converting cultivated land to grassland are lower compared to converting grassland to cultivated land, suggesting that reclamation activities may exacerbate drought occurrence to some extent. Conversely, ecological protection measures such as returning farmland to grassland can help mitigate drought occurrences. The frequency of drought associated with grassland conversion to bare land is lower than that of bare land conversion to grassland, but has a longer duration. This indicates that reduced surface vegetation cover can intensify the adverse effects of meteorological drought. Additionally, while the frequency and duration of drought are lower for conversions from cultivated land to bare land compared to conversions from bare land to cultivated land, the intensity of meteorological drought across all types of land use changes remains high, underscoring the significant impact of meteorological drought on this region.

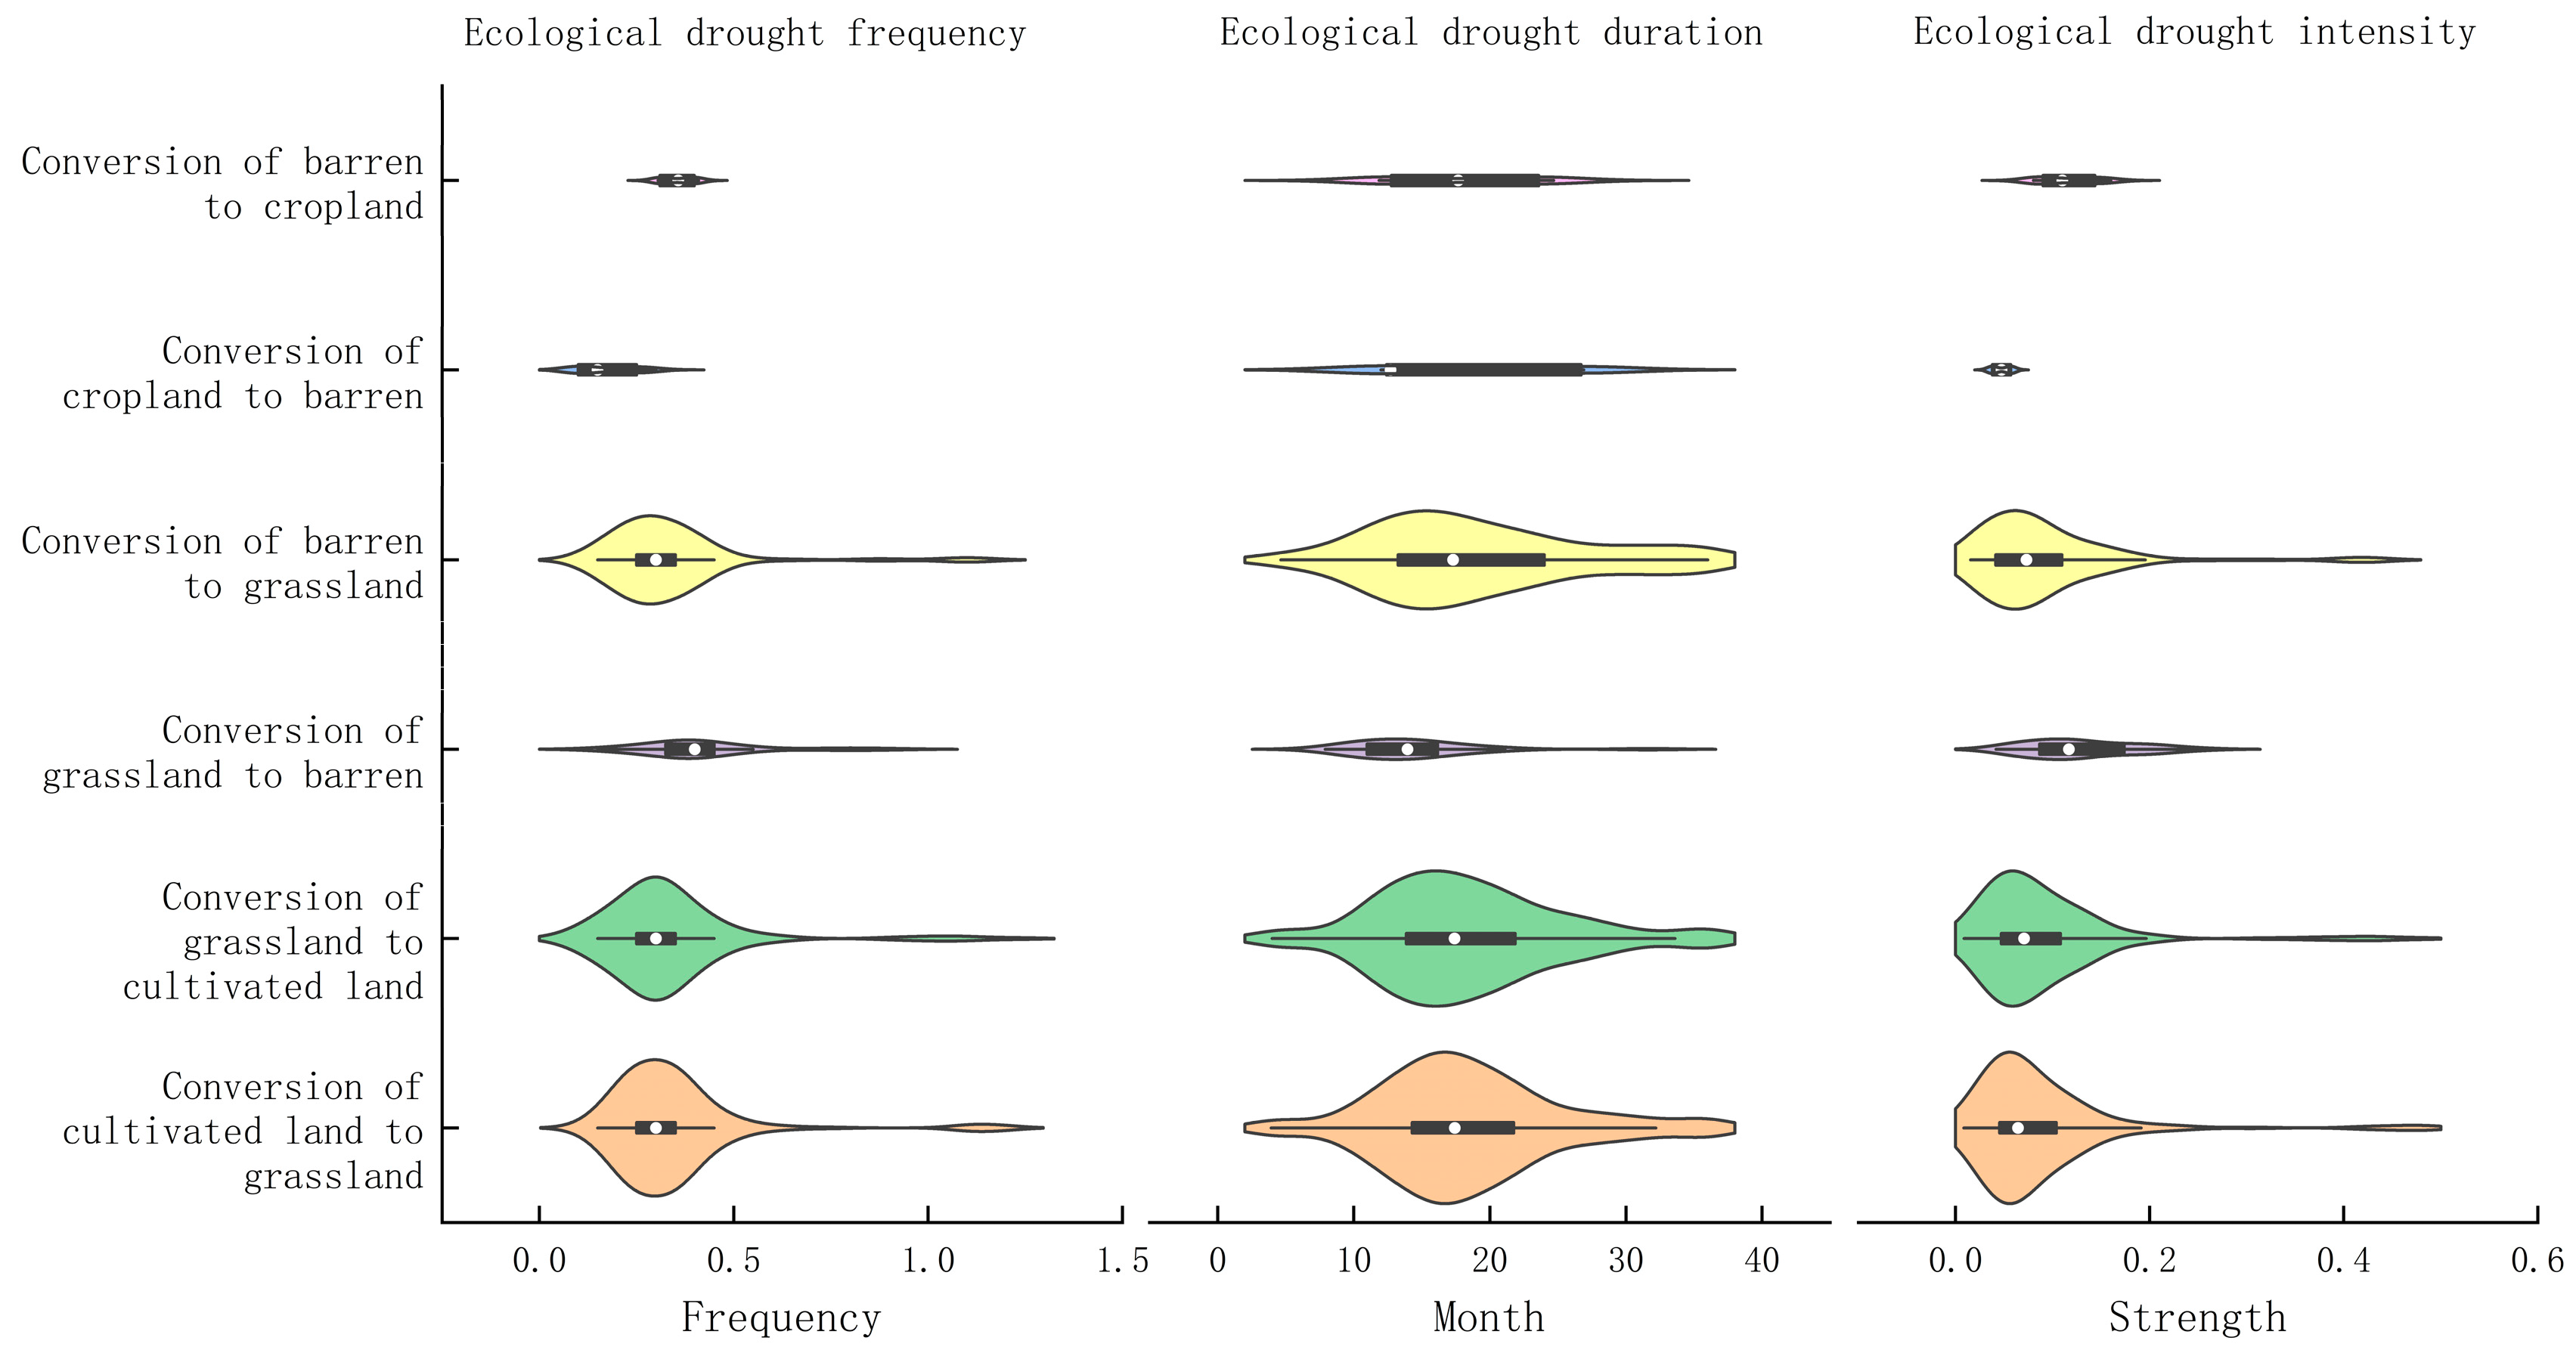
3.4.2. Change Region Ecological Drought Characteristics

Unlike meteorological drought, ecological drought exhibits a lower frequency and intensity. As shown in Figure 14, overall, the mutual transformation among the three types of land use has distinct characteristics. Specifically, when grassland and cultivated land were converted into each other, there was no significant changes in the frequency, duration, or intensity of ecological drought, indicating high consistency. This suggests that although the vegetation cover type changes, minor alterations in the coverage degree do not affect the fundamental characteristics of ecological drought. Compared to bare land, ecological drought had a higher frequency and intensity but a shorter duration. This implies that a reduction in grassland cover can intensify ecological drought due to decreased soil and water conservation ability, nutrient loss, and altered evapotranspiration patterns. When cultivated land was transformed into bare land, the frequency, duration, and intensity of ecological drought decreased, with a greater fluctuation in duration. Cultivated crops exhibit seasonality; even after harvest, surface residues can mitigate ecological drought occurrence. However, during crop replanting, artificial management is required, leading to weaker resistance against ecological drought, thus making it more likely to occur.

3.5. Transition Frequency and Correlation Between Meteorological Drought and Ecological Drought

So how much impact does the occurrence of meteorological drought events have on the occurrence, duration, and intensity of ecological drought events? We need to specifically study the transition frequency and correlation between them. The frequency and correlation of the two data were calculated pixelwise, and the results are shown in Figure 15. The figure on the left illustrates the frequency of transitions from meteorological drought events to ecological drought events, with certain regions lacking specific values, signifying the absence of direct or indirect transition in those areas. On the whole, the average frequency of meteorological drought to ecological drought in the study area was about 55%, with a moderate transition frequency. The figure illustrates distinct regions, with a higher overall value in the north, suggesting that meteorological drought in these areas frequently transitions to ecological drought, thereby indicating the significant role of meteorological drought in the emergence of ecological drought. The transition frequency in the southern region was predominantly below 40%, signifying a lower transition frequency from meteorological drought to ecological drought in these areas. Consequently, the influence of meteorological drought on the emergence of ecological droughts was less pronounced than in the northern region, with other significant factors also affecting the occurrence of ecological drought. The figure on the right is the correlation between meteorological drought and ecological drought values in a pixelwise manner. The results showed a general positive correlation in the study area, with some scattered regions having negative correlations. Comparing the left and the right figures shows that although the region’s short-term value is below the drought threshold, it does not necessarily indicate that persistent drought events will occur. There are some blank areas in the diagram that show no transitive relationships and correlations. Combined with Figure 6, it can be seen that the frequency and duration of meteorological drought in these regions are almost 0, indicating a low likelihood of meteorological drought in these regions, favorable ecological conditions, and a low probability of ecological drought.
Outliers are removed prior to computing the correlation. Initially, let us analyze the relationships inside the stable zones, as presented in Table 3. The correlation of drought frequency, duration, and intensity of cultivated land was basically the same as that of grassland with medium and low coverage. The correlation of drought frequencies exceeded 0.7, signifying a considerable likelihood of annual drought occurrence. The association between drought durations was the most significant, suggesting that a long period of meteorological drought substantially influences the duration of ecological drought. The connection between drought intensities is weak, suggesting that severe meteorological drought does not inherently result in severe ecological drought. The frequency, duration, and intensity of drought in grasslands with varying coverages diminished as coverage increased, suggesting a correlation between the incidence and transition of drought and the degree of vegetation coverage. Grasslands with substantial vegetation cover can markedly diminish the occurrence, duration, and severity of drought by enhancing soil water retention, regulating evapotranspiration, improving ecosystem resilience, obstructing drought propagation, modulating local climate variations, increasing ecosystem diversity, and affecting drought thresholds. This clearly illustrates the significant role of vegetation coverage in the incidence and propagation of drought, while also offering a crucial scientific foundation for the management and conservation of grassland ecosystems.
Furthermore, as presented in Table 4, the relationship in regions experiencing land use shifts demonstrate unique characteristics. The correlation of drought characteristics between grassland and cultivated land was positive, with a drought frequency of 0.68 and drought durations of 0.93 and 0.92, respectively. This suggests a fundamental consistency, indicating that the alteration in surface vegetation type had minimal impact on the occurrence and transition of drought. The drought intensity increased somewhat upon the conversion of grassland to cultivated land, measuring 0.51, which suggests that the drought resistance of cultivated land is somewhat inferior to that of grassland. The correlation of drought features was positive when cultivated land and grassland were transformed into bare land, and negative when bare land was changed into cultivated land and grassland. This phenomenon was intricately linked to the multifaceted impacts of plant cover on soil water retention, evapotranspiration regulation, soil structure enhancement, regional climate alteration, anthropogenic activities, and ecosystem resilience. The reduction in vegetation cover diminishes the soil’s water retention capacity and the ecosystem’s regulatory ability, hence elevating the likelihood of drought incidence and transition. The augmentation of vegetation cover can significantly alleviate the incidence and transition of drought by boosting these functions. The transformation of uncultivated land into agricultural and grassland can significantly diminish the incidence and transition of drought. The augmentation of grassland vegetation cover can enhance soil’s water retention capacity and water usage efficiency, while diminishing soil water evaporation. Although arable land is more effective in alleviating the onset and transition of drought, it necessitates increased human oversight and may diminish its drought resilience due to soil deterioration. Prioritizing the transformation of barren land into grassland in the research area may provide a more efficacious strategy for ecological restoration and drought resilience.

4. Discussion

4.1. Spatial Distribution Analysis of Drought Characteristics

We found an obvious spatial heterogeneity in the frequency, duration, and intensity of meteorological drought in the study area [57]. The development of spatial patterns of drought distribution under climatic conditions is fundamental to understanding drought features in the Shendong mining area. The frequency and duration of drought in the eastern part of the study area were lower than those in the western part, since the eastern part is closer to the semi-humid and semi-arid area, with a wetter climate and more rainfall. In this area the soil moisture is sufficient and can persist in providing vegetation to meet its standard water requirements [58]. This is consistent with the results of this study. At the same time, this study found that the frequency, duration, and intensity of meteorological drought did not show synchronization, and there was no obvious linear correlation between them. Secondly, the influence of soil characteristics on drought characteristics cannot be ignored. The soil types in the study area are shown in Figure 16. The main soil types in the study area are Huangmian soil, chestnut soil, and semi-fixed sandy soil [59]. These soil types have a loose structure, low organic matter content, and poor water retention capacity. This makes the soil in the study area vulnerable to wind and water erosion, exacerbating the duration and intensity of ecological drought. In addition, human activities, especially coal mining activities, have a significant impact on the meteorological drought characteristics of the Shendong mining area. Coal mining leads to subsidence of the Earth’s surface and a drop in the water table, further increasing the frequency and intensity of droughts. Some scholars have shown that the annual mean Temperature Vegetation Drought Index (TVDI) in subsidence areas is higher than that of non-subsidence areas, which indicates that coal mining activities have a significant impact on drought characteristics [60]. The ecological drought in the study area showed obvious characteristics. Firstly, the frequency of ecological drought in the study area was low. This low frequency indicates that the vegetation in this region is relatively stable and the water imbalance is not frequently occurring. Secondly, the ecological drought lasted a long time. In conjunction with drought frequency, we can reaffirm that the ecosystem in this region is relatively stable yet situated in a critical vulnerability zone, due to the prolonged duration of each ecological drought. Thirdly, the intensity of ecological drought was low. Some scholars believe that while the duration of ecological drought was prolonged, the intensity of individual ecological droughts was minimal, resulting in a negligible impact on ecosystem changes in the study area [61].
Although meteorological drought had a high frequency, short duration, and high intensity, ecological drought had a low frequency, long duration, and low intensity. First, ecosystems have the capacity to buffer and recover. When meteorological drought occurs frequently and with high intensity in the study area, the buffer capacity of the ecosystem will be gradually exhausted, which can easily lead to the cumulative effect of ecological drought. This cumulative effect makes the duration of ecological drought significantly longer. Secondly, there is a lag in the response of ecosystems to drought. The vegetation response to drought can take months or even years to fully manifest, and this lag results in a longer duration of ecological drought. Third, long-term climate change will also affect the characteristics of ecological drought. Climate change has led to an increase in the frequency, intensity, and duration of drought events. In this context, the high frequency and intensity of meteorological droughts may further exacerbate ecosystem stress, making the cumulative effects of ecological droughts more significant. In recent years, the companies in the Shendong mining area have vigorously implemented ecological restoration projects and actively implemented the strategy of mining while restoring, which has increased the vegetation coverage rate and stabilized the change in ecological drought to a certain extent [62]. Furthermore, certain scholars have determined that global atmospheric circulation influences the characteristics of ecological drought at the local level, and phenomena such as El Niño may also affect the incidence of ecological drought in continental interiors [63].

4.2. Analysis of Drought Characteristics of Different Land Use Types

In the stable land use area, the drought characteristics of cultivated land and grassland with a moderate coverage rate showed some similarity in numerical value. However, this similarity does not mean that they have the same drought risk in all seasons. It should be noted that during summer and autumn the vegetation coverage rate of cropland was typically elevated, enabling the land to sustain high soil moisture levels and diminish the likelihood of ecological drought [64]. In winter and spring, the grass coverage was not very high. The intensity of different types of meteorological drought was highly consistent. Different types of ecological drought frequencies are similar, and drought duration is negatively correlated with drought intensity. Different ecosystems have different sensitivity and response thresholds. Generally speaking, grassland is more sensitive than cropland with a lower threshold. Increased vegetation coverage correlates with a higher susceptibility to drought and a lower threshold [65]. Conversely, some ecosystems may take longer to be affected by drought. The resilience of different ecosystems varies. Soil water retention capacity and permeability also affect the duration and intensity of drought. Sand drains quickly, resulting in shorter durations but higher drought intensities. However, clay soils may have a strong water-holding capacity, resulting in a long duration but lower drought intensity [66].
The meteorological drought characteristics in grasslands converted to croplands were more obvious than those of croplands converted into grasslands, with higher frequencies and longer durations. The extent of cropland is significantly influenced by human activities, resulting in an accelerated rate of soil water alterations, which may increase both the frequency and duration of such events. The characteristics of meteorological drought in grasslands converted to barrens are more obvious, with lower frequencies and longer durations. The conversion of barren to cropland can increase drought frequency and intensify the duration of drought [67]. The conversion of grasslands to barrens can influence vegetation coverage and biodiversity, surface albedo and regional precipitation patterns, and hence drought characteristics. The conversion of barren lands into grasslands can induce drought conditions and establish drought characteristics in previously unaffected regions. The ecological drought characteristics of grassland transitioning to cropland and vice versa are remarkably consistent. This indicates that the ecological water demand balance of the two types of ecosystems is consistent [68]. The ecological drought frequency, duration, and intensity of grassland conversion to barren were higher than those of grassland to barren conversions. The conversion of grassland to barren lands destroyed the ecological water balance in the region and led to the intensification of the frequency and intensity of droughts. The conversion of barren land to grassland, resulting in a shift from an unbalanced to a balanced water ecosystem, can diminish the incidence of droughts.

4.3. Transition from Meteorological Drought to Ecological Drought

Meteorological drought is one of the most basic types of droughts. At present, there are many studies on the transition of meteorological droughts to agricultural and hydrological droughts. Numerous scholars have discovered that agricultural droughts typically lag behind meteorological droughts spatially, with varying lag times across different regions. However, there are relatively few studies on the transition from meteorological drought to ecological drought, and this paper suggests that climate is not the only factor affecting the transition from meteorological drought to ecological drought. The correlation between meteorological drought and ecological drought transitions in the study area is low, only about 55%. While the transition frequency in certain regions reached 90%, this indicates a high transition frequency in a confined area and a pronounced drought transition effect; however, it does not demonstrate that climatic drought is the primary factor influencing ecological drought. The transition frequency was high in the north and low in the south, meaning that the study area is in an ecologically fragile agropastoral ecotone. In the north of this fragile zone, the climate is drier, and the imbalance of ecological water is more likely to occur, which increases the transition frequency. The water and heat conditions in the south of the fragile zone are better than those in the north, the ecological water is more balanced, and the climate has little influence on the ecological drought. Different land use types can form different vegetation coverages, which may also have a certain impact on this transition [69]. Regions with scant vegetation display a deficient or nonexistent vegetation ecosystem; in contrast, locations with abundant vegetation coverage reveal a comparatively excellent vegetation ecosystem. Therefore, the transition from meteorological drought to ecological drought is a more complicated problem.

5. Conclusions

This research shows that the meteorological drought in the Shendong mining area is characterized by a high frequency, short duration, and high intensity, while the ecological drought is characterized by a low frequency, long duration, and low intensity. The study area is located at the junction of semi-arid and semi-humid areas. The inter-monthly and inter-annual variability in temperature and precipitation is significant and severe drought conditions can develop rapidly. Conversely, while the frequency and intensity of ecological drought in the study area are relatively low, the prolonged duration of individual drought events significantly affects the ecosystems of the region.
Increased vegetation coverage correlates with a decreased likelihood of meteorological and ecological drought incidence and transition. The traits of climatic and ecological drought on agricultural land resemble those of grasslands with moderate coverage, and surface vegetation cover can significantly mitigate the frequency of drought to some degree. Regions with increased vegetation density exhibit greater moisture retention, enhanced drought resilience, and a reduced duration of drought conditions.
The frequency of drought and diachronic alterations are more intricate in the drought characteristics of regions undergoing land use change. The drought intensity is largely steady, with high meteorological drought intensity and low ecological drought intensity. The drought characteristics associated with the reciprocal transformation between cultivated land and grassland exhibit considerable consistency. The decline in surface vegetation significantly influences meteorological and ecological drought in the short term.
The transition of meteorological drought to ecological drought is affected by climate, altitude, and soil type, among others. The predominant factors vary across distinct regions of the study area. The contribution degree of climate to the transition of meteorological drought to ecological drought was only about 55%. Various soil types, including semi-fixed aeolian sand, significantly influenced this transition due to their loose structure and inadequate water retention capacity. There were also significant differences in the transition efficiency at different altitudes.
The prevalence of meteorological drought near many major mines in the mining region is considerable. The transition frequency from meteorological drought to ecological drought exceeds 60%. The meteorological drought intensity at Jitu well and Daliuta well is greater than in other mining sites. Therefore, drought-tolerant plants can be selected to carry out guided vegetation restoration in the Shendong mining area. Microbial reclamation technology can be adopted, soil improvement work can be carried out, and so on.

6. Deficiencies and Prospects

6.1. Deficiencies

Firstly, although this study constructed a time series of vegetation growth anomaly data using the total primary productivity of vegetation to represent ecological drought, the factors considered in this construction method are relatively few, and its applicability to other regions is still limited. Secondly, although the run theory can effectively identify drought events on the time scale, there are certain limitations in identifying the same drought event in space. Finally, this study only focused on a typical area in the semi-humid and semi-arid ecotone between agriculture and pastoralism, and the research results have their own particularity.

6.2. Prospects

In view of the deficiencies of this study, we will conduct in-depth research based on it. Firstly, we will attempt to construct an ecological drought index composed of multiple factors and verify its usefulness. We will focus on several parameters closely related to the ecosystem, such as evapotranspiration, the vegetation index, and crop coefficient, to build a more appropriate ecological drought index. Secondly, in addition to using the run theory, we will further consider adopting a three-dimensional identification method in order to better take into account the relationships among time, space, and the event itself, and to more comprehensively identify drought events. Finally, in the future we will consider choosing a larger study area to carry out the work, because the conclusions drawn from a larger study area are more universal and convincing.

Author Contributions

Conceptualization, Y.Z., Z.C. and C.H.; methodology, Z.C. and C.H.; code, H.L. and H.Q.; validation, Z.C., X.Z. and H.L.; formal analysis, X.Z. and H.Q.; investigation, X.Z. and H.Q.; resources, H.Q.; data curation, H.Q. and H.L.; writing—original draft preparation, H.Q.; writing—review and editing, Z.C., C.H. and S.W.; visualization, H.Q. and S.W.; supervision, Y.Z. and H.Z.; project administration, Z.C. and H.Z.; funding acquisition, Y.Z., S.W. and H.Z. All authors have read and agreed to the published version of the manuscript.

Funding

The authors declare that financial support was received for the research, authorship, and/or publication of this article. This work was supported by the State Key Project of the National Natural Science Foundation of China—key projects of the joint fund for regional innovation and development (grant number U22A20620 U21A20108); the Doctoral Science Foundation of Henan Polytechnic University (grant number B2021-20); and the China Shenhua Shendong Science and Technology Innovation Project (grant number E210100573).

Data Availability Statement

The China Regional PML-V2 Land Evapotranspiration and Total Primary Productivity Dataset comes from the National Tibetan Plateau Scientific Data Center (https://data.tpdc.ac.cn/zh-hans/data/40f57c67-33a6-402d-bd37-6ede91919f23 (accessed on 16 September 2024)). The land use type data come from the 1985–2022 provincial-level annual China Land Cover Dataset (CLCD), produced by Professors Yang Jie and Huang Xin from Wuhan University (https://zenodo.org/records/4417809 (accessed on 17 September 2024)). The 1 km monthly precipitation dataset for China (1901–2023) and the 1 km monthly mean temperature dataset for China are from the Tibetan Plateau Data Center (https://www.tpdc.ac.cn/zh-hans/data/faae7605-a0f2-4d18-b28f-5cee413766a2 (accessed on 17 September 2024) and https://www.tpdc.ac.cn/zh-hans/data/71ab4677-b66c-4fd1-a004-b2a541c4d5bf (accessed on 17 September 2024)).

Acknowledgments

All authors acknowledge the reviewers for their insightful suggestions, which have greatly improved the quality of this paper.

Conflicts of Interest

The authors declare no conflicts of interest.

References

  1. Zhao, S.T.; Zhou, R.; Yuan, S.B.; Li, E.H. Protection and Restoration of Shallow Lake Wetland Plants in the Middle and Lower Reaches of the Yangtze River. People’s Yangtze River 2025, 56, 1–19. [Google Scholar]
  2. Tran, T.-N.-D.; Lakshmi, V. Enhancing human resilience against climate change: Assessment of hydroclimatic extremes and sea level rise impacts on the Eastern Shore of Virginia, United States. Sci. Total Environ. 2024, 947, 174289, ISSN 0048-9697. [Google Scholar] [CrossRef]
  3. Tran, T.-N.-D.; Tapas, M.R.; Do, S.K.; Etheridge, R.; Lakshmi, V. Investigating the impacts of climate change on hydroclimatic extremes in the Tar-Pamlico River basin, North Carolina. J. Environ. Manag. 2024, 363, 121375, ISSN 0301-4797. [Google Scholar] [CrossRef]
  4. Wang, Y.L.; Wang, R.; Shan, F.J.; Zhang, Y.X.; Zhao, Y.; Sun, Y. Drought Characteristics Analysis of Corn in Liaoning Province Based on SPEI Index. J. Liaoning Univ. Technol. (Nat. Sci. Ed.) 2024, 44, 273–280. [Google Scholar]
  5. He, L.J.; Long, H.; Li, L.J.; Zhao, Z.Y. Collaborative Visual Analysis of Spatiotemporal Evolution of Agricultural Drought Index in Guizhou. J. Agric. Big Data 2024, 6, 532–545. [Google Scholar]
  6. Gao, J.; Jing, L.H.; Li, H.Y.; Miao, Y.L.; Jing, L.J. Precipitation and Meteorological Drought Change Characteristics in the Tacheng Area of Xinjiang Over the Past 60 Years. Plateau Mt. Meteorol. Res. 2024, 44, 134–142. [Google Scholar]
  7. Xue, L.; Yuan, S.J.; Wang, J.S. Research Progress and Prospects on the Causes of Meteorological Drought in Different Regions of China. Arid. Meteorol. 2023, 41, 1–13. [Google Scholar]
  8. Fan, H.; Dang, X.H.; Zhao, J.Y.; Wang, X.X.; Cheng, X.Q.; Lin, Q.R. Spatiotemporal Changes of Drought in the Arid Northwest Region Based on the Temperature Vegetation Drought Index. Sci. Technol. Eng. 2024, 24, 11537–11546. [Google Scholar]
  9. Song, Y.L. Research Progress on Global Drought Indices. J. Appl. Meteorol. Sci. 2022, 33, 513–526. [Google Scholar]
  10. Li, B.; Xie, J.C.; Hu, Y.H.; Jiang, R.G. Analysis of Spatiotemporal Changes of Drought in Shaanxi Province Based on the Standardized Precipitation Index. Trans. Chin. Soc. Agric. Eng. 2017, 33, 113–119. [Google Scholar]
  11. Li, Y.; Jiang, W.; Chen, X.J.; Wu, Y.J.; Wang, S. Trend of Meteorological Drought from 1961 to 2020 in Ordos Based on the Percentage Deviation of Precipitation. Res. Arid. Zones 2024, 41, 1099–1111. [Google Scholar]
  12. Han, H.T.; Hu, W.C.; Chen, X.J.; Wang, N.A.; Li, G. Comparative Study on Three Meteorological Drought Indices. Res. Arid. Zones 2009, 27, 237–241. [Google Scholar]
  13. Tao, R.; Zhang, K. Analysis of Meteorological Drought Characteristics and Spatiotemporal Changes in China from 1982 to 2015 Based on PDSI. Water Resour. Prot. 2020, 36, 50–56. [Google Scholar]
  14. Wang, C.X.; Zhang, S.Q.; Chen, W.X.; Sun, R. Applicability Analysis and Revision of the Meteorological Drought Composite Index (MCI) in Sichuan Province. Chin. Agric. Sci. Bull. 2019, 35, 115–121. [Google Scholar]
  15. Vicente-Serrano, S.-M.; Begueria, S.; Lopez-Moreno, J.-I. A Multiscalar Drought Index Sensitive to Global Warming: The Standardized Precipitation Evapotranspiration Index. J. Clim. 2010, 23, 1696–1718. [Google Scholar] [CrossRef]
  16. Gao, Y.; Feng, J.; Zhang, C.; Weng, B.; Qin, T. Research Progress on Drought Assessment Indicator System. J. Anhui Agric. Sci. 2012, 40, 11659–11663. [Google Scholar]
  17. Wang, F.; Wang, Z.M.; Yang, H.B.; Zhao, Y. Spatiotemporal Pattern of Drought in the Yellow River Basin Based on SPEI. Sci. China Earth Sci. 2018, 48, 1169–1183. [Google Scholar]
  18. Shi, X.; Chen, F.; Ding, H.; Shi, M.; Li, Y. Assessing Vegetation Ecosystem Resistance to Drought in the Middle Reaches of the Yellow River Basin, China. Int. J. Environ. Res. Public Health 2022, 19, 4180. [Google Scholar] [CrossRef]
  19. Liang, S.Z.; Sui, X.Y.; Wang, M.; Li, X.H.; Dong, H.Y.; Yao, H.M.; Ma, W.D. Multi-timescale Dry-Wet Changes in the Yellow River Basin Based on SPEI. Res. Soil Water Conserv. 2022, 29, 231–241. [Google Scholar]
  20. Liu, D.; Esquivel-Muelbert, A.; Acil, N.; Astigarraga, J.; Cienciala, E.; Fridman, J.; Kunstler, G.; Matthews, T.J.; Ruiz-Benito, P.; Sadler, J.P.; et al. Mapping multi-dimensional variability in water stress strategies across temperate forests. Nat. Commun. 2024, 15, 8909. [Google Scholar] [CrossRef]
  21. Sadiqi, S.-S.-J.; Hong, E.-M.; Nam, W.-H.; Kim, T. Review: An integrated framework for understanding ecologicaldrought and drought resistance. Sci. Total Environ. 2022, 846, 157477. [Google Scholar] [CrossRef]
  22. Karmaoui, A.; El Jaafari, S.; Chaachouay, H.; Hajji, L. The socioecological system of the pre-Sahara zone of Morocco: A con-ceptual framework to analyse the impact of drought and desertification. GeoJournal 2022, 87, 4961–4974. [Google Scholar] [CrossRef]
  23. Paz, H.; Pineda-García, F.; Pinzón-Pérez, L.F. Root depth and morphology in response to soil drought: Comparing ecological groups along the secondary succession in a tropical dry forest. Oecologia 2015, 179, 551–561. [Google Scholar] [CrossRef]
  24. Su, X.; Jiang, T.; Niu, J. Concept and research progress of ecological drought. Water Res. Prot. 2021, 37, 15–21. [Google Scholar]
  25. Lan, M.Y.; Zhou, D.Z.; Guan, Y.H. Spatiotemporal Changes of Normalized Vegetation Index and Its Driving Factors in Yan’an City. J. Zhejiang AF Univ. 2024, 41, 1293–1302. [Google Scholar]
  26. Wen, X.D.; Luo, Z.H.; Fu, L.G. Impact of Climate and Land Use Changes on the Spatiotemporal Variation of Enhanced Vege-tation Index in the Guangdong-Hong Kong-Macao Greater Bay Area. Ecol. Sci. 2023, 42, 222–232. [Google Scholar]
  27. Yin, B.S.; Li, Z.F.; Yue, R.; Lv, S.H.; Li, F.L. Monitoring of Drought Conditions in the Guanzhong Area Based on the Temperature Vegetation Drought Index. Trans. Chin. Soc. Agric. Eng. 2024, 40, 111–119. [Google Scholar]
  28. Eltahir, E.A.B.; Yeh, P.J.F. On the asymmetric response of aquifer water level to floods and droughts in Illinois. Water Resour. Res. 1999, 35, 1199–1217. [Google Scholar] [CrossRef]
  29. Peters, E. Propagation of Drought Through Groundwater Systems: Illustrated in the Pang (UK) and Upper-Guadiana(ES) Catch-ments. Ph.D. Thesis, Wageningen University, Wageningen, The Netherlands, 2003. [Google Scholar]
  30. Konapala, G.; Mishra, A. Review of complex networks application in hydroclimatic extremes with an implementation to char-acterize spatio-temporal drought propagation in continental USA. J. Hydrol. 2017, 555, 600–620. [Google Scholar] [CrossRef]
  31. Mishra, A.-K.; Ines, A.-V.-M.; Das, N.-N.; Khedun, C.P.; Singh, V.P.; Sivakumar, B.; Hansen, J.W. Anatomy of a local-scale drought: Application of assimilated remote sensing products, crop model, and statistical methods to an agricultural drought study. J. Hydrol. 2015, 52, 615–629. [Google Scholar] [CrossRef]
  32. Han, Z.; Huang, S.; Huang, Q.; Leng, G.; Wang, H.; Bai, Q.; Zhao, J.; Ma, L.; Wang, L.; Du, M. Propagation dynamics from meteorological to groundwater drought and their possible influence factors. J. Hydrol. 2019, 57812. [Google Scholar] [CrossRef]
  33. Guo, Y.; Huang, S.; Huang, Q.; Leng, G.; Fang, W.; Wang, L.; Wang, H. Propagation thresholds of meteorological drought for triggering hydrological drought at various levels. Sci. Total Environ. 2020, 712, 136502. [Google Scholar] [CrossRef]
  34. Han, Z.; Huang, S.; Huang, Q.; Bai, Q.; Leng, G.; Wang, H.; Zhao, J.; Wei, X.; Zheng, X. Effects of vegetation restoration on groundwater drought in the Loess Plateau, China. J. Hydrol. 2020, 591, 125566. [Google Scholar] [CrossRef]
  35. Su, X.L.; Chu, J.D.; Zhang, T.; Jiang, T.L.; Wang, G.Z. Spatiotemporal Evolution Trend of Groundwater Drought and Its Dynamic Response to Meteorological Drought in Northwest China. Water Resour. Prot. 2022, 38, 34–42. [Google Scholar]
  36. Wang, Y.; Zhang, Y.; Cheng, Y.; Xu, L.; Guo, J.; Wang, H.; Li, J.; Du, S.H. Remote Sensing Monitoring and Spatiotemporal Change Analysis of Vegetation Cover under Coal Mining Activities in the Shendong Mining Area from 1986 to 2023. Remote Sens. Nat. Resour. 2024, 1–11. [Google Scholar]
  37. Chen, Z.; Zhu, Z.; Zhang, X.; Jiao, Y.; Cheng, Y.; Wang, S.; Zhang, H. Study on spatiotemporal evolution of ecosystem services, spatio-temporal pattern of tradeoff/synergy relationship and its driving factors in Shendong mining area. Front. Environ. Sci. 2024, 12, 1445833, ISSN 2296-665X. [Google Scholar]
  38. Jia, Y.; Chen, S.; Deng, Q. Impact of Surface Fractures Induced by Multiple Coal Seam Mining on Soil Physicochemical Properties. Res. Soil Water Conserv. 2025, 32, 98–107. [Google Scholar]
  39. Zhang, Y.; He, S. PML-V2(China): Evapotranspiration and Gross Primary Production Dataset (2000.02.26–2020.12.31); National Tibetan Plateau/Third Pole Environment Data Center: Beijing, China, 2022. [Google Scholar] [CrossRef]
  40. He, S.; Zhang, Y.; Ma, N.; Tian, J.; Kong, D.; Liu, C. A daily and 500 m coupled evapotranspiration and gross primary production product across China during 2000–2020. Earth Syst. Sci. Data 2022, 14, 5463–5488. [Google Scholar] [CrossRef]
  41. Zhang, Y.; Kong, D.; Gan, R.; Chiew, F.H.S.; McVicar, T.R.; Zhang, Q.; Yang, Y. Coupled estimation of 500m and 8-day resolution global evapotranspiration and gross primary production in 2002–2017. Remote Sens. Environ. 2019, 222, 165–182. [Google Scholar] [CrossRef]
  42. Zhang, Y.; Peña-Arancibia, J.L.; McVicar, T.R.; Chiew, F.H.S.; Vaze, J.; Liu, C.; Lu, X.; Zheng, H.; Wang, Y.; Liu, Y.Y.; et al. Multi-decadal trends in global terrestrial evapotranspiration and its components. Sci. Rep. 2016, 6, 19124. [Google Scholar] [CrossRef]
  43. Peng, S. 1-km monthly precipitation dataset for China (1901–2023); National Tibetan Plateau/Third Pole Environment Data Center: Beijing, China, 2020. [Google Scholar]
  44. Peng, S.Z.; Ding, Y.X.; Wen, Z.M.; Chen, Y.M.; Cao, Y.; Ren, J.Y. Spatiotemporal change and trend analysis of potential evapotranspiration over the Loess Plateau of China during 2011–2100. Agric. For. Meteorol. 2017, 233, 183–194. [Google Scholar] [CrossRef]
  45. Ding, Y.X.; Peng, S.Z. Spatiotemporal trends and attribution of drought across China from 1901–2100. Sustainability 2020, 12, 477. [Google Scholar] [CrossRef]
  46. Peng, S.Z.; Ding, Y.X.; Liu, W.Z.; Li, Z. 1 km monthly temperature and precipitation dataset for China from 1901 to 2017. Earth Syst. Sci. Data 2019, 11, 1931–1946. [Google Scholar] [CrossRef]
  47. Peng, S.; Gang, C.; Cao, Y.; Chen, Y. Assessment of climate change trends over the loess plateau in China from 1901 to 2100. Int. J. Climatol. 2017, 38, 2250–2264. [Google Scholar] [CrossRef]
  48. Yang, J.; Huang, X. The 30 m annual land cover datasets and its dynamics in China from 1985 to 2022 [Data set]. In Earth System Science Data; Zenodo: Genève, Switzerland, 2023; Volume 13, pp. 3907–3925. [Google Scholar]
  49. Tian, X.; Shao, X.; Zhang, Y.; Feng, R.; Wu, T.; Chen, B.; Bian, N. Spatial distribution and transmission relationship of meteorological drought and ecological drought in Ordos in recent 20 years. Geogr. Res. 2019, 43, 1878–1890. [Google Scholar]
  50. Yu, Z.; Wang, J.; Liu, S.; Rentch, J.S.; Sun, P.; Lu, C. Global gross primary productivity and water use efficiency changes under drought stress. Environ. Res. Lett. 2017, 12, 014016. [Google Scholar] [CrossRef]
  51. Wei, X.; He, W.; Zhou, Y.; Ju, W.; Xiao, J.; Li, X.; Liu, Y.; Xu, S.; Bi, W.; Zhang, X.; et al. Global assessment of lagged and cumulative effects of drought on grassland gross primary production. Ecol. Indic. 2022, 136, 108646. [Google Scholar] [CrossRef]
  52. Zhang, X.; Wang, R.; Shan, F.; Zhang, T.; Wang, Y. Spatiotemporal distribution characteristics of drought in the three northeastern provinces of China from 1961 to 2020. J. Irrig. Drain. 2024, 43, 78–88. [Google Scholar]
  53. Xiao, P.; Ma, Z.Z.; Zhang, X.H.; Xiao, X.; Gou, Q.S.; Guo, M.Y.; Lin, P.F. Groundwater drought characteristics and dynamic response to meteorological drought in the plain area of Qingdao. Water Resour. Hydropower Technol. (Chin. Engl.) 2025, 1–21. [Google Scholar]
  54. Li, J.Z.; Wang, Y.X.; Li, S.F.; Hu, R. A Nonstationary Standardized Precipitation Index incorporating climate indices as covariates. J. Geophys. Res. Atmos. 2015, 120, 12082–12095. [Google Scholar] [CrossRef]
  55. Khoshnazar, A.; Corzo Perez, G.A. Wet-environment Evapotranspiration and Precipitation Standardized Index (WEPSI) for drought assessment and monitoring. Earth Syst. Sci. Data 2021, 13, 1393–1411. [Google Scholar] [CrossRef]
  56. Wen, G.T.; Bai, J.J.; Sun, S.S. Analysis of drought variation characteristics in Shaanxi Province from 2004 to 2014 based on time series remote sensing data. Arid. Zone Res. 2018, 36, 221–229. [Google Scholar]
  57. Li, Y.; Huang, Y.; Li, Y.; Zhang, H.; Fan, J.; Deng, Q.; Wang, X. Spatiotemporal heterogeneity in meteorological and hydrological drought patterns and propa-gations influenced by climatic variability, LULC change, and human regulations. Sci. Rep. 2024, 14, 5965. [Google Scholar]
  58. Yin, Y.; Ma, D.; Wu, S. Enlargement of the semi-arid region in China from 1961 to 2010. Clim. Dyn. 2019, 52, 509–521. [Google Scholar] [CrossRef]
  59. Xu, Q. Ecological Restoration Technology Evaluation in the Shendong Mining Area. Master’s Thesis, China University of Mining and Technology, Xuzhou, China, 2022. [Google Scholar]
  60. Shao, T.Y. Study on the Dynamic Changes of Soil Surface Moisture Content in Shendong Mining Area Based on TVDI. Master’s Thesis, Inner Mongolia Agricultural University, Hohhot City, China, 2023. [Google Scholar]
  61. Li, Y.; Zhang, Q.; Zhang, A.; Chen, Y.; Yang, M. Characteristics and influencing factors of boundary layer change in arid and semi-arid region. Plateau Meteorol. 2016, 35, 385–396. [Google Scholar]
  62. Liu, Y.; Lei, S.; Chen, X.; Chen, M.; Yang, Y.M.; Li, X.H.; Zhang, X.Y.; Long, L.; Bian, Z. Analysis of temporal changes and driving factors of vegetation coverage in Shendong Mining area and its guided restoration strategy. J. China Coal Soc. 2021, 46, 3319–3331. [Google Scholar]
  63. Zhou, G.Y.; Zhou, L.Y.; Shao, J.J.; Zhou, X.H. Effects of extreme drought on terrestrial ecosystems: Review and prospects. Chin. J. Plant Ecol. 2020, 44, 515–525. [Google Scholar] [CrossRef]
  64. Jiang, R.; Liang, J.; Zhao, Y.; Wang, H.; Xie, J.; Lu, X.; Li, F. Assessment of vegetation growth and drought conditions using satellite-based vegetation health indices in Jing-Jin-Ji region of China. Sci. Rep. 2021, 11, 13775. [Google Scholar] [CrossRef]
  65. Su, J.; Fan, L.; Yuan, Z.; Wang, Z.; Wang, Z. Quantifying the drought sensitivity of grassland under different climate zones in Northwest China. Sci. Total Environ. 2024, 910, 168688. [Google Scholar] [CrossRef]
  66. Zhang, Y.-W.; Wang, K.-B.; Wang, J.; Liu, C.; Shangguan, Z.-P. Changes in soil water holding capacity and water availability following vegetation restoration on the Chinese Loess Plateau. Sci. Rep. 2021, 11, 9692. [Google Scholar] [CrossRef]
  67. Gao, S.; Wang, F.; Men, R.; Yan, S.; Wang, Z.; Lai, H.; Li, Y.; Guo, W. The Propagation Characteristics of Meteorological Drought to Vegetation Drought Based on Three-Dimensional Clustering Algorithm in China. Agronomy 2024, 14, 2067. [Google Scholar] [CrossRef]
  68. Zhang, L.; Chang, J.X.; Guo, A.; Zhou, K.; Yang, G.; Zou, D. Ecological drought evolution characteristics under different climatic regions in the Yangtze River basin. J. Hydrol. 2023, 629, 130573. [Google Scholar] [CrossRef]
  69. Zhao, A.Z.; Liu, X.F.; Zhu, X.F.; Pan, Y.Z.; Chen, S.C. Spatiotemporal changes of vegetation cover in the Loess Plateau from 2000 to 2014 and their attribution. Chin. Environ. Sci. 2016, 36, 1568–1578. [Google Scholar]
Figure 1. Study location map.
Remotesensing 17 01064 g001
Figure 2. Mean of the total primary productivity of vegetation in the Shendong mining area from 2001 to 2020.
Remotesensing 17 01064 g002
Figure 3. Mean temperature and precipitation in the Shendong mining area from 2001 to 2020.
Remotesensing 17 01064 g003
Figure 4. Drought events and their characteristic identifications. (a) Recognition pixel (b) Mark continuous pixels (c) Identification event.
Remotesensing 17 01064 g004
Figure 5. Schematic diagram of the transition of a meteorological drought to an ecological drought.
Remotesensing 17 01064 g005
Figure 6. Spatial distribution of meteorological drought characteristics in the Shendong mining area.
Remotesensing 17 01064 g006
Figure 7. Spatial distribution of ecological drought characteristics in the Shendong mining area.
Remotesensing 17 01064 g007
Figure 8. Areas with stable land uses in the Shendong mining area from 2001 to 2020.
Remotesensing 17 01064 g008
Figure 9. Characteristics of meteorological drought in stable land use types of the Shendong mining area.
Remotesensing 17 01064 g009
Figure 10. Ecological drought characteristics of stable land uses in the Shendong mining area.
Remotesensing 17 01064 g010
Figure 11. Land use change areas in the Shendong mining area from 2001 to 2020.
Remotesensing 17 01064 g011
Figure 12. Land use changes in the Shendong mining area from 2001 to 2020.
Remotesensing 17 01064 g012
Figure 13. Regional meteorological drought characteristics for land use conversions in the Shendong mining area.
Remotesensing 17 01064 g013
Figure 14. Regional ecological drought characteristics of land use type changes in the Shendong mining area.
Remotesensing 17 01064 g014
Figure 15. Frequency and correlation between meteorological and ecological droughts in the Shendong mining area.
Remotesensing 17 01064 g015
Figure 16. Distribution map of main soil types in the Shendong mining area (redrawn from China’s 1:400,000 Soil Map of China).
Remotesensing 17 01064 g016
Table 1. Main data sources.
Data TypeData NameResolutionTime and Space RangeTime and Space Range of UseBibliography
GPP dataThe China Regional PML-V2 Land Evapotranspiration and Total Primary Productivity Dataset1 day, 500 m2000.02.26–2020.12.312001–2020, 1 kmZhang et al. [39,40,41,42]
Temperature data1 km monthly mean temperature dataset for China1 month, 1 km1901–20232001–2020, 1 kmPeng et al. [43,44,45,46,47]
Precipitation data1 km monthly precipitation dataset for China1 month, 1 km1901–20232001–2020, 1 kmPeng et al. [43,44,45,46,47]
Land use/land cover dataAnnual China Land Cover Dataset, CLCD1 year, 30 m1985–20222001–2020, 1 kmYang and Huang et al. [48]
Table 2. SPI classification criteria.
GradeTypeSPI Value
1Normal drought and moist conditions−0.5 < SPI
2Mild drought−1.0 < SPI ≤ −0.5
3Moderate drought−1.5 < SPI ≤ −1.0
4Severe drought−2.0 < SPI ≤ −1
5Extreme droughtSPI ≤ −2.0
Table 3. Correlation between meteorological and ecological droughts in stable land uses.
CorrelationCroplandGrassland
Low Vegetative CoverageLow-to-Medium CoverageMedium CoverageMedium-to-High CoverageHigh Vegetative Coverage
Drought frequency0.710.730.720.690.660.38
Drought duration0.960.950.930.910.840.38
Drought intensity0.370.750.410.410.400.11
Table 4. Correlation between meteorological and ecological droughts in converted land uses.
CorrelationBefore ConversionCroplandGrasslandGrasslandBarrenCroplandBarren
After ConversionGrasslandCroplandBarrenGrasslandBarrenCropland
Drought frequency0.680.680.59−0.150.56−0.26
Drought duration0.930.920.85−0.210.81−0.44
Drought intensity0.400.510.52−0.390.49−0.53
Disclaimer/Publisher’s Note: The statements, opinions and data contained in all publications are solely those of the individual author(s) and contributor(s) and not of MDPI and/or the editor(s). MDPI and/or the editor(s) disclaim responsibility for any injury to people or property resulting from any ideas, methods, instructions or products referred to in the content.

