Article

Rapid Laser Ranging Method for Compact LiDAR Systems

State Key Laboratory of Digital Manufacturing Equipment and Technology, School of Mechanical Science and Engineering, Huazhong University of Science and Technology, Wuhan 430074, China
*
Author to whom correspondence should be addressed.
Remote Sens. 2025, 17(6), 1002; https://doi.org/10.3390/rs17061002
Submission received: 17 January 2025 / Revised: 24 February 2025 / Accepted: 11 March 2025 / Published: 12 March 2025

Abstract

:
We propose a rapid laser ranging method for compact LiDAR systems. It employs a high signal-to-noise ratio (SNR) coherent detection scheme to minimize the required measurement integration time, while also addressing key challenges encountered by existing rapid coherent ranging methods in compact systems—namely, device fabrication difficulties, the complexity of parallel Doppler frequency shift (DFS) decoupling, and endpoint effect elimination—through low-depth pseudo-random phase modulation (LD-PRPM). Furthermore, it introduces sliding window analysis, which fully harnesses the advantages of continuous-wave measurement and further boosts the ranging rate. In addition, the proposed method is adaptive and resistant to interference. Analysis and experiments validate its effectiveness. In the experiments, the method demonstrated a ranging accuracy of 5 mm, a ranging precision of 2 mm (1σ), and a rapid ranging rate of 10 MHz. These results may offer valuable references for enhancing the temporal or spatial resolution of the compact LiDAR system.

1. Introduction

Advanced applications in manned or unmanned platforms, such as rapid autonomous relative positioning and high-resolution 3D reconstruction, impose strict demands on the temporal or spatial resolutions of the imaging LiDAR (~100 Hz frame rate or ~10 megapixels per frame), which consequently present severe challenges for data rates of built-in laser ranging systems (~10 megahertz) [1,2,3]. In addition, most platforms place stringent size, weight, and power (SWaP) constraints on the embedded LiDAR, meaning that rapid laser ranging must be implemented within the restricted SWaP.
Currently, the engineering-applicable data rates of laser ranging systems are in the range of hundreds of kilohertz, far below the above requirement (single-line system index, the multi-line system will not be discussed this paper. On the one hand, performance improvements in single-line systems are linear to those of multi-line systems; on the other hand, multi-line systems involve additional barriers in terms of complexity, stability, consistency, and power consumption). This limitation mainly stems from the extensive adoption of the direct time-of-flight (dTOF) method. It determines the target’s distance by directly measuring the round-trip time of the laser beam, and measures only once in a pulse period. Most of the time taken is wasted waiting for the echo signal [4], which significantly diminishes the measurement efficiency.
To address this problem, Kim et al. at Yeungnam University proposed the DS-OCDMA method, which eliminates the idle listening time of the LiDAR by coding the pulses [5,6]. The engineering implementation of this method posed challenges, so it remained at the simulation stage. Wang et al. from Tsinghua University proposed a ranging method named the DDMA method, which used an m-sequence with a 150 MHz code rate to pulse-modulate the laser amplitude, and realized high-speed ranging by segmented matched filtering and delay finding [7,8]. However, due to the non-coherent detection regime, reliable detection of the target relies on long integration time, so the actual dynamic characteristic of the laser ranging system is still greatly limited. As a matter of fact, the low-detection SNR is a common problem for non-coherent measurements. When system power is limited, non-coherent measurements often require coherent or non-coherent superposition of multiple electronic signals to achieve effective detection. Since rapid ranging inherently limits the integration length of the signal in the time domain, non-coherent ranging is not suitable for high-speed applications to some extent. The use of a single-photon detector is a possible solution to the SNR problem, but there are still bottlenecks in its actual implementation, due to device integration, room temperature noise reduction, and so on [9].
Compared to non-coherent systems, coherent laser ranging offers a better measurement SNR with the same transmission power. As a result, it enables effective signal detection with shorter integration times, making it more suitable for high-speed applications. Current studies on rapid coherent laser ranging focus on two technical approaches. The first approach leverages high-repetition-rate linear-frequency-modulated continuous-wave (LFMCW) laser chirp to achieve rapid distance measurement. Although on-chip LFMCW laser sources operating at megahertz repetition rates have been demonstrated for ranging applications [10,11,12], the fabrication of these sources remains extremely challenging. When considering more general-purpose semiconductor lasers as alternatives, their implementation requires linear calibration techniques such as optoelectronic phase-locked looping [13], pre-distortion techniques [14], resampling methods [15], iterative learning algorithms [16] or phase comparisons [17], which still face significant obstacles in high-repetition-rate situations. Moreover, the LFMCW laser ranging method generates non-monophonic beat signals when the frequency modulation of the local chirp is reversed, called the endpoint effect. This part of signal is invalid for measurement, and its energy, as a percentage of the total signal energy, is equal to the time of flight divided by the repetition period of the laser chirp. In high-speed measurement, the repetition period of the laser chirp is short, leading to large proportions of invalid regions, low effective signal power, and decreased detection SNRs. In contrast, the second approach utilizes wide-bandwidth, low-repetition-rate LFMCW laser chirp combined with time–frequency analysis techniques to achieve high-speed measurements [18], which mitigates the endpoint effect. However, it still has two major shortcomings. Miniaturizing narrow-linewidth, wide-bandwidth LFMCW laser sources is technically challenging, and it is inherently unsuitable for measuring moving targets with DFS, an issue that is nearly critical in LiDAR applications. Even if this system could be equipped with advanced parallel DFS decoupling technologies, such as synchronously and reversely frequency sweeping dual-lasers [19], four-wave-mixing-based double sideband sweeping [20], external modulator-based double sideband modulation [21], auxiliary interferometric vibration measurement [22], or algorithmic analysis [23], it would remain unsuitable for low-SWaP rapid ranging systems. It might also suffer from challenges, including with regard to complex systems and difficult synchronization, hard fabrication, low energy utilization, difficult integration, or poor dynamic performance. In addition to the aforementioned methods, researchers have also explored rapid laser ranging techniques based on advanced devices such as on-chip optical frequency combs [24,25,26]. Although they exhibit excellent measurement performance, fabrication challenges limit their short-term applicability in specific fields.
Herein, we propose a novel rapid laser ranging method. This method is based on a high-SNR coherent detection scheme, ensuring effective target detection with short measurement integration time. Meanwhile, through LD-PRPM, it tackles the challenges faced by traditional rapid coherent ranging methods, including device fabrication difficulties, the complexity of parallel DFS decoupling, and the presence of endpoint effects. Moreover, the proposed method employs sliding window analysis, fully leveraging the merits of continuous-wave measurements and further enhancing measurement speeds. In addition, the proposed method offers several additional advantages, such as adaptivity and resistance to interference. The effectiveness of the proposed method was verified by analysis and experiments. In the experiments, the proposed method demonstrated a ranging accuracy of 5 mm, a ranging precision of 2 mm (1σ), and a ranging rate of 10 MHz, which is essential for improving the resolution and frame rate of the LiDAR system. What is more, the proposed method is enlightening for other related fields, such as coherent optical communication [27], gravitational wave detection [28], ultrasonic measurement [29], remote sensing [30], and so on.

2. Principles

A schematic diagram of the proposed method is shown in Figure 1. The narrow-linewidth laser generated by the distributed feedback (DFB) laser is split by a fiber coupler. One beam is sent to a 90° optical hybrid as the local oscillation light. The other beam is low-depth phase modulated with a periodic pseudo-random binary sequence (PRBS) by the electro-optic modulator (EOM), simultaneously generating modulated and unmodulated optical carriers. Then, the carriers are transmitted to the target. The backscattered light of the target is coupled back to the fiber, and goes into the 90° optical hybrid as a signal light, which interferes with the local oscillation light and forms four interfering optical signals with a phase difference of 90°. They are differentially acquired by the balanced detectors to form two quadrature interference photocurrent signals II and IQ. Due to the low-depth phase modulation, the quadrature interference photocurrent signals contain modulated and unmodulated components, respectively, formed by the modulated and unmodulated optical carriers. Therefore, the DFS of the target can be parallelly derived and decoupled from the unmodulated component, and then the total delay between the local reference and the signal light can be obtained from the modulated component to accomplish ranging. On this basis, the sliding window analysis of photocurrent signals is performed, enabling further improvements of the temporal resolution of the measurement.

2.1. Coherent Detection with LD-PRPM

We assume the field of local oscillation light is:
E l o = E 0 e i 2 π f c t
where E 0 is the field amplitude and f c is the field frequency.
With phase modulation and target Doppler effect modulation, the signal light field E s i g is:
E s i g = E 1 e i φ 0 e i 2 π f c + f d t e i β a t τ 0 τ t o f
where E 1 is the field amplitude of the signal light, φ 0 is the offset of the phase bias between the local oscillation light and the signal light, f d is the DFS caused by the radial velocity of the target, and β is phase modulation depth coefficient of PRBS. a t denotes the reference PRBS waveform, with τ 0 and τ t o f respectively being internal signal delay and time of flight of the laser. a t is given by:
a t = n = 0 N 1 a n rect t n T c T c
where N is total length of the PRBS, and a n is the value of the nth chip of PRBS. Using bipolar PRBS, there is a n 1 , 1 . T c represents the chip width, and rect depicts a rectangular window function:
rect t T = 1 ,   0 t < T 0 ,   Others
The local oscillation light and the signal light interfere in the 90° optical hybrid. Assuming that the two beams are of the same polarization state, and the 90° optical hybrid is an ideal device, the four interfering optical signals with a phase difference of 90° are:
E I + E I E Q + E Q = 1 / 2 1 / 2 1 / 2 1 / 2 1 / 2 i / 2 1 / 2 i / 2 E s i g E l o
where E I + , E I , E Q + and E Q are their electric fields. Therefore, the quadrature interference photocurrent signals from balance detectors can be deduced as:
I I t I Q t = K R E I + 2 E I 2 E Q + 2 E Q 2 = K R E 0 E 1 cos β a t τ 0 τ t o f + 2 π f d t + φ 0 sin β a t τ 0 τ t o f + 2 π f d t + φ 0
where K is the ratio constant of the photoelectric conversion and R is detector responsivity.
We define the complex photocurrent signal I as:
I t = I I t + i I Q t = K R E 0 E 1 e i 2 π f d t + φ 0 cos β a t τ 0 τ t o f + i sin β a t τ 0 τ t o f
With the association of Equations (3) and (7), I becomes:
I t = K R E 0 E 1 e i 2 π f d t + φ 0 cos β + i sin β a t τ 0 τ t o f
Then, the complex photocurrent signal and the reference PRBS are matched filtered:
r t = I t a t = I τ a τ + t d τ
where denotes the correlation operation. This process is also called electronic de-chirping.
With Equations (3) and (8) substituted into Equation (9), we have:
r t = K R E 0 E 1 cos β e i 2 π f d τ + φ 0 a τ + t d τ + i K R E 0 E 1 sin β e i 2 π f d τ + φ 0 a τ τ 0 τ t o f a τ + t d τ
Under the condition that the total length N is large enough and the phase modulation depth coefficient β is inadequately small, Equation (10) can be simplified to:
r t i K R E 0 E 1 sin β e i 2 π f d τ + φ 0 a τ τ 0 τ t o f a τ + t d τ
If the Doppler effect generated by the target is negligible, the DFS term can be directly removed from the integration. Then, the norm of Equation (11) can be simplified and calculated as:
r t K R E 0 E 1 sin β R a a t + τ 0 + τ t o f
where R a a t is the autocorrelation function of PRBS.
According to the coding theory, the m-sequence poses excellent autocorrelation, a high peak sidelobe ratio (PSLR), as well as easy generation features, and can effectively improve the ability of the ranging system to resist narrowband or broadband interference. Therefore, we choose m-sequence for phase modulation. The normalized theoretical autocorrelation function of the m-sequence is:
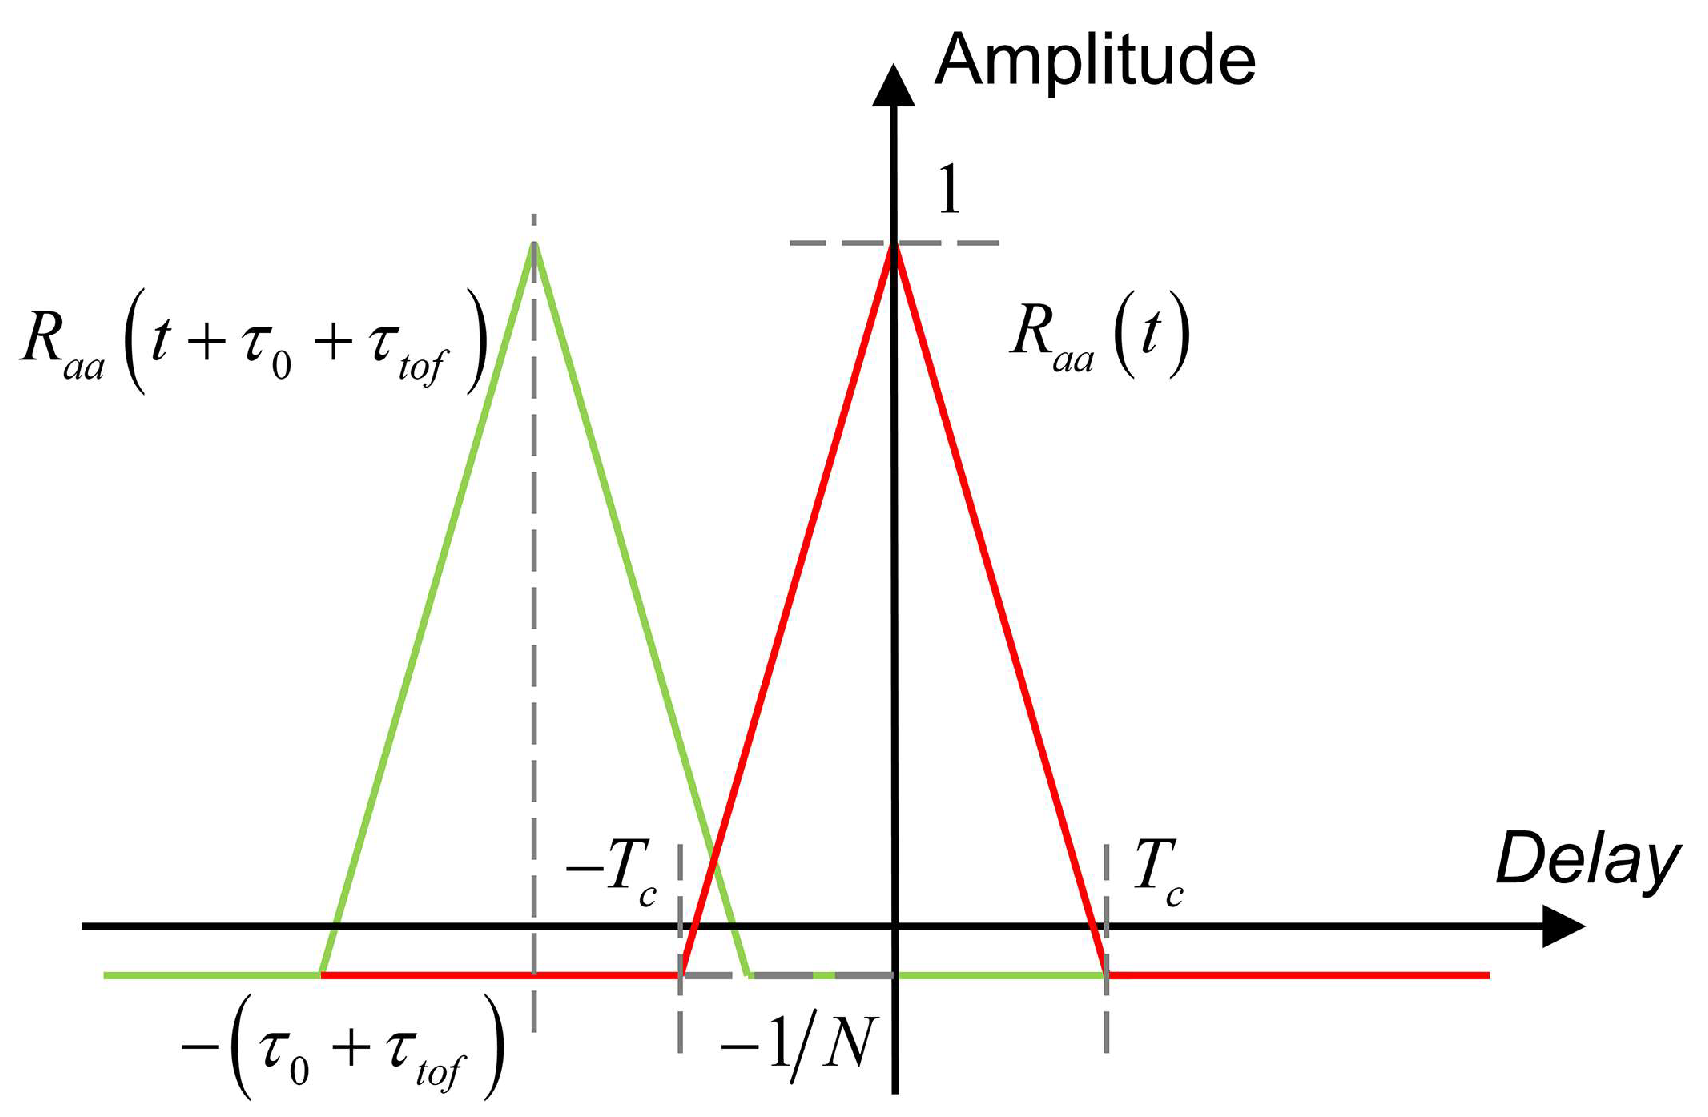
R a a = 1 t T c 1 + 1 N , 0 t < T c 1 N , T c t N 1 T c
Its plot (shown in red line), along with the plot of R a a t + τ 0 + τ t o f (shown in green line), whose peak coordinates is τ 0 + τ t o f , is shown in Figure 2.
Therefore, the total delay can be obtained by matched filtering the complex photocurrent signal with the reference PRBS a t , obtaining the norm of the result, and searching its peak. Further, the internal signal time delay τ 0 can be obtained by offline parameter calibration, and then the time-of-flight τ t o f can be calculated.
In this way, the distance to the target is given as:
d = τ t o f c 2
where c is the speed of light.
So far, laser ranging is realized with N being large enough, the phase modulation depth coefficient β being inadequately small, and the DFS of target being negligible.
During ranging, the weak echo signal experiences two gain processes. One is coherent enhancement in the light, which amplifies the echo signal with the local oscillator light, as shown in Equation (6). The other is coherent accumulation in the RF field, which narrows signal bandwidth with matched filtering, as shown in Equation (12). These signal gain processes are similar to those of the FMCW laser ranging, so the proposed method exhibits high measurement SNR as well. This is very important in rapid ranging applications, indicating that the ranging system allows measurements with low laser power and short integration times.
However, due to the extremely short laser wavelength, the DFS in coherent laser ranging is particularly significant and has an immense impact on ranging, so it cannot be ignored.
The ambiguity function of PRBS is defined by:
X t , f d = a τ a τ + t e i 2 π f d τ d τ
which is similar to the PRBS autocorrelation function R a a t , but with the DFS of the target taken into account. Substituting Equation (15) into Equation (11) and calculating its norm, we can obtain:
r t K R E 0 E 1 sin β X t + τ 0 + τ t o f , f d
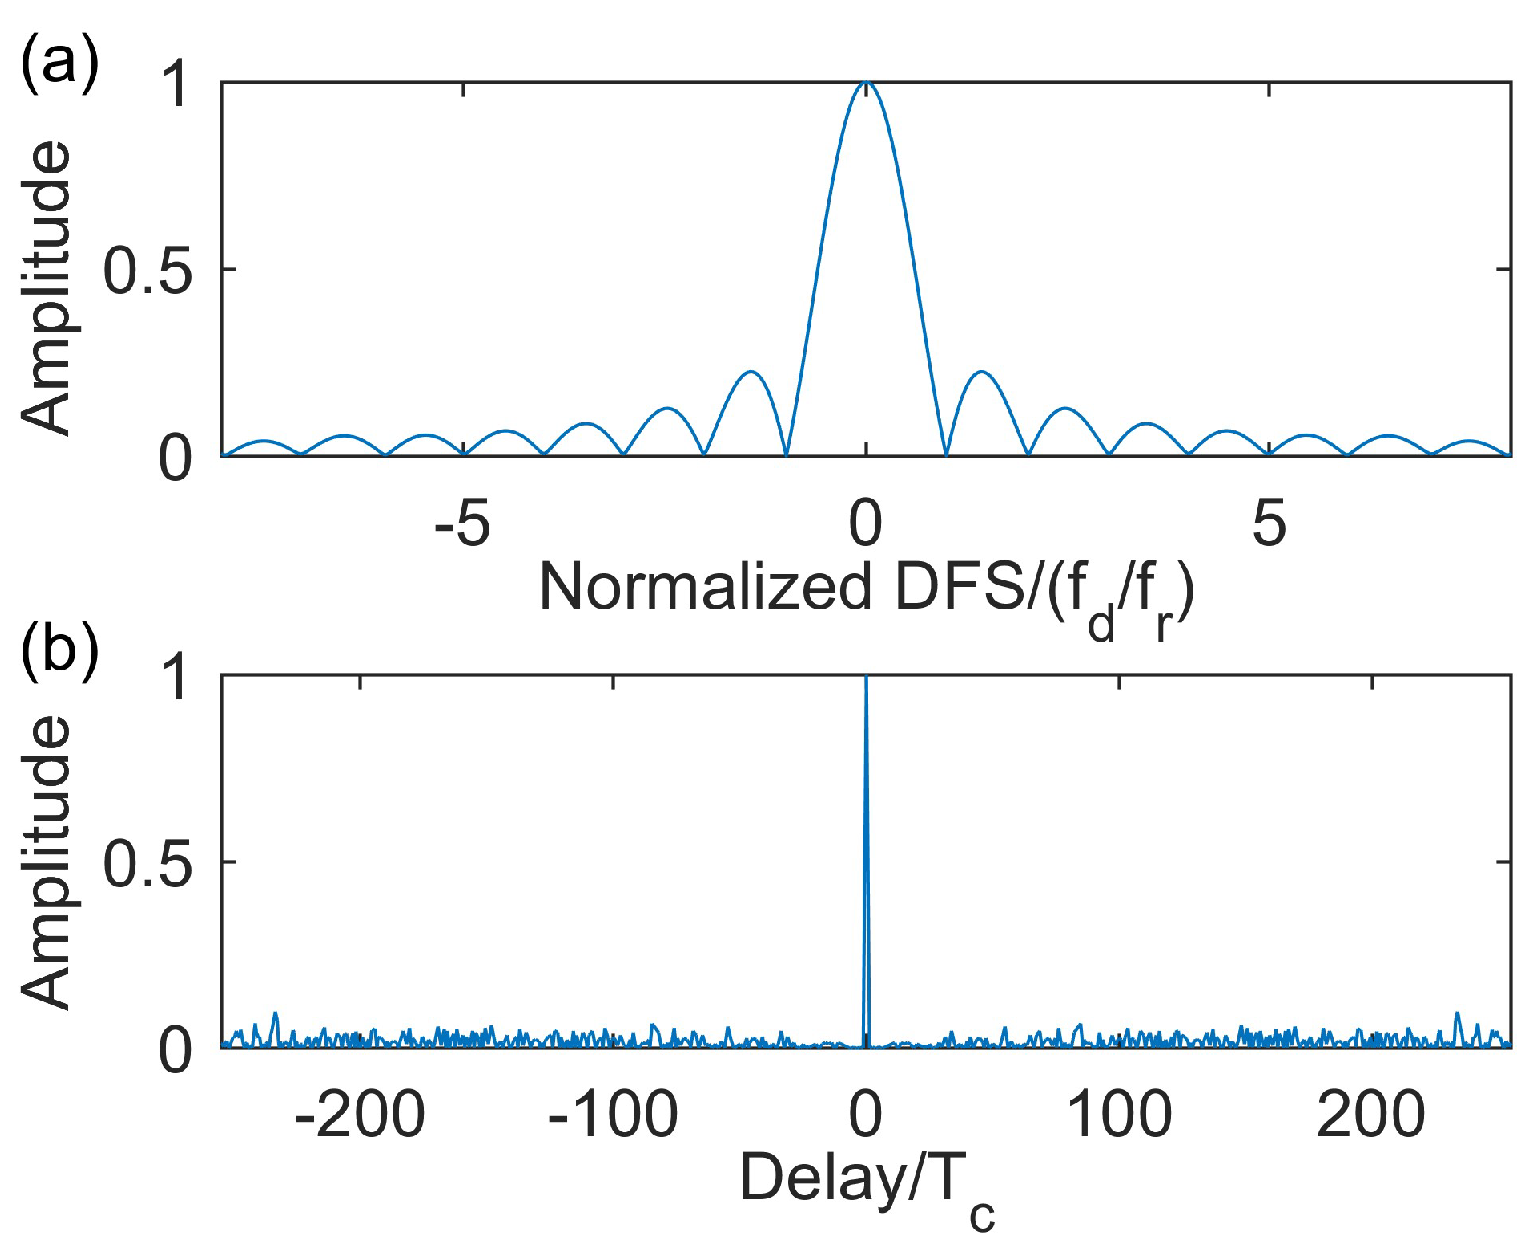
This means that the result of the matched filter can be evaluated by the ambiguity function. The normalized ambiguity function of the seventh-order m-sequence ( N = 2 7 1 = 255 ) is shown in Figure 3 (shades of colors correspond to changes in amplitudes), along with its zero-delay profile and zero-DFS profile, shown in Figure 4. The normalized DFS defined in figures is the ratio of the DFS f d and the repetition frequency f r = 1 / N T c of PRBS.
These figures show that with the increase in DFS, even if the time delay of the two PRBS sequences is zero, the correlation peak amplitude still has a large attenuation, resulting in detection failure. Therefore, DFS detection and compensation abilities are essential for this coherent ranging system.
From Equation (8), we know that the energy of the interference signal is distributed to two nearly orthogonal dimensions. So, we can let β = π / 4 , evenly distributing the power for ranging and DFS decoupling. In this case, Equation (8) is rewritten as:
I t = 2 2 K R E 0 E 1 e i 2 π f d t + φ 0 1 + i a t τ 0 τ t o f
The Fourier transform of Equation (17) is:
I F ω = 2 2 K R E 0 E 1 e i φ 0 2 π δ ω 2 π f d + i a F ω 2 π f d e i ω 2 π f d τ 0 + τ t o f
where δ represents the impulse function, a F ω denotes the Fourier transform of the PRBS a t . Selecting the PRBS period T r = 1 / f r as the fast Fourier transform (FFT) analysis time window, we can obtain:
I F , w i n ω = 2 2 K R E 0 E 1 e i φ 0 2 π N T c Sa ω 2 π f d N T c 2 e i φ w i n + i a F ω 2 π f d e i ω 2 π f d τ 0 + τ t o f N T c Sa ω N T c 2 e i φ w i n
where φ w i n is the phase rotation caused by the window function, Sa x = sin x / x represents sampling function, and denotes convolution.
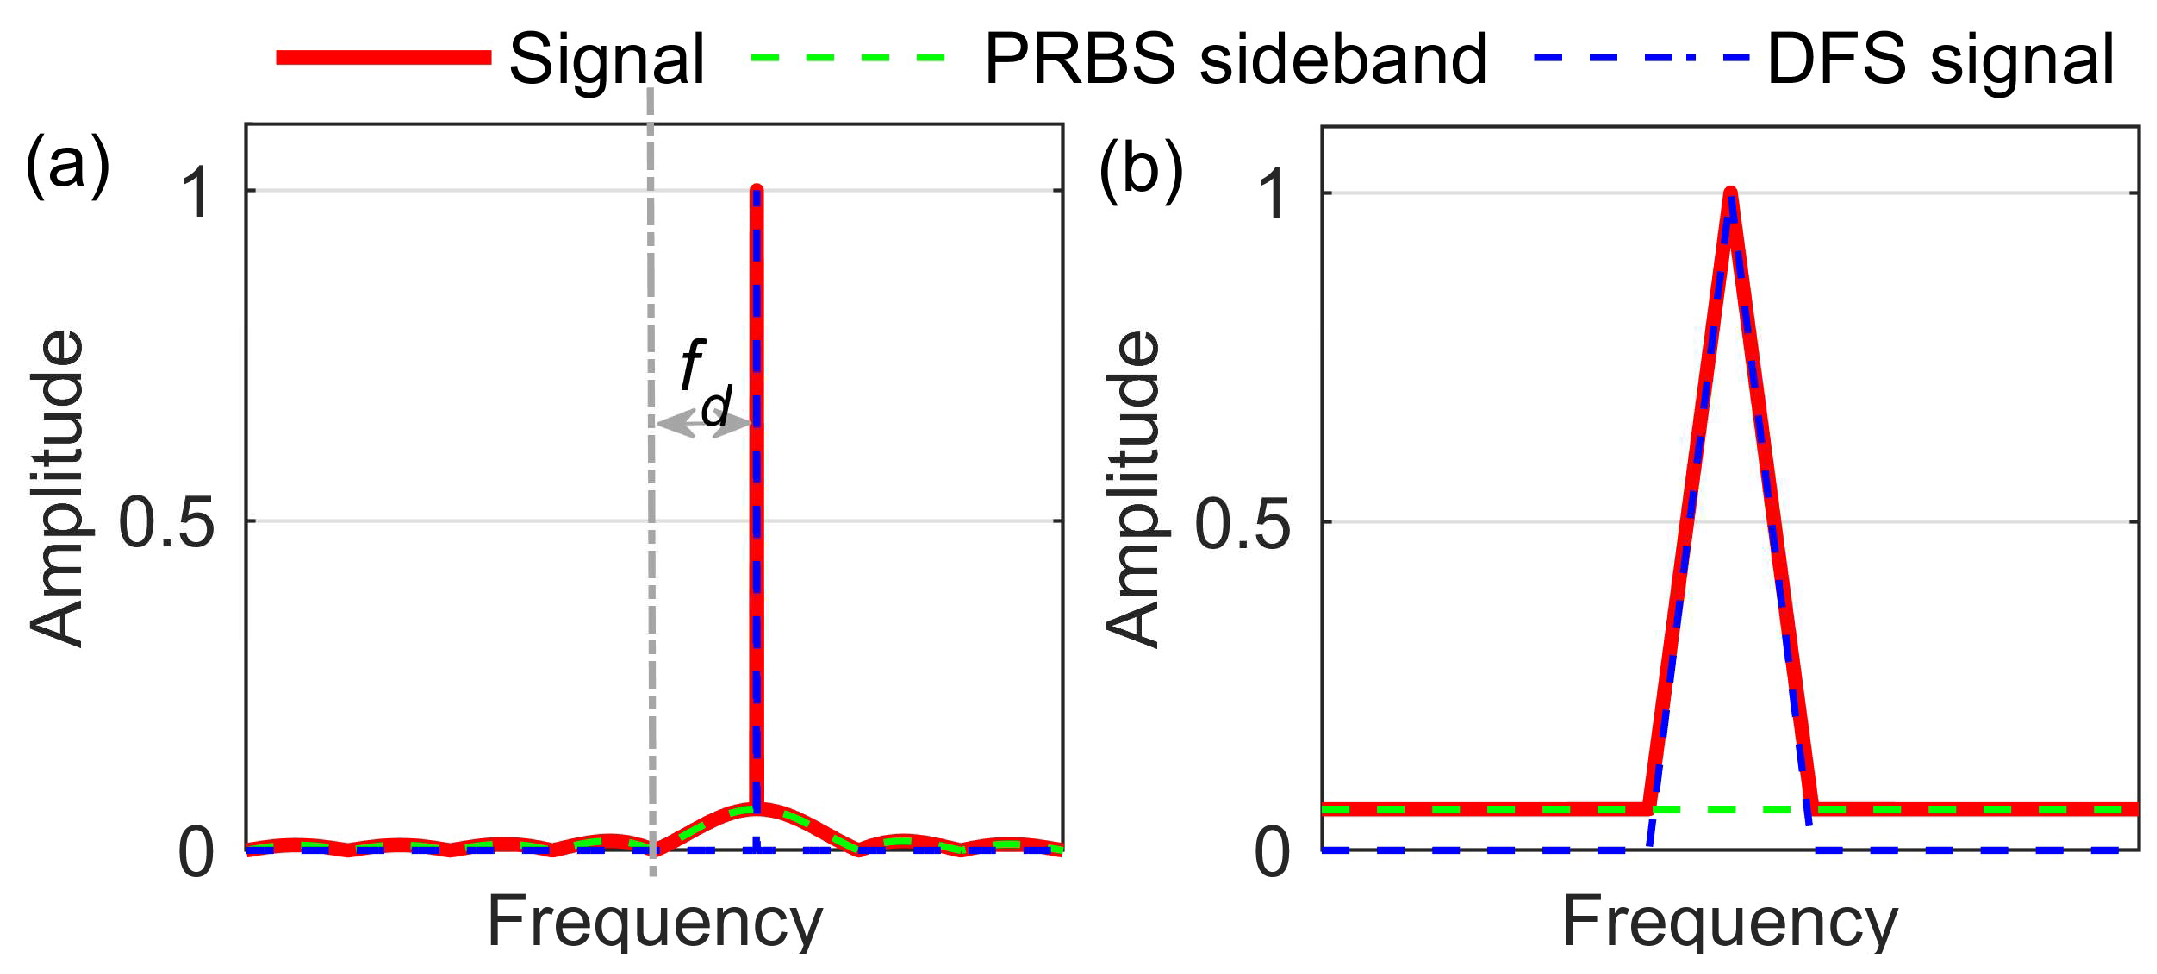
In Equation (19), the first term represents the spectrum of the DFS signal. Its energy is concentrated in the bandwidth f r . The second term represents the frequency spectrum of the PRBS for ranging. It is similar to white noise, so its energy is approximately uniformly distributed in the bandwidth 1 / T c . Since the modulation depth coefficient is set at β = π / 4 , the energy of the two terms is the same, but the amplitude spectrum of the DFS signal is more concentrated in the frequency domain. The peak of the amplitude spectrum is obviously higher than that of the PRBS signal. Therefore, the position of the peak value ω = 2 π f d in Equation (19) can be clearly located by spectrum analysis.
The normalized amplitude spectrum of the complex photocurrent signal with a seventh-order m-sequence is shown in Figure 5a, with a phase modulation depth coefficient of β = π / 4 , a sample window length of T r , and a DFS of f d = + N f r . The partial enlargement in Figure 5b shows that the normalized amplitude spectrum of complex photocurrent signal can be equivalent to the sum of the amplitude spectrum of the DFS signal and the PRBS sideband. Since the energy of the PRBS sideband is approximately uniformly distributed in the bandwidth 1 / T c = N f r after spectrum spreading, it has little effect on the peak frequency location of the DFS signal.
After obtaining the target DFS through the above spectrum analysis, we can shift the frequency of the complex photocurrent signal or the local template signal to eliminate the Doppler effect. An example of frequency shifting the complex photocurrent signal is illustrated here.
Firstly, the complex photocurrent signal is frequency shifted by f d :
I s h i f t t = I t e i 2 π f d t = 2 2 K R E 0 E 1 e i φ 0 1 + i a t τ 0 τ t o f
Then, matched filtering I s h i f t t is performed, obtaining the norm:
r s h i f t t = I s h i f t τ a τ + t d τ 2 2 K R E 0 E 1 R a a t + τ 0 + τ t o f
As a result, the flight time of the laser and the target distance can be measured by locating the peak of Equation (21).
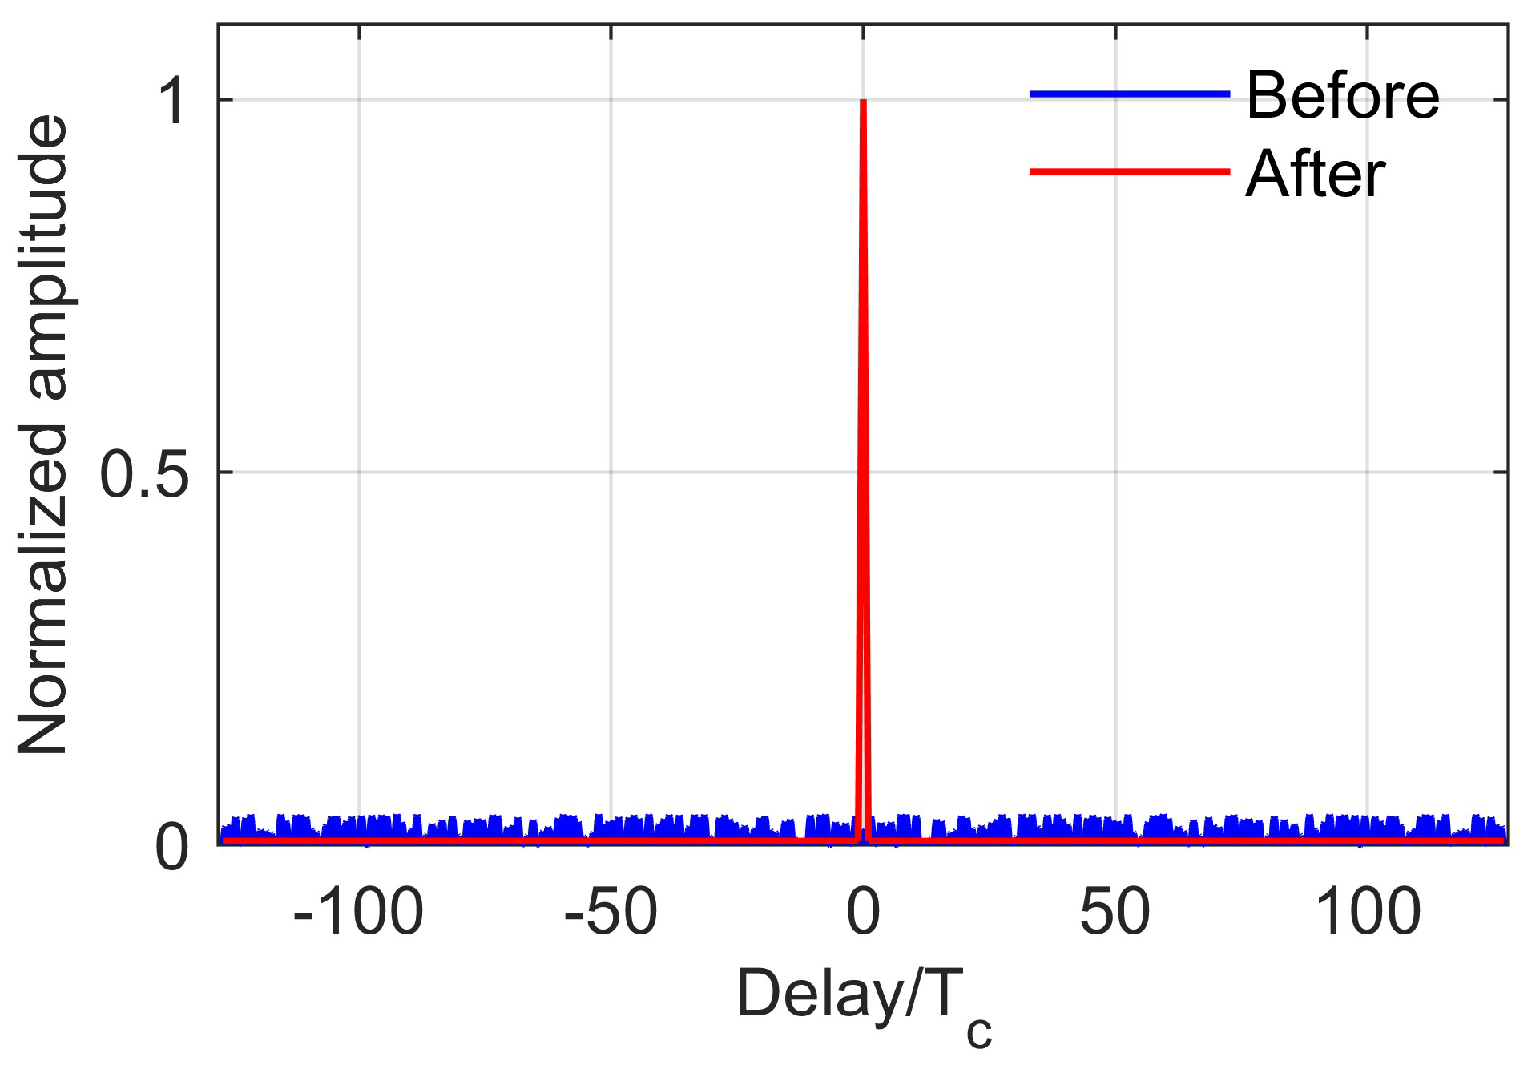
The output of the matched filter before and after frequency shifting of the complex photocurrent signal is shown in Figure 6 (settings are the same as Figure 5). It can be seen that the correlator has no peak before the Doppler effect compensation, while an obvious peak can be found after compensation.
Here, we briefly expand on the robustness of DFS compensation, which is characterized by three key features. First, according to our measurement principle, DFS estimation is performed independently within each time window, ensuring that compensation errors do not accumulate over time. Second, DFS estimation errors primarily arise from systematic factors such as FFT spectral leakage and scalloping loss, as well as random errors induced by measurement noise. These errors are independent of the DFS magnitude and, therefore, do not scale with it. Finally, even if DFS estimation introduces errors, as shown in Figure 3, their effect is equivalent to a residual DFS, which attenuates the correlation peak amplitude without altering its position. Based on these three features, ranging accuracy is not directly affected by DFS compensation errors and remains robust across a wide DFS range.
It is also worth mentioning that averaging the power for ranging and DFS decoupling is a robust approach, and may be the most common choice for coherent ranging systems. However, in some application scenarios, the DFS can be small, and the ranging precision requirement may be rigorous. At this time, we can adjust the value of the modulation depth coefficient β adaptively, providing higher energy to guarantee the SNR and precision of ranging based on priority. The ability to ensure robust detection in an unknown scene and adaptively deploy the powers of ranging and DFS decoupling in a known scene is not available in any other system at present, which embodies the adaptability of the proposed method.
As of now, coherent detection based on LD-PRPM has been accomplished.

2.2. Sliding Window Analysis

In the measurement, periodic pseudo-random code is used as the modulation signal, and the delay of the signal light can be determined by the result of circular cross-correlation. So, this electronic de-chirping-based method does not suffer from the endpoint effect in the FMCW method (see Supplementary Materials), and the sliding window measurement can be further adopted to improve the temporal resolution of ranging. The typical application scenario is in rapid scanning imaging LiDAR, so this scenario is used as an example for illustration.
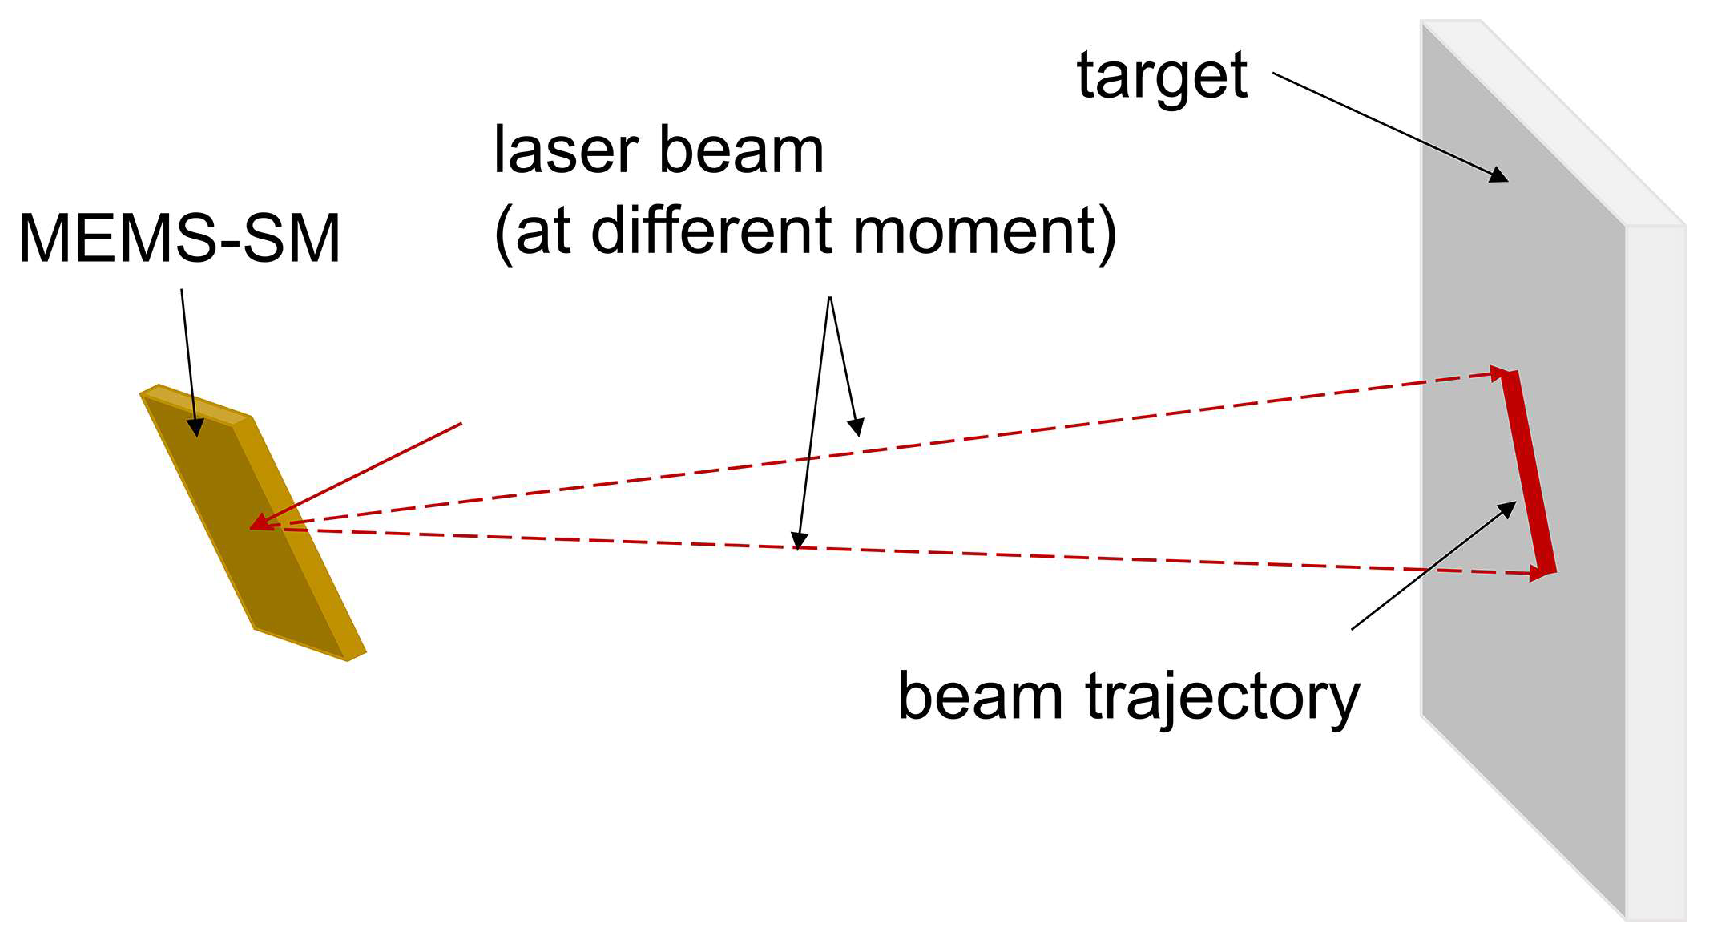
Firstly, the model of the complex photocurrent signal in a rapid scanning situation is studied. As shown in Figure 7, around the sample time window T s t a r t , T e n d , the laser beam is scanned by a MEMS scanning mirror (MEMS-SM) to form a beam trajectory. The complex photocurrent signal is equivalent to the superposition of the echo signal at each point on the trajectory. So, the model must be modified from Equation (17).
Given that the sampling time window in rapid measurement scenarios is extremely short (typically at the microsecond level or shorter), the beam trajectory within T s t a r t , T e n d can be reasonably approximated as a straight line, representing the local differential of the target surface along the scanning direction. Moreover, considering the typical acceleration of common targets, their velocity remains nearly constant within this short duration, regardless of the complexity of their motion pattern. This means that the distance, d , of the measurement point changes linearly in the sampling time:
d t = d 0 + v t
where d 0 is the distance of the measurement point at time T s t a r t , and v is the equivalent velocity of the measurement point caused by both motion and scanning.
So, the time of flight of the laser beam can be expressed as:
τ t o f t = 2 d t c = 2 d 0 c + 2 v c t
Then, Equation (17) can be modified to:
I t = 2 2 K R E 0 E 1 e i 2 π f d t + φ 0 1 + i a C v t τ 0 2 d 0 c
where C v = 1 2 v / c is the velocity coefficient.
Eliminating the DFS for Equation (24) and performing the FFT yields:
  I s h i f t , F ω = 2 2 K R E 0 E 1 e i φ 0 1 + i 1 C v a F ω C v e i ω τ 0 + 2 d 0 c C v
Substituting Equation (25) into Equation (11) and calculating its norm, we can obtain:
r t = 2 2 K R E 0 E 1 R a a t + τ 0 + 2 d 0 c C v
where R a a t is the cross-correlation of a C v t and a t . Since the equivalent velocity of the measurement point is tiny compared to the speed of light, C v approaches 1. In this case, Equation (26) is approximate to:
r t = 2 2 K R E 0 E 1 R a a t + τ 0 + 2 d 0 c
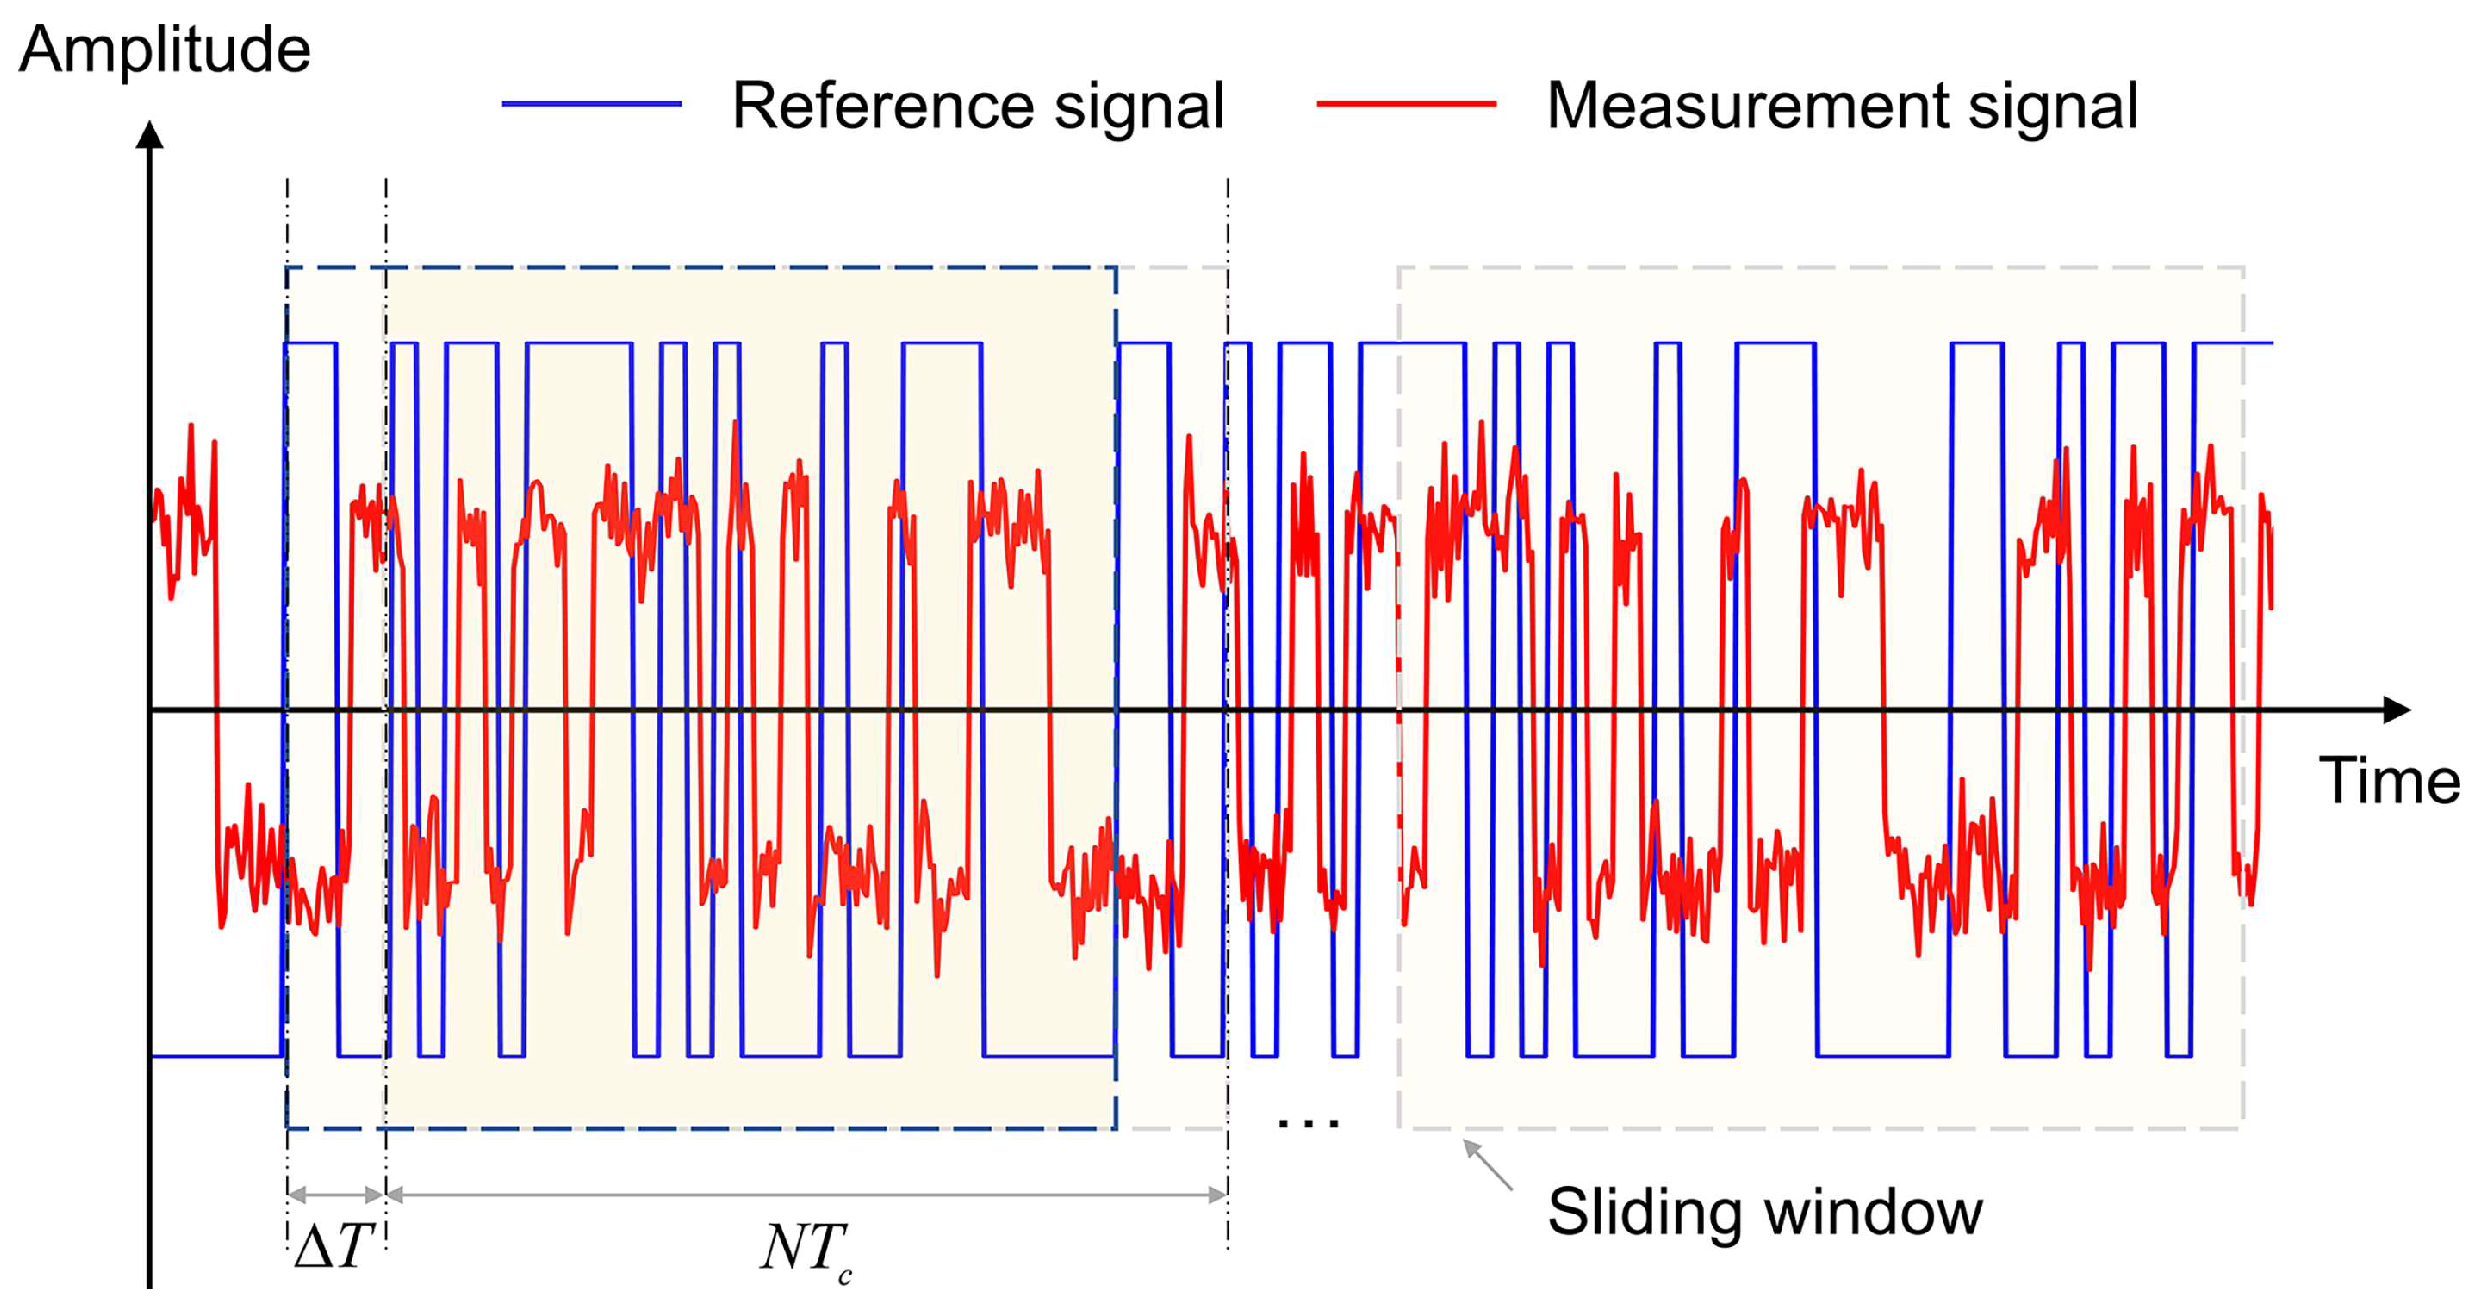
This means that the ranging is complete at the beginning of the measurement time window. We select the code repeating period N T c (shown as the dotted box) as the signal analysis length and Δ T as the sliding window interval, as shown in Figure 8; then, the temporal ranging resolution can be enhanced to 1 / Δ T , and up to the sample rate.

3. Comparisons

In this section, we quantify the rapid ranging performance of the proposed method, hereafter referred to as the LD-PRPM method, and highlight its advantages by comparing it with the coherent FMCW ranging method and the non-coherent DDMA ranging method. The former is the most commonly used coherent method, while the latter represents state-of-the-art research based on non-coherent pseudo-random modulation.
For the weak signal rapid detection scenario, the measurement SNR of the LD-PRPM method is derived. We let the phase of the emitting laser be modulated by the m-sequence with the code rate f c = 1 / T c , code length N , and phase modulation depth coefficient β = π / 4 . The amplitude of the local oscillation light is E 0 . The amplitude of the signal light is E 1 . The heterodyne efficiency is η c (the heterodyne efficiency is defined as the ratio of the actual signal amplitude to the ideal signal amplitude, and is caused by the wavefront distortion, target depolarization, speckle effect, etc. Due to the space constraints of this article, only its application is discussed here). The ratio constant of the amplitude of the light field to the light power is K . Detector responsivity is R . Elementary charge is e . The sample rate of the complex photocurrent signal is f s . The bandwidth of the analog front end is B . The measurement window size is T m = N T c = 1 / f m . The measurement frequency (different from the ranging rate, it represents the speed of each independent measurement of the system, which is also an important indicator for the rapid ranging system) is f m .
From the derivation in the Supplementary Materials, the measurement SNR of LD-PRPM can be obtained as:
SNR LD - PRPM = P s _ m e a s P n _ m e a s = η c 2 K R E 1 2 f s T m 8 e B
Then, we derive the measurement SNR for the FMCW method. We let the emitting laser be modulated by the triangular wave with 50% duty cycle and frequency 1 / T m . The measurement window size is T m / 2 (in order to achieve the same ranging rate as LD-PRPM, the FMCW method needs two measurements in the same measurement time). The definitions of the other parameters are the same as above.
From the derivation in the Supplementary Materials, we can obtain the measurement SNR of FMCW as:
SNR FMCW = P s _ m e a s P n _ m e a s = η c 2 K R E 1 2 T m 4 e
When the bandwidth of the analog front end is the Nyquist bandwidth ( B = f s / 2 ), Equation (28) is reduced to Equation (29). This shows that the LD-PRPM method has the same measurement SNR as FMCW.
However, the above analysis does not consider the endpoint effect. When the measurement window size T m / 2 is reduced to near τ t o f in rapid ranging, the effective power of the signal in the measurement results decreases as the endpoint effect increases (see Supplementary Materials Figure S1). The actual SNR measurement in Equation (29) is further modified to:
SNR FMCW = η c 2 K R E 1 2 T m 4 e T m 2 τ t o f T m , T m > 2 τ t o f
Therefore, the LD-PRPM method is more advantageous in rapid ranging.
Finally, we evaluate the measurement SNR of the DDMA method. We let the amplitude of the emitting laser be modulated by the m-sequence with code rate f c = 1 / T c and code length N . The amplitude of the signal light is 2 E 1 (the amplitude is increased 2 times to ensure that the average power of the received signal in amplitude modulation and phase modulation is the same). The ratio constant of the amplitude of the light field to the light power is K . Detector responsivity is R (coherent detection tends to use PIN detectors, while non-coherent detection tends to use detectors with higher response such as APDs, R are used here to differentiate). The sample rate of the complex photocurrent signal is f s . The bandwidth of the analog front end is B . The measurement window size is T m = N T c .
From the derivation in the Supplementary Materials, the measurement SNR of DDMA can be acquired as:
SNR DDMA = P s _ m e a s P n _ m e a s = K 2 R 2 E 1 4 f s T m R L 16 k T B
The SNR of DDMA to LD-PRPM is:
SNR DDMA SNR LD - PRPM = e K R 2 R 1 E 1 2 R L 2 η c 2 k T
This indicates that the weaker the signal is, the higher the SNR gain the LD-PRPM will have, which means the LD-PRPM method is more suitable for rapid ranging scenarios with low emitting power.
Take the typical values of each parameter: echo signal power, K E 1 2 = 1   nW ; APD responsivity, R = 20   A / W ; PIN detector responsivity, R = 1   A / W ; heterodyne efficiency, η c = 0.2 ; temperature, T = 300   K ; and load resistor, R L = 50   Ω , into Equation (32); we can then obtain SNR DDMA / SNR LD - PRPM = 20   dB .
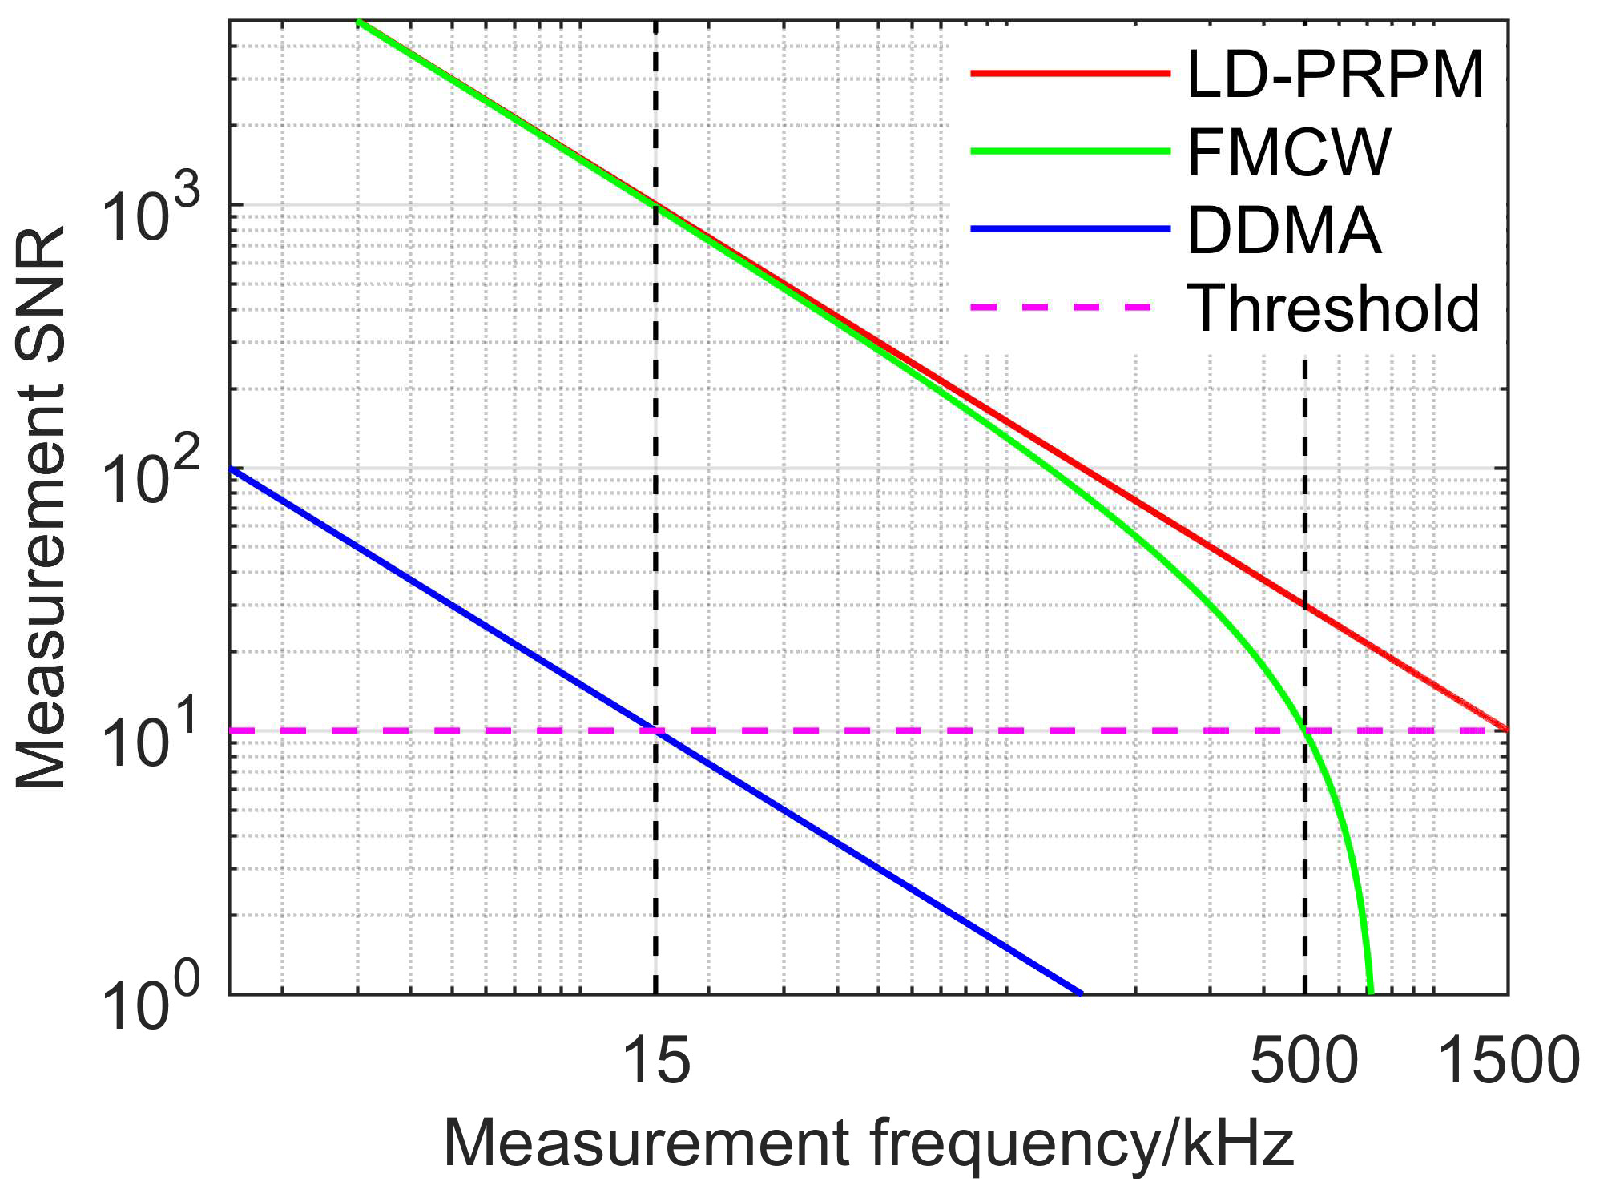
Assuming that (1) the above-mentioned echo signal power is obtained with a target located at a 100 m distance, and (2) when the LD-PRPM method detects at the maximum measurement frequency (1.5 MHz) without generating measurement ambiguity, the detection threshold of 10 dB SNR will be reached. A plot of the measurement SNR varying with the measurement frequencies of each laser ranging method can be made, as shown in Figure 9.
It can be seen that the maximum allowable measurement frequency of the FMCW method is only 500 kHz due to modulation waveform. The maximum allowable measurement frequency of DDMA is only 15 kHz due to the measurement SNR. In comparison, the maximum measurement frequency of LD-PRPM method is 3 times higher than that of the FMCW method and 100 times higher than that of DDMA method, which further clarifies the advantages of LD-PRPM method in rapid ranging applications.

4. Simulations

4.1. Coherent Detection with LD-PRPM

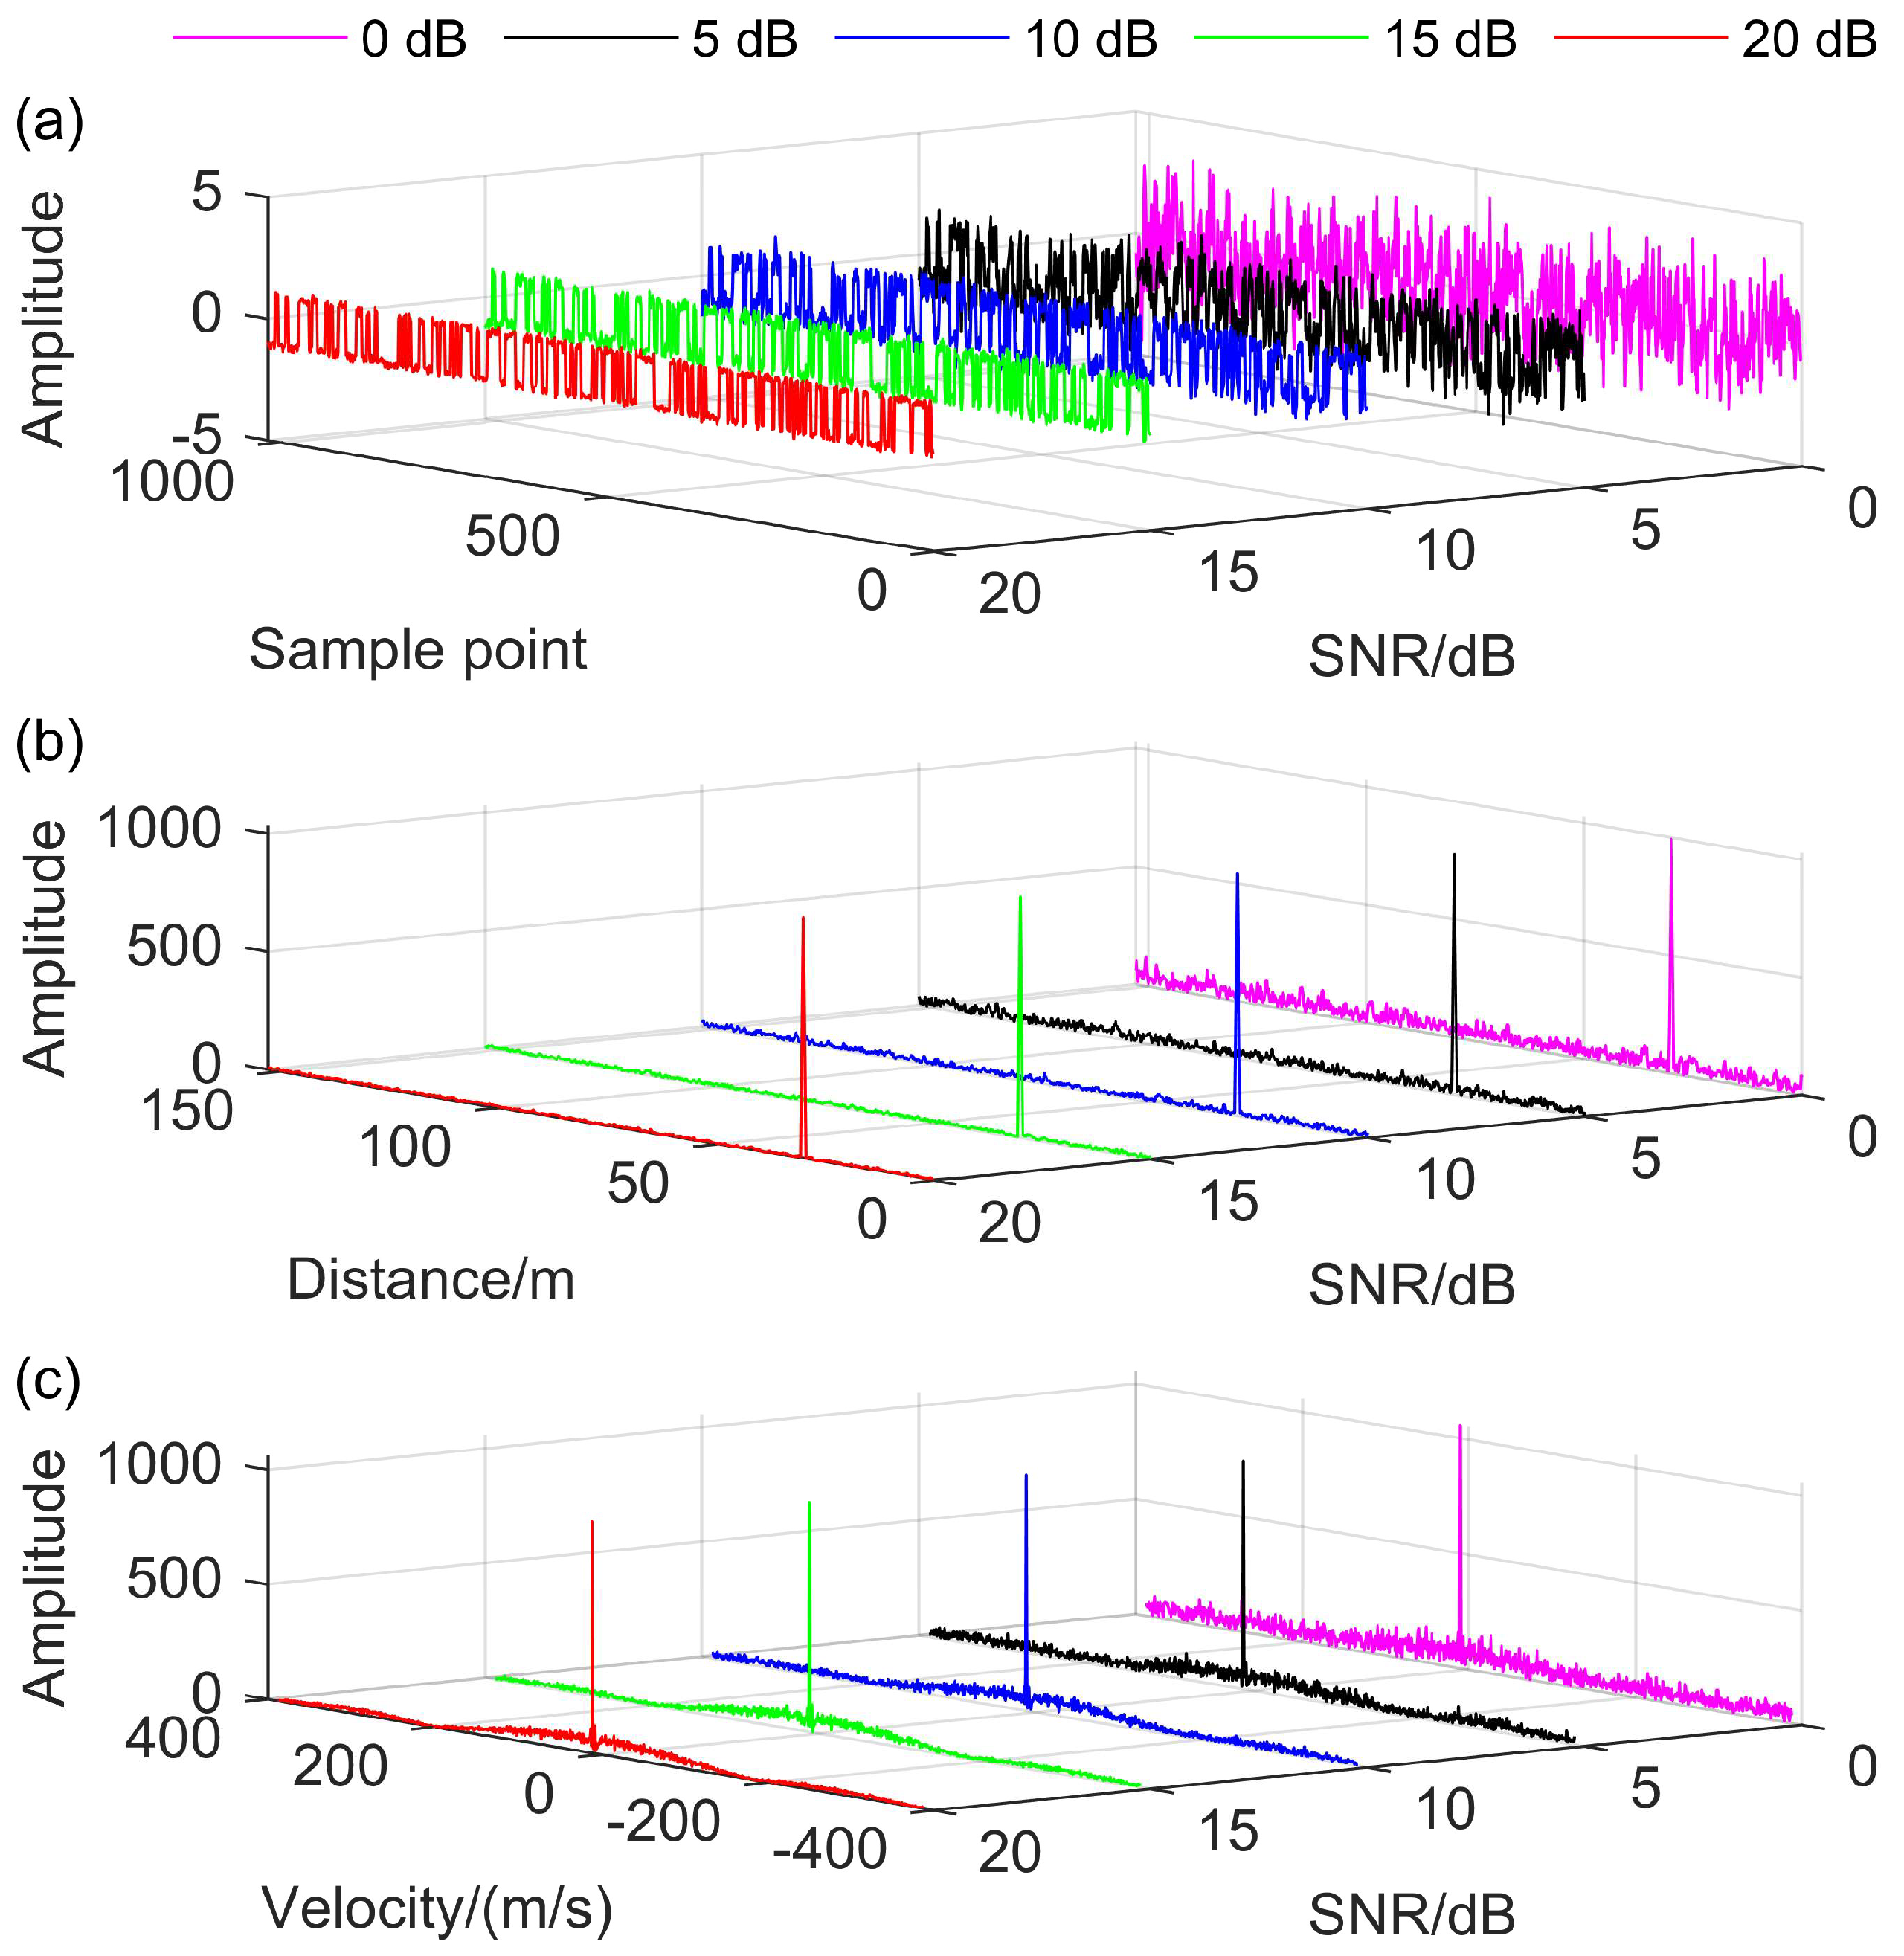
Simulations were carried out to verify the effectiveness of coherent detection with LD-PRPM. In the simulations, the laser wavelength was set to 1550 nm, its phase was modulated by an m-sequence with a code rate of 255 MHz, a code length of 255, and a phase modulation depth coefficient of β = π / 4 . Three sets of measurements were carried out with a 1 GHz sample rate, under SNRs from 0 dB to 20 dB.
In the first set of measurements, the target was located at a constant position (30 m) and had a constant velocity (10 m/s). The simulation results are shown in Figure 10. It shows the time-domain waveforms of the modulated components of the complex photocurrent signals, the ranging spectrum (mapped by matched filter output) and the velocity spectrum (corresponding to the decoupled DFS, mapped by a FFT amplitude spectrum) of the target under different SNRs. It can be seen that the position and velocity spectrum in Figure 10b,c were consistent with the theoretical analysis. Moreover, even if the signal was overwhelmed by noise in the low SNR case, the proposed method was still effective in achieving detection.
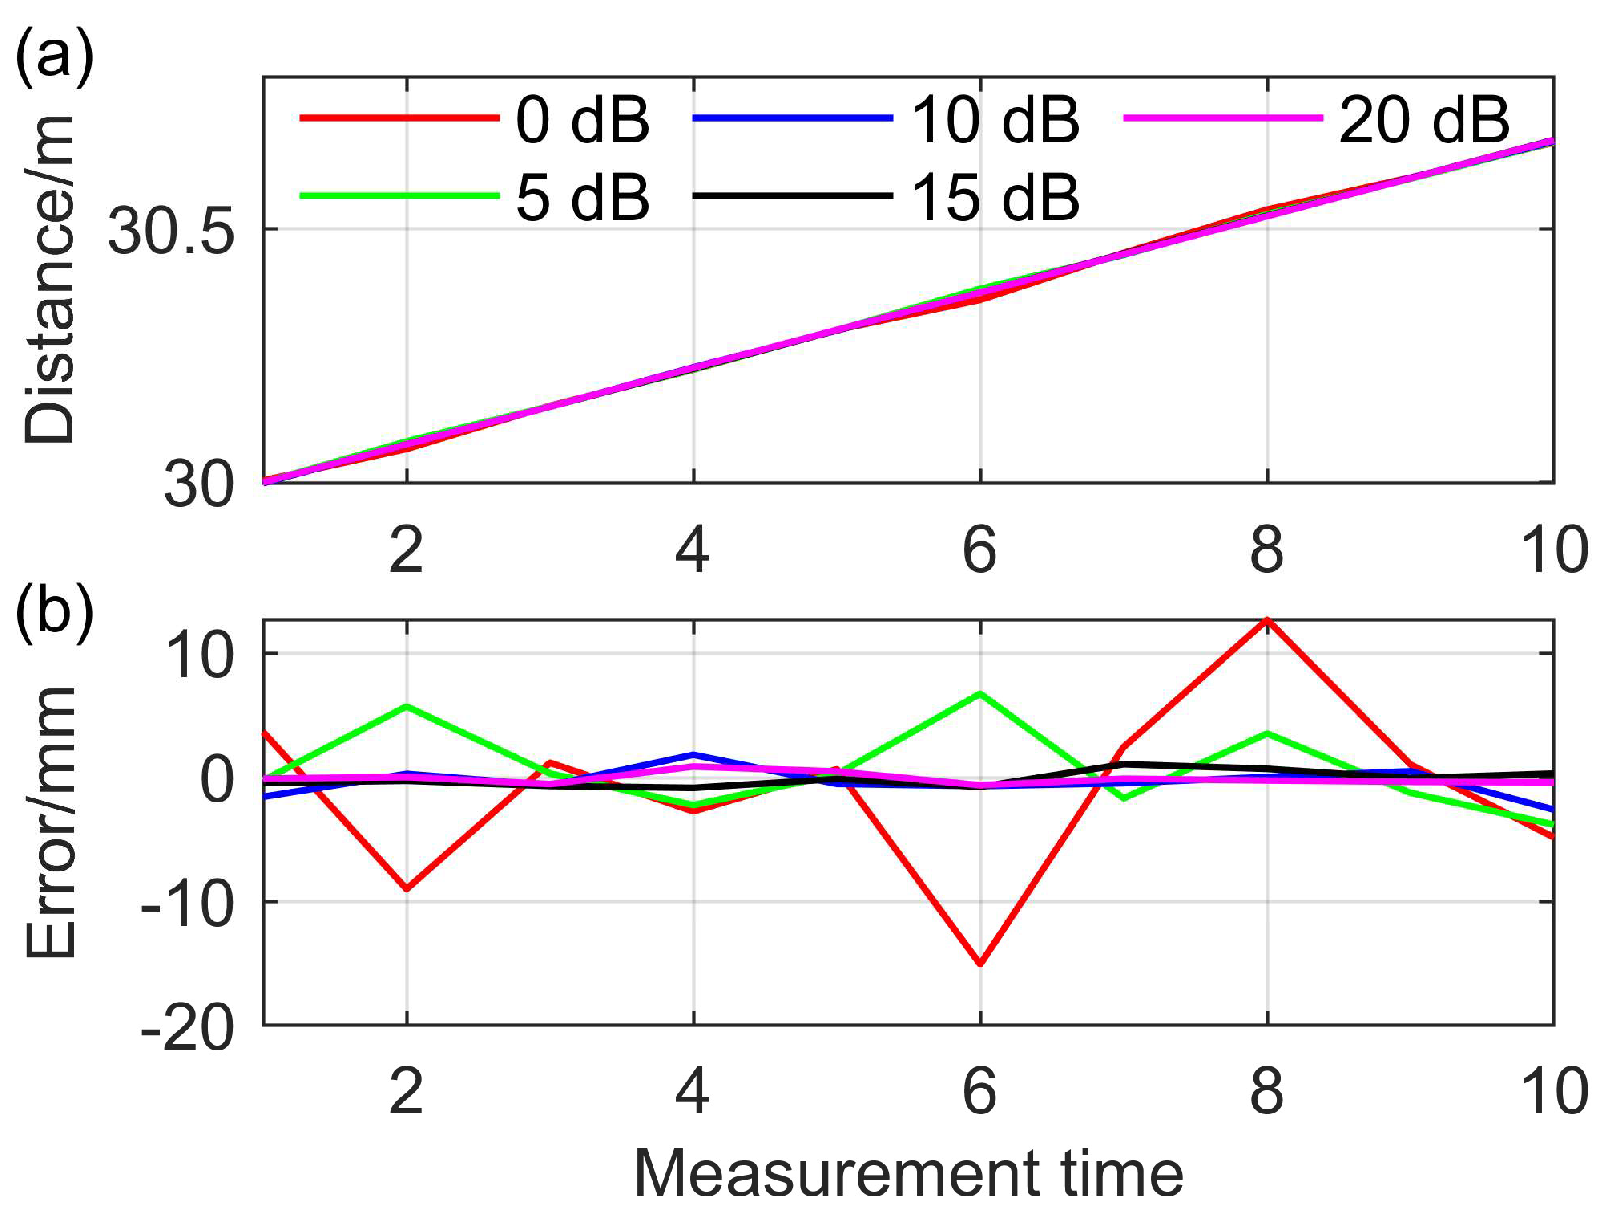
In the second set of measurements, the target was moved at a constant velocity (10 m/s), but was located at different positions (30–30.675 m, with a 0.075 m interval). The correlation peak was located by the fourth-order polynomial method [7] and the spectrum peak was located by zero-filling FFT (100-fold subdivision). The simulation results are shown in Figure 11. The peak-to-peak value of the measurement error was about ±10 mm at 0 dB SNR, and ±1 mm at 20 dB SNR.
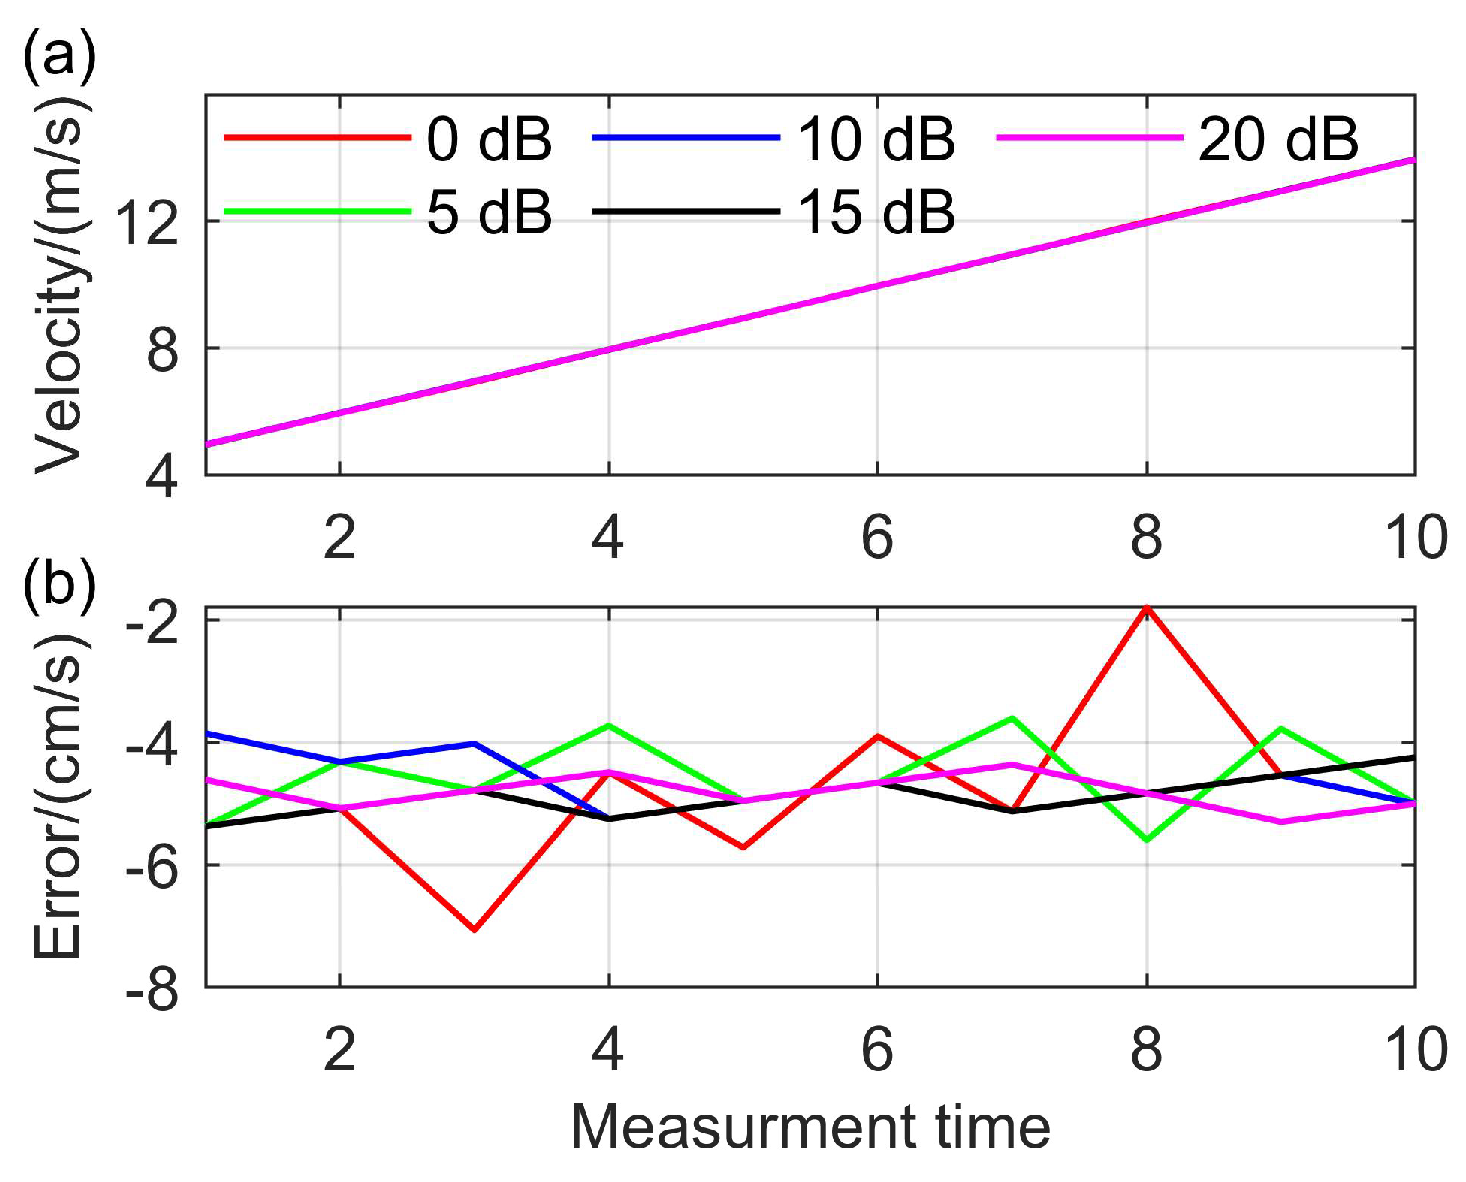
In the third set of measurements, the target was located at constant position (30 m), but had different velocities (5–14 m/s, with a 1 m/s interval). The correlation peak was located by fourth-order polynomial, and the spectrum peak was located by zero-filling FFT (100-fold subdivision). The simulation results are shown in Figure 12. The peak-to-peak value of the measurement error was about ±2.5 cm/s at 0 dB SNR, and ±0.25 cm/s at 20 dB SNR.

4.2. Sliding Window Analysis

In order to verify the rapid ranging capability of the sliding window measurement, a simulation was carried out in a rapid scanning imaging LiDAR scenario. In the simulation, the transmission and receiving settings were the same as Section 4.1. The angular velocity of the scanning beam was set to 2 π f s c a n A a n g l e = 2000 π 0.065   rad Hz (we let the beam scan sinusoidally with a frequency of f s c a n = 2   kHz and an amplitude of A a n g l e = 0.065   rad , and measured at the maximum angular velocity moment). The target plane surface was located at 30 m, and the angle between the target and the scanning tangent was 0.55 rad. The length of the measurement window was 1 μs and the sliding interval was 0.1 μs, corresponding to the 10 MHz ranging rate. The simulation results, shown in Figure 13, were in good agreement with the true values, indicating that the sliding window measurement could effectively improve the temporal resolution of ranging.

5. Experiments

Experiments were carried out to verify the validity of the proposed method. The main experimental setup consisted of a 1550 nm DFB laser (1550LD-3-0-0-2, Aerodiode (Bozeman, MT, USA)), an EOM (MPZ-LN-10, iXblue (Saint-Germain-en-Laye, Île-de-France, France)), two balanced detectors (PDB480C-AC, Thorlabs (Newton, NJ, USA)), a signal generator (SDG7102A, Siglent (Shenzhen, Guangdong, China)) and an oscilloscope (HDO4804, Rigol (Suzhou, Jiangsu, China)). The SDG7102A was used to generate a pseudo-random modulation waveform (m-sequence), with its amplitude set according to the desired phase modulation depth and the half-wave voltage of the MPZ-LN-10. The output signals from the PDB480C-AC were acquired by the HDO4804 and processed offline.
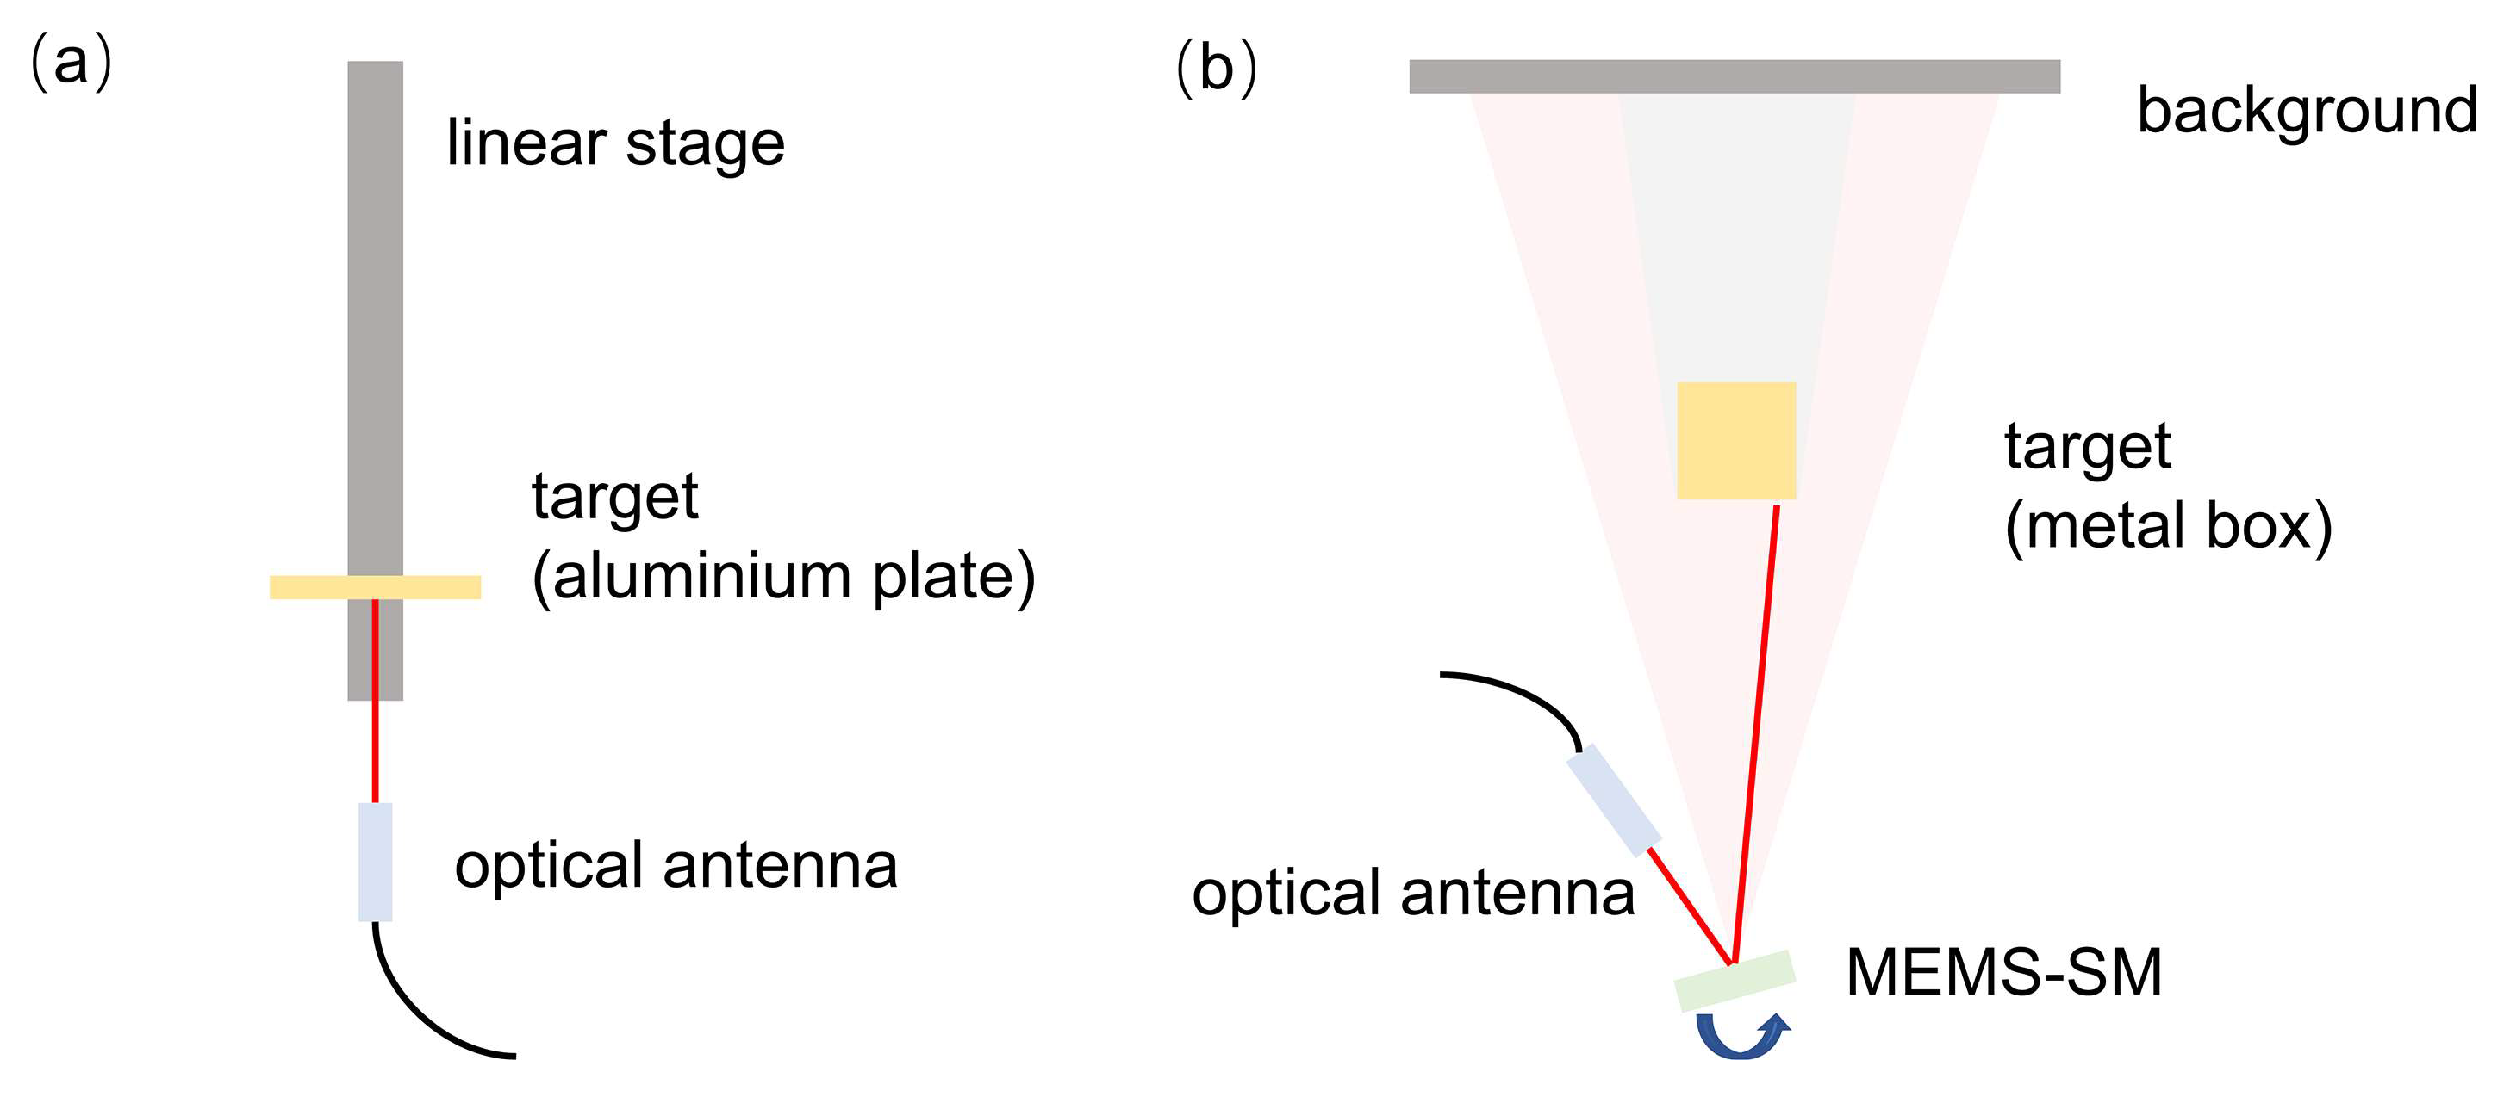
Based on the setup shown in Figure 14a, coherent detection with LD-PRPM was verified, and the measurement accuracy and precision of the ranging system were evaluated. The measurement beam was coaxially transmitted and received by an optical antenna, and the measurement target was an aluminum plate mounted on a high-precision linear stage, with a nominal positioning accuracy of 0.05 mm and a maximum velocity of 0.4 m/s. Based on the setup shown in Figure 14b, the rapid ranging capability of the sliding window measurement was verified, demonstrating the application feasibility for high-resolution/high-frame rate LiDAR. The measurement beam was coaxially transmitted and received by an optical antenna and scanned by a MEMS-SM. A metal box served as the measurement target and the white wall acted as the background.

5.1. Coherent Detection with LD-PRPM

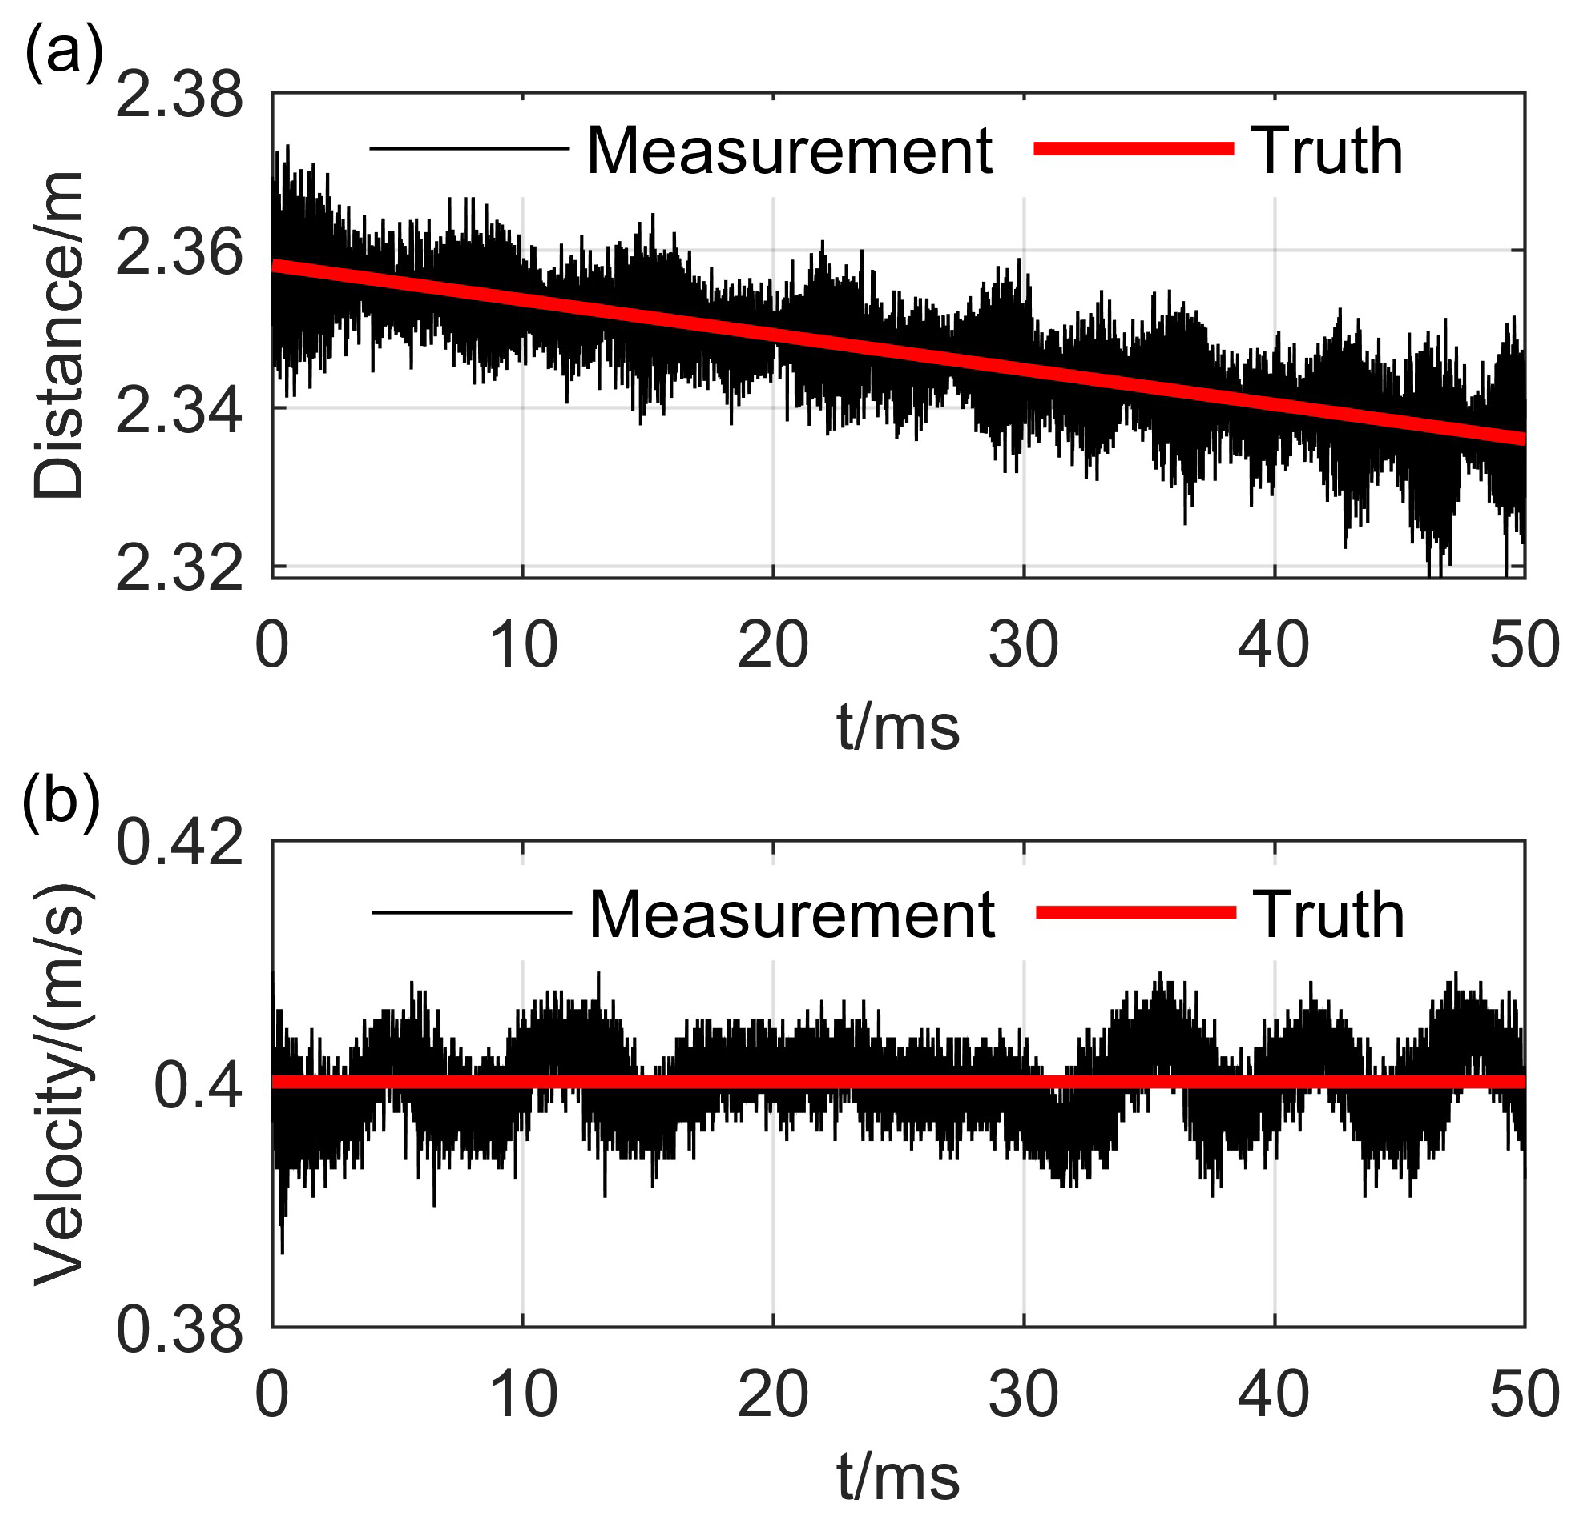
Firstly, the target moved at maximum velocity of 0.4 m/s, leading to a DFS of about 500 kHz. An m-sequence with a phase modulation depth coefficient of β = π / 4 , code rate of 204.7 MHz, and total length of 2047 was used as the modulation signal. At this time, the integration time of the measurement was 10 μs, corresponding to a spectral resolution of 100 kHz. A total of 50 ms of data were collected by the oscilloscope with a sample rate of 1 GHz, and obtained 5000 measurement points, as shown with the black line in Figure 15. The red line was the truth value, derived from the linear stage controller. It can be seen that the ranging system accurately measured the 20 mm target displacement in 50 ms, and determined the target velocity to be 0.4 m/s with the calculated DFS.
By subtracting the measurements from the truth values to obtain the measurement error and characterizing the accuracy using the root mean square (RMS) value of the measurement error, we determined the ranging accuracy to be 5 mm and the velocimetry accuracy to be 3 mm/s. At last, the target was placed stationarily at a position of 2 m to characterize the ranging precision, which was found to be 2 mm (1σ).

5.2. Sliding Window Analysis

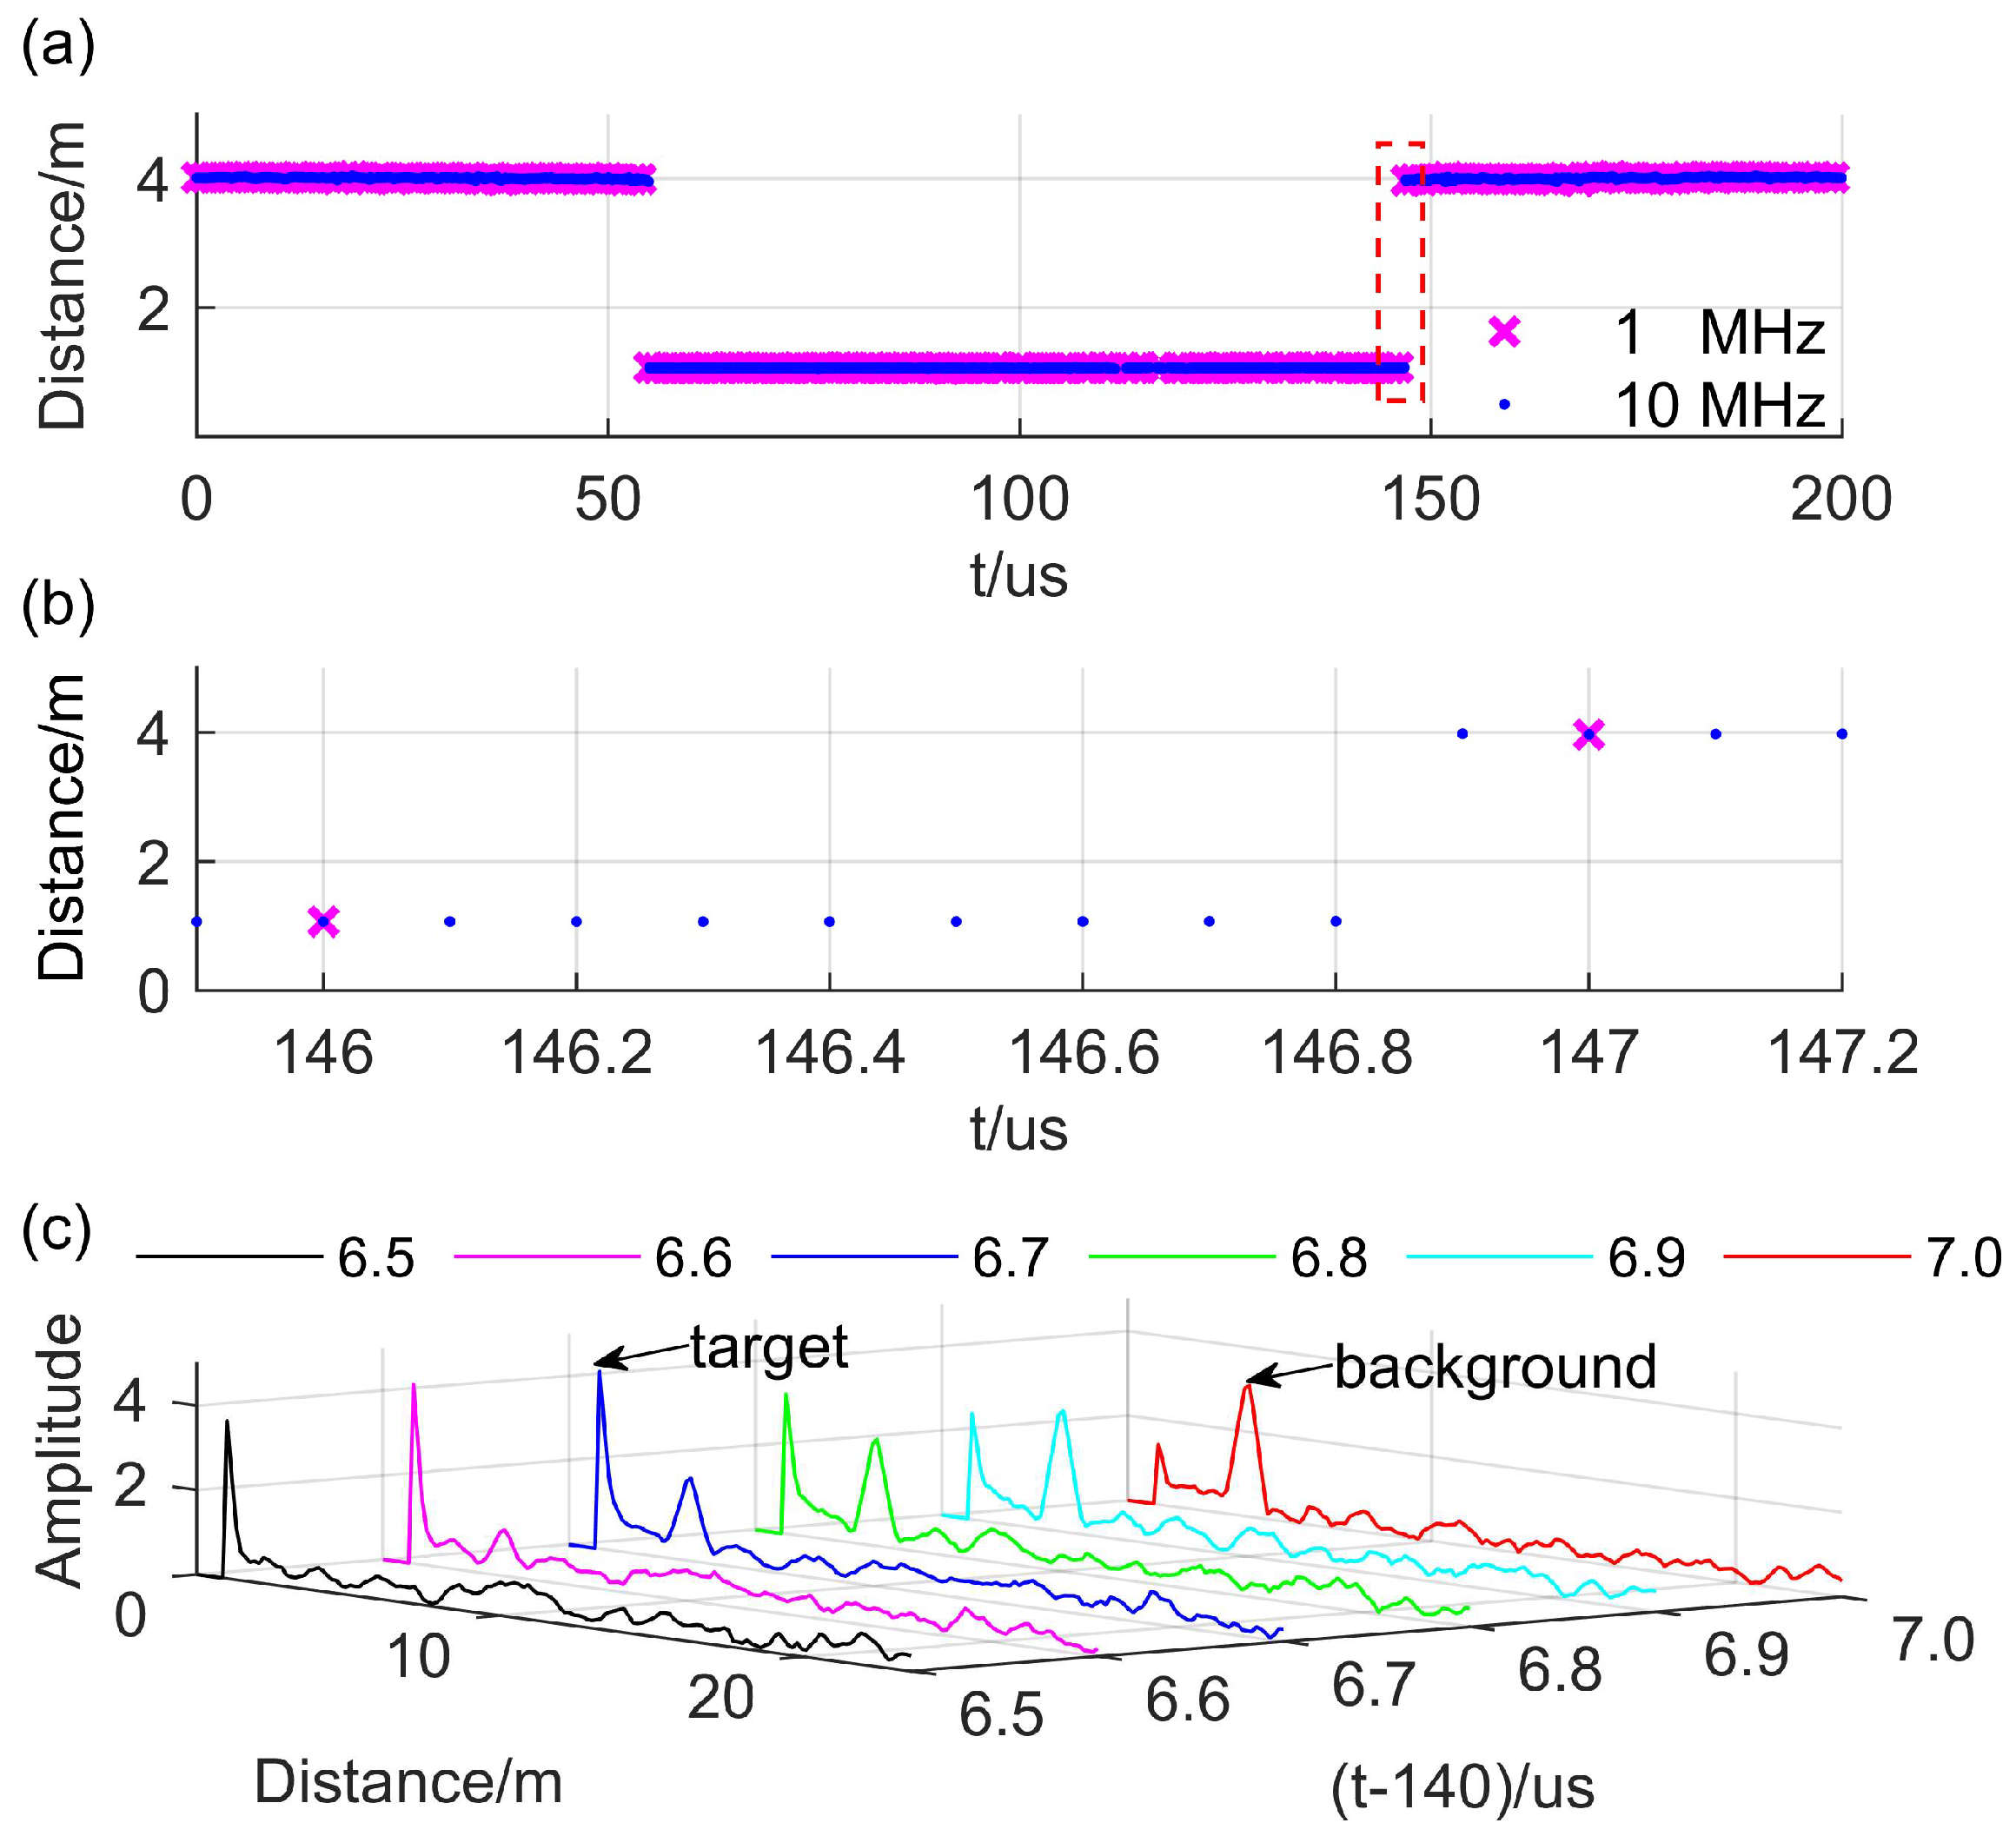
In order to verify the rapid ranging capability of the sliding window measurement, the m-sequence with a phase modulation depth factor of β = π / 4 , a code rate of 255 MHz, and a total length of 255 was used as the modulation signal in this experiment. The integration time of the measurement was reduced to 1 μs. A total of 200 μs of data were collected by an oscilloscope with a sample rate of 1 GHz. The line scan results of the metal box are shown in Figure 16a. The pink ‘×’ markers indicate the ranging results without the sliding window, corresponding to a ranging rate of 1 MHz. The blue ‘·’ markers denote the results of sliding window measurements, corresponding to a ranging rate of 10 MHz.
It can be seen that the ranging system clearly recognized the target at 1 m and the white wall background at 4 m regardless of whether the time window was slid or not. The partial enlarged view of the red dashed box in Figure 16a is shown in Figure 16b. Due to the limitations of the temporal resolution, the 1 MHz ranging rate results localized the target edge at 146 μs, while the 10 MHz ranging rate results more accurately located the edge at 146.8 μs. The entire process of the measurement beam moving from the target to the background white wall from 146.5 μs to 147 μs was recorded in Figure 16c. It can be seen that the light spot had been partially incident to the white wall background at 146.6 μs, which means that we can use more complex signal processing methods to achieve more accurate edge localization. This rapid ranging capability is critical for high-resolution/high-frame rate LiDAR.

6. Conclusions

In this paper, a novel rapid laser ranging method is proposed. This method not only fully leverages the merits of continuous-wave coherent detection in high-speed applications, but addresses the critical challenges in existing rapid coherent laser ranging systems. Additionally, it is adaptive and resistant to interference. Through theoretical analysis, comparisons with state-of-the-art methods, and simulations and experiments, the method is comprehensively demonstrated. Experimental results showed that the proposed method achieved a ranging accuracy of 5 mm, a ranging precision of 2 mm (1σ), a speed accuracy of 3 mm/s, and a rapid ranging rate of 10 MHz. These results are of great significance for the temporal or spatial resolution enhancement of the imaging LiDAR, and are inspiring for related fields. The integration of this system is our next goal.

Supplementary Materials

The following supporting information can be downloaded at https://www.mdpi.com/article/10.3390/rs17061002/s1: Figure S1: The endpoint effect in the FMCW method; Figure S2: The circular cross-correlation process in the LD-PRPM method.

Author Contributions

Conceptualization, J.G.; methodology, J.G.; software, B.G.; validation, J.G. and B.G.; formal analysis, B.G.; investigation, J.G. and B.G.; resources, J.W. and X.L.; data curation, J.G. and B.G.; writing—original draft preparation, J.G. and B.G.; writing—review and editing, J.G. and B.G.; visualization, B.G.; supervision, J.W. and X.L.; project administration, J.W., X.L. and Z.Y.; funding acquisition, J.W., X.L. and Z.Y. All authors have read and agreed to the published version of the manuscript.

Funding

This research was funded by the National Key Research and Development Program of China (2023YFC2205502), National Engineering Research Center for Offshore Windpower (HSFD22009), and National Natural Science Foundation of China (51975233).

Data Availability Statement

Data underlying the results presented in this paper will be made available upon reasonable request.

Conflicts of Interest

The authors declare no conflicts of interest.

References

  1. Lukashchuk, A.; Riemensberger, J.; Karpov, M.; Liu, J.; Kippenberg, T.J. Dual Chirped Microcomb Based Parallel Ranging at Megapixel-Line Rates. Nat. Commun. 2022, 13, 3280. [Google Scholar] [CrossRef] [PubMed]
  2. Jiang, Y.; Karpf, S.; Jalali, B. Time-Stretch LiDAR as a Spectrally Scanned Time-of-Flight Ranging Camera. Nat. Photonics 2020, 14, 14–18. [Google Scholar] [CrossRef]
  3. Riemensberger, J.; Lukashchuk, A.; Karpov, M.; Weng, W.; Lucas, E.; Liu, J.; Kippenberg, T.J. Massively Parallel Coherent Laser Ranging Using a Soliton Microcomb. Nature 2020, 581, 164–170. [Google Scholar] [CrossRef]
  4. Bastos, D.; Brandao, A.; Lorences-Riesgo, A.; Monteiro, P.P.; Oliveira, A.S.R.; Pereira, D.; Olyaei, H.Z.; Drummond, M.V. Time-Frequency Range Estimation Method for Pulsed LiDAR. IEEE Trans. Veh. Technol. 2023, 72, 1429–1437. [Google Scholar] [CrossRef]
  5. Park, Y.; Kim, G. LIDAR Pulse Coding for High Resolution Range Imaging at Improved Refresh Rate. Opt. Express 2016, 24, 23810–23828. [Google Scholar] [CrossRef]
  6. Kim, G.; Eom, J.; Park, Y. Concurrent Transmitting LiDAR Sensor with Bipolar Optical Codes. In Proceedings of the Wireless Telecommunications Symposium, Boston, MA, USA, 24 May 2023. [Google Scholar]
  7. Wang, J.; Zhang, G.; You, Z. High-Resolution LiDAR Using Random Modulated Continuous Wave with a Low Code Rate. Measurement 2022, 202, 111719. [Google Scholar] [CrossRef]
  8. Wang, J.; Zhang, G.; You, Z. Improved Sampling Scheme for LiDAR in Lissajous Scanning Mode. Microsyst. Nanoeng. 2022, 8, 64. [Google Scholar] [CrossRef]
  9. Li, Z.-P.; Ye, J.-T.; Huang, X.; Jiang, P.-Y.; Cao, Y.; Hong, Y.; Yu, C.; Zhang, J.; Zhang, Q.; Peng, C.-Z.; et al. Single-Photon Imaging over 200 Km. Optica 2021, 8, 344–349. [Google Scholar] [CrossRef]
  10. Lihachev, G.; Riemensberger, J.; Weng, W.; Liu, J.; Tian, H.; Siddharth, A.; Snigirev, V.; Shadymov, V.; Voloshin, A.; Wang, R.N.; et al. Low-Noise Frequency-Agile Photonic Integrated Lasers for Coherent Ranging. Nat. Commun. 2022, 13, 1–10. [Google Scholar] [CrossRef]
  11. Snigirev, V.; Riedhauser, A.; Lihachev, G.; Churaev, M.; Riemensberger, J.; Wang, R.N.; Siddharth, A.; Huang, G.; Möhl, C.; Popoff, Y.; et al. Ultrafast Tunable Lasers Using Lithium Niobate Integrated Photonics. Nature 2023, 615, 411–417. [Google Scholar] [CrossRef]
  12. Li, M.; Chang, L.; Wu, L.; Staffa, J.; Ling, J.; Javid, U.A.; Xue, S.; He, Y.; Lopez-rios, R.; Morin, T.J.; et al. Integrated Pockels Laser. Nat. Commun. 2022, 13, 5344. [Google Scholar] [CrossRef] [PubMed]
  13. Behroozpour, B.; Sandborn, P.A.M.; Quack, N.; Seok, T.J.; Matsui, Y.; Wu, M.C.; Boser, B.E. Electronic-Photonic Integrated Circuit for 3D Microimaging. IEEE J. Solid-State Circuits 2017, 52, 161–172. [Google Scholar] [CrossRef]
  14. Li, P.; Zhang, Y.; Yao, J. Rapid Linear Frequency Swept Frequency-Modulated Continuous Wave Laser Source Using Iterative Pre-Distortion Algorithm. Remote Sens. 2022, 14, 3455. [Google Scholar] [CrossRef]
  15. Jiang, S.; Liu, B.; Wang, H. FMCW Laser Ranging Method Based on a Frequency Multiplier. Appl. Opt. 2021, 60, 918. [Google Scholar] [CrossRef]
  16. Zhang, X.; Pouls, J.; Wu, M.C. Laser Frequency Sweep Linearization by Iterative Learning Pre-Distortion for FMCW LiDAR. Opt. Express 2019, 27, 9965. [Google Scholar] [CrossRef]
  17. Cheng, X.; Liu, J.; Zhang, Y.; Zhang, F.; Qu, X. Simultaneous Measurement of Distance and Speed via Frequency-Modulated Continuous-Wave LIDAR System Based on H13C14N Gas Cell. Opt. Lasers Eng. 2022, 159, 107193. [Google Scholar] [CrossRef]
  18. Qian, R.; Zhou, K.C.; Zhang, J.; Viehland, C.; Dhalla, A.H.; Izatt, J.A. Video-Rate High-Precision Time-Frequency Multiplexed 3D Coherent Ranging. Nat. Commun. 2022, 13, 1476. [Google Scholar] [CrossRef]
  19. Yang, H.J.; Deibel, J.; Nyberg, S.; Riles, K. High-Precision Absolute Distance and Vibration Measurement with Frequency Scanned Interferometry. Appl. Opt. 2005, 44, 3937–3944. [Google Scholar] [CrossRef]
  20. Martinez, J.J.; Campbell, M.A.; Warden, M.S.; Hughes, E.B.; Copner, N.J.; Lewis, A.J. Dual-Sweep Frequency Scanning Interferometry Using Four Wave Mixing. IEEE Photonics Technol. Lett. 2015, 27, 733–736. [Google Scholar] [CrossRef]
  21. Xu, Z.; Tang, L.; Zhang, H.; Pan, S. Simultaneous Real-Time Ranging and Velocimetry via a Dual-Sideband Chirped Lidar. IEEE Photonics Technol. Lett. 2017, 29, 2254–2257. [Google Scholar] [CrossRef]
  22. Cheng, L.; Ziyi, X.; Guodong, L.; Bingguo, L.; Binghui, L. FSI Combined with Heterodyne Interferometer for Non-Cooperative Targets Distance Measurement. IEEE Photonics Technol. Lett. 2022, 34, 85–88. [Google Scholar] [CrossRef]
  23. Wang, Z.; Liu, Z.; Tian, K.; Zhang, H. Frequency-Scanning Interferometry for Dynamic Measurement Using Adaptive Sage-Husa Kalman Filter. Opt. Lasers Eng. 2023, 165, 107545. [Google Scholar] [CrossRef]
  24. Trocha, P.; Karpov, M.; Ganin, D.; Pfeiffer, M.H.P.; Kordts, A.; Wolf, S.; Krockenberger, J.; Marin-Palomo, P.; Weimann, C.; Randel, S.; et al. Ultrafast Optical Ranging Using Microresonator Soliton Frequency Combs. Science 2018, 359, 887–891. [Google Scholar] [CrossRef] [PubMed]
  25. Chen, R.; Shu, H.; Shen, B.; Chang, L.; Xie, W.; Liao, W.; Tao, Z.; Bowers, J.E.; Wang, X. Breaking the Temporal and Frequency Congestion of LiDAR by Parallel Chaos. Nat. Photonics 2023, 17, 306–314. [Google Scholar] [CrossRef]
  26. Lukashchuk, A.; Riemensberger, J.; Tusnin, A.; Liu, J.; Kippenberg, T.J. Chaotic Microcomb-Based Parallel Ranging. Nat. Photonics 2023, 17, 814–821. [Google Scholar] [CrossRef]
  27. Xu, Z.; Chen, K.; Zhang, H.; Pan, S. Multifunction Lidar System Based on Polarization-Division Multiplexing. J. Light. Technol. 2019, 37, 2000–2007. [Google Scholar] [CrossRef]
  28. Esteban, J.J.; García, A.F.; Barke, S.; Peinado, A.M.; Cervantes, F.G.; Bykov, I.; Heinzel, G.; Danzmann, K. Experimental Demonstration of Weak-Light Laser Ranging and Data Communication for LISA. Opt. Express 2011, 19, 15937–15946. [Google Scholar] [CrossRef]
  29. Albuquerque, D.F.; Vieira, J.M.N.; Lopes, S.I.; Aguilera, T.; Álvarez, F.J. Doppler Resilient Modulation in a Cdma-Based Acoustic Local Positioning System. In Proceedings of the 2016 International Conference on Indoor Positioning and Indoor Navigation IPIN, Alcala de Henares, Spain, 4–7 October 2016. [Google Scholar]
  30. Zhang, Y.; Wu, Y.; Xia, H. Spatial Resolution Enhancement of Coherent Doppler Lidar by Pseudo-Random Phase Coding. J. Light. Technol. 2022, 40, 4467–4473. [Google Scholar] [CrossRef]
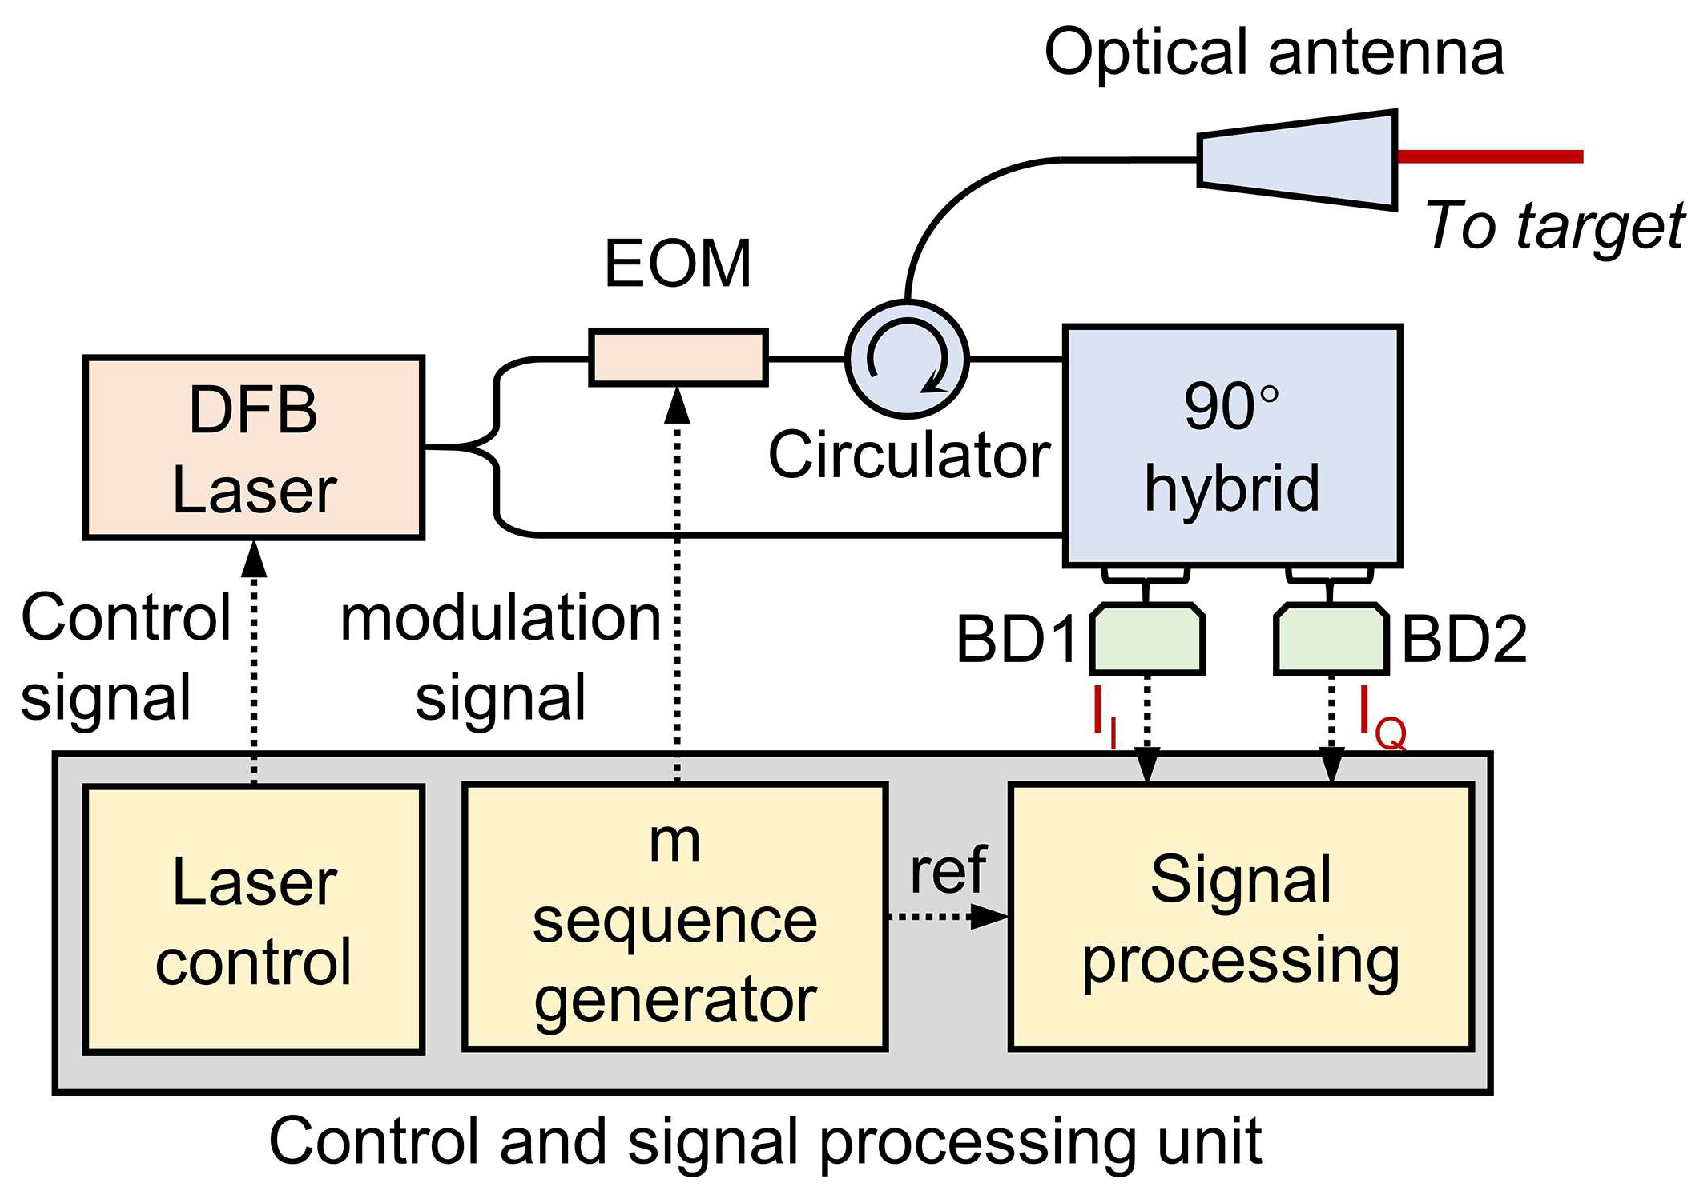
Figure 1. Schematic diagram of the proposed rapid laser ranging system.
Remotesensing 17 01002 g001
Figure 2. The normalized autocorrelation function of the m-sequence.
Remotesensing 17 01002 g002
Figure 3. The normalized ambiguity function of the 7th-order m-sequence.
Remotesensing 17 01002 g003
Figure 4. The zero-DFS profile (a) and zero-delay profile (b) of the normalized ambiguity function.
Remotesensing 17 01002 g004
Figure 5. The normalized amplitude spectrum of the complex photocurrent signal: (a) signal amplitude spectrum; (b) partial enlargement drawing of amplitude spectrum.
Remotesensing 17 01002 g005
Figure 6. The outputs of the matched filter before and after the frequency shifting of the complex photocurrent signal.
Remotesensing 17 01002 g006
Figure 7. Schematic of the beam trajectory formed by rapid laser beam scanning.
Remotesensing 17 01002 g007
Figure 8. The principle of the sliding window analysis.
Remotesensing 17 01002 g008
Figure 9. Measurement SNR versus measurement frequency for each laser ranging method.
Remotesensing 17 01002 g009
Figure 10. Time-domain waveforms of the modulated components of the complex photocurrent signals, the ranging spectrum of the target, and the velocity spectrum of the target, under different SNRs: (a) time-domain waveforms of the modulated components of the complex photocurrent signals; (b) ranging spectrum of the target; (c) velocity spectrum of the target.
Remotesensing 17 01002 g010
Figure 11. Simulation results for target locating at different positions: (a) ranging result; (b) ranging error.
Remotesensing 17 01002 g011
Figure 12. Simulation results for targets with different velocities: (a) velocimetry result; (b) velocimetry error.
Remotesensing 17 01002 g012
Figure 13. Simulation results for sliding window measurement: (a) ranging result; (b) ranging error.
Remotesensing 17 01002 g013
Figure 14. Schematic diagrams of the experimental setups: (a) coherent detection with LD-PRPM validation; (b) rapid ranging capability validation of the sliding window measurement.
Remotesensing 17 01002 g014
Figure 15. Experimental results of simultaneous ranging and velocimetry: (a) ranging result; (b) velocimetry results.
Remotesensing 17 01002 g015
Figure 16. Line scan results of the metal box: (a) line scan results of the metal box; (b) partial enlarged view of the red dashed box; (c) entire process of the measurement beam moving from the target to the background white wall from 146.5 μs to 147 μs.
Remotesensing 17 01002 g016
Disclaimer/Publisher’s Note: The statements, opinions and data contained in all publications are solely those of the individual author(s) and contributor(s) and not of MDPI and/or the editor(s). MDPI and/or the editor(s) disclaim responsibility for any injury to people or property resulting from any ideas, methods, instructions or products referred to in the content.