Essay

The Tectonic Significance of the Mw7.1 Earthquake Source Model in Tibet in 2025 Constrained by InSAR Data

1
School of Environment and Spatial Informatics, China University of Mining and Technology, Xuzhou 221116, China
2
Anhui Earthquake Agency, Hefei 230031, China
3
Anhui Mengcheng National Geophysical Observatory, Anhui Earthquake Agency, Bozhou 233527, China
4
Wuhan Gravitation and Solid Earth Tides, National Observation and Research Station, 40 Hongshance Road, Wuhan 430071, China
*
Author to whom correspondence should be addressed.
Remote Sens. 2025, 17(5), 936; https://doi.org/10.3390/rs17050936
Submission received: 7 February 2025 / Revised: 27 February 2025 / Accepted: 3 March 2025 / Published: 6 March 2025

Abstract

:
On 7 January 2025, at Beijing time, an Mw7.1 earthquake occurred in Dingri County, Shigatse, Tibet. To accurately determine the fault that caused this earthquake and understand the source mechanism, this study utilized Differential Interferometric Synthetic Aperture Radar (DInSAR) technology to process Sentinel-A data, obtaining the line-of-sight (LOS) co-seismic deformation field for this earthquake. This deformation field was used as constraint data to invert the geometric parameters and slip distribution of the fault. The co-seismic deformation field indicates that the main characteristics of the earthquake-affected area are vertical deformation and east-west extension, with maximum deformation amounts of 1.6 m and 1.0 m for the ascending and descending tracks, respectively. A Bayesian method based on sequential Monte Carlo sampling was employed to invert the position and geometric parameters of the fault, and on this basis, the slip distribution was inverted using the steepest descent method. The inversion results show that the fault has a strike of 189.2°, a dip angle of 40.6°, and is classified as a westward-dipping normal fault, with a rupture length of 20 km, a maximum slip of approximately 4.6 m, and an average slip angle of about −82.81°. This indicates that the earthquake predominantly involved normal faulting with a small amount of left–lateral strike–slip, corresponding to a moment magnitude of Mw7.1, suggesting that the fault responsible for the earthquake was the northern segment of the DMCF (Deng Me Cuo Fault). The slip distribution results obtained from the finite fault model inversion show that this earthquake led to a significant increase in Coulomb stress at both ends of the fault and in the northeastern–southwestern region, with stress loading far exceeding the earthquake triggering threshold of 0.03 MPa. Through analysis, we believe that this Dingri earthquake occurred at the intersection of a “Y”-shaped structural feature where stress concentration is likely, which may be a primary reason for the frequent occurrence of moderate to strong earthquakes in this area.

Graphical Abstract

1. Introduction

According to the China Earthquake Networks Center (CENC), an Mw7.1 earthquake occurred on 7 January 2025, at 09:05 in Dingri County, Shigatse, Tibet Autonomous Region, China (latitude 28.5°N, longitude 87.45°E), with a focal depth of 10 km. The maximum intensity of the earthquake reached IX degrees, making it the largest earthquake on the Chinese mainland in the past year. The earthquake occurred within the Lhasa block of the Tibetan Plateau, approximately 11 km from the nearest fault, the Deng Me Cuo fault (hereinafter referred to as “DMCF”, Figure 1). As of 07:00 on 8 January, a series of aftershocks (1.2 ≤ M ≤ 5.1) totaling 390 occurrences had been recorded [1]. The earthquake resulted in 126 fatalities and damaged 27,248 housing units (including collapsed houses, fallen courtyard walls, and cracked walls), affecting approximately 61,500 people to varying degrees. The epicenter of this Mw7.1 earthquake was located near the northern segment of the DMCF, west of the Shenzha–Dingjie rift valley. Research from various institutions, including the China Earthquake Networks Center (CEA), Harvard University’s Global Centroid Moment Tensor (GCMT), and the United States Geological Survey (USGS), has indicated that the Dingri earthquake likely occurred on a low-angle normal fault with extensional characteristics (Table 1). Among them, the CEA inverted the seismic moment tensor (optimal double-couple model) based on broadband waveform data from mainland China and the near-source full waveform method. The Green’s function was calculated based on a regional velocity model. Given the density of the seismic stations near the earthquake event, the source mechanism inversion results were obtained within 15 min after the earthquake. The southern part of the Tibetan Plateau, where the earthquake occurred, is subjected to both north–south compressive and east–west extensional stresses, with the plateau exhibiting two typical fault systems that are nearly north–south- and east–west-oriented. Under such intense crustal deformations, the Lhasa block and the surrounding fault zones are particularly active. Since 1950, the Lhasa block has experienced 21 earthquakes of a magnitude 6 or higher, the largest being the 6.9 magnitude earthquake in Milin, Tibet, in 2017, which was a typical thrust fault rupture [2]. The Dingri earthquake represented a typical normal fault rupture event, indicating that extensional stress predominates in the region, although the specific fault responsible for the earthquake remains unclear. Studying this earthquake is beneficial for understanding the seismic mechanisms and movement characteristics of the north–south normal fault system in the southern Shenzha–Dingjie rift valley area, and it holds significant value for recognizing the Cenozoic north–south rifting and basin structural features along the northern foothills of the Himalayas.
The high altitude and scarcity of seismic geological data pose numerous challenges for field geological surveys. To expedite research on this earthquake, this paper employs Differential Interferometric Synthetic Aperture Radar (DInSAR) data to obtain a co-seismic deformation field with high spatial and high-precision resolution, constraining the geometric shape of the fault that generated the earthquake, and providing accurate parameters for inverting the co-seismic slip distribution. Particularly, when inverting the geometric shape parameters of the fault using nonlinear estimation methods, different inversion methods can yield various optimization results, potentially leading to complex, multimodal issues [3]. The sequential Monte Carlo (SMC) method can avoid producing locally optimal results and has advantages such as harmonizing likelihood, resampling, and parallel computation [4], enabling the efficient completion of nonlinear inversion work and yielding precise fault geometric parameters. Based on this, the study inverts the characteristics of co-seismic rupture slip, analyzes the faulting structure, calculates the Coulomb stress changes on specific fault planes, and qualitatively assesses seismic hazards.
In summary, this research utilized Sentinel-1A data to extract the co-seismic deformation field through DInSAR and employed a Bayesian method based on sequential Monte Carlo sampling to study the geometric parameters of the fault that generated the earthquake [5], using the steepest descent method to invert the slip distribution of the fault [6], providing a reference for accurately understanding the deformation characteristics and faulting structure of the Mw7.1 earthquake.
Figure 1. Tectonic background of the Mw7.1 Dingri earthquake in 2025. (a) Geographical Location of the Epicenter of the Dingri Earthquake. Black box: research sope of (b); gray focal spheres: source mechanisms of M > 6.5 earthquakes since 1970 as provided by the USGS; Red focal sphere: source mechanism of the Dingri earthquake as given by the USGS. (b) Coverage Area of Earthquake Epicenter Images. Green and white boxes indicate the coverage areas of the European Space Agency’s Sentinel-1A ascending and descending orbits; black box: research sope of (c). (c) Local amplification map of the earthquake-prone area. The red and blue focal spheres represent the source mechanisms provided by the USGS and GCMT, respectively; the yellow dots: the precise aftershock catalog of the Mw7.1 Dingri earthquake [7]; white circles: the county towns in the vicinity of the epicenter; DMCF: Deng Me Cuo Fault; NHF: North Himalayan fault; YLZBF: Yarlung Zangbo River fault; SZDJF: Shenzha–Dingjie fault; TDF: Tangyako–Dingri fault.
Remotesensing 17 00936 g001

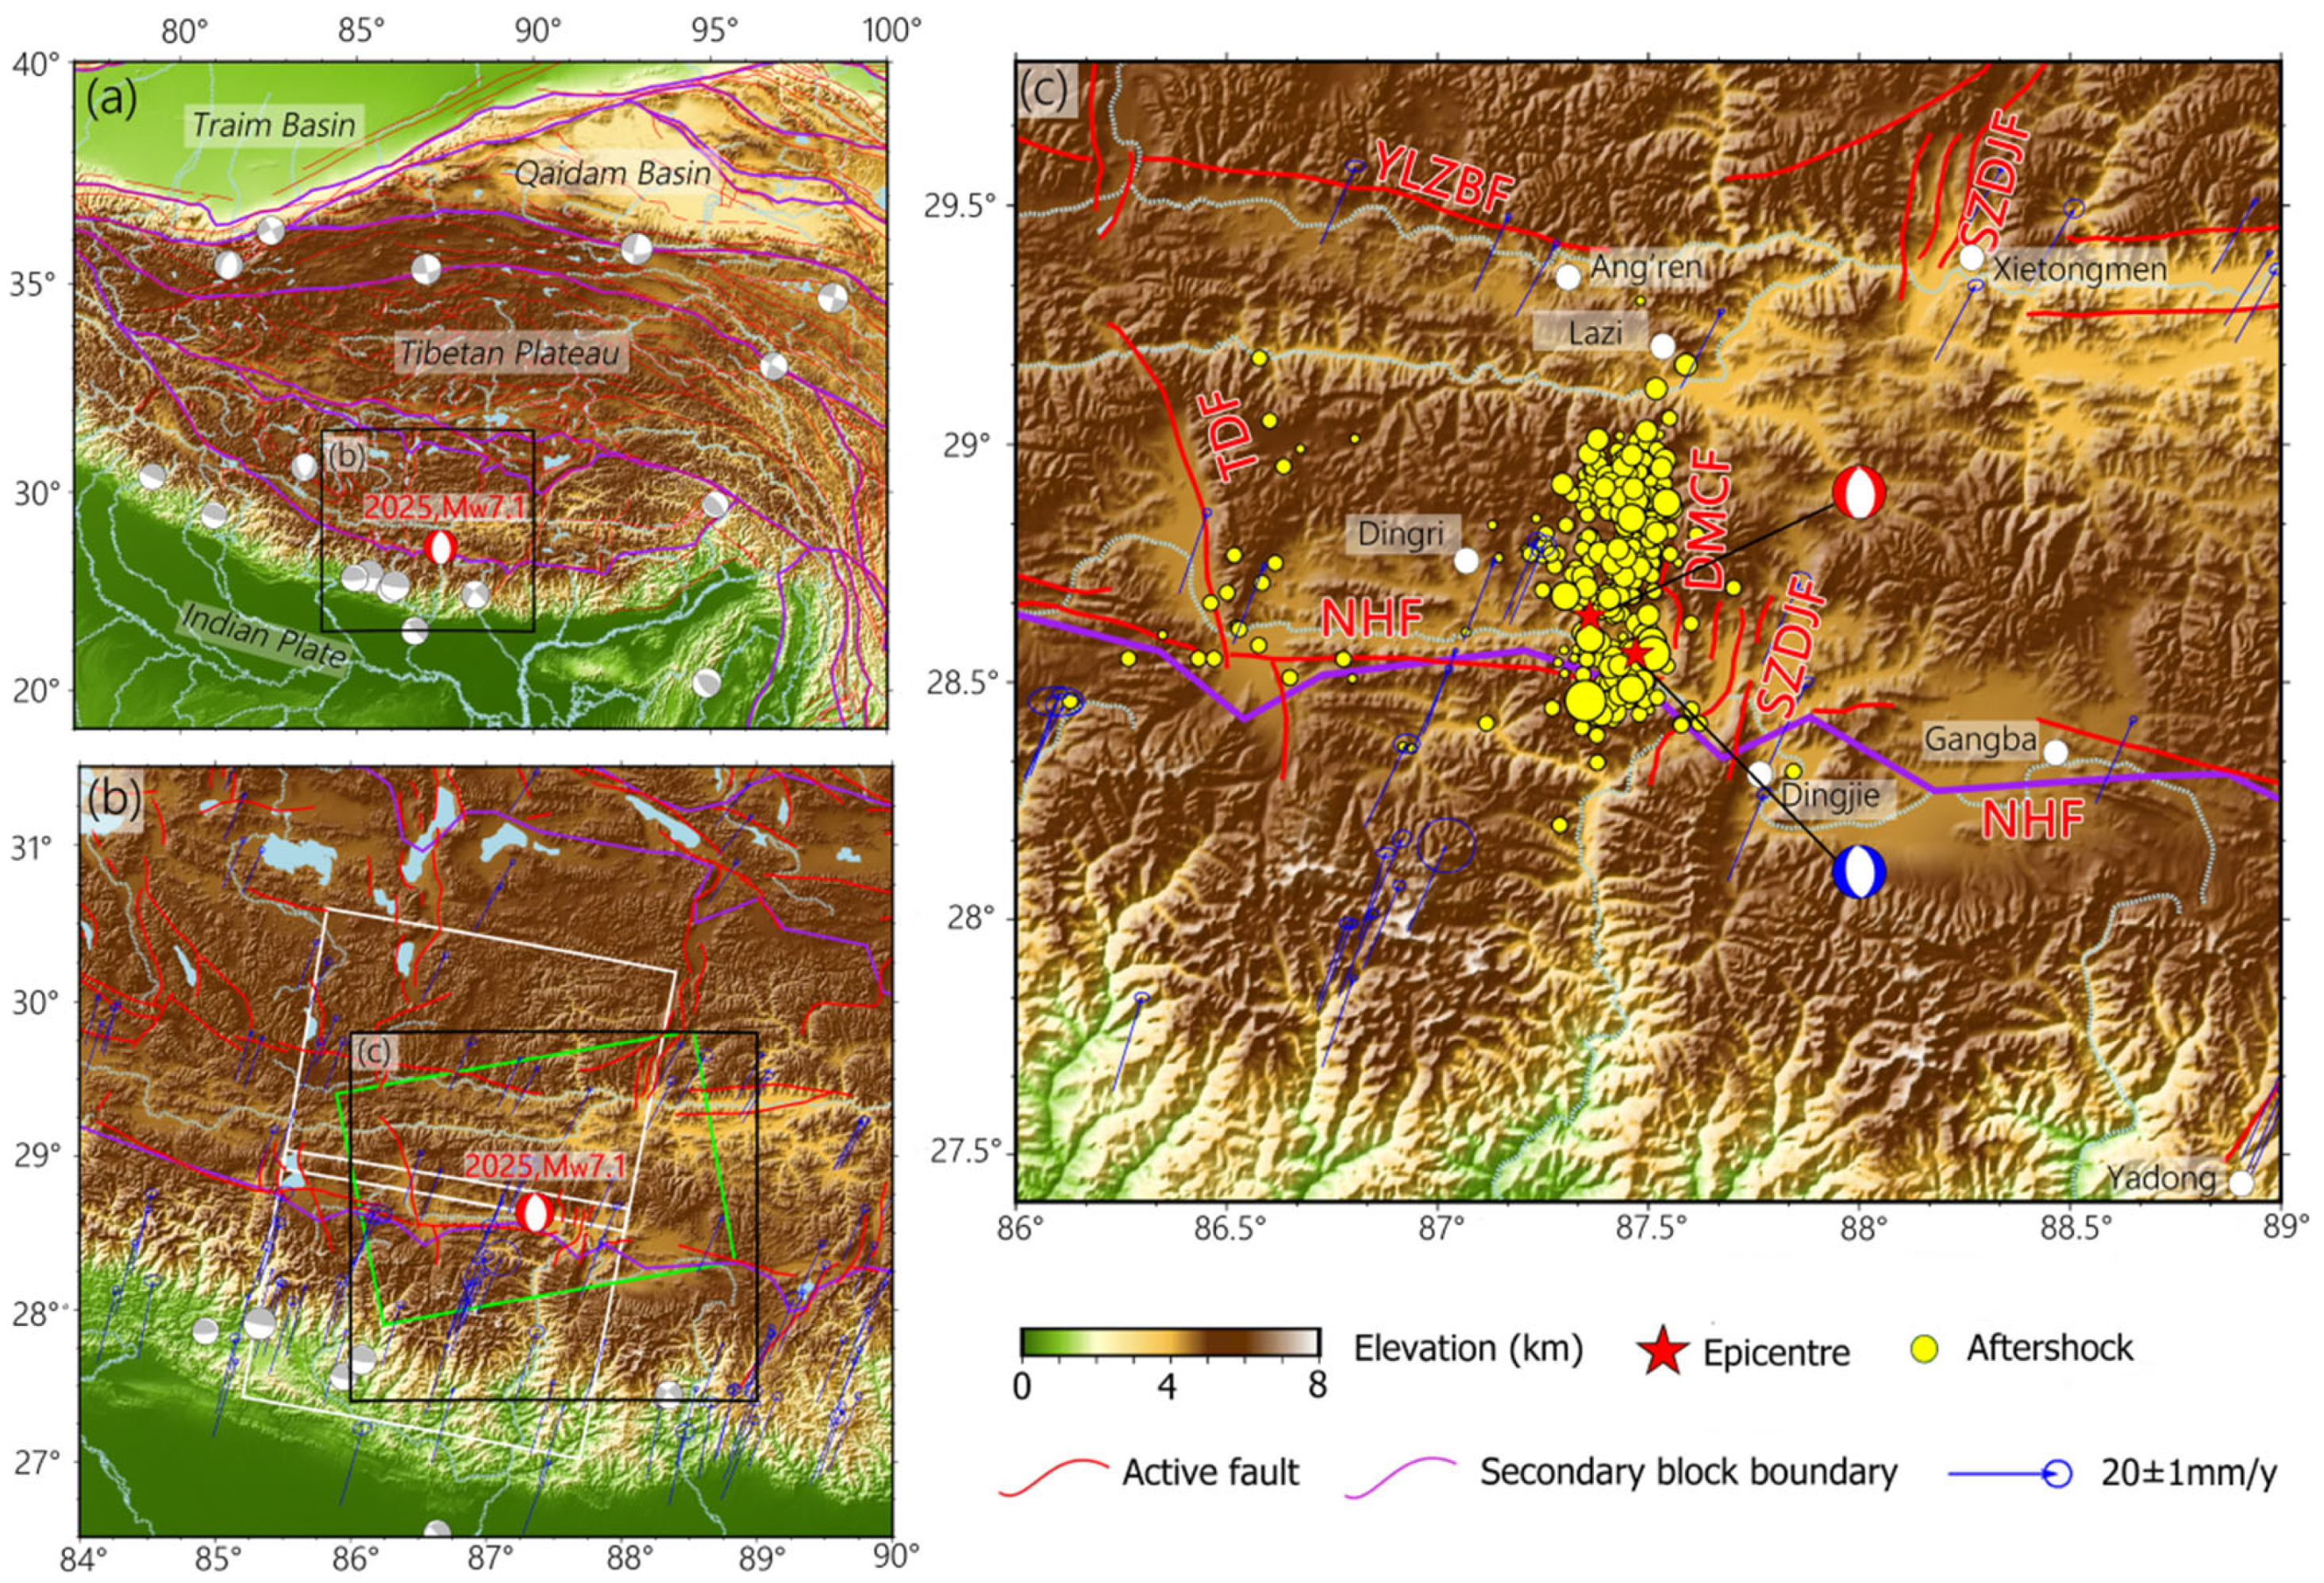
2. Geological Structural Background

In terms of regional tectonics, this earthquake occurred within the Himalayan block of the Gangdise–Himalayas orogenic belt. The tectonic secondary unit where the epicenter is located is the north Himalayan carbonate platform, which stretches in a belt-like manner from east to west and primarily exposes Paleozoic to Cenozoic strata. To the north lies the passive continental margin basin of the Laiguangri unit, which exposes Mesoproterozoic to Upper Proterozoic, Paleozoic, and Paleogene strata; to the south is the high Himalayan basement mélange zone, predominantly consisting of Mesoproterozoic strata. At the junction of the Dingri and Dingjie counties within the South Asian subcontinent, a small structural uplift occurs in the northern direction [8]. This earthquake is situated in the intersection area of the Shenzha–Dingjie rift and the North Himalayan fault (hereinafter referred to as “NHF”), to the west of this small structural uplift, near the DMCF east of Dingri County (Figure 1). Influenced by the push from the Indian Plate, the uplift of the Tibetan Plateau, and the thickening of the crust, the region exhibits significant east–west extensional tectonics, structural geomorphological evolution, and normal faulting seismic activity. The Lhasa block is cut by several near-north–south-trending rifts from west to east, penetrating southward through the Yarlung Tsangpo suture zone to the arc-shaped Himalayan region. The near-east–west extensional deformation within the block is mainly adjusted through multiple parallel near-north–south-trending normal fault rift systems [9]. Among these, the near-north–south structural rifts within the Lhasa block include the Yadong–Gulu rift, the Shenzha–Dingjie rift, the southern section of the Gangga–Dangqiongcuo rift, the Nimu–Lhozhuk rift, the Zhongba–Daxiong rift, and the Hualba–Cangmucuo rift [10]. These structural rifts have been significantly active since the Quaternary, with frequent strong earthquakes, such as the Ms7.0 earthquake in 1908 in the Dingri–Gemangcuo valley and the Ms7.5 earthquake in the Yadong–Gulu rift in 1952. The closest earthquake to this event was a magnitude 5.9 earthquake that occurred on 20 March 2020, approximately 15 km from the epicenter of the current quake.

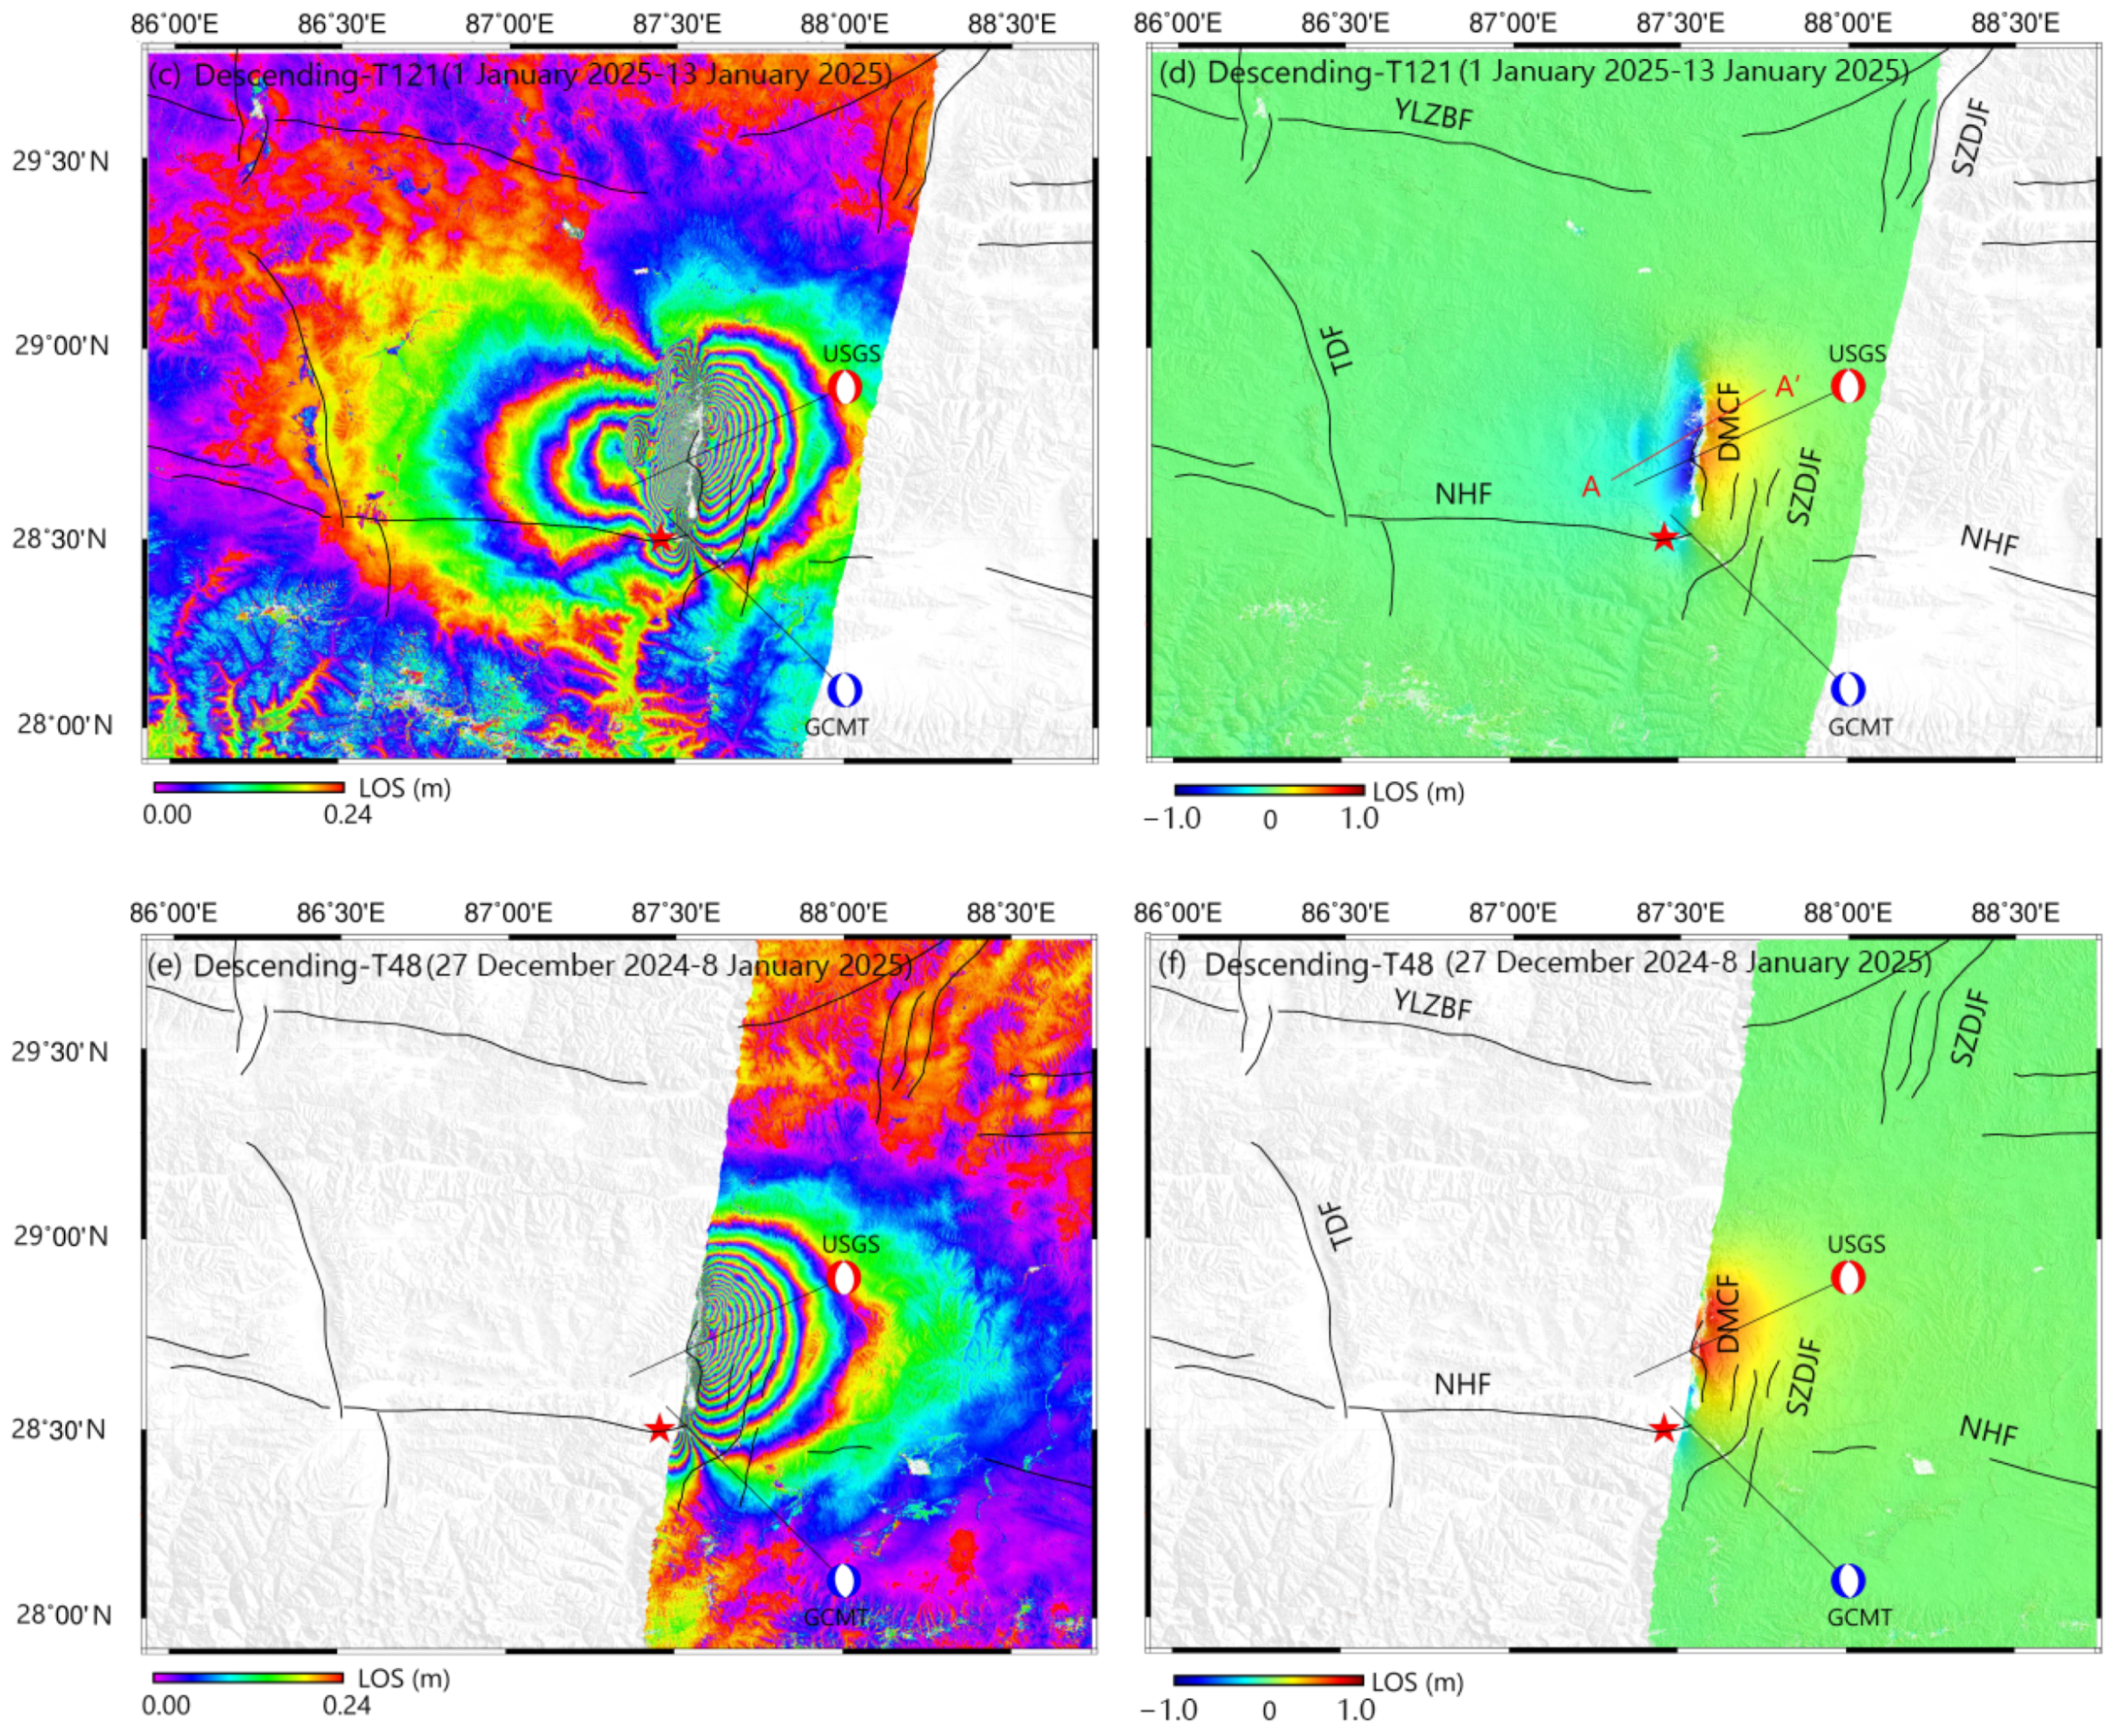
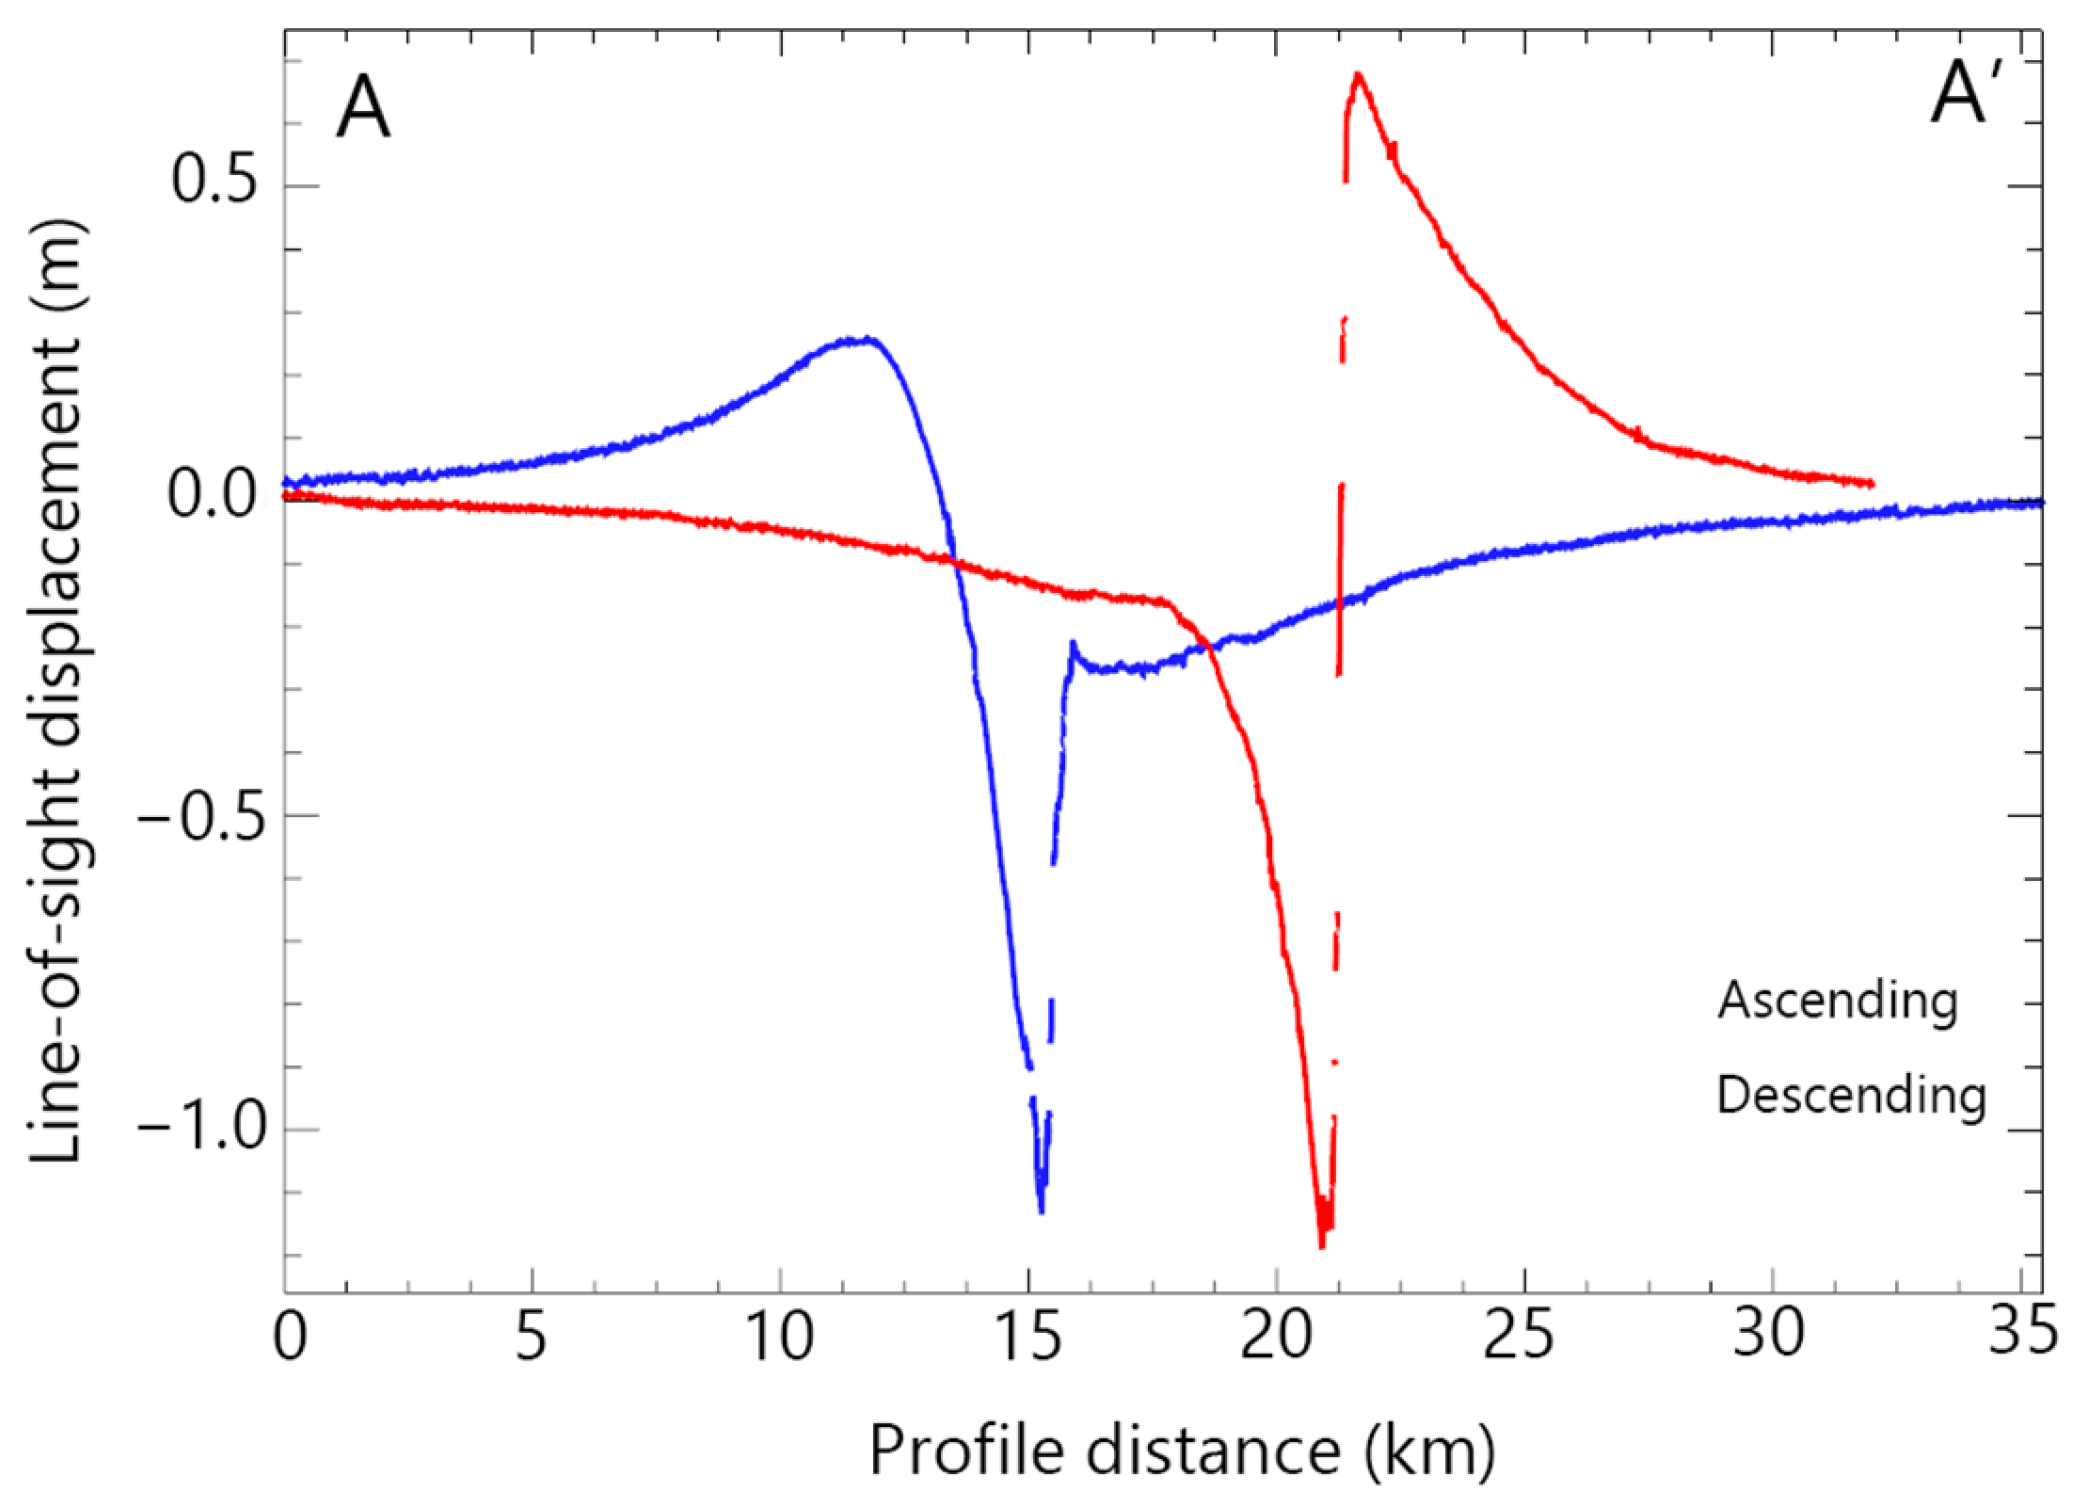
3. InSAR Data Processing and Deformation Analysis

The European Space Agency launched the next-generation radar satellite Sentinel-1A in April 2014, operating in the C-band with a revisit period of 12 days. This satellite can acquire images from three sub-strips, with a swath width of up to 250 km [11]. The interferometric wide-swath imagery data fully covered the main deformation area of the daytime earthquake (Table 2), with the T121 descending orbit data composed of two overlapping images. This study used SARscape 5.7 software to process two re-track images before and after the earthquake to obtain interferometric images of the co-seismic deformation field. The data utilized ALOS DEM (30 × 30 m resolution) to eliminate phase errors caused by terrain effects [12]. In the specific processing procedure, multi-looking with a range direction look number of 4 and an azimuth direction look number of 1 was first applied to generate the interferogram. The Goldstein filtering method was used to enhance the signal-to-noise ratio [13]; subsequently, the minimum cost flow algorithm was employed for phase unwrapping [14] to resolve the 2π ambiguity issue; finally, geographic coding was used to obtain the co-seismic deformation field in the LOS direction of the daytime earthquake in the WGS84 geographic coordinate system, as shown in Figure 2. Considering that the epicenter of this earthquake was located in the high-altitude region of the Tibetan Plateau, where the air is thin and dry, the impact of the troposphere on the SAR phase was minimal. Therefore, this study did not use GACOS data to remove atmospheric water vapor information from the interferogram. From the tectonic background and source mechanism, this earthquake was classified as extensional, with both ascending and descending InSAR deformation fields showing characteristics of subsidence on the west side and uplift on the east side, indicating a clear normal fault feature for this earthquake. Additionally, there are distinct deformation stripe discontinuities along the northern segment of the DMCF, suggesting clear surface rupture characteristics, with a potential surface rupture length of about 20 km, preliminarily inferring that the source fault was the northern segment of the DMCF. The InSAR deformation field shows that the maximum LOS deformation at the epicenter occurred on the hanging wall of the fault (west side of the fault zone), with the maximum deformation in the ascending track approaching −1.6 m (negative values indicate movement away from the satellite), and the maximum deformation in the descending track approaching −1 m, creating a subsidence area 20 km wide and 45 km long within the graben west of the DMCF, which coincides with the range of the Deng Me Cuo graben. Both ascending and descending track deformation fields exhibited asymmetric distribution, with significant subsidence occurring on the hanging wall and uplift deformation on the footwall, consistent with the earthquake mechanism, indicating that the earthquake rupture was primarily a normal fault. Moreover, the LOS displacement on the hanging wall was notably greater than that on the footwall, demonstrating the westward inclination of the source fault. This study further delineated the co-seismic displacement measurement profile AA’ across the LOS deformation fields from west to east, where displacement discontinuities appeared between the two deformation areas, indicating that surface rupture or excessive surface deformation gradients caused shallow surface InSAR decorrelation areas, suggesting that the fault may have ruptured to the surface (Figure 3). Due to the T48 orbit data not fully covering the deformation field of this earthquake, this study did not use the results from this orbit in subsequent source mechanism inversion and only used the results from T12 and T121 as constraint data.

4. Inversion of Fault Geometry and Slip Distribution

To expedite the inversion process, this study employed a uniform sampling method to downsample the LOS deformation field, reducing the data volume while retaining the main features of co-seismic deformation. Ultimately, 4050 points of ascending track data and 3270 points of descending track data were obtained [15].

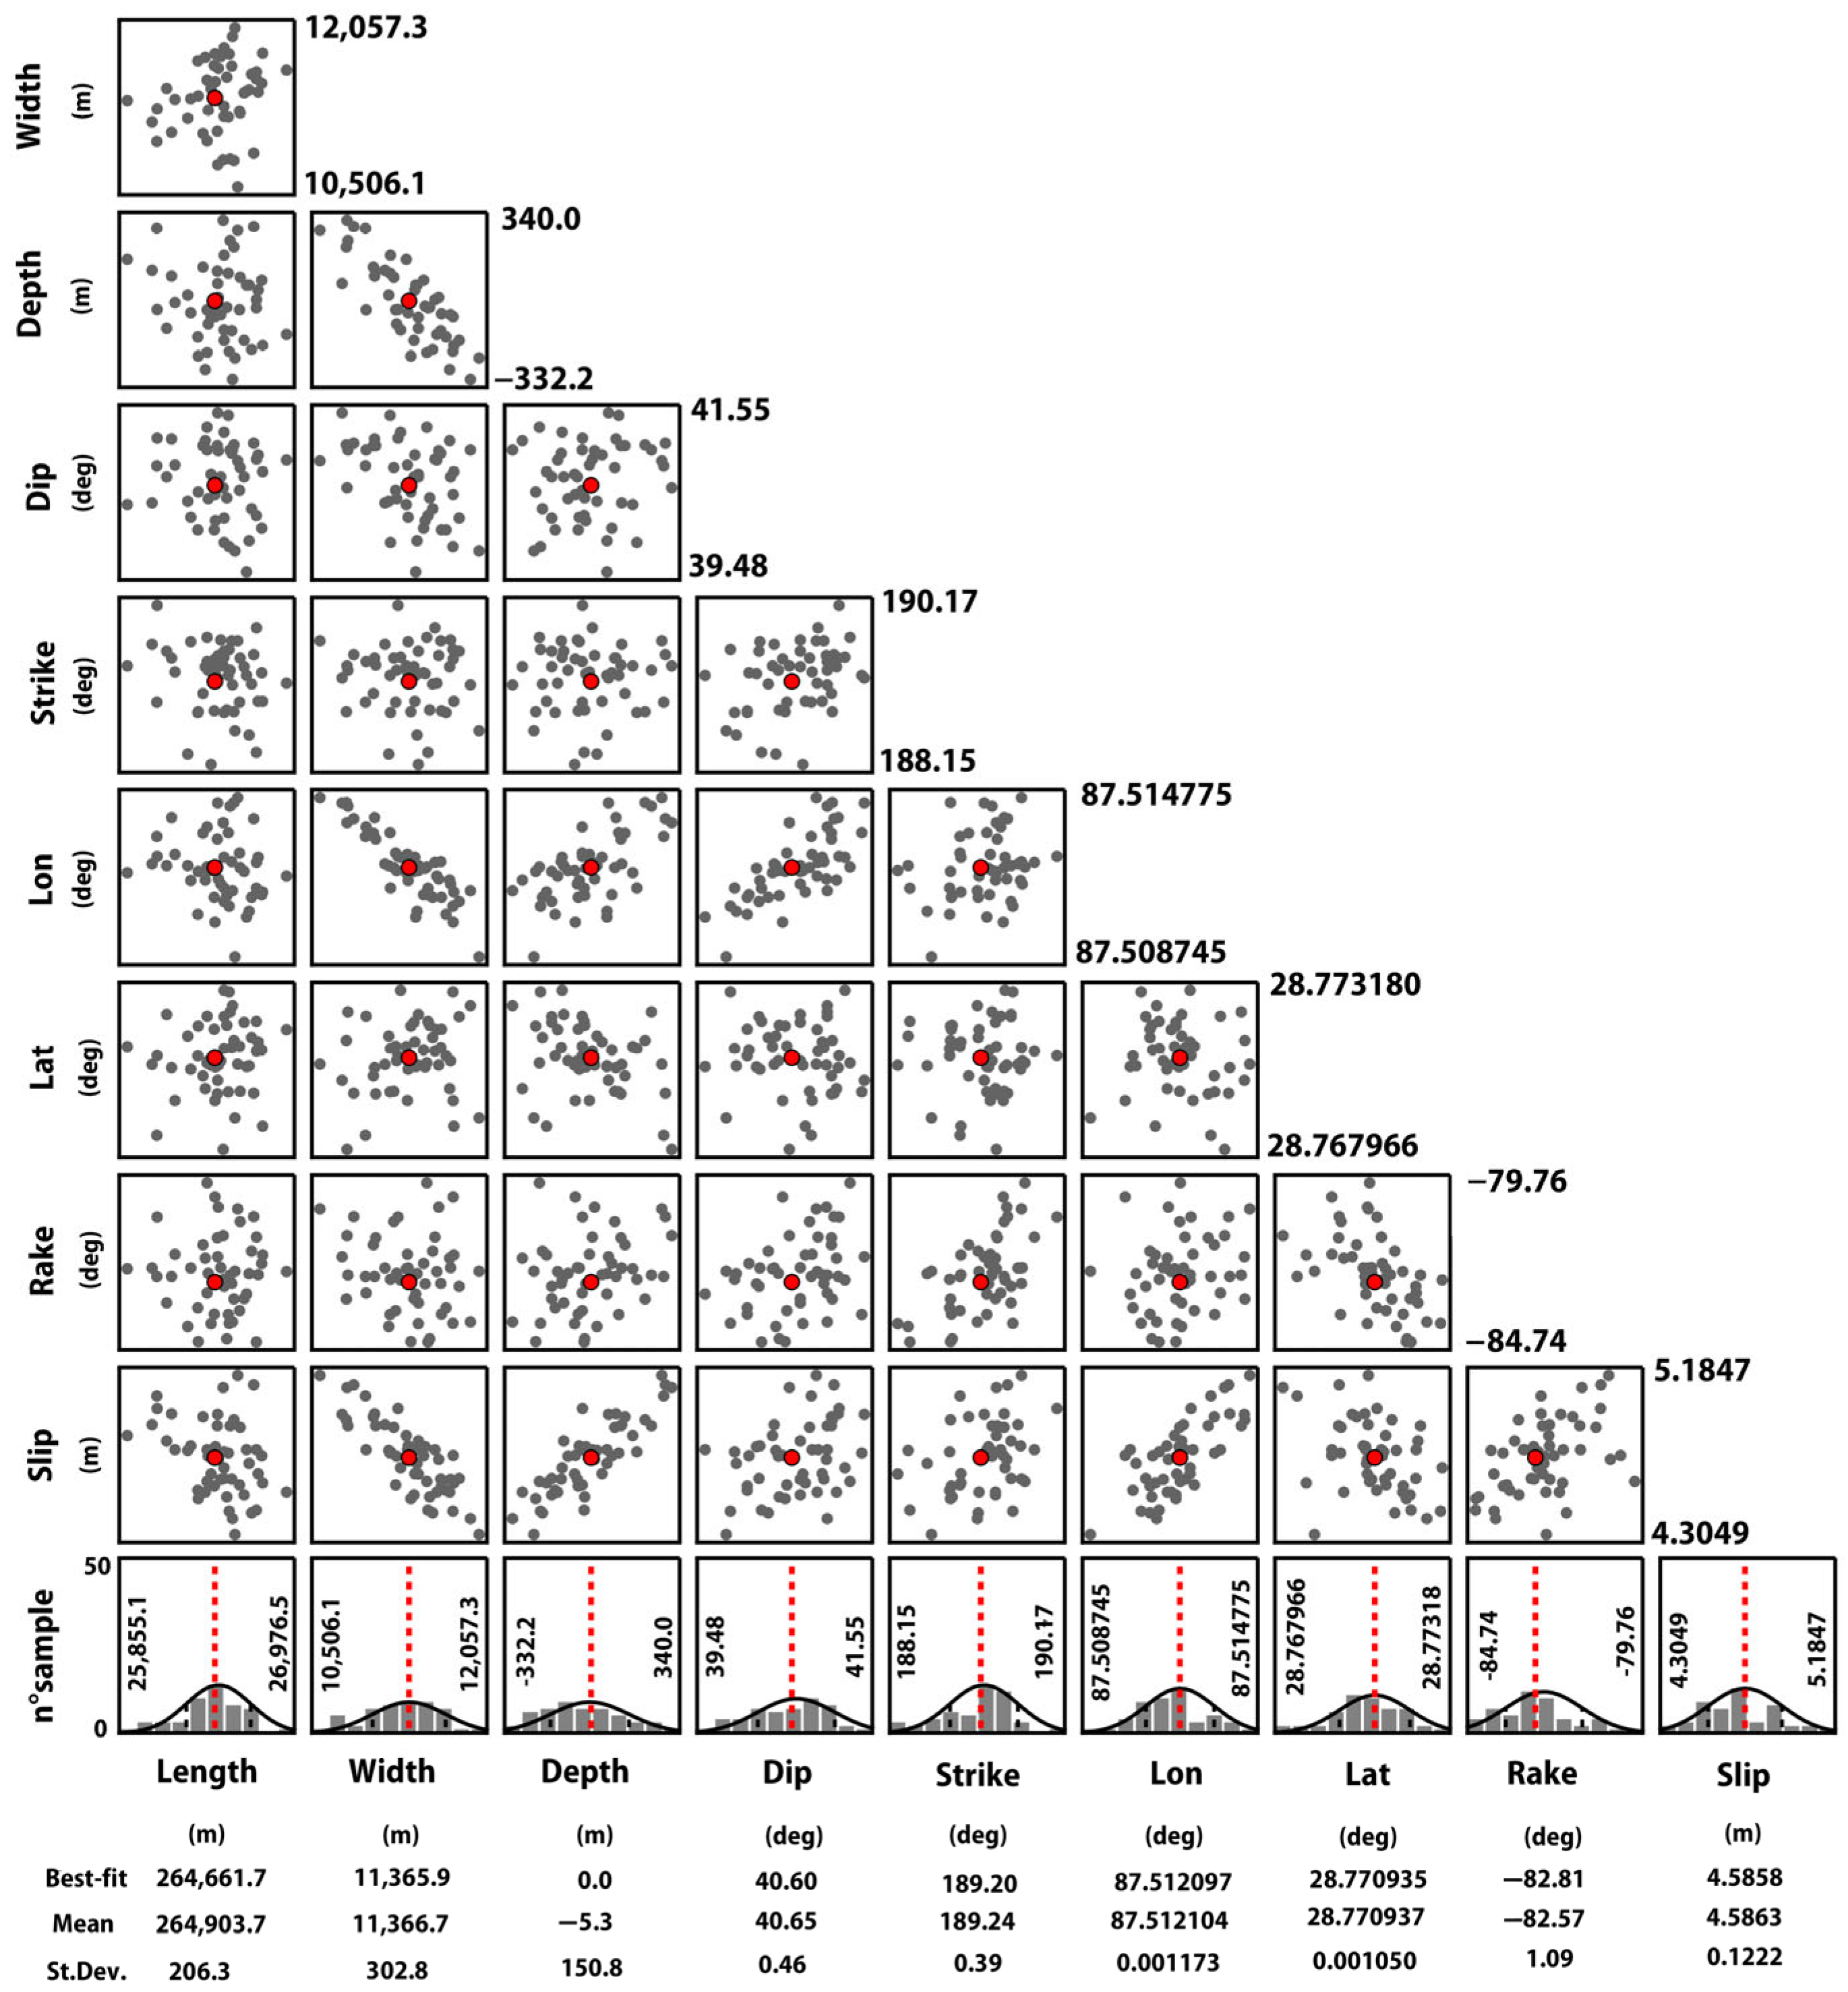
4.1. Inversion of Fault Geometry

This study assumed that the shear modulus and Poisson’s ratio were 30 GPa and 0.25, respectively [16]. First, we estimated the geometric parameters related to the fault that caused the earthquake using a Bayesian method (BM) based on sequential Monte Carlo sampling (SMC) [5]. According to the definition of the BM, the posterior probability density function (PDF) of the model parameters p ( m | d o b s ) can be expressed as follows:
p ( m | d o b s ) p ( m ) p ( d o b s | m ) ,
where m represents the parameters to be estimated, generally including fault parameters and hyperparameters, and d o b s denotes the observed data.
In general, solving for fault parameters is a nonlinear problem. For each subset d o b s , k of K datasets, we assume a multivariate Gaussian distribution with errors to estimate the distribution of unknown residuals, which serves as the hyperparameters [17]. The PDF is expressed as follows:
p ( m , σ 1 , σ 2 , , σ K | d o b s , 1 , d o b s , 2 , d o b s , K ) p ( m ) k = 1 K L ( m ,   σ k ) ,  
L ( m ,   σ k ) represents the weights of different datasets, expressed as follows:
L ( m , σ k ) = 1 ( 2 π σ k 2 ) N k / 2 C x k 1 / 2 exp 1 2 σ k 2 ( d obs , k d k ( m ) ) T C x k 1 ( d obs , k d k ( m ) ) .
where d ( m ) represents the N k static or transient displacement of dataset k; C x k denotes the variance and covariance matrix combined with hyperparameter σ k .
The BM treats the fault as a uniform plane and samples the dataset. The lower limit of the confidence interval is taken as the 2.5th percentile of the sorted estimated sample values, while the upper limit is taken as the 97.5th percentile. The values between these two limits yield the 95% confidence interval for each parameter. The optimized geometric parameters of the fault include fault strike, dip angle, length, width, depth, longitude, latitude, slip angle, and slip amount [5]. The focal mechanisms provided by different research institutions are relatively similar (Table 1), indicating that the source fault exhibited characteristics of normal faulting with a small amount of right-lateral strike–slip. Therefore, in this study, the GCMT and USGS published focal mechanism solutions were used as references during modeling. While allowing other geometric parameters of the fault to be freely searched, the strike search range was set to [0°, 360°] for inversion. The posterior probability density functions (PDF) of the fault geometric parameters in 1D and 2D are shown in Figure 4, which can characterize the degree of dispersion of the fault geometric parameters. Figure 4 reflects a good correlation between the optimal parameter values from the model fit and the peaks of the Bayesian estimates. The inversion results reveal that the source fault was approximately 40.36 km long with a slip of 4.6 m, while the strike angle and dip angle were 189.2° and 40.6°, respectively. The fault depth was at approximately 0 km, indicating that the co-seismic slip reached the surface, and the slip angle of −72.81° suggests that the earthquake was primarily normal faulting, accompanied by a small component of right–lateral strike–slip.

4.2. Inversion of Fault Slip Distribution

Based on the known fault geometry model, this study discretized the fault into several sub-faults, aiming to calculate the slip distribution corresponding to each sub-fault. The ground deformation caused by fault dislocation was calculated using the elastic dislocation formula. In the specific solving process, the steepest descent method (SDM) was employed to seek the optimal solution between the fit of the observed values and the roughness of the slip distribution [6]:
min ( G s d 2 + α 2 L s 2 ) ,
In this equation, d represents the observed values, G is the Green’s function, obtained through the elastic dislocation model of the layered elastic half-space crust; α is the smoothing factor, obtained through the trade-off curve. L is the displacement weighting factor and the finite difference approximation of the Laplacian operator; s is the slip amount of the sub-fault. Referring to the SMC results in Section 4.1, the fault parameters were initialized as follows: strike was set at 189.2°, dip at 40.6°, and the fault’s length and width were set at 70 km and 20 km, respectively, with each sub-fault sized at 1 km × 1 km. This study used downsampled data to invert the slip distribution of the day of the earthquake, consistent with the data used in Section 4.1 for inverting fault geometric parameters.
Figure 5 shows the co-seismic slip distribution, indicating that there was a significant slip area near the surface of the ruptured fault plane, suggesting that the co-seismic slip rupture reached the surface. The National Research Institute for Natural Disaster Prevention showed through the interpretation of satellite images before and after the earthquake that there were surface dislocations from the earthquake in Changsuo Township, north of Laong, and Zhanan. The co-seismic slip distribution calculated the epicenter location to be (87.51°E, 28.77°N), with the maximum rupture location of the fault in the model being relatively shallow, primarily concentrated within a depth range of 0 to 10 km, and the maximum slip amount reaching 4.6 m, indicating that this earthquake released a tremendous amount of energy, with the simulated moment magnitude reaching Mw7.1. The residual results obtained during the inversion of the fault slip distribution are shown in Figure 6. The rectangles in the figure represent the locations of the inverted faults. Near the epicenter, the line of sight to the simulated values and observed values were basically consistent. For the T12 ascending orbit, the residual range was −0.12 to 0.1 m, with a root mean square (RMS) of 4.1 cm; for the T121 descending orbit, the residual range was −0.06 to 0.06 m, with an RMS of 2.4 cm, achieving a data model fit of 97.47%. Overall, the fitting effect of the two orbital datasets was extremely good, indicating that the inversion results of the fault geometry had a certain degree of reliability.

5. Regional Earthquake Hazard Assessment

The earthquake occurred at the collision boundary of the Indian Ocean Plate and the Eurasian Plate, an area with complex geological structures and a history of frequent seismic activity. To assess the impact on Dingri County, we assumed a friction coefficient of 0.4 [18,19], with the receiving fault striking at 189.2°, a dip angle of 40.6°, and a slip angle of −72.81° (these geometric parameters were obtained through inversion; see Table 1). Based on the crust 1.0 layered elastic half-space model and the co-seismic slip distribution obtained from SDM inversion, we used Coulomb 3.3 software [20] to calculate the Coulomb failure stress changes (CFS) corresponding to depths of 5 km, 7.5 km, 10 km, and 12.5 km [21]:
Δ CFS = Δ τ + μ Δ σ n
where ∆CFS represents the Coulomb stress change on the specific receiving fault; Δ τ indicates the change in shear stress along the direction of the fault slip; μ denotes the effective friction coefficient, which ranged from 0.2 to 0.8 [19]; and Δ σ n signifies the change in normal stress on the fault plane. A positive ∆CFS promotes fault rupture, while a negative value inhibits rupture occurrence. Figure 7 illustrates that the ∆CFS caused by the 2024 Dingri earthquake within four depth ranges was primarily divided into two directions: one was northeast–southwest, particularly where the Coulomb stress significantly increased (>0.03 MPa) at both ends of the fault and surrounding areas of the DMCF, enhancing the seismic hazard in this region. Simultaneously, as the depth changed, the range of increased Coulomb stress gradually expanded to the Shenzha–Dingjie fault (Hereinafter referred to as “SZDJF”) zone, significantly strengthening the stress on this fault and increasing its seismic hazard. The other direction was northwest–southeast, characterized by a reduction in Coulomb stress, especially where the NHF, Yarlung Zangbo River fault (hereinafter referred to as “YLZBF”), and the Tangyako–Dingri fault were in a state of stress release, thereby reducing the potential seismic hazard of these faults.

6. Discussion

The source model derived from InSAR co-seismic observation deformation data in this study was consistent with the results of seismological research, indicating the reliability of the source model presented herein. From the source model results, it can be observed that this earthquake occurred on the Deme Co normal fault, which is located just west of the SDF. This fault is a relatively shallow blind fault. The earthquake was primarily characterized by normal faulting, accompanied by a minor right–lateral strike–slip component. The lower boundary of the fault that generated the earthquake was projected to be less than 15 km from the branch fault of the SDF. The existing geological data show that the SDF crosses the east–west-trending YLZBF and the NHF from north to south, with different segment characteristics. The DMCF, relevant to this study, is situated in the extensional zone between the two east–west-trending faults of the NHF system, characterized by a westward dip, moderate dip angle (30~45°), and a nearly north–south orientation [8]. The NHF south of the Dingri earthquake has a nearly east–west orientation, a northward dip, and a low-angle normal slip characteristic [22], and it is farther from the DMCF than the SDF is from the fault that generated the earthquake. The “Y”-shaped structure consists of a main fault and secondary faults that share the same trend, with the main fault and secondary faults dipping in opposite directions, forming a “Y” shape in profile [23]. This structural type often results from the combined effects of extension and gravity, where secondary faults of a lower order are derived from the hanging wall of the main fault [24]. The fault that generated the Mw5.7 earthquake in Dingri in 2020 was confirmed to be a secondary fault within the SDF, together forming a “Y”-shaped structure in the extensional zone. The fault that generated the Mw7.1 earthquake in Dingri is located at the intersection of the “Y”-shaped structure, an area prone to stress concentration. Furthermore, the DMCF is the main boundary fault on the eastern edge of the Deng Me Cuo graben (one of the larger grabens in the southern segment of the Shenzha–Dingjie rift). The USGS earthquake catalog indicates that this fault has been active since the 2015 Nepal earthquake, with ten occurrences of earthquakes of a magnitude 5.0 or greater. Previous research results [25] have shown that the Mw7.9 earthquake on 25 April 2015 caused Coulomb stress loading on the north–south-trending SDF, while the east–west-trending NHF experienced a decrease in Coulomb stress. The potential for triggering large earthquakes in the southern Tibetan normal fault system [10,26]. Thus, the future seismic hazard potential in the Dingri area, where the SDF and the NHF intersect, requires close attention.

7. Conclusions

This paper utilizes ascending and descending track Sentinel-1A InSAR data to study the co-seismic deformation field, source model of the fault, and tectonic characteristics caused by the Mw7.1 earthquake in Dingri County, Tibet, on 7 January 2025, and draws the following conclusions:
Surface displacement primarily occurs within the epicentral area, with subsidence deformation significantly greater than uplift deformation. The maximum surface displacements in the ascending and descending line-of-sight (LOS) directions reach −1.6 m and −1.0 m, respectively.
The fault responsible for the earthquake is a shallow, concealed normal fault with a strike of 189.2°, a dip angle of 40.6°, and a westward dip. The slip mainly concentrates within a range of 1 to 10 km, with a maximum slip of 4.6 m. This study preliminarily infers that it is the north–south-trending DMFC, with the rupture extending to the surface, forming a surface rupture zone approximately 30 km long.
From the macroscopic distribution of ∆CFS changes, this earthquake caused a reduction in co-seismic Coulomb stress on both the northeast and southwest sides of the fault. The Coulomb stress significantly increased at the northeastern and southwestern ends of the rupture segment and surrounding areas, particularly where the DMCF experienced a large-scale Coulomb stress loading far exceeding the earthquake triggering threshold of 0.03 MPa. The calculation results indicated that the potential seismic hazard of the northern end of the NHF, the Dangreyongco–Dingri fault, and the YLZBF in the southern segment of the Dingri Mw7.1 earthquake rupture is reduced.
The DMCF is located at the “Y”-shaped structural intersection in the southern part of the SZDJF, an area prone to stress concentration. The potential seismic hazard in the Dingri region, where the SZDJF terminates and intersects with the NHF, still requires close attention.

Author Contributions

S.Y.: article writing and revision. S.Z.: participation in the decision making. J.L.: data analysis and visualization. Z.L.: validation. J.D.: data Processing and model analysis. All authors have read and agreed to the published version of the manuscript.

Funding

This research was supported by the National Natural Science Foundation of China (Grant No. 42271460), the Science for Earthquake Resilience of the China Earthquake Administration (Grant No. XH23019YC), the Joint Open Fund of the Mengcheng National Geophysical Observatory (Grant No. MENGO-202306), and the Open Fund of Wuhan, Gravitation and Solid Earth Tides, National Observation and Research Station (Grant No. WHYWZ202209).

Data Availability Statement

The data that support the findings of this study are available on request from the corresponding author.

Acknowledgments

The European Space Agency provided the Sentinel-1A data, and the China Earthquake Networks Center and the National Earthquake Science Data Center (http://data.earthquake.cn, accessed on 27 January 2025) provided data support. Some figures in this paper were created using GMT 6 software, and some scripts were provided by teachers from the Institute of Geology, China Earthquake Administration. The SDM 2013 software was provided by Wang Rongjiang from the German Research Centre for Geosciences. The reviewers’ comments were very helpful in revising this paper, and we would like to express our gratitude to them as well.

Conflicts of Interest

The authors declare that they have no known competing financial interest or personal relationships that could have appeared to influence the work reported in this paper.

References

  1. Global Major Earthquake Real-Time Response Team, Ground Motion Intensity Assessment Dataset for the M6.8 Dingri Earthquake in Xizang Province. 2025. Available online: https://data.earthquake.cn (accessed on 27 January 2025).
  2. Liu, Y.H.; Shan, X.J.; Zhang, Y.F.; Zhao, D.Z.; Qu, C.Y. Use of seismic waveforms and InSAR data for determination of the seismotectonics of the mainling Ms 6.9 earthquake on Nov.18, 2017. Seismol. Geol. 2018, 40, 1254–1275. (In Chinese) [Google Scholar]
  3. Bagnardi, M.; Hooper, A. Inversion of surface deformation data for rapid estimates of source parameters and uncertainties: A Bayesian approach. Geochem. Geopysicas Geosyst. 2018, 19, 2194–2211. [Google Scholar] [CrossRef]
  4. Moral, P.D.; Doucet, A.; Jasra, A. Sequential Monte Carlo samplers. J. R. Stat. Soc. 2006, 68, 411–436. [Google Scholar] [CrossRef]
  5. Vasyura-Bathke, H.; Dettmer, J.; Steinberg, A.; Heimann, S.; Jónsson, S. The Bayesian earthquake analysis tool. Seismol. Res. Lett. 2020, 91, 1003–1018. [Google Scholar] [CrossRef]
  6. Wang, R.J.; Diao, F.Q.; Hoechner, A. SDM—A geodetic inversion code incorporating with layered crust structure and curved fault geometry. Proc. EGU Gen. Assem. 2013, 15, 2411. [Google Scholar]
  7. Zhao, B. Relocating Catalogue of M6.8 Earthquake Sequence in Dingri, Xizang. Available online: https://data.earthquake.cn/datashare/report.shtml?PAGEID=datasourcelist&dt=ff80808294439adf019443c969ea0001 (accessed on 27 January 2025).
  8. Zhang, J.-j.; Lei, G.; Lin, D. Structural characteristrics of middle and southern Xainza-Dingye normal fault system and its relationship to Southern Tibetan detachment system. Chin. Sci. Bull. 2002, 47, 738–743. (In Chinese) [Google Scholar]
  9. Zhang, P.-z.; Wang, W.-t.; Gan, W.-j.; Zhang, Z.-q.; Zhang, H.-p.; Zheng, D.-w.; Zheng, W.-j.; Wang, Y.; Wang, Y.-j.; Xu, B.-b.; et al. Present-day deformation and geodynamic processes of the Tibetan Plateau. Acta Geol. Sincia 2022, 96, 3297–3313. [Google Scholar] [CrossRef]
  10. Huang, T.; Wu, Z.H.; Han, S.; Gao, Y.; Bai, W.G. The Basci Characteristics of Active Faults in the Region of Xigaze, Xizang and the Assessment of Potential Earthquake Disaster Risks. Prog. Earthq. Sci. 2024, 54, 696–711. (In Chinese) [Google Scholar]
  11. Wang, C.; Mouche, A.; Tandeo, P.; Stopa, J.E.; Longépé, N.; Erhard, G.; Foster, R.C.; Vandemark, D.; Chapron, B. A labelled ocean SAR imagery dataset of ten geophysical phenomena from Sentinel-1 wave mode. Geosci. Data J. 2019, 6, 105–115. [Google Scholar] [CrossRef]
  12. Farr, T.G.; Rosen, P.; Caro, E.; Crippen, R.; Duren, R.; Hensley, S.; Kobrick, M.; Paller, M.; Rodriguez, E.; Roth, L.; et al. The Shuttle Radar Topography Mission. Rev. Geophys. 2007, 45, 1–33. [Google Scholar] [CrossRef]
  13. Goldstein, R.M. Atmospheric limitations to repeat-track radar interferometry. Geophys. Res. Lett. 1995, 22, 2517–2520. [Google Scholar] [CrossRef]
  14. Werner, C.; Wegmuller, U.; Strozzi, T.; Wiesmann, A. Processing strategies for phase unwrapping for InSAR applications. In Proceedings of the European Conference on Synthetic Aperture Radar (EUSAR 2002), Cologne, Germany, 4–6 June 2002. [Google Scholar]
  15. Lohman, R.B.; Simons, M. Some thoughts on the use of InSAR data to constrain models of surface deformation: Noise structure and data downsampling. Geochem. Geophys. Geosystems 2005, 61, Q01007. [Google Scholar] [CrossRef]
  16. Steck, L.K.; Phillips, W.S.; Mackey, K.; Begnaud, M.L.; Stead, R.J.; Rowe, C.A. Seismic tomography of crustal P and S across Eurasia. Geophys. J. Int. 2009, 177, 81–92. [Google Scholar] [CrossRef]
  17. Fukuda, J.; Johnson, K.M. A fully Bayesian inversion for spatial distribution of fault slip with objective smoothing. Bull. Seismol. Soc. Am. 2008, 98, 1128–1146. [Google Scholar] [CrossRef]
  18. Toda, S.; Stein, R.S.; Richards, D.K.; Bozkurt, S. Forecasting the Evolution of Seismicity in Southern California: Animations Built on Earthquake Stress Transfer. J. Geophys. Res. Solid Earth 2005, 110, S21C-2. [Google Scholar] [CrossRef]
  19. Barbot, S.; Fialko, Y.; Bock, Y. Postseismic deformation due to the Mw 6.0 2004 Parkfield earthquake: Stress-driven creep on a fault with spatially variable rate-and-state friction parameters. J. Geophys. Res. 2009, 114, B07405. [Google Scholar] [CrossRef]
  20. Lin, J.; Stein, R.S. Stress triggering in thrust and subduction earthquakes and stress interaction between the southern San Andreas and nearby thrust and strike-slip faults. J. Geophys. Geophys. Res. Solid Earth 2004, 109, b02303. [Google Scholar] [CrossRef]
  21. Harris, R.A. Introduction to special section: Stress triggers, stress shadows, and implications for seismic hazard. J. Geophys. Res. Solid Earth 1998, 103, 24347–24358. [Google Scholar] [CrossRef]
  22. Liu, J.; Ji, C.; Zhang, J.; Zhang, P.; Zeng, L.; Li, Z.; Wang, W. Tectonic setting and general features of coseismic rupture of the 25 April 2015 Mw7.8 Gorkha, Nepal earthquake. Chin. Sci. Bull. 2015, 60, 2604–2655. (In Chinese) [Google Scholar]
  23. Zhu, Z.-C.; Song, H.-L. Tectonic Geology; China University of Geosciences Press: Wuhan, China, 1999. (In Chinese) [Google Scholar]
  24. Shi, Y.-Q.; Feng, X.-J.; Dai, W.-Q.; Ren, J.; Li, X.-N.; Han, H.-Y. Distribution and structural characteristics of the Xi’an section of the Weihe fault. Acta Seismol. Sin. 2008, 30, 634–647. (In Chinese) [Google Scholar] [CrossRef]
  25. Wei, X.; Tan, K.; Liu, G.; Qiao, X.-J.; Nie, Z.-S. Coseismic and postseismic coulomb stress changes on surrounding major faults caused by the 2015 Nepal Mw7.9 earthquake. Chin. J. Geophys. 2015, 58, 4305–4316. [Google Scholar]
  26. Zhang, X.; Zhang, Z.; Wang, J.; Wang, S.; Yang, X.; Zhuan, S.; Hou, D.; Zhang, Z.; Zhang, L.; Cheng, Z. Further discussion on the formation and evolution of the Yarlung Zangbo suture zone, Tibet. Geol. China 2019, 47, 944–970, (In Chinese with Engish abstract). [Google Scholar] [CrossRef]
Figure 2. InSAR co-seismic deformation field of the Mw7.1 earthquake in January 2024: (a) T12 ascending track interferogram; (b) T12 ascending track displacement field; (c) T121 descending track interferogram; (d) T121 descending track displacement field; (e) T48 descending track interferogram; (f) T48 descending track displacement field. The red and blue focal spheres represent the source mechanism solutions of the January earthquake determined by the USGS and GCMT, respectively. The black fault traces indicate the identified active fault systems in the study area. One color fringe represents a line-of-sight (LOS) displacement of 50 mm. The red line segment indicates profile AA’, with the profile measurement results shown in Figure 3. The red five-pointed star indicates the epicenter provided by the CEA. DMCF: Deng Me Cuo fault; NHF: North Himalayan fault; YLZBF: Yarlung Zangbo River fault; SZDJF: Shenzha–Dingjie fault; TDF: Tangyako–Dingri fault.
Remotesensing 17 00936 g002aRemotesensing 17 00936 g002b
Figure 3. Measurement results of co-seismic deformation profile of Mw7.1 Dingri earthquake in 2025. AA’ deformation field profile is shown in Figure 2b,d.
Remotesensing 17 00936 g003
Figure 4. Estimation of fault geometric parameters. The red line in the histogram and the red dots in the 2D correlation plot indicate the maximum a posteriori solution.
Remotesensing 17 00936 g004
Figure 5. Inversion model of co-seismic slip distribution based on InSAR data. (a) Three-dimensional co-seismic slip distribution model; (b) surface projection of co-seismic slip distribution. Blue arrows indicate the slip direction.
Remotesensing 17 00936 g005
Figure 6. Fit of the inversion data for fault slip distribution. (ac) correspond to the observed values, simulated values, and residuals of the ascending track InSAR data, respectively; (df) correspond to the observed values, simulated values, and residuals of the descending track InSAR data, respectively. The red rectangle is the fault plane projected on the surface; the black lines are active faults; DMCF: Deng Me Cuo fault; NHF: North Himalayan fault; SZDJF: Shenzha–Dingjie fault.
Remotesensing 17 00936 g006
Figure 7. Static ∆CFS in neighboring regions induced by the 2025 Dingri earthquake. (a) ∆CFS at a depth of 5 km underground. (b) ∆CFS at a depth of 7.5 km underground. (c) ∆CFS at a depth of 10 km underground. (d) ∆CFS at a depth of 5 km underground. The green dots the precise aftershock catalog of the Mw7.1 Dingri earthquake [7]; the black lines represent active faults. DMCF: Deng Me Cuo fault; NHF: North Himalayan fault; YLZBF: Yarlung Zangbo River fault; SZDJF: Shenzha–Dingjie Fault; TDF: Tangyako–Dingri Fault.
Remotesensing 17 00936 g007
Table 1. Source parameters of the 2025 Dingri Mw7.1 earthquake.
SourceLongitude/East (°)Latitude/
North (°)
D/kmNodal Plane I/(°)Nodal Plane II/(°)Earthquake Magnitude
StrikeDipRakeStrikeDipRake
GCMT87.36128.63910.034942−10318749−88Mw7.1
USGS87.4728.5612.035642−8817348−92Mw7.1
CEA87.4528.510.0356.2943.66−102.76184.3547.67−78.11Mw7.0
This study87.4828.625.0189.240.6−82.81///Mw7.1
Table 2. Differential interferometric image parameters of ascending and descending orbits.
Orbit Direction (Orbit Number)Imaging DatePolarization ModeAzimuth of Line of Sight α/(°)Incidence Angle of Line of Sight θ/(°)Spatial Baseline (m)Time Baseline (d)
Before EarthquakeAfter Earthquake
Asc (T12)5 January 202517 January 2025VV−12.5934.59−18.75812
Des (T121)1 January 202513 January 2025VV−167.3734.62−6.25412
Des (T48)27 December 20248 January 2025VV−167.3834.63−49.06712
Disclaimer/Publisher’s Note: The statements, opinions and data contained in all publications are solely those of the individual author(s) and contributor(s) and not of MDPI and/or the editor(s). MDPI and/or the editor(s) disclaim responsibility for any injury to people or property resulting from any ideas, methods, instructions or products referred to in the content.

