Article

Three-Dimensional Distribution of Arctic Aerosols Based on CALIOP Data

1
College of Oceanography and Ecological Science, Shanghai Ocean University, Shanghai 201306, China
2
Shanghai Key Laboratory of Polar Life and Environment Sciences (Shanghai Jiao Tong University), 1954 Huashan Road, Shanghai 200030, China
3
Key Laboratory of Polar Ecosystem and Climate Change (Shanghai Jiao Tong University), Ministry of Education, 1954 Huashan Road, Shanghai 200030, China
*
Author to whom correspondence should be addressed.
Remote Sens. 2025, 17(5), 903; https://doi.org/10.3390/rs17050903
Submission received: 14 January 2025 / Revised: 24 February 2025 / Accepted: 28 February 2025 / Published: 4 March 2025
(This article belongs to the Section Atmospheric Remote Sensing)

Abstract

:
Tropospheric aerosols play an important role in the notable warming phenomenon and climate change occurring in the Arctic. The accuracy of Cloud–Aerosol Lidar with Orthogonal Polarization (CALIOP) aerosol optical depth (AOD) and the distribution of Arctic AOD based on the CALIOP Level 2 aerosol products and the Aerosol Robotic Network (AERONET) AOD data during 2006–2021 were analyzed. The distributions, trends, and three-dimensional (3D) structures of the frequency of occurrences (FoOs) of different aerosol subtypes during 2006–2021 are also discussed. We found that the CALIOP AOD exhibited a high level of agreement with AERONET AOD, with a correlation coefficient of approximately 0.67 and an RMSE of less than 0.1. However, CALIOP usually underestimated AOD over the Arctic, especially in wet conditions during the late spring and early summer. Moreover, the Arctic AOD was typically higher in winter than in autumn, summer, and spring. Specifically, polluted dust (PD), dust, and clean marine (CM) were the dominant aerosol types in spring, autumn, and winter, while in summer, ES (elevated smoke) from frequent wildfires reached the highest FoOs. There were increasing trends in the FoOs of CM and dust, with decreasing trends in the FoOs of PD, PC (polluted continental), and DM (dusty marine) due to Arctic amplification. In general, the vertical distribution patterns of different aerosol types showed little seasonal variation, but their horizontal distribution patterns at various altitudes varied by season. Furthermore, locally sourced aerosols such as dust in Greenland, PD in eastern Siberia, and ES in middle Siberia can spread to surrounding areas and accumulate further north, affecting a broader region in the Arctic.

1. Introduction

Due to global warming, the Arctic is currently warming faster than other regions [1,2]. This phenomenon is referred to as Arctic amplification. The Arctic has warmed at a rate of approximately 1.2 °C per decade at its peak [1,2,3,4]. In addition, Arctic climate change has important impacts on extreme weather events around the globe. Specifically, heavy rainfall [5], extreme heatwaves [6], and cold waves [7,8] in the Northern Hemisphere are closely linked to the phenomenon of abnormal warming in the Arctic. There are many processes that drive Arctic amplification, including the heat and moisture transport from middle and low latitudes [2], sea ice–albedo feedback [4,9,10], water vapor radiation [11], and atmospheric and oceanic heat transport [12,13]. Moreover, the radiative forcing of tropospheric aerosols is a key driving factor of Arctic warming [14,15,16,17,18]. By influencing atmospheric transport patterns and cloud formation, aerosols play a significant role in climate change in the Arctic. As a result, further investigation of the spatiotemporal distribution and variability of the Arctic aerosols is essential to improve our understanding of Arctic amplification.
Aerosols are usually tiny (2 nm–10 μm) particles suspended in the atmosphere that originate from both human activities and natural resources [19]. Aerosols affect the climate in both direct and indirect ways. The direct effect is caused by the interactions between aerosols and solar radiation [20,21], while the indirect effect is related to aerosols’ impacts on cloud properties [22]. Additionally, the so-called semi-direct aerosol effect induces an increase in atmospheric heating and thus a decrease in cloud cover, due to the absorption of solar radiation by black carbon (BC) aerosols [23,24]. Thus, aerosols can influence the heat budget and cloud microphysical characteristics by absorbing and scattering radiation [18,25]. These effects on radiation are more prominent over the Arctic due to the high surface albedo of snow and ice [26].
Long-term vertical and horizontal aerosol observations are crucial for a comprehensive understanding of aerosol characteristics in the Arctic. Aircraft and sounding balloons are usually used to monitor the sources, physicochemical properties, and vertical structures of aerosols, but their use is limited to specific periods and altitudes [27,28]. Solar photometers from the Aerosol Robotic Network (AERONET) can also detect several aerosol properties, such as the Ångstrom index, single-scattering albedo, and aerosol optical depth (AOD). The AERONET also includes long-term data records for numerous monitoring sites around the world. However, AERONET has limitations in terms of continuous observation and comprehensive vertical distribution [29]. Satellite remote sensing, with its extensive coverage, high spatial and temporal resolution, and continuous observation capability, is preferred for detecting aerosols at present. Several satellite sensors, such as the Moderate-Resolution Imaging Spectroradiometer (MODIS) [30,31], the Advanced Along-Track Scanning Radiometer (AATSR) [32], the Medium-Resolution Imaging Spectrometer (MERIS) [33], the Ozone-Monitoring Instrument (OMI) [34], the Multi-angle Imaging Spectro-Radiometer (MISR) [35], and the Visible-Infrared Imaging Radiometer Suite (VIIRS) [36], can monitor the horizontal distribution of AOD over the Arctic. However, these instruments do not provide measurements of the vertical distribution of aerosols, which is also important for the atmospheric radiation balance and the formation of clouds and precipitation [37,38].
Cloud–Aerosol Lidar and Infrared Pathfinder Satellite Observation (CALIPSO) combines active lidar instruments with passive infrared sensors and visible imagers, which can observe the 3D distribution and optical properties of aerosols at unprecedented vertical resolutions [39,40,41]. Currently, CALIPSO is the only satellite able to provide continuous observations of aerosols at a near-global scale and at high resolution. Moreover, the Cloud–Aerosol Lidar with Orthogonal Polarization (CALIOP) onboard CALIPSO enables it to overlook the effects of highly reflective surfaces and identify aerosol types vertically [42]. CALIPSO has been widely used to examine the spatial distribution of aerosols [43], as well as to identify aerosol types and explore seasonal variation characteristics [44] in the Arctic. The reliability of CALIOP products has been extensively validated [45,46]. Specifically, Zhao et al. [47] conducted a comparative analysis of CALIOP AOD products in Asia with AERONET AOD data, while Liu et al. [48] performed a comprehensive comparison of AOD data from MODIS, CALIOP, and AERONET to evaluate CALIOP’s performance in China. Previous studies have consistently confirmed CALIOP’s capability to accurately retrieve AOD measurements across Asia. Furthermore, Mielonen et al. [49], utilizing AERONET data, demonstrated that CALIOP’s aerosol classification accuracy was within 70% of their selected spatiotemporal range. Chen et al. [50] validated the reliability of CALIOP’s typing algorithm through in situ chemical analysis over Harbin. However, our understanding remains limited regarding both CALIOP’s AOD retrieval performance and aerosol classification capabilities in the Arctic region. The vertical distribution of aerosols can influence precipitation patterns, changes in surface temperature, and available atmospheric energy [40]. Additionally, the three-dimensional structure of aerosols is crucial to cloud formation due to their frequent mixing with cloud layers [51], which has significant impacts on climate change [52] and sea ice formation [53] in the Arctic region. Therefore, we also need to conduct detailed and comprehensive research for the vertical structure of aerosols in the Arctic.
In this study, the accuracy and distribution of CALIOP AOD in the Arctic (60°N~82°N) were analyzed, and the distribution and 3D structure of different aerosol subtypes in the Arctic was also determined. In Section 2, the data and methodology used in this study are described in detail. Section 3.1 is devoted to evaluating the accuracy of CALIOP AOD data in different seasons compared with that of AERONET AOD data, as well as presenting the distribution of Arctic AOD data from CALIOP observations. In Section 3.2, the proportions and trends of different aerosol types in 2006–2020 and their distribution are discussed. The 3D structure of FoOs of important aerosol types in different areas was also investigated. Finally, the conclusions from this paper are summarized in Section 4.

2. Materials and Methods

2.1. Data Sources

The CALIPSO satellite was launched in April 2006 and collected data at an orbital altitude of 705 km with a 16-day repeat period. As mentioned before, CALIOP is an active lidar instrument onboard CALIPSO with two detection wavelengths (532 nm and 1064 nm). The scene classification algorithm of CALIOP can classify features such as clouds or aerosols using the depolarization ratio, integrated attenuated backscatter coefficient, surface type, and information on whether the layer is elevated or not [54]. It can provide both the physical and optical properties of aerosols, together with the vertical structure of clouds and aerosols [39,40]. As an active remote sensing sensor, CALIOP detects aerosols with less impact on the highly reflective Arctic surface and clouds during both the daytime and nighttime [55]. Although there may be errors within CALIOP’s daytime measurements due to the interference of sunlight, we used the daytime dataset due to the occurrence of polar days during the summer. In this study, we used the CALIOP Level 2 aerosol products to obtain AOD and determine aerosol classifications over the Arctic during 2006–2021. Due to the updated CALIOP data product versions, we used the CALIOP data from V4-20 and V4-21 versions before and after August 2020, respectively. The CALIOP data products were downloaded from the Atmospheric Science Data Center (https://asdc.larc.nasa.gov/project/CALIPSO, accessed on 22 September 2023). Considering the coverage of CALIOP observations between 82°N and 82°S due to the orbit inclination of CALIPSO, we narrowed the region of interest to 60°N~82°N.
The AERONET can provide accurate ground-based AOD measurements at 15 min intervals, with an uncertainty level of about 0.01 [56]. Its headquarters are in NASA Goddard Space Flight Center. The AERONET version 3 (V3) data were published in January 2018, with three data quality levels: Level 1.0 (unscreened), Level 1.5 (cloud-screened and quality-controlled), and Level 2.0 (quality-assured) [57]. The AERONET Level 2.0 AOD data during 2006–2021 were used in this study to evaluate the accuracy of CALIOP AOD over the Arctic, which can be obtained from the Goddard Space Flight Center (https://aeronet.gsfc.nasa.gov/, 22 September 2023). As a result, a total of 21 AERONET sites over the Arctic (see Figure 1) were used for further analysis.

2.2. Methodology

Given that CALIOP AOD measurements are available at 532 nm, while the AERONET provides AOD measurements at 340, 380, 440, 500, 670, 870, and 1020 nm, we needed to interpolate the AERONET AOD measurements to 532 nm for further comparison. In this study, the AERONET AOD measurements at 440, 500, and 675 nm were selected to interpolate the AOD at 532 nm. The second-order polynomial was used during the AERONET AOD interpolation [58], which can be expressed by
l n τ θ = 0 + 1 l n λ + 2 ( l n λ ) 2
where τ θ represents the AOD at the λ channel and i (i = 0, 1, 2) are unknown coefficients. i can be estimated using least-squares curve fitting [59]. Based on the known AOD values at the 440, 500, and 675 nm channels for each AERONET station, we could calculate the three distinct coefficients i for each station.
We performed spatiotemporal matching of the AOD data from CALIOP and AERONET to validate the accuracy of CALIOP AOD with the interpolated AERONET AOD. First, we calculated the daily average AOD for both CALIOP and AERONET. Then, centering on the AERONET site, we calculated the average CALIOP AOD within a 0.5° latitude and longitude grid to match this with the AERONET AOD. According to Redemann et al. [60], we used the information of ‘Feature Optical Depth 532 Uncertainty’, ‘Feature Classification Flags’, ‘CAD Score’, and ‘Extinction QC 532’ of SDS included with the data to control data quality. To be specific, we only selected data that met the criteria described in Table 1 to remove the effects of clouds.
Additionally, the performance of CALIOP AOD was assessed by calculating the correlation coefficient (R), root mean square error (RMSE), and relative mean bias (RMB), which are defined as
R = i = 1 n A O D s a t e l l i t e i A O D s a t e l l i t e ¯ A O D A E R O N E T i A O D A E R O N E T ¯ i = 1 n A O D s a t e l l i t e i A O D s a t e l l i t e ¯ 2 i = 1 n A O D A E R O N E T i A O D A E R O N E T ¯ 2
R M S E = 1 n i = 1 n ( A O D s a t e l l i t e i A O D ( A E R O N E T ) i ) 2
R M B = A O D ¯ s a t e l l i t e A O D ¯ A E R O N E T
Moreover, the aerosols were divided into seven types in the CALIOP data: clean marine (CM), dust, polluted dust (PD), polluted continental/smoke (PC), clean continental/background (CC), elevated smoke (ES), and dusty marine (DM). The vertical distribution characteristics of aerosol types are stored in the binary 16-bit mask of the variable ‘Feature Classification Flags’ in the CALIOP data [42]. To obtain a more comprehensive depiction of the 3D characteristics of Arctic aerosols, we calculated the frequency of occurrences (FoOs) for the above aerosol types classified by CALIOP, which is defined as
F o O s = n a e r o s o l n t o t a l
where n a e r o s o l represents the number of samples identified by CALIOP for a particular aerosol type within the specified altitude range, and n t o t a l represents the total number of samples within the specified altitude range.
In this study, the Mann–Kendall (MK) test [61,62] was also used to analyze the trend of aerosols over a 16-year period. The non-parametric Mann–Kendall test [63,64] is a distribution-free test, and it has been widely applied in monotonic trend detection in time series. This method is suitable for analyzing change trends with non-normal distribution properties [65,66]. The standardized MK test statistic ( Z ) follows the standard normal distribution ( μ = 0 ,   σ 2 = 1 ) and can be given as
Z = S 1 V a r ( S ) 0 S + 1 V a r ( S ) S > 0 S = 0 S < 0
V a r S = n n 1 2 n + 5 18
S = i = 2 n j = 1 i 1 s g n A i A j
s g n A i A j = 1 0 1 A i A j > 0 A i A j = 0 A i A j < 0
where V a r S is the variance and S is the Kendall sum statistic. In addition, sgn (…) in Equation (9) shows the symbol of ( A i A j ), where A i and A j are values at time instances i and j, from the time series { A 1 , A 2 , …, A j , …, A k , …, A n } containing n observations. The sign of the statistic Z corresponds to the direction of the trend (upward or downward), while Z indicates the significance level [67]. The trend is considered insignificant if Z is less than the confidence levels, such as α = 20 % ( Z 1.282 , low confidence level), α = 10 % ( Z 1.645 , moderate confidence level), or α = 5 % ( Z 1.96 , high confidence level). The statistic U F k is defined as
U F k = x k x k ¯ V a r ( x k ) , ( k = 1,2 , 3 , , n )
where U F 1 = 0 , x k is the number of pairs where x i < x j ( i < j ) in the series, which records the number of times the previous data point is smaller than the subsequent data point in each pair, and x k ¯ and V a r ( x k ) are the average value and variance of x k , respectively. Then, U B k is calculated by repeating the process above in the order of the reverse time series, which gives U B k = U F k   ( U B 1 = 0 ) [68]. The value of U F reflects the direction of the trend in the time series. The trend is significant at the 95% confidence level when the U F exceeds 1.96. If the U F and U B curves intersect at a point, and that point lies within the significance level range, then it corresponds to the beginning of a trend mutation.

3. Results and Discussion

3.1. Distribution of Arctic AOD from CALIOP Observations

3.1.1. Validation of CALIOP AOD

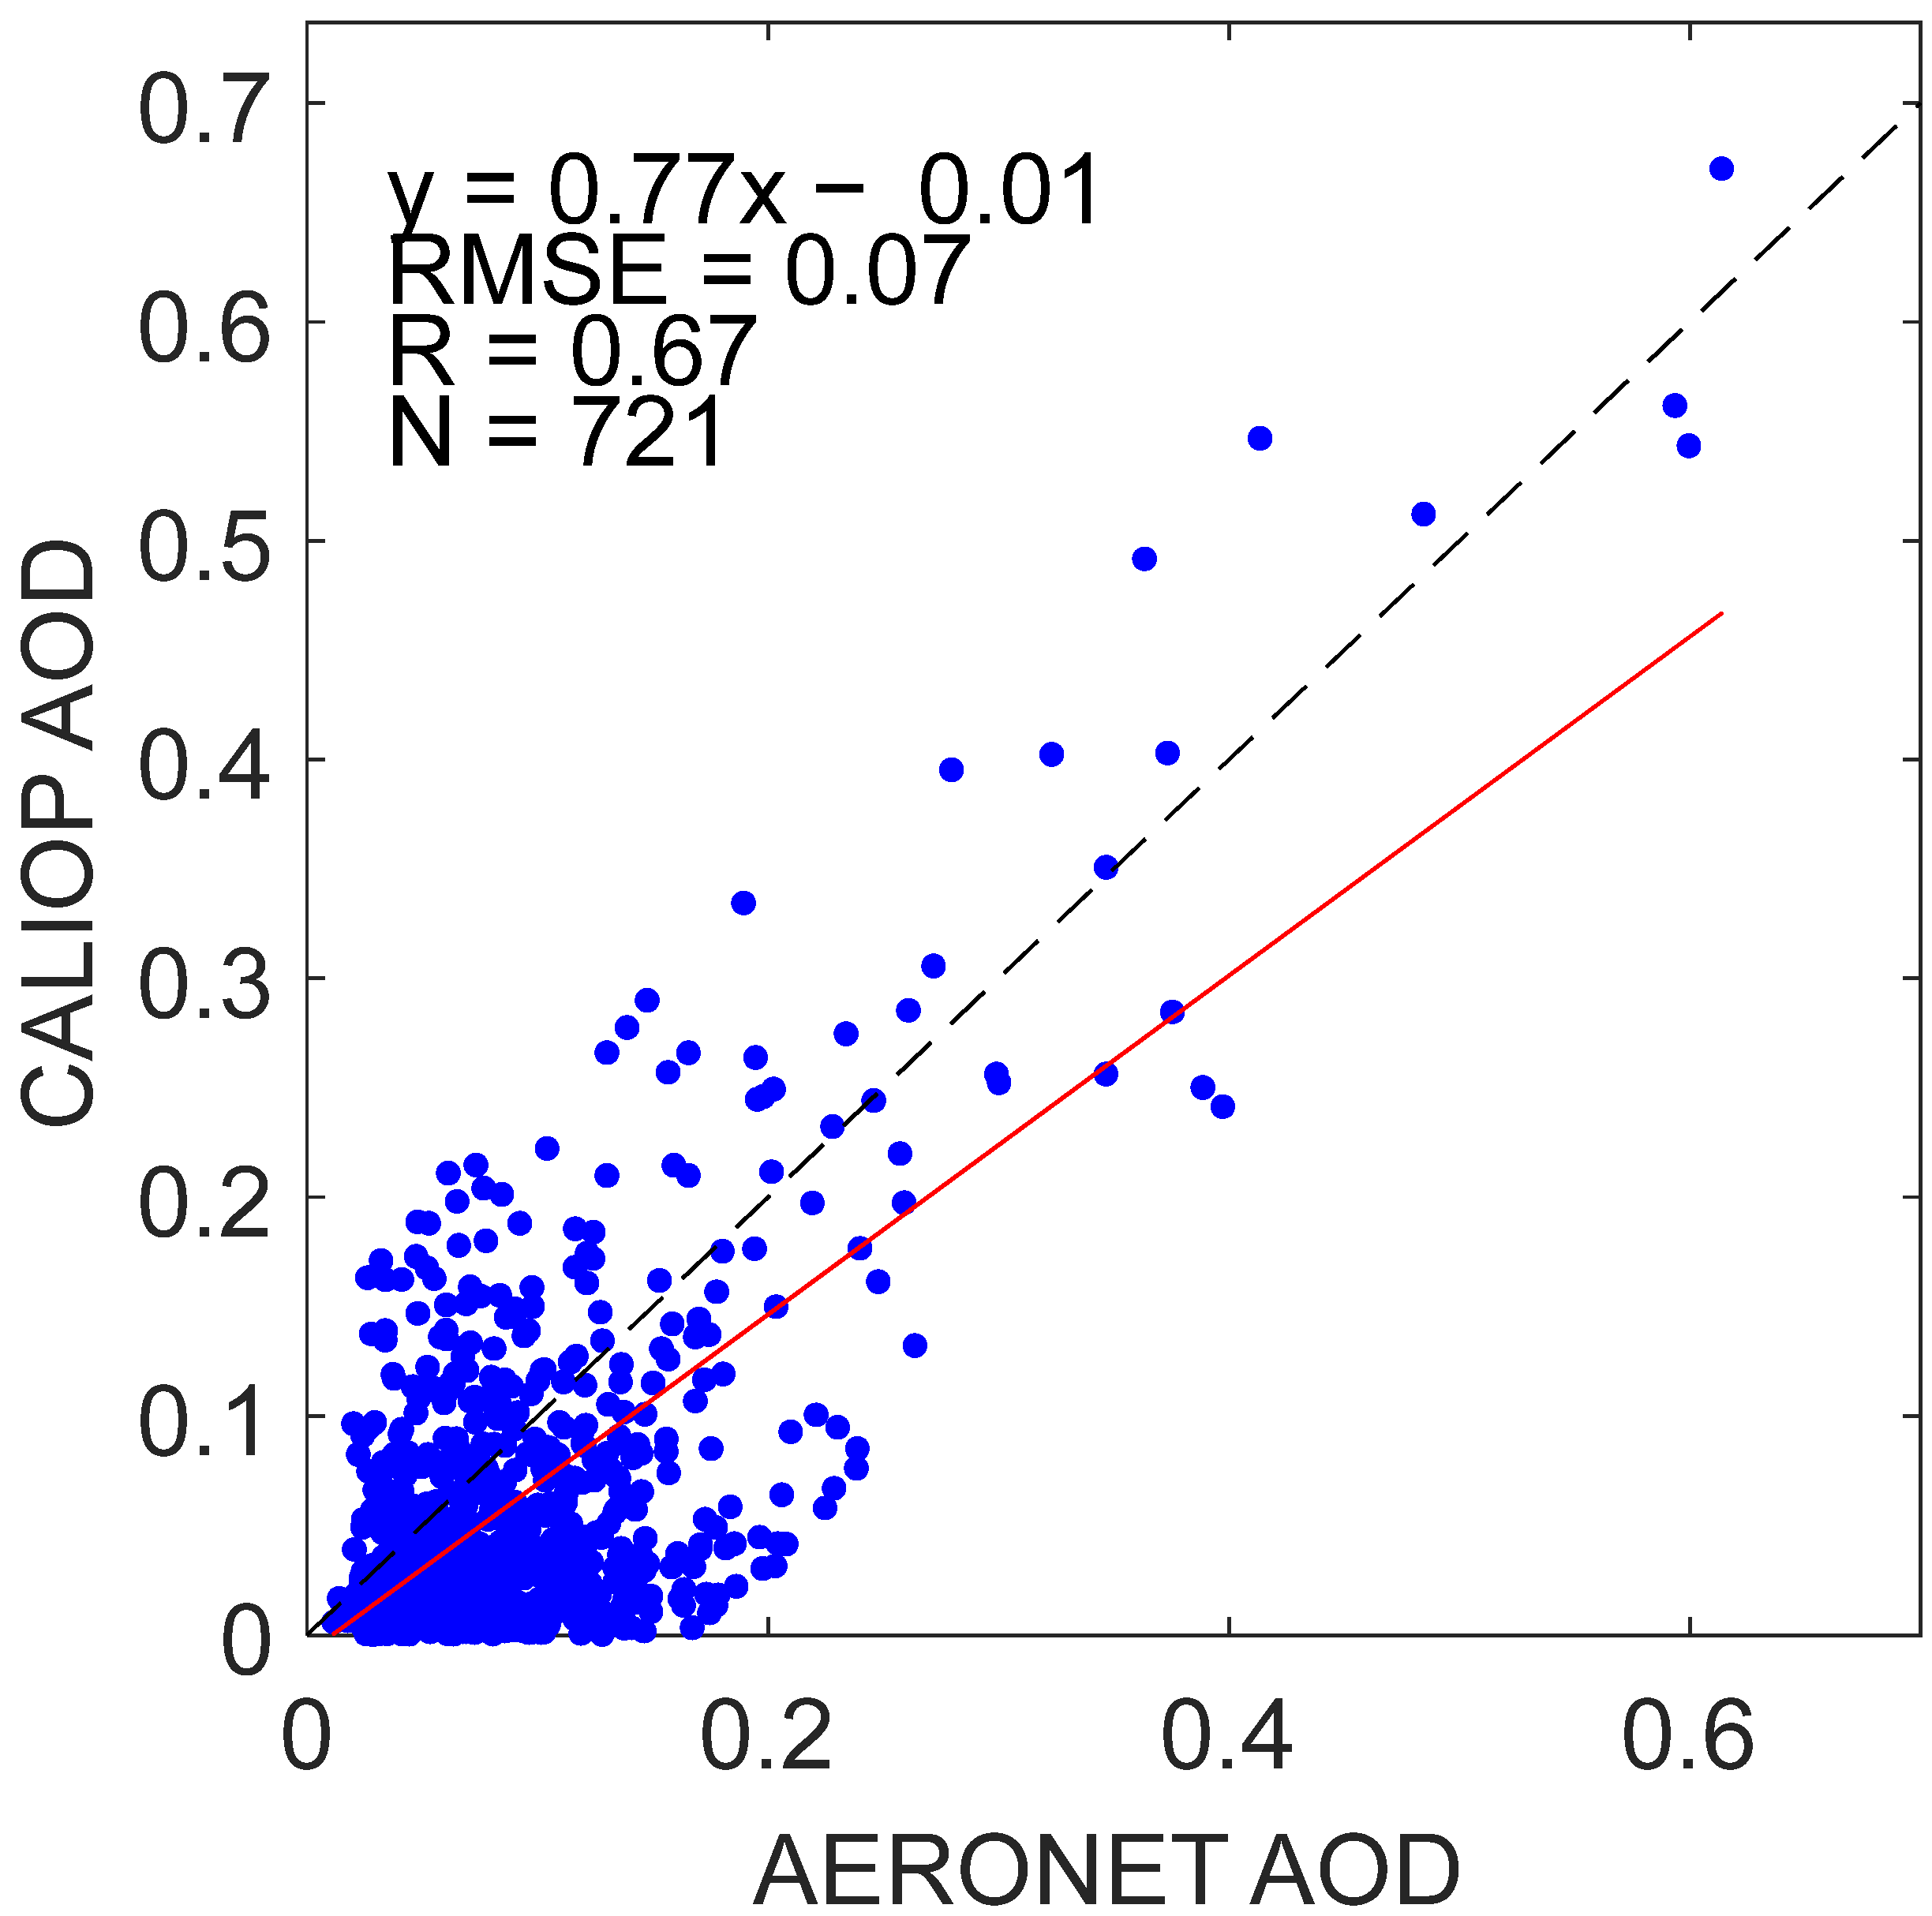
Figure 2 illustrates the comparison of the Arctic AOD from CALIOP and AERONET measurements during 2006–2021. In general, the relationship between CALIOP and AERONET exhibited a strong correlation, with a correlation coefficient of approximately 0.67 and an RMSE of less than 0.1. The linear regression analysis revealed a slope of 0.775 and an intercept of −0.009, indicating that CALIOP AOD appears to be underestimated over the Arctic. This underestimation can be linked to some tenuous layers with low signal-to-noise ratios being omitted in CALIOP observations during the daytime. While the AOD values for these layers were individually small, their cumulative integrated AOD was substantial [69]. Additionally, since the uncertainty of CALIOP AOD varies significantly depending on factors such as aerosol types and surface conditions, employing alternative models might provide a more robust evaluation of CALIOP’s capability in retrieving AOD.
Table 2 shows statistical metrics at each AERONET site, including the correlation coefficients, RMSE, and RMB between the CALIOP and AERONET AOD over the Arctic. Generally, CALIOP AOD showed strong agreement with the AERONET AOD at 86% of sites, with a correlation coefficient of greater than 0.5. However, the correlation coefficients were relatively lower at Yakutsk (0.42), NEON DEJU (0.16), and ARM Oliktok AK (0.25). This is due to the high altitude of these sites and the complex terrain and meteorological conditions, which result in a lower accuracy of CALIOP AOD retrievals [47,48]. The RMSE of CALIOP compared with that of AERONET AOD was smaller than 0.1 at all AERONET sites except Yakutsk, revealing an accurate representation of CALIOP AOD over the Arctic. The RMB at most sites was less than 1 due to the typical underestimation of CALIOP AOD. The underestimation was particularly pronounced at Tiksi, which had an RMB of 0.34. However, the RMB was greater than 1 at about 28% of sites, indicating the overestimation of CALIOP AOD at these sites. This overestimation may be attributed to the aerosol classification method employed by CALIOP, which relies on the surface type and fails to accurately classify marine aerosols transported from the ocean to the land [70].
Figure 3 presents the variability of mean AOD from CALIOP and AERONET, the mean correlation coefficient between CALIOP and AERONET AOD, and the mean RMSE and RMB of CALIOP AOD in each month at all sites. Note that the AERONET observations were not available during the Arctic polar night, and therefore we discuss the monthly results from March to October only. The mean CALIOP and AERONET AOD displayed similar monthly patterns; however, remarkable underestimation of CALIOP AOD was also observed. This is still attributed to the failure of CALIOP in detecting some aerosol layers during the daytime [71]. This is also consistent with the analysis in Figure 2 and Table 1. The correlation coefficient was greater than 0.55 in each month. The RMSE of CALIOP AOD was typically lower than 0.1 in all months, with a maximum of about 0.095 in August. This could be due to the interference from sunlight scattering during the polar day period [41]. It is also clear from Figure 3 that the RMB is lower than 1 in all months, further confirming the underestimation of CALIOP AOD over the Arctic. It is noteworthy that the RMB is relatively low from April to July. This indicates that CALIOP’s ability to retrieve AOD is poorer under humid conditions compared to dry conditions.

3.1.2. Seasonal AOD Distribution of the Arctic

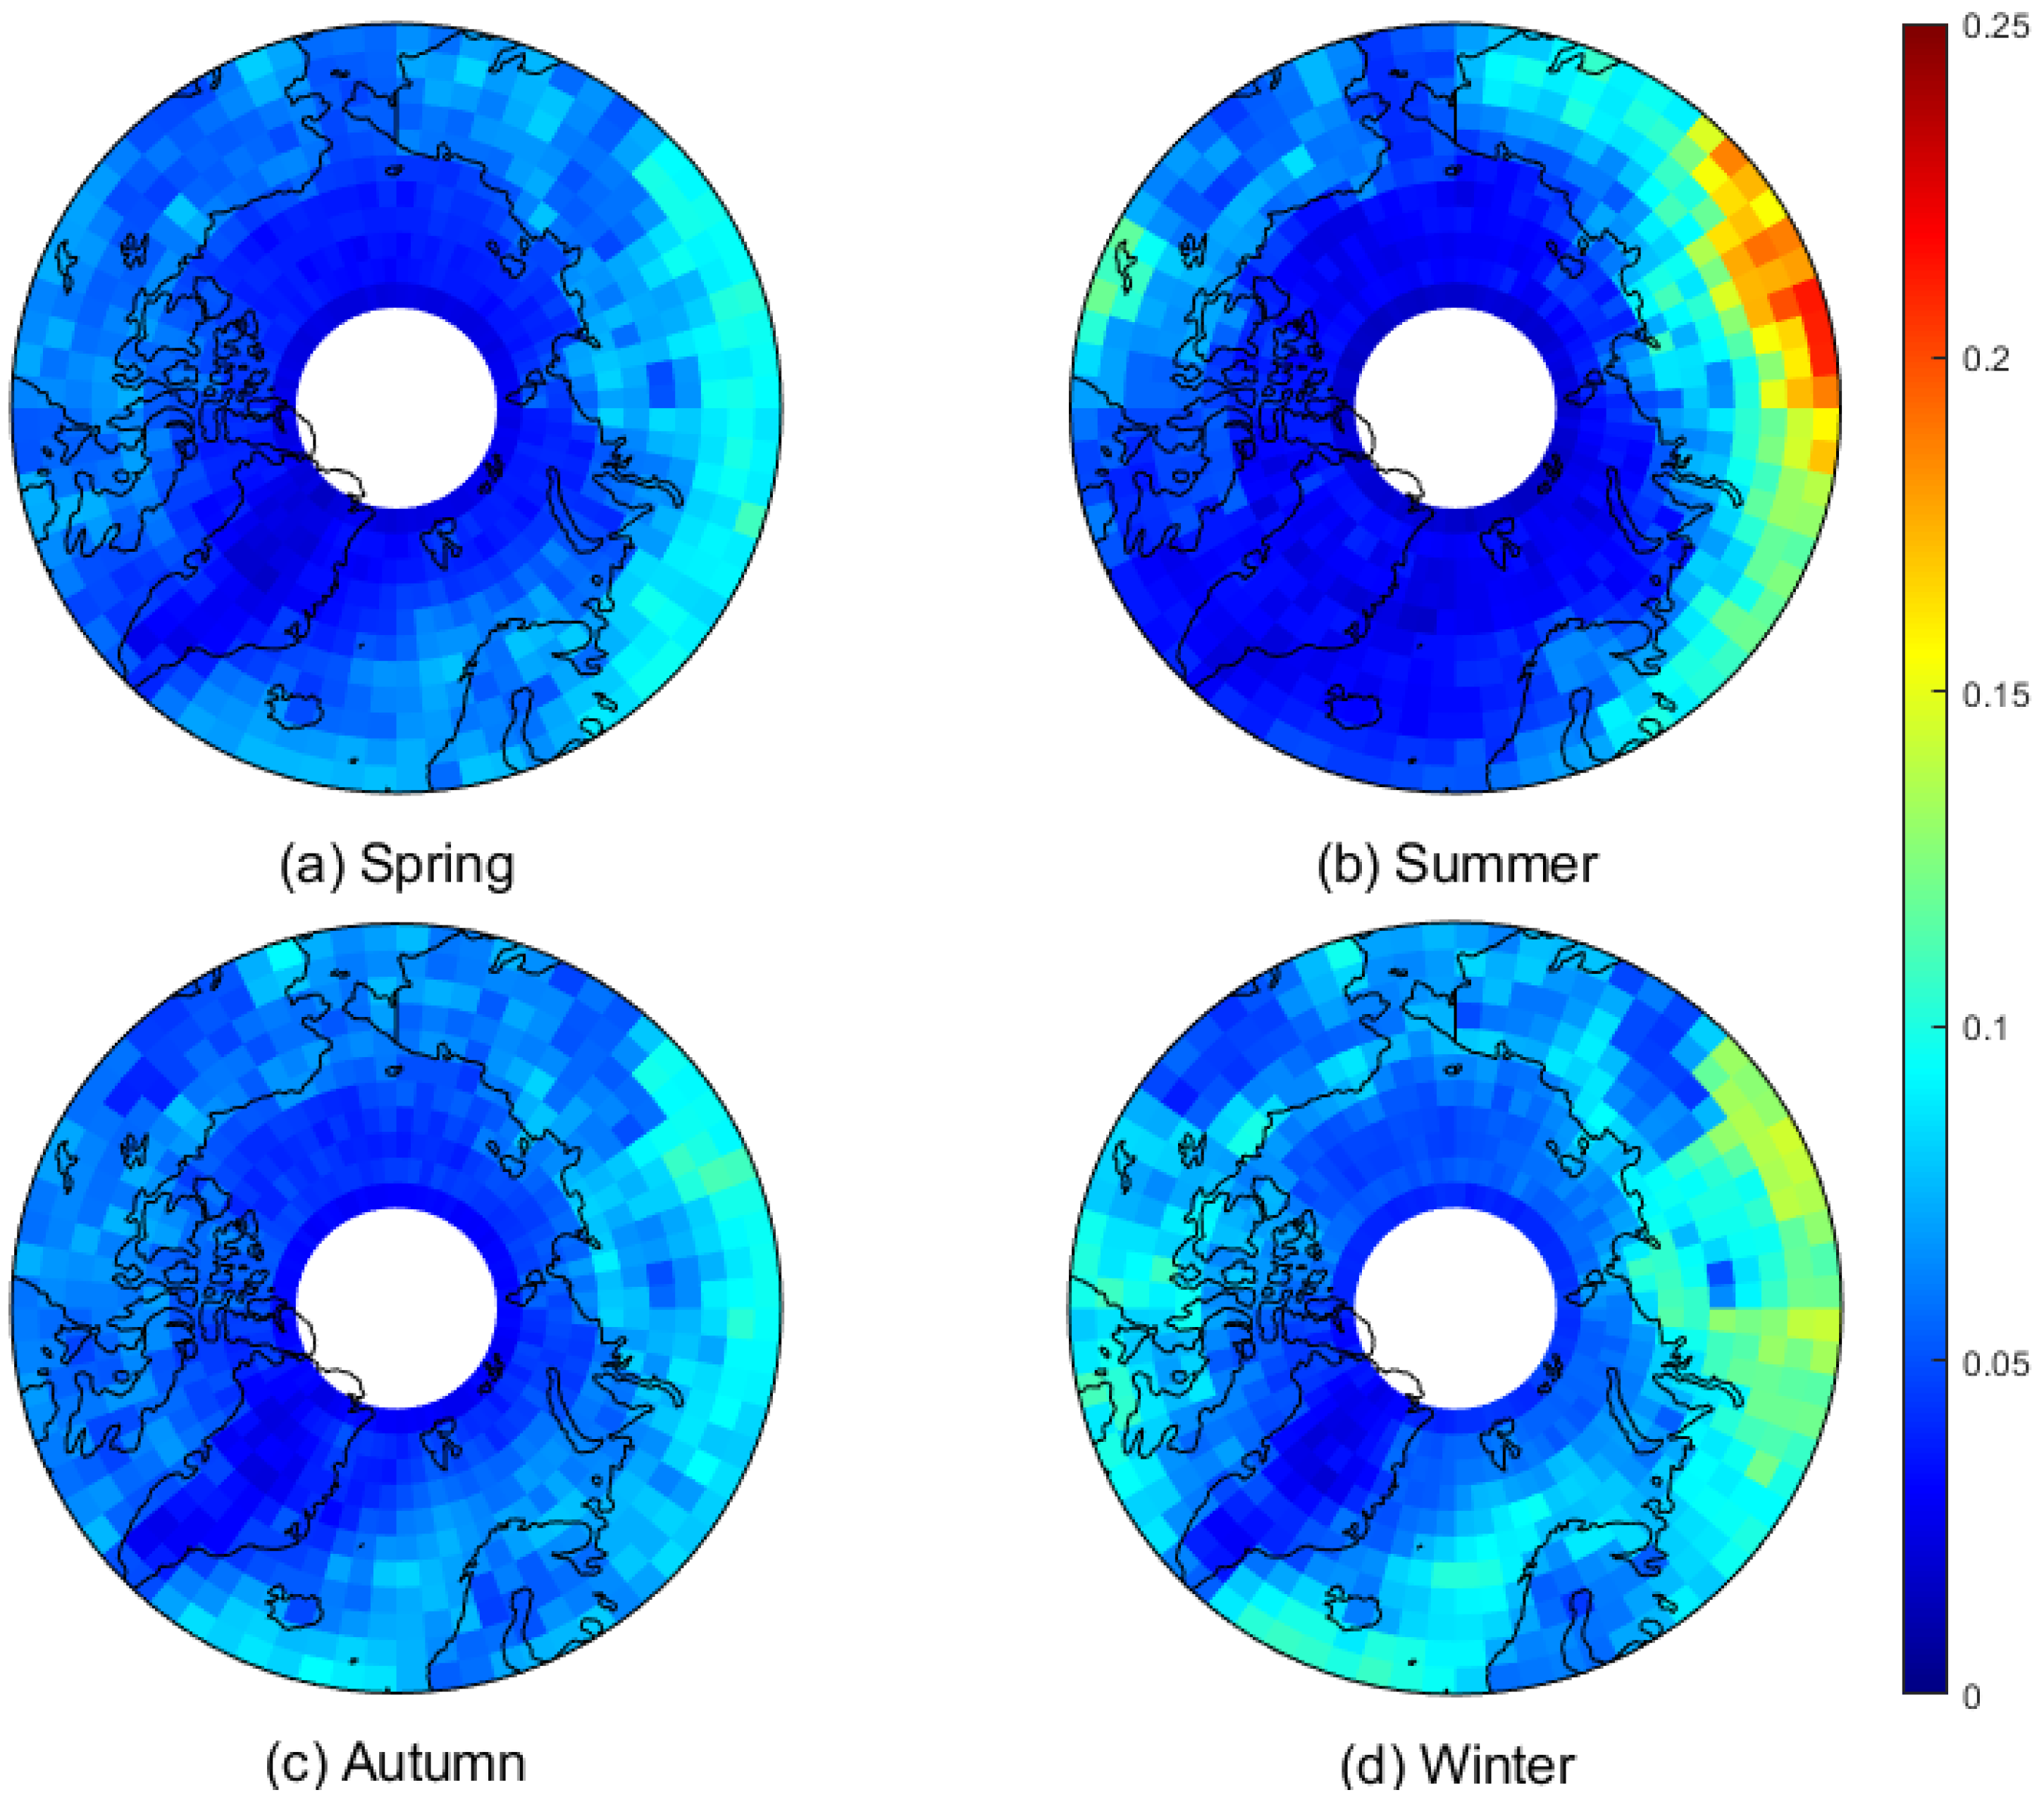
Figure 4 shows the spatial distributions of seasonal mean AOD in CALIOP observations over the Arctic during 2006–2021. Generally, the AOD was higher over land than the ocean, and it decreased as the latitude increased over the Arctic in all seasons. This is because there are more emission sources on land than at sea. One of the most distinctive features observed over land was the remarkable aerosol loading in northern Siberia in each season, which may be linked to the frequent wildfires [72] and severe industrial emissions in this area. The aerosol loading in northern Siberia was most pronounced in summer (June–August), with a maximum AOD of approximately 0.21. This could be a result of the frequent forest fires in Siberia in summer, leading to an increased load of pollutants [73]. In addition, the AOD over Greenland, northern Alaska, and eastern Siberia was consistently low in all seasons. The Arctic aerosol loading was also greater at lower latitudes than higher latitudes in all seasons, which may be due to the differences in mid-latitude transport [74]. Typically, the average AOD was highest in winter (0.068, December–February), followed by spring (0.059, March–May), autumn (0.056, September–November), and summer (0.052). The fact that the highest aerosol loading occurs in winter is due to the infrequent precipitation in these months; precipitation is an important mechanism for removing pollutants during the Arctic winter [75]. Moreover, pollutant transport from Europe, North America, and northern Siberia due to the winter planetary circulation patterns in the Northern Hemisphere also contribute to the high AOD over the Arctic during winter [76].

3.2. Characteristics of Different Aerosol Types over the Arctic

3.2.1. Proportions and Trends of Different Aerosol Types in 2006–2021

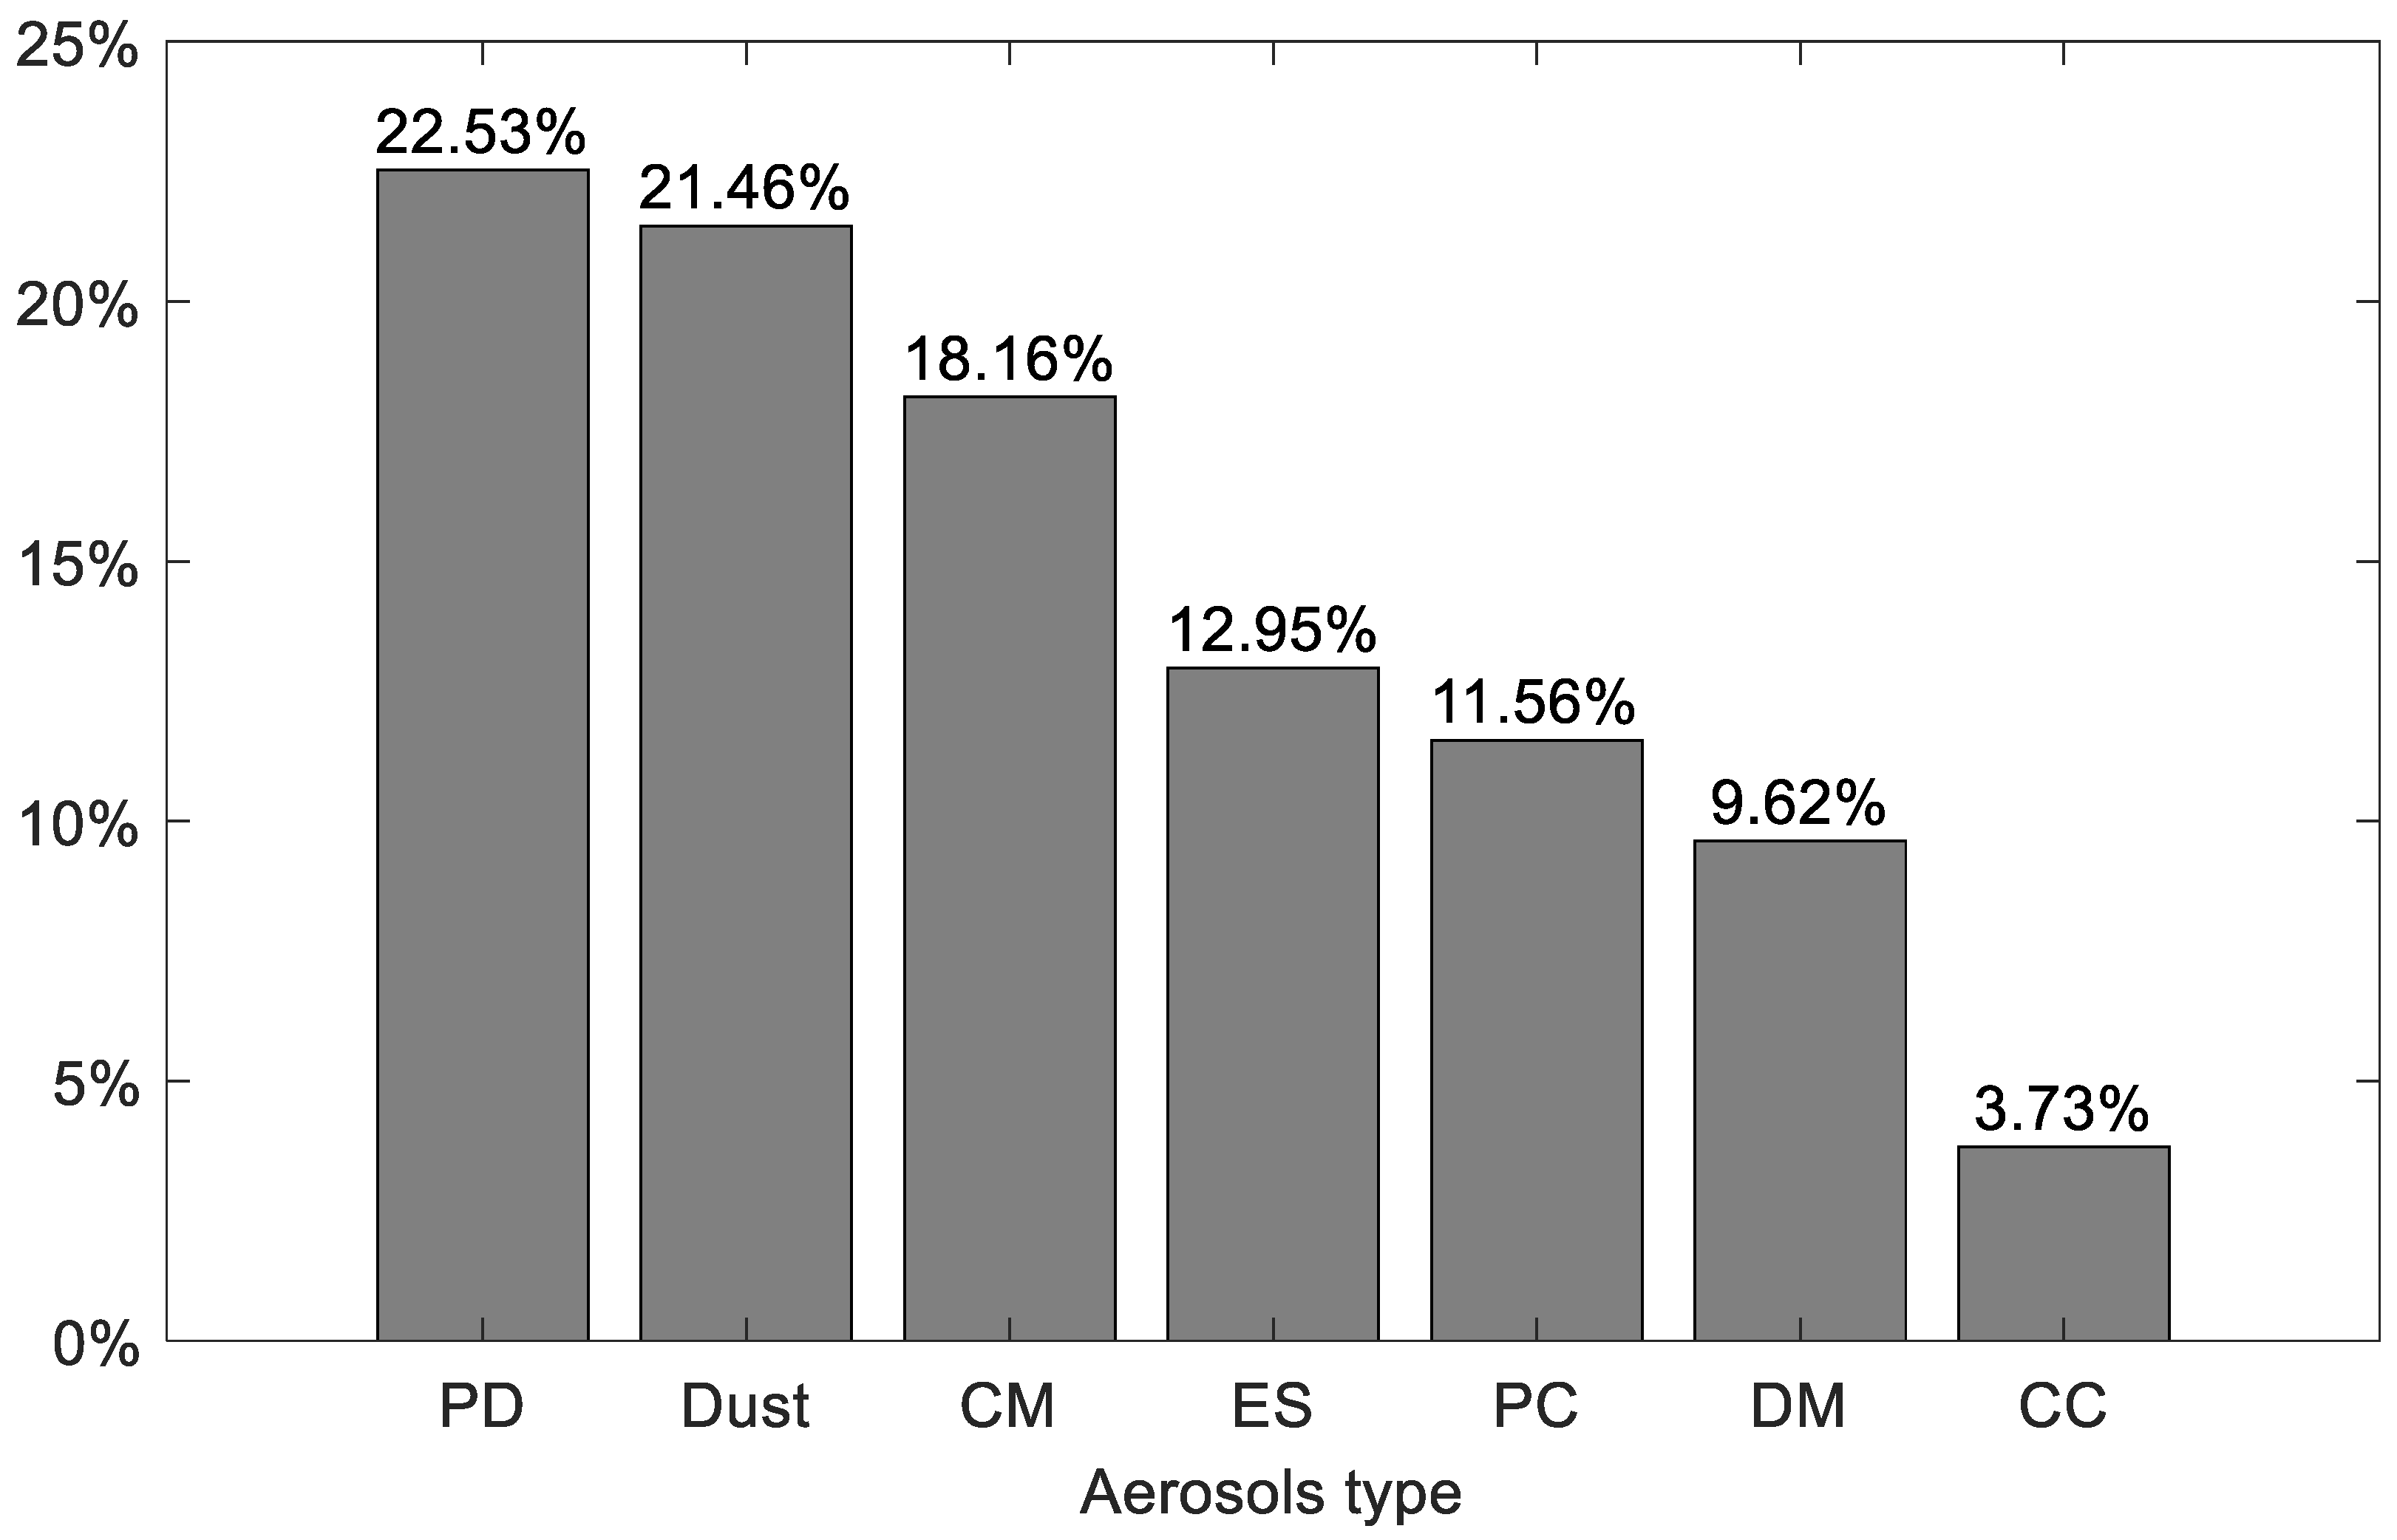
In Figure 5, the mean proportions of CM, dust, PC, CC, PD, ES, and DM over the Arctic during 2006–2021 are shown. We can see that PD, dust, and CM dominated the aerosol composition over the Arctic, while CC represented the smallest proportion (less than 5%) over the Arctic. While local Arctic emissions are a contributing source of dust and PD [77], dust concentration over the Arctic is more significantly influenced by Asian and African dust [78]. In contrast, unlike dust and PD, which came from multiple sources, CM mainly originated from the Arctic Ocean due to the release of sea salt and biogenic aerosols during sea ice melting [79]. Additionally, ES, PC, and DM moderately contribute to the total aerosols over the Arctic, with all having a proportion of about 10%. However, the ES, PC, and DM over the Arctic come from different sources. ES is mainly composed of carbonaceous aerosols due to biomass burning emissions [80,81], PC originates from local pollution sources [81,82], and DM is a mixture of dust and CM [81]. As a result, besides the long-distance transport from lower latitudes, local sources also significantly contribute to Arctic aerosol formation.
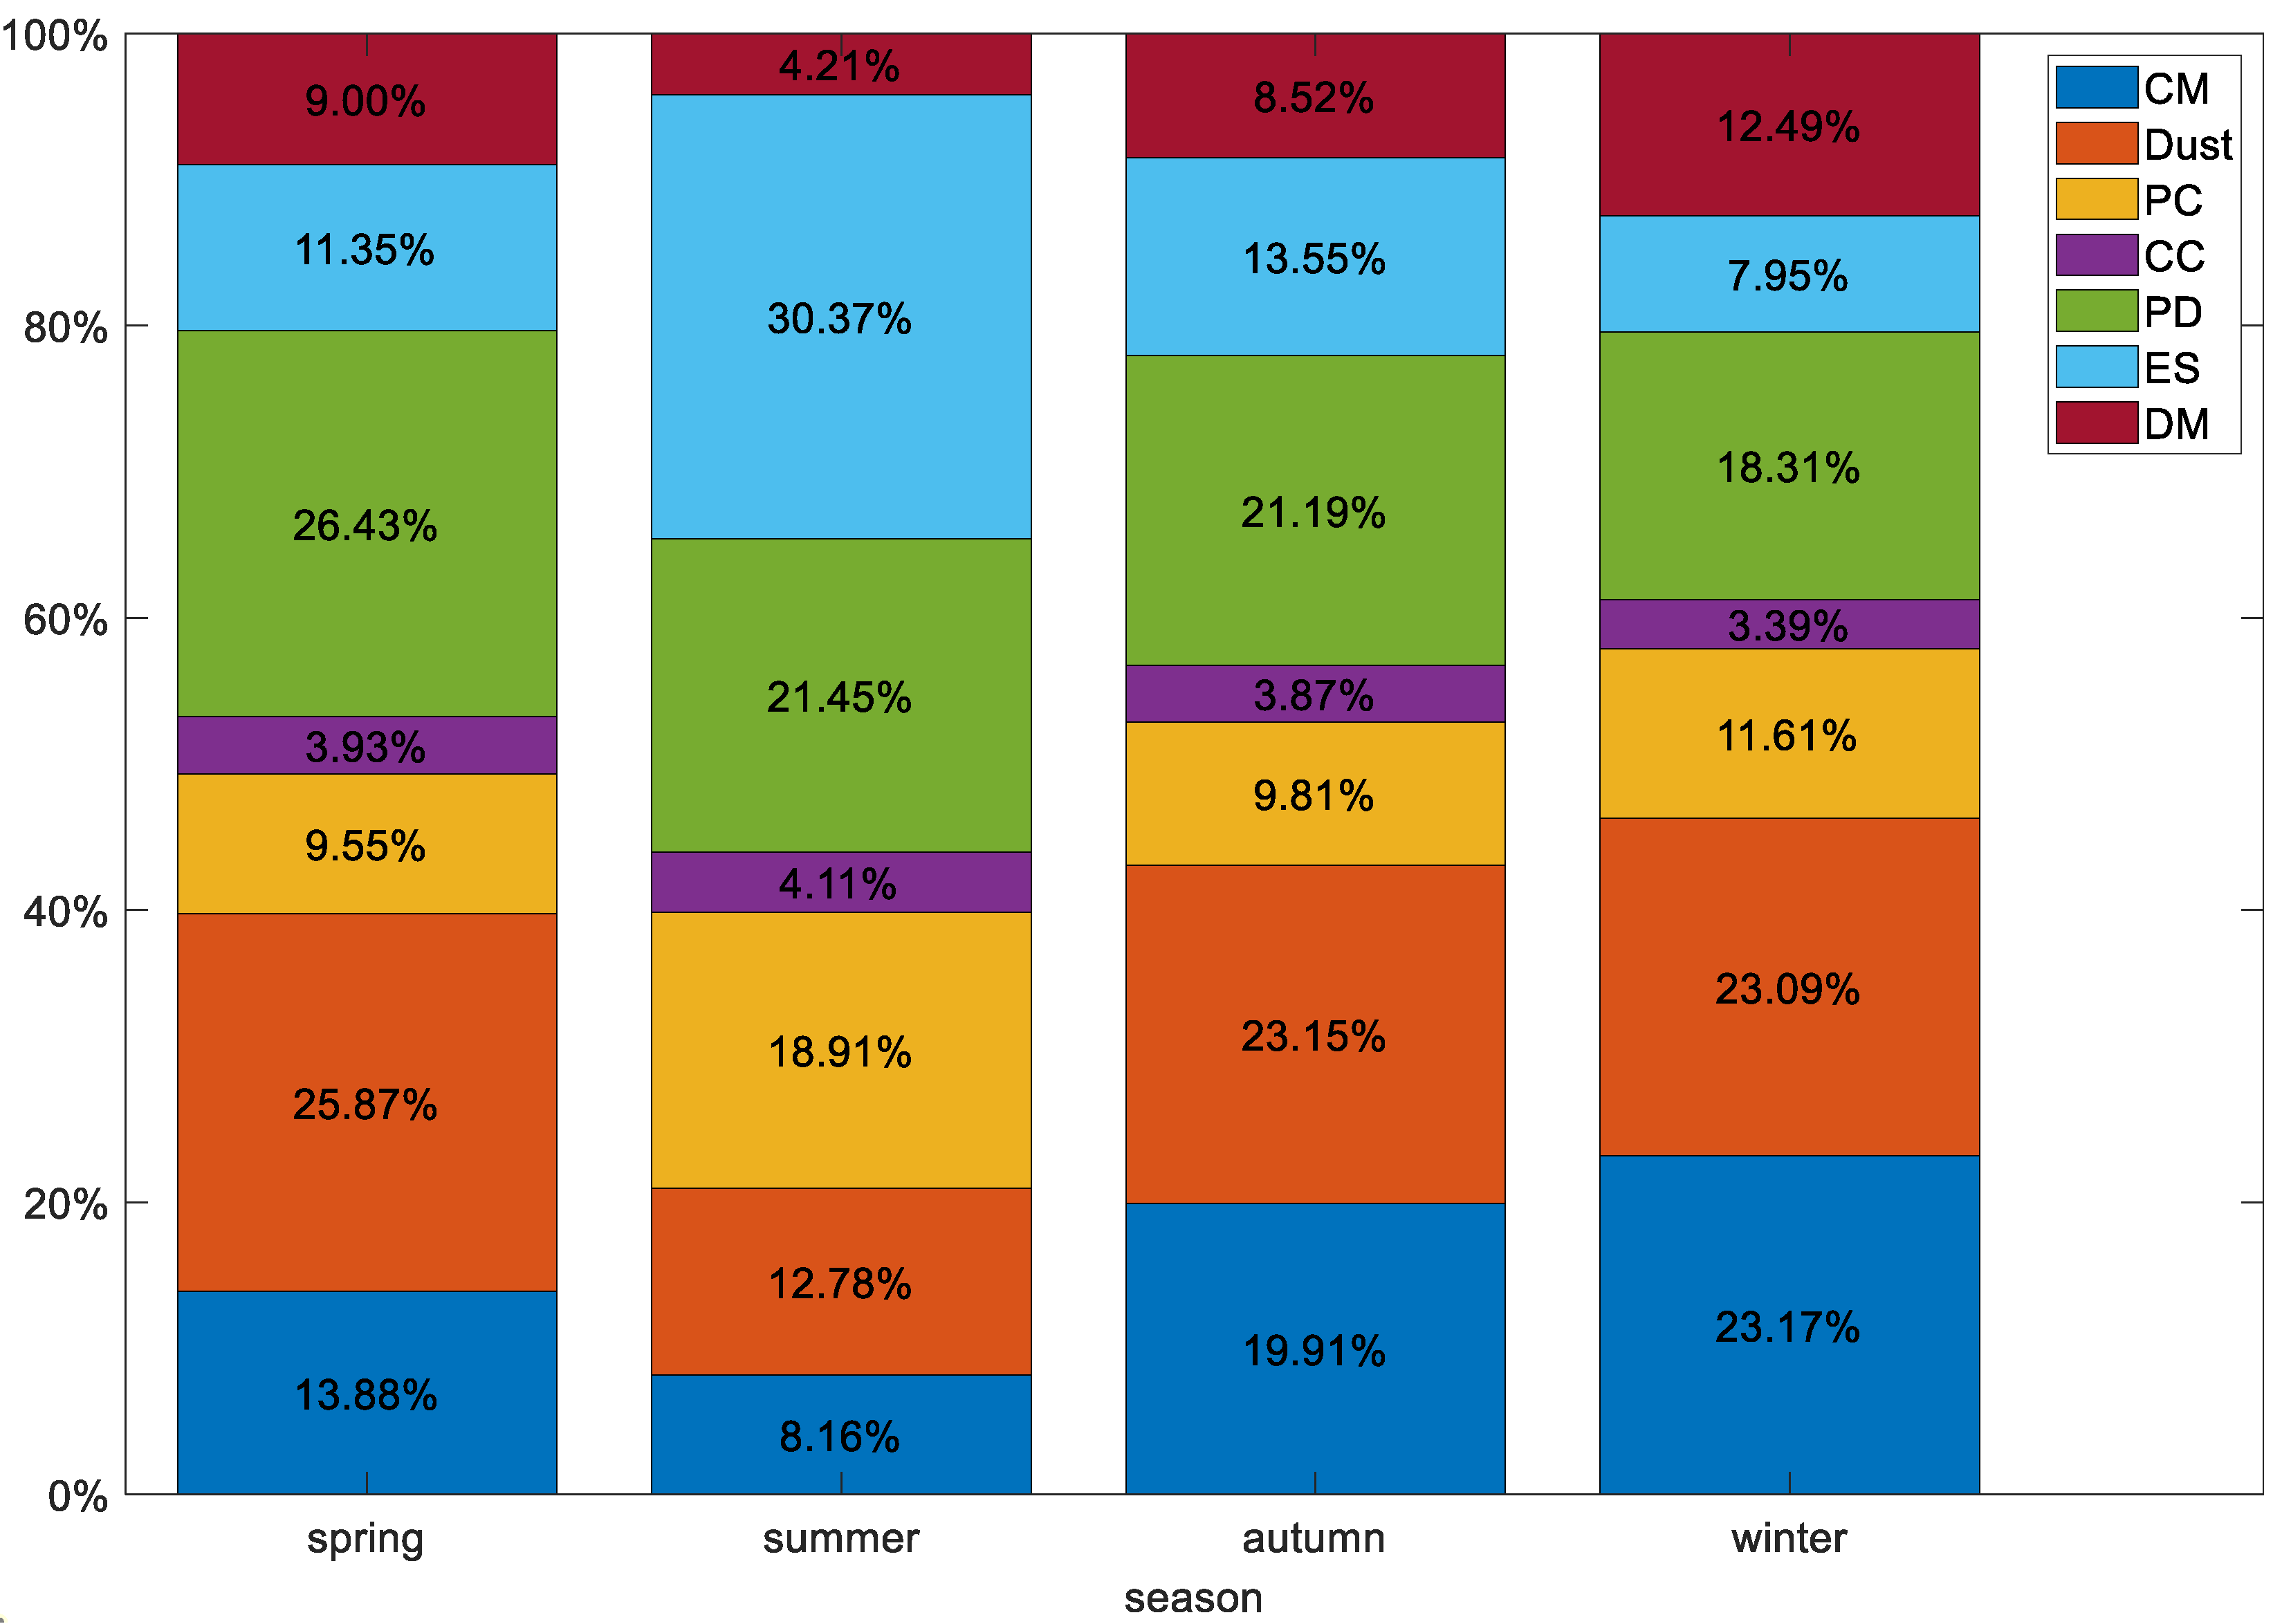
Figure 6 shows the average proportions of different types of aerosols over the Arctic in each season during 2006–2021. During spring, PD and dust accounted for the largest proportion of total aerosols. These spring dust events are consistent with Asian dust transport [83]. Additionally, the variations in the PD and dust in spring may have strong connections with Arctic amplification, since they induced positive radiative forcing, which has significant effects on the Arctic surface [84]. In summer, the proportion of ES was the highest, followed by PD and PC. However, the amounts of ES were remarkably lower in other seasons, which can be linked to the frequent wildfires in Siberia in summer [85]. In autumn, dust, PD, and CM represented the largest proportion of aerosols, accounting for more than 60%, while CM, dust, and PD were the most common types in winter. It is interesting that when the Arctic Ocean was covered by large amounts of long-lasting sea ice under dry and cold conditions in winter, a significant proportion of CM was also detected. This could be connected to the origination of aerosols from the open ocean (breaking waves) and open sea ice fractures [86], which is also consistent with the analyses of chemical composition by Moschos et al. [87]. Although CM, dust, and PD over the Arctic generally make up the highest proportion of the overall composition in all seasons except summer, they originate from different sources. Marine aerosols including CM and DM are typically local, arriving from the Arctic Ocean [79,88], while the dust and PD mainly arrive from long-range transport [78,89]. Among the different types of aerosols over the Arctic, the proportion of CC was the lowest (i.e., less than 5%) in all seasons, which is consistent with the analysis in Figure 5. This is also consistent with Omar et al. [90], who noted that CC was not identified very frequently by the CALIOP subtype algorithm due to the difficulty of detecting a low IAB (integrated attenuated backscatter) threshold, which is one of the optical characteristics of CC.
Figure 7 shows the results of the M-K trend analysis for all aerosol types except CC, due to it having the lowest proportion during 2006–2021. Generally, the FoOs of CM and dust exhibited an increasing trend, while those of PC, PD, and DM depicted downward trends over the 16 years considered. The increasing trend in the FoOs of CM had an 80% significance level (low confidence level) and may be related to Arctic amplification due to sea ice–albedo feedback [9,79]. This is also consistent with Browse et al.’s analysis [91], which found that the loss of summertime Arctic sea ice leads to a large increase in the emission of aerosols. Additionally, the increasing trend in the FoOs of dust had a 95% significance level (high confidence level). This trend also corresponds with the analysis in Bowen and Vincent [92], who found that the relative spatial extent of dust (RSED) presented a significant increasing linear trend between 2007 and 2019 in the Arctic. Additionally, the intersection of the U F and U B lines in 2017 indicates an abrupt change in the trend, with a significant increase in the FoOs of dust after 2017.
The decreasing trend in the FoOs of PC during 2006–2021 had an 80% significance level (low confidence level) and may be attributed to the long-range transport of aerosols from lower latitudes [78,89], which leads to a reduction in the relative proportion of locally sourced PC. Despite the strong connection between dust and PD and DM, opposite trends in the FoOs of PD and DM to those of dust were observed during 2006–2021 over the Arctic (Figure 7d,f). The decrease in the FoOs of PD had a 95% significance level (high confidence level) and may be linked to the reduction in pollution due to a regulatory policy on industrial emission [93]. This PD is mainly a mixture of dust and ES [81]. In addition, this might be because of CALIOP’s tendency to misidentify diamond dust and ice fog as dust, as highlighted by Zamora et al. [94]. Additionally, the intersection of the U F and U B lines in 2014 indicates an abrupt change in the trend, with a significant decrease in the FoOs of PD after 2014. Moreover, the decrease in the FoOs of DM had a 90% significance level (moderate confidence level) and may be related to the differences in distinct density [95] and hygroscopicity [96] of dust and CM, which leads to the obstacle to their mixture. It could also be caused by the increasing humidity of CM caused by global warming, which makes the formation of DM increasingly difficult. Additionally, while the more frequent lightning- and human-caused wildfires in summer due to surface warming contribute to the increase in ES loading [85,97], no significant trend in the FoOs of ES was detected (Figure 7e). This may be associated with the increase in the total amount of aerosols over the Arctic [98], which prevents changes in the proportion of ES.

3.2.2. Distribution of Different Aerosol Types over the Arctic

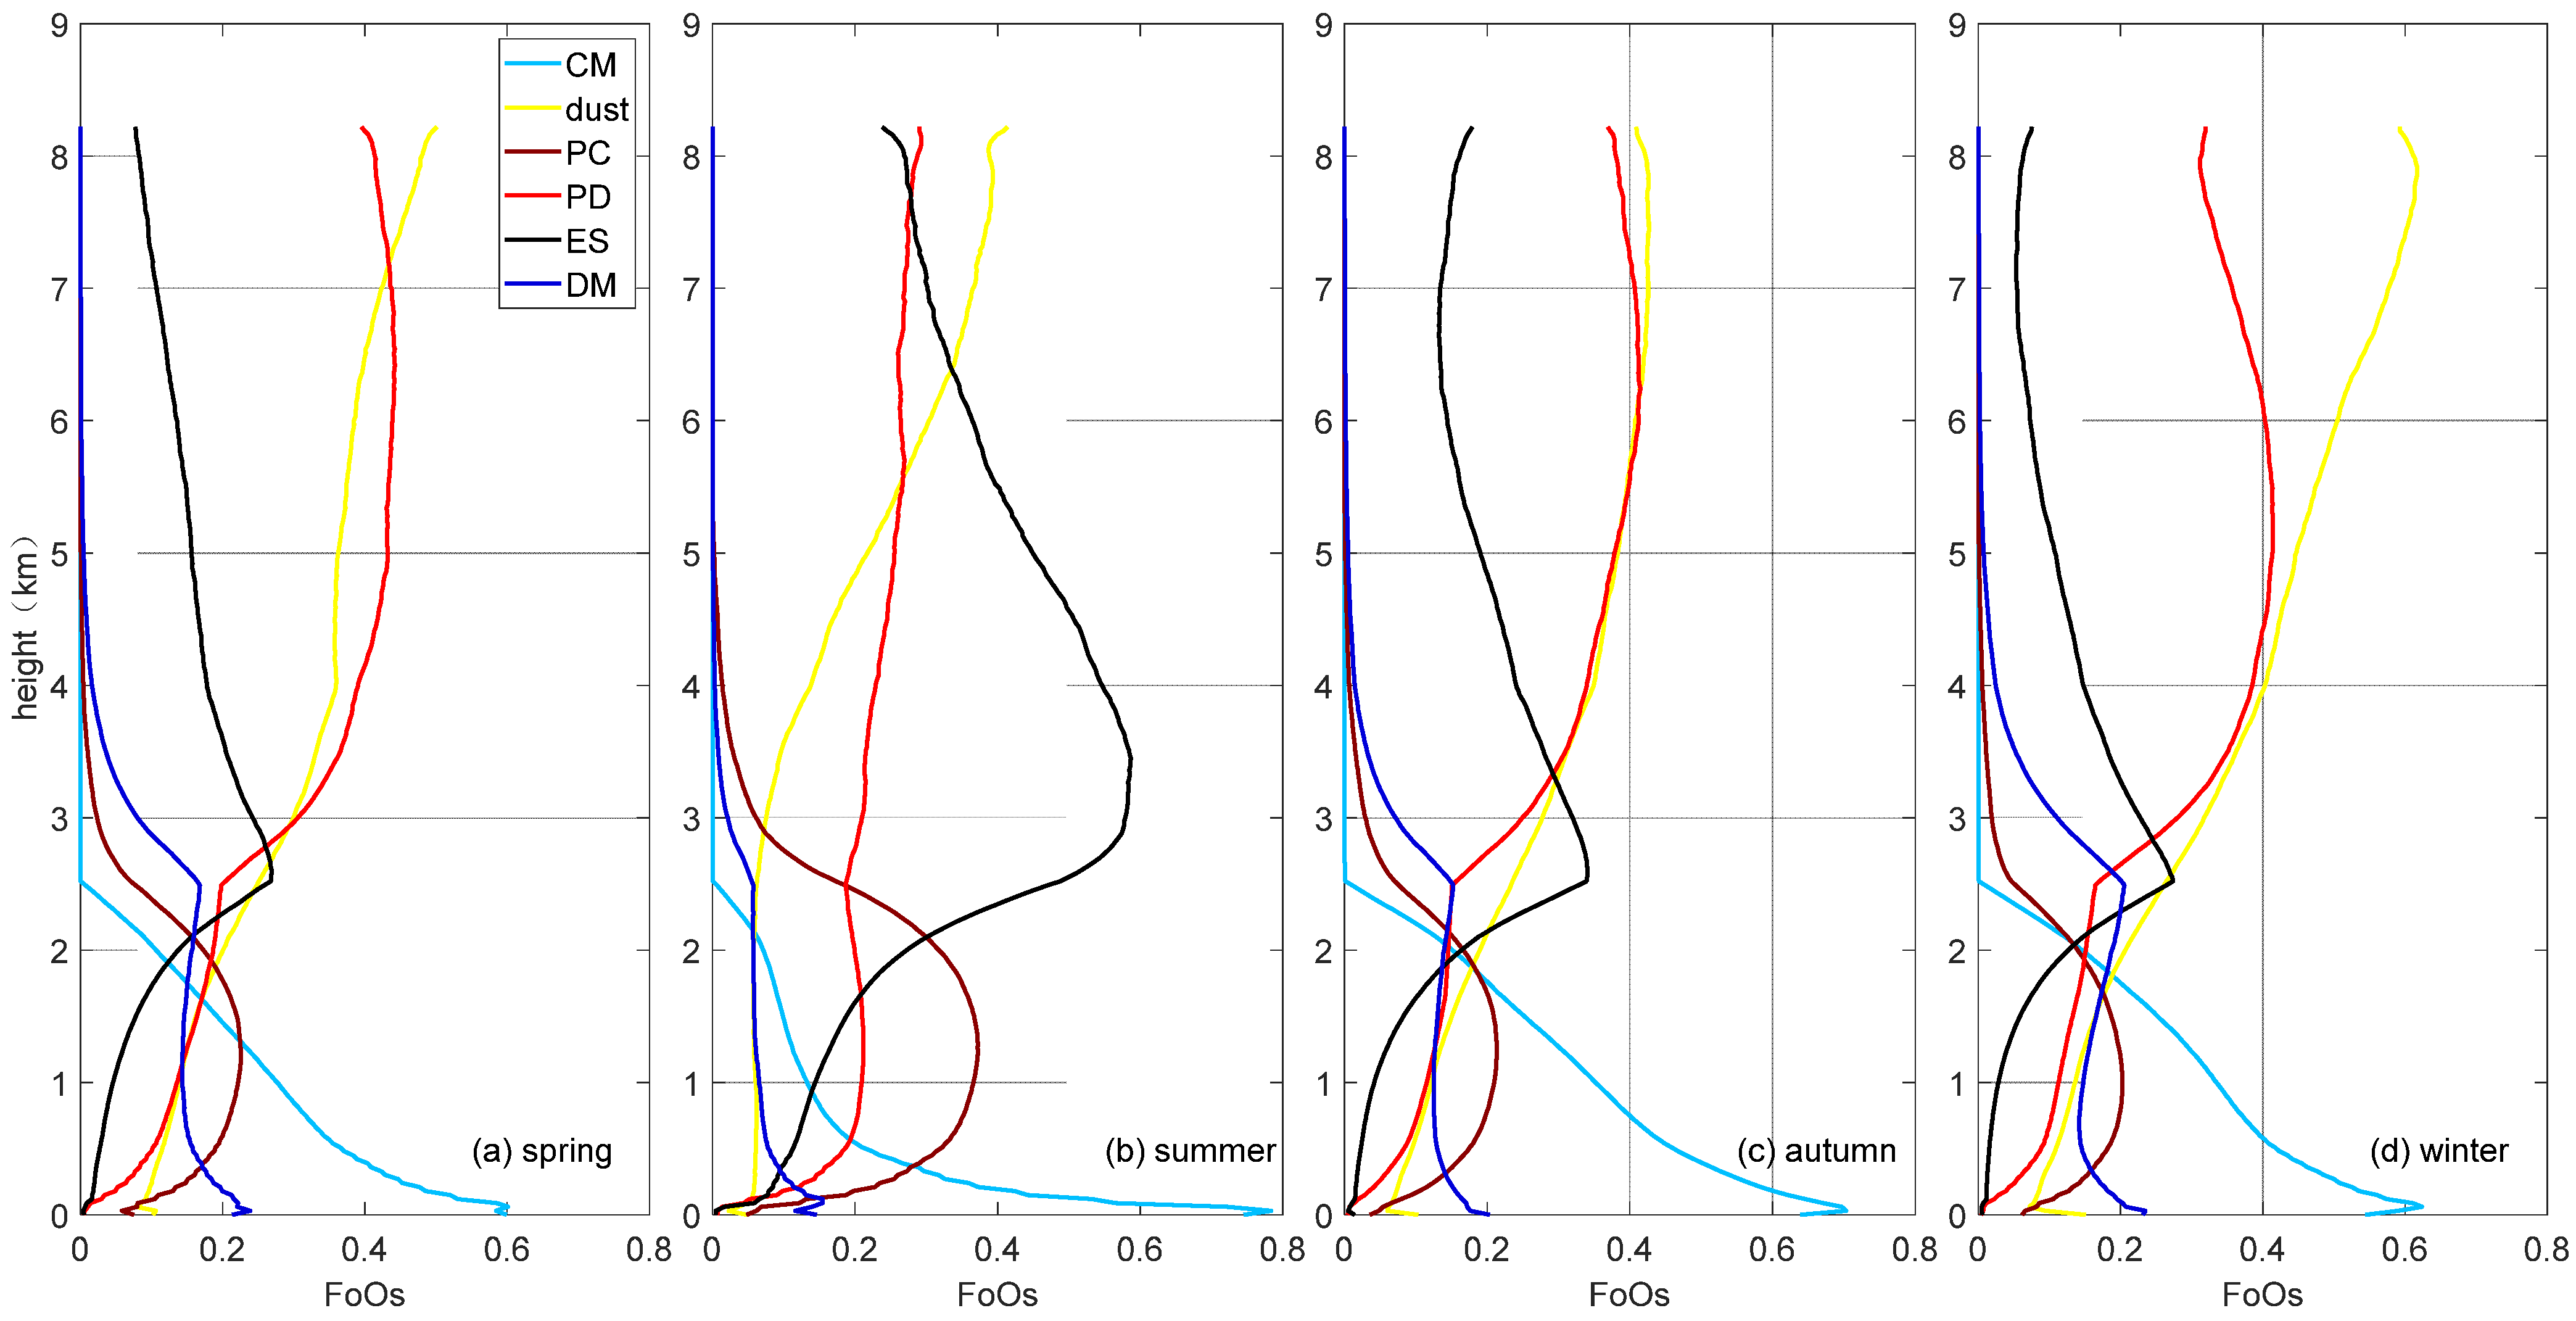
Figure 8 presents the vertical profiles of the mean FoOs of different types of aerosols over the Arctic in each season during 2006–2021. Remarkable vertical mixing of the FoOs of ES was typically detected in each season, reaching a maximum at about 2–3 km. The lifting of smoke particles could be related to ES self-lofting, as well as large-scale atmospheric motion [99]. Moreover, the vertical mixing of the FoOs of ES was most prominent in summer, being nearly twice the strength of FoOs in other seasons when dust was the dominant aerosol type. Moreover, the FoOs of PC increased with height below 1 km and experienced a subsequent decrease. The FoOs of PC almost reached zero at the height where ES reached its maximum. This is consistent with Kim et al. [81], who indicated that the primary difference between PC and ES is layer top height.
The vertical distribution of the FoOs of dust exhibited a pattern similar to that of PD in each season, which can be attributed to the fact that PD primarily originates from dust. The FoOs of both dust and PD increased with height and were concentrated above 4 km. This is due to the long-range transport in the upper troposphere [100], which is one of the most important sources of dust and PD in the Arctic. As a result, the FoOs of dust above 6 km were typically higher in winter than in other seasons, which may be associated with the strong transport of dust in this season [78,89,101].
The vertical distribution of the FoOs of PD generally displayed a consistent pattern in spring (Figure 8a), autumn (Figure 8c), and winter (Figure 8d). However, unlike the similar distribution of the FoOs of PD and dust in both spring and autumn, a significant discrepancy between the FoOs of PD and dust in winter was observed (especially above 6 km). The slight effect of the typically higher FoO of dust on those of PD in winter is likely due to the contemporaneously limited quantity of ES over the Artic, since PD is mainly a mixture of dust and ES. Moreover, one of the most distinctive features observed in summer was that the FoOs of PD increased the slowest in the summertime as altitude rose above 1 km (Figure 8b). This could be due to the limited quantity of dust, which is the other constituent of PD.
It is also clear from Figure 8 that CM and DM were primarily concentrated below 3 km, and their vertical distributions generally showed a similar pattern across all seasons. As the altitude increased, the FoOs of CM decreased rapidly, while the FoOs of DM were consistent and then decreased exponentially above approximately 2.5 km. This indicates that the vertical distributions of CM and DM are largely affected by temperature and humidity.
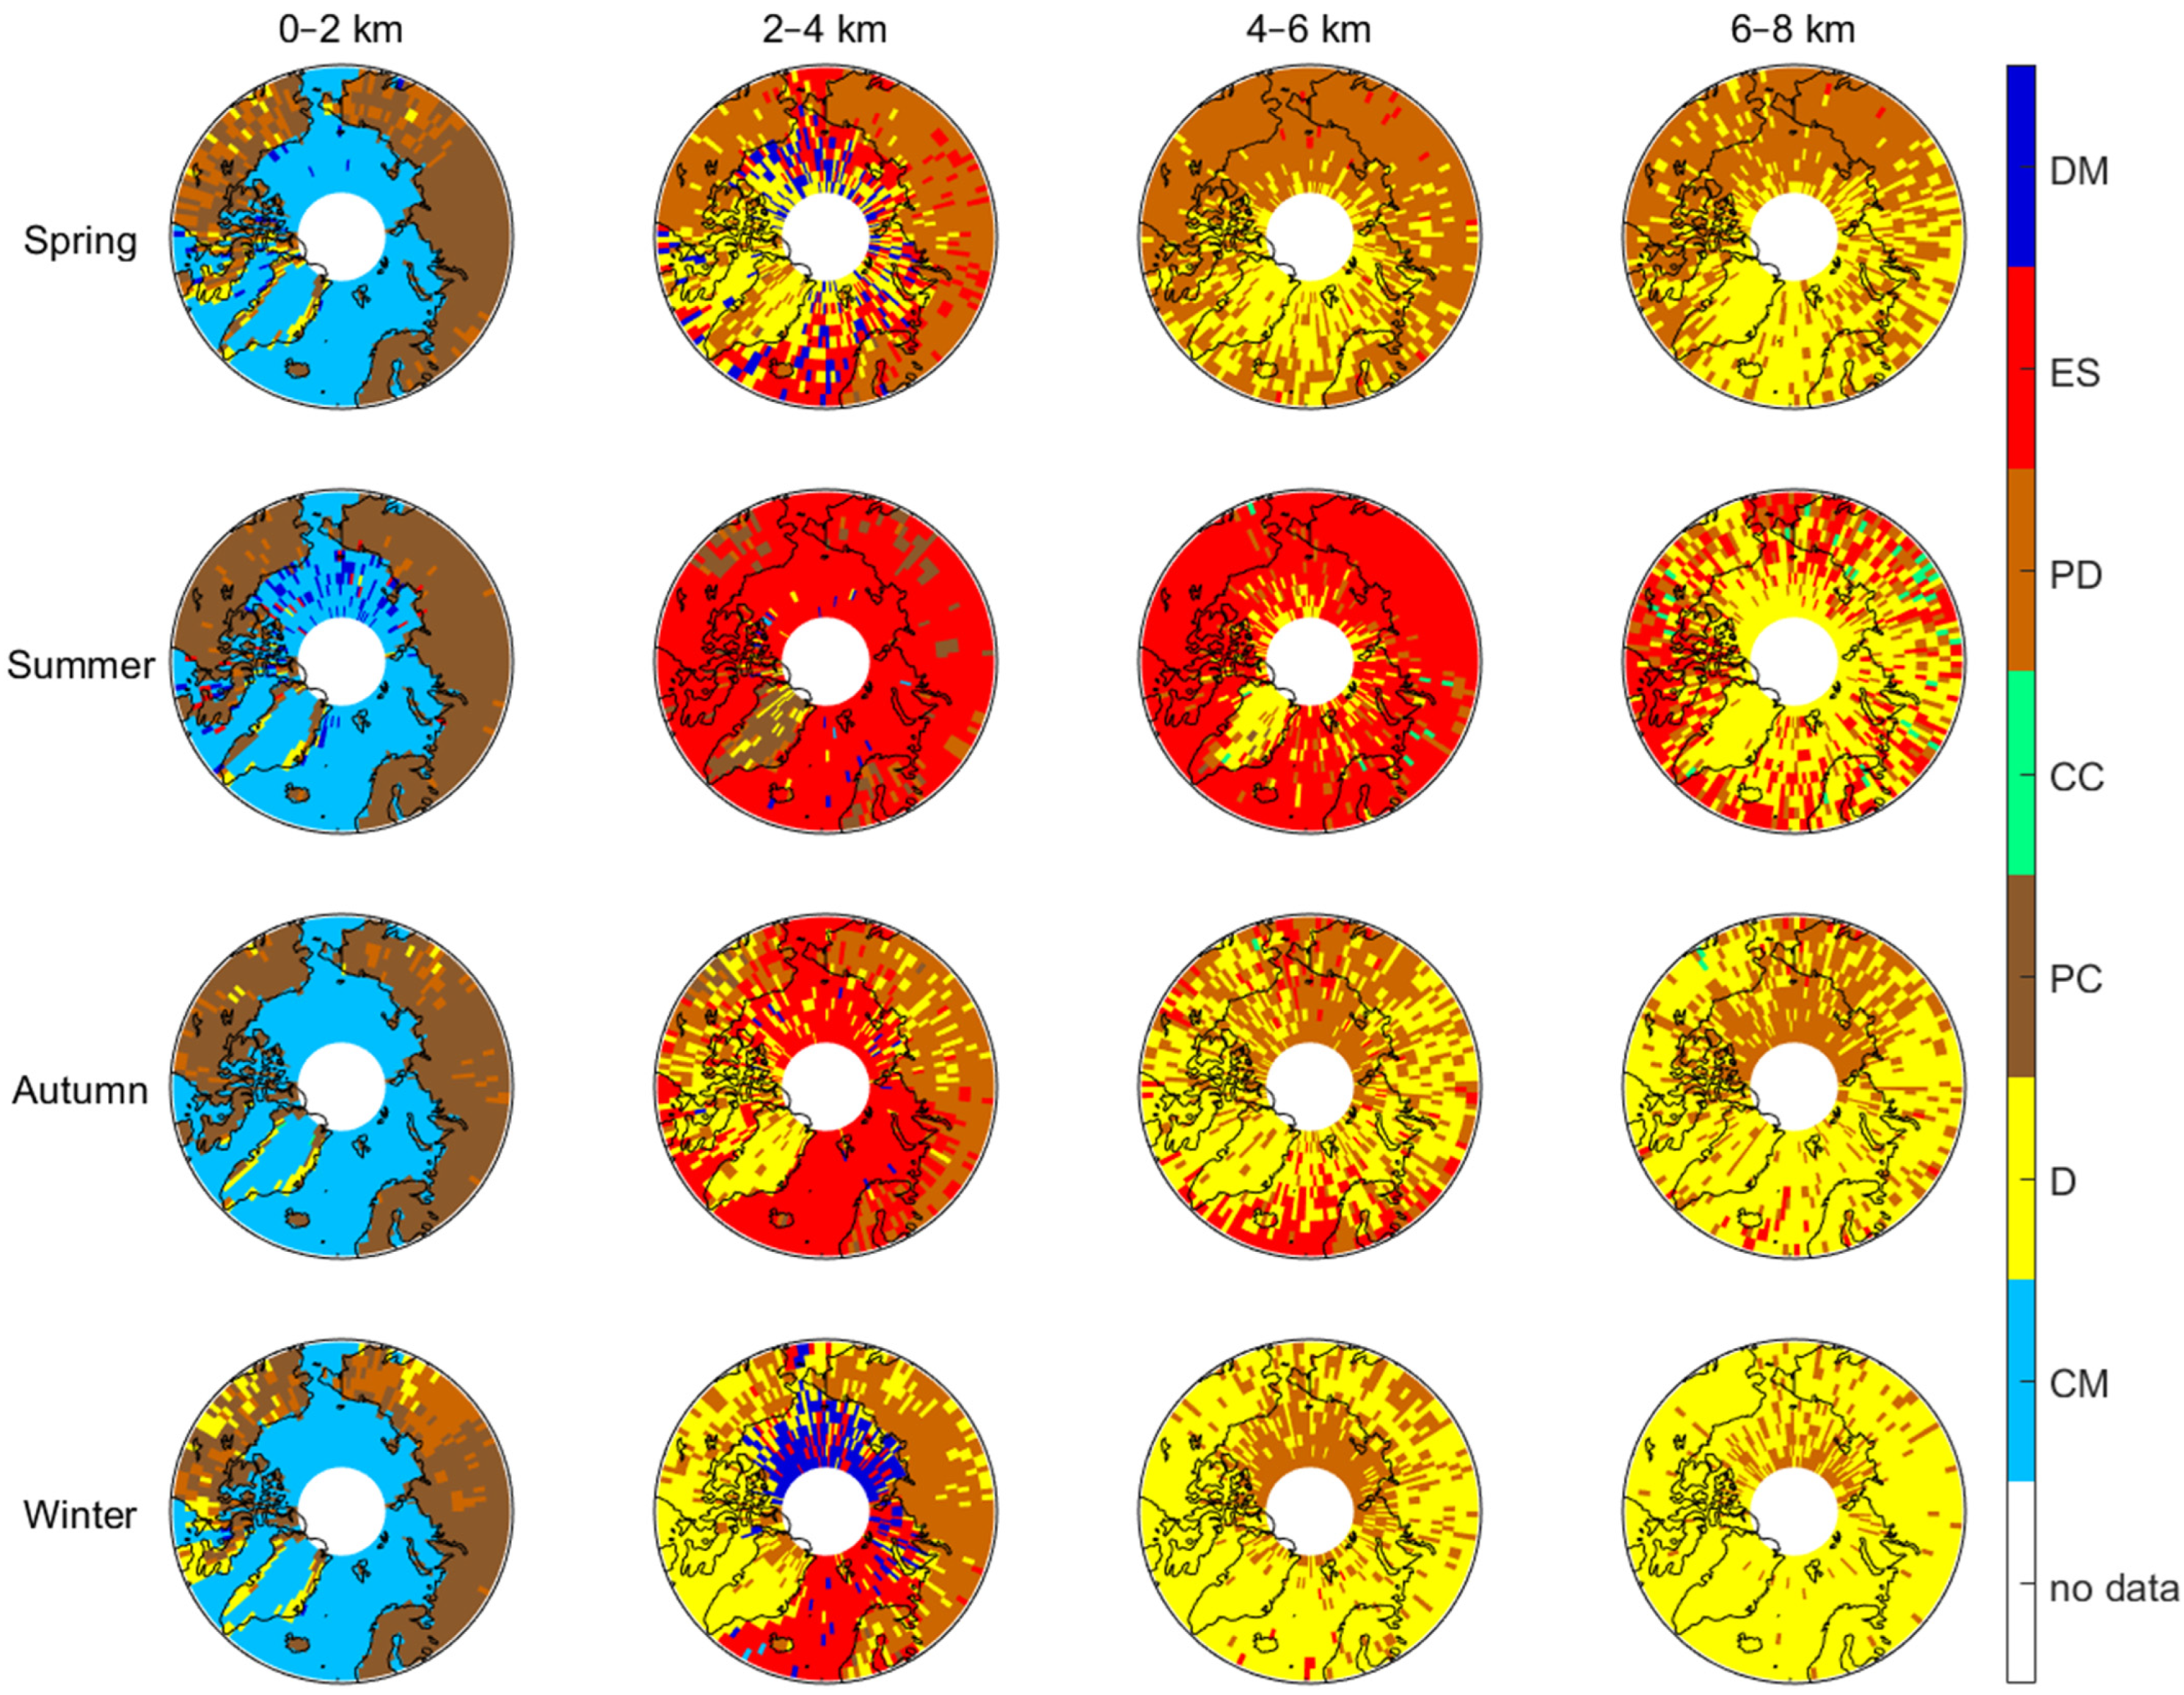
In Figure 9, the horizontal distributions of the most dominant aerosol types at 0–2, 2–4, 4–6, and 6–8 km over the Arctic in each season during 2006–2021 are illustrated. On the one hand, in spring, the Arctic Ocean and Greenland were dominated by CM at 0–2 km. On the other hand, PC was dominant over most of the Arctic land except for part of Northern Canada and eastern Siberia, where PD sporadically existed. At 2–4 km, PD was the most widespread aerosol type over Arctic land, followed by dust mainly over Greenland and Northern Canada. ES was also scattered over northern Russia, the eastern part of the Greenland Sea, and the Pacific sector of the Arctic Ocean, while DM was fractionally spread over the east part of the Greenland Sea and the northern Pacific sector of the Arctic Ocean. In the middle and upper troposphere (4–8 km), dust and PD were dominant over the Arctic. This could be due to the strong transport of dust from lower-latitude regions due to prevailing atmospheric circulation patterns [78,102].
The spatial distributions of aerosols at 0–2 km in summer generally displayed a similar pattern to those in spring, except that more regions were dominated by DM over the northern Pacific sector of the Arctic Ocean in summer than in spring. ES dominated the aerosol composition at 2–6 km over the entire Arctic during summer, except that PC and dust were prominent at 2–4 km and 4–6 km over Greenland, respectively. The PC level at 2–4 km over Greenland is mainly attributed to the strong mixing of continental and ES in summer. Additionally, the widespread dust at 4–6 km over Greenland in summer may be related to ice sheet melting, which leads to an increase in land surface exposure and therefore dust formation [103]. In the upper troposphere (6–8 km), dust was the most dominant aerosol type over the Arctic, followed by ES, which was mainly detected at lower latitudes of the Arctic.
In autumn, the most dominant aerosol types exhibited a similar spatial pattern to that in spring and summer at 0–2 km. ES made up the largest proportion of aerosols at 2–4 km in both summer and autumn over the Arctic Ocean. Additionally, PD was spread over northern Russia, and dust was mainly detected over Greenland, Northern Canada, and part of Sakha in autumn at this height. The prevailing ES in summer was replaced by dust in autumn due to the wet removal effect [27] and the transport of dust in autumn [101]. Therefore, in the middle and upper troposphere (4–8 km), the spatial distribution of the Arctic’s most dominant aerosol types at 6–8 km presented similar pattern to that at 4–6 km, except that ES was more extensive at low latitudes at 4–6 km. At 6–8 km, PD was widespread in the Pacific side of the Arctic, while dust prevailed over the rest of the Arctic.
During winter, the spatial distribution of the most dominant aerosol types at 0–2 km was also similar to that in other seasons, with the exception of PD, which was more extensive over northeastern Russia, as well as dust, which was detected more fractionally over northwest Canada and eastern Siberia. At 2–4 km, PD was extensively detected over Eurasia in winter and presented a similar spatial pattern to that in autumn. Wintertime dust was mainly distributed over the land areas of the western Arctic, as well as the CAA (Canadian Atlantic area) and Hudson and Baffin bays at this height. Additionally, the DM and ES at 2–4 km prevailed over the Atlantic sector of the Arctic Ocean and the Pacific sector of the Central Arctic, respectively, in winter. Dust was spread over most of the Arctic due to the extensive transport from lower latitudes [78,89] in the middle and upper troposphere (4–8 km), especially at 6–8 km.

3.2.3. Three-Dimensional Structure of FoOs of Important Aerosol Types in Different Areas

As determined by the analysis above, dust, PD, ES, and CM were the dominant aerosol types over the Arctic. Despite the extensive presence of CM over the Arctic Ocean and Greenland in each season, their influence on climate was relatively minor due to their unique optical and physical properties. Therefore, only dust, PD, and ES were further analyzed, as detailed in the following text, due to their vital impact on radiative forcing [104]. To further understand the three-dimensional structure of various aerosol types over different hotspot regions, we present the profiles over three regions of the world. These regions were the Greenland zone (GLZ) (60°N–75°N; 60°W–20°W), the eastern Siberia zone (ESZ) (60°N–75°N; 140°E–180°E), and the middle Siberia zone (MSZ) (60°N–75°N; 100°E–140°E). For the analysis of the Arctic’s most dominant aerosol types, we considered the GLZ for dust, the ESZ for PD, and the MSZ for ES. Additionally, considering the discrepancies in the emissions of aerosol subtypes between different seasons, the profiles of GLZ, ESZ in spring, and MSZ in summer were observed.
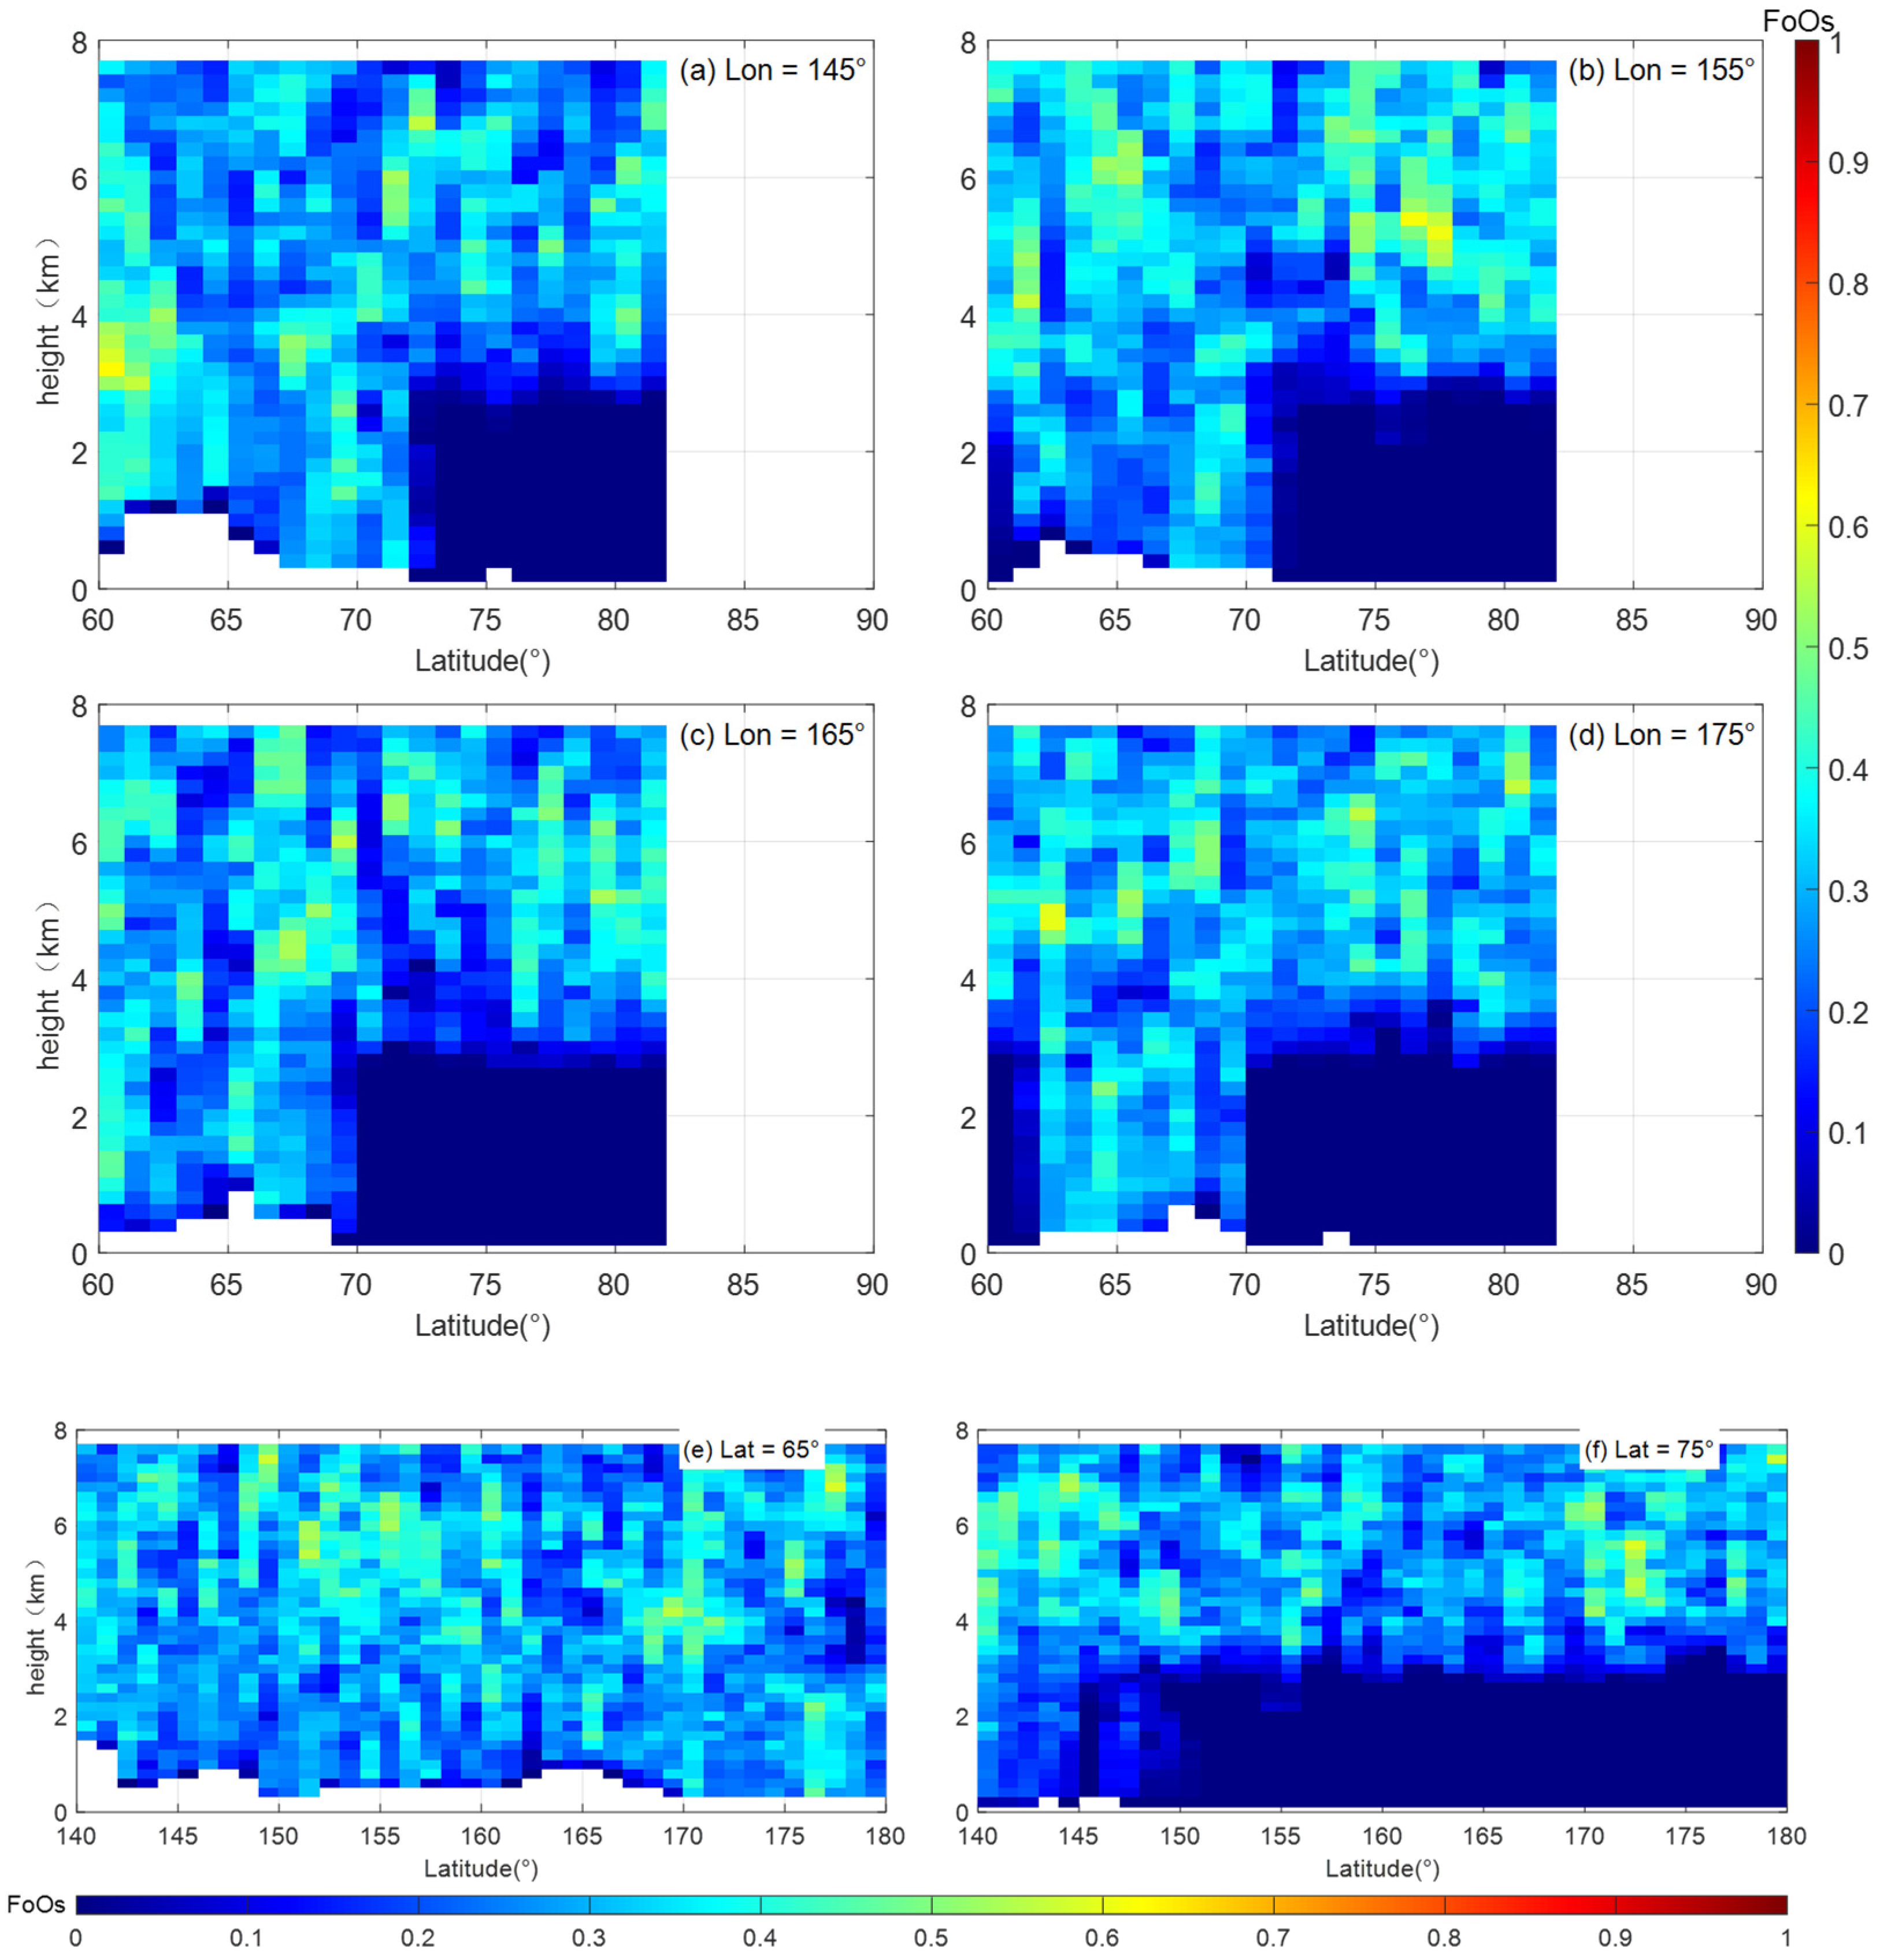
Figure 10 illustrates the three-dimensional structure of dust in spring over the GLZ during 2006–2021. It is evident that dust over the GLZ was mainly concentrated at high latitudes and confined above 3 km. There was also some dust present below 3 km over the land. This vertical distribution pattern indicates that dust over the GLZ was primarily from the local surface rather than transported from lower latitudes. However, there was a small amount of dust over the ocean southwest of Greenland. This may be linked to the transport of dust from the GLZ itself driven by the prevailing southeast wind [105]. Compared to the distribution of dust between 65°N and 75°N (Figure 10e,f), the FoOs in the high-latitude regions over Greenland were higher, which further supports that Greenland is a significant source of dust.
The three-dimensional structure of PD in spring over the ESZ during 2006–2021 is presented in Figure 11. It is notable that the distribution of PD was observably affected by the underlying surface conditions. To be specific, PD was generally only found above 3 km over the ocean (mostly north of 70°N), while over the land, it could be detected throughout the whole troposphere. This is due to the emission of anthropogenic pollution in the ESZ, which contributes to the formation of PD. Increased human activity on the land, including industrial production and mineral exploitation [106], results in PD emissions over the land. Furthermore, the frequent temperature inversions in the Arctic atmosphere during spring produce a stable meteorological condition, which causes most of the PD to concentrate over the land [107].
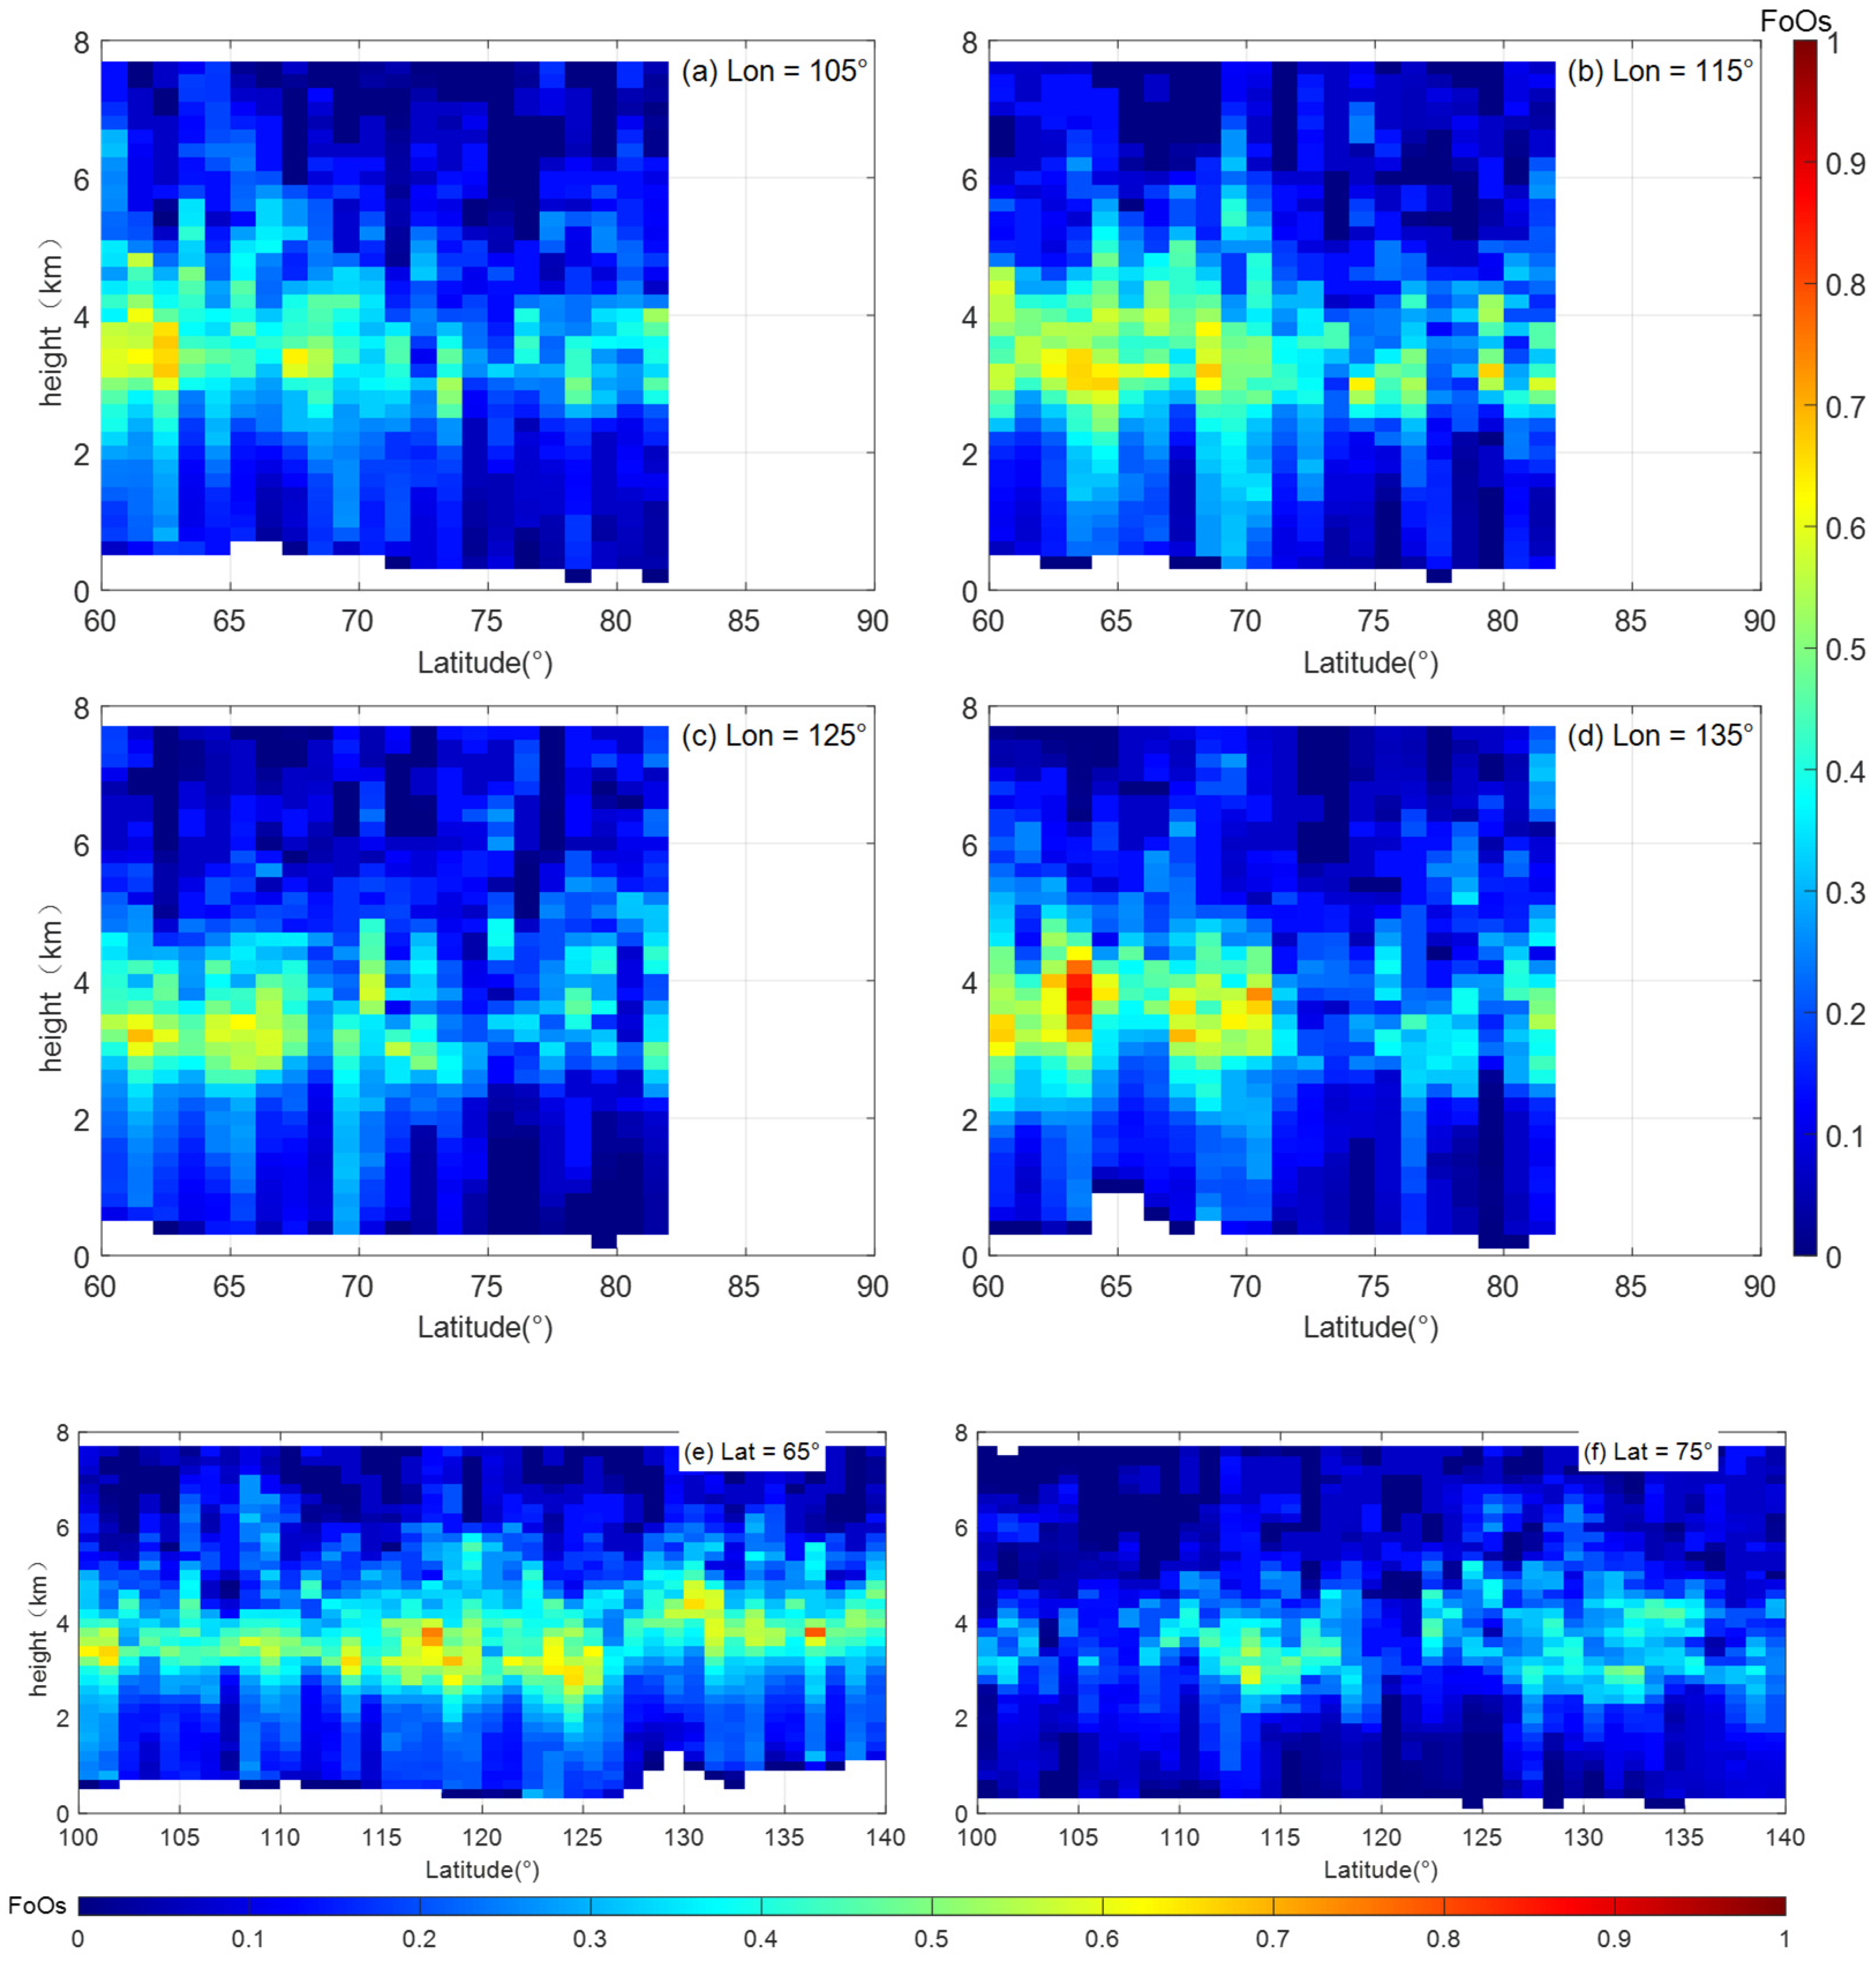
The three-dimensional structure of ES in summer over the MSZ during 2006–2021 is depicted in Figure 12. As seen in Figure 8, most of the ES was spread between 2 and 6 km. In addition, the meridional distribution of ES was relatively uniform across the entire region. Although ES originates from land areas, it can still be transported further north due to the polar vortex. With prolonged insolation during the Arctic summer under polar day conditions, the meridional vorticity gradient gradually decreases, making such transport increasingly easier [108]. Furthermore, this ES eventually settles and, in turn, feeds back to the melting of sea ice in the Arctic.

4. Conclusions

In this study, the accuracy of CALIOP AOD and the distribution of Arctic AOD based on the CALIOP Level 2 aerosol products and AERONET AOD data during 2006–2021 were analyzed. We also estimated the characteristics of different aerosol subtypes, including their proportion, trend, and vertical distribution. Our findings from this study can be summarized as follows:
  • Overall, the CALIOP AOD exhibits a high level of agreement with AERONET AOD, with a correlation coefficient of approximately 0.67 and an RMSE of less than 0.1. There is a slight underestimation of CALIOP AOD over the Arctic; the underestimation during late spring and early summer is more pronounced. This indicates that the inversion algorithm for the AOD of CALIOP typically ignores some tenuous layers, especially during wet conditions over the Arctic. In addition, the ability of CALIOP to retrieve AOD varies under different underlying surface and topographic conditions.
  • The AOD is higher over land than the ocean and decreases as the latitude increases over the Arctic in all seasons. The average AOD over the Arctic displays distinct seasonal variability, and it is highest during winter, followed by spring, autumn, and summer. In addition, the maximum AOD loading is pronounced in northern Siberia during summer due to the frequent wildfires there.
  • PD, dust, and CM prominently dominate the aerosol composition over the Arctic during 2006–2021, while the proportion of CC in the Arctic is minimal. The highest aerosol loading of PD and dust is observed in spring due to long-range transport from Asia and Africa. In summer, wildfire contributes significantly to ES loading. In autumn and winter, CM, dust, and PD make up the main composition of aerosols, with significant local contributions from sea salt and biogenic aerosols originating in the Arctic Ocean.
  • There are increasing trends in the FoOs of CM and dust and decreasing trends in the FoOs of PD, PC, and DM. Overall, these trends are mainly influenced by Arctic amplification, which has affected sea ice coverage and atmospheric circulation patterns and thus influenced the emission of these aerosol types in the Arctic. It is also worth noting that no significant trend in the FoOs of ES was observed during warmer summers. This is likely due to the rising total aerosol load over the Arctic, which limits ES proportions.
  • The vertical mixing ability varies among different types of aerosols. Dust and PD are mainly concentrated above 4 km, while CM and DM are mainly detected below 3 km. The FoOs of ES increase with altitude, reaching a maximum between 2 and 3 km. The vertical distribution patterns of the same aerosol type show little seasonal variation, which indicates that the physicochemical properties of aerosols have a greater impact on their vertical mixing ability than aerosol quantity. However, the prevalent aerosol type in some seasons may influence the formation of related aerosol types, thereby affecting their vertical distribution.
  • The dominant aerosol type at different altitudes varies by season over the Arctic below 6 km. In winter, dust transport from Asia covers much of the Arctic. This transport continues until spring, contributing to the formation of PD. In summer, ES from forest fires dominates the middle troposphere, and locally sourced dust and remaining ES become significant in autumn, with PD aerosols forming through the mixing of dust and ES in heavily polluted areas. This reveals that dust, ES, and PD are widely distributed over the Arctic. At 2–4 km, PC and CM dominate land and sea regions, respectively, in all seasons, while transported dust is notably detected in areas like northeastern Siberia and northern Alaska.
  • Substantial amounts of dust, PD, and ES come from local sources, specifically Greenland, eastern Siberia, and middle Siberia, respectively. Arctic amplification and human activities not only contribute to the emission of these types of aerosols but also accelerate their horizontal spread. In addition, these aerosols tend to accumulate further north in the Arctic and then affect a broader region in the Arctic.
The distributions and 3D structures of various aerosol types in the Arctic are clearly displayed with data from CALIOP. In particular, the 3D structures of dust, PD, and ES provide new insights into the quantities of various aerosols and their spatial and temporal distributions in the Arctic. However, further research is needed to understand the specific impacts of these aerosol subtypes on Arctic cloud formation and radiative forcing, as well as to elucidate the mutual feedback mechanisms between aerosols and Arctic amplification.

Author Contributions

Conceptualization, L.C. and Y.S.; methodology, Y.S. and L.C.; software, Y.S.; validation, L.C. and Y.S.; formal analysis, Y.S.; investigation, Y.S. and L.C.; resources, Y.S.; data curation, Y.S.; writing—original draft preparation, Y.S.; writing—review and editing, L.C. and Y.S.; visualization, L.C.; supervision, L.C.; project administration, L.C.; funding acquisition, L.C. All authors have read and agreed to the published version of the manuscript.

Funding

This work was financially supported by the National Natural Science Foundation of China (42174016) and the Shanghai Frontiers Science Center of Polar Science (SCOPS) under Grant SOO2024-01.

Data Availability Statement

The CALIOP aerosol products are available from the Atmospheric Science Data Center (https://asdc.larc.nasa.gov/project/CALIPSO, accessed on 22 September 2023); the AERONET data can be obtained from the Goddard Space Flight Center (https://aeronet.gsfc.nasa.gov/, accessed on 22 September 2023).

Acknowledgments

The authors would like to thank the Atmospheric Science Data Center (ASDC) for providing the CALIOP aerosol products and the Goddard Space Flight Center (GSFC) for providing the AERONET data.

Conflicts of Interest

The authors declare no conflicts of interest. The funders had no role in the design of the study, in the collection, analyses, or interpretation of data, in the writing of the manuscript, or in the decision to publish the results.

References

  1. Shu, Q.; Wang, Q.; Årthun, M.; Wang, S.; Song, Z.; Zhang, M.; Qiao, F. Arctic Ocean Amplification in a Warming Climate in CMIP6 Models. Sci. Adv. 2022, 8, eabn9755. [Google Scholar] [CrossRef] [PubMed]
  2. Xie, Y.; Huang, J.; Wu, G.; Lei, N.; Liu, Y. Enhanced Asian Warming Increases Arctic Amplification. Environ. Res. Lett. 2023, 18, 034041. [Google Scholar] [CrossRef]
  3. Davy, R.; Griewank, P. Arctic Amplification Has Already Peaked. Environ. Res. Lett. 2023, 18, 084003. [Google Scholar] [CrossRef]
  4. Screen, J.A.; Simmonds, I. The Central Role of Diminishing Sea Ice in Recent Arctic Temperature Amplification. Nature 2010, 464, 1334–1337. [Google Scholar] [CrossRef] [PubMed]
  5. Wu, Z.; Li, X.; Li, Y.; Li, Y. Potential Influence of Arctic Sea Ice to the Interannual Variations of East Asian Spring Precipitation. J. Clim. 2016, 29, 2797–2813. [Google Scholar] [CrossRef]
  6. Budikova, D.; Ford, T.W.; Ballinger, T.J. United States Heat Wave Frequency and Arctic Ocean Marginal Sea Ice Variability. J. Geophys. Res. Atmos. 2019, 124, 6247–6264. [Google Scholar] [CrossRef]
  7. Ma, S.; Zhu, C. Extreme Cold Wave over East Asia in January 2016: A Possible Response to the Larger Internal Atmospheric Variability Induced by Arctic Warming. J. Clim. 2019, 32, 1203–1216. [Google Scholar] [CrossRef]
  8. Ma, S.; Zhu, C.; Liu, B.; Zhou, T.; Ding, Y.; Orsolini, Y. Polarized Response of East Asian Winter Temperature Extremes in the Era of Arctic Warming. J. Clim. 2018, 31, 5543–5557. [Google Scholar] [CrossRef]
  9. Dai, A.; Luo, D.; Song, M.; Liu, J. Arctic Amplification Is Caused by Sea-Ice Loss under Increasing CO2. Nat. Commun. 2019, 10. [Google Scholar] [CrossRef]
  10. Yim, B.Y.; Min, H.S.; Kim, B.-M.; Jeong, J.-H.; Kug, J.-S. Sensitivity of Arctic Warming to Sea Ice Concentration. J. Geophys. Res. Atmos. 2016, 121, 6927–6942. [Google Scholar] [CrossRef]
  11. Beer, E.; Eisenman, I. Revisiting the Role of the Water Vapor and Lapse Rate Feedbacks in the Arctic Amplification of Climate Change. J. Clim. 2022, 35, 1–33. [Google Scholar] [CrossRef]
  12. Khodri, M.; Leclainche, Y.; Ramstein, G.; Braconnot, P.; Marti, O.; Cortijo, E. Simulating the Amplification of Orbital Forcing by Ocean Feedbacks in the Last Glaciation. Nature 2001, 410, 570–574. [Google Scholar] [CrossRef]
  13. Pithan, F.; Mauritsen, T. Arctic Amplification Dominated by Temperature Feedbacks in Contemporary Climate Models. Nat. Geosci. 2014, 7, 181–184. [Google Scholar] [CrossRef]
  14. Dobricic, S.; Pozzoli, L.; Vignati, E.; Van Dingenen, R.; Wilson, J.; Russo, S.; Klimont, Z. Nonlinear Impacts of Future Anthropogenic Aerosol Emissions on Arctic Warming. Environ. Res. Lett. 2019, 14, 034009. [Google Scholar] [CrossRef]
  15. Schmale, J.; Zieger, P.; Ekman, A.M.L. Aerosols in Current and Future Arctic Climate. Nat. Clim. Change 2021, 11, 95–105. [Google Scholar] [CrossRef]
  16. Ren, L.; Yang, Y.; Wang, H.; Zhang, R.; Wang, P.; Liao, H. Source Attribution of Arctic Black Carbon and Sulfate Aerosols and Associated Arctic Surface Warming during 1980–2018. Atmos. Chem. Phys. 2020, 20, 9067–9085. [Google Scholar] [CrossRef]
  17. Shindell, D. Local and Remote Contributions to Arctic Warming. Geophys. Res. Lett. 2007, 34. [Google Scholar] [CrossRef]
  18. Wang, T.; Tang, J.; Sun, M.; Liu, X.; Huang, Y.; Huang, J.; Han, Y.; Cheng, Y.; Huang, Z.; Li, J. Identifying a Transport Mechanism of Dust Aerosols over South Asia to the Tibetan Plateau: A Case Study. Sci. Total Environ. 2021, 758, 143714. [Google Scholar] [CrossRef] [PubMed]
  19. McNeill, V.F. Atmospheric Aerosols: Clouds, Chemistry, and Climate. Annu. Rev. Chem. Biomol. Eng. 2017, 8, 427–444. [Google Scholar] [CrossRef]
  20. Heald, C.L.; Ridley, D.A.; Kroll, J.H.; Barrett, S.R.H.; Cady-Pereira, K.E.; Alvarado, M.J.; Holmes, C.D. Contrasting the Direct Radiative Effect and Direct Radiative Forcing of Aerosols. Atmos. Chem. Phys. 2014, 14, 5513–5527. [Google Scholar] [CrossRef]
  21. Rap, A.; Scott, C.E.; Spracklen, D.V.; Bellouin, N.; Forster, P.M.; Carslaw, K.S.; Schmidt, A.; Mann, G. Natural Aerosol Direct and Indirect Radiative Effects. Geophys. Res. Lett. 2013, 40, 3297–3301. [Google Scholar] [CrossRef]
  22. Mahowald, N. Aerosol Indirect Effect on Biogeochemical Cycles and Climate. Science 2011, 334, 794–796. [Google Scholar] [CrossRef]
  23. Ding, K.Y.; Huang, X.; Ding, A.; Wang, H.; Su, H.; Kerminen, V.-M.; Petäj, T.; Tan, Z.; Wang, Z.; Zhou, D.; et al. Aerosol-Boundary-Layer-Monsoon Interactions Amplify Semi-Direct Effect of Biomass Smoke on Low Cloud Formation in Southeast Asia. Nat. Commun. 2021, 12, 6416. [Google Scholar] [CrossRef] [PubMed]
  24. Lohmann, U.; Feichter, J. Can the Direct and Semi-Direct Aerosol Effect Compete with the Indirect Effect on a Global Scale? Geophys. Res. Lett. 2001, 28, 159–161. [Google Scholar] [CrossRef]
  25. Shindell, D.; Faluvegi, G. Climate Response to Regional Radiative Forcing during the Twentieth Century. Nat. Geosci. 2009, 2, 294–300. [Google Scholar] [CrossRef]
  26. Tunved, P.; Ström, J.; Krejci, R. Arctic Aerosol Life Cycle: Linking Aerosol Size Distributions Observed between 2000 and 2010 with Air Mass Transport and Precipitation at Zeppelin Station, Ny-Ålesund, Svalbard. Atmos. Chem. Phys. 2013, 13, 3643–3660. [Google Scholar] [CrossRef]
  27. Tomasi, C.; Kokhanovsky, A.A.; Lupi, A.; Ritter, C.; Smirnov, A.; O’Neill, N.T.; Stone, R.S.; Holben, B.N.; Nyeki, S.; Wehrli, C.; et al. Aerosol Remote Sensing in Polar Regions. Earth-Sci. Rev. 2015, 140, 108–157. [Google Scholar] [CrossRef]
  28. Watanabe, M.; Iwasaka, Y.; Shibata, T.; Hayashi, M.; Fujiwara, M.; Neuber, R. The Evolution of Pinatubo Aerosols in the Arctic Stratosphere during 1994–2000. Atmos. Res. 2004, 69, 199–215. [Google Scholar] [CrossRef]
  29. Holben, B.N.; Eck, T.F.; Slutsker, I.; Tanré, D.; Buis, J.P.; Setzer, A.; Vermote, E.; Reagan, J.A.; Kaufman, Y.J.; Nakajima, T.; et al. AERONET—A Federated Instrument Network and Data Archive for Aerosol Characterization. Remote Sens. Environ. 1998, 66, 1–16. [Google Scholar] [CrossRef]
  30. Mei, L.; Xue, Y.; de Leeuw, G.; von Hoyningen-Huene, W.; Kokhanovsky, A.A.; Istomina, L.; Guang, J.; Burrows, J.P. Aerosol Optical Depth Retrieval in the Arctic Region Using MODIS Data over Snow. Remote Sens. Environ. 2013, 128, 234–245. [Google Scholar] [CrossRef]
  31. Xian, P.; Zhang, J.; O’Neill, N.T.; Toth, T.D.; Sorenson, B.; Colarco, P.R.; Kipling, Z.; Hyer, E.J.; Campbell, J.; Reid, J.S.; et al. Arctic Spring and Summertime Aerosol Optical Depth Baseline from Long-Term Observations and Model Reanalyses—Part 1: Climatology and Trend. Atmos. Chem. Phys. 2022, 22, 9915–9947. [Google Scholar] [CrossRef]
  32. Mei, L.; Vandenbussche, S.; Rozanov, V.; Proestakis, E.; Amiridis, V.; Callewaert, S.; Vountas, M.; Burrows, J.P. On the Retrieval of Aerosol Optical Depth over Cryosphere Using Passive Remote Sensing. Remote Sens. Environ. 2020, 241, 111731. [Google Scholar] [CrossRef]
  33. Treffeisen, R.; Tunved, P.; Ström, J.; Herber, A.; Bareiss, J.; Helbig, A.; Stone, R.S.; Hoyningen-Huene, W.; Krejci, R.; Stohl, A.; et al. Arctic Smoke—Aerosol Characteristics during a Record Smoke Event in the European Arctic and Its Radiative Impact. Atmos. Chem. Phys. 2007, 7, 3035–3053. [Google Scholar] [CrossRef]
  34. Sorenson, B.T.; Zhang, J.; Reid, J.S.; Xian, P.; Jaker, S.L. Ozone Monitoring Instrument (OMI) UV Aerosol Index Data Analysis over the Arctic Region for Future Data Assimilation and Climate Forcing Applications. Atmos. Chem. Phys. 2023, 23, 7161–7175. [Google Scholar] [CrossRef]
  35. Ranjbar, K.; O’Neill, N.T.; Lutsch, E.; McCullough, E.M.; AboEl-Fetouh, Y.; Xian, P.; Strong, K.; Fioletov, V.E.; Lesins, G.; Abboud, I. Extreme Smoke Event over the High Arctic. Atmos. Environ. 2019, 218, 117002. [Google Scholar] [CrossRef]
  36. Lee, J.; Hsu, N.C.; Sayer, A.M.; Bettenhausen, C.; Yang, P. AERONET-Based Nonspherical Dust Optical Models and Effects on the VIIRS Deep Blue/SOAR over Water Aerosol Product. J. Geophys. Res. Atmos. 2017, 122, 10384–10401. [Google Scholar] [CrossRef]
  37. Ratnam, M.V.; Prasad, P.; Raj, S.T.A.; Raman, M.R.; Basha, G. Changing Patterns in Aerosol Vertical Distribution over South and East Asia. Sci. Rep. 2021, 11, 308. [Google Scholar] [CrossRef]
  38. Su, T.; Li, Z.; Li, C.; Li, J.; Han, W.; Shen, C.; Tan, W.; Wei, J.; Guo, J. The Significant Impact of Aerosol Vertical Structure on Lower Atmosphere Stability and Its Critical Role in Aerosol–Planetary Boundary Layer (PBL) Interactions. Atmos. Chem. Phys. 2020, 20, 3713–3724. [Google Scholar] [CrossRef]
  39. Powell, K.A.; Hostetler, C.A.; Liu, Z.; Vaughan, M.A.; Kuehn, R.; Hunt, W.F.; Lee, K.-P.; Trepte, C.R.; Rogers, R.R.; Young, S.W.; et al. CALIPSO Lidar Calibration Algorithms. Part I: Nighttime 532-Nm Parallel Channel and 532-Nm Perpendicular Channel. J. Atmos. Ocean. Technol. 2009, 26, 2015–2033. [Google Scholar] [CrossRef]
  40. Adams, A.M.; Prospero, J.M.; Zhang, C. CALIPSO-Derived Three-Dimensional Structure of Aerosol over the Atlantic Basin and Adjacent Continents. J. Clim. 2012, 25, 6862–6879. [Google Scholar] [CrossRef]
  41. Hunt, W.H.; Winker, D.M.; Vaughan, M.A.; Powell, K.A.; Lucker, P.L.; Weimer, C. CALIPSO Lidar Description and Performance Assessment. J. Atmos. Ocean. Technol. 2009, 26, 1214–1228. [Google Scholar] [CrossRef]
  42. Lu, X.; Hu, Y.; Yang, Y.; Vaughan, M.; Liu, Z.; Rodier, S.; Hunt, W.; Powell, K.; Lucker, P.; Trepte, C. Laser Pulse Bidirectional Reflectance from CALIPSO Mission. Atmos. Meas. Tech. 2018, 11, 3281–3296. [Google Scholar] [CrossRef]
  43. Devasthale, A.; Tjernström, M.; Omar, A.H. The Vertical Distribution of Thin Features over the Arctic Analysed from CALIPSO Observations. Tellus B Chem. Phys. Meteorol. 2011, 63, 86–95. [Google Scholar] [CrossRef]
  44. Yang, Y.; Zhao, C.; Wang, Q.; Cong, Z.; Yang, X.; Fan, H. Aerosol Characteristics at the Three Poles of the Earth as Characterized by Cloud–Aerosol Lidar and Infrared Pathfinder Satellite Observations. Atmos. Chem. Phys. 2021, 21, 4849–4868. [Google Scholar] [CrossRef]
  45. Kim, S.-W.; Berthier, S.; Raut, J.-C.; Chazette, P.; Dulac, F.; Yoon, S.-C. Validation of Aerosol and Cloud Layer Structures from the Space-Borne Lidar CALIOP Using a Ground-Based Lidar in Seoul, Korea. Atmos. Chem. Phys. 2008, 8, 3705–3720. [Google Scholar] [CrossRef]
  46. Liu, D.; Wang, Z.; Liu, Z.; Winker, D.; Trepte, C. A Height Resolved Global View of Dust Aerosols from the First Year CALIPSO Lidar Measurements. J. Geophys. Res. 2008, 113. [Google Scholar] [CrossRef]
  47. Zhao, Y.; Tang, Q.; Hu, Z.; Yu, Q.; Liang, T. Comparison and Analysis of CALIPSO Aerosol Optical Depth and AERONET Aerosol Optical Depth Products in Asia from 2006 to 2023. Remote Sens. 2024, 16, 4359. [Google Scholar] [CrossRef]
  48. Liu, C.; Shen, X.; Gao, W. Intercomparison of CALIOP, MODIS, and AERONET Aerosol Optical Depth over China during the Past Decade. Int. J. Remote Sens. 2018, 39, 7251–7275. [Google Scholar] [CrossRef]
  49. Mielonen, T.; Arola, A.; Komppula, M.; Kukkonen, J.; Koskinen, J.; de Leeuw, G.; Lehtinen, K.E.J. Comparison of CALIOP Level 2 Aerosol Subtypes to Aerosol Types Derived from AERONET Inversion Data. Geophys. Res. Lett. 2009, 36. [Google Scholar] [CrossRef]
  50. Chen, Q.-X.; Shen, W.-X.; Yuan, Y.; Tan, H.-P. Verification of Aerosol Classification Methods through Satellite and Ground-Based Measurements over Harbin, Northeast China. Atmos. Res. 2019, 216, 167–175. [Google Scholar] [CrossRef]
  51. Guo, J.; Liu, H.; Wang, F.; Huang, J.; Feng, X.; Lou, M.; Wu, Y.; Jiang, J.H.; Xie, T.; Zhaxi, Y.; et al. Three-Dimensional Structure of Aerosol in China: A Perspective from Multi-Satellite Observations. Atmos. Res. 2016, 178, 580–589. [Google Scholar] [CrossRef]
  52. Cronin, T.W.; Tziperman, E. Low Clouds Suppress Arctic Air Formation and Amplify High-Latitude Continental Winter Warming. Proc. Natl. Acad. Sci. USA 2015, 112, 11490–11495. [Google Scholar] [CrossRef] [PubMed]
  53. Burt, M.A.; Randall, D.A.; Branson, M.D. Dark Warming. J. Clim. 2016, 29, 705–719. [Google Scholar] [CrossRef]
  54. Winker, D.M.; Vaughan, M.A.; Omar, A.; Hu, Y.; Powell, K.A.; Liu, Z.; Hunt, W.H.; Young, S.A. Overview of the CALIPSO Mission and CALIOP Data Processing Algorithms. J. Atmos. Ocean. Technol. 2009, 26, 2310–2323. [Google Scholar] [CrossRef]
  55. Ma, X.; Huang, Z.; Qi, S.; Huang, J.; Zhang, S.; Dong, Q.; Wang, X. Ten-Year Global Particulate Mass Concentration Derived from Space-Borne CALIPSO Lidar Observations. Sci. Total Environ. 2020, 721, 137699. [Google Scholar] [CrossRef] [PubMed]
  56. Holben, B.N.; Tanré, D.; Smirnov, A.; Eck, T.F.; Slutsker, I.; Abuhassan, N.; Newcomb, W.W.; Schafer, J.S.; Chatenet, B.; Lavenu, F.; et al. An Emerging Ground-Based Aerosol Climatology: Aerosol Optical Depth from AERONET. J. Geophys. Res. Atmos. 2001, 106, 12067–12097. [Google Scholar] [CrossRef]
  57. Giles, D.M.; Sinyuk, A.; Sorokin, M.G.; Schafer, J.S.; Smirnov, A.; Slutsker, I.; Eck, T.F.; Holben, B.N.; Lewis, J.R.; Campbell, J.R.; et al. Advancements in the Aerosol Robotic Network (AERONET) Version 3 Database—Automated Near-Real-Time Quality Control Algorithm with Improved Cloud Screening for Sun Photometer Aerosol Optical Depth (AOD) Measurements. Atmos. Meas. Tech. 2019, 12, 169–209. [Google Scholar] [CrossRef]
  58. Eck, T.F.; Holben, B.N.; Reid, J.S.; Dubovik, O.; Smirnov, A.; O’Neill, N.T.; Slutsker, I.; Kinne, S. Wavelength Dependence of the Optical Depth of Biomass Burning, Urban, and Desert Dust Aerosols. J. Geophys. Res. Atmos. 1999, 104, 31333–31349. [Google Scholar] [CrossRef]
  59. Mélin, F.; Zibordi, G.; Djavidnia, S. Development and Validation of a Technique for Merging Satellite Derived Aerosol Optical Depth from SeaWiFS and MODIS. Remote Sens. Environ. 2007, 108, 436–450. [Google Scholar] [CrossRef]
  60. Redemann, J.; Vaughan, M.; Zhang, Q.; Shinozuka, Y.; Russell, P.B.; Livingston, J.M.; Kacenelenbogen, M.S.; Remer, L.A. The Comparison of MODIS-Aqua (C5) and CALIOP (v2 & V3) Aerosol Optical Depth. Atmos. Chem. Phys. 2012, 12, 3025–3043. [Google Scholar] [CrossRef]
  61. Mann, H.B. Nonparametric Tests against Trend. Econometrica 1945, 13, 245. [Google Scholar] [CrossRef]
  62. Kendall, M.G. Rank Correlation Methods. Biometrika 1957, 44, 298. [Google Scholar] [CrossRef]
  63. Güçlü, Y.S. Multiple Şen-Innovative Trend Analyses and Partial Mann-Kendall Test. J. Hydrol. 2018, 566, 685–704. [Google Scholar] [CrossRef]
  64. Yue, S.; Wang, C.Y. Applicability of Prewhitening to Eliminate the Influence of Serial Correlation on the Mann-Kendall Test. Water Resour. Res. 2002, 38, 4-1–4-7. [Google Scholar] [CrossRef]
  65. Hamed, K.H.; Ramachandra Rao, A. A Modified Mann-Kendall Trend Test for Autocorrelated Data. J. Hydrol. 1998, 204, 182–196. [Google Scholar] [CrossRef]
  66. Otero, P.; Cabrero, Á.; Alonso-Pérez, F.; Gago, J.; Nogueira, E. Temperature and Salinity Trends in the Northern Limit of the Canary Current Upwelling System. Sci. Total Environ. 2023, 901, 165791. [Google Scholar] [CrossRef] [PubMed]
  67. Güçlü, Y.S. Improved Visualization for Trend Analysis by Comparing with Classical Mann-Kendall Test and ITA. J. Hydrol. 2020, 584, 124674. [Google Scholar] [CrossRef]
  68. Wang, J. Determining the Most Accurate Program for the Mann-Kendall Method in Detecting Climate Mutation. Theor. Appl. Climatol. 2020, 142, 847–854. [Google Scholar] [CrossRef]
  69. Omar, A.H.; Winker, D.M.; Tackett, J.L.; Giles, D.M.; Kar, J.; Liu, Z.; Vaughan, M.A.; Powell, K.A.; Trepte, C.R. CALIOP and AERONET Aerosol Optical Depth Comparisons: One Size Fits None. J. Geophys. Res. Atmos. 2013, 118, 4748–4766. [Google Scholar] [CrossRef]
  70. Kanitz, T.; Ansmann, A.; Foth, A.; Seifert, P.; Wandinger, U.; Engelmann, R.; Baars, H.; Althausen, D.; Casiccia, C.; Zamorano, F. Surface Matters: Limitations of CALIPSO v3 Aerosol Typing in Coastal Regions. Atmos. Meas. Tech. 2014, 7, 2061–2072. [Google Scholar] [CrossRef]
  71. Toth, T.D.; Campbell, J.C.; Reid, J.S.; Tackett, J.; Vaughan, M.A.; Zhang, J.; Marquis, J.W. Minimum Aerosol Layer Detection Sensitivities and Their Subsequent Impacts on Aerosol Optical Thickness Retrievals in CALIPSO Level 2 Data Products. Atmos. Meas. Tech. 2018, 11, 499–514. [Google Scholar] [CrossRef]
  72. Smolyakov, B.S.; Makarov, V.I.; Shinkorenko, M.P.; Popova, S.A.; Bizin, M.A. Effects of Siberian Wildfires on the Chemical Composition and Acidity of Atmospheric Aerosols of Remote Urban, Rural and Background Territories. Environ. Pollut. 2014, 188, 8–16. [Google Scholar] [CrossRef] [PubMed]
  73. Zhuravleva, T.B.; Kabanov, D.M.; Nasrtdinov, I.M.; Russkova, T.V.; Sakerin, S.M.; Smirnov, A.; Holben, B.N. Radiative Characteristics of Aerosol during Extreme Fire Event over Siberia in Summer 2012. Atmos. Meas. Tech. 2017, 10, 179–198. [Google Scholar] [CrossRef]
  74. Xie, Y.; Li, Z.; Li, L.; Wagener, R.; Abboud, I.; Li, K.; Li, D.; Zhang, Y.; Chen, X.; Xu, H. Aerosol Optical, Microphysical, Chemical and Radiative Properties of High Aerosol Load Cases over the Arctic Based on AERONET Measurements. Sci. Rep. 2018, 8. [Google Scholar] [CrossRef] [PubMed]
  75. Willis, M.D.; Leaitch, W.R.; Abbatt, J.P.D. Processes Controlling the Composition and Abundance of Arctic Aerosol. Rev. Geophys. 2018, 56, 621–671. [Google Scholar] [CrossRef]
  76. Allen, R.J.; Sherwood, S.C. The Impact of Natural versus Anthropogenic Aerosols on Atmospheric Circulation in the Community Atmosphere Model. Clim. Dyn. 2010, 36, 1959–1978. [Google Scholar] [CrossRef]
  77. Dagsson-Waldhauserova, P.; Renard, J.-B.; Olafsson, H.; Vignelles, D.; Berthet, G.; Verdier, N.; Duverger, V. Vertical Distribution of Aerosols in Dust Storms during the Arctic Winter. Sci. Rep. 2019, 9, 16122. [Google Scholar] [CrossRef]
  78. Groot, C.D.; Grythe, H.; Skov, H.; Stohl, A. Substantial Contribution of Northern High-Latitude Sources to Mineral Dust in the Arctic. J. Geophys. Res. Atmos. 2016, 121, 13678–13697. [Google Scholar] [CrossRef]
  79. Chen, Q.; Mirrielees, J.A.; Thanekar, S.; Loeb, N.; Kirpes, R.M.; Upchurch, L.; Barget, A.J.; Lata, N.N.; Raso, W.; McNamara, S.; et al. Atmospheric Particle Abundance and Sea Salt Aerosol Observations in the Springtime Arctic: A Focus on Blowing Snow and Leads. Atmos. Chem. Phys. 2022, 22, 15263–15285. [Google Scholar] [CrossRef]
  80. Haque, M.M.; Kawamura, K.; Deshmukh, D.K.; Kunwar, B.; Kim, Y. Biomass Burning Is an Important Source of Organic Aerosols in Interior Alaska. J. Geophys. Res. Atmos. 2021, 126, e2021JD034586. [Google Scholar] [CrossRef]
  81. Kim, M.-H.; Omar, A.H.; Tackett, J.L.; Vaughan, M.A.; Winker, D.M.; Trepte, C.R.; Hu, Y.; Liu, Z.; Poole, L.R.; Pitts, M.C.; et al. The CALIPSO Version 4 Automated Aerosol Classification and Lidar Ratio Selection Algorithm. Atmos. Meas. Tech. 2018, 11, 6107–6135. [Google Scholar] [CrossRef] [PubMed]
  82. Hansen, A.K.; Kristensen, K.; Nguyen, Q.T.; Zare, A.; Cozzi, F.; Nøjgaard, J.K.; Skov, H.; Brandt, J.; Christensen, J.H.; Ström, J.; et al. Organosulfates and Organic Acids in Arctic Aerosols: Speciation, Annual Variation and Concentration Levels. Atmos. Chem. Phys. 2014, 14, 7807–7823. [Google Scholar] [CrossRef]
  83. Huang, Z.; Huang, J.; Hayasaka, T.; Wang, S.; Zhou, T.; Jin, H. Short-Cut Transport Path for Asian Dust Directly to the Arctic: A Case Study. Environ. Res. Lett. 2015, 10, 114018. [Google Scholar] [CrossRef]
  84. Lambert, F.; Kug, J.-S.; Park, R.J.; Mahowald, N.; Winckler, G.; Abe-Ouchi, A.; O’ishi, R.; Takemura, T.; Lee, J.-H. The Role of Mineral-Dust Aerosols in Polar Temperature Amplification. Nat. Clim. Change 2013, 3, 487–491. [Google Scholar] [CrossRef]
  85. Cao, Y.; Yin, M.; Tian, J.; Liang, S. Increased Summertime Wildfire as a Major Driver of the Clear-Sky Dimming in the Siberian Arctic from 2000 to 2020. Atmos. Res. 2024, 306, 107458. [Google Scholar] [CrossRef]
  86. Kirpes, R.M.; Bonanno, D.; May, N.W.; Fraund, M.; Barget, A.; Moffet, R.C.; Ault, A.P.; Pratt, K.A. Wintertime Arctic Sea Spray Aerosol Composition Controlled by Sea Ice Lead Microbiology. ACS Cent. Sci. 2019, 5, 1760–1767. [Google Scholar] [CrossRef]
  87. Moschos, V.; Schmale, J.; Aas, W.; Becagli, S.; Calzolai, G.; Eleftheriadis, K.; Moffett, C.E.; Schnelle-Kreis, J.; Severi, M.; Sharma, S.; et al. Elucidating the Present-Day Chemical Composition, Seasonality and Source Regions of Climate-Relevant Aerosols across the Arctic Land Surface. Environ. Res. Lett. 2022, 17, 034032. [Google Scholar] [CrossRef]
  88. Breider, T.J.; Mickley, L.J.; Jacob, D.J.; Wang, Q.; Fisher, J.A.; Chang, R.Y.-W.; Alexander, B. Annual Distributions and Sources of Arctic Aerosol Components, Aerosol Optical Depth, and Aerosol Absorption. J. Geophys. Res. Atmos. 2014, 119, 4107–4124. [Google Scholar] [CrossRef]
  89. Raif, E.N.; Barr, S.L.; Tarn, M.D.; McQuaid, J.B.; Daily, M.I.; Abel, S.J.; Barrett, P.A.; Bower, K.N.; Field, P.R.; Carslaw, K.S.; et al. High Ice-Nucleating Particle Concentrations Associated with Arctic Haze in Springtime Cold-Air Outbreaks. EGUsphere 2024, Preprint. [Google Scholar] [CrossRef]
  90. Omar, A.; Winker, D.M.; Vaughan, M.A.; Hu, Y.; Trepte, C.R.; Ferrare, R.; Lee, K.-P.; Hostetler, C.A.; Kittaka, C.; Rogers, R.R.; et al. The CALIPSO Automated Aerosol Classification and Lidar Ratio Selection Algorithm. J. Atmos. Ocean. Technol. 2009, 26, 1994–2014. [Google Scholar] [CrossRef]
  91. Browse, J.; Carslaw, K.S.; Mann, G.W.; Birch, C.E.; Arnold, S.R.; Leck, C. The Complex Response of Arctic Aerosol to Sea-Ice Retreat. Atmos. Chem. Phys. 2014, 14, 7543–7557. [Google Scholar] [CrossRef]
  92. Bowen, M.; Vincent, R.F. An Assessment of the Spatial Extent of Polar Dust Using Satellite Thermal Data. Sci. Rep. 2021, 11, 901. [Google Scholar] [CrossRef] [PubMed]
  93. Zheng, Y.; Zhang, Q.; Tong, D.; Davis, S.J.; Caldeira, K. Climate Effects of China’s Efforts to Improve Its Air Quality. Environ. Res. Lett. 2020, 15, 104052. [Google Scholar] [CrossRef]
  94. Zamora, L.M.; Kahn, R.A.; Evangeliou, N.; Groot, C.D.; Huebert, K.B. Comparisons between the Distributions of Dust and Combustion Aerosols in MERRA-2, FLEXPART, and CALIPSO and Implications for Deposition Freezing over Wintertime Siberia. Atmos. Chem. Phys. 2022, 22, 12269–12285. [Google Scholar] [CrossRef]
  95. Hidy, G.M.; Mohnen, V.; Blanchard, C.L. Tropospheric Aerosols: Size-Differentiated Chemistry and Large-Scale Spatial Distributions. J. Air Waste Manag. Assoc. 2013, 63, 377–404. [Google Scholar] [CrossRef]
  96. Deng, C.; Brooks, S.D.; Vidaurre, G.; Thornton, D.C.O. Using Raman Microspectroscopy to Determine Chemical Composition and Mixing State of Airborne Marine Aerosols over the Pacific Ocean. Aerosol Sci. Technol. 2013, 48, 193–206. [Google Scholar] [CrossRef]
  97. Coogan, S.C.P.; Cai, X.; Jain, P.; Flannigan, M.D. Seasonality and Trends in Human- and Lightning-Caused Wildfires ≥ 2ha in Canada, 1959–2018. Int. J. Wildland Fire 2020, 29, 473–485. [Google Scholar] [CrossRef]
  98. Pernov, J.; Beddows, D.; Thomas, D.C.; Dall’Osto, M.; Harrison, R.M.; Schmale, J.; Skov, H.; Maßling, A. Increased Aerosol Concentrations in the High Arctic Attributable to Changing Atmospheric Transport Patterns. Npj Clim. Atmos. Sci. 2022, 5, 62. [Google Scholar] [CrossRef]
  99. Das, S.; Colarco, P.R.; Oman, L.D.; Taha, G.; Torres, O. The Long-Term Transport and Radiative Impacts of the 2017 British Columbia Pyrocumulonimbus Smoke Aerosols in the Stratosphere. Atmos. Chem. Phys. 2021, 21, 12069–12090. [Google Scholar] [CrossRef]
  100. Zhao, X.; Huang, K.; Fu, J.S.; Abdullaev, S.F. Long-Range Transport of Asian Dust to the Arctic: Identification of Transport Pathways, Evolution of Aerosol Optical Properties, and Impact Assessment on Surface Albedo Changes. Atmos. Chem. Phys. 2022, 22, 10389–10407. [Google Scholar] [CrossRef]
  101. Shi, Y.; Liu, X.; Wu, M.; Zhao, X.; Ke, Z.; Brown, H. Relative Importance of High-Latitude Local and Long-Range-Transported Dust for Arctic Ice-Nucleating Particles and Impacts on Arctic Mixed-Phase Clouds. Atmos. Chem. Phys. 2022, 22, 2909–2935. [Google Scholar] [CrossRef]
  102. Di Pierro, M.; Jaeglé, L.; Anderson, T.L. Satellite Observations of Aerosol Transport from East Asia to the Arctic: Three Case Studies. Atmos. Chem. Phys. 2011, 11, 2225–2243. [Google Scholar] [CrossRef]
  103. Bullard, J.E.; Mockford, T. Seasonal and Decadal Variability of Dust Observations in the Kangerlussuaq Area, West Greenland. Arct. Antarct. Alp. Res. 2018, 50, S100011. [Google Scholar] [CrossRef]
  104. Kawai, K.; Matsui, H.; Tobo, Y. Dominant Role of Arctic Dust with High Ice Nucleating Ability in the Arctic Lower Troposphere. Geophys. Res. Lett. 2023, 50, e2022GL102470. [Google Scholar] [CrossRef]
  105. Gorter, W.; van Angelen, J.H.; Lenaerts, J.T.M.; van den Broeke, M.R. Present and Future Near-Surface Wind Climate of Greenland from High Resolution Regional Climate Modelling. Clim. Dyn. 2013, 42, 1595–1611. [Google Scholar] [CrossRef]
  106. Popovicheva, O.; Diapouli, E.; Makshtas, A.; Shonija, N.K.; Manousakas, M.; Saraga, D.; Uttal, T.; Eleftheriadis, K. East Siberian Arctic Background and Black Carbon Polluted Aerosols at HMO Tiksi. Sci. Total Environ. 2019, 655, 924–938. [Google Scholar] [CrossRef]
  107. Thomas, M.A.; Devasthale, A.; Tjernström, M.; Ekman, A.M.L. The Relation between Aerosol Vertical Distribution and Temperature Inversions in the Arctic in Winter and Spring. Geophys. Res. Lett. 2019, 46, 2836–2845. [Google Scholar] [CrossRef]
  108. Luo, B.; Luo, D.; Dai, A.; Xiao, C.; Simmonds, I.; Hanna, E.; Overland, J.; Shi, J.; Chen, X.; Yao, Y.; et al. Rapid Summer Russian Arctic Sea-Ice Loss Enhances the Risk of Recent Eastern Siberian Wildfires. Nat. Commun. 2024, 15, 5399. [Google Scholar] [CrossRef]
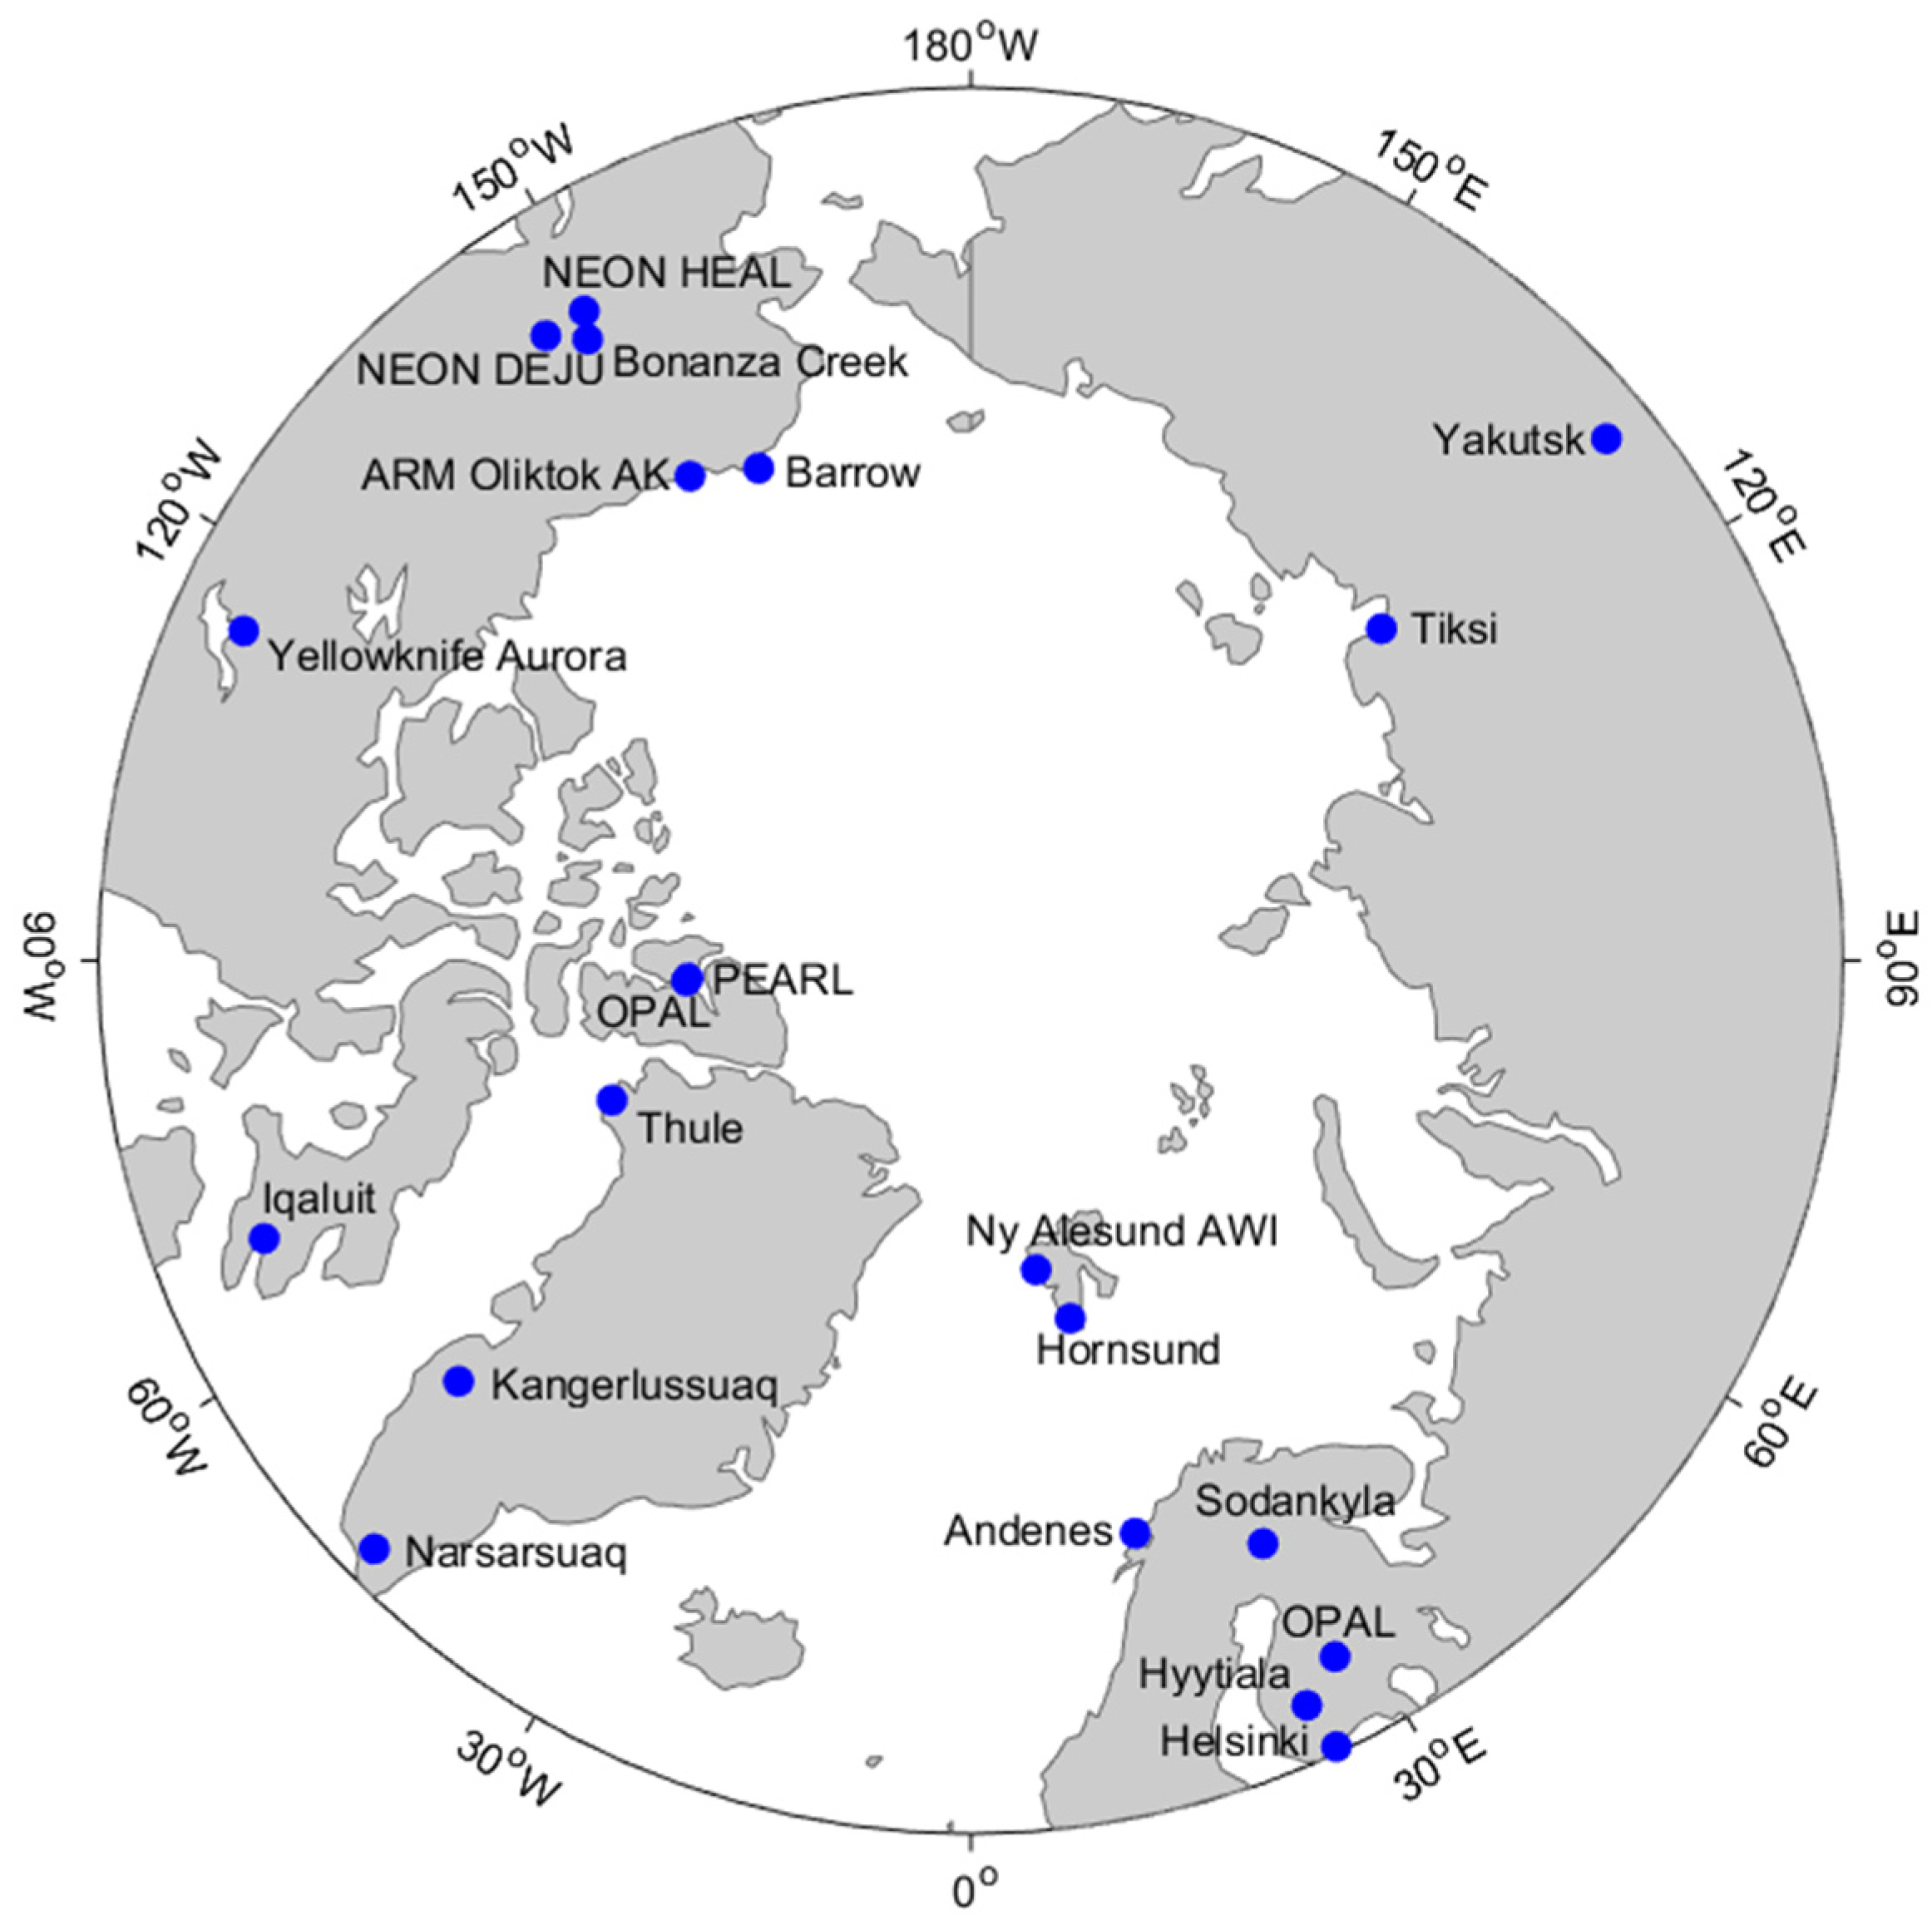
Figure 1. Spatial distribution of the AERONET stations in the region of interest.
Remotesensing 17 00903 g001
Figure 2. Scatterplot comparing CALIOP and AERONET AOD over the Arctic during 2006–2021. The dashed line represents the 1:1 line, while the red line represents the fitted line.
Remotesensing 17 00903 g002
Figure 3. (a) Monthly mean AOD from CALIOP and AERONET, (b) correlation coefficient between monthly mean AOD from CALIOP and AERONET, and (c) monthly RMSE and (d) RMB of CALIOP against AERONET AOD over the Arctic during 2006–2021.
Remotesensing 17 00903 g003
Figure 4. Spatial distributions of seasonal mean AOD over the Arctic during 2006–2021.
Remotesensing 17 00903 g004
Figure 5. Average proportions of seven different types of aerosols over the Arctic during 2006–2021.
Remotesensing 17 00903 g005
Figure 6. Average proportions of all types of Arctic aerosols in different seasons during 2006–2021.
Remotesensing 17 00903 g006
Figure 7. M-K trend analysis results (including Z value, time series of UF and UB values) of FoOs of (a) CM, (b) dust, (c) PC, (d) PD, (e) ES, and (f) DM during 2006–2021. Dashed lines represent the confidence intervals for UF values at the 95% significance level or greater.
Remotesensing 17 00903 g007
Figure 8. Vertical profiles of mean FoOs of different types of aerosols over the Arctic in each season during 2006–2021.
Remotesensing 17 00903 g008
Figure 9. Horizontal distribution of the most dominant aerosol types at different altitude ranges over the Arctic in each season during 2006–2021.
Remotesensing 17 00903 g009
Figure 10. Three-dimensional structure of dust in spring over GLZ during 2006–2021, with each latitude–vertical cross-section made along the longitudes at 10° intervals (top panel), and each longitude–vertical cross-section made along the latitudes at 10° intervals (bottom panel).
Remotesensing 17 00903 g010
Figure 11. Same as Figure 10 but for the three-dimensional structure of PD in spring over ESZ during 2006–2021.
Remotesensing 17 00903 g011
Figure 12. Same as Figure 11 but for the three-dimensional structure of ES in summer over MSZ during 2006–2021.
Remotesensing 17 00903 g012
Table 1. Data attributes for CALIOP AOD.
ParameterValue Range
Feature Optical Depth 532 Uncertainty0~0.1
Feature Classification Flags3
CAD Score−100~−70
Extinction QC 5320,1
Table 2. Correlation coefficient between CALIOP and AERONET AOD, as well as RMSE and RMB compared with AERONET AOD at individual stations over the Arctic during 2006–2021.
SitesRRMSERMBN
OPAL0.7200.0861.06531
Andenes0.9210.0360.05362
ARM Oliktok AK0.2500.0881.3998
Barrow0.7250.0740.56327
Bonanza Creek0.8100.0840.48939
Helsinki0.9440.0220.77638
Hyytiala0.8200.0560.69034
Iqaluit0.9350.0170.93223
Kangerlussuaq0.5770.0380.70078
Sodankyla0.5300.0890.73624
Thule0.9640.0320.47828
Tiksi0.8750.0520.34111
Yakutsk0.4150.1490.72277
Yellowknife Aurora0.5600.0630.67770
NEON DEJU0.1590.0450.45013
NEON HEAL0.9540.0210.65721
Hornsund0.5430.0560.54234
Narsarsuaq0.6930.0771.3837
Ny Alesund AWI0.8360.0151.0628
PEARL0.5890.0371.10145
Kuopio0.6710.0371.07843
Disclaimer/Publisher’s Note: The statements, opinions and data contained in all publications are solely those of the individual author(s) and contributor(s) and not of MDPI and/or the editor(s). MDPI and/or the editor(s) disclaim responsibility for any injury to people or property resulting from any ideas, methods, instructions or products referred to in the content.