
Land Reclamation in the Mississippi River Delta


Abstract
1. Introduction
2. Methods
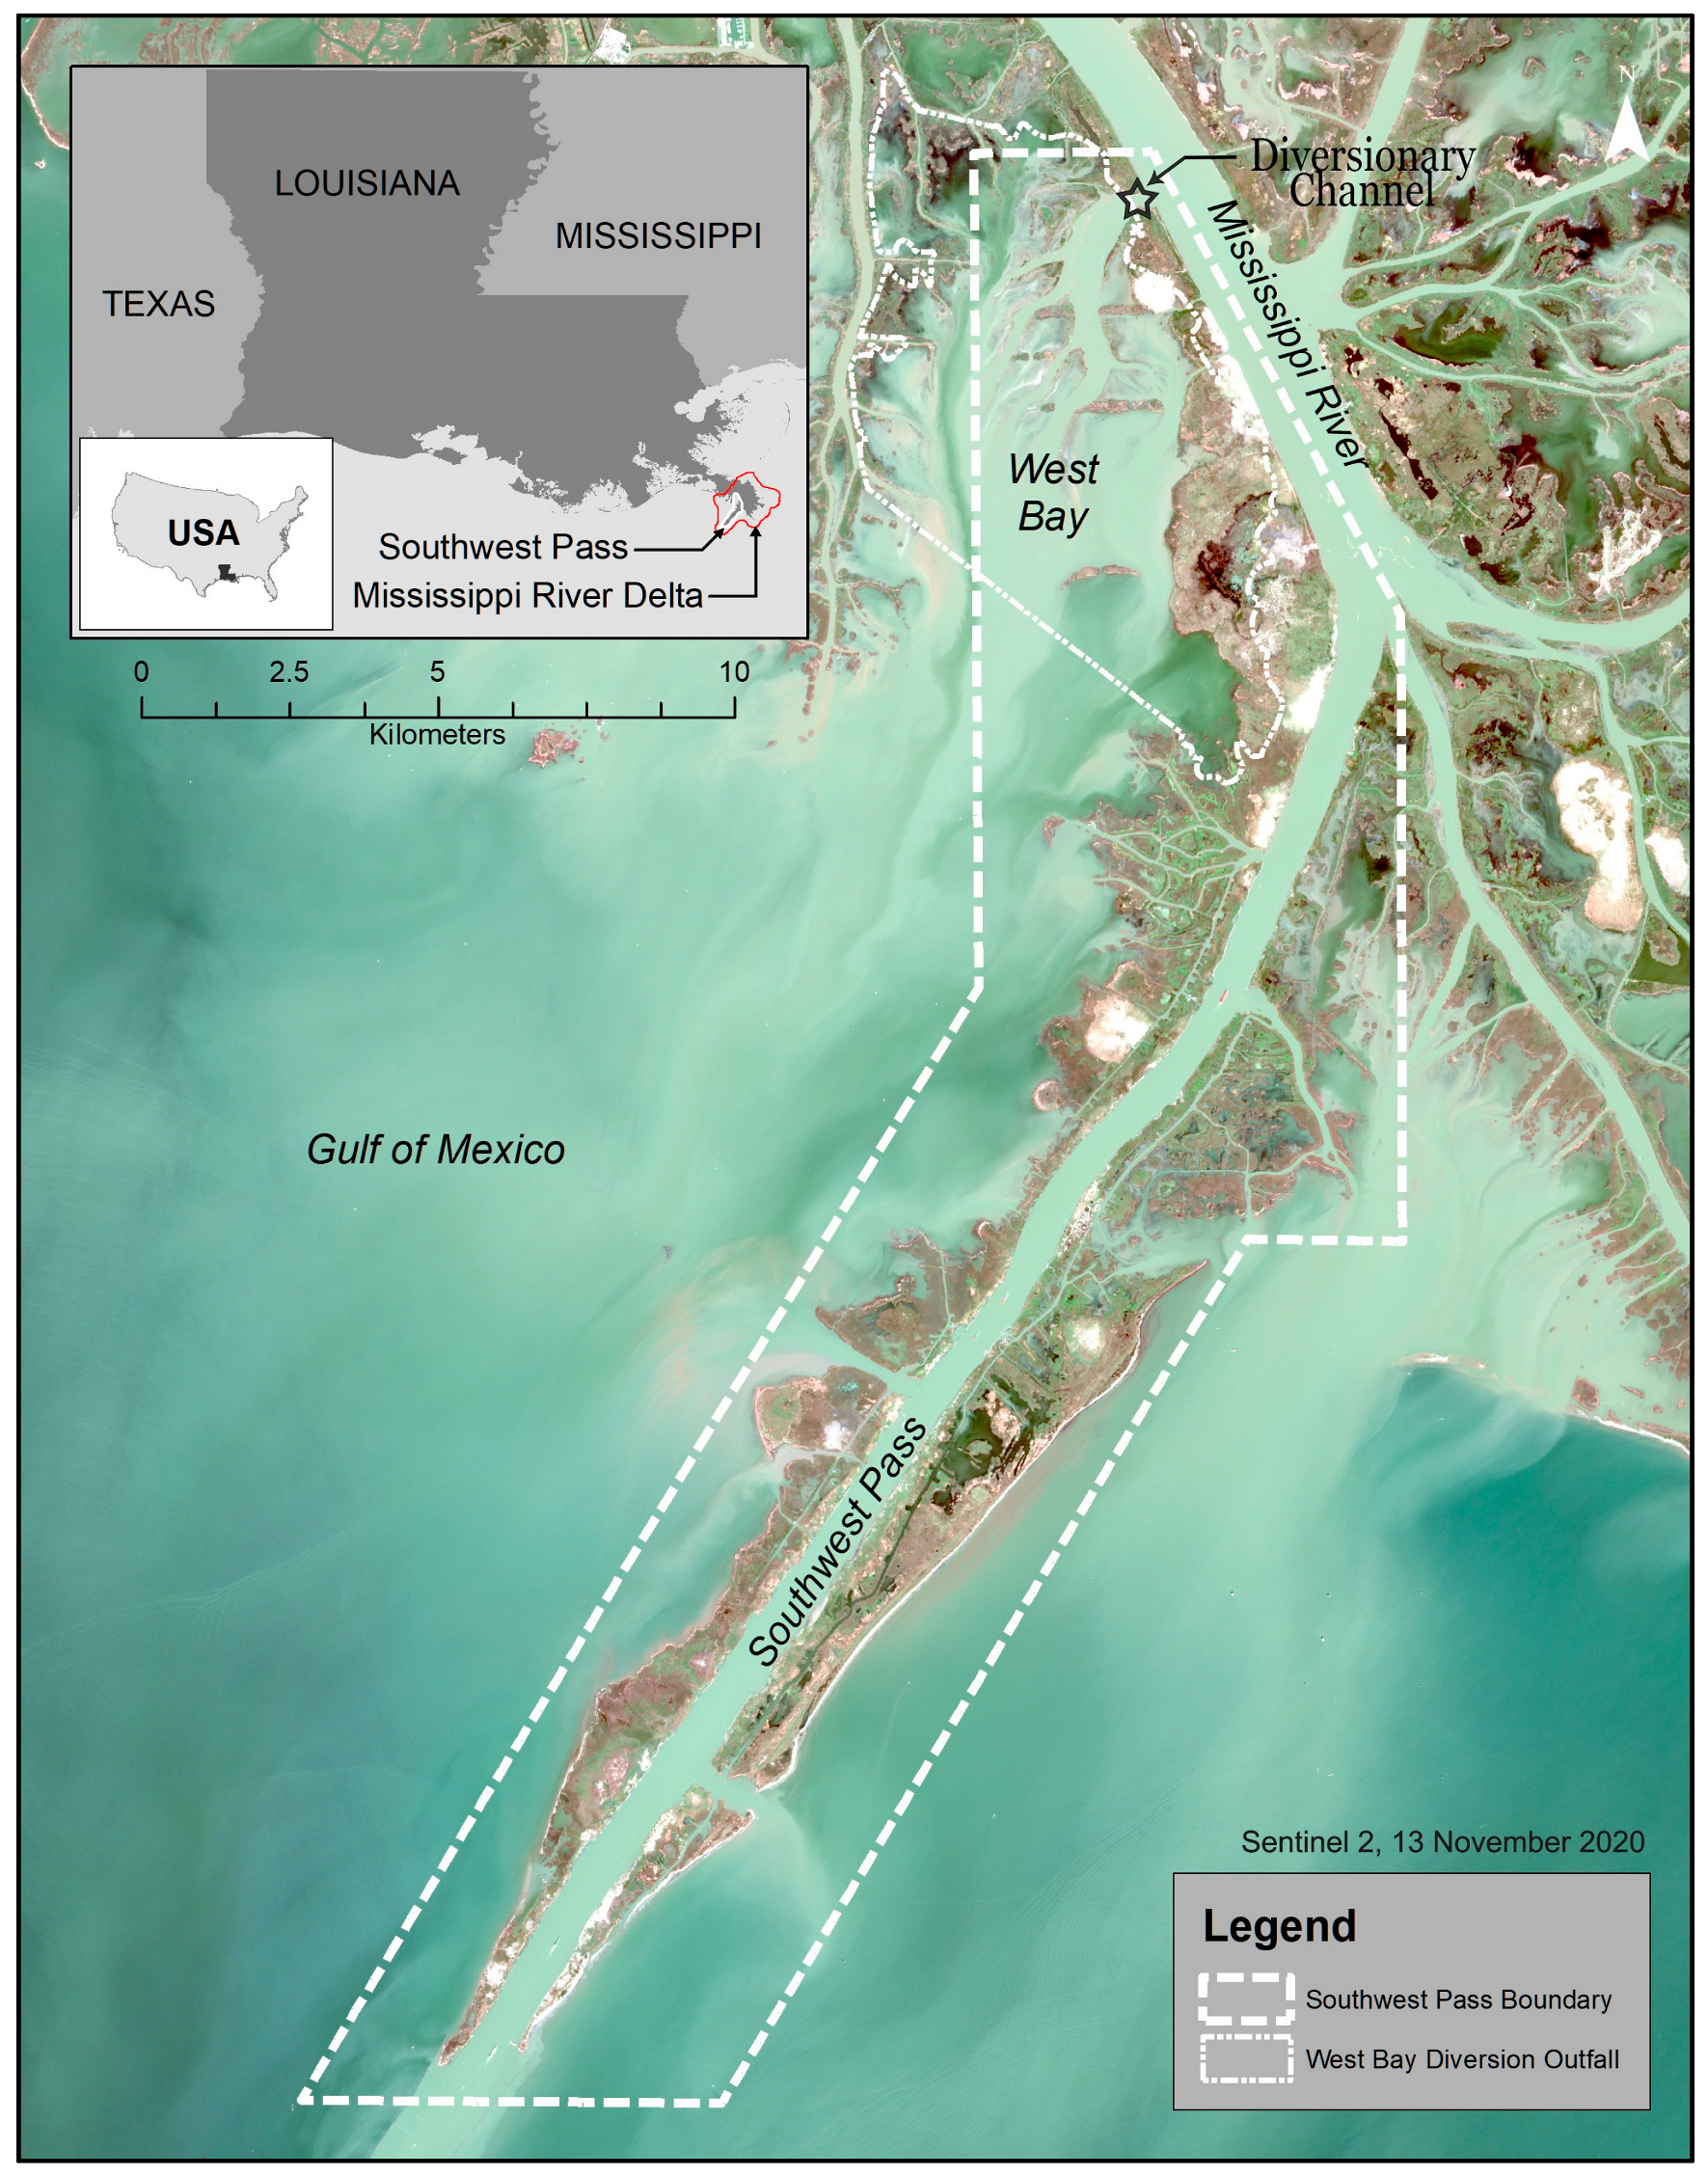
2.1. Study Area
2.2. Dredging Activities
2.3. Wetland Change Analysis
2.4. Land Change Assessments
2.4.1. Historical Period
2.4.2. BUDM and Reclamation Periods
2.5. Land Cover Classification
2.6. Landscape Metrics
3. Results
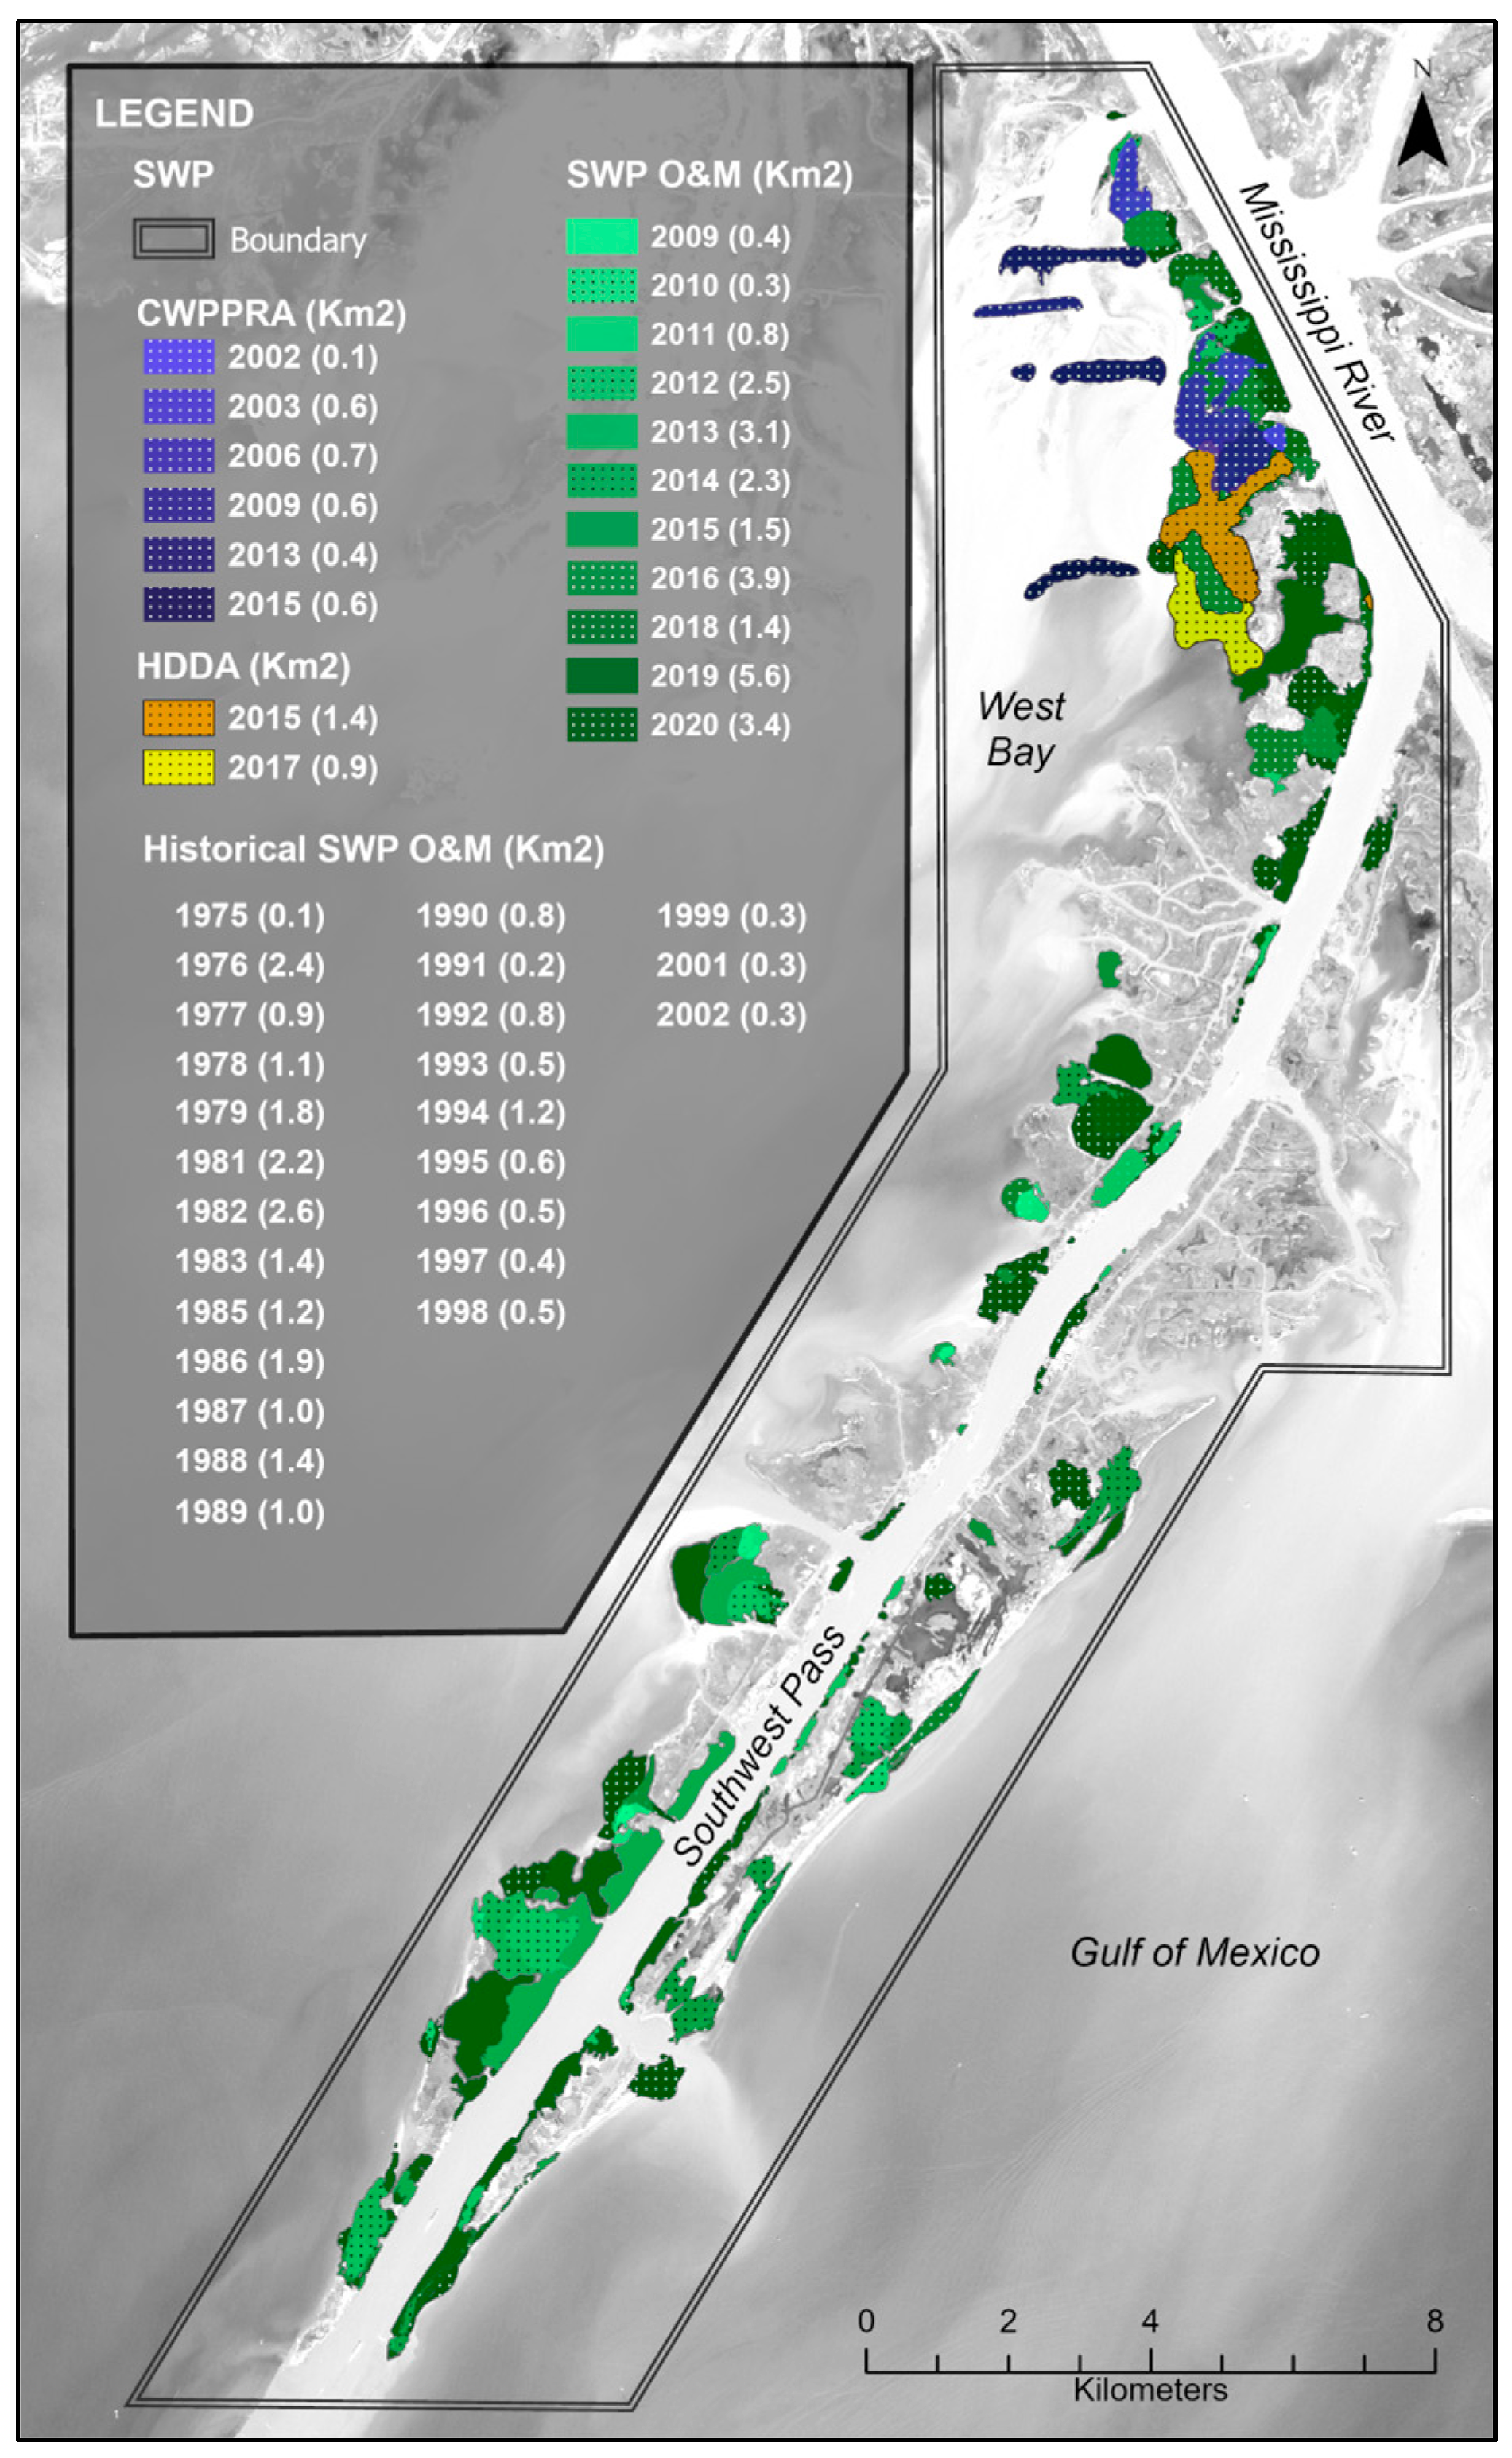
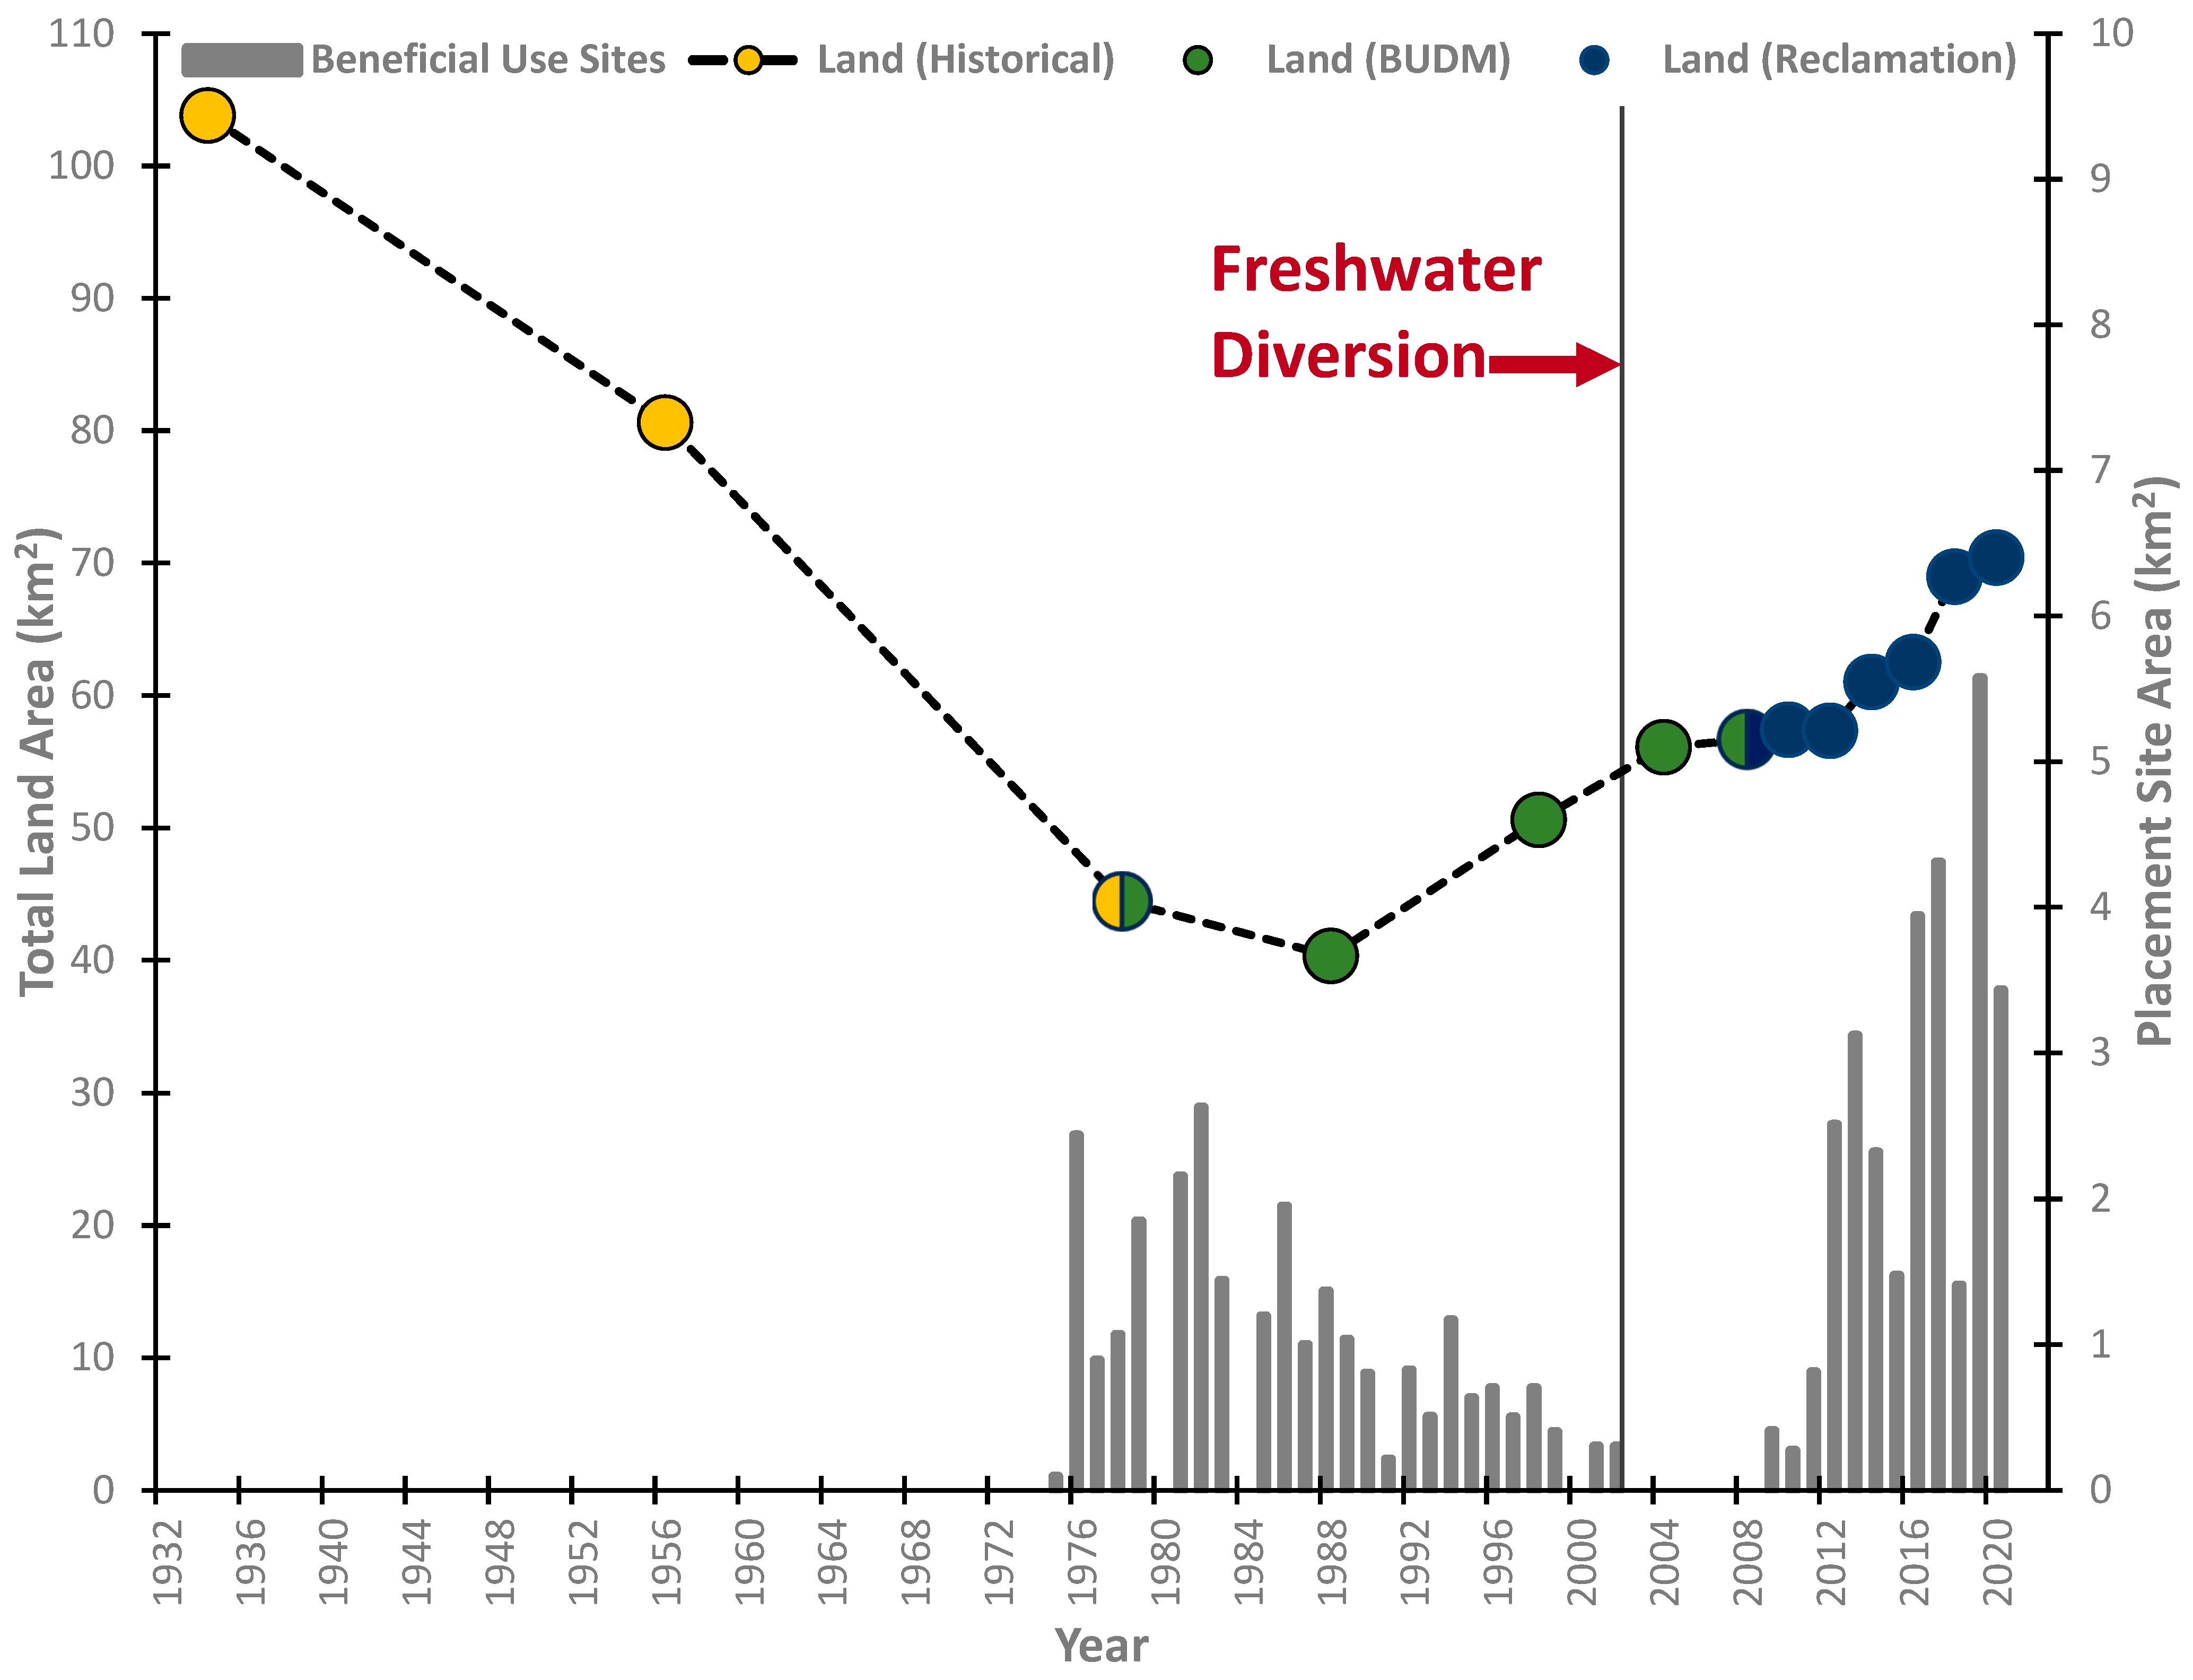
3.1. Dredging and Placement Activities
3.2. Land Cover Assessment
3.3. Landscape Metric Assessment
3.4. Long-Term Land Change
3.4.1. Land Change–Temporal Analysis
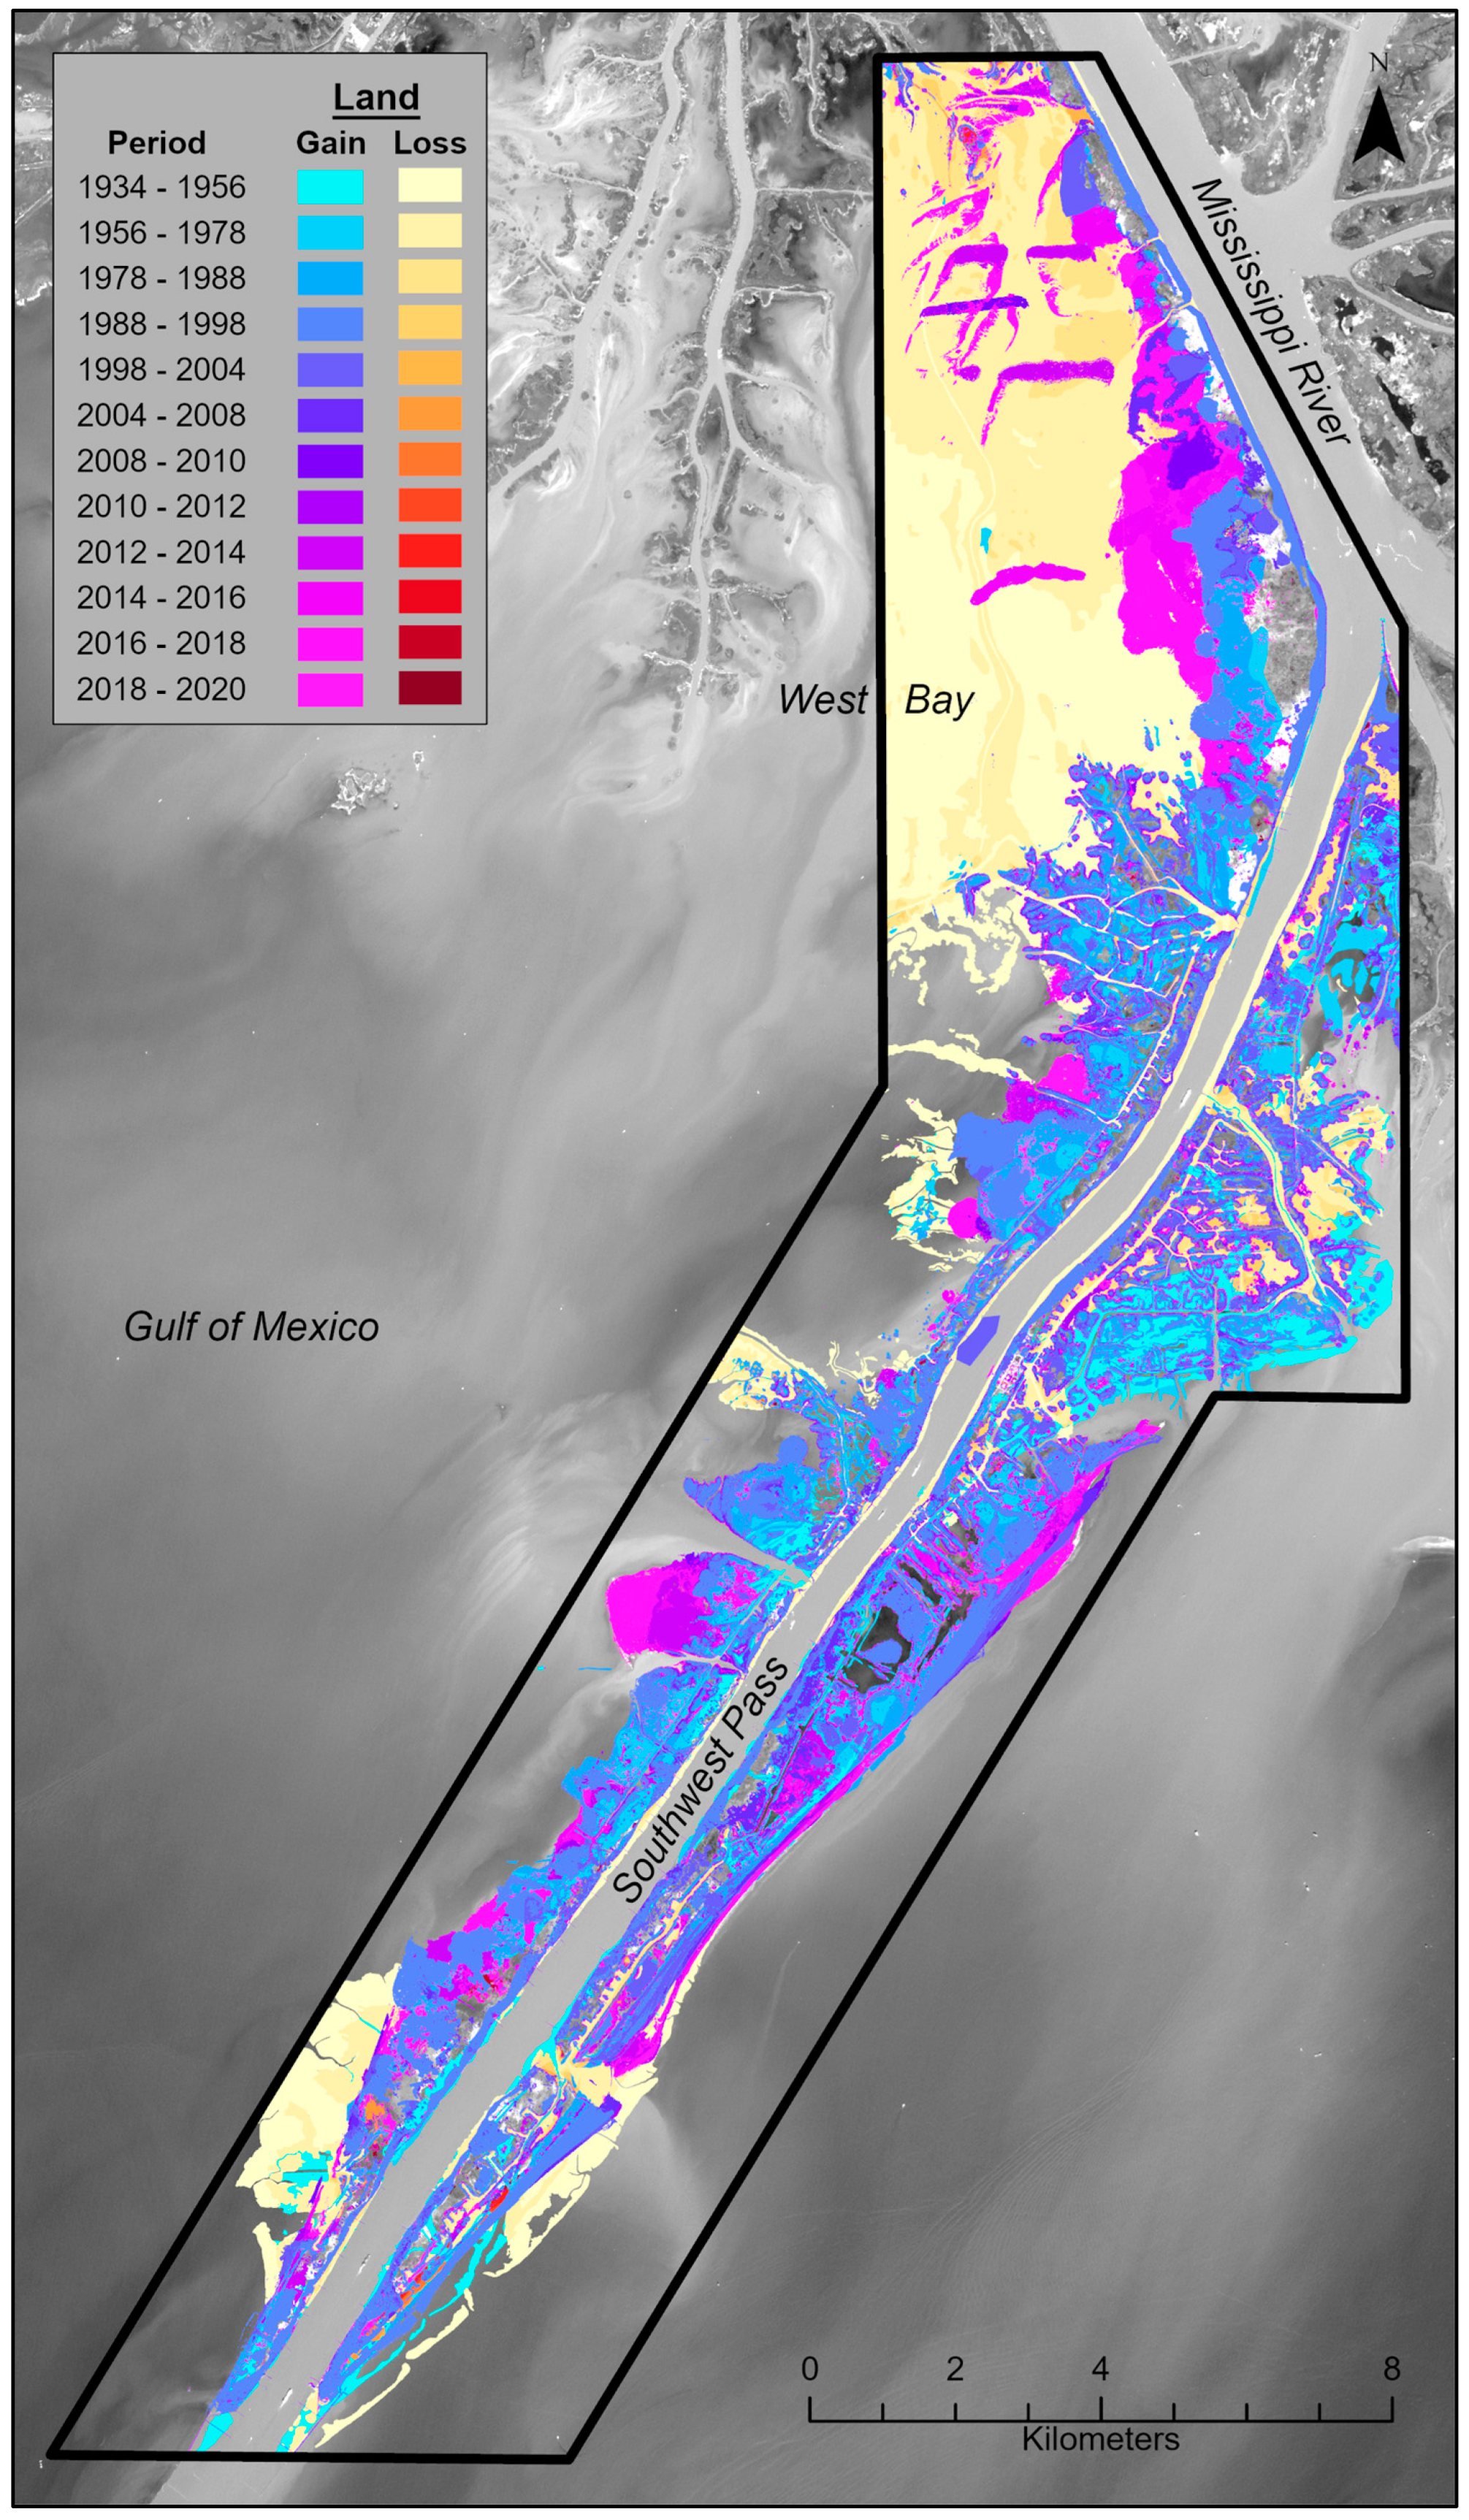
3.4.2. Land Change–Spatial Analysis
4. Discussions
5. Conclusions
Author Contributions
Funding
Data Availability Statement
Acknowledgments
Conflicts of Interest
List of Abbreviations
| Abbreviation | Definition |
| BUMP | Beneficial Use Monitoring Program |
| BUDM | Beneficial Use of Dredged Material |
| BUDMAT | Beneficial Use of Dredged Material Program |
| CART | Classification And Regression Tree |
| CWPPRA | Coastal Wetlands Planning, Protection, and Restoration Act |
| DOQQ | Digital Orthophoto Quarter Quadrangle |
| FRAGSTATS | Fragmentation Analysis |
| HDDA | Hopper Dredge Disposal Area |
| LCA | Louisiana Coastal Area |
| LOSCO | Louisiana Oil Spill Coordinator’s Office |
| MLG | Mean Low Gulf |
| MRC | Mississippi River Commission |
| MRD | Mississippi River Delta |
| NLCD | National Land Cover Dataset |
| NWI | National Wetland Inventory |
| O&M | Operations and Maintenance |
| SWP | Southwest Pass |
| USACE | United States Army Corps of Engineers |
| USCGS | United States Coastal and Geodetic Survey |
| USGS | United States Geological Survey |
References
- IADC: International Association of Dredging Companies. Dredging in Figures 2018. 2018, pp. 1–13. Available online: https://www.iadc-dredging.com/publication/dredging-in-figures-2018/ (accessed on 13 December 2023).
- Sengupta, D.; Choi, Y.R.; Tian, B.; Brown, S.; Meadows, M.; Hackney, C.R.; Banerjee, A.; Li, Y.; Chen, R.; Zhou, Y. Mapping 21st century global coastal land reclamation. Earth’s Future 2023, 11, e2022EF002927. [Google Scholar] [CrossRef]
- Shepard, W. Cities from the sea: The true cost of reclaimed land. The Guardian, 2 May 2018; p. 2. [Google Scholar]
- Wang, W.; Liu, H.; Li, Y.; Su, J. Development and management of land reclamation in China. Ocean Coast. Manag. 2014, 102, 415–425. [Google Scholar] [CrossRef]
- Erwin, K.L. Wetlands and global climate change: The role of wetland restoration in a changing world. Wetl. Ecol. Manag. 2009, 17, 71–84. [Google Scholar] [CrossRef]
- Griggs, G.; Reguero, B.G. Coastal adaptation to climate change and sea-level rise. Water 2021, 13, 2151. [Google Scholar] [CrossRef]
- Li, X.; Bellerby, R.; Craft, C.; Widney, S.E. Coastal wetland loss, consequences, and challenges for restoration. Anthr. Coasts 2018, 1, 1–15. [Google Scholar] [CrossRef]
- Murray, N.J.; Worthington, T.A.; Bunting, P.; Duce, S.; Hagger, V.; Lovelock, C.E.; Lucas, R.; Saunders, M.I.; Sheaves, M.; Spalding, M.; et al. High-resolution mapping of losses and gains of Earth’s tidal wetlands. Science 2022, 376, 744–749. [Google Scholar] [CrossRef] [PubMed]
- Allen, M. Cities Are Rapidly Reclaiming Land at Risk of Extreme SeaLevel Rise. Coastal Science and Societies, Hakai Magazine, 24 April 2023. [Google Scholar]
- Pratolongo, P.D.; Kirby, J.R.; Plater, A.; Brinson, M.M. Temperate coastal wetlands: Morphology, sediment processes, and plant communities. In Coastal Wetlands: An Integrated Ecosystem Approach; Elsevier: Amsterdam, The Netherlands, 2009; pp. 337–396. [Google Scholar]
- Batker, D.; de la Torre, I.; Costanza, R.; Swedeen, P.; Day, J.; Boumans, R.; Bagstad, K. Gaining Ground: Wetlands, Hurricanes, and the Economy: The Value of Restoring the Mississippi River Delta. Earth Economics Project Report; Earth Economics: Tacoma, WA, USA, 2010. [Google Scholar]
- Day, J.W.; Bailey, C.; Batker, D.; Bentley, S.; Cable, J.; Costanza, R.; Cowan, J.; Deegan, L.; Freeman, A.; Giosan, L.; et al. Answering 10 Fundamental Questions about the Mississippi River Delta; Mississippi River Delta Science and Engineering Special Team: New Orleans, LA, USA, 2012. [Google Scholar]
- Coleman, J.M.; Roberts, H.H.; Stone, G.W. Mississippi River Delta: An overview. J. Coast. Res. 1998, 14, 699–716. [Google Scholar]
- White, D.A. Vascular plant community development on mudflats in the Mississippi River delta, Louisiana, USA. Aquat. Bot. 1993, 45, 171–194. [Google Scholar] [CrossRef]
- Day, J.W.; Britsch, L.D.; Hawes, S.R.; Shaffer, G.P.; Reed, D.J.; Cahoon, D. Pattern and process of land loss in the Mississippi Delta: A spatial and temporal analysis of wetland habitat change. Estuaries Coasts 2000, 23, 425. [Google Scholar] [CrossRef]
- Penland, S.; Roberts, H.H.; Williams, S.J.; Sallenger, A.H., Jr.; Cahoon, D.R.; Davis, D.W.; Groat, C.G. Coastal Land Loss in Louisiana. Gulf Coast Assoc. Geol. Soc. Trans. 1990, 40, 685–699. [Google Scholar]
- Morton, R.A.; Bernier, J.C.; Barras, J.A.; Ferina, N.F. Rapid Subsidence and Historical Wetland Loss in the Mississippi Delta Plain: Likely Causes and Future Implications. U.S. Geological Survey: Reston, VA, USA, 2005. [Google Scholar]
- Couvillion, B.R.; Holly, B.; Donald, S.; Michelle, F. Land Area Change in Coastal Louisiana 1932 to 2016: U.S. Geological Survey Scientific Investigations Map 3381; pamphlet; U.S. Geological Survey: Reston, VA, USA, 2017; 16p. [CrossRef]
- Heimann, D.C.; Sprague, L.A.; Blevins, D.W. Trends in Suspended-Sediment Loads and Concentrations in the Mississippi River Basin, 1950–2009; Scientific Investigations Report 2011–5200; U.S. Geological Survey: Reston, VA, USA, 2011; 33p.
- Couvillion, B.R.; Barras, J.A.; Steyer, G.D.; Sleavin, W.; Fischer, M.; Beck, H.; Trahan, N.; Griffin, B.; Heckman, D. Land Area Change in Coastal Louisiana from 1932 to 2010; Scientific Investigations Map 3164, scale 1: 265,000; U.S. Geological Survey: Reston, VA, USA, 2011.
- Suir, G.M.; Jones, W.R.; Garber, A.L.; Barras, J.A. Pictorial account and landscape evolution of the crevasses near Fort St. Philip, Louisiana (No. 2); U.S. Army Corps of Engineers: Washington, DC, USA, 2014.
- Ganju, N.K.; Defne, Z.; Schwab, C.; Moorman, M. Horizontal Integrity a Prerequisite for Vertical Stability: Comparison of Elevation Change and the Unvegetated-Vegetated Marsh Ratio Across Southeastern USA Coastal Wetlands. Estuaries Coasts 2023, 47, 2135–2145. [Google Scholar] [CrossRef]
- Bowes, K.M.; White, J.R.; Maiti, K.; Meselhe, E. Surface water temperature impacts on coastal wetland denitrification: Implications for river reconnection. Sci. Total Environ. 2022, 828, 154397. [Google Scholar] [CrossRef]
- Pathak, A.; Glick, P.; Hansen, L.J.; Hilberg, L.E.; Ritter, J.; Stein, B.A. Incorporating Nature-Based Solutions into Community Climate Adaptation Planning; National Wildlife Federation and EcoAdapt: Washington, DC, USA, 2022. [Google Scholar]
- Penland, S.; Wayne, L.; Britsch, L.D.; Williams, S.J.; Beall, A.D.; Butterworth, V.C. Geomorphic Classification of Coastal Land Loss Between 1932 and 1990 in the Mississippi River Delta Plain, Southeastern Louisiana: Open-File Report 00-417; U.S. Geological Survey: Reston, VA, USA, 2001.
- U.S. Army Corps of Engineers. Dredging and Dredged Material Management; Engineer Manual 1110-2-5025; U.S. Army Corps of Engineers: Washington, DC, USA, 2015.
- Louisiana Coastal Wetlands Conservation and Restoration Task Force (LCWCRTF). The 1997 Evaluation Report to the US Congress on the Effectiveness of Louisiana Coastal Wetland Restoration Projects; Louisiana Department of Natural Resources: Baton Rouge, LA, USA, 1997; 76p.
- Hicks, B.; McCasland, E. Louisiana Coastal Area (LCA), Louisiana Beneficial Use of Dredged Material Program, Programmatic Study Report and Programmatic Environmental Impact Statement; U.S. Army Corps of Engineers: Washington, DC, USA, 2010.
- Childs, J.L. Managing Dredged Material for Beneficial Purpose. In Dredging Operations Technical Support (DOTS) Program Webinar; U.S. Geological Survey: Reston, VA, USA, 2013. [Google Scholar]
- Estes, T.J. Confined Disposal Facilities Function, Design, Management and Environmental Evaluation Procedures; U.S. Army Engineer Research and Development Center: Vicksburg, MS, USA, 2012.
- USACE. Beneficial Use of Dredged Material Program Vision Placemat; U.S. Army Corps of Engineers: Washington, DC, USA, 2022.
- USACE. Beneficial Uses of Dredged Material; EM 1110-2-5026; U.S. Army Corps of Engineers: Washington, DC, USA, 1987.
- USACE. Beneficial Uses of Dredged Sediment; Dredging Operations Technical Support Program; U.S. Army Engineer Research and Development Center: Vicksburg, MS, USA, 2023. Available online: https://budm.el.erdc.dren.mil (accessed on 30 October 2023).
- USACE. Beneficial Use of Dredged Material Disposal History Mississippi River, Baton Rouge to the Gulf of Mexico, La, Southwest Pass; New Orleans District, U.S. Army Corps of Engineers: New Orleans, LA, USA, 1980. [Google Scholar]
- Suedel, B.C.; McQueen, A.D.; Wilkens, J.L.; Saltus, C.L.; Bourne, S.G.; Gailani, J.Z.; King, J.K.; Corbino, J.M. Beneficial use of dredged sediment as a sustainable practice for restoring coastal marsh habitat. Integr. Environ. Assess. Manag. 2022, 18, 1162–1173. [Google Scholar] [CrossRef]
- McQueen, A.D.; Suedel, B.C.; Wilkens, J.L.; Saltus, C.L.; Gailani, J.Z.; Corbino, J.M. Restoring marsh habitat with beneficial use of dredged sediment from a riverine environment. WEDA J. Dredg. 2020, 18, 1–19. [Google Scholar]
- Huval, C.J.; Hewlett, J.C.; McCollum, R.A. Ship Navigation Simulation Study, Southwest Pass Entrance, Mississippi River; Technical Report HL-96-12; U.S. Army Corps of Engineer, New Orleans District: New Orleans, LA, USA, 1996.
- Suir, G.M.; Saltus, C.L.; Reif, M.K. Remote sensing-based structural and functional assessments of Phragmites australis diebacks in the Mississippi River Delta. Ecol. Indic. 2022, 135, 108549. [Google Scholar] [CrossRef]
- USACE. Beneficial Use of Dredged Material Disposal History Mississippi River, Baton Rouge to the Gulf of Mexico, La, Southwest Pass, 1970 to 1979; U.S. Army Corps of Engineers, New Orleans District: New Orleans, LA, USA, 1980.
- USACE. Beneficial Use of Dredged Material Disposal History Mississippi River, Baton Rouge to the Gulf of Mexico, La, Southwest Pass, 1980 to 1989; U.S. Army Corps of Engineers, New Orleans District: New Orleans, LA, USA, 1990.
- USACE. Beneficial Use of Dredged Material Disposal History Mississippi River, Baton Rouge to the Gulf of Mexico, La, Southwest Pass, 1990 to 1999; U.S. Army Corps of Engineers, New Orleans District: New Orleans, LA, USA, 2000.
- USACE. Beneficial Use of Dredged Material Disposal History Mississippi River, Baton Rouge to the Gulf of Mexico, La, Southwest Pass, 2000 to 2009; U.S. Army Corps of Engineers, New Orleans District: New Orleans, LA, USA, 2010.
- USACE. Beneficial Use of Dredged Material Disposal History Mississippi River, Baton Rouge to the Gulf of Mexico, La Head of Passes Hopper Dredge Disposal Area, 2015 to 2020; U.S. Army Corps of Engineers: New Orleans, LA, USA, 2020.
- Tischendorf, L. Can landscape indices predict ecological processes consistently? Landsc. Ecol. 2001, 16, 235–254. [Google Scholar] [CrossRef]
- U.S. Coast and Geodetic Survey (USCGS). 1932 Louisiana Mississippi River Delta Lower End of Southwest Pass; 1:20,000, 7.5 Minute Series, Sheet Number T-5404; USCGS: Washington, DC, USA, 1935.
- Cowardin, L.M.; Carter, V.; Goblet, F.; LaRoe, E.T. Classification of Wetlands and Deepwater Habitats of the United States; FWS/OBS-79/31; Biological Services Program, U.S. Fish and Wildlife Service: Washington, DC, USA, 1979.
- Wicker, K.M. Mississippi Deltaic Plain Region Ecological Characterization: A Habitat Mapping Study, a User’s Guide to the Habitat Maps; FWS/OBS-79-07; Office of Biological Services, U.S. Fish and Wildlife Service: Washington, DC, USA, 1980.
- Reif, M. Remote Sensing for Inland Water Quality Monitoring: A U.S. Army Corps of Engineers Perspective; ERDC/EL TR-11-13; Water Operations Technical Support Program, U.S. Army Engineer Research and Development Center: Vicksburg, MS, USA, 2011.
- U.S. Army Corps of Engineers. Environmental Assessment #578—Louisiana Coastal Area Beneficial Use of Dredged Material Program Mississippi River Outlets at Venice Project in Plaquemines Parish; Louisiana. U.S. Army Corps of Engineers, New Orleans District: New Orleans, LA, USA, 2020.
- Suir, G.M.; Wilcox, D.A.; Reif, M. Classification of Typha-dominated wetlands using airborne hyperspectral imagery along Lake Ontario, USA. Aquat. Ecosyst. Health Manag. 2021, 24, 140–155. [Google Scholar] [CrossRef]
- Quinlan, J.R. C4.5: Programs for Machine Learning; Elsevier: Amsterdam, The Netherlands, 2014. [Google Scholar]
- Chan, D.J. Using Ecosystem Services to Understand the Impact of Land Cover Change: A Case Study of the Upper San Pedro Watershed; The University of Arizona: Tucson, AZ, USA, 2013. [Google Scholar]
- Jollineau, M.Y.; Howarth, P.J. Mapping an inland wetland complex using hyperspectral imagery. Int. J. Remote Sens. 2008, 29, 3609–3631. [Google Scholar] [CrossRef]
- McGarigal, K.; Cushman, S.A.; Neel, M.C.; Ene, E. FRAGSTATS: Spatial Pattern Analysis Program for Categorical Maps. Computer Software Program Produced by the Authors at the University of Massachusetts, Amherst. 2002. Available online: https://www.fragstats.org (accessed on 21 November 2023).
- Suir, G.M.; Sasser, C.E.; Harris, J.M. Use of remote sensing and field data to quantify the performance and resilience of restored Louisiana wetlands. Wetlands 2020, 40, 2643–2658. [Google Scholar] [CrossRef]
- Olson, K.R.; Speidel, D.R. Managing the lower Mississippi River landscape for strategic navigational and flood control. Open J. Soil Sci. 2021, 11, 285–330. [Google Scholar] [CrossRef]
- U.S. Army Corp of Engineers (USACE). Beneficial Use of Dredged Material Disposal History Mississippi River, Baton Rouge to the Gulf of Mexico, La, Southwest Pass Dredged Material Disposal History Through FY 1979; U.S. Army Corp of Engineers, New Orleans District: New Orleans, LA, USA, 1979.
- Henkel, T. 2022 Operations, Maintenance, and Monitoring Report for West Bay Sediment Diversion (MR-0003); Coastal Protection and Restoration Authority of Louisiana: New Orleans, LA, USA, 2022; 73p.
- U.S. Army Corps of Engineers. Beneficial Use of Dredged Material Disposal History Mississippi River, Baton Rouge to the Gulf of Mexico, La Head of Passes Hopper Dredge Disposal Area; U.S. Army Corp of Engineers, New Orleans District: New Orleans, LA, USA, 2021.
- Steyer, G.D.; Llewellyn, D.W. Coastal Wetlands Planning, Protection, and Restoration Act: A programmatic application of adaptive management. Ecol. Eng. 2000, 15, 385–395. [Google Scholar] [CrossRef]
- Liu, S.; Lei, G.; Wang, D.; Li, H.; Li, W.; Jia, G. Reoccupying Ecological Land for Excessively Expanded Rust Belt Cities in Traditional Grain Bases: An Eco-Economic Trade-Off Perspective; Multidisciplinary Digital Publishing Institute: Basel, Switzerland, 2020. [Google Scholar] [CrossRef]

| Phase | Program | Type | Year | Data Source | Resolution |
|---|---|---|---|---|---|
| Historical Period | Topographic Sheet | Land and Water Data | 1934 | U.S. Coast and Geodetic Survey | 1:20,000 |
| National Wetland Inventory | Land and Water Data | 1956 | U.S. Geological Survey | 1:24,000 | |
| National Wetland Inventory | Land and Water Data | 1978 | U.S. Geological Survey | 1:24,000 | |
| Initial BUDM Period | National Wetland Inventory | Land and Water Data | 1988 | U.S. Geological Survey | 1:24,000 |
| LOSCO | DOQQ | 1998 | La. Oil Spill Coordinator’s Office | 1:10,000 | |
| National Aerial Photography Program | DOQQ | 2004 | U.S. Geological Survey | 1:24,000 | |
| Beneficial Use Monitoring Program | Aerial Photo | 2008 | U.S. Department of Agriculture | 1 m | |
| Recent Land Reclamation Period | Beneficial Use Monitoring Program | Aerial Photo | 2010 | U.S. Army Corps of Engineers | 1 m |
| Beneficial Use Monitoring Program | Aerial Photo | 2012 | U.S. Army Corps of Engineers | 1 m | |
| Global Enhanced GEOINT Delivery (G-EGD) Program | WorldView-3 Satellite Imagery | 2014 | MAXAR Technologies | 1.24 m | |
| Beneficial Use Monitoring Program | Aerial Photo | 2016 | U.S. Army Corps of Engineers | 1 m | |
| Beneficial Use Monitoring Program | Aerial Photo | 2018 | U.S. Army Corps of Engineers | 1 m | |
| Beneficial Use Monitoring Program | Aerial Photo | 2020 | U.S. Army Corps of Engineers | 1 m |
| Classified Data | Reference Data | |||||||
|---|---|---|---|---|---|---|---|---|
| Land Cover Classes | DV | SV | BG | D | OW | AV | Row Total | User’s Accuracy (%) |
| Dense Vegetation (DV) | 54 | 16 | 0 | 0 | 0 | 0 | 70 | 77.14 |
| Sparse Vegetation (SV) | 9 | 56 | 0 | 0 | 5 | 0 | 70 | 80.00 |
| Bare Ground (BG) | 0 | 8 | 55 | 5 | 2 | 0 | 70 | 78.57 |
| Developed (D) | 0 | 0 | 0 | 65 | 5 | 0 | 70 | 92.86 |
| Open Water (OW) | 0 | 5 | 0 | 4 | 61 | 0 | 70 | 87.14 |
| Aquatic Vegetation (AV) | 0 | 1 | 1 | 0 | 1 | 67 | 70 | 95.71 |
| Column total | 63 | 86 | 56 | 74 | 74 | 67 | 420 | Overall accuracy 85.24% |
| Producer’s accuracy (%) | 85.71 | 65.12 | 98.21 | 87.84 | 82.43 | 100.00 | 0.00 | |
| Date | Dense Vegetation | Sparse Vegetation | Bare Ground | Developed | Open Water | Aquatic Vegetation |
|---|---|---|---|---|---|---|
| km2 | ||||||
| 2008 | 49.9 | 4.4 | 1.5 | 0.8 | 157.8 | 9.9 |
| 2010 | 42.0 | 11.8 | 2.6 | 1.0 | 160.3 | 6.7 |
| 2012 | 40.0 | 14.6 | 1.8 | 1.0 | 164.9 | 2.2 |
| 2014 | 34.9 | 20.0 | 5.2 | 1.0 | 158.9 | 4.5 |
| 2016 | 44.5 | 15.8 | 2.9 | 0.9 | 154.8 | 5.4 |
| 2018 | 40.8 | 20.7 | 6.8 | 0.7 | 147.7 | 7.7 |
| 2020 | 38.4 | 24.3 | 6.7 | 1.0 | 149.1 | 4.9 |
| Change Rate (2008–2020) | Dense Vegetation | Sparse Vegetation | Bare Ground | Developed | Open Water | Aquatic Vegetation |
|---|---|---|---|---|---|---|
| Class Mean Area (km2/Yr) | −0.58 | 1.41 | 0.45 | −0.01 | −1.10 | −0.18 |
| Edge Density (meters/hectare/year) | 5.37 | 5.79 | 1.32 | −0.07 | −0.96 | 0.64 |
| Aggregation Index (percentage/year) | −0.27 | 0.81 | 0.21 | 0.10 | 0.01 | −0.38 |
Disclaimer/Publisher’s Note: The statements, opinions and data contained in all publications are solely those of the individual author(s) and contributor(s) and not of MDPI and/or the editor(s). MDPI and/or the editor(s) disclaim responsibility for any injury to people or property resulting from any ideas, methods, instructions or products referred to in the content. |
© 2025 by the authors. Licensee MDPI, Basel, Switzerland. This article is an open access article distributed under the terms and conditions of the Creative Commons Attribution (CC BY) license (https://creativecommons.org/licenses/by/4.0/).
Share and Cite
Suir, G.M.; Saltus, C.; Corbino, J.M. Land Reclamation in the Mississippi River Delta. Remote Sens. 2025, 17, 878. https://doi.org/10.3390/rs17050878
Suir GM, Saltus C, Corbino JM. Land Reclamation in the Mississippi River Delta. Remote Sensing. 2025; 17(5):878. https://doi.org/10.3390/rs17050878
Chicago/Turabian StyleSuir, Glenn M., Christina Saltus, and Jeffrey M. Corbino. 2025. "Land Reclamation in the Mississippi River Delta" Remote Sensing 17, no. 5: 878. https://doi.org/10.3390/rs17050878
APA StyleSuir, G. M., Saltus, C., & Corbino, J. M. (2025). Land Reclamation in the Mississippi River Delta. Remote Sensing, 17(5), 878. https://doi.org/10.3390/rs17050878