Article

Climatology of Midlatitude Mesospheric Zonal and Meridional Winds Observed by the Wuhan and Beijing MST Radars

1
Faculty of Science, Kunming University of Science and Technology, Kunming 650032, China
2
Electronic Information School, Wuhan University, Wuhan 430072, China
3
Student Engineering Training and Innovation Practice Center, Wuhan University, Wuhan 430072, China
*
Author to whom correspondence should be addressed.
Remote Sens. 2025, 17(5), 806; https://doi.org/10.3390/rs17050806
Submission received: 5 December 2024 / Revised: 10 January 2025 / Accepted: 7 February 2025 / Published: 25 February 2025

Abstract

:
Based on long-term observations from Wuhan and Beijing MST (Mesosphere-Stratosphere-Troposphere) radars, we analyzed the climatological properties of mid-latitude mesospheric winds and evaluated them against the Horizontal Wind Model (HWM14). Measurements of zonal and meridional winds were collected from 2012 to 2021 using these two MST radars. The seasonal daily and monthly variations and periodic oscillations in mesospheric zonal and meridional winds are presented. Monthly mean and seasonal zonal winds recorded by two MST radars have similar height-time distributions to the HWM14. However, there are differences in zonal wind speeds, especially between summer and winter measurements and HWM14. The agreement between model results and actual radar measurements is poorer for meridional winds than for zonal winds. Through harmonic analysis, it is revealed that the zonal and meridional winds display significant Annual Oscillation (AO) between 65 and 85 km, while Semi-Annual Oscillation (SAO) is not readily apparent. It is found that there is no significant correlation between solar activity and the wind variations or data acquisition rate from MST radar. Overall, these studies help us better understand atmospheric changes in the mesosphere and provide ground observation references for models.

1. Introduction

The mesosphere serves as an important segment of the middle and upper atmosphere and is essential for examining its interactions with both lower and upper atmospheric layers. Research on mesospheric neutral winds can deepen the understanding of the mesospheric dynamical state and help to refine the wind field model for the mesosphere atmosphere, as well as provide space environment monitoring and forecasting services, which are of great scientific significance and value for engineering applications. The statistical mean study of mesospheric neutral winds helps us to have a clear understanding of the long-term change pattern of atmospheric fluctuations, which is often related to the small-scale fluctuations transmitted from the lower atmosphere. Thus, the study of mesospheric mean winds is also helpful for us to deeply explore the activity pattern of atmospheric fluctuations and its influence on atmospheric circulation. However, the current comprehension of the dynamic course in the mesosphere and its variation regularity is extremely limited due to insufficient observational data. As observational methods have advanced in recent years, the mesospheric wind can be studied using the MST (Mesosphere-Stratosphere-Troposphere) radar, meteor radar, MF (Medium-Frequency) radar, rocket, and satellite sensor [1,2,3,4,5,6,7,8]. The mesospheric wind structures and variations have been the focus of tremendous attention so far. However, the detection principles, detection heights and ranges of these detection methods are somewhat different. The meteor radar is an atmospheric wind field detection technique based on meteor trails, which has been extensively applied to the detection of atmospheric winds in the Mesosphere and Lower Thermosphere (MLT), and its reliable inspection altitude is concentrated at 80–100 km [1,3,9,10,11,12]. At the Collm station in Germany (51.3°N, 13.0°E), Placke et al. employed an all-sky interference meteor radar to perform long-standing measurements of atmospheric winds in the MLT region from 2004 to 2009, and found that the average zonal winds show distinct seasonal variations, and that the variations are dramatically more robust over winter months than during summer months. They also inverted a long-standing pattern of gravity fluctuation fluxes based on the measured wind field data [10]. Using meteor radar measurements from Bear Lake Observatory (42°N, 111°W) and Aura satellite data, Day et al. examined the wind field in the MLT area from March 2008 to July 2011, and found significant seasonal oscillations in both meridional and zonal winds, and the southward wind in summer reached up to 12 m/s, which were closely associated with colder temperatures in the local area [12]. In addition, within China, using MLT regional neutral wind observations from 2002 to 2004 by meteor radar located in Wuhan (30.6°N, 114.4°E), Zhao et al. confirmed that daily averaged zonal winds were characterized by strong shear in the solstices and strong eastward wind occurring in summer, and daily average meridional winds were southward except in winter [11]. Moreover, Tang et al. and Ma et al. have utilized a meteor radar chain to illustrate the divergence among long-standing measurements of average winds in the MLT area and HWM models [13,14]. The MF radar can also obtain the winds in the MLT district by the Fresnel reflection of ionosphere, but the observations above 80 km are more reliable [15]. There are not many MF radars that continue to operate at present, and they are not widely distributed [16]. Franke and Thorsen found from MF radar measurements at Urbana (40°N, 88°W) that average zonal winds for the 1991–1992 period were mainly dominated by semi-annual oscillations in the range of 86–95 km as well as by annual oscillations at other heights in the MLT area [17]. Subsequently, Kishore et al. reported a study of zonal average winds in the MLT zone using MF radar at Yamagawa station (31.2°N, 130.6°E) in the mid-latitudes, analyzing continuous observations of the wind field from 1996 to 1998 and identifying semiannual oscillations and annual oscillations components in the zonal mean winds [18]. As for rockets, they are the only in-situ detection method that can measure the upper atmosphere, but due to the high cost, they cannot be used for continuous long-term detection [19,20,21,22]. Additionally, satellite measurements can have a clearer global distribution of atmospheric parameters, but the temporal-spatial resolution of specific regions is rough [23,24,25,26]. Importantly, the MST radar has been demonstrated to be effective and crucial for determining the mesospheric winds, which can obtain long-term and higher spatial and temporal resolution wind data [27,28,29,30]. The MST radar can detect the atmospheric wind field continuously day and night, but since the fluctuation of electron density at 60~90 km altitude is more prominent during the daytime, the MST radar valid echoes from the mesosphere are usually observed during the daytime [31,32]. The study by Nakamura et al. examined average winds at altitudes of 60–90 km using MU radar (35°N, 136°E) data collected between 1985 and 1989, and compared these results with previous meteor radar data from 1983 to 1986 at the same location, together with the 1986 CIRA model, and using Adelaide MF radar (35°S, 138°E) observations at 60–100 km in the southern hemisphere [33]. The team led by Latteck utilized the MAARSY to gather detailed observations of Polar Mesosphere Winter Echoes (PMWE) at Andøya (69.30°N, 16.03°E) over the period from 2011 to 2013 [34]. The study conducted by Kumar et al. investigated the mesospheric winds at low latitudes using data detected from the Indian Gadanki MST radar (13.5°N, 79.2°E) over the period from 1995 to 2006 and compared the observed features using rocket, High Resolution Doppler Imager (HRDI), MF radars and HWM93. According to their results, the zonal winds were notably eastward at solstices and westward at equinoxes, and the meridional winds flowed southward up to 75 km and reversed to northward beyond 75 km, agreeing with other technical measurements [35]. Ratnam et al. studied the long-standing modifications of Semi-Annual Oscillation (SAO) and Quasi-Biennial Oscillation (QBO) in a low latitude mesosphere (70–80 km) using a long dataset of MST radar, HRDI satellites, and rockets from 1977–2006, and examined the relations between these oscillations and the stratospheric quasi-biennial oscillation [36].
Furthermore, MST radar technology has rapidly progressed in China over recent years. Supported by the Chinese Meridional Project, the Wuhan and Beijing MST radars have been constructed and are operational. Located in Chongyang, Hubei Province, the Wuhan (WH) MST radar has coordinates of 29.51°N and 114.13°E, whereas the Beijing (BJ) MST radar is in Xianghe, Hebei Province at 39.75°N and 116.96°E [37]. Research conducted previously has revealed that the WH and BJ MST radar observations are in good agreement with other instruments and models in the mesosphere, stratosphere, and troposphere, establishing that MST radar is a capable means of measuring wind fields in these areas [31,32]. Our research explores the daily, monthly, and seasonal variations in mesospheric zonal and meridional winds over these two regions with the help of the WH and BJ MST radars. To our knowledge, no long-term variation of the mesospheric wind in the 65–90 km range in the mid-latitude zones of China has been studied, and our study will fill this gap.
Outlined below is the organization of this paper. Section 2 explains the methodologies and observation data from the WH and BJ MST radars. In Section 3, the daily, monthly, and seasonal variations of the mesospheric average zonal and meridional winds at two sites are presented, along with a comparison to the HWM14. Moreover, the reasons for the results are examined and studied in detail. Following this, the long-period oscillations: Annual Oscillation (AO) and Semi-Annual Oscillation (SAO) in zonal and meridional winds recorded by the WH and BJ MST radars are explained. The effect of solar activity on wind variations and radar data acquisition rates is also discussed. Section 4 provides a summary.

2. Data and Methods

The WH and BJ MST radars are valuable parts of the Meridional Space Weather Monitor Project of China (Meridional Project), which have been in operation since the end of 2011. These two MST radars are pulse-modulated Doppler radars with large-scale arrays, which can obtain reliable zonal and meridional wind measurements without supervision. In this work, the mesospheric mean zonal and meridional wind variations over the entire 65–90 km altitude are investigated by using the observations of two MST radars from 2012 to 2021.
The two MST radars adopt phased array and digital beam synthesis technology, transmitting five beams in sequence: east, west, south, north, and vertical, so as to attain a three-dimensional wind field. The BJ and WH MST radars are operated at 50 MHz and 53.8 MHz, respectively, with three detection modes: low (~2.5–12 km), middle (~10–25 km) and high (~60–100 km) modes to explore the troposphere, low stratosphere, and mesosphere [38,39]. We provide more details about the information used for this study in Table 1. The beam angle of the WH radar has been slightly adjusted, so the altitude resolution is different in different time periods. Many previous studies have given detailed introductions to the WH and BJ MST radars and data extraction methods, so we will not go into details here [31,32,35,37,40].
The number of valid observation days in the 65–90 km range from 2012 to 2021 recorded by two MST radars are shown in Figure 1. There are some data gaps in the monthly total days of available observations at WH and BJ stations per year, and there are relatively few in some months, especially in 2016 at BJ, the first half of 2018 and the second half of 2019 at WH. This is because the MST radars have annual periodic inspection and preventive maintenance, as well as hardware replacements and debugging, and some experimental detections only for other altitude observations. To explore the long-term changes in average winds, the daily average winds are determined by averaging the raw neutral wind data recorded every 30 min for each day. From 2012 to 2021, the daily average winds for the 365 days of the integrated year are calculated from these daily averages. At the same time, we apply identical standard processing to the wind data at each altitude, obtaining monthly average zonal and meridional winds by averaging the detailed annual daily average wind for each month. Moreover, before obtaining the reliable and valid wind field data, we eliminated the interference and outliers using the similar data processing method introduced in previous studies [40].
While examining the variations in mesospheric horizontal winds as estimated by the BJ and WH MST radars, we also compared these findings with the Horizontal Wind Model (HWM). HWM, a global standard atmospheric model that offers average horizontal winds from the Earth’s surface to 500 km, has been recently revised and is now called HWM14. It was created by combining datasets from a variety of instruments, including satellites, rockets, and ground-based measurements [41,42,43,44]. In upper atmospheric studies, the HWM has been employed extensively. As an illustration, HWM offers accurate observation-based neutral wind drivers for space weather applications and ionospheric model development [45,46]. We discuss the discrepancies and the possibility of these discrepancies between the MST radar detection results and the HWM, which contribute to better understanding of the climatological characteristics of midlatitude mesospheric winds. Furthermore, these discussions have informed future updates to the HWM version and provided an opportunity to assess the climate variability.
Due to uneven temporal sampling, to obtain the dominant oscillations in the neutral wind field recorded by the MST radars, the Lomb-Scargle (LS) method is proposed to be used in this project for the periodogram study, and the least-squares harmonic method has been used to fit the zonal and meridional wind amplitudes and phases [47,48]. The daily average wind data are subjected to harmonic analysis to find the amplitude and phase of the AO and SAO. Least square fitting is applied to the time series of zonal and meridional components using 365-day and 182.5-day harmonics. Each wind component can be expressed by a function of time;
t = a 0 + m = 1 2 A m cos 2 π t T m + φ m
where a 0 is prevailing component, Am and φm are the amplitude and phase of the mth harmonic component with period of Tm [49].

3. Results and Discussion

3.1. Diurnal Variation in the Average Winds During Different Seasons

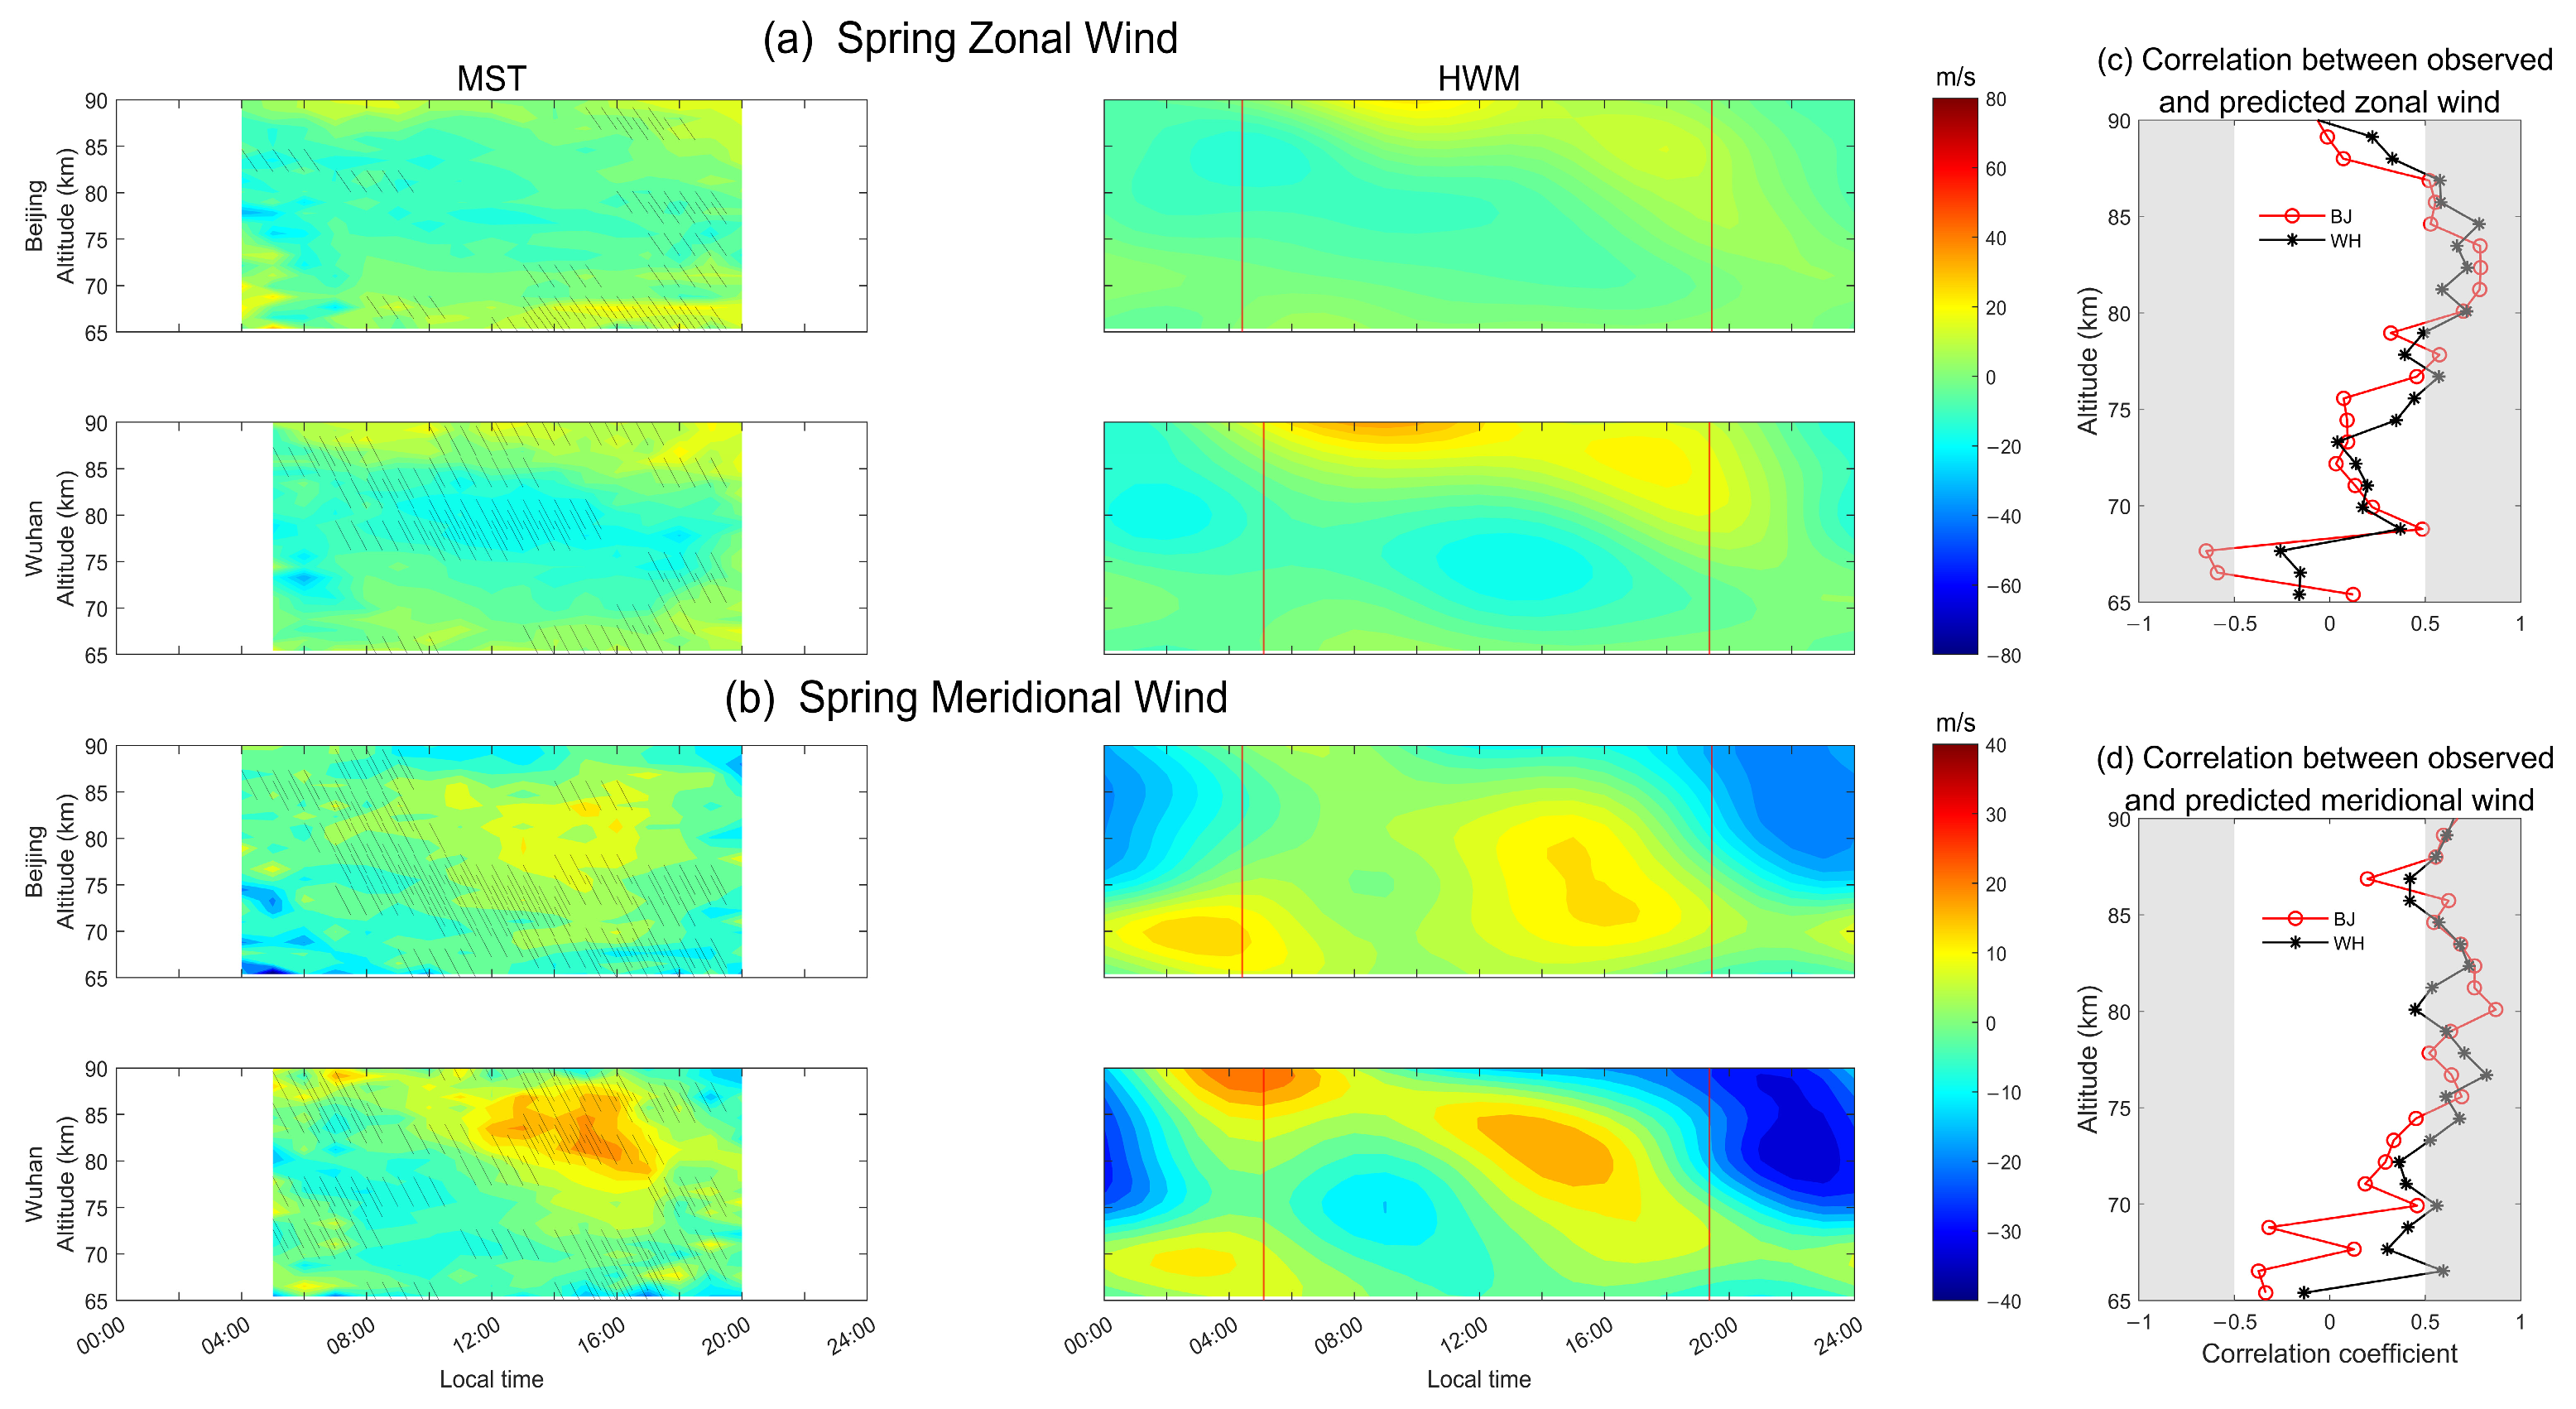
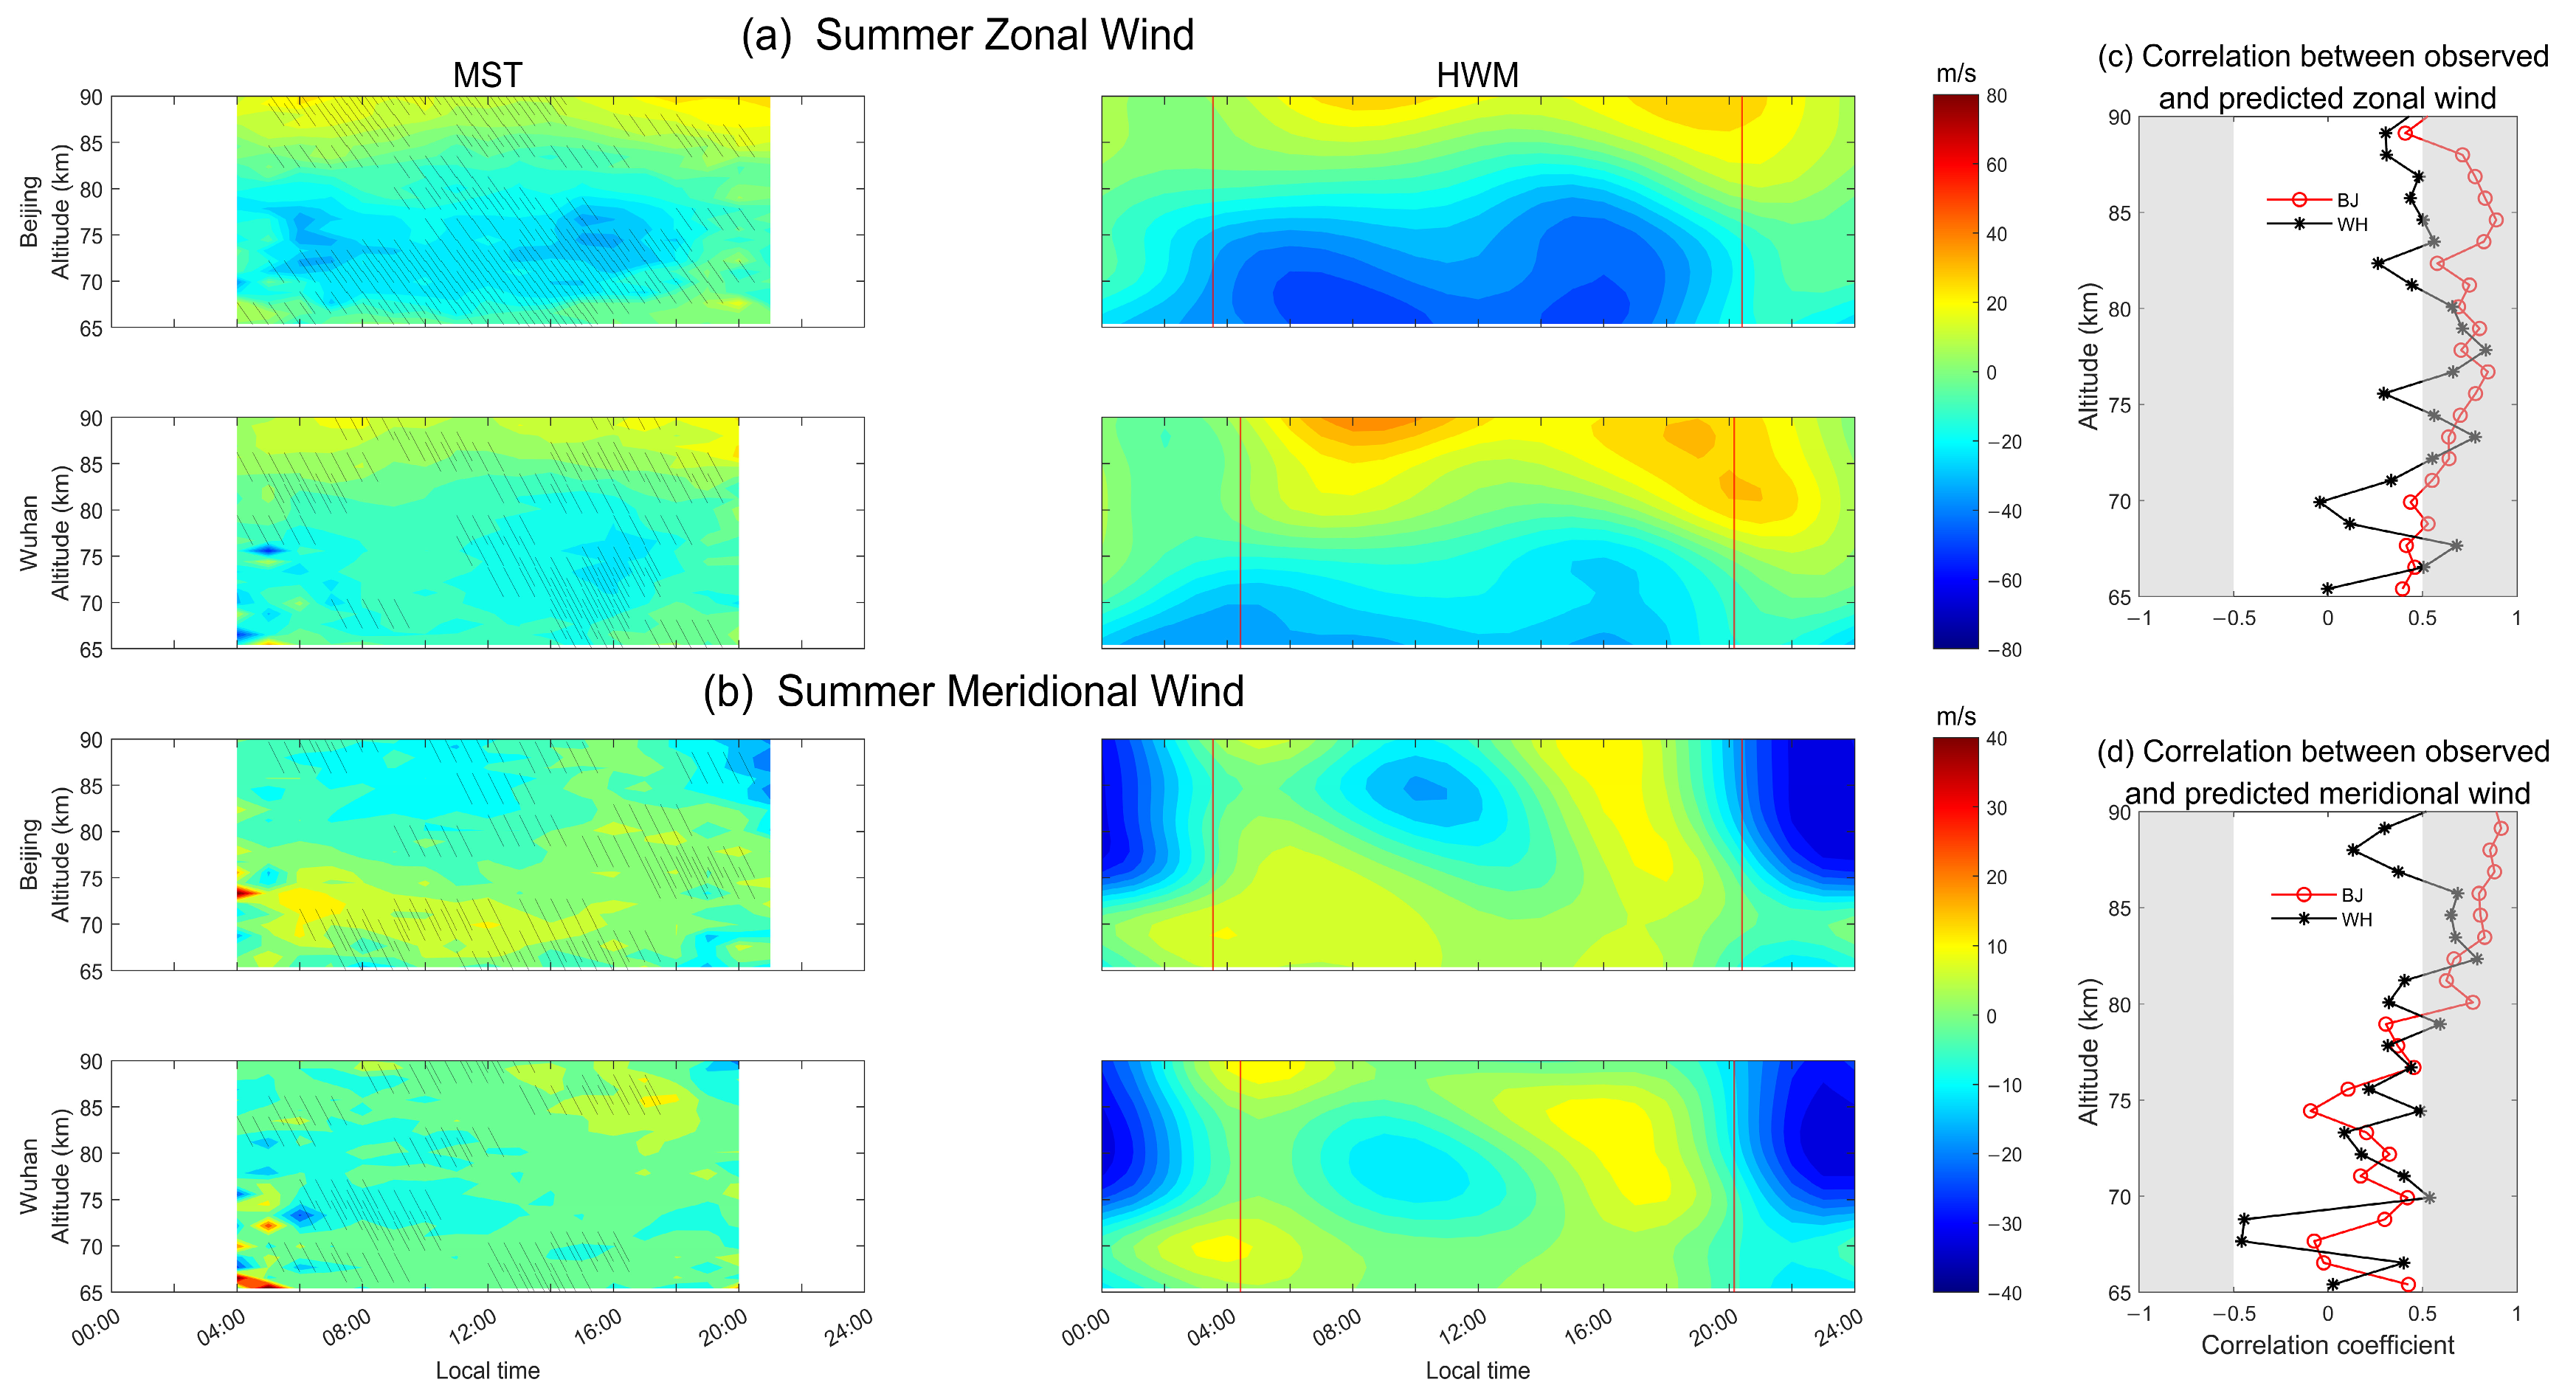
The dependency of MST radar echoes in the mesosphere on electron density, which is derived from solar radiation, means that reliable mesospheric wind observations from MST radar are typically confined to daylight hours. In our study, the observations of seasonal diurnal variations are only analyzed for daytime observation data. The daytime ranges of the respective seasons have been determined based on the local average sunrise and sunset time of each season in each radar station. In order to observe the temporal variations, we accounted for the hourly average speeds. Initially, the hourly average wind speeds were calculated for each season of the year. Subsequently, these calculations were extended to encompass each season across all years from 2012 to 2021. Finally, the average wind speeds for the corresponding seasons across all years were computed to derive the synthesized daily variations for the entire period. Figure 2, Figure 3, Figure 4 and Figure 5 illustrate the integrated diurnal variations of zonal and meridional winds given by the MST radars and HWM14 across the four seasons: spring (Mar–Apr–May), summer (Jun-Jul-Aug), autumn (Sep–Oct–Nov), and winter (Dec–Jan–Feb). The two red lines on the right side of each figure indicate the times of sunrise and sunset, corresponding to the time range for the MST radar data on the left side.
Figure 2, Figure 3, Figure 4 and Figure 5 show the comparison results of the daily changes of zonal and meridional winds in the four seasons of BJ and WH in the composite year between the actual observations of radar and the forecasts of HWM14 model. In spring (Figure 2), the zonal winds (Figure 2a) observed over BJ and WH are eastward above 85 km and below 70 km, with a wind speed of about 20 m/s during the daytime. The actual MST radar observations exhibit a remarkable degree of similarity to the zonal wind patterns forecasted by HWM14, but at ~10 LT (Local time) and ~17 LT, the zonal winds of the model are stronger at about 90 km than those observed. The spring meridional winds (Figure 2b) move northward at heights of 75–85 km during 12–17 LT, being more pronounced at WH than at BJ. As Figure 2c,d show, there are strong correlations between the observed and predicted zonal and meridional wind speeds at the altitude of 80–86 km and 75–85 km at the two sites, respectively, with correlation coefficients greater than positive 0.5.
During summer (Figure 3), zonal winds (Figure 3a) observed at BJ and WH stations are westward at 70–80 km during the daytime while the wind speed over WH is less at the same altitude. Similarly, the zonal winds forecasted by the model display westward jet below 80 km during the daytime, but above 85 km, those forecasted by the model are stronger than those detected by the two MST radars. The correlation (Figure 3c) between the observed and predicted zonal wind speeds is strong, and the correlation of BJ is stronger than that of WH at 77–90 km altitude. The hourly average of meridional winds (Figure 3b) obtained by MST radar are northward in the lower altitude of BJ during the daytime, while northward wind occurs in the upper heights at WH. The meridional winds of HWM14 show southward winds at 80–85 km at BJ and 75–80 km at WH around ~10:00 LT, and the wind speed at BJ is greater than that at WH. Incidentally, HWM14 shows strong southward jet above 75 km during spring and summer nights. Due to the difference of the speed values, the correlation (Figure 3d) between the observed and predicted meridional wind speeds at the two stations is weak below 80 km.
In autumn (Figure 4), the detected and forecasted zonal winds (Figure 4a) are eastward in both BJ and WH. Meanwhile, compared with the HWM14, the observations of WH are more consistent with the model predictions, but the observed value is less than the predicted value at 75–85 km, while the zonal winds projected by the model are larger than those detected at BJ at all heights. Northward winds (Figure 4b) are seen at both BJ and WH stations, but at altitudes of 75–85 km, the meridional winds detected at WH are greater than those at BJ. When compared with the model, it is found that the observed value at BJ is less than predicted above 70 km at sunrise time, while the winds observed at WH are contrary to the model forecast appeared at around 75 km at 8 LT. Furthermore, the meridional winds observed and predicted are southward with velocity ~15–25 m/s above 85 km at WH after noon, but the prediction of the model is obviously greater. The correlation (Figure 4d) between observed and predicted meridional wind speeds in the BJ is weak below 80 km. There are different wind patterns in zonal and meridional winds of the observations and model at the altitude of 78–88 km and 65–82 km, so the correlations are much weaker than at other altitudes, as presented in Figure 4c,d.
In winter (Figure 5), the zonal winds (Figure 5a) recorded at BJ and WH and those predicted by HWM14 are eastward at all heights during the day, but the model predictions are larger than the actual observations. Also, the model predicts that zonal winds appear as an eastward jet at BJ and WH below 75 km at midnight. In general, the meridional winds (Figure 5b) are weak during the day. The correlation (Figure 5c) between the observed and forecasted meridional wind speeds from the two stations is similar and both around 0.5. The meridional winds observed are northward with velocities of ~10–20 m/s at BJ and WH stations at heights of 70–85 km at ~10–17 LT, which is similar to the model-predicted pattern. Meanwhile, the meridional wind of the model is southward with velocities of ~15~25 m/s above 85 km while the northward jet is at midnight above 70 km. The correlation (Figure 5d) of meridional wind speeds in winter is worst, and most of the correlation coefficients are less than 0.5.
The influence of diurnal and semidiurnal tides on atmospheric horizontal winds and temperature variations is widely recognized [50,51]. However, there is a lack of research regarding the tidal component of horizontal winds detected by MST radar, because reliable observations of mesospheric winds by MST radar are limited to daytime observations with almost no nighttime data recorded. Apart from the equatorial area, semidiurnal tides generally exhibit a larger amplitude compared to diurnal tides. Wilhelm et al. obtained the average wind variations, diurnal and semidiurnal tides in MLT zones from the observations of three meteor radars at Andenes, Juliusruh and Tavistock at high and mid latitudes [52]. Their research illustrated that the amplitude of diurnal and semidiurnal tides increased with height, and semidiurnal tides had a greater amplitude compared to diurnal tides. Moreover, at heights above 90 km, the semidiurnal tidal variations of the horizontal winds are significant and may exceed the prevailing mean horizontal winds. Stober et al. used the same three meteor radars and model to compare the mean winds and the semidiurnal wind tide, along with its phase behavior, and reported analogous results [53]. According to the results of these studies, it appears that the tidal amplitude of horizontal mean winds from 65 to 90 km is less than at altitudes over 90 km and might not be greater than the average horizontal winds.
Based on the above results of this paper, we can see from the HWM14 results that the meridional winds show semidiurnal tides in all seasons but no significant semidiurnal tides are observed in the zonal winds. We calculated the deviations of the daytime and all-day zonal and meridional winds obtained from HWM14 to estimate the tidal effect on the zonal and meridional winds. We find that below 85 km at both stations, the deviations of the daytime and all-day average wind speed are several m/s and the deviations for the meridional winds are generally larger than those for the zonal winds. Moreover, the meridional wind is weaker compared with the zonal wind; the deviation of the meridional wind is mostly comparable to the all-day meridional wind speed. As the height increases, both deviations gradually increase. We assume that the diurnal mean horizontal winds in this study would include a tidal bias; the bias of daytime meridional wind is larger than that of zonal wind, but the bias is considered to be acceptable Therefore, we have simply averaged the daily winds in the following analysis.

3.2. Day-to-Day Variation of Zonal and Meridional Winds

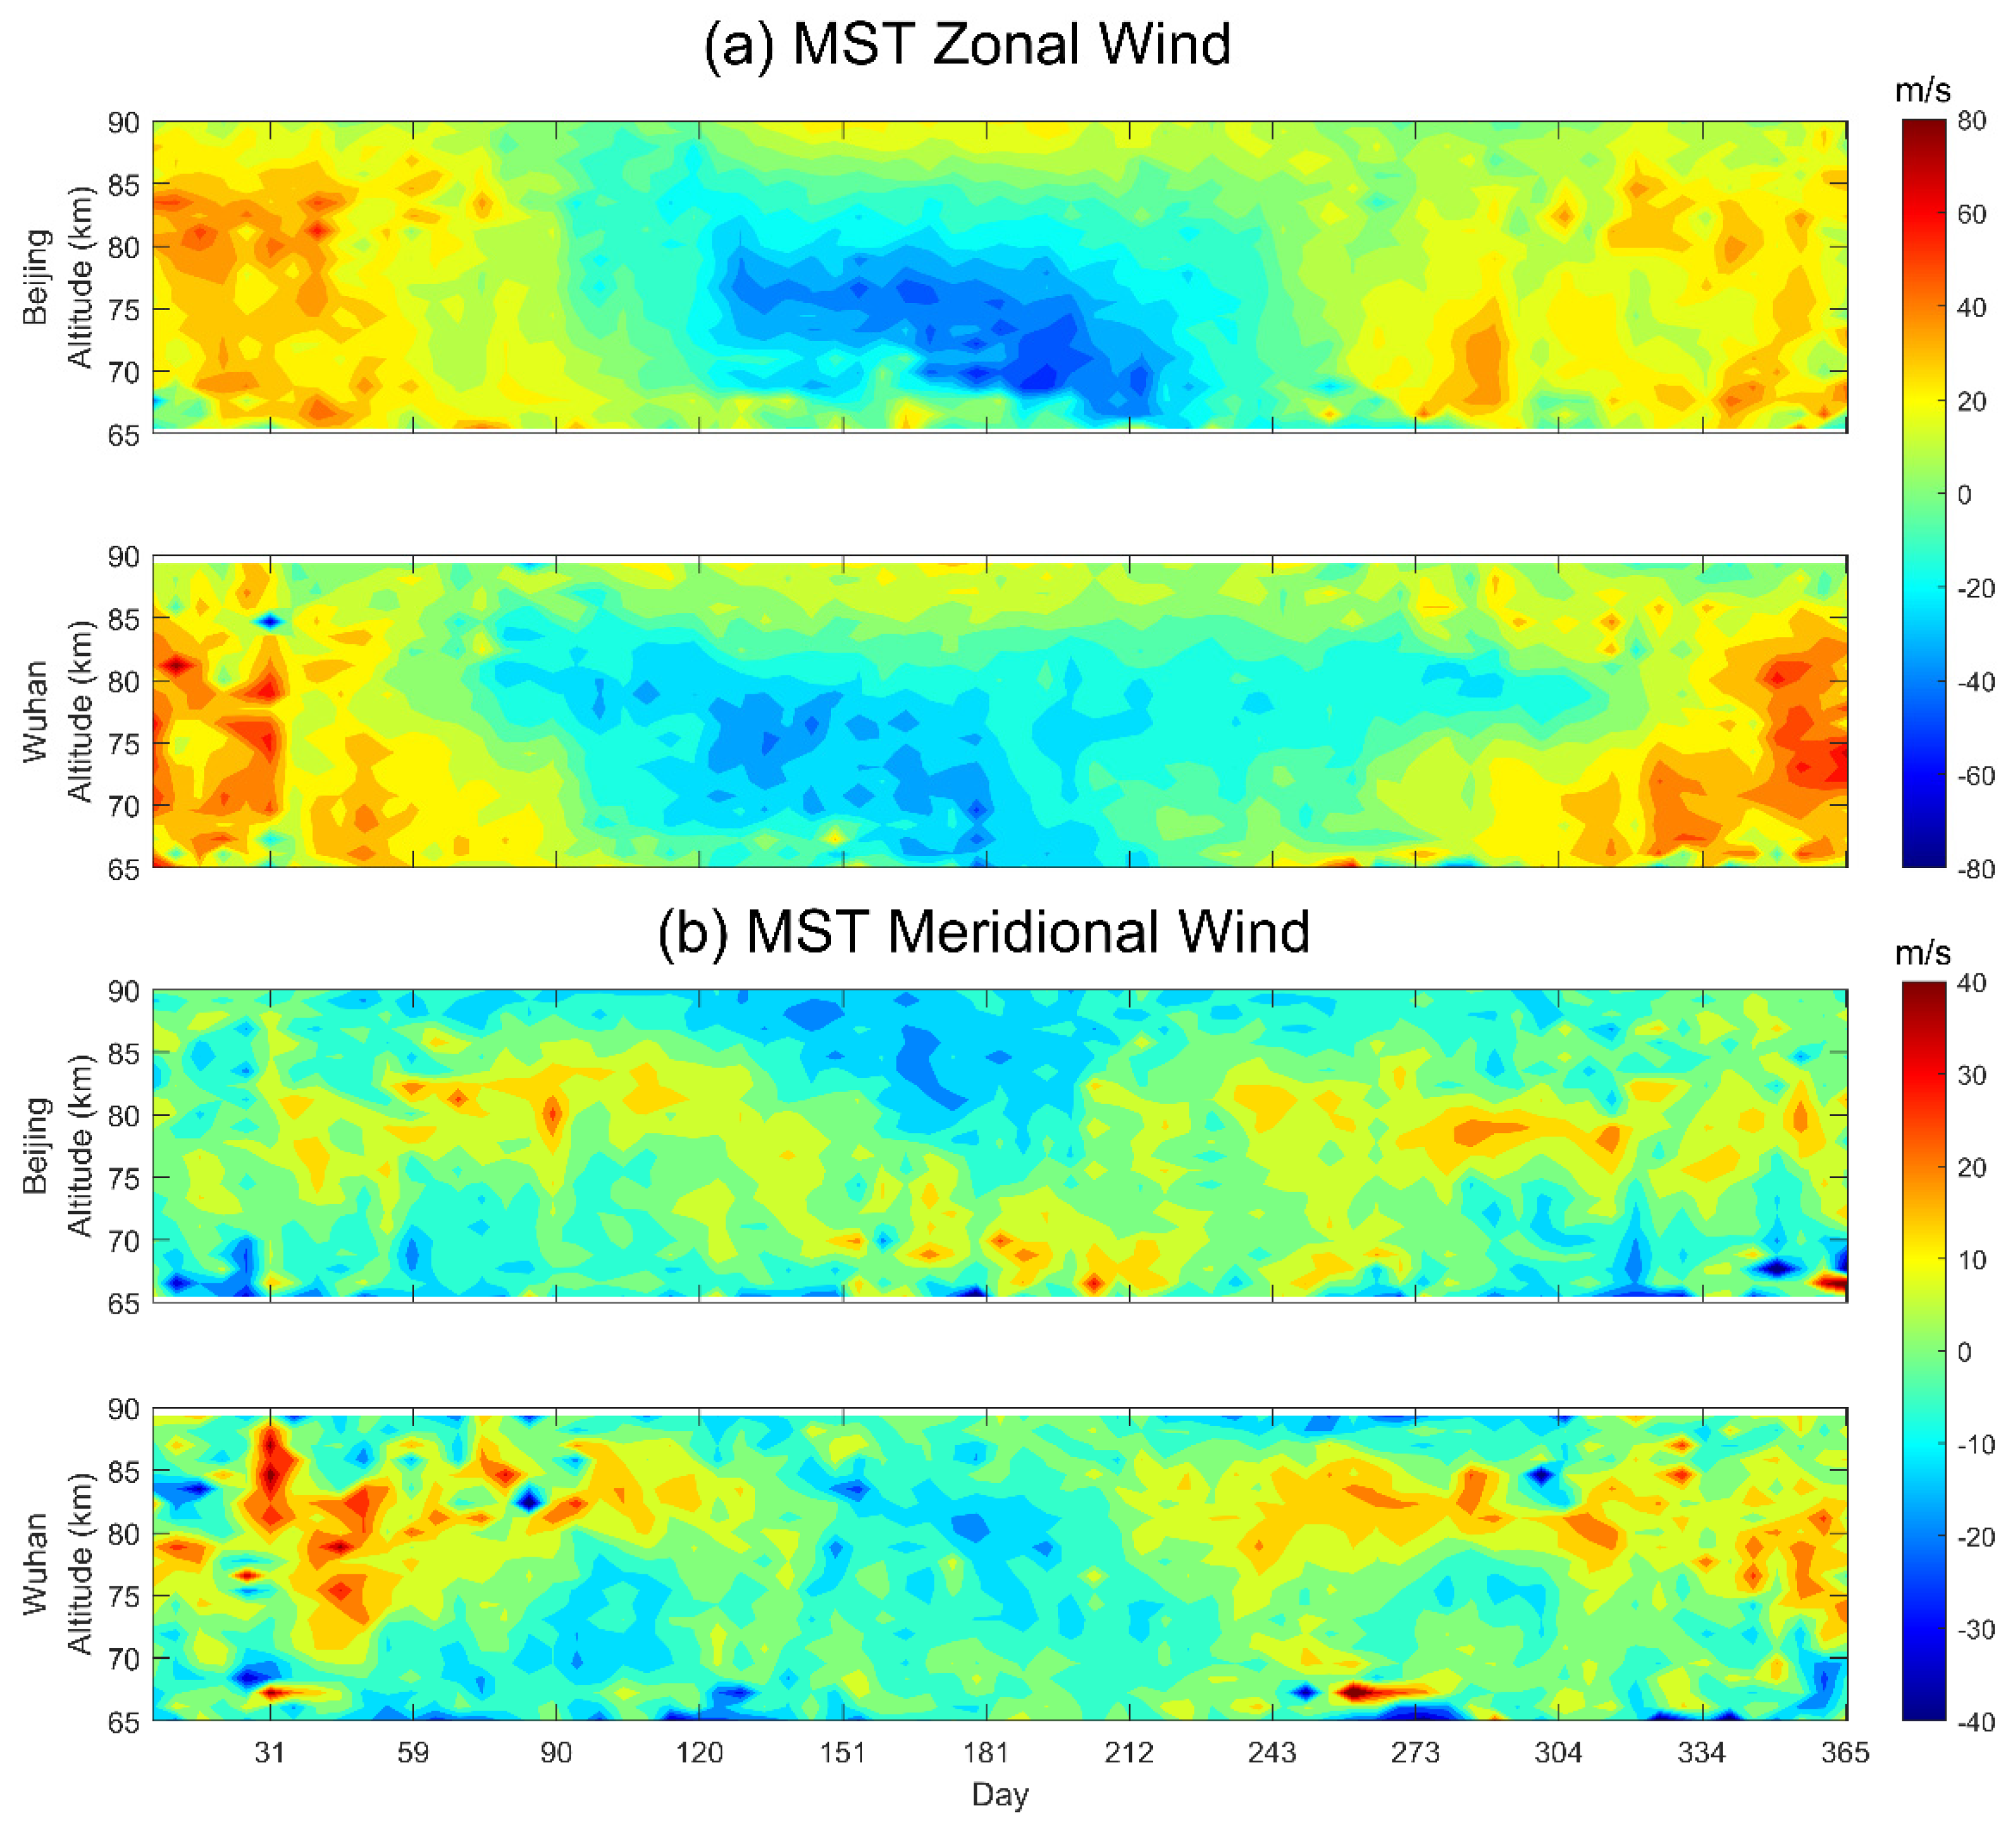
The day-to-day variations in the composite annual zonal and meridional winds captured by the WH and BJ MST radars from 2012 to 2021 are illustrated in Figure 6. In Figure 6a, a westward jet clearly can be seen at 65–80 km during the summer at two sites, but the zonal wind observed over BJ is stronger than that over WH at the same height and time. Additionally, an eastward jet occurs at 65–85 km in the winter both at BJ and WH stations.
As seen from Figure 6b, the northward winds occur at 70–85 km during spring and winter at the BJ and WH observation stations, but the northward winds observed over WH are stronger than those observed over BJ at the same time. Also, we can clearly find southward winds around June above 80 km.
Numerous disturbances are evident in both zonal and meridional winds observed by both MST radars. This may be due to the abundant waves contained in the wind variations recorded by the MST radars, such as gravity waves and planetary waves. The gravity waves have a crucial involvement in the transfer of energy and momentum from the lower atmosphere to the upper atmosphere [54]. Gravity waves typically cause disturbances in the horizontal wind field [55]. The planetary waves are also important for mesospheric variability, especially in winter, when the prevailing westerly zonal winds in the stratosphere and lower mesosphere favor the propagation of planetary waves. In winter in the Northern Hemisphere, sometimes the eastward zonal winds may be reversed in the mesosphere and stratosphere due to the interaction of planetary waves (PW) with the background winds [56,57].

3.3. Monthly Mean Wind Variations

Figure 7 presents a comparative analysis between the BJ and WH MST radar measurements (depicted on the left side of Figure 7) and the predictions generated by the HWM14 model (illustrated on the right side of Figure 7) from 65 to 90 km. As shown on the left side of Figure 7a, we can actually observe the westward jet winds below 85 km from April to August at the two MST stations, and find that the westward jet winds over BJ are stronger than those over WH. Two actually measured eastward jet winds are also observed by two radars, the first at 65–90 km from September to March and the second above 90 km from May to August. In addition, obvious zonal mean winds vertical shear can be seen at about 85 km in summer at both stations. According to previous studies, strong gravity wave or tidal wave activity in the mesosphere may cause the wind vertical shear [58,59]. Furthermore, there are significant latitudinal differences in the observations, with the monthly mean zonal winds being stronger at BJ than at WH, as also revealed by previous studies [13,14].
By comparing the radar measurements on the left side of Figure 7a with the model results on the right side, it is found that HWM14 obtains the essential features of the MST radar observations by displaying both westward and eastward jets at both BJ and WH stations, but there are certain discrepancies with the radar observations. During the period from April to August at BJ station, the predicted values of HWM14 present that the peak altitude of westward jet is about 10 km lower than the actual MST radar measurements. In addition, at the BJ and WH observation sites, the zonal winds detected by radar at an altitude of 65–85 km in summer and at 65–90 km in the September to March period are weaker than the HWM14 predictions. Especially in winter, the difference between MST radar measurements and HWM14 exceeds 20 m/s. But overall, the zonal components detected by the MST radars and those given by the HWM14 present similar wind structures.
Figure 7b shows the monthly average meridional wind variations from the actual radar observations (left) and HWM14 predictions (right) in the integrated year. The left side of Figure 7b reveals that at the BJ observation site, average meridional winds blow southward between 80 and 90 km in height from April through August. We find that the actual measurements and model projections show identical three circular structures of northward meridional winds at three different heights at BJ. Two circular structures manifest at heights of 75–85 km around March and October, and the third circular structure emerges below 75 km in summer. At WH station, a northward jet stream is observed by the radar in the time range from August to April at 70–85 km, but two northward jets appear around March and September above 75 km and a southward jet occurs above 70 km from February to July presented by HMW14. Also, the model predicts southward winds to be stronger than observed at the same altitude and time.
There are indeed inconsistencies between the MST radar observations and the HWM14 predictions, summarized as follows: (1) Significant discrepancies are displayed between the radar observations and model predictions in summer and winter seasons; (2) The consistency between the measurements and the HWM14 is more pronounced in the zonal component compared to the meridional component; (3) The radar measurements yield lower values than those predicted by the model. The database of HWM14 for the MLT areas incorporates many types of ground detection instruments, including Fabry-Perot interferometers, incoherent scatter radars, MF radars, and lidars around the world, but the MST radars are not included. Therefore, the discrepancy between observations and model predictions may be due to the limited data available for HWM14 development. Furthermore, the neutral winds detected by the MST radar contain a lot of smaller period perturbations as shown in Figure 6. We use daytime data recorded by MST radar to represent the whole day, while the monthly average data is derived from the daily average. This may be one of the reasons why the monthly mean winds obtained by MST radar are small. Moreover, the meridional winds present more significant semidiurnal tides than zonal winds that can be found in the HWM14 results in Figure 2, Figure 3, Figure 4 and Figure 5, which lead to poorer consistency of the meridional winds compared to the zonal winds. Besides those, the meridional winds in the mesosphere have an obvious longitudinal dependence, which indicates that the meridional wind cannot be accurately predicted based on the input of the limiting longitude alone [60,61,62].
Sudden stratospheric warming (SSW) events indicated by many studies have an impact on the average winds in the MLT areas [63,64,65,66,67]. The results of the study by Tang et al. and Ma et al. using meteor radar also suggested that in the mid-latitudes, the neutral winds would be affected by SSW events, leading to the difference between observations and model predictions in winter [13,14]. The discrepancy between radar measurements and the model predictions of the winter zonal components over BJ and WH may be due to SSW events. The response of mesospheric winds observed by MST radar to SSW events is also a meaningful topic. We will continue to investigate it in detail in the future, but not further discuss it here. Furthermore, in the study of this paper, the compound annual data are gained using 10 years of radar observations at BJ and WH stations from 2012 to 2021. Portnyagin et al. demonstrated the mean winds in the mid-latitudes during 1964–2004 and found that mean annual zonal winds (eastward winds) decreased before the 1980s, while mean annual meridional winds (northward winds) increased before the 1990s [68]. The average zonal winds (meridional winds) have no obvious change tendency after the 1980s (1990s). Therefore, some of the divergences between our observations and models may be due to interdecadal variations in MLT average winds.

3.4. Long Period Oscillations Detected in the Zonal and Meridional Winds

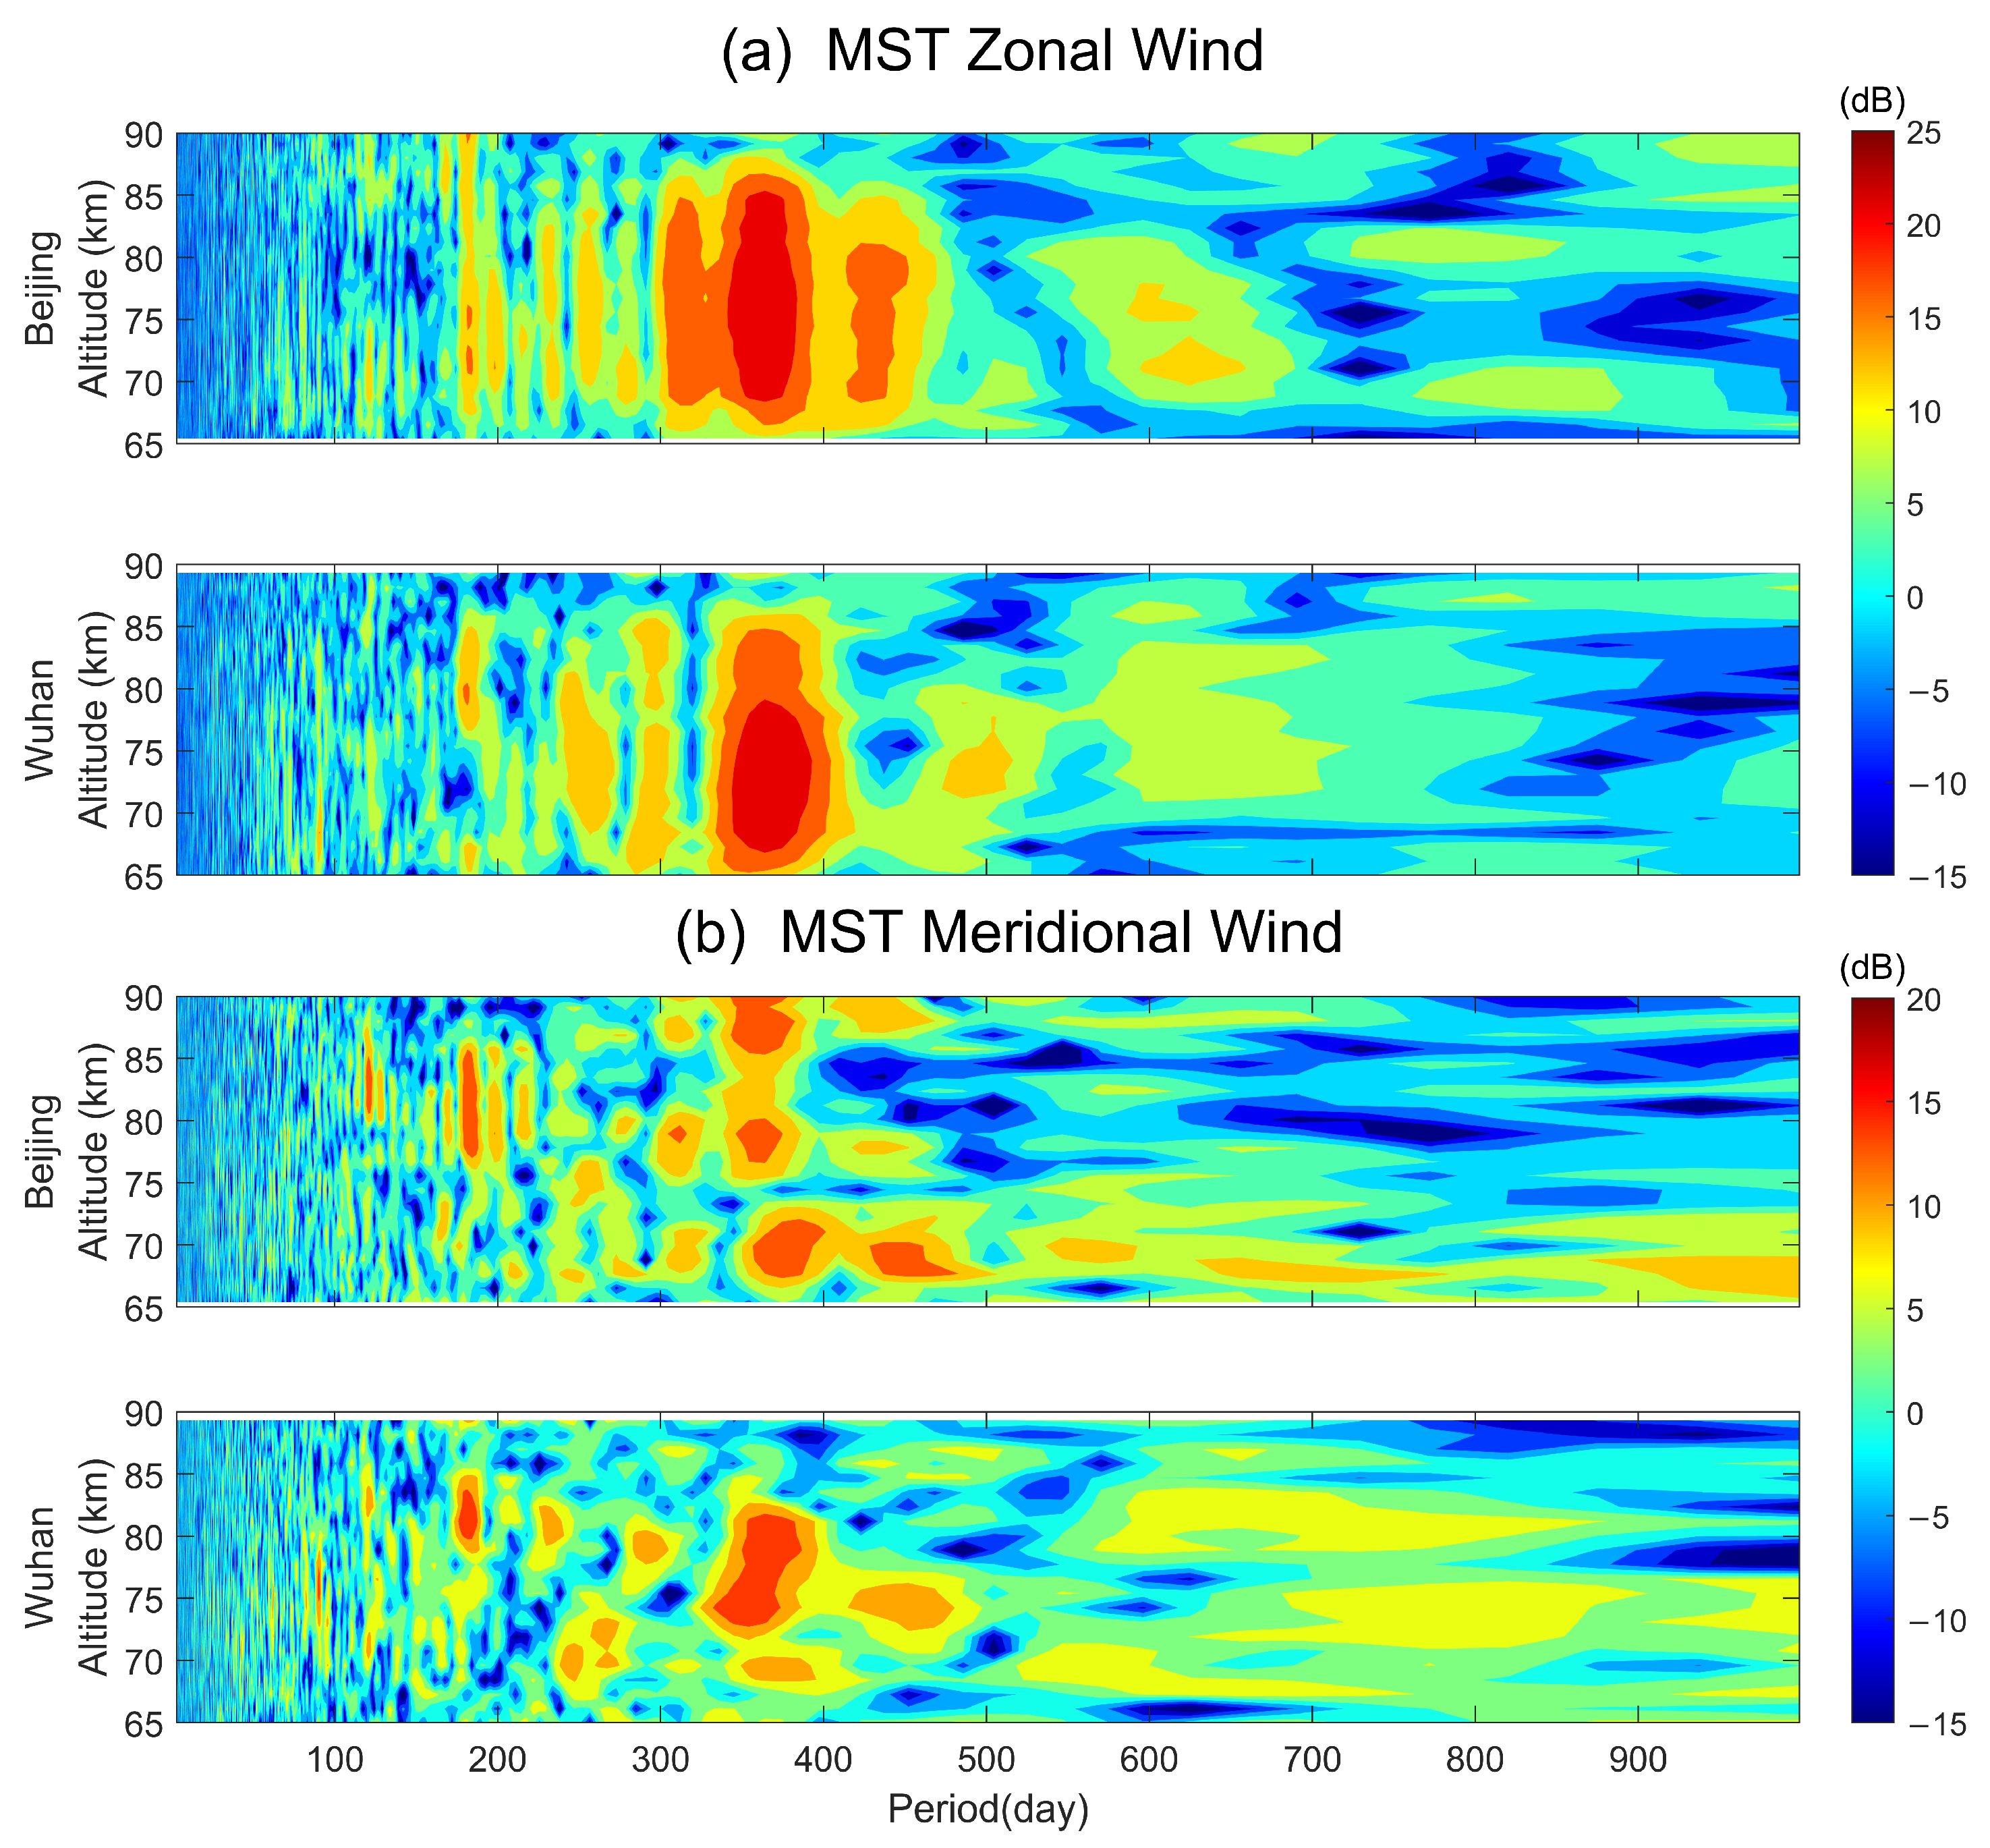
To further analyze the periodic patterns in the zonal and meridional wind data from the BJ and WH MST radars, Lomb–Scargle (LS) periodograms [47,69] are computed for the entire detection period of the winds from 65 to 90 km. Figure 8a shows the LS spectrum of zonal winds at BJ and WH stations at 65–90 km. The distinct annual oscillation (AO) patterns with a period of 365 days and an amplitude of approximately 20 dB are detected between 65 and 85 km altitudes at the BJ and WH stations. The weak Semi-annual Oscillation (SAO, 182.5 days) between 70–90 km altitudes at BJ and 75–85 km altitudes at WH with amplitude ~8 dB and ~9 dB, respectively, are also observed. Similarly, the LS spectrum of meridional winds is given in Figure 8b. The weak SAO of meridional winds are observed at 75–85 km heights at BJ and 80–85 km heights at WH with ~10 dB and ~9 dB. Comparatively strong AO of meridional wind is observed with amplitude of ~15 dB. In a word, the zonal and meridional winds observed by the BJ and WH radars exhibit noticeable AO and SAO oscillations, and the AO amplitudes at both stations are much larger than the SAO amplitude, and the AO amplitudes of the meridional winds are smaller compared to those in the zonal winds.
Referring to previous studies, a similar result was also presented for zonal winds. Jia et al. reported that an AO is evident at midlatitudes [16,70]. Yi et al. and Jia et al. illuminated that latitudinal variations among stations result in discrepancies in zonal winds [70,71]. The differences in oscillation structure observed at the BJ and WH stations appear to be due mainly to their different latitudes. As shown in Figure 8, we do not observe any obvious traces of QBO, which aligns with earlier research [14,72]. In order to further examine how AO and SAO vary with altitude at the two observation sites, we have conducted a harmonic fit on the neutral wind data, with more information available in Section 3.5.

3.5. Amplitude and Phase Variations of AO and SAO in Zonal and Meridional Winds

Figure 9 represents the harmonic fitting results of zonal winds detected by the MST radars at BJ and WH stations. From Figure 9a, it is clear that the AO in the zonal wind displays an amplitude maximum of ~32 m/s at ~68 km and ~76 km at BJ and ~71 km at WH. Two sites have a similar trend in the AO amplitude: the AO amplitude decreases at altitudes from 70 to 86 km, whereas it decreases at altitudes from 65 to 70 km and from 86 to 90 km. In comparison to WH, the same trend at BJ appears at a higher altitude. According to Figure 9a,b, the SAO amplitude is much less pronounced than the AO amplitude. The SAO amplitudes of the zonal winds gradually decrease at 65–71 km and 80–87 km at WH and 75–86 km at BJ. The SAO amplitudes of the two observation stations exhibit a similar trend above 77 km and an opposite trend below 76 km. The phases of the AO and SAO are depicted in Figure 9c,d. Figure 9c reveals that the zonal wind phase of the AO follows a comparable trend at altitudes from 65 to 90 km at two sites, with no noticeable phase difference in the 65–87 km range. In Figure 9d, the SAO in the zonal wind phase shows a similar trend at altitudes from 73 to 90 km at two sites, but the SAO of zonal wind phase at BJ is greater than that of WH above 73 km.
Figure 10 presents the harmonic fitting results of the meridional wind detected by the MST radars at two sites. According to Figure 10a, the AO in the meridional wind has its highest amplitude of nearly 9.5 m/s at WH near 82 km and a top amplitude of about 8 m/s at BJ around 68 km. The amplitudes of the meridional wind SAO have a similar tendency to vary in altitude at WH and BJ, but the similarity of the amplitudes of the meridional wind SAO at the two stations is much poorer than that of the zonal wind SAO at the two sites. In Figure 10a, it can be clearly seen that the amplitude of the AO increases gradually at 75–80 km at BJ and 72–82 km at WH, and the amplitude at WH exceeds that at BJ in the height range of 72–84 km. Conversely, the amplitude of the meridional wind AO at WH is lower than that at BJ below 72 km and above 84 km, respectively. As depicted in Figure 10b, the SAO amplitude peaks at around 10 m/s at WH and at roughly 8 m/s at BJ, with both occurring at 82 km. The SAO shows the same trend at both locations: the SAO amplitude decreases at 65–75 km and 80–86 km altitude, and increases at 75–82 km altitude. From Figure 10a,b, we can clearly see that the similar trend of SAO amplitude is stronger than that of AO amplitude at both stations. The AO and SAO phases in the meridional wind are depicted in Figure 10c,d. We can see in Figure 10c,d that the phases of the meridional winds AO show similar variations above 73 km at BJ and WH, and the phases of the meridional winds SAO show similar variations above 80 km at BJ and WH. Comparing the AO phases of the two stations in Figure 9c and Figure 10c, we find that the trend of similarity of the AO phases of the two stations in the zonal winds is much better than the trend of similarity of the AO phases of the meridional winds at two stations.
Generally, AO and SAO are the predominant oscillation patterns of the average neutral winds in the MTL area. In our study, the variations of the AO of the zonal wind in the mid-latitude BJ and WH districts with increasing altitude from 70 to 86 km, and the maximum amplitude of the zonal wind AO is ~32 m/s. Simultaneously, the highest amplitude of the AO and SAO in the meridional wind reaches about 80 km. Comparing Figure 9a and Figure 10a, the AO amplitudes in the zonal winds are greater than the AO amplitudes in the meridional winds at the same heights at BJ and WH. Zhou et al. verified that the mean winds in the MLT region are dominated by the mid-latitude AO and influenced by the low-latitude SAO using the meteor radar chain [16]. Ma et al. also reported the average neutral wind AO and SAO oscillations using meteor radar, demonstrating that the AO and SAO dominate the average neutral wind variations in the MLT area [14]. Namboothiri et al. indicated that the mesospheric average winds at mid-latitudes are primarily influenced by the AO [73]. The study by Kishore et al. showed the altitudinal differences in the AO and SAO of the mean zonal wind in the MLT over Yamagawa (31.2°N, 130.6°E) with the same latitude as WH. Their results revealed that the AO amplitude of the zonal winds was less than what we actually observed by the WH MST radar. In addition to the difference in longitude between the two sites, the variations in the average zonal winds over a long period of time may also contribute to this discrepancy, as their research is based on measurements taken from 1996 to 1998 [18].

3.6. The Effect of Solar Activity

Since the collection of wind variations observed by the BJ and WH MST radars covering ten years from 2012 to 2021, we have attempted to explore the relation between the neutral winds and solar activity. Solar activity refers to the phenomena in the solar atmosphere associated with the distortion of the magnetic field, with an approximately 11-year cycle. Solar activity can potentially affect the Earth’s ionosphere, magnetosphere, atmosphere, and climate. The 10.7 cm solar radio flux (F10.7) is one of the representative indicators of solar activity, which is often used to indicate its strength. Figure 11 shows the changes in F10.7 during the observation period from 2012 to 2021. The F10.7 indices reveal a gradual increase in solar activity commencing in 2012, peaking in 2014 and 2015, followed by a subsequent decline. The period from 2012 to 2021 includes nearly one solar activity cycle. We conducted a thorough investigation into the variations in both direction and magnitude of the zonal and meridional winds in the mesosphere observed by MST radars. Our findings indicate that neither the zonal nor the meridional winds exhibited significant interannual variability, nor did we identify a clear correlation with solar activity intensity. Although numerous prior studies have explored the correlation between long-term wind changes in the mesosphere and the solar cycle effect, their conclusions have not been entirely consistent [74,75,76,77]. There were positive correlations, negative correlations, and no significant correlations reported in their investigates. The different station locations, observation periods, detection means and evaluation methods would contribute to the different conclusions. Additionally, Qian et al. have proposed that the winds in the mesosphere are more affected by the interaction of the winds with the upward propagating waves than solar irradiance effects. The duration of the observation periods from 2012 to 2021 in our study is indeed short to determine the correlation with solar activity. As the BJ and WH MST radars continue to operate and observe, we have the opportunity to further study wind variation over a longer period of time.
Meanwhile, the MST radar mesospheric echoes are determined by the electron density, so we also consider the relation between the radar’s effective data acquisition rate and solar activity. Between 2012 and 2021, the correlation coefficients of the MST radar’s effective data acquisition rates with the F10.7 index at 65–90 km have been calculated. For BJ and WH, the average values of the correlation coefficients with the F10.7 indices for effective data acquisition rates are 0.15 and 0.11, respectively. It can be seen that the correlation between the MST radar’s effective data acquisition rate and solar activity is comparatively weak. Research by Pokhotelov et al. indicates that mesospheric echoes and the F10.7 at mid-latitudes are almost unrelated [52,78]. Therefore, we surmise that the effective data acquisition rate in the mesosphere for the MST radar is more related to radar performance and can investigate it in more detail in further studies.

4. Summary

This study represents the climatological analysis of midlatitude mesospheric zonal and meridional winds, utilizing neutral wind data from the WH and BJ MST radars spanning 2012 to 2021 for the first time. Our presentation includes the daily, monthly, and seasonal variations in the average zonal and meridional winds in the mesosphere at two observation sites, as well as a comparison with the HWM14. The discussion of the discrepancies between the radar observation results and HWM14 results is also contained. Furthermore, we have investigated the long-period oscillation of the winds observed by two MST radars and the relation between solar activity and radar observations. Below is a summary of the essential conclusions:
The BJ and WH MST radars record the day-to-day variations in the integrated year, with zonal winds exhibiting a noticeable westward rapid at 65–80 km in summer and an eastward rapid at 65–85 km in winter. For the meridional winds, the northward winds at BJ and WH stations occur in the spring and winter seasons within the range of 70–85 km, but the northward winds observed at WH are stronger than those observed at BJ. Moreover, numerous disturbances are noticeable in both zonal and meridional winds as detected by the MST radars, potentially due to gravity waves affecting the horizontal winds. The seasonal daily and monthly average zonal winds both from the MST radar measurements and the model forecasts display similar patterns, although there are some differences. The measured wind speeds of the zonal winds are significantly less than those from the model, especially in summer and winter. The observed values of the winter zonal component at BJ and WH do not match model results, which is potentially linked to the SSW event and should be explored in more detail going forward. As illustrated in Figure 7, a noticeable vertical shear in the monthly average zonal winds emerges around 85 km during the summer, which may be caused by strong gravity wave or tidal wave activity in the mesosphere. Below 85 km in summer, the zonal westward winds observed at BJ are stronger than those at WH, which might be attributed to the latitudinal difference between two stations. Compared to zonal winds, the consistency between model forecasts and radar measurements is lower for meridional winds. As shown in Figure 2, Figure 3, Figure 4 and Figure 5, the meridional winds in the four seasons of the integrated year display more significant semidiurnal tides than the zonal winds, which is one reason for the poorer consistency of the meridional wind relative to the zonal wind. Additionally, there is a noticeable longitudinal dependence of the meridional winds in the MLT area, and accurate forecasts cannot be achieved by using only the limiting longitude as input. Furthermore, the limited data available for HWM14 development, the perturbations and tidal effects, and general variations in MLT-mean winds on interdecadal time scales are also why there are differences between radar measurements and model forecasts. Moreover, the daytime data of MST radar are used to represent the whole day, and monthly average data are extracted from the daily mean. This may have partly contributed to the smaller monthly average winds obtained from two MST radars. Calculating the Lomb-Scargle periodograms for 65–90 km winds and performing harmonic fitting on the neutral wind data reveals that the zonal and meridional winds have significant periodic oscillations (AO and SAO) at BJ and WH. The amplitude of the AO in the zonal wind declines with increasing height from 70 to 86 km. The AO amplitude is significantly more pronounced than the SAO amplitude in the zonal winds at 70–85 km. The AO amplitude of the meridional winds at 65–85 km over BJ and WH is much smaller than the AO amplitude of the zonal winds at the same altitude. The mesospheric average neutral wind is dominated by AO and also influenced by SAO. Moreover, solar activity does not appear to have a fundamental effect on the variations in wind and the acquisition rates of radar data.

Author Contributions

Conceptualization, W.Z. and X.L.; methodology, W.Z. and X.L.; software, W.Z. and X.L.; validation, W.Z., X.L. and L.C.; formal analysis, W.Z. and X.L.; investigation, W.Z., X.L. and L.C.; resources, G.C. and W.G.; data curation, G.C., W.Z., X.L. and L.C.; writing—original draft preparation, W.Z. and X.L.; writing—review and editing, W.Z. and X.L.; visualization, W.Z. and X.L.; supervision, W.Z., G.C. and W.G.; project administration, W.Z.; funding acquisition, W.Z. All authors have read and agreed to the published version of the manuscript.

Funding

This work is supported by Basic Research Special Foundation of Yunnan Province of China-General Program (grant no. 202301AT070215) and Natural Science Research Foundation of Kunming University of Science and Technology (grant no. KKZ3202307036).

Data Availability Statement

The MST radar data used in this paper can be downloaded from the Chinese Meridian Project Data Center (https://data.meridianproject.ac.cn/ (accessed on 5 December 2022)).

Acknowledgments

The authors acknowledge the use of data from the Chinese Meridian Project, and we also acknowledge the use of the HWM14 provided by the National Space Science Data Center (NSSDC). We are sincerely grateful to all reviewers and editors for their constructive comments and suggestions.

Conflicts of Interest

The authors declare no conflicts of interest.

References

  1. Dowdy, A.; Vincent, R.A.; Igarashi, K.; Murayama, Y.; Murphy, D.J. A comparison of mean winds and gravity wave activity in the northern and southern polar MLT. Geophys. Res. Lett. 2001, 28, 1475–1478. [Google Scholar] [CrossRef]
  2. Fritts, D.C.; Janches, D.; Iimura, H.; Hocking, W.K.; Bageston, J.V.; Leme, N.M.P. Drake Antarctic Agile Meteor Radar first results: Configuration and comparison of mean and tidal wind and gravity wave momentum flux measurements with Southern Argentina Agile Meteor Radar. J. Geophys. Res.-Atmos. 2012, 117, 17. [Google Scholar] [CrossRef]
  3. Kumar, G.K.; Hocking, A.K. Climatology of northern polar latitude MLT dynamics: Mean winds and tides. Ann. Geophys. 2010, 28, 1859–1876. [Google Scholar] [CrossRef]
  4. Lu, X.; Liu, A.Z.; Oberheide, J.; Wu, Q.; Li, T.; Li, Z.H.; Swenson, G.R.; Franke, S.J. Seasonal variability of the diurnal tide in the mesosphere and lower thermosphere over Maui, Hawaii (20.7°N,156.3°W). J. Geophys. Res.-Atmos. 2011, 116, 18. [Google Scholar] [CrossRef]
  5. Sandford, D.J.; Beldon, C.L.; Hibbins, R.E.; Mitchell, N.J. Dynamics of the Antarctic and Arctic mesosphere and lower thermosphere-Part 1: Mean winds. Atmos. Chem. Phys. 2010, 10, 10273–10289. [Google Scholar] [CrossRef]
  6. Sridharan, S.; Tsuda, T.; Gurubaran, S. Radar observations of long-term variability of mesosphere and lower thermosphere winds over Tirunelveli (8.7°N,77.8°E). J. Geophys. Res.-Atmos. 2007, 112, 12. [Google Scholar] [CrossRef]
  7. Wilhelm, S.; Stober, G.; Chau, J.L. A comparison of 11-year mesospheric and lower thermospheric winds determined by meteor and MF radar at 69 degrees N. Ann. Geophys. 2017, 35, 893–906. [Google Scholar] [CrossRef]
  8. Zhang, S.D.; Yi, F.; Hu, X. MF radar observation of mean wind and tides of winter mesopause (80–98 km) region over Wuhan (30°N,114°E). J. Atmos. Sol.-Terr. Phys. 2004, 66, 15–25. [Google Scholar] [CrossRef]
  9. Gong, Y.; Ma, Z.; Li, C.; Lv, X.; Zhang, S.; Zhou, Q.; Huang, C.; Huang, K.; Yu, Y.; Li, G. Characteristics of the quasi-16-day wave in the mesosphere and lower thermosphere region as revealed by meteor radar, Aura satellite, and MERRA2 reanalysis data from 2008 to 2017. Earth Planet. Phys. 2020, 4, 274–284. [Google Scholar] [CrossRef]
  10. Placke, M.; Stober, G.; Jacobi, C. Gravity wave momentum fluxes in the MLT-Part I: Seasonal variation at Collm (51.3°N, 13.0°E). J. Atmos. Sol.-Terr. Phys. 2011, 73, 904–910. [Google Scholar] [CrossRef]
  11. Zhao, G.X.; Liu, L.B.; Wan, W.X.; Ning, B.Q.; Xiong, J.G. Seasonal behavior of meteor radar winds over Wuhan. Earth Planets Space 2005, 57, 61–70. [Google Scholar] [CrossRef]
  12. Day, K.A.; Taylor, M.J.; Mitchell, N.J. Mean winds, temperatures and the 16- and 5-day planetary waves in the mesosphere and lower thermosphere over Bear Lake Observatory (42°N,111°W). Atmos. Chem. Phys. Discuss. 2011, 11, 30381–30418. [Google Scholar] [CrossRef]
  13. Tang, Q.; Zhou, Y.F.; Du, Z.T.; Zhou, C.; Qiao, J.D.; Liu, Y.; Chen, G.Y. A Comparison of Meteor Radar Observation over China Region with Horizontal Wind Model (HWM14). Atmosphere 2021, 12, 98. [Google Scholar] [CrossRef]
  14. Ma, Z.; Gong, Y.; Zhang, S.D.; Zhou, Q.H.; Huang, C.M.; Huang, K.M.; Dong, W.J.; Li, G.Z.; Ning, B.Q. Study of Mean Wind Variations and Gravity Wave Forcing Via a Meteor Radar Chain and Comparison with HWM-07 Results. J. Geophys. Res.-Atmos. 2018, 123, 9488–9501. [Google Scholar] [CrossRef]
  15. Sharma, A.K.; Gaikwad, H.P.; Ratnam, M.V.; Gurav, O.B.; Ramanjaneyulu, L.; Chavan, G.A.; Sathishkumar, S. Diurnal, monthly and seasonal variation of mean winds in the MLT region observed over Kolhapur using MF radar. J. Atmos. Sol.-Terr. Phys. 2018, 169, 91–100. [Google Scholar] [CrossRef]
  16. Zhou, B.; Xue, X.; Yi, W.; Ye, H.; Zeng, J.; Chen, J.; Wu, J.; Chen, T.; Dou, X. A comparison of MLT wind between meteor radar chain data and SDWACCM results. Earth Planet. Phys. 2022, 6, 451–464. [Google Scholar] [CrossRef]
  17. Franke, S.J.; Thorsen, D. Mean Winds and Tides in the Upper Middle Atmosphere at Urbana (40°N, 88°W) During 1991–1992. J. Geophys. Res. Part D Atmos. 1993, 98, 18607–18615. [Google Scholar] [CrossRef]
  18. Kishore, P.; Namboothiri, S.P.; Igarashi, K. Study of mesosphere lower thermosphere (MLT) mean winds over Yamagawa (31.2°N, 130.6°E) during 1996–1998. J. Geophys. Res.-Atmos. 2000, 105, 24863–24870. [Google Scholar] [CrossRef]
  19. Havnes, O.; Brattli, A.; Aslaksen, T.; Singer, W.; Latteck, R.; Blix, T.; Thrane, E.; Troim, J. First common volume observations of layered plasma structures and polar mesospheric summer echoes by rocket and radar. Geophys. Res. Lett. 2001, 28, 1419–1422. [Google Scholar] [CrossRef]
  20. Pfaff, R.; Holzworth, R.; Goldberg, R.; Freudenreich, H.; Voss, H.; Croskey, C.; Mitchell, J.; Gumbel, J.; Bounds, S.; Singer, W.; et al. Rocket probe observations of electric field irregularities in the polar summer mesosphere. Geophys. Res. Lett. 2001, 28, 1431–1434. [Google Scholar] [CrossRef]
  21. Hoppe, U.P.; Eriksen, T.; Thrane, E.V.; Blix, T.A.; Fiedler, J.; Lübken, F.J. Observations in the polar middle atmosphere by rocket-borne Rayleigh lidar:: First results. Earth Planets Space 1999, 51, 815–824. [Google Scholar] [CrossRef]
  22. Antonsen, T.; Havnes, O. On the detection of mesospheric meteoric smoke particles embedded in noctilucent cloud particles with rocket-borne dust probes. Rev. Sci. Instrum. 2015, 86, 12. [Google Scholar] [CrossRef]
  23. Ern, M.; Preusse, P.; Alexander, M.J.; Warner, C.D. Absolute values of gravity wave momentum flux derived from satellite data. J. Geophys. Res.-Atmos. 2004, 109, 17. [Google Scholar] [CrossRef]
  24. Ern, M.; Preusse, P.; Gille, J.C.; Hepplewhite, C.L.; Mlynczak, M.G.; Russell, J.M.; Riese, M. Implications for atmospheric dynamics derived from global observations of gravity wave momentum flux in stratosphere and mesosphere. J. Geophys. Res.-Atmos. 2011, 116, 24. [Google Scholar] [CrossRef]
  25. Alexander, M.J.; Gille, J.; Cavanaugh, C.; Coffey, M.; Craig, C.; Eden, T.; Francis, G.; Halvorson, C.; Hannigan, J.; Khosravi, R.; et al. Global estimates of gravity wave momentum flux from High Resolution Dynamics Limb Sounder observations. J. Geophys. Res.-Atmos. 2008, 113, 11. [Google Scholar] [CrossRef]
  26. Oberheide, J.; Lehmacher, G.A.; Offermann, D.; Grossmann, K.U.; Manson, A.H.; Meek, C.E.; Schmidlin, F.J.; Singer, W.; Hoffmann, P.; Vincent, R.A. Geostrophic wind fields in the stratosphere and mesosphere from satellite data. J. Geophys. Res.-Atmos. 2002, 107, 18. [Google Scholar] [CrossRef]
  27. Hocking, W.K. Strengths and limitations of MST radar measurements of middle-atmosphere winds. Ann. Geophys.-Atmos. Hydrospheres Space Sci. 1997, 15, 1111–1122. [Google Scholar] [CrossRef]
  28. Zhao, Z.Y.; Zhou, C.; Qing, H.Y.; Yang, G.B.; Zhang, Y.N.; Chen, G.; Hu, Y.G. Wuhan Atmosphere Radio Exploration (WARE) radar: System design and online winds measurements. Radio Sci. 2013, 48, 326–333. [Google Scholar] [CrossRef]
  29. Ratnam, M.V.; Rao, D.N.; Rao, T.N.; Thulasiraman, S.; Nee, J.B.; Gurubaran, S.; Rajaram, R. Mean winds observed with Indian MST radar over tropical mesosphere and comparison with various techniques. Ann. Geophys. 2001, 19, 1027–1038. [Google Scholar] [CrossRef]
  30. Sheth, R.; Kudeki, E.; Lehmacher, G.; Sarango, M.; Woodman, R.; Chau, J.; Guo, L.; Reyes, P. A high-resolution study of mesospheric fine structure with the Jicamarca MST radar. Ann. Geophys. 2006, 24, 1281–1293. [Google Scholar] [CrossRef]
  31. Chen, G.; Cui, X.; Chen, F.L.; Zhao, Z.Y.; Wang, Y.; Yao, Q.; Wang, C.; Lü, D.R.; Zhang, S.D.; Zhang, X.X.; et al. MST Radars of Chinese Meridian Project: System Description and Atmospheric Wind Measurement. IEEE Trans. Geosci. Remote Sens. 2016, 54, 4513–4523. [Google Scholar] [CrossRef]
  32. Qiao, L.; Chen, G.; Zhang, S.D.; Yao, Q.; Gong, W.L.; Su, M.K.; Chen, F.L.; Liu, E.X.; Zhang, W.F.; Zeng, H.Y.; et al. Wuhan MST radar: Technical features and validation of wind observations. Atmos. Meas. Tech. 2020, 13, 5697–5713. [Google Scholar] [CrossRef]
  33. Nakamura, T.; Tsuda, T.; Fukao, S. Mean winds at 60–90 km observed with the MU radar (35°N). J. Atmos. Terr. Phys. 1996, 58, 655–660. [Google Scholar] [CrossRef]
  34. Latteck, R.; Strelnikova, I. Extended observations of polar mesosphere winter echoes over Andoya (69°N) using MAARSY. J. Geophys. Res.-Atmos. 2015, 120, 8216–8226. [Google Scholar] [CrossRef]
  35. Kumar, G.K.; Ratnam, M.V.; Patra, A.K.; Rao, V.; Rao, S.V.B.; Kumar, K.K.; Gurubaran, S.; Ramkumar, G.; Rao, D.N. Low-latitude mesospheric mean winds observed by Gadanki mesosphere-stratosphere- troposphere (MST) radar and comparison with rocket, High Resolution Doppler Imager (HRDI), and MF radar measurements and HWM93. J. Geophys. Res.-Atmos. 2008, 113, 12. [Google Scholar] [CrossRef]
  36. Ratnam, M.V.; Kumar, G.K.; Murthy, B.V.K.; Patra, A.K.; Rao, V.; Rao, S.V.B.; Kumar, K.K.; Ramkumar, G. Long-term variability of the low latitude mesospheric SAO and QBO and their relation with stratospheric QBO. Geophys. Res. Lett. 2008, 35, 5. [Google Scholar] [CrossRef]
  37. Tian, Y.F.; Lu, D.R. Comparison of Beijing MST radar and radiosonde horizontal wind measurements. Adv. Atmos. Sci. 2017, 34, 39–53. [Google Scholar] [CrossRef]
  38. Tian, Y.; Chen, Z.; Lyu, D. A dataset of Beijing MST radar horizontal wind fields at Xianghe Station in 2012. China Sci. Data 2021, 6, 1. [Google Scholar]
  39. Gong, W.; Zhou, X.; Chen, G.; Zhang, W. Mesosphere-Stratosphere-Troposphere radar dataset during 2012–2020 from Chongyang, Wuhan Station. China Sci. Data 2021, 6, 1. [Google Scholar] [CrossRef]
  40. Zhang, W.F.; Chen, G.; Zhang, S.D.; Gong, W.L.; Chen, F.L.; He, Z.Q.; Huang, K.M.; Wang, Z.H.; Li, Y.X. Statistical Study of the Midlatitude Mesospheric Vertical Winds Observed by the Wuhan and Beijing MST Radars in China. J. Geophys. Res.-Atmos. 2020, 125, 16. [Google Scholar] [CrossRef]
  41. Hedin, A.E.; Fleming, E.L.; Manson, A.H.; Schmidlin, F.J.; Avery, S.K.; Clark, R.R.; Franke, S.J.; Fraser, G.J.; Tsuda, T.; Vial, F.; et al. Empirical wind model for the upper, middle and lower atmosphere. J. Atmos. Terr. Phys. 1995, 58, 1421–1447. [Google Scholar] [CrossRef]
  42. Drob, D.P.; Emmert, J.T.; Crowley, G.; Picone, J.M.; Shepherd, G.G.; Skinner, W.; Hays, P.; Niciejewski, R.J.; Larsen, M.; She, C.Y.; et al. An empirical model of the Earth’s horizontal wind fields: HWM07. J. Geophys. Res.-Space Phys. 2008, 113, 18. [Google Scholar] [CrossRef]
  43. Emmert, J.T.; Drob, D.P.; Shepherd, G.G.; Hernandez, G.; Jarvis, M.J.; Meriwether, J.W.; Niciejewski, R.J.; Sipler, D.P.; Tepley, C.A. DWM07 global empirical model of upper thermospheric storm-induced disturbance winds. J. Geophys. Res.-Space Phys. 2008, 113, 16. [Google Scholar] [CrossRef]
  44. Drob, D.P.; Emmert, J.T.; Meriwether, J.W.; Makela, J.J.; Doornbos, E.; Conde, M.; Hernandez, G.; Noto, J.; Zawdie, K.A.; McDonald, S.E.; et al. An update to the Horizontal Wind Model (HWM): The quiet time thermosphere. Earth Space Sci. 2015, 2, 301–319. [Google Scholar] [CrossRef]
  45. Huba, J.D.; Ossakow, S.L.; Joyce, G.; Krall, J.; England, S.L. Three-dimensional equatorial spread F modeling: Zonal neutral wind effects. Geophys. Res. Lett. 2009, 36. [Google Scholar] [CrossRef]
  46. Kelly, M.A.; Comberiate, J.M.; Miller, E.S.; Paxton, L.J. Progress toward forecasting of space weather effects on UHF SATCOM after Operation Anaconda. Space Weather 2014, 12, 601–611. [Google Scholar] [CrossRef]
  47. Scargle, J.D. Studies in astronomical time series analysis. II-Statistical aspects of spectral analysis of unevenly spaced data. Astrophys. J. 1982, 263, 835–853. [Google Scholar] [CrossRef]
  48. Lomb, N.R. Least-squares frequency analysis of unequally spaced data. Astrophys. Space Sci. 1976, 39, 447–462. [Google Scholar] [CrossRef]
  49. Vincent, R.A.; Kovalam, S.; Fritts, D.C.; Isler, J.R. Long-term MF radar observations of solar tides in the low-latitude mesosphere: Interannual variability and comparisons with the GSWM. J. Geophys. Res.-Atmos. 1998, 103, 8667–8683. [Google Scholar] [CrossRef]
  50. Zhang, X.L.; Forbes, J.M.; Hagan, M.E.; Russell, J.M.; Palo, S.E.; Mertens, C.J.; Mlynczak, M.G. Monthly tidal temperatures 20–120 km from TIMED/SABER. J. Geophys. Res.-Space Phys. 2006, 111, 20. [Google Scholar] [CrossRef]
  51. Yu, Y.; Wan, W.X.; Ren, Z.P.; Xiong, B.; Zhang, Y.; Hu, L.H.; Ning, B.Q.; Liu, L.B. Seasonal variations of MLT tides revealed by a meteor radar chain based on Hough mode decomposition. J. Geophys. Res.-Space Phys. 2015, 120, 7030–7048. [Google Scholar] [CrossRef]
  52. Wilhelm, S.; Stober, G.; Brown, P. Climatologies and long-term changes in mesospheric wind and wave measurements based on radar observations at high and mid latitudes. Ann. Geophys. 2019, 37, 851–875. [Google Scholar] [CrossRef]
  53. Stober, G.; Baumgarten, K.; McCormack, J.P.; Brown, P.; Czarnecki, J. Comparative study between ground-based observations and NAVGEM-HA analysis data in the mesosphere and lower thermosphere region. Atmos. Chem. Phys. 2020, 20, 11979–12010. [Google Scholar] [CrossRef]
  54. Fritts, D.C.; Alexander, M.J. Gravity wave dynamics and effects in the middle atmosphere. Rev. Geophys. 2003, 41, 1003. [Google Scholar] [CrossRef]
  55. Suzuki, S.; Nakamura, T.; Ejiri, M.K.; Tsutsumi, M.; Shiokawa, K.; Kawahara, T.D. Simultaneous airglow, lidar, and radar measurements of mesospheric gravity waves over Japan. J. Geophys. Res.-Atmos. 2010, 115. [Google Scholar] [CrossRef]
  56. Matthias, V.; Dörnbrack, A.; Stober, G. The extraordinarily strong and cold polar vortex in the early northern winter 2015/2016. Geophys. Res. Lett. 2016, 43, 12287–12294. [Google Scholar] [CrossRef]
  57. Stober, G.; Matthias, V.; Jacobi, C.; Wilhelm, S.; Höffner, J.; Chau, J.L. Exceptionally strong summer-like zonal wind reversal in the upper mesosphere during winter 2015/16. Ann. Geophys. 2017, 35, 711–720. [Google Scholar] [CrossRef]
  58. Friedman, J.S. Tropical mesopause climatology over the Arecibo Observatory. Geophys. Res. Lett. 2003, 30, 4. [Google Scholar] [CrossRef]
  59. Laskar, F.I.; Chau, J.L.; St-Maurice, J.P.; Stober, G.; Hall, C.M.; Tsutsumi, M.; Hoffner, J.; Hoffmann, P. Experimental Evidence of Arctic Summer Mesospheric Upwelling and Its Connection to Cold Summer Mesopause. Geophys. Res. Lett. 2017, 44, 9151–9158. [Google Scholar] [CrossRef]
  60. Hu, X.; Zhang, X.; Igarashi, K.; Zhang, D. A preliminary comparison of observations with MF radars in Wuhan and Yamagawa at 30–31 N. J. Atmos. Sol.-Terr. Phys. 2006, 68, 1036–1042. [Google Scholar] [CrossRef]
  61. Manson, A.H.; Meek, C.E.; Hall, C.M.; Nozawa, S.; Mitchell, N.J.; Pancheva, D.; Singer, W.; Hoffmann, P. Mesopause dynamics from the scandinavian triangle of radars within the PSMOS-DATAR Project. Ann. Geophys. 2004, 22, 367–386. [Google Scholar] [CrossRef]
  62. Jacobi, C.; Hoffmann, P.; Liu, R.Q.; Merzlyakov, E.G.; Portnyagin, Y.I.; Manson, A.H.; Meek, C.E. Long-term trends, their changes, and interannual variability of Northern Hemisphere midlatitude MLT winds. J. Atmos. Sol.-Terr. Phys. 2012, 75–76, 81–91. [Google Scholar] [CrossRef]
  63. Chau, J.L.; Hoffmann, P.; Pedatella, N.M.; Matthias, V.; Stober, G. Upper mesospheric lunar tides over middle and high latitudes during sudden stratospheric warming events. J. Geophys. Res.-Space Phys. 2015, 120, 3084–3096. [Google Scholar] [CrossRef]
  64. Mbatha, N.; Sivakumar, V.; Malinga, S.B.; Bencherif, H.; Pillay, S.R. Study on the impact of sudden stratosphere warming in the upper mesosphere-lower thermosphere regions using satellite and HF radar measurements. Atmos. Chem. Phys. 2010, 10, 3397–3404. [Google Scholar] [CrossRef]
  65. Stray, N.H.; Orsolini, Y.J.; Espy, P.J.; Limpasuvan, V.; Hibbins, R.E. Observations of planetary waves in the mesosphere-lower thermosphere during stratospheric warming events. Atmos. Chem. Phys. 2015, 15, 4997–5005. [Google Scholar] [CrossRef]
  66. Ma, Z.; Gong, Y.; Zhang, S.D.; Zhou, Q.H.; Huang, C.M.; Huang, K.M.; Yu, Y.; Li, G.Z.; Ning, B.Q.; Li, C. Responses of Quasi 2 Day Waves in the MLT Region to the 2013 SSW Revealed by a Meteor Radar Chain. Geophys. Res. Lett. 2017, 44, 9142–9150. [Google Scholar] [CrossRef]
  67. Zhou, B.Z.; Yi, W.; Xue, X.H.; Ye, H.L.; Zeng, J.; Li, G.Z.; Tsutsumi, M.; Gulbrandsen, N.; Chen, T.D.; Dou, X.K. Impact of sudden stratospheric warmings on the neutral density, temperature and wind in the MLT region. Front. Astron. Space Sci. 2023, 10, 9. [Google Scholar] [CrossRef]
  68. Portnyagin, Y.I.; Merzlyakov, E.G.; Solovjova, T.V.; Jacobi, C.; Kurschner, D.; Manson, A.; Meek, C. Long-term trends and year-to-year variability of mid-latitude mesosphere/lower thermosphere winds. J. Atmos. Sol.-Terr. Phys. 2006, 68, 1890–1901. [Google Scholar] [CrossRef]
  69. Gong, Y.; Zhou, Q.H.; Zhang, S.D. Atmospheric tides in the low-latitude E and F regions and their responses to a sudden stratospheric warming event in January 2010. J. Geophys. Res.-Space Phys. 2013, 118, 7913–7927. [Google Scholar] [CrossRef]
  70. Jia, M.J.; Xue, X.H.; Gu, S.Y.; Chen, T.D.; Ning, B.Q.; Wu, J.F.; Zeng, X.Y.; Dou, X.K. Multiyear Observations of Gravity Wave Momentum Fluxes in the Midlatitude Mesosphere and Lower Thermosphere Region by Meteor Radar. J. Geophys. Res.-Space Phys. 2018, 123, 5684–5703. [Google Scholar] [CrossRef]
  71. Yi, W.; Xue, X.H.; Reid, I.M.; Murphy, D.J.; Hall, C.M.; Tsutsumi, M.; Ning, B.Q.; Li, G.Z.; Vincent, R.A.; Chen, J.S.; et al. Climatology of the mesopause relative density using a global distribution of meteor radars. Atmos. Chem. Phys. 2019, 19, 7567–7581. [Google Scholar] [CrossRef]
  72. Rao, N.V.; Tsuda, T.; Riggin, D.M.; Gurubaran, S.; Reid, I.M.; Vincent, R.A. Long-term variability of mean winds in the mesosphere and lower thermosphere at low latitudes. J. Geophys. Res.-Space Phys. 2012, 117, 16. [Google Scholar] [CrossRef]
  73. Namboothiri, S.P.; Kishore, P.; Igarashi, K.; Nakamura, T.; Tsuda, T. MF radar observations of mean winds over Yamagawa (31.2° N, 130.6° E) and Wakkanai (45.4° N, 141.7° E). J. Atmos. Sol.-Terr. Phys. 2000, 62, 1177–1187. [Google Scholar] [CrossRef]
  74. Keuer, D.; Hoffmann, P.; Singer, W.; Bremer, J. Long-term variations of the mesospheric wind field at mid-latitudes. Ann. Geophys. 2007, 25, 1779–1790. [Google Scholar] [CrossRef]
  75. Jacobi, C.; Kürschner, D. Long-term trends of MLT region winds over Central Europe. Phys. Chem. Earth. 2006, 31, 16–21. [Google Scholar] [CrossRef]
  76. Qian, L.Y.; Jacobi, C.; McInerney, J. Trends and Solar Irradiance Effects in the Mesosphere. J. Geophys. Res.-Space Phys. 2019, 124, 1343–1360. [Google Scholar] [CrossRef]
  77. Middleton, H.R.; Mitchell, N.J.; Muller, H.G. Mean winds of the mesosphere and lower thermosphere at 52° N in the period 1988–2000. Ann. Geophys. 2018, 20, 81–91. [Google Scholar] [CrossRef]
  78. Pokhotelov, D.; Becker, E.; Stober, G.; Chau, J.L. Seasonal variability of atmospheric tides in the mesosphere and lower thermosphere: Meteor radar data and simulations. Ann. Geophys. 2018, 36, 825–830. [Google Scholar] [CrossRef]
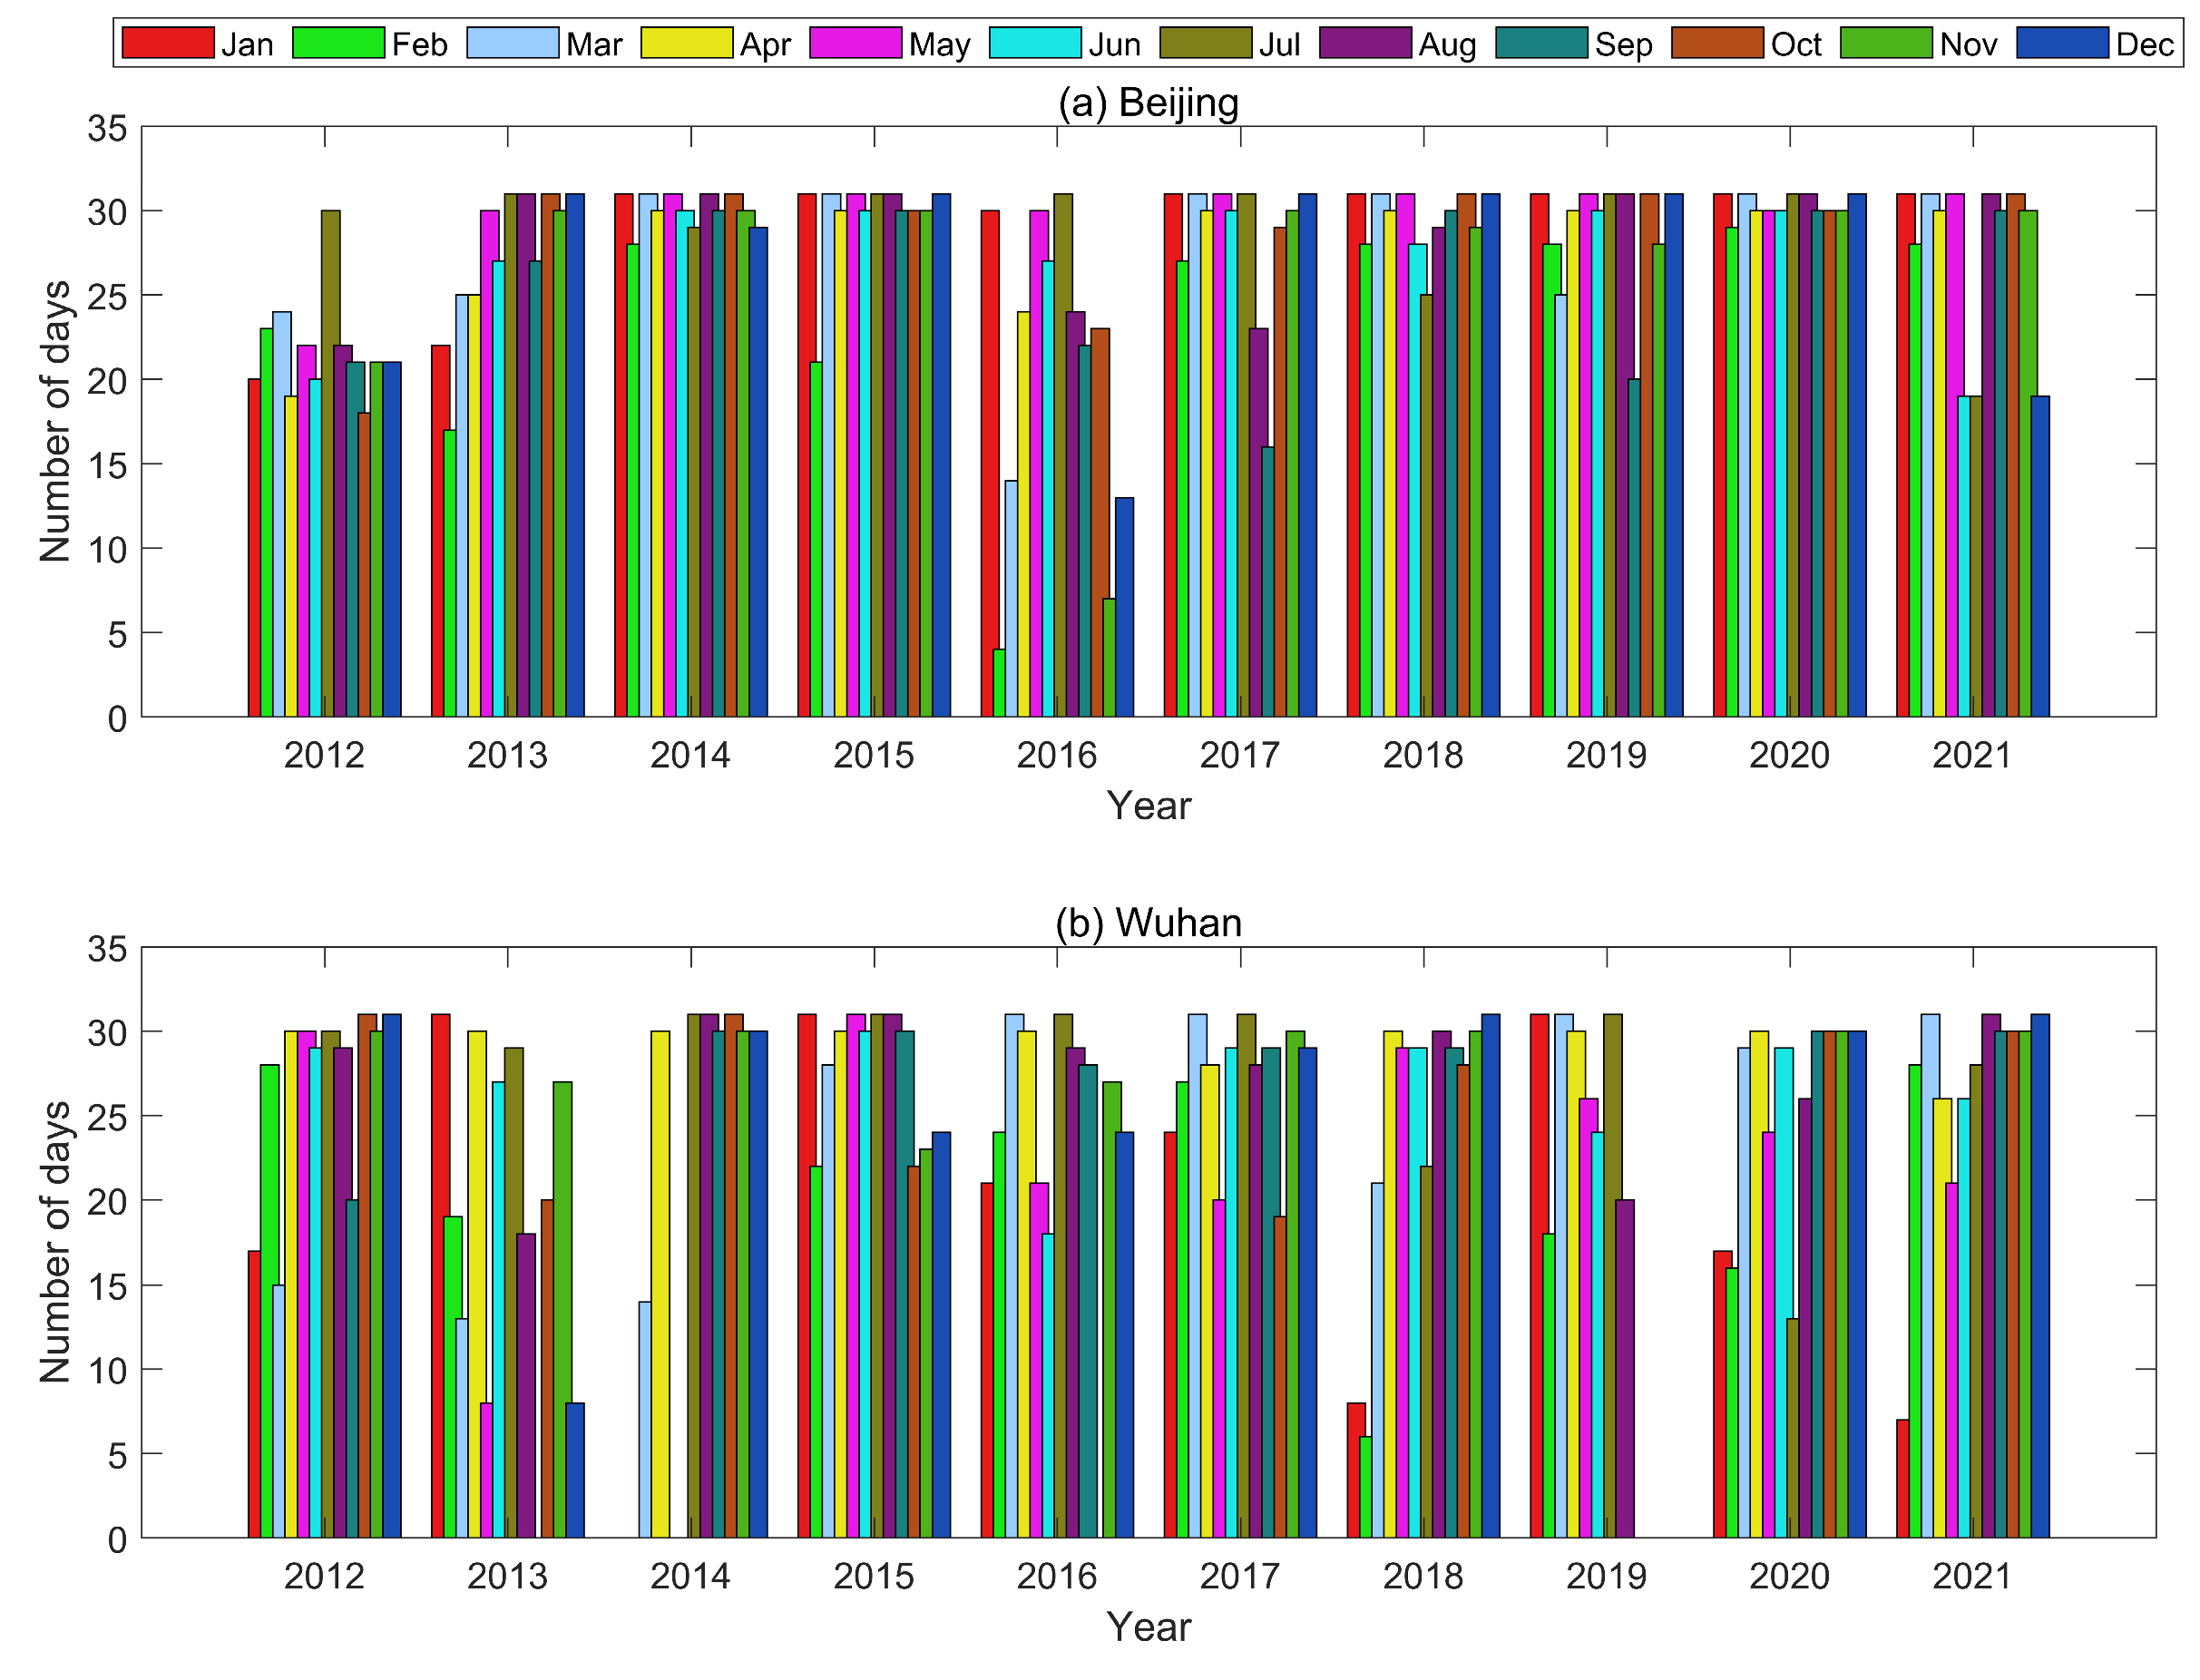
Figure 1. The number of valid observation days in the 65–90 km range in each month of Beijing and Wuhan MST radars. Different color bars indicate different months from 2012 to 2021.
Remotesensing 17 00806 g001
Figure 2. Comparison of the spring diurnal variations of zonal winds (a) and meridional winds (b) in the integrated year between BJ and WH MST radar observations (left) and HWM14 model predictions (middle). Positive values indicate eastward zonal winds or northward meridional winds, and negative values indicate westward zonal winds or southward meridional winds. The two thin red lines in the model prediction on the right indicate the sunrise and sunset times, respectively. The black slashes indicate that the significant level of wind speed changes are above 90%. (c,d) represent the correlation coefficients between the observed and model-forecasted wind speed values for zonal and meridional winds, respectively, during the spring daytime.
Remotesensing 17 00806 g002
Figure 3. Same as Figure 2 but for data in summer.
Remotesensing 17 00806 g003
Figure 4. Same as Figure 2 but for data in autumn.
Remotesensing 17 00806 g004
Figure 5. Same as Figure 2 but for data in winter.
Remotesensing 17 00806 g005
Figure 6. The day-to-day changes in zonal (a) and meridional wind (b) of the BJ and WH MST radars during the consolidated year.
Remotesensing 17 00806 g006
Figure 7. Comparison between the actual measurements (left) and the HWM14 model predictions (right) for the monthly average zonal (a) and meridional winds (b) during the integrated year at the BJ and WH MST radar stations.
Remotesensing 17 00806 g007
Figure 8. Contour of the Lomb-Scargle spectral relative amplitude of zonal winds (a) and meridional winds (b) detected by two MST radars at BJ and WH sites.
Remotesensing 17 00806 g008
Figure 9. Harmonic fitting results for zonal winds from BJ and WH MST radars: (a) AO and (b) SAO amplitudes, while (c) AO and (d) SAO phases.
Remotesensing 17 00806 g009
Figure 10. Harmonic fitting results of meridional winds from MST radars at BJ and WH stations: (a) AO and (b) SAO amplitudes, while (c) AO and (d) SAO phases.
Remotesensing 17 00806 g010
Figure 11. The variation of F10.7 index from 2012 to 2021. The blue line is the 27-day averaged F10.7, and the black line is the smoothed F10.7 by polynomial fitting.
Remotesensing 17 00806 g011
Table 1. Geographic positions, operating frequencies, time period of data, altitude and time resolution of the MST radars used in this study.
MST RadarGeographic LocationFrequencyData Used in this Study
(Number of Observed Profiles)
Altitude ResolutionTime Resolution
Beijing (BJ)39.75°N, 116.96°E50 MHz01/01/2012–31/12/2021 (188,520)1.13 km30 min
Wuhan (WH)29.51°N, 114.13°E53.8 MHz01/01/2012–31/12/2021
(158,781)
(2012–2013) 1.13 km
(2014–2015) 1.18 km
(2016–2017) 1.17 km
(2018–2021) 1.16 km
30 min
Disclaimer/Publisher’s Note: The statements, opinions and data contained in all publications are solely those of the individual author(s) and contributor(s) and not of MDPI and/or the editor(s). MDPI and/or the editor(s) disclaim responsibility for any injury to people or property resulting from any ideas, methods, instructions or products referred to in the content.