Abstract
The Michelson interferometer for global high-resolution thermospheric imaging (MIGHTI) aboard the NASA ionospheric connection (ICON) satellite offers extensive atmospheric wind field data for mid-latitude regions and has recently released its version 5 (v05) data. We conducted a comprehensive comparison and validation of MIGHTI v05 level 2.2 data for the period from December 2019 to October 2022, covering all MIGHTI data in orbit. In a comparison of raw wind speeds, MIGHTI demonstrates good agreement with the ground-based Fabry–Pérot interferometer (FPI), meteor radars, and the space-borne instrument TIMED Doppler interferometer (TIDI). However, some differences still exist. Comparisons with meteor radars revealed differences attributable to observational altitude, day–night variations, and latitude distribution. Below 100 km, MIGHTI and meteor radar exhibit excellent consistency (r = 0.819 for zonal and r = 0.782 for meridional winds). Day–night differences are minimal, with closer amplitude values observed at night. MIGHTI shows stronger correlations with low-latitude meteor radar, with coefficients of 0.859 (zonal) and 0.891 (meridional) at Ledong. The meridional wind correlation is better in low-latitude regions, in contrast to mid-latitudes. Similar observations were made in a comparison with FPI, emphasizing the need for caution when considering the meridional wind component of MIGHTI at observational boundaries (~40 °N). In addition to comparing raw wind speed data, we analyzed the amplitude of fluctuations extracted by MIGHTI and TIDI by employing the least squares method to extract planetary waves. The results indicate that both TIDI and MIGHTI observe the same fluctuation events, but TIDI extracts larger fluctuation amplitudes than MIGHTI. Finally, we present, for the first time, the spatial structure of a five-day wave that occurred in March 2020.
1. Introduction
The middle and upper atmosphere refers to a region of 50–500 km in altitude, which exhibits complex spatiotemporal dynamics with numerous inter-layer energy transfer mechanisms that remain unclear.
Neutral winds play a crucial role in the middle and upper atmosphere, serving as an essential parameter for investigating atmospheric dynamic processes. Among the various atmospheric phenomena, planetary waves are of particular significance in middle and upper atmospheric dynamics research, acting as a key medium for energy transfer and atmospheric coupling [1,2]. These waves, characterized by quasi-horizontal motion, are primarily generated by differential atmospheric heating and land–sea topographic effects, exhibiting distinct periodicity and regularity [3,4,5]. The formation and evolution of planetary waves are significantly influenced by horizontal wind fields, while simultaneously exerting feedback effects on wind field dynamics [4]. Therefore, precise wind measurement techniques are essential. Atmospheric wind detection ground-based equipment, including LiDAR, geomagnetic (electrical) equipment, radio equipment, optical equipment, such as meteor radar [6,7,8,9], the Fabry–Pérot interferometer [10,11], etc.
Meteor radar, capable of operating around the clock regardless of weather conditions, stands as the most common method for acquiring wind speed measurements in the mesosphere and lower thermosphere (MLT) regions. Due to its exceptional local time coverage, it is frequently utilized for studying atmospheric phenomena such as tides and planetary-scale waves [6,12]. The Fabry–Pérot interferometer (FPI) is utilized as a passive instrument to measure wind velocity and temperature in the airglow region, and it is the only ground-based device that can detect thermospheric winds and temperatures at ~250 km. Over the years, the sensitivity of FPI technology has been remarkably improved by one or two orders of magnitude. Recently, the maximum standard deviation method (MSDM) was proposed to invert wind velocity and temperature from FPI, which demonstrated high precision and robustness under distorted and noisy interferometric conditions [10].
Compared with ground-based equipment, satellite-based equipment has a broader coverage area. The satellite motion allows the payload to scan a larger area in a shorter period of time, which helps to capture fluctuations on small time scales without meteorological constraints such as clouds and precipitation.
For example, the TIMED Doppler interferometer (TIDI), installed on the thermosphere ionosphere–mesosphere dynamics and energetics (TIMED) satellite launched in December 2001. TIDI utilizes the FPI technique, with the O2(0-0) band as its targeted spectral line [13]. So far, TIDI continues its operational status, and its data products are widely utilized. Recently, Sun et al. [12] analyzed the global distribution and spatial structure of QTDWs with different zonal wavenumbers, using the wind data obtained from TIDI. Zhou et al. [8] conducted a joint analysis of observational data from TIDI and a meteor radar chain around the meridian 120 °E, during the years 2012–2015 and 2018–2020; they derived the diurnal variation of eastward-propagating diurnal tides with zonal wave number 3 (DE3) and suggested that it is primarily due to changes in tidal phase.
The Michelson interferometer for global high-resolution thermospheric imaging (MIGHTI) is on board the Ionospheric Connection Explorer (ICON), launched in 2019 to measure thermospheric neutral winds via the Doppler asymmetric spatial aberration (DASH) technique [14,15]. The MIGHTI interferometer is designed to obtain global atmospheric temperature and wind speed profiles in the Earth’s upper atmosphere [15].
Due to differences in orbital parameters and detection modes, MIGHTI’s observations offer enhanced data coverage compared to TIDI in equatorial and mid-latitude regions. Despite the current loss of communication with ICON, data retrieval is still being refined. Therefore, cross-validation of all MIGHTI data during the ICON orbital period holds significant relevance. The latest version of MIGHTI data is now version 5 (v05); this improves the accuracy of the data by two to three orders of magnitude compared to version 4 (v04), which uses the HWM14 as a zero wind reference, whereas v05 takes into account instrument errors [16]. For the previously released v04 data, MIGHTI is in good agreement with meteor radar, FPI, and TIMED/TIDI, respectively [17,18,19,20]. He et al. [21] used four low-latitude meteor radar systems and MIGHTI wind data to investigate the quasi-two-day waves (Q2DWs) at altitudes of 95–200 km in early 2020. They found that the amplitudes of these waves stayed consistent between 80 and 100 km. Above 106 km, the Q2DW amplitudes and phases showed structures that were possibly from the combination of Q2DWs and their secondary waves. Cross-validation was similarly conducted for the MIGHTI v05 wind data. Englert et al. [16] compared the results of the v05 MIGHTI Level 2.1 product (line-of-sight winds) from both the night-time green-line and red-line observations to those obtained from a set of ground-based FPIs during the time period of April 2020 through March 2022. They also compared the green-line observations to those obtained from Tirupati SMR in 2020 and 2021, generally showing good agreement. Yamazaki et al. [22] used ICON/MIGHTI v05 wind measurements to analyze the monthly climatological data of zonal-mean winds and tides from April 2020 to March 2022. Results were compared with the horizontal wind model 2014 (HWM14), which showed that ICON/MIGHTI measurements generally showed higher values than HWM14 and another model, the climatological tidal model of the thermosphere (CTMT).
Therefore, a comprehensive comparison and validation of MIGHTI v05 data are of great significance. We selected ground-based instruments such as Xinglong FPI, meteor radars, etc., and conducted a thorough comparison and validation with MIGHTI v05 data. This covered the period from December 2019 to October 2022, corresponding to the entire on-orbit duration of ICON. Additionally, we conducted comparative validation with the onboard instrument TIDI. In this comparison, we not only compared the original wind speeds but also examined the planetary waves in early 2020 extracted by both instruments.
2. Materials and Methods
2.1. MIGHTI
ICON is the newest addition to NASA’s fleet of Heliophysics satellites, with a 27-degree inclination orbit at ~575 km [15]. MIGHTI consists of 2 sensors with orthogonal fields of view, pointing horizontally at 45° and 135° from the flight direction, using limb-sounding and vertical electronic scanning with CCD to measure winds at altitudes of 90 to 300 km by observing the Doppler shifted spectra of OI 557.7 and 630.0 nm emissions [14]. The vertical resolution of MIGHTI in the MLT is ~3 km and ~10 km in the thermosphere. In MIGHTI’s limb-viewing geometry, they cover latitudes from ~12°S to 42°N. MIGHTI daytime and night-time single exposure times are 30 and 60 s, respectively, which corresponds to 250–500 km along the satellite track [14].
MIGHTI version 5 (v05) data utilize a new calibration technique for the “zero wind” condition. This method involves a 96-day comparison of ascending and descending orbit data, enabling a self-calibration of the zero baseline [16]. The estimated accuracy of the v05 wind data is generally 10–25 m/s [16,22]. In this study, we utilize MIGHTI v05 version level 2.2 data products, considering only data with a quality of 1 for this study.
2.2. Meteor Radar
The meteor radars used in this study, all manufactured by the same producer, utilize a common design employing a cross-dipole antenna for transmission and five cross-dipole antennas arranged orthogonally for independent reception [7,23,24,25]. Due to the scattering effect of meteor trails on radio waves, a portion of the energy is reflected back to the radar-receiving antenna. This enables the detection of Doppler shift and, thus, the determination of wind speed in the target area.
In this comparison, we used meteor radar data from Tirupati, Ledong, Wuhan, and Beijing, covering the low and middle latitudes of the northern hemisphere. The main operation parameters of the meteor radars can be found in Table 1. Atmospheric observations can be obtained by measuring the radial drift velocity of the ionized trail. These winds have been estimated by binning the meteor measurements in time and altitude, using a Gaussian weighting function of 1 hour and 2 km in time and altitude, respectively [18,23]. Meteor radars typically achieve wind measurement accuracies of 5–10 m/s [26,27].

Table 1.
Main operation parameters of the meteor radars employed for comparison.
2.3. FPI
The Xinglong FPI (40.2°N, 117.4°E) has been operational since early April 2010, consisting of six key subsystems: the sky-scanner system, the filter-controlled system, the F-P etalon, the auto-focused lens system, and the data acquisition and saving system. It is capable of receiving three airglow emissions with wavelengths corresponding to OH 892.0 nm, OI 557.7 nm, and OI 630.0 nm, at heights of 87, 98, and 250 km, respectively [28].
The sky-scanner system controls the instrument’s observation direction and elevation, the filter-controlled system is used to select the working wavelength and filter out stray light in the corresponding wavelength airglow, the F-P etalon induces interference in the incident light, cleared of stray light, to interfere and produce interference fringes. Then, the auto-focusing lens system converges the radiation signal onto a back-illuminated CCD detector with 1024 × 1024 pixels, obtaining clear airglow interference images. According to the Doppler shift and expansion of the airglow interference images, the wind speed and temperature at the corresponding heights can be inferred. Each observation cycle spans approximately 1 h, encompassing scanning, lens movement, CCD readout, and exposure time. Exposure time typically ranges from 3 to 5 min, contingent on different emission wavelengths [28]. The wind error measured by Xinglong FPI is around 1 m/s and 2–6 m/s at 557 nm and 630 nm, respectively [9].
In this study, data points where the FPI measured wind speeds greater than 250 m/s at 630 nm (with errors over 50 m/s) and greater than 150 m/s at 557 nm (with errors over 30 m/s) were excluded. These thresholds were selected, based on prior studies indicating that such high wind speeds and large uncertainties are typically associated with measurement errors or low signal-to-noise ratios [29].
2.4. TIDI
TIMED is in a circular orbit at a nominal altitude of 625 km, with an inclination angle of 74 degrees, which represents true global coverage of the measured on-orbit neutral wind. TIDI is a Fabry–Pérot interferometer designed specifically for studying the dynamics of the Earth’s middle atmosphere and lower thermosphere-ionosphere (MLTI). Operating within an altitude range of 70 to 120 km, TIDI measures the horizontal vector wind field with a vertical resolution of ~2 km, with peak accuracies that approach 3 m/s [30]; however, the systematic errors are difficult to determine [31]. TIDI daytime and night-time exposure times are 0.75 s and 3 s, respectively. Each up/down acquisition cycle takes about 100–200 s to complete, resulting in a nominal horizontal spacing between profiles of approximately 750 km along the orbit track [30]. The precession rate of the TIDI satellite is about 12 min per day, so full LST coverage is achieved every 60 days [19].
TIDI consists of four telescopes, and the limb is sampled simultaneously in four orthogonal directions by vertically scanning telescopes that are oriented in a cross-shaped pattern 45 degrees to the satellite velocity vector. The TIDI telescopes facing the sunward side are referred to as the “warm side,” and those facing away from the sun are called the “cold side”. The TIMED satellite performs a 180° yaw maneuver roughly every 60 days to ensure that the warm side of the satellite is always pointing toward the sun, while the cold side remains away from the sun [19].
Due to inconsistencies in the accuracy of the TIDI cold-side and warm-side data inversions, particularly with a greater volume of warm-side data from 2019 to 2022, we only used warm-side data.
2.5. Methodologies
The locations of all the ground-based instruments used in this study are shown in Figure 1. In the comparison between MIGHTI and meteor radars, we applied a spatiotemporal window of 300 km and 30 min to each meteor radar measurement and interpolated the MIGHTI data in altitude to the meteor radar altitudes by spline interpolation. For the Ledong, Wuhan, and Beijing meteor radar systems, we interpolated the MIGHTI wind speeds in the altitude range of 92 to 110 km, with intervals of 2 km. Since the Tirupati meteor radar data used here covers an altitude from 91.5 to 104.5 km with a resolution of 1 km, for consistency with the data from the other three sites and ease of subsequent processing, we averaged the data for each pair of adjacent altitudes to represent the wind speed at the interpolated intermediate altitude. For example, averaging the data at 91.5 km and 92.5 km results in a wind speed of 92 km.
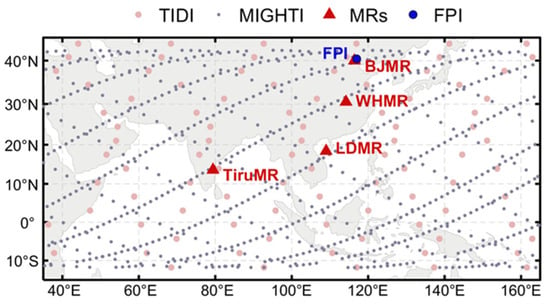
Figure 1.
Locations of all the ground-based instruments used in this study, with the MIGHTI and TIDI measurement locations on 20 January 2020.
For wind speeds at 630 nm and 557 nm, as measured by FPI, coincidences within 500 km and 300 km, respectively, and within 30 min of MIGHTI observation times were chosen for comparison. Wu et al. [9] proposed that the FPI spectrometer integrates over the sampling volume, weighting the overall motion of the molecules based on the distribution of airglow brightness with altitude. Therefore, for the altitude-resolved MIGHTI observations, we utilized normalized emission rates as weights, considering each altitude, to perform the height-weighted processing of MIGHTI winds at each sample point.
In the comparison of the neutral winds between MIGHTI and TIDI, we filtered out TIDI data when the solar beta angle (the angle between the orbital plane and the Earth-Sun vector) exceeded 55 [23]. At each TIDI wind measurement, a space-time window of LST ± 15 min, latitude ± 4°, and longitude ± 4° was employed to find the coincidences between TIDI and MIGHTI. For a single TIDI observation with multiple MIGHTI observations that meet the filtering criteria, we selected the most recent one in time. Then, we performed altitude-binned averaging, with bins set at every 5 km within an altitude range of 90 km to 105 km.
Extracting and comparing planetary-scale fluctuations from various observational data is a crucial step. For this research, the least squares fitting method was employed to extract planetary waves [32].
The MIGHTI/ICON observational data and TIDI/TIMED observational data utilized in this study contain information on time, altitude, longitude, and latitude. This allows for the simultaneous determination of both the period and wavenumber of planetary waves during the analysis. In contrast, meteor radar observational data lack longitude information, preventing the determination of wavenumbers. For datasets with longitude information, the least squares fitting formula for planetary waves is as follows:
where ti denotes the universal time, λi signifies the longitude, and σ and s, respectively, represent the frequency and meridional wavenumber of the fluctuation (with eastward propagation considered to be negative). A and B are the amplitudes of the fluctuation, while C represents the background meridional wind. The maximum amplitudes of the fluctuation can be expressed as:
This study primarily compares the quasi-two-day wave (Q2DW) observed in early 2020 and an approximately five-day wave occurring in the first half of the year. The analysis of Q2DW employed a 10-day window, ranging from the first day to the 100th day, with a daily increment. The accurate periods of the Q2DW at 90 km were calculated using a range from 28 h to 72 h, with 1-hour increments. Similarly, for the approximately five-day wave, a 20-day window was employed, utilizing a period range of 100 to 160 h.
3. Comparison Results
3.1. MIGHTI vs. MR
There were 3421 points that met the filtering criteria in total. We conducted a statistical analysis of these points in terms of altitude. As the altitude increases, the available data from meteor radars decreases, which may be attributed to the lower density of meteors above 100 km, resulting in a reduction in the number of coincidences between the two instruments. We calculated the correlation coefficients for MIGHTI and meteor radar observations at each altitude and performed linear fits using the least squares method. The changes in correlation coefficients and fit slopes with altitude are shown in Figure 2b and Figure 2c, respectively. It can be observed that the correlation is highest at around 94 km (with correlation coefficients of 0.857 and 0.813 for the zonal and meridional wind components, respectively). Additionally, there is good consistency between MIGHTI and the meteor radar at 92 km, indicating that the newly extended observations by MIGHTI at around 91 km exhibit satisfactory quality. With increasing altitude, the number of coincident points and the correlation between the two instruments decreases due to the reduced availability of meteor radar data. This may be attributed to the fact that the quality of meteor radar data above 100 km experiences the effect of meteor density. The distribution of meteor trails with altitude is affected by atmospheric density, the angle at which the meteoroid enters the atmosphere, and the frequency used by the meteor radar, with a maximum at around 90 km [33]. To avoid sensitivity to outliers with fewer samples, we restricted the comparison to coincidences within the 92–100 km altitude range.
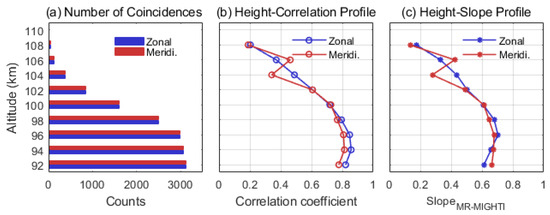
Figure 2.
(a) The available data counts at different altitudes of all coincidences between MIGHTI and the four meteor radar devices. (b) The correlation coefficients and (c) fitting slopes are calculated using the least squares method between MIGHTI and meteor radar devices at each altitude.
The scatter plots of measurements from MIGHTI and meteor radar devices are depicted in the top panels of Figure 3. Each dot indicates one altitude from one coincidence, spanning from 92 to 100 km. The two instruments show good consistency, with a correlation coefficient of 0.819 for the zonal wind and 0.782 for the meridional wind. The fitting slopes around 0.6 indicate that MIGHTI measurements exhibit larger speeds than meteor radar measurements. Due to the difference in calibration [16], we separated the daytime observations from the night-time observations. As shown in the middle and bottom panels of Figure 3, the correlation coefficients between daytime and night-time observations do not vary significantly. However, the fitted slopes of night-time observations are larger than those of daytime observations. Englert et al. [16] proposed that this discrepancy might arise from variations in the peak altitudes and thickness of the 557 nm airglow between daytime and night-time. The peak of daytime 557 nm airglow is located above 100 km, and it has a thicker layer, with the line of sight traversing a greater distance through the airglow region. Other factors may contribute to this situation as well, such as differences in exposure times during the day and night, which could result in significant variations in horizontal resolution between the two instruments [16].
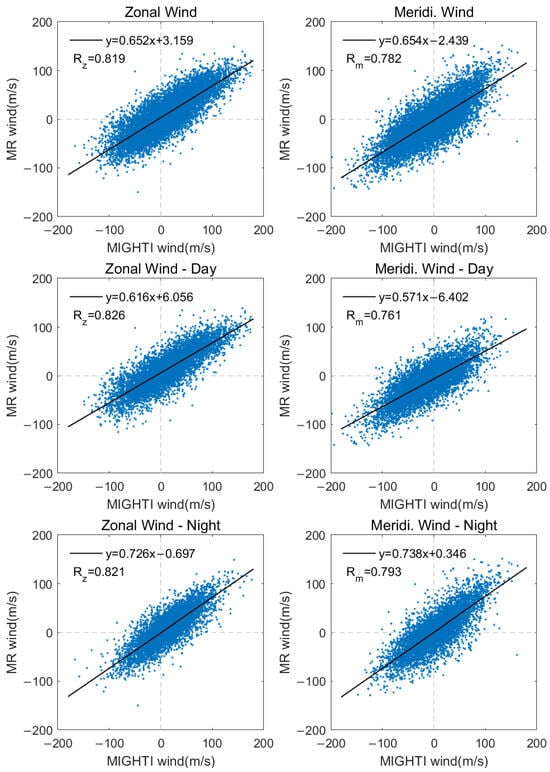
Figure 3.
Scatter plots of coincidences between MIGHTI and four meteor radar results for all available observations (top panels), daytime observation (middle panels), and night-time observation (bottom panels). Each dot indicates one altitude from one coincidence, spanning from 92 to 100 km.
From Figure 3, it can be observed that during both the daytime and night-time, the correlation of the zonal wind component is higher than that of the meridional wind component. Zhou et al. [20] illustrated the limited precision of MIGHTI’s meridional wind data through a comparison with the Wuhan meteor radar data throughout 2020 and employed a statistical approach proposed by Hawking et al. to compare geophysical data from multiple instruments with varying levels of accuracy.
However, this result primarily pertains to the observations at the Wuhan meteor radar site, representing mid-latitude regions. It does not effectively validate observations at low latitudes. Therefore, to investigate differences in the measurement accuracy of MIGHTI at different latitudes, we separated the meteor radar sites for individual comparisons with MIGHTI. Due to COVID-related work suspension [16], Tirupati’s meteor radar site only has data from December 2019 to April 2020. Therefore, for the other meteor radar sites, we utilized data from the same time frame. Applying the temporal and spatial filtering conditions described in Section 2, we analyzed observations only within the 92–100 km altitude range, and the results are shown in Figure 4. For the Beijing station, which is located at a latitude of approximately 40°N, near the MIGHTI observation boundary, the correlation of the meridional wind field is significantly lower than that of the zonal wind field. This could be attributed to the motion of ICON at the observation boundary, resulting in lower accuracy in the zonal wind field. As the spacecraft nears the observation boundary, its motion becomes predominantly zonal. This zonal movement induces substantial variations in the azimuth angle of MIGHTI’s line of sight with respect to the Earth’s latitudinal and longitudinal coordinate system [16]. Such variations might exacerbate the error in projecting the spacecraft’s velocity onto the meridional wind component, thereby reducing the accuracy of the derived wind measurements in this region. As latitude decreases, this situation improves noticeably. At the Ledong radar station, the correlation coefficient of the meridional wind field between the two instruments reaches as high as 0.891. Yu et al. [34] proposed that the geomagnetic field could significantly impede the vertical movement of charged particles in a meteoroid, thereby reducing the accuracy of zonal wind measurements obtained by meteor radar. Although the influence of the geomagnetic field may be relatively small in mid- to low-latitude regions, it cannot be completely ignored. Generally, in non-border regions, both MIGHTI and the meteor radar exhibit a high correlation, exceeding 0.8, indicating a strong and significant relationship.

Figure 4.
Variation of correlation coefficients and fitted slopes for MIGHTI with different meteor radar sites.
3.2. MIGHTI vs. FPI
In a comparison in the MLT region, MIGHTI green-line data demonstrates good consistency with meteor radar results. For higher thermospheric wind speeds, we compared the night-time 630 nm band observations of Xinglong FPI with MIGHTI-Red data. Similarly, the FPI 557 nm data were compared to MIGHTI-Green data.
Approximately 788 coincidences were obtained at ~96 km (557 nm), and around 654 coincidences were obtained at ~250 km (630 nm). The scatter plots are shown in Figure 5. Generally, there is good consistency, with the correlation in the zonal wind field generally better than that in the meridional wind field, especially in the observations at 630 nm, where the correlation coefficient is only 0.554. This can also be explained by the spacecraft’s motion near the observation boundary.
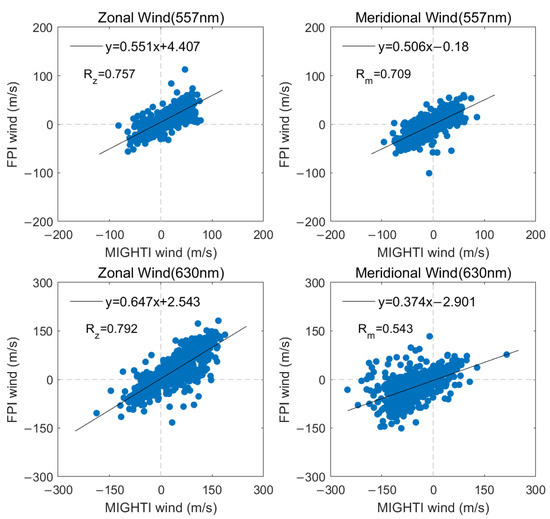
Figure 5.
Scatter plots of Xinglong FPI winds of 557 nm and weighted MIGHTI-Green winds (top panel). Scatter plots of Xinglong FPI winds of 630 nm and weighted MIGH*TI-Red winds (bottom panel).
In both the comparisons between MIGHTI and FPI and between MIGHTI and meteor radar results, it can be observed that the fitted slope using the least squares method is consistently less than 1. This implies that the estimated wind speeds from both ground-based FPI and meteor radars are lower than those estimated by MIGHTI. In many previous studies, a similar conclusion has been reached: wind speeds measured by space-borne instruments are greater than those measured by ground-based instruments [27,35]. For example, Burrage et al. found that HRDI O2(0–0) winds were generally greater than Jakarta SMR measurements [36], while Forbes et al. identified a speed bias of 1.6 for zonal-mean winds and 1.3 for the semidiurnal tide when comparing HRDI winds with three SMR datasets [37]. Similarly, Q. Wu et al. observed larger diurnal tide amplitudes in TIDI O2(0-0) meridional wind data compared to SMR data from Maui [38]. These discrepancies might arise from the temporal resolution differences compared to the 30 s/60 s or even 0.75 s/3 s integration of MIGHTI or TIDI; the ground-based instruments inherently involve a temporal averaging of approximately 0.5 to 1 h. Additionally, differences in observation geometry contribute. Space-borne limb-viewing geometries sample different atmospheric layers and horizontal scales compared to ground-based zenith observations. The limb-sounding technique has a longer atmospheric path integration, which may yield larger apparent wind magnitudes.
However, the comparison with FPI yields an even smaller fitted slope (0.551/0.506) compared to the night-time meteor radar comparison (0.72/0.707). This result is consistent with the findings of Englert et al. [16], who suggested that this might be due to atmospheric scattering causing positive and negative Doppler shifts to overlap, thereby resulting in underestimated wind speed values.
3.3. MIGHTI vs. TIDI
3.3.1. Neutral Wind
There are 6272 coincidences from December 2019 to October 2022 between MIGHTI and TIDI, in total. After height averaging in each altitude bin, the wind speeds of MIGHTI and TIDI at coincidences were statistically analyzed at intervals of 10 m/s. The averaged winds, presented in Figure 6, exhibit a normal distribution across five distinct altitude ranges. The left side is the zonal wind component, while the right side displays the meridional wind component. Each panel displays the wind speed distributions of MIGHTI and TIDI at the corresponding altitudes. The blue color represents MIGHTI observations, the red color represents TIDI observations, and the darker blue color indicates the overlapping regions of the two datasets. Fitting was performed using a normal distribution function and the fitted curves, along with the calculated mean and variance, are presented in each panel. Notably, the TIDI wind speeds demonstrate higher dispersion, with a standard deviation reaching 60 m/s to 70 m/s above 105 km and notable occurrences of unusually high values. In contrast, MIGHTI’s wind speed distribution remains relatively stable. Within this altitude range, representing the mesosphere and lower thermosphere (MLT) region, wind speeds generally range from −200 m/s to 200 m/s. Consequently, our comparative analysis focuses on observations within the 90 km to 105 km altitude range, where the speed magnitudes fall between −200 m/s and 200 m/s.
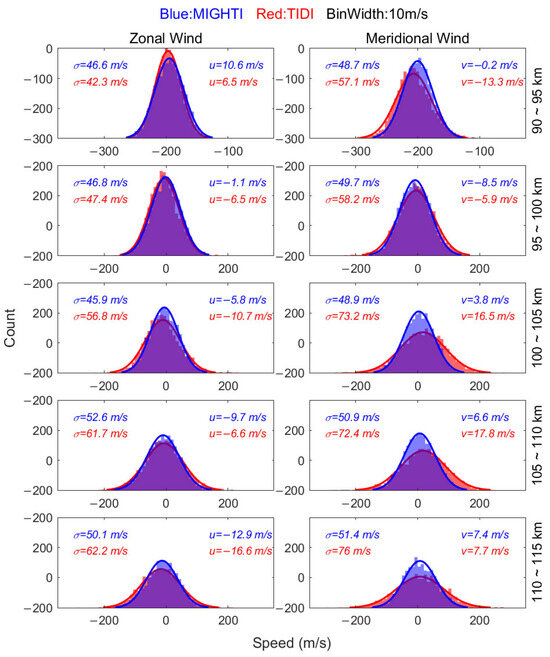
Figure 6.
The wind speed distributions with an interval of 10 m/s in each altitude range (shown in the right column). Blue indicates MIGHTI winds. Red indicates TIDI winds. The darker blue indicates the overlapping region of two datasets. In each panel, σ represents the variances, while u and v represent the means of zonal winds and meridional winds, respectively.
The discrepancy between MIGHTI and TIDI measurements may arise from several factors. First, determining the zero-wind reference is a critical step in the calibration and retrieval process of spaceborne instruments. MIGHTI’s zero-wind calibration uses a 96-day sliding time window to solve for the zero-wind reference and wind components independently of external models, reducing systematic biases [16]. In contrast, TIDI relies on an observation-corrected value based on spacecraft and Earth rotation velocities, which may introduce errors due to unchanged initial baselines [13,19]. Second, in terms of instrument design, each MIGHTI sensor is equipped with a baffle that extends in front of the entrance pupil [14]. The primary purpose of the baffle is to suppress signals originating from angles outside the field of view, ensuring high measurement accuracy [14]. In contrast, TIDI’s optical design is more aggressive and its stray light suppression is less effective, leading to lower wind measurement accuracy and hindering the widespread application of TIDI’s wind field data [39]. Third, MIGHTI’s longer exposure times (30 s daytime, 60 s night-time) result in smoother profiles but may miss short-term variations, whereas TIDI’s shorter exposures (0.75 s daytime, 3 s night-time) capture transient anomalies but have larger horizontal spacing. In addition, a spatiotemporal window of LST ± 15 min, latitude ± 4°, and longitude ± 4° was used to screen for the coincidences, meaning that the measurements of MIGHTI and TIDI were not taken at exactly the same time and location and the different observational geometries will still have an effect.
The upper panel in Figure 7 presents a scatterplot depicting the height-averaged winds from both TIDI and MIGHTI within the altitude range of 90 to 105 km. The lower two panels illustrate the distribution of differences between the two datasets. Mean differences and root mean square errors were computed for both meridional and zonal components. The two datasets are generally consistent (r > 0.6). The correlation coefficient, fitting slope, and mean difference for the meridional component of MIGHTI and TIDI are superior to those for the zonal component. This indicates a stronger correlation between the meridional winds of the two instruments. Additionally, with a fitting slope of less than 1 and a positive mean difference, to some extent, this indicates that in an altitude range of 90 to 105 km, the overall measurements of MIGHTI are higher than those of TIDI. It is worth noting that we only utilized the warm-side data from TIDI in this analysis, which means that this conclusion is specific to the warm-side data of TIDI. Similar results were observed by Dhadly et al. [19] in their comparisons between MIGHTI v04 data and TIDI.
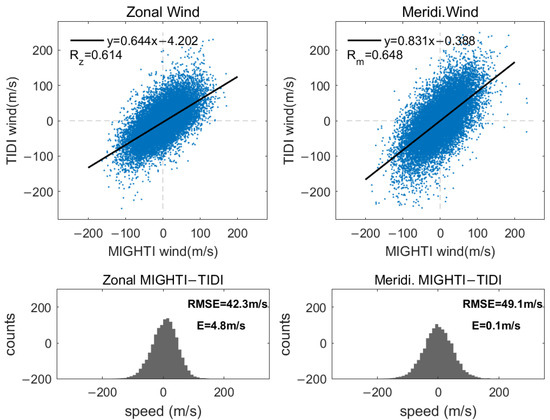
Figure 7.
Scatter plots of TIDI winds and MIGHTI winds between 90 and 105 km (top panels). The distribution of the difference between the horizontal wind measurements from MIGHTI and TIDI (bottom panels).
3.3.2. Planetary Wave
In addition to the comparison of raw wind-speed data, we also compared the fluctuations extracted by MIGHTI and TIDI. Quasi-two-day waves (Q2DWs) are the most typical and dynamically significant modes observed in the MLT region, with a maximum amplitude of more than 70 m/s in the wind field, which has an important impact on the changes of background atmospheric wind field, temperature, circulation, and photochemical composition in the MLT region [40,41,42], typically exhibiting periods of approximately 40–60 h; they can be observed near the equator in the MLT region almost throughout the year [43]. These waves are generally considered to be the atmospheric manifestation of the gravest westward-propagating Rossby-gravity normal mode with zonal wavenumber 3 [5], amplified or potentially initiated by mesospheric easterly jet instability, which admits zonal wavenumbers of 2 through 4 [44,45]. Among these, westward zonal wavenumbers 2 (W2), 3 (W3), and 4 (W4) are the most typical and dynamically significant modes observed in the MLT region [41]. Notably, W3 Q2DWs occur most frequently in January, February, and July, while W2 Q2DWs peak in February, often accompanied by W3 [12]. He et al. [21] further demonstrated the characteristics of W2 and W3 Q2DWs during the first half of 2020, using MIGHTI v04 data and low-latitude specular meteor radar (SMR). Building on these findings, we individually analyzed the W2 and W3 Q2DWs near the equator (5°S–5°N) using MIGHTI v05 meridional wind data and TIDI warm-side meridional wind data, employing the method described in Section 2.
Figure 8 shows the amplitudes as a function of time and period of the Q2DWs at the equator and ~95 km altitude throughout the first 100 days of 2020. Using data from the TIDI (panels a and c) and MIGHTI (panels b and d) instruments separately, the presentation illustrates W3 Q2DWs (panels a and b) and W2 Q2DWs (panels c and d). The white dashed lines pinpoint the day with the maximum amplitude, commonly referred to as the central day of the observed event, while the pink dashed lines indicate the specific periods under consideration. In the early months of 2020, the strongest occurrence of W3 was around day 25, for a period of approximately 50 h, while W2 occurred around day 38, for a period of approximately 49 h. The periods and occurrence times of the extracted waves show no significant differences between MIGHTI observations and TIDI observations. However, the wave amplitudes extracted from TIDI measurements were larger than those extracted from MIGHTI, especially for W3, where the amplitude extracted from TIDI data was approximately twice as large as that from MIGHTI.
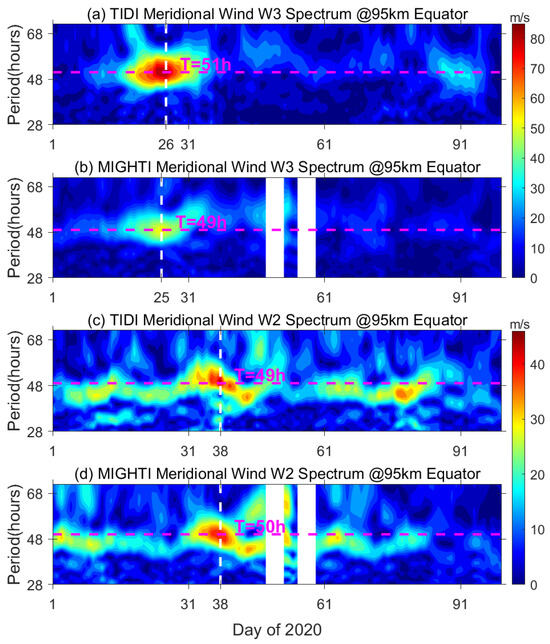
Figure 8.
Temporal variations of the spectra for the quasi-two-day waves (Q2DWs) with westward zonal wavenumber 3 in the (a) TIDI and (b) MIGHTI meridional wind data, as well as westward zonal wavenumber 2 in the (c) TIDI and (d) MIGHTI meridional wind data at the equator and 95 km, during days 1 to 100 of 2020. The white dashed lines indicate the center day of the event, and the pink dashed lines indicate the exact periods.
The spatial structures of W2 and W3 during the occurrence of the waves are illustrated in Figure 9. TIDI’s observational data presented a broader latitude coverage, offering a more comprehensive spatial structure, as depicted in Figure 9a. W3 Q2DW attained its maximum amplitude near the equator. Within the altitude range of 85 km to 100 km, the latitude coverage of significant amplitude extended from approximately 50°S to 30°N. For W2 Q2DW, as shown in Figure 9c, the maximum amplitude was also observed near the equator, with a latitude coverage ranging from approximately 15°S to 20°S. These features are consistent with the findings of many previous studies [12]. Due to the limited observational range of MIGHTI, we could only observe the coverage of Q2DWs in the northern hemisphere, which is generally consistent with the results obtained from TIDI data analysis. Additionally, it is worth noting that for both W2 and W3, the altitude of the maximum amplitudes observed by TIDI is higher, at around 100 km.
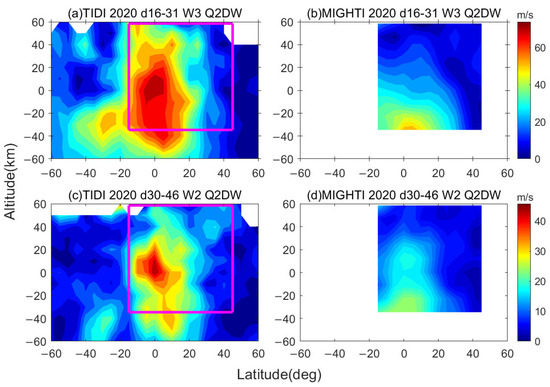
Figure 9.
Amplitudes of W3 Q2DWs in meridional wind from days 16–31 of 2020 in a latitude-altitude depiction estimated from (a) TIDI and (b) MIGHTI. Similar images show W2 from day 30–46, estimated from (c) TIDI and (d) MIGHTI. Pink rectangles indicate the same coverage height and latitude as MIGHTI.
We conducted a similar analysis using data from two low-latitude meteor radar stations, Ledong and Tirupati. The time-varying spectrograms for both sites are shown in Figure 10, where the two white dashed lines correspond to the central days of the W3 and W2 waves extracted from TIDI and MIGHTI observations. Both stations observed the Q2DWs, especially in Ledong, where two distinct Q2DW events were clearly identified, with central days corresponding to the W3 and W2 waves observed by the space-borne instruments. The periods are also consistent, at approximately 50 h. In Tirupati, the extraction of wave numbers might be less clear, due to wave interference.
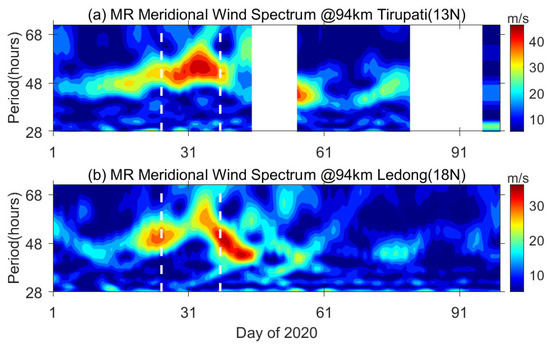
Figure 10.
Temporally varying spectra of westward planetary waves in (a) Tirupati and (b) Ledong meridional wind data at 94 km during days 1 to 100 of 2020. The white dashed lines indicate the center days of the events estimated in the space-borne instrument.
Here, we fixed the period at 50 h and analyzed the fluctuations extracted by the meteor radar at different altitudes. As shown in Figure 11, due to the lower accuracy of the meteor radar above 100 km mentioned in Section 3.1, we only fitted the range of 80–100 km. In the Tirupati meteor radar, the amplitude reached its greatest level in the range of 85–100 km. In the Ledong meteor radar, the fluctuation center of the 25th-day event was ~85 km, and the fluctuation center of the 38th-day event was ~92 km. In addition, the amplitudes of the fluctuations in Tirupati and Ledong meteor radar results were much closer to that of MIGHTI, which is basically in the order of 40–50 m/s, instead of the 70–80 m/s estimated by TIDI.
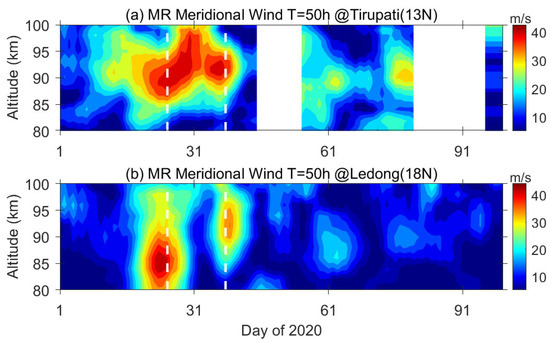
Figure 11.
The amplitude variation of Q2DWs in time-altitude depiction from day 1–100 of 2020, estimated from (a) Tirupati meteor radar and (b) Ledong meteor radar meridional observations. The white dashed lines indicate the center day of the events estimated in the space-borne instrument.
Similarly, when analyzing the planetary wave in the equatorial region using a 20-day sliding window, we identified a five-day wave with westward zonal wavenumber 1 (W1), the period is approximately 126 h. The five-day waves are one of the planetary waves identified as a westward-traveling Rossby mode with a zonal wave number of 1 [46]. Like the two-day waves, they are intrinsic resonant modes naturally present in the Earth’s atmosphere.
Both TIDI and MIGHTI observed this fluctuation, as shown in Figure 12a,b, with the peak amplitude occurring around the 75th day. Notably, this fluctuation is more distinct in TIDI observations, reaching an amplitude of approximately ~25 m/s, while MIGHTI-extracted fluctuation amplitudes range from 18 m/s to 20 m/s. The spatial structure is depicted in Figure 12c,d. In the observations from both TIDI and MIGHTI, the maximum amplitude was observed around 95 km near the equator, which was consistent across both datasets. Similar to the analysis of Q2SWs mentioned above, the oscillation amplitudes extracted from the MIGHTI data remained smaller than those extracted from TIDI.
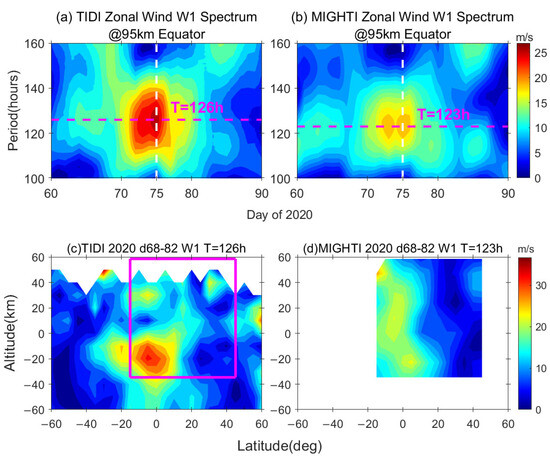
Figure 12.
Temporal variations of the spectra for the westward planetary waves with zonal wavenumber 1 in the (a) TIDI and (b) MIGHTI zonal wind data at the equator and 95 km during days 60 to 90 of 2020, along with the variation of amplitude in latitude-altitude depiction from days 68–82 of 2020, estimated from (c) TIDI and (d) MIGHTI zonal observations. The white dashed lines and the pink dashed lines in (a) and (b) indicate the center days of the events and the exact periods, respectively. The pink rectangle in (c) indicates the same coverage height and latitude as MIGHTI.
4. Conclusions
We conducted a comprehensive analysis by comparing MIGHTI v05 level 2.2 data from December 2019 to October 2022 during the ICON mission with meteor radar, FPI, and TIDI/TIMED data. The overall comparison revealed a satisfactory level of consistency, although some discrepancies were identified.
For the meteor radar comparison, we utilized a spatiotemporal window of 300 km for 30 min, resulting in 3421 coincidences after interpolating MIGHTI wind speeds in altitude. Analyzing the winds’ correlation at different altitudes shows that the observations in the range of 92–100 km are in good agreement (r = 0.819, 0.782). However, there is a lower correlation above 100 km. Furthermore, we examined the correlation between daytime and night-time measurements. Interestingly, the day–night correlation difference is not substantial, but the absolute values of the two instruments are more closely aligned during the night.
Then, we compared MIGHTI with four meteor radar sites at different latitudes (spanning 13°N–40°N, at intervals of 5–10°N) separately for analysis. The correlation between MIGHTI and the Beijing meteor radar station (located at 40°N, near MIGHTI’s observation boundary) exhibits weaker values compared to the other three stations. Additionally, at this specific station, the correlation in the meridional component was found to be weaker than in the zonal component. In contrast, the observations from MIGHTI and the meteor radar at the other three locations demonstrated a strong correlation (r > 0.8), and the correlation in the meridional wind field was stronger than that in the zonal wind field.
For comparison with the Xinglong FPI, we employed a spatiotemporal window of 500 km and 30 min for the 630 nm channel of FPI and a window of 300 km and 30 min for the 557 nm channel. The MIGHTI wind data were processed using a normalized airglow emission rate, applying height-weighted treatment. Approximately 788 coincidences were obtained around 96 km (557 nm), and around 654 coincidences were obtained around 250 km (630 nm). The wind observations of the 557 nm channel and the zonal component of the 630 nm channel show good agreement (r > 0.7). However, in the red-line observations, the correlation for the meridional component is poor, and the absolute amplitude of FPI is far smaller than that of MIGHTI, with the fitting slope ranging from 0.384–0.641.
In comparison with TIDI, we initially filtered the coincidences between MIGHTI and TIDI using a ± 15 min LST, ± 4° latitude, and ± 4° longitude spatiotemporal window, and conducted a comparison of the original wind speeds. The two instruments showed good consistency in measuring wind speeds. Subsequently, we focused on comparing the extracted planetary wave from both instruments. In the W2 and W3 Q2DWs observed in January and February 2020, MIGHTI and TIDI were able to extract similar event data at approximately the same time and location. Specifically, the extracted center days and periods of the waves were generally consistent, but TIDI-extracted amplitudes were significantly larger than those of MIGHTI. Similar Q2DWs were also observed by the Ledong and Tirupati meteor radar sites, showing amplitudes and altitude structures more similar to the MIGHTI analysis. Additionally, in March 2020, near the equator, a five-day wave with a period of approximately 126 h was discovered, and its spatial structure was presented for the first time. However, the specific mechanism is still under further investigation.
This represents a thorough validation of MIGHTI v05 Level 2.2 data, encompassing cross-validation between ground-based and onboard equipment. Additionally, it includes a comparative analysis of raw wind fields and planetary waves. These findings offer crucial support for the utilization of MIGHTI data, facilitate further algorithmic enhancements, and contribute significantly to the advancement of onboard exploration technology.
Author Contributions
Funding acquisition, S.G. and Y.Q.; investigation, D.G. and S.G.; methodology, D.G. and S.G.; project administration, S.G.; software, D.G.; writing—original draft, D.G.; writing—review and editing, S.G., Y.Q., N.L., Y.C., W.Y., and Y.W. All authors have read and agreed to the published version of the manuscript.
Funding
This project is funded by the National Natural Science Foundation of China (Grant Numbers 42374195, 42188101, and 42404168), the China Postdoctoral Science Foundation (Grant Number 2024M752463), and the Postdoctoral Project of Hubei Province (Grant Number 2024HBBHCXA054).
Data Availability Statement
FPI, Beijing, and Wuhan meteor radar data can be found at https://data2.meridianproject.ac.cn/ (accessed on 28 Marth 2023). Ledong meteor radar data can be accessed offline at Beijing National Observatory of Space Environment, the Institute of Geology and Geophysics Chinese Academy of Sciences, or online through the Geophysics Center, National Earth System Science Data Center (http://wdc.geophys.ac.cn) (accessed on 1 August 2023). ICON data are processed in the ICON Science Data Center at UCB and are available at https://icon.ssl.berkeley.edu/Data (accessed on 1 August 2023). TIDI level 3 (v11) vector wind data are available at https://tidi.engin.umich.edu/ (accessed on 18 January 2024). The Tirupati meteor radar dataset used here can be found on Zenodo (https://doi.org/10.5281/zenodo.4433180) (accessed on 25 October 2023).
Acknowledgments
We acknowledge the Chinese Meridian Project for providing FPI, Beijing, and Wuhan meteor radar data. Ledong meteor radar data were sourced from the MIOS project supported by the National Natural Science Foundation of China (41727803). We acknowledge the use of the ICON-MIGHTI data dataset. ICON is supported by NASA’s Explorers Program through the contracts NNG12FA45C and NNG12FA42I. We also acknowledge TIMED/TIDI for providing the wind field data. We express our gratitude to the SV University Staff for operating the meteor radar at Tirupati, which was utilized in the present study.
Conflicts of Interest
The authors declare no conflicts of interest.
References
- He, Y.; Zhu, X.; Sheng, Z.; He, M. Resonant Waves Play an Important Role in the Increasing Heat Waves in Northern Hemisphere Mid-Latitudes Under Global Warming. Geophys. Res. Lett. 2023, 50, e2023GL104839. [Google Scholar] [CrossRef]
- He, Y.; Zhu, X.; Sheng, Z.; He, M. Identification of Stratospheric Disturbance Information in China Based on the Round-Trip Intelligent Sounding System. Atmos. Chem. Phys. 2024, 24, 3839–3856. [Google Scholar] [CrossRef]
- Andrews, D.G.; Holton, J.R.; Leovy, C.B. Middle Atmosphere Dynamics; Academic Press: Cambridge, MA, USA, 1987. [Google Scholar]
- Gu, S. Planetary Waves and Their Roles in Atmospheric Coupling. Ph.D. Thesis, University of Science and Technology of China, Hefei, China, 2015. [Google Scholar]
- Salby, M.L. Rossby Normal Modes in Nonuniform Background Configurations. Part II. Equinox and Solstice Conditions. J. Atmos. Sci. 1981, 38, 1827–1840. [Google Scholar] [CrossRef]
- Tang, Q.; Zhou, Y.; Du, Z.; Zhou, C.; Qiao, J.; Liu, Y.; Chen, G. A Comparison of Meteor Radar Observation over China Region with Horizontal Wind Model (HWM14). Atmosphere 2021, 12, 98. [Google Scholar] [CrossRef]
- Wang, Y.; Li, G.; Ning, B.; Yang, S.; Sun, W.; Yu, Y. All-Sky Interferometric Meteor Radar Observations of Zonal Structure and Drifts of Low-Latitude Ionospheric E Region Irregularities. Earth Space Sci. 2019, 6, 2653–2662. [Google Scholar] [CrossRef]
- Zhou, X.; Yue, X.; Yu, Y.; Hu, L. Day-To-Day Variability of the MLT DE3 Using Joint Analysis on Observations From TIDI-TIMED and a Meteor Radar Meridian Chain. J. Geophys. Res. Atmos. 2022, 127, e2021JD035794. [Google Scholar] [CrossRef]
- Wu, Q.; Gablehouse, R.D.; Solomon, S.C.; Killeen, T.L.; She, C.-Y. A New Fabry-Perot Interferometer for Upper Atmosphere Research. In Proceedings of the Instruments, Science, and Methods for Geospace and Planetary Remote Sensing, Honolulu, HI, USA, 30 December 2004; Volume 5660, pp. 218–227. [Google Scholar]
- Wei, Y.; Gu, S.-Y.; Yang, Z.; Huang, C.; Li, N.; Hu, G.; Dou, X. Inversion of Wind and Temperature from Low SNR FPI Interferograms. Remote Sens. 2023, 15, 1934. [Google Scholar] [CrossRef]
- Gu, S.; Hou, X.; Li, N.; Yi, W.; Ding, Z.; Chen, J.; Hu, G.; Dou, X. First Comparative Analysis of the Simultaneous Horizontal Wind Observations by Collocated Meteor Radar and FPI at Low Latitude through 892.0-Nm Airglow Emission. Remote Sens. 2021, 13, 4337. [Google Scholar] [CrossRef]
- Sun, R.; Gu, S.-Y.; Dou, X.; Wei, Y.; Qin, Y.; Yang, Z. Decadal Quasi-2-Day Wave Observations in the Equatorial Mesopause Region by a Meteor Radar over Kototabang (0.2°S, 100.3°E) and TIMED/TIDI and Comparison with Quasi-2-Day Wave Observations at Mid-Latitudes. Remote Sens. 2023, 15, 1122. [Google Scholar] [CrossRef]
- Niciejewski, R.; Wu, Q.; Skinner, W.; Gell, D.; Cooper, M.; Marshall, A.; Killeen, T.; Solomon, S.; Ortland, D. TIMED Doppler Interferometer on the Thermosphere Ionosphere Mesosphere Energetics and Dynamics Satellite: Data Product Overview. J. Geophys. Res. 2006, 111, 2005JA011513. [Google Scholar] [CrossRef]
- Englert, C.R.; Harlander, J.M.; Brown, C.M.; Marr, K.D.; Miller, I.J.; Stump, J.E.; Hancock, J.; Peterson, J.Q.; Kumler, J.; Morrow, W.H.; et al. Michelson Interferometer for Global High-Resolution Thermospheric Imaging (MIGHTI): Instrument Design and Calibration. Space Sci. Rev. 2017, 212, 553–584. [Google Scholar] [CrossRef]
- Immel, T.J.; England, S.L.; Mende, S.B.; Heelis, R.A.; Englert, C.R.; Edelstein, J.; Frey, H.U.; Korpela, E.J.; Taylor, E.R.; Craig, W.W.; et al. The Ionospheric Connection Explorer Mission: Mission Goals and Design. Space Sci. Rev. 2017, 214, 13. [Google Scholar] [CrossRef] [PubMed]
- Englert, C.R.; Harlander, J.M.; Marr, K.D.; Harding, B.J.; Makela, J.J.; Fae, T.; Brown, C.M.; Ratnam, M.V.; Rao, S.V.B.; Immel, T.J. Michelson Interferometer for Global High-Resolution Thermospheric Imaging (MIGHTI) On-Orbit Wind Observations: Data Analysis and Instrument Performance. Space Sci. Rev. 2023, 219, 27. [Google Scholar] [CrossRef] [PubMed]
- Makela, J.J.; Baughman, M.; Navarro, L.A.; Harding, B.J.; Englert, C.R.; Harlander, J.M.; Marr, K.D.; Benkhaldoun, Z.; Kaab, M.; Immel, T.J. Validation of ICON-MIGHTI Thermospheric Wind Observations: 1. Nighttime Red-Line Ground-Based Fabry-Perot Interferometers. JGR Space Phys. 2021, 126, e2020JA028726. [Google Scholar] [CrossRef] [PubMed]
- Harding, B.J.; Chau, J.L.; He, M.; Englert, C.R.; Harlander, J.M.; Marr, K.D.; Makela, J.J.; Clahsen, M.; Li, G.; Ratnam, M.V.; et al. Validation of ICON-MIGHTI Thermospheric Wind Observations: 2. Green-Line Comparisons to Specular Meteor Radars. JGR Space Phys. 2021, 126, e2020JA028947. [Google Scholar] [CrossRef] [PubMed]
- Dhadly, M.S.; Englert, C.R.; Drob, D.P.; Emmert, J.T.; Niciejewski, R.; Zawdie, K.A. Comparison of ICON/MIGHTI and TIMED/TIDI Neutral Wind Measurements in the Lower Thermosphere. JGR Space Phys. 2021, 126, e2021JA029904. [Google Scholar] [CrossRef] [PubMed]
- Zhou, C.; Liu, Y.; Du, Z.; Fan, Z.; Sun, H.; Zhou, C. Validation of MIGHTI/ICON Atmospheric Wind Observations over China Region Based on Meteor Radar and Horizontal Wind Model (HWM14). Atmosphere 2022, 13, 1078. [Google Scholar] [CrossRef]
- He, M.; Chau, J.L.; Forbes, J.M.; Zhang, X.; Englert, C.R.; Harding, B.J.; Immel, T.J.; Lima, L.M.; Bhaskar Rao, S.V.; Ratnam, M.V.; et al. Quasi-2-Day Wave in Low-Latitude Atmospheric Winds as Viewed from the Ground and Space During January–March, 2020. Geophys. Res. Lett. 2021, 48, e2021GL093466. [Google Scholar] [CrossRef]
- Yamazaki, Y.; Harding, B.J.; Qiu, L.; Stolle, C.; Siddiqui, T.A.; Miyoshi, Y.; Englert, C.R.; England, S.L. Monthly Climatologies of Zonal-Mean and Tidal Winds in the Thermosphere as Observed by ICON/MIGHTI During April 2020–March 2022. Earth Space Sci. 2023, 10, e2023EA002962. [Google Scholar] [CrossRef]
- Holdsworth, D.A.; Reid, I.M.; Cervera, M.A. Buckland Park All-Sky Interferometric Meteor Radar. Radio Sci. 2004, 39, RS5009. [Google Scholar] [CrossRef]
- Rao, S.V.B.; Eswaraiah, S.; Venkat Ratnam, M.; Kosalendra, E.; Kishore Kumar, K.; Sathish Kumar, S.; Patil, P.T.; Gurubaran, S. Advanced Meteor Radar Installed at Tirupati: System Details and Comparison with Different Radars. J. Geophys. Res. Atmos. 2014, 119, 11-893–11-904. [Google Scholar] [CrossRef]
- Yu, Y.; Wan, W.; Ning, B.; Liu, L.; Wang, Z.; Hu, L.; Ren, Z. Tidal Wind Mapping from Observations of a Meteor Radar Chain in December 2011. J. Geophys. Res. Space Phys. 2013, 118, 2321–2332. [Google Scholar] [CrossRef]
- Kristoffersen, S.K.; Ward, W.E.; Meek, C.E. Wind Comparisons between Meteor Radar and Doppler Shifts in Airglow Emissions Using Field-Widened Michelson Interferometers. Atmos. Meas. Tech. 2024, 17, 3995–4014. [Google Scholar] [CrossRef]
- Hasebe, F.; Tsuda, T.; Nakamura, T.; Burrage, M.D. Validation of HRDI MLT Winds with Meteor Radars. Ann. Geophys. 1997, 15, 1142–1157. [Google Scholar] [CrossRef][Green Version]
- Yuan, W.; Xu, J.; Ma, R.; Wu, Q.; Jiang, G.; Gao, H.; Liu, X.; Chen, S. First Observation of Mesospheric and Thermospheric Winds by a Fabry-Perot Interferometer in China. Chin. Sci. Bull. 2010, 55, 4046–4051. [Google Scholar] [CrossRef]
- Wei, Y.; Gu, S.-Y.; Li, N.; Qin, Y.; Sun, R.; Wang, D.; Hu, G.; Le, H.; Yuan, W. Passive Optical Observation of Mesosphere and Thermosphere Wind Over Three Stations in China. J. Geophys. Res. Space Phys. 2024, 129, e2023JA032214. [Google Scholar] [CrossRef]
- Killeen, T.L.; Wu, Q.; Solomon, S.C.; Ortland, D.A.; Skinner, W.R.; Niciejewski, R.J.; Gell, D.A. TIMED Doppler Interferometer: Overview and Recent Results. J. Geophys. Res. Space Phys. 2006, 111, A10S01. [Google Scholar] [CrossRef]
- Wu, Q.; Ortland, D.A.; Killeen, T.L.; Roble, R.G.; Hagan, M.E.; Liu, H.-L.; Solomon, S.C.; Xu, J.; Skinner, W.R.; Niciejewski, R.J. Global Distribution and Interannual Variations of Mesospheric and Lower Thermospheric Neutral Wind Diurnal Tide: 1. Migrating Tide. J. Geophys. Res. 2008, 113, 2007JA012542. [Google Scholar] [CrossRef]
- Wu, D.L.; Hays, P.B.; Skinner, W.R. A Least Squares Method for Spectral Analysis of Space-Time Series. J. Atmos. Sci. 1995, 52, 3501–3511. [Google Scholar] [CrossRef]
- Chen, Z.; Liu, Z.; Feng, J.; Hu, L.; Yan, C.; Yuan, W.; Wu, X.; Zhen, B.; Zhou, X. Meteor Radar Prototype Testing and Data Quality Comparison Analysis for Phase II of Chinese Meridian Project. Rev. Geophys. Planet. Phys. 2024, 55, 120–130. [Google Scholar] [CrossRef]
- Yu, T.; Xia, C.; Zuo, X.; Huang, C.; Mao, T.; Liu, L.; Liu, Z. A Comparison of Mesospheric and Low-Thermospheric Winds Measured by Fabry-Perot Interferometer and Meteor Radar over Central China. J. Geophys. Res. Space Phys. 2016, 121, 10-037–10-051. [Google Scholar] [CrossRef]
- Gault, W.A.; Thuillier, G.; Shepherd, G.G.; Zhang, S.P.; Wiens, R.H.; Ward, W.E.; Tai, C.; Solheim, B.H.; Rochon, Y.J.; McLandress, C.; et al. Validation of O(1S) Wind Measurements by WINDII: The WIND Imaging Interferometer on UARS. J. Geophys. Res. Atmos. 1996, 101, 10405–10430. [Google Scholar] [CrossRef]
- Burrage, M.D.; Skinner, W.R.; Gell, D.A.; Hays, P.B.; Marshall, A.R.; Ortland, D.A.; Manson, A.H.; Franke, S.J.; Fritts, D.C.; Hoffman, P.; et al. Validation of Mesosphere and Lower Thermosphere Winds from the High Resolution Doppler Imager on UARS. J. Geophys. Res. 1996, 101, 10365–10392. [Google Scholar] [CrossRef]
- Forbes, J.M.; Portnyagin, Y.I.; Skinner, W.; Vincent, R.A.; Solovjova, T.; Merzlyakov, E.; Nakamura, T.; Palo, S. Climatological Lower Thermosphere Winds as Seen by Ground-Based and Space-Based Instruments. Ann. Geophys. 2004, 22, 1931–1945. [Google Scholar] [CrossRef]
- Wu, Q.; Killeen, T.L.; Ortland, D.A.; Solomon, S.C.; Gablehouse, R.D.; Johnson, R.M.; Skinner, W.R.; Niciejewski, R.J.; Franke, S.J. TIMED Doppler Interferometer (TIDI) Observations of Migrating Diurnal and Semidiurnal Tides. J. Atmos. Sol.-Terr. Phys. 2006, 68, 408–417. [Google Scholar] [CrossRef]
- Xiao, Y.; Feng, Y.; Wen, Z.; Fu, D. Doppler Asymmetric Spatial Heterodyne Interferometry for Wind Measurement in Middle and Upper Atmosphere (Invited). Acta Photonica Sin. 2022, 51, 0851516. [Google Scholar] [CrossRef]
- Tang, L.; Gu, S.-Y.; Sun, R.; Dou, X. Multi-Year Behavioral Observations of Quasi-2-Day Wave Activity in High-Latitude Mohe (52.5°N, 122.3°E) and Middle-Latitude Wuhan (30.5°N, 114.6°E) Using Meteor Radars. Remote Sens. 2024, 16, 311. [Google Scholar] [CrossRef]
- Gu, S.; Li, T.; Dou, X.; Wu, Q.; Mlynczak, M.G.; Russell, J.M. Observations of Quasi-Two-Day Wave by TIMED/SABER and TIMED/TIDI. JGR Atmos. 2013, 118, 1624–1639. [Google Scholar] [CrossRef]
- Gu, S.-Y.; Wei, Y.; Sha, X.; Tang, L.; Li, N. A Case Study of the Wavenumber Transition between Westward Quasi-2 Day Wave s = 3 and s = 4 Modes in the Mesosphere. Atmosphere 2023, 14, 442. [Google Scholar] [CrossRef]
- Harris, T.J.; Vincent, R.A. The Quasi-two-day Wave Observed in the Equatorial Middle Atmosphere. J. Geophys. Res. 1993, 98, 10481–10490. [Google Scholar] [CrossRef]
- Plumb, R.A. Baroclinic Instability of the Summer Mesosphere: A Mechanism for the Quasi-Two-Day Wave? J. Atmos. Sci. 1983, 40, 262–270. [Google Scholar] [CrossRef]
- Randel, W.J. Observations of the 2-Day Wave in NMC Stratospheric Analyses. J. Atmos. Sci. 1994, 51, 306–313. [Google Scholar] [CrossRef]
- Forbes, J.M. Tidal and Planetary Waves. In Geophysical Monograph Series; Johnson, R.M., Killeen, T.L., Eds.; American Geophysical Union: Washington, DC, USA, 2013; pp. 67–87. ISBN 978-1-118-66424-7. [Google Scholar]
Disclaimer/Publisher’s Note: The statements, opinions and data contained in all publications are solely those of the individual author(s) and contributor(s) and not of MDPI and/or the editor(s). MDPI and/or the editor(s) disclaim responsibility for any injury to people or property resulting from any ideas, methods, instructions or products referred to in the content. |
© 2025 by the authors. Licensee MDPI, Basel, Switzerland. This article is an open access article distributed under the terms and conditions of the Creative Commons Attribution (CC BY) license (https://creativecommons.org/licenses/by/4.0/).