Article

A Multi-Scale Spatio-Temporal Fusion Network for Occluded Small Object Detection in Geiger-Mode Avalanche Photodiode LiDAR Systems

1
National Key Laboratory of Laser Spatial Information, Harbin Institute of Technology, Harbin 150001, China
2
The School of Electronics and Information Engineering, Harbin Institute of Technology, Harbin 150001, China
3
Zhengzhou Research Institute, Harbin Institute of Technology, Zhengzhou 450000, China
4
The 44th Research Institute of China Electronics Technology Group Corporation, Chongqing 400060, China
*
Author to whom correspondence should be addressed.
Remote Sens. 2025, 17(5), 764; https://doi.org/10.3390/rs17050764
Submission received: 5 December 2024 / Revised: 12 February 2025 / Accepted: 19 February 2025 / Published: 22 February 2025

Abstract

:
The Geiger-Mode Avalanche Photodiode (Gm-APD) LiDAR system demonstrates high-precision detection capabilities over long distances. However, the detection of occluded small objects at long distances poses significant challenges, limiting its practical application. To address this issue, we propose a multi-scale spatio-temporal object detection network (MSTOD-Net), designed to associate object information across different spatio-temporal scales for the effective detection of occluded small objects. Specifically, in the encoding stage, a dual-channel feature fusion framework is employed to process range and intensity images from consecutive time frames, facilitating the detection of occluded objects. Considering the significant differences between range and intensity images, a multi-scale context-aware (MSCA) module and a feature fusion (FF) module are incorporated to enable efficient cross-scale feature interaction and enhance small object detection. Additionally, an edge perception (EDGP) module is integrated into the network’s shallow layers to refine the edge details and enhance the information in unoccluded regions. In the decoding stage, feature maps from the encoder are upsampled and combined with multi-level fused features, and four prediction heads are employed to decode the object categories, confidence, widths and heights, and displacement offsets. The experimental results demonstrate that the MSTOD-Net achieves mAP50 and mAR50 scores of 96.4% and 96.9%, respectively, outperforming the state-of-the-art methods.

1. Introduction

LiDAR systems, renowned for their ability to actively acquire detailed three-dimensional structural information, have been extensively applied in both military and civilian fields [1,2,3,4,5]. Among these, Geiger-Mode Avalanche Photodiode (Gm-APD) LiDAR stands out due to its single-photon-level detection sensitivity, which significantly enhances its capability for long-distance detection [6,7]. This new-generation LiDAR system differs from conventional automotive LiDAR in its imaging mechanism. It employs focal plane array imaging, enabling the simultaneous generation of range and intensity images with an identical resolution, whereas automotive LiDAR relies on multi-line scanning to directly produce 3D point clouds. Although automotive LiDAR offers a higher spatial resolution, its lower imaging speed and shorter detection range impose significant limitations on its applications. In contrast, Gm-APD LiDAR features high sensitivity, a strong anti-interference capability, a long detection range, and a fast imaging speed, making it a focal point of the current research and enabling the detection of long-range objects.
Nevertheless, the practical deployment of Gm-APD LiDAR systems in long-distance detection scenarios presents significant challenges, including the small size and weak signals of moving objects, as well as object occlusion. First, due to the hardware limitations, the current Gm-APD LiDAR system is equipped with a relatively small imaging array, capturing image data at a resolution of 64 × 64 pixels. This low resolution limits the amount of texture information available for object detection. As a result, the acquired data are characterized by weak and small features. Second, in real-world long-distance detection scenarios, moving objects are often subject to occlusion, leading to situations where only partial or no object information is observable at specific moments. This necessitates the exploitation of temporal sequences to facilitate object detection under such conditions. Collectively, these factors render long-distance object detection using Gm-APD LiDAR systems an inherently challenging problem [8,9,10,11].
With the continuous advancement of computational resources, object detection technology has achieved significant progress. However, in Gm-APD LiDAR systems, certain two-stage object detection algorithms [12,13] face challenges in practical deployment due to their large model size and high parameter complexity. Although one-stage object detection algorithms [14,15,16,17] address this limitation by reducing the number of parameters, they often struggle to effectively extract features from distant small objects and occluded objects, resulting in a suboptimal detection performance.
Researchers have proposed various solutions for mitigating the impact of small and occluded objects on detection. For instance, CRNet [18] employs graph convolutional networks to explore the relationships among weak and small objects, while FPPNet [19] uses background information to predict occluded objects. Additionally, approaches such as YOLO-ESL [20], YOLO-SG [21], and SAO-YOLO [22] have been introduced to enhance the YOLO framework, improving its capability to detect weak, small, and occluded objects. Although these methods have achieved certain improvements in detecting small and occluded objects, the image data collected by Gm-APD LiDAR systems have a low resolution of 64 × 64 pixels. Unlike RGB or high-resolution images, such data lack detailed texture information on the object. Consequently, the existing methods cannot be directly applied to this type of data, resulting in a poor detection performance and limited generalization ability. However, most of these methods overlook the potential of temporal information to improve object visibility and fail to fully exploit the multi-scale features of non-occluded objects. Furthermore, in the context of Gm-APD LiDAR systems, the unique imaging characteristics demand a more effective integration of range and intensity images, as well as enhanced edge information for occluded objects.
To address these challenges, we propose the MSTOD-Net, a multi-scale spatio-temporal object detection network designed to detect small and occluded objects in Gm-APD LiDAR systems. In the encoding stage, the network integrates range and intensity images with temporal information from both the current and previous frames to recover occluded data. To enhance the feature representation, the edge perception (EDGP) module refines the edge details, while the feature fusion (FF) module ensures the effective integration of range and intensity data. Additionally, the multi-scale context awareness (MSCA) module captures the correlations between deep semantic and shallow edge features to improve the detection precision. In the decoding stage, the network integrates the fused features to predict object categories, offsets, widths, and heights, as inspired by [23]. The experimental results demonstrate that the MSTOD-Net achieves mAP50 and mAR50 scores of 96.4% and 96.9%, respectively, surpassing the state-of-the-art methods.
The main contributions of this study are as follows:
  • An MSTOD-Net designed for small and occluded objects has been developed to fully extract the spatial and temporal information from input data and utilizes a dual-channel structure to associate effective features between intensity and range images.
  • Considering the differences in the data characteristics between intensity and range images, the FF module and the MSCA module are designed to fuse multi-scale effective features. This approach enables the mapping of data with differing characteristics into a unified semantic space, thereby facilitating comprehensive feature interaction.
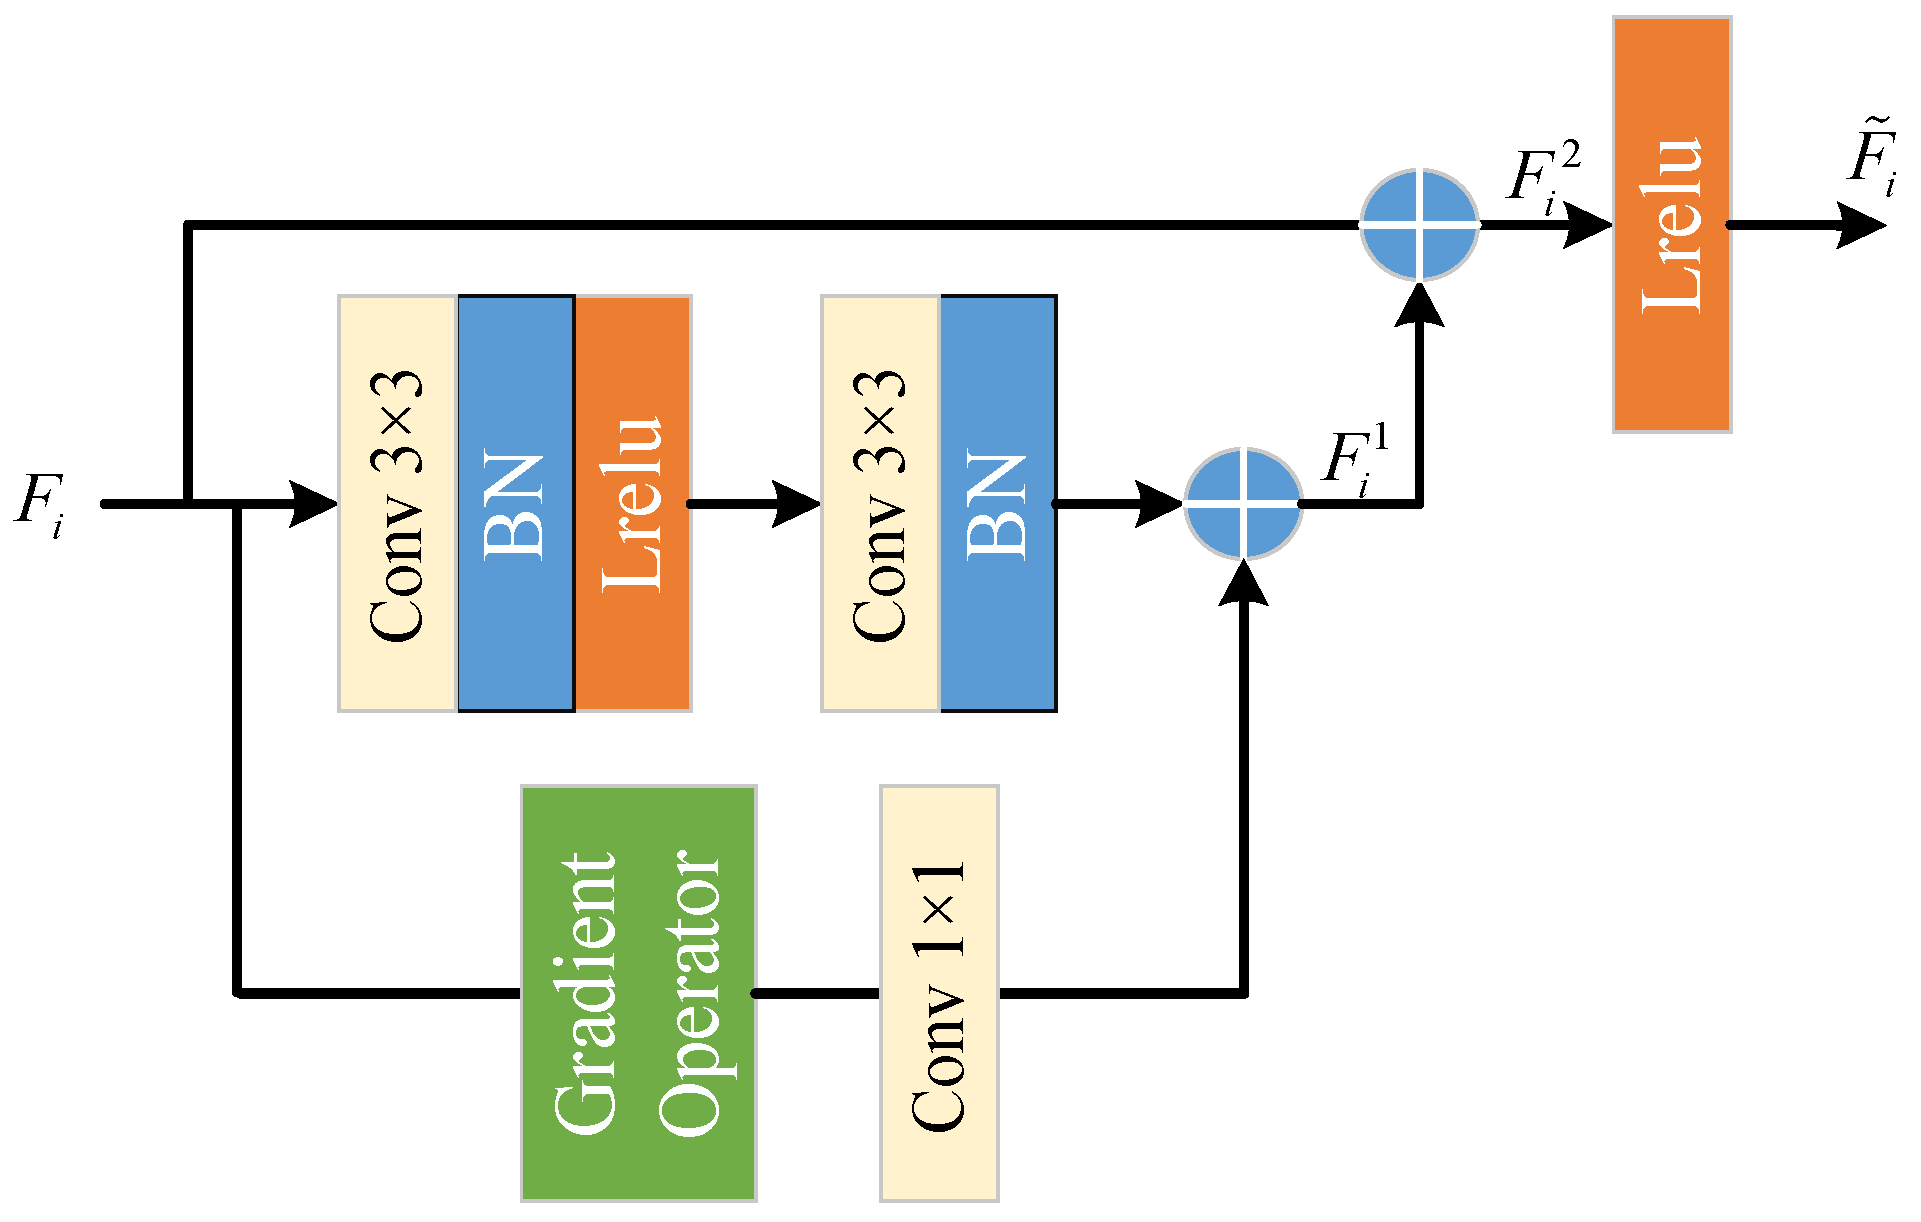
  • Given the lack of detailed information in the small object data acquired from the Gm-APD LiDAR system, we designed the EDGP module to enhance the edge perception, enabling the network to focus on more useful object edge information.
  • Our proposed MSTOD-Net is evaluated on the established Gm-APD LiDAR dataset. Compared to other state-of-the-art object detection algorithms, our method demonstrates a superior performance and achieves an improved object detection precision.

2. Related Work

Since the scenes under consideration involve both small and occluded objects, the following sections outline recent advancements in these respective areas of research.

2.1. Small Object Detection

At present, CNN-based object detection networks are mainly divided into two categories: anchor-based detection methods [24] and anchor-free detection methods [14]. Anchor-based detection methods require predicting a large number of anchor boxes, then determining the category, and adjusting the boxes to obtain the final detection result, which involves a significant computational overhead. Classic networks in this category include the RCNN series [12,13], SSD [25], RetinaNet [26], and the YOLO series [14,15,16,17]. In contrast, anchor-free detection methods have become a new research hotspot by eliminating the redundancies associated with anchor prediction, achieving promising results in small object detection. Notable networks include CornerNet [27], CenterNet [23], FCOS [28], ExtremeNet [29], YOLOX [30], and YOLOv8 [31], all of which have demonstrated a strong detection performance. Jie Feng et al. [32] proposed a new semantic-embedded density-adaptive network (SDANet) based on anchor-free detectors, addressing the challenge of detecting small and difficult-to-detect moving vehicles. Jiaquan Shen et al. [33] introduced a light aircraft detection algorithm based on the anchor-free method, which incorporated an attention mechanism to effectively reduce the model’s computational cost and enhance the feature extraction for small objects. Wei Zhang et al. [34] proposed an adaptive label allocation detection framework using an anchor-free object detection network as the backbone, utilizing a feature compensation method to address the issue of feature disappearance for small objects. Lijian Yu et al. [35] developed an anchor-free vehicle detection network (AVD-kpNet) to robustly detect small vehicles in remote sensing images, thereby improving the detection precision. Mingyang Wang et al. [36] designed a Three ResNet block detection model based on CenterNet to enhance the detection precision and speed for small-scale pedestrians, addressing the issue of missed detections due to the small size of pedestrian objects.
In recent years, researchers have explored Transformer-based object detection networks for small object detection. Lingtong Min et al. [37] incorporated a Transformer into the YOLO network and proposed an innovative framework, YOLO-DCTI, which leveraged the Contextual Transformer (CoT) framework to detect small and tiny objects. Xinyu Cao et al. [38] introduced a Transformer-based DFS-DETR network, achieving significant improvements in the detection performance on small object datasets. Chuan Qin et al. [39] proposed an end-to-end Transformer-based detection framework for small-scale objects in SAR images, demonstrating a superior performance in detecting small objects.
Although the aforementioned research, including anchor-based and Transformer-based detection methods, has improved the detection precision for small objects and introduced certain enhancements, it does not ensure accurate detection when background occlusions, such as trees, obstruct moving objects. Moreover, it fails to fully account for the unique characteristics of images generated by Gm-APD LiDAR systems and does not effectively enhance the edge information on small objects.

2.2. Occluded Object Detection

András Pálffy et al. [40] proposed an occlusion perception fusion method using a stereo camera and a radar sensor, which adjusts the expected detection rate and characteristics of different areas based on the sensor’s visibility, addressing the problem of detecting pedestrian occlusion. Qiming Li et al. [41] introduced a simple and effective anchor-free network for pedestrian detection in crowd scenarios (OAF-Net) which effectively simulated different levels of occlusion of pedestrians and could be optimized to achieve a high-level understanding of complex training samples where the pedestrians were blocked, thereby improving the object detection performance. Hua Bao et al. [42], addressing issues such as object occlusion and scale changes in detection, proposed a new conjoined dual-attention network for visual tracking, incorporating self-attention and cross-attention mechanism modules, which achieved good detection results. Yidan Nie et al. [43] proposed a new time-motion compensation connected network (Siam-TMC) for remote sensing tracking, designing a TMComp mechanism that utilized time-motion information, which demonstrated effective detection results for occluded objects. Tian-Liang Zhang et al. [44] introduced a new feature learning model called CircleNet, which adapted the features by mimicking the observation process for low-resolution and occluded objects, improving the detection performance for both occluded and small pedestrians. Kangning Cui et al. [45] introduced the PalmDSNet network to address detection challenges in remote sensing data caused by overlaps and occlusion. Additionally, they employed a bimodal reproduction algorithm to enhance the understanding of the point patterns, effectively improving the object detection accuracy.
Although the aforementioned studies have focused on the detection of occluded objects and improvement of the detection performance, they have not adequately explored the differences and complementarities in the characterization of data at different levels and types within the network. In addition, most of these studies have not enhanced the features in the unoccluded regions of the network, thus limiting their ability to effectively improve the object detection performance.
In summary, to address the challenges of detecting small and occluded moving objects in the current research, we propose a multi-scale spatio-temporal detection framework. By integrating temporal information from previous frames and incorporating feature fusion and edge perception modules, the proposed approach effectively improves the detection accuracy while maintaining its real-time performance.

3. Methodology

3.1. The Overall Architecture

Figure 1 illustrates the overall architecture of the proposed MSTOD-Net, which effectively integrates multi-scale temporal and spatial information to accurately detect occluded small objects. The proposed MSTOD-Net consists of a dual-branch encoder, multiple feature fusion (FF) modules, a multi-scale context-aware (MSCA) module, a decoder, and a prediction head with multiple prediction components.
In the encoder, we propose a new FF module to extract complementary information from range images (Rng) and intensity images (Cnt). This module enables the interaction of channel and spatial attention, as well as sharing information across different data types. We introduce an EDGP module embedded into shallow feature maps to enhance the edge features of the object, resulting in clearer edge information. In deep feature maps, we add a self-attention mechanism to effectively extract high-level semantic information.
In the decoder, we input the deepest semantic fusion features from the encoder into our proposed multi-scale context awareness (MSCA) module and perform upsampling to fuse the obtained high-resolution feature map with the FF module’s output. Finally, four prediction heads are used to decode the feature map into heat map, confidence, height, width, and displacement offset items, respectively.

3.2. The Backbone Network

As shown in Figure 1, we design a dual-branch encoder for feature extraction, using the improved ResNet [46] network as the backbone. The backbone network consists of a convolutional layer, a max pooling layer, an EDGP module, and three residual blocks. To reduce the network parameters, each layer of the two backbone networks shares the weight parameters.
First, the range image of the current frame, the range image of the previous frame, and the heat map of the previous frame’s prediction result are summed bitwise, and the extracted features are input into the first 3 × 3 convolutional layer. Then, the range images and intensity images are fused, and a max pooling layer is used to further reduce the information extracted by the convolutional layer, thereby decreasing the amount of computation. Next, the extracted shallow features are passed through the EDGP module to enhance the edge information of the object. Finally, three residual blocks are used to extract high-level semantic features at different layers, and the FF module, designed to fuse range and intensity features, is applied.
Therefore, our dual-channel backbone network can fully extract both the common and complementary features of range and intensity images. The specific network parameter structure is shown in Table 1.

3.3. The EDGP Module
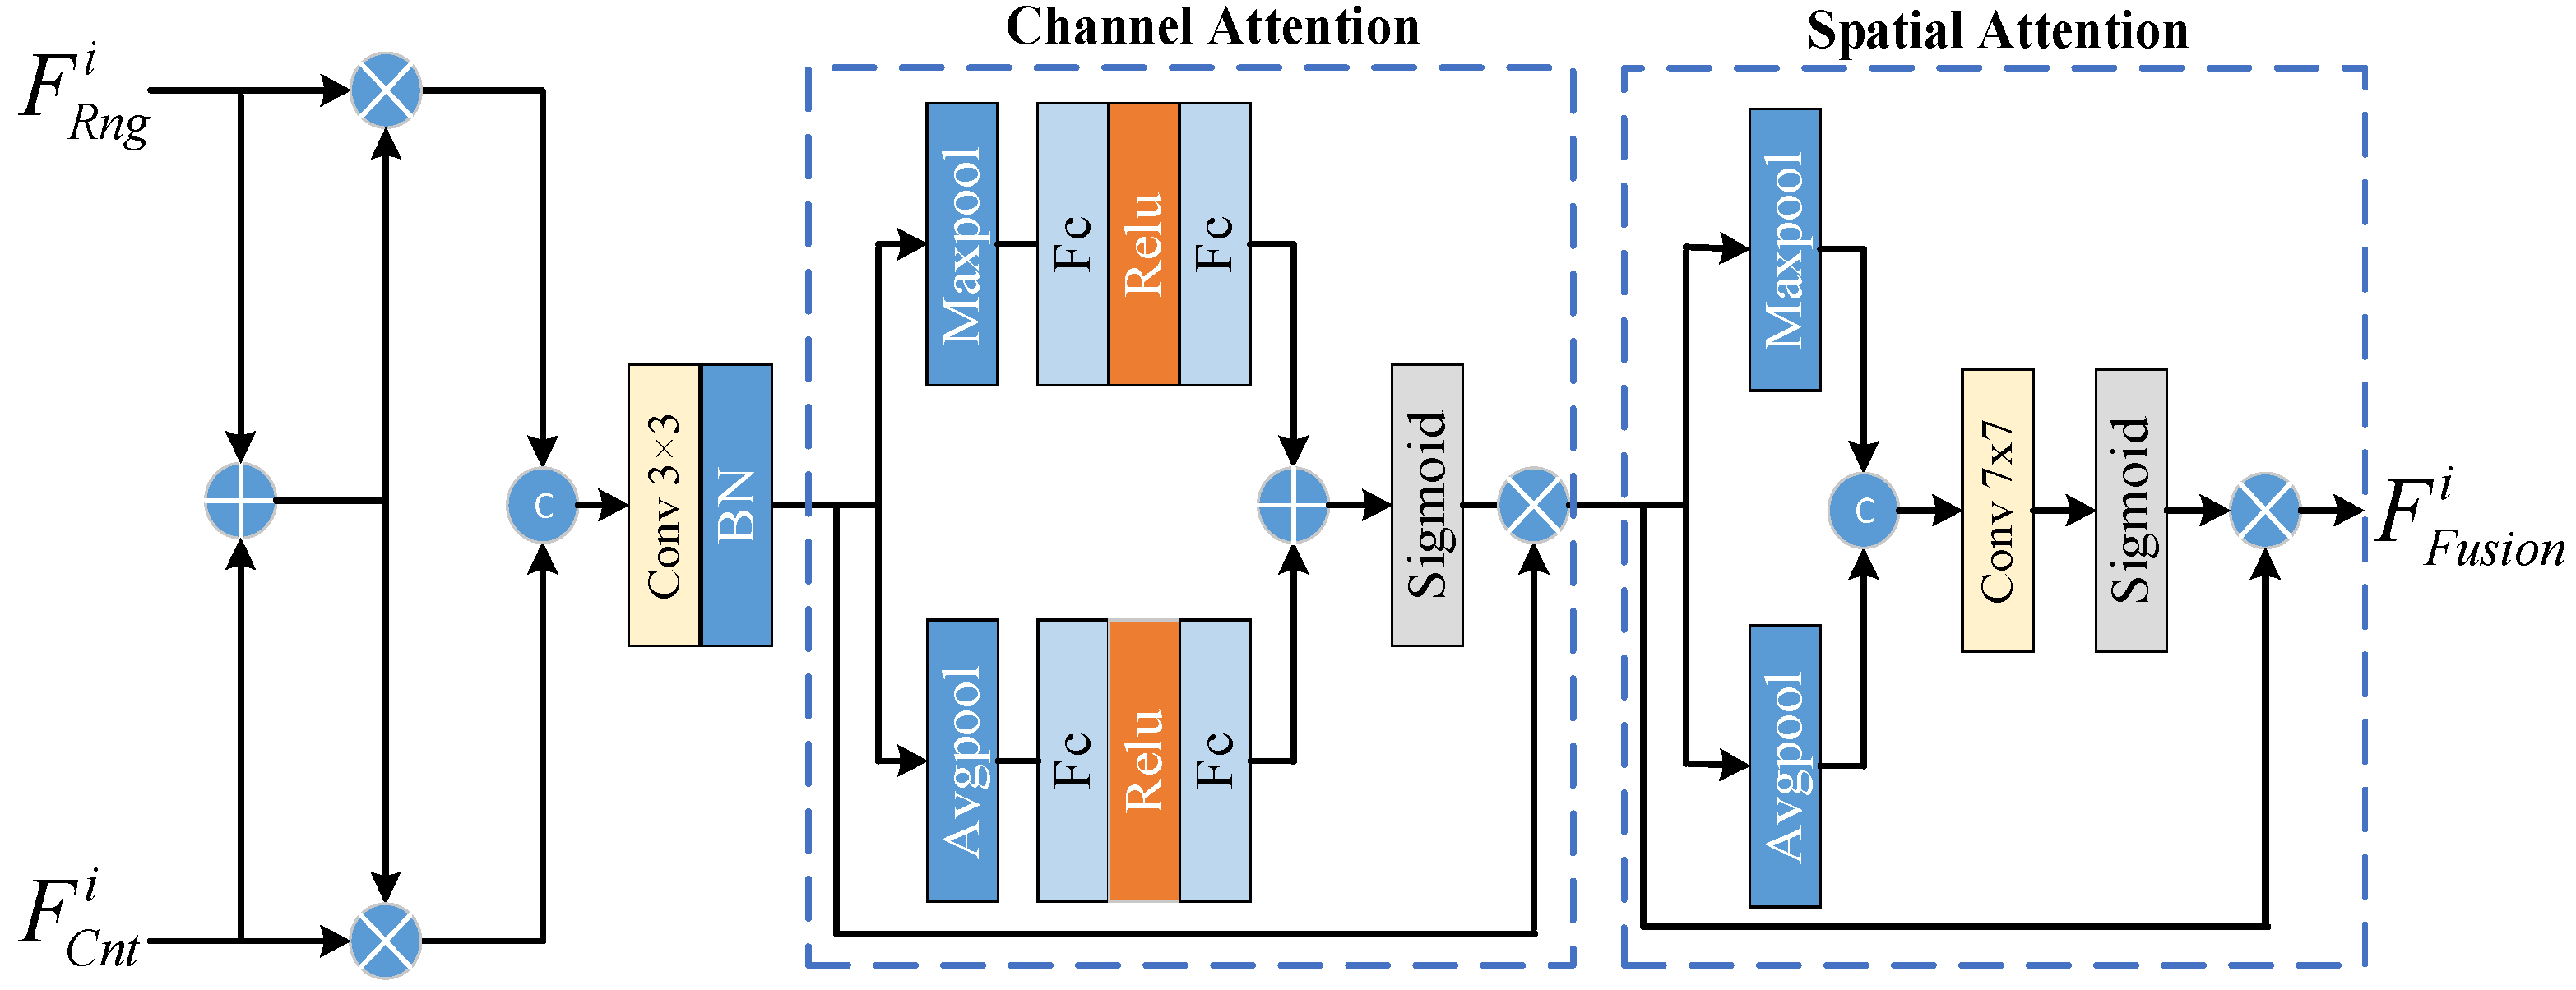
The EDGP module is designed to enhance the edge gradient information in the range and intensity image features F ˜ i , where i { R n g , C n t } , respectively, and the gradient operator is introduced into the residual module to compute the gradient information of the objects. The module structure is shown in Figure 2. First, we use the Sobel gradient operator [47] on the input feature F i to extract the edge information of the object, and we use two 3 × 3 convolution blocks to further extract the features from the input. Then, the edge enhancement feature F i 1 is obtained by adding these two features. Finally, the input feature F i and the edge enhancement feature F i 1 are added using a skip connection to obtain the output enhancement feature as follows:
F ˜ i = Lrelu ( Conv 1 × 1 ( Sobel ( F i ) ) CB ( CBL ( F i ) ) F i ) ,   w h e r e   i { R n g , C n t }
where Sobel is a gradient operator, Conv 1 × 1 is 1 × 1 convolution, is element summation, CBL is 3 × 3 convolution followed by batch normalization (BN) and Leaky Relu (Lrelu), and CB is 3 × 3 convolution followed by batch normalization (BN).

3.4. The FF Module

In order to utilize the information from range images and intensity images better, we propose the FF module for feature fusion, as shown in Figure 3. Rng features and Cnt features extracted from the upper-layer network are represented as F R n g i | i = 1 , 2 and F C n t i | i = 1 , 2 , respectively, and the fused features are F F u s i o n i | i = 1 , 2 . In the FF module, the fused features of Rng and Cnt are obtained through summation, multiplication, and stacking operations. To extract further valuable features, the fusion features undergo global max pooling and average pooling for channels using the channel attention mechanism. Subsequently, spatial attention is applied through global max pooling and average pooling in the spatial dimension. This process captures both the global and local characteristics of channels and spaces. Consequently, global and local context information is simultaneously considered, and the process can be expressed as follows:
F F u s i o n i = SA ( CA ( Cat ( F R n g i ( F C n t i F R n g i ) , F C n t i ( F C n t i F R n g i ) ) ) )
where represents element multiplication, Cat represents concatenation, CA represents channel attention, and SA represents spatial attention.

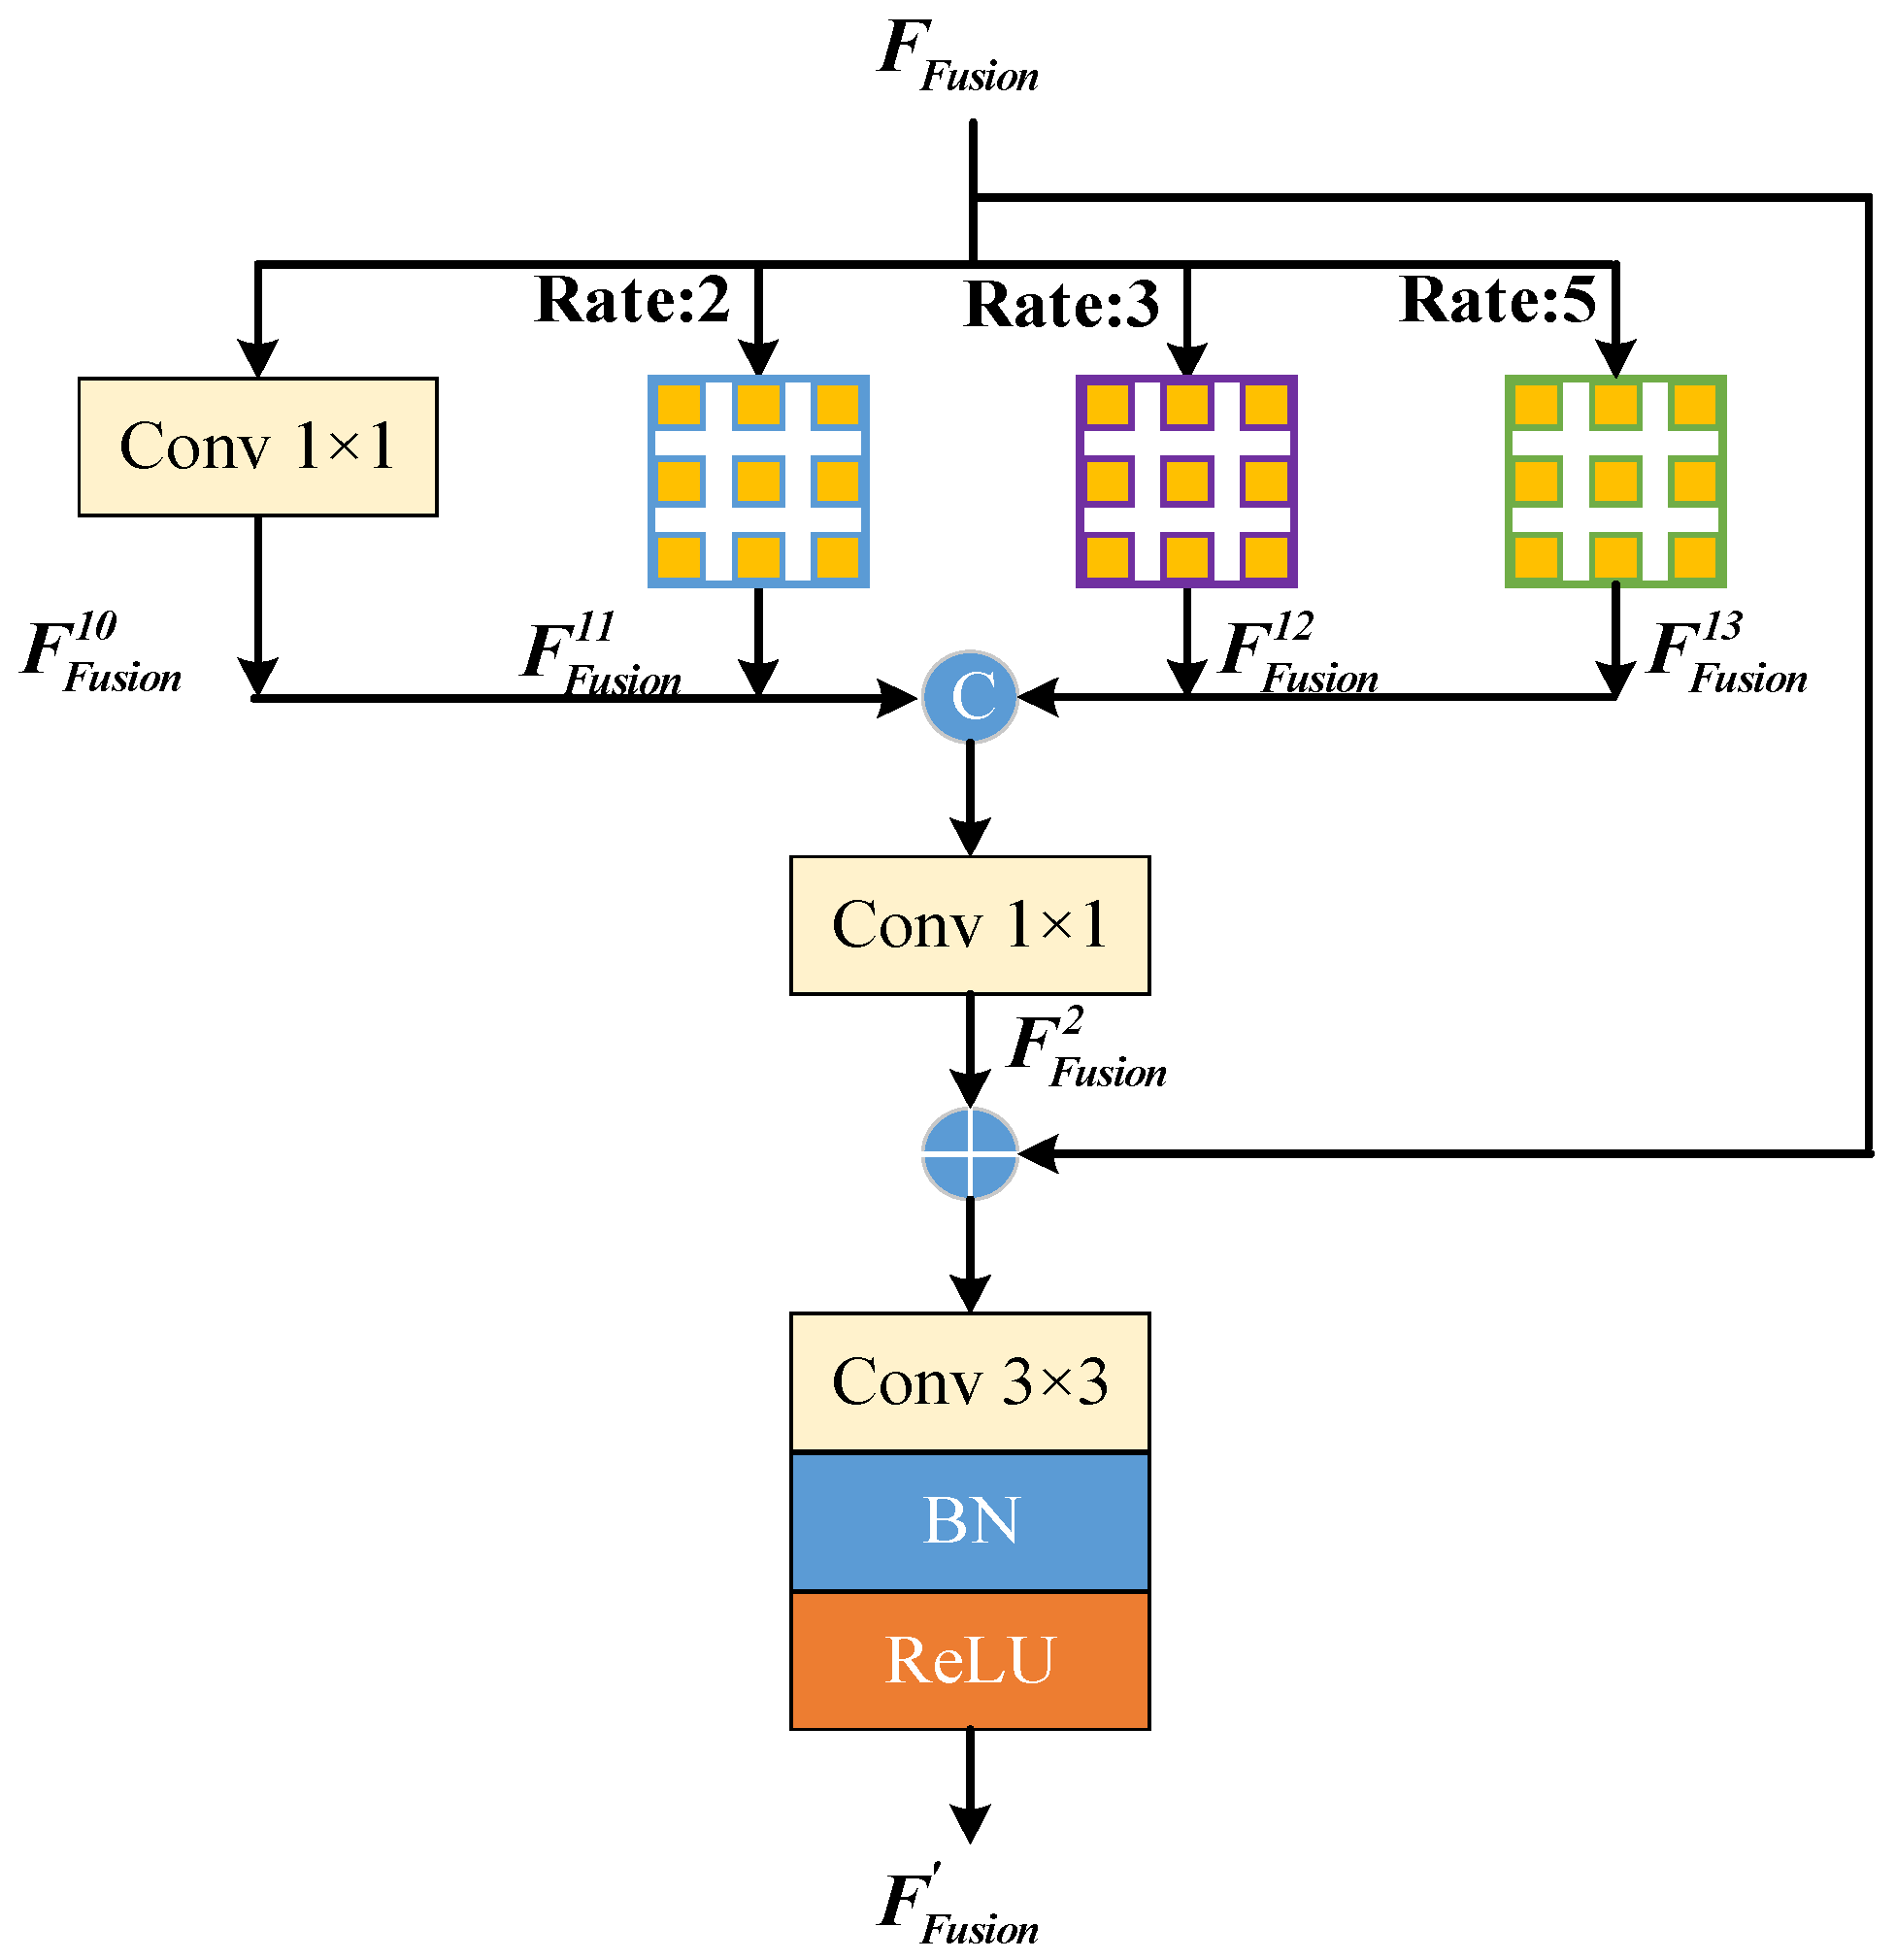
3.5. The MSCA Module

Low-level features contain basic attributes and local structures, while high-level features encompass more semantic information, leading to weak correlations between different feature levels. To fully utilize these extracted features, we design a multi-scale context-aware (MSCA) module, which is inspired by [48], as shown in Figure 4.
In order to enlarge the receptive field of the features, we introduce three dilated convolutions with different dilation rates. The features extracted by the 1 × 1 convolution and the three dilated convolutions can be concatenated as follows:
F F u s i o n 10 = Conv 1 × 1 ( F F u s i o n )
F F u s i o n 11 = Conv 3 × 3 , r a t e = 2 ( F F u s i o n ) F F u s i o n 12 = Conv 3 × 3 , r a t e = 3 ( F F u s i o n ) F F u s i o n 13 = Conv 3 × 3 , r a t e = 5 ( F F u s i o n )
F F u s i o n 2 = Conv 1 × 1 ( Cat ( F F u s i o n 10 , F F u s i o n 11 , F F u s i o n 12 , F F u s i o n 13 ) )
Then, the integrated multi-scale features are combined with the input features. Finally, the features are further extracted using 3 × 3 convolution to capture the multi-scale context features, which can be expressed as follows:
F F u s i o n = CBR ( F F u s i o n 2 F F u s i o n )
where CBR is 3 × 3 convolution followed by batch normalization (BN) and Relu.

3.6. The Loss Function

The loss function can be divided into four parts:
  • L h m is the object center point loss;
  • L s i z e is the object size loss;
  • L o f f is the center point offset loss;
  • L d i s is the object displacement loss.
The object center point loss function L h m is represented by the focal loss [26] as follows:
L h m = 1 N x y c ( 1 Y ^ x y c ) α log ( Y ^ x y c ) Y x y c = 1 ( 1 Y x y c ) β ( Y ^ x y c ) α log ( 1 Y ^ x y c ) otherwise
where Y [ 0 , 1 ] W R × H R × C is the ground-truth heat map corresponding to the marked object, N is the number of objects, and α = 2 and β = 4 are the hyperparameters of focal loss.
The object size loss function L s i z e is expressed by L1 loss as follows:
L s i z e = 1 N i = 1 N S ^ p i s i
where S ^ p i is the size regression value of the center point, and s i is the size of the real label box.
The center point offset loss L o f f is represented by L1 loss as follows:
L o f f = 1 N p O ^ p ˜ ( p R p ˜ )
where p is the center of the original input image of the network, p ˜ is the center point corresponding to the feature graph obtained after the convolution of the original input image, N is the downsampling factor, p R p ˜ is the ground-truth center point offset, and O ^ p ˜ is the predicted center point offset.
The object displacement loss L d i s is represented by L1 loss as follows:
L d i s = 1 N i = 1 N D ^ p i ( t ) ( p i ( t 1 ) p i ( t ) )
where D ^ ( t ) W R × H R × 2 is the predicted two-dimensional displacement, and for each detected object at position p ^ ( t ) , the displacement d ^ ( t ) = D ^ p ^ ( t ) ( t ) captures the difference between the object’s position in the current frame p ^ ( t ) and the previous frame p ^ ( t 1 ) ; that is, d ^ ( t ) = p ^ ( t ) p ^ ( t 1 ) , p ^ ( t 1 ) , and p ^ ( t ) are the position of the previous frame and the current frame of the real object, respectively.
The total loss L total of the network is expressed as follows:
L total = λ h m L h m + λ s i z e L s i z e + λ o f f L o f f + λ d i s L d i s
where λ h m , λ s i z e , λ o f f , and λ d i s are the weights corresponding to the object center point loss, object size loss, center point offset loss, and object displacement loss, respectively.

4. The Experiment

4.1. Dataset Acquisition and Implementation Details

4.1.1. Dataset Acquisition

This study employs a Gm-APD LiDAR system to acquire dynamic data from a fixed setup across two distinct scenarios, capturing continuous dynamic sequences within these scenes. Featuring a single-photon detection sensitivity, the system’s principal structure is illustrated in Figure 5. The laser emits high-frequency pulsed beams that diverge to illuminate the object, and the reflected light is captured using a two-dimensional Gm-APD array. Each pixel of the array measures the return time to compute the object distances, producing a three-dimensional image. This image comprises a range image (Rng) that contains the distance information and an intensity image (Cnt) that provides reflectance information. As depicted in Figure 5, data were collected for multiple occluded small objects, including people, UAVs, and cars, across the two scenarios.
Scenario 1 involved the collection of ten sets of dynamic data on people at night, while scenario 2 focused on three sets of dynamic daytime data, including people, UAVs, and cars. A total of 3032 frames were randomly selected and extracted consecutively from each sequence across the two scenarios to construct the dataset used in this study. Detailed information about the dataset is presented in Table 2. We employed the LabelImg [49] annotation tool to label the dataset. Given that the dataset primarily consisted of small and occluded objects, we integrated two types of data, along with features from consecutive frames in the sequence, to ensure accurate object annotation. The diversity of the scenes and the precision of the annotations provide a strong foundation for the reliable validation of the MSTOD-Net.

4.1.2. Implementation Details

The software and hardware platform configurations used in the experiment were as follows: two GeForce RTX™ 2080 Ti graphics cards, manufactured by NVIDIA, with a memory capacity of 11 GB each, and PyTorch1.9.0, a deep learning framework.
We collected datasets for two challenging scenarios, extracting a total of 3032 data frames. The datasets were divided into training, test, and validation sets at a 7:2:1 ratio. To enhance the resolution of the images, the original 64 × 64 range and intensity images were upsampled 8-fold using the nearest-neighbor interpolation method, resulting in 512 × 512 range and intensity images as the network inputs. The model was trained for 100 epochs. The initial learning rate was set to 2 × 10⁻⁴, and it was reduced to 1 × 10⁻⁴ after 60 epochs. The batch size was set to 16, and the optimizer used was Adam with a momentum of 0.9.

4.2. Evaluation Indexes

In this study, we use two metrics, mAP (mean average precision) and mAR (mean average recall), commonly used in COCO evaluation metrics for object detection, to evaluate the detection performance of the model. The AP (average precision) is calculated as follows:
A P = 0 1 P ( R ) d R
where P (precision) represents the precision rate, R (recall) represents the recall rate, and the formula is as follows:
P = T P T P + F P
R = T P T P + F N
where TP (True Positive) represents the number of samples predicted as positive that are actually positive; FP (False Positive) represents the number of samples predicted as positive that are actually negative; and FN (False Negative) represents the number of samples predicted as negative that are actually positive.
The mAP is the average of the APs for all categories, expressed as follows:
m A P = i = 1 C A P i C
where C denotes the total number of all categories, and A P i denotes the AP value for class i.
AR (average recall) is calculated as follows:
A R = 2 0.5 1 R ( o ) d o
where o denotes I O U [ 0.5 , 1.0 ] , and R denotes the recall rate.
The mAR is the average of the ARs for all categories, expressed as follows:
m A R = i = 1 C A R i C
In order to evaluate the effectiveness of the MSTOD-Net in real-time detection, we also introduce the model parameters (Params) and floating-point operations (FLOPs) for evaluation.
P a r a m s = a = 1 N ( K a 2   C a 1   C a + C a )
F L O P s = a = 1 N K a 2   C a 1   H a   W a
where N is the number of convolutional layers, H a   W a is the size of the a-th feature map, K a is the size of the a-th convolution kernel, and C a is the channel number of the a-th feature map.

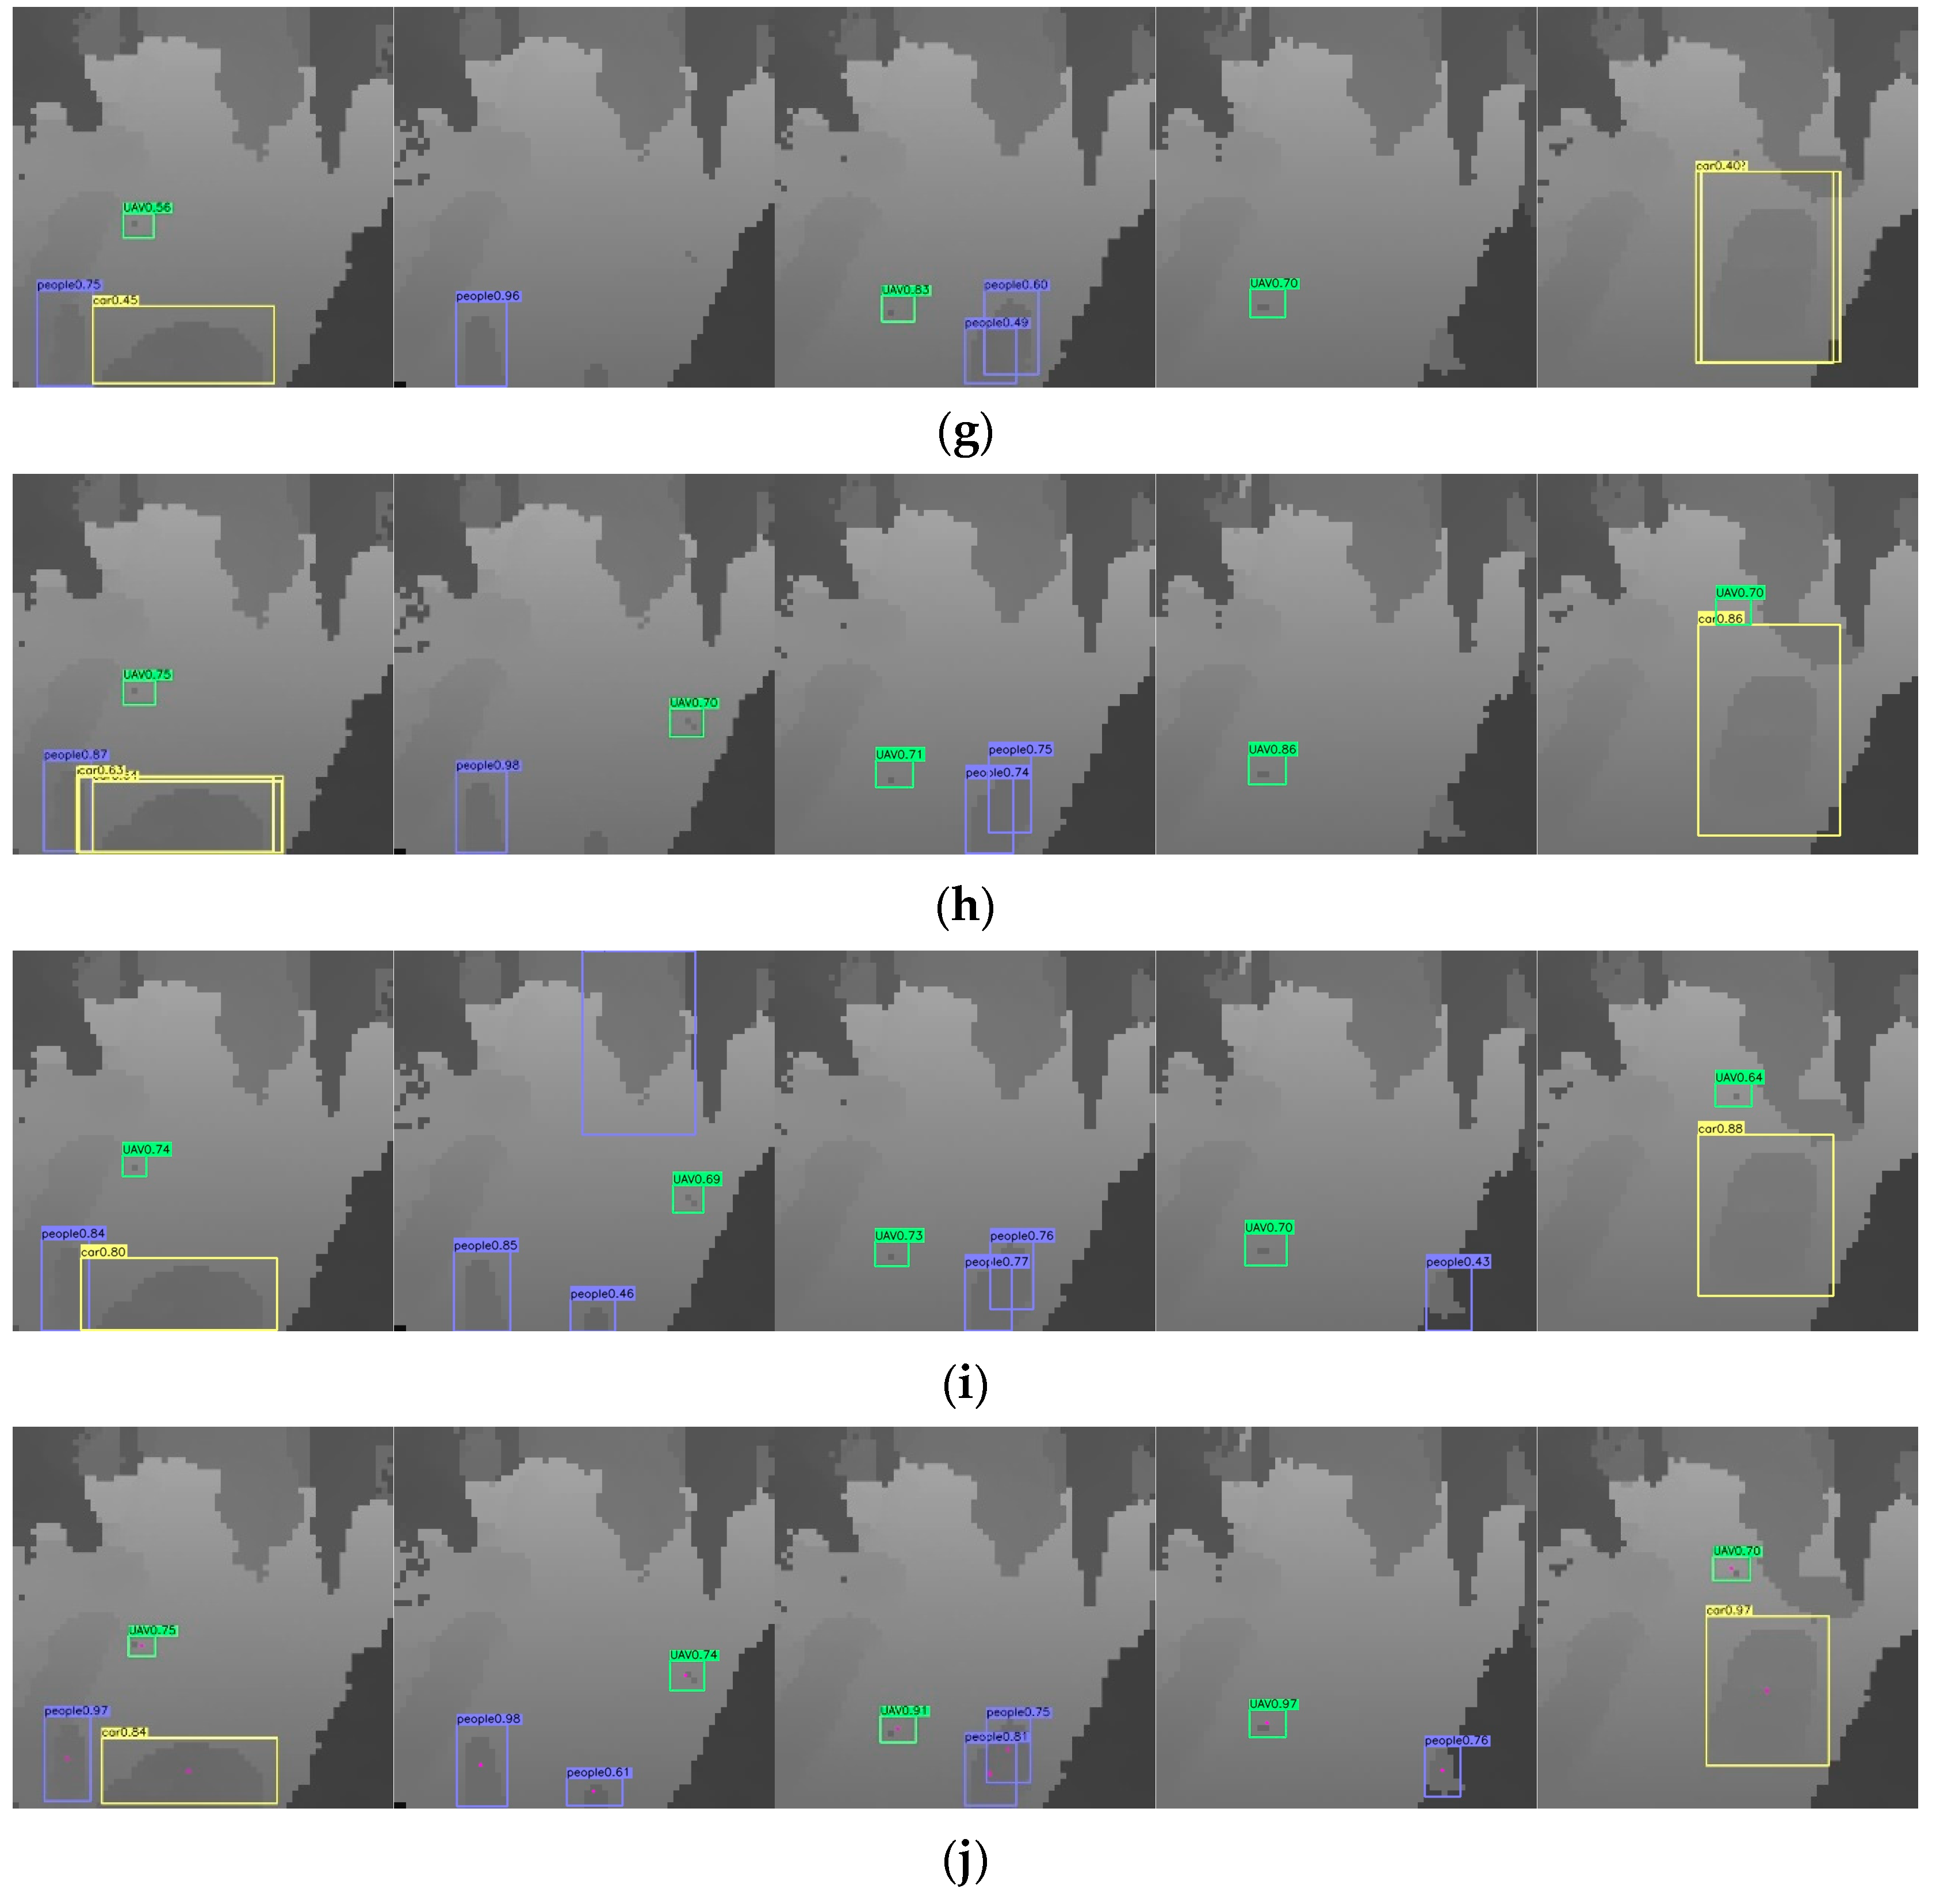
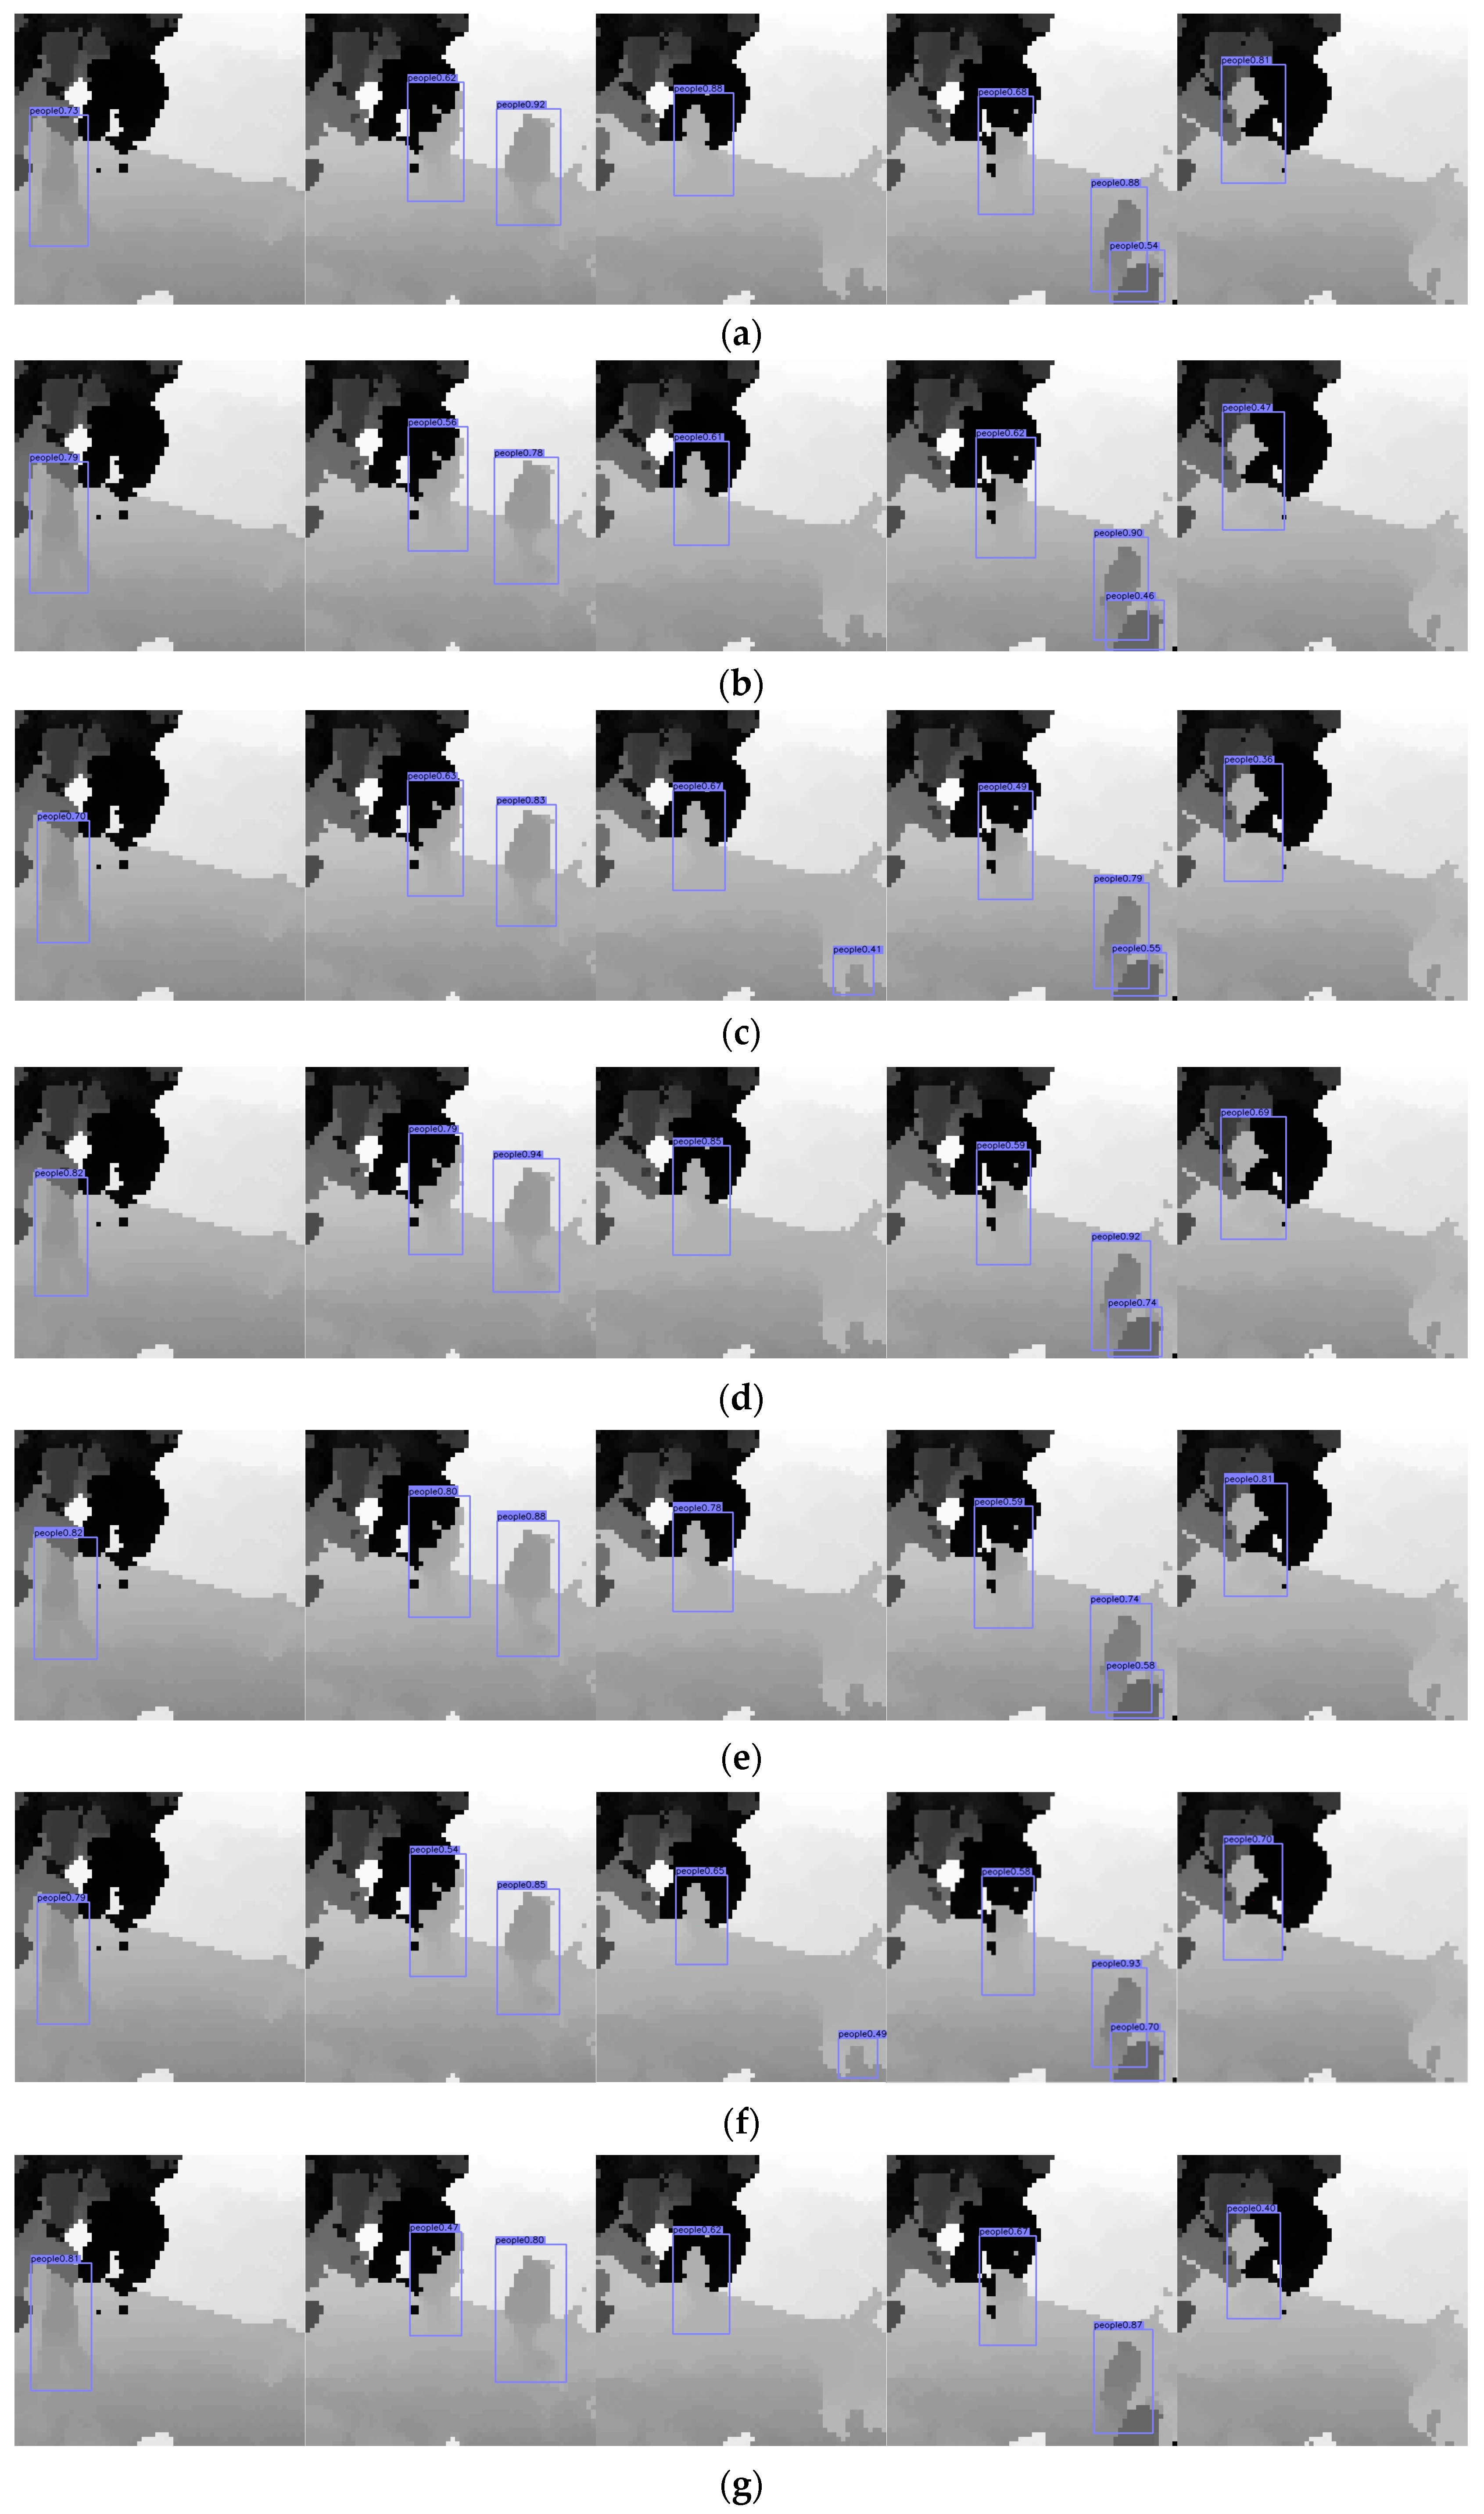
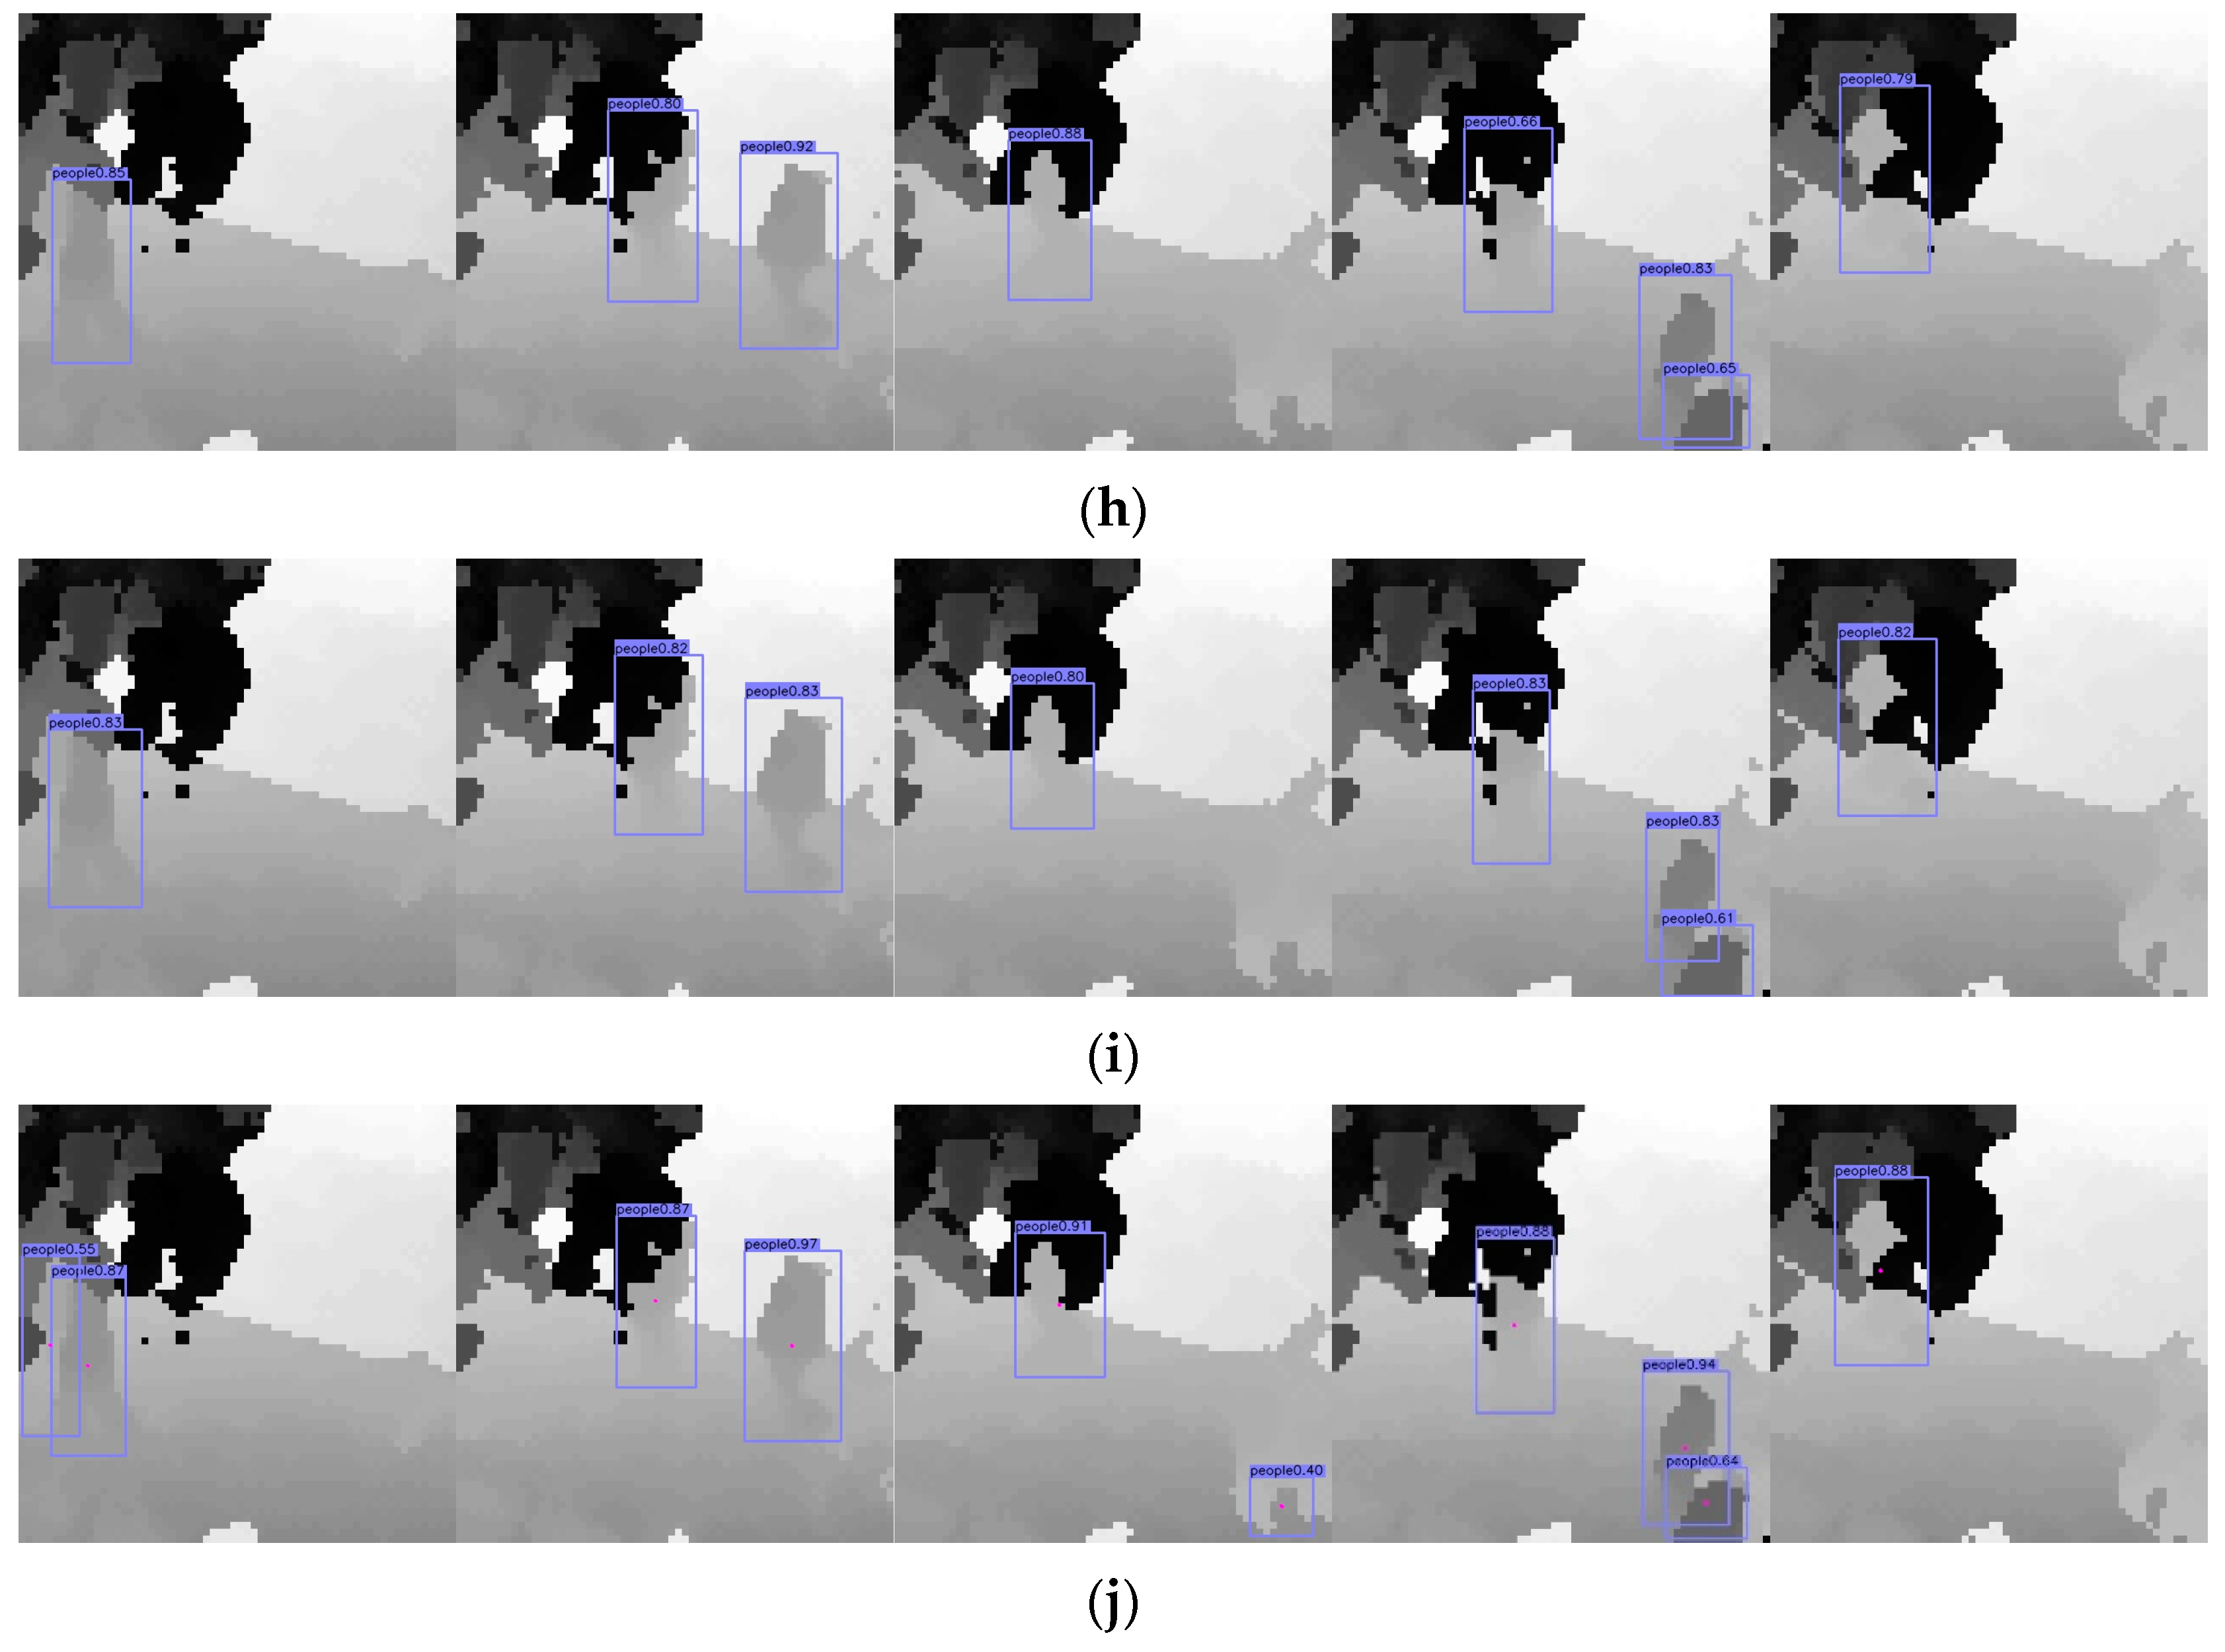
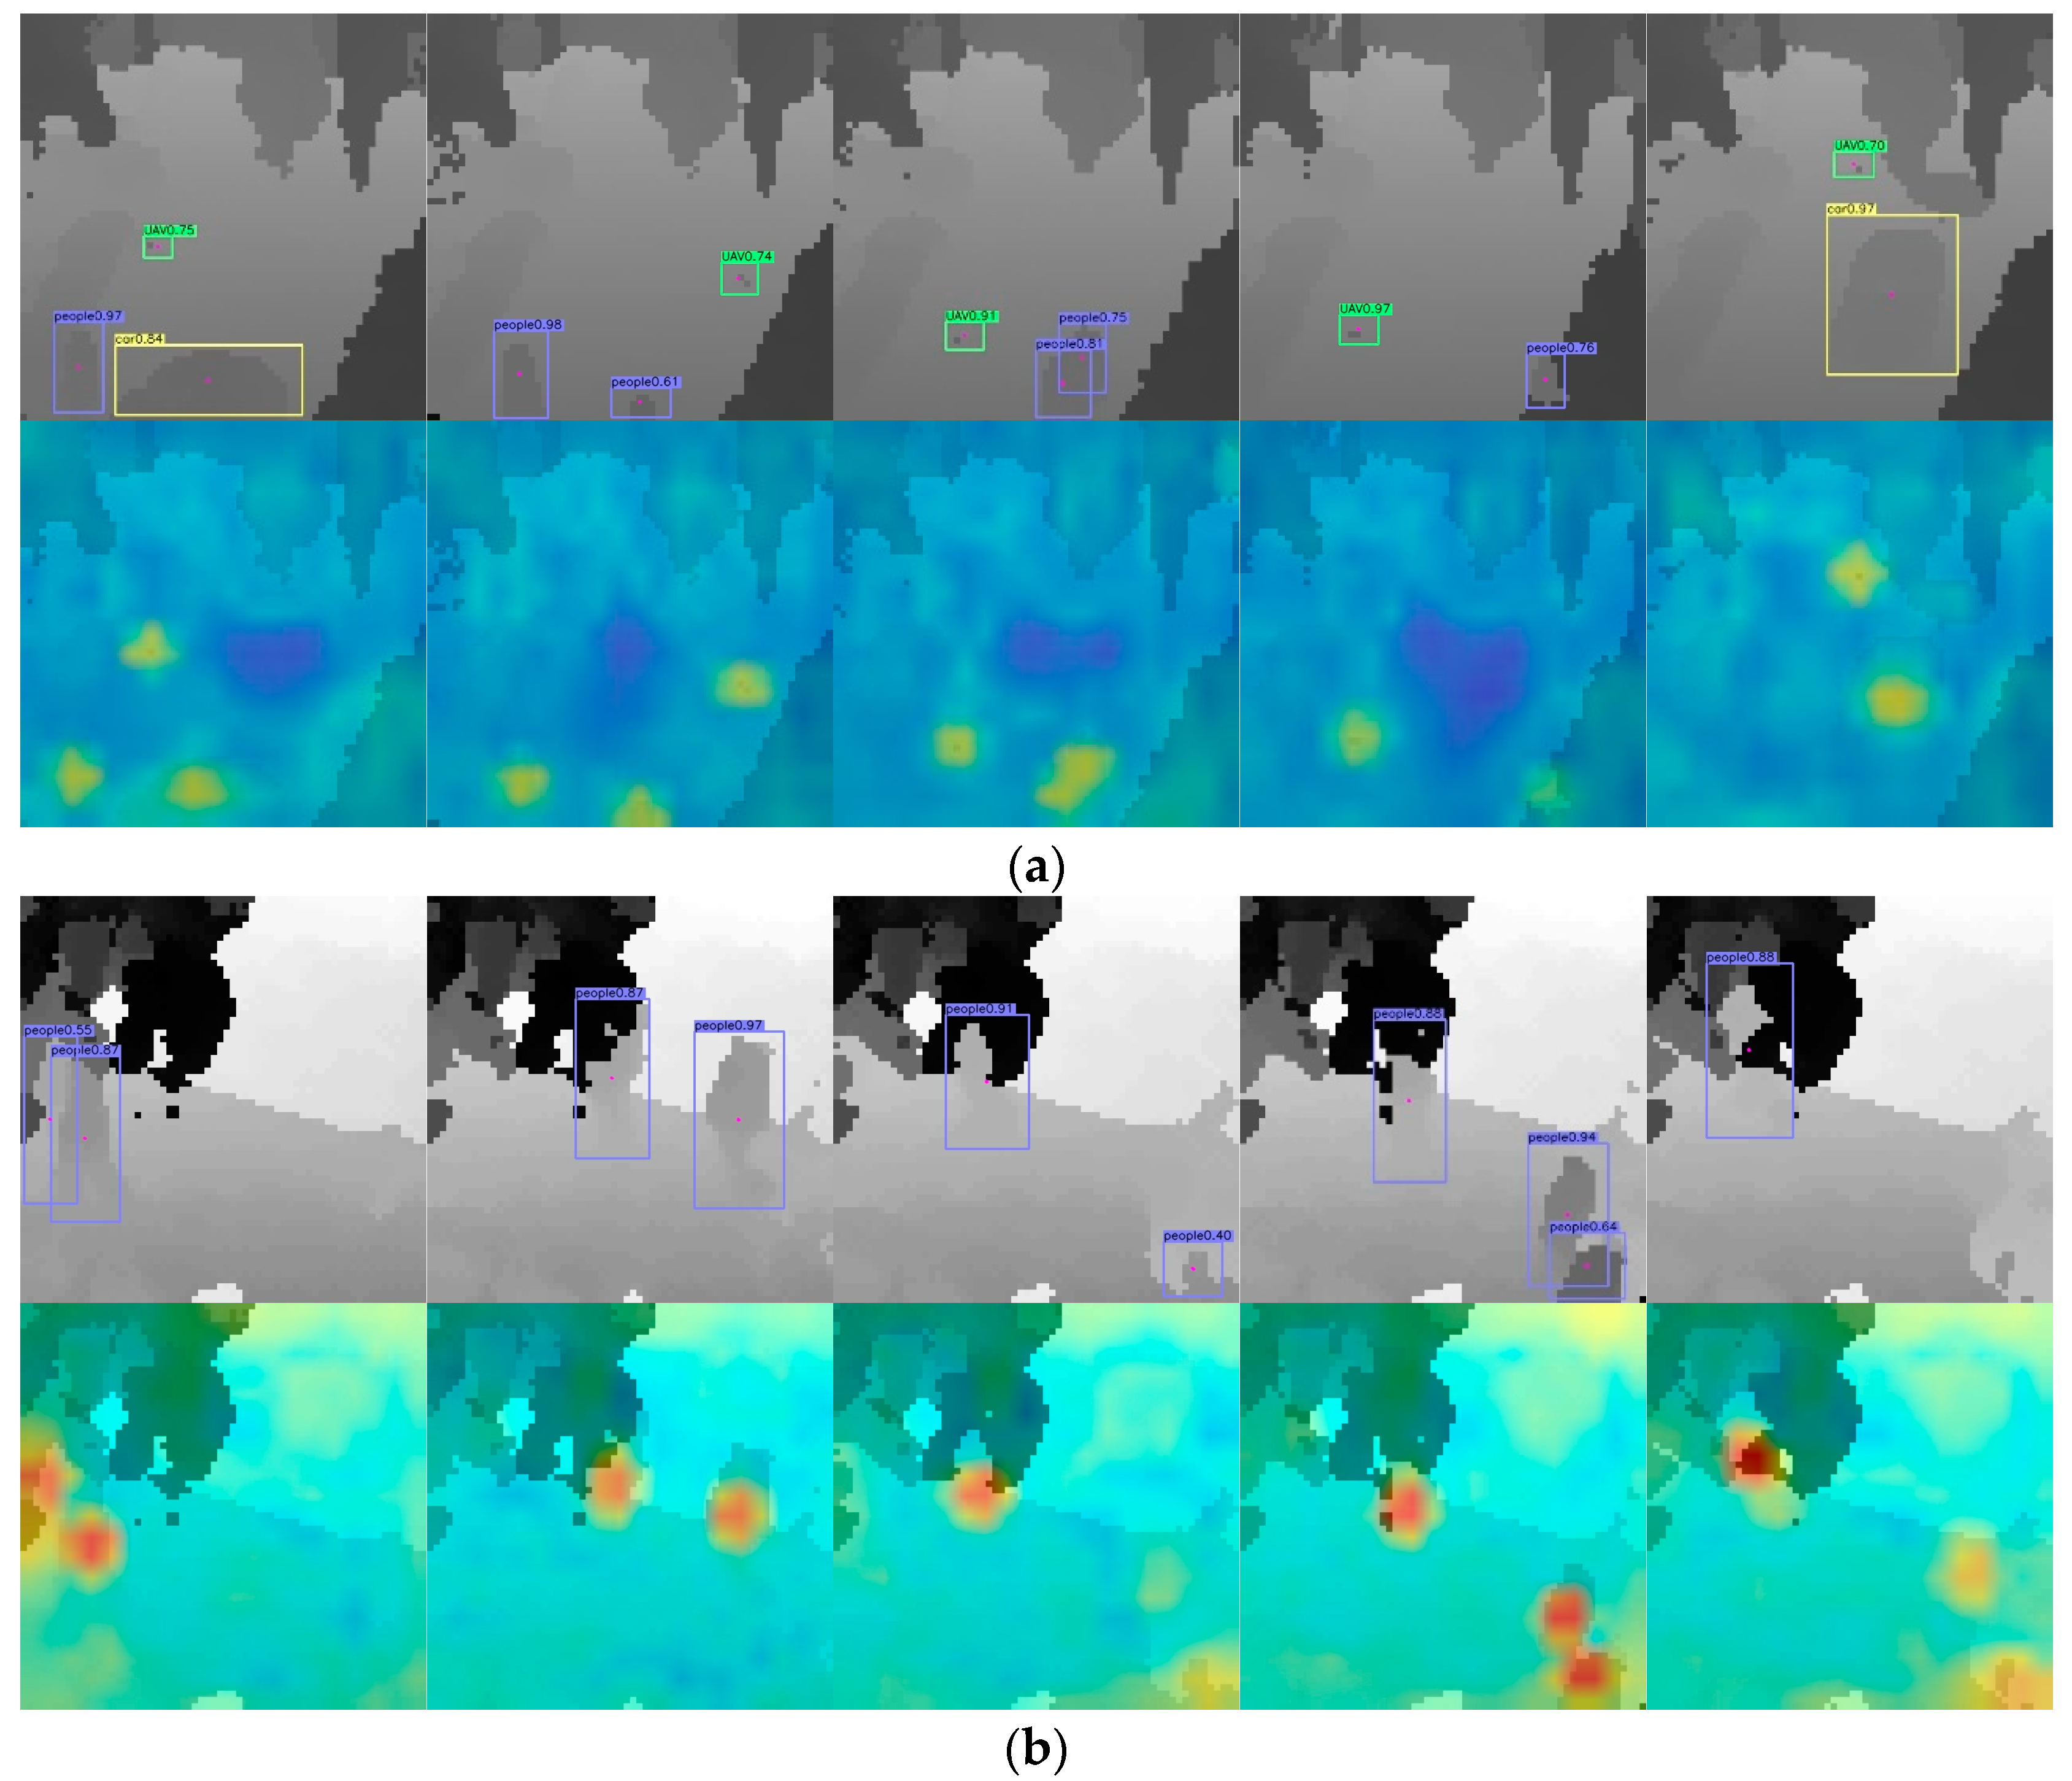
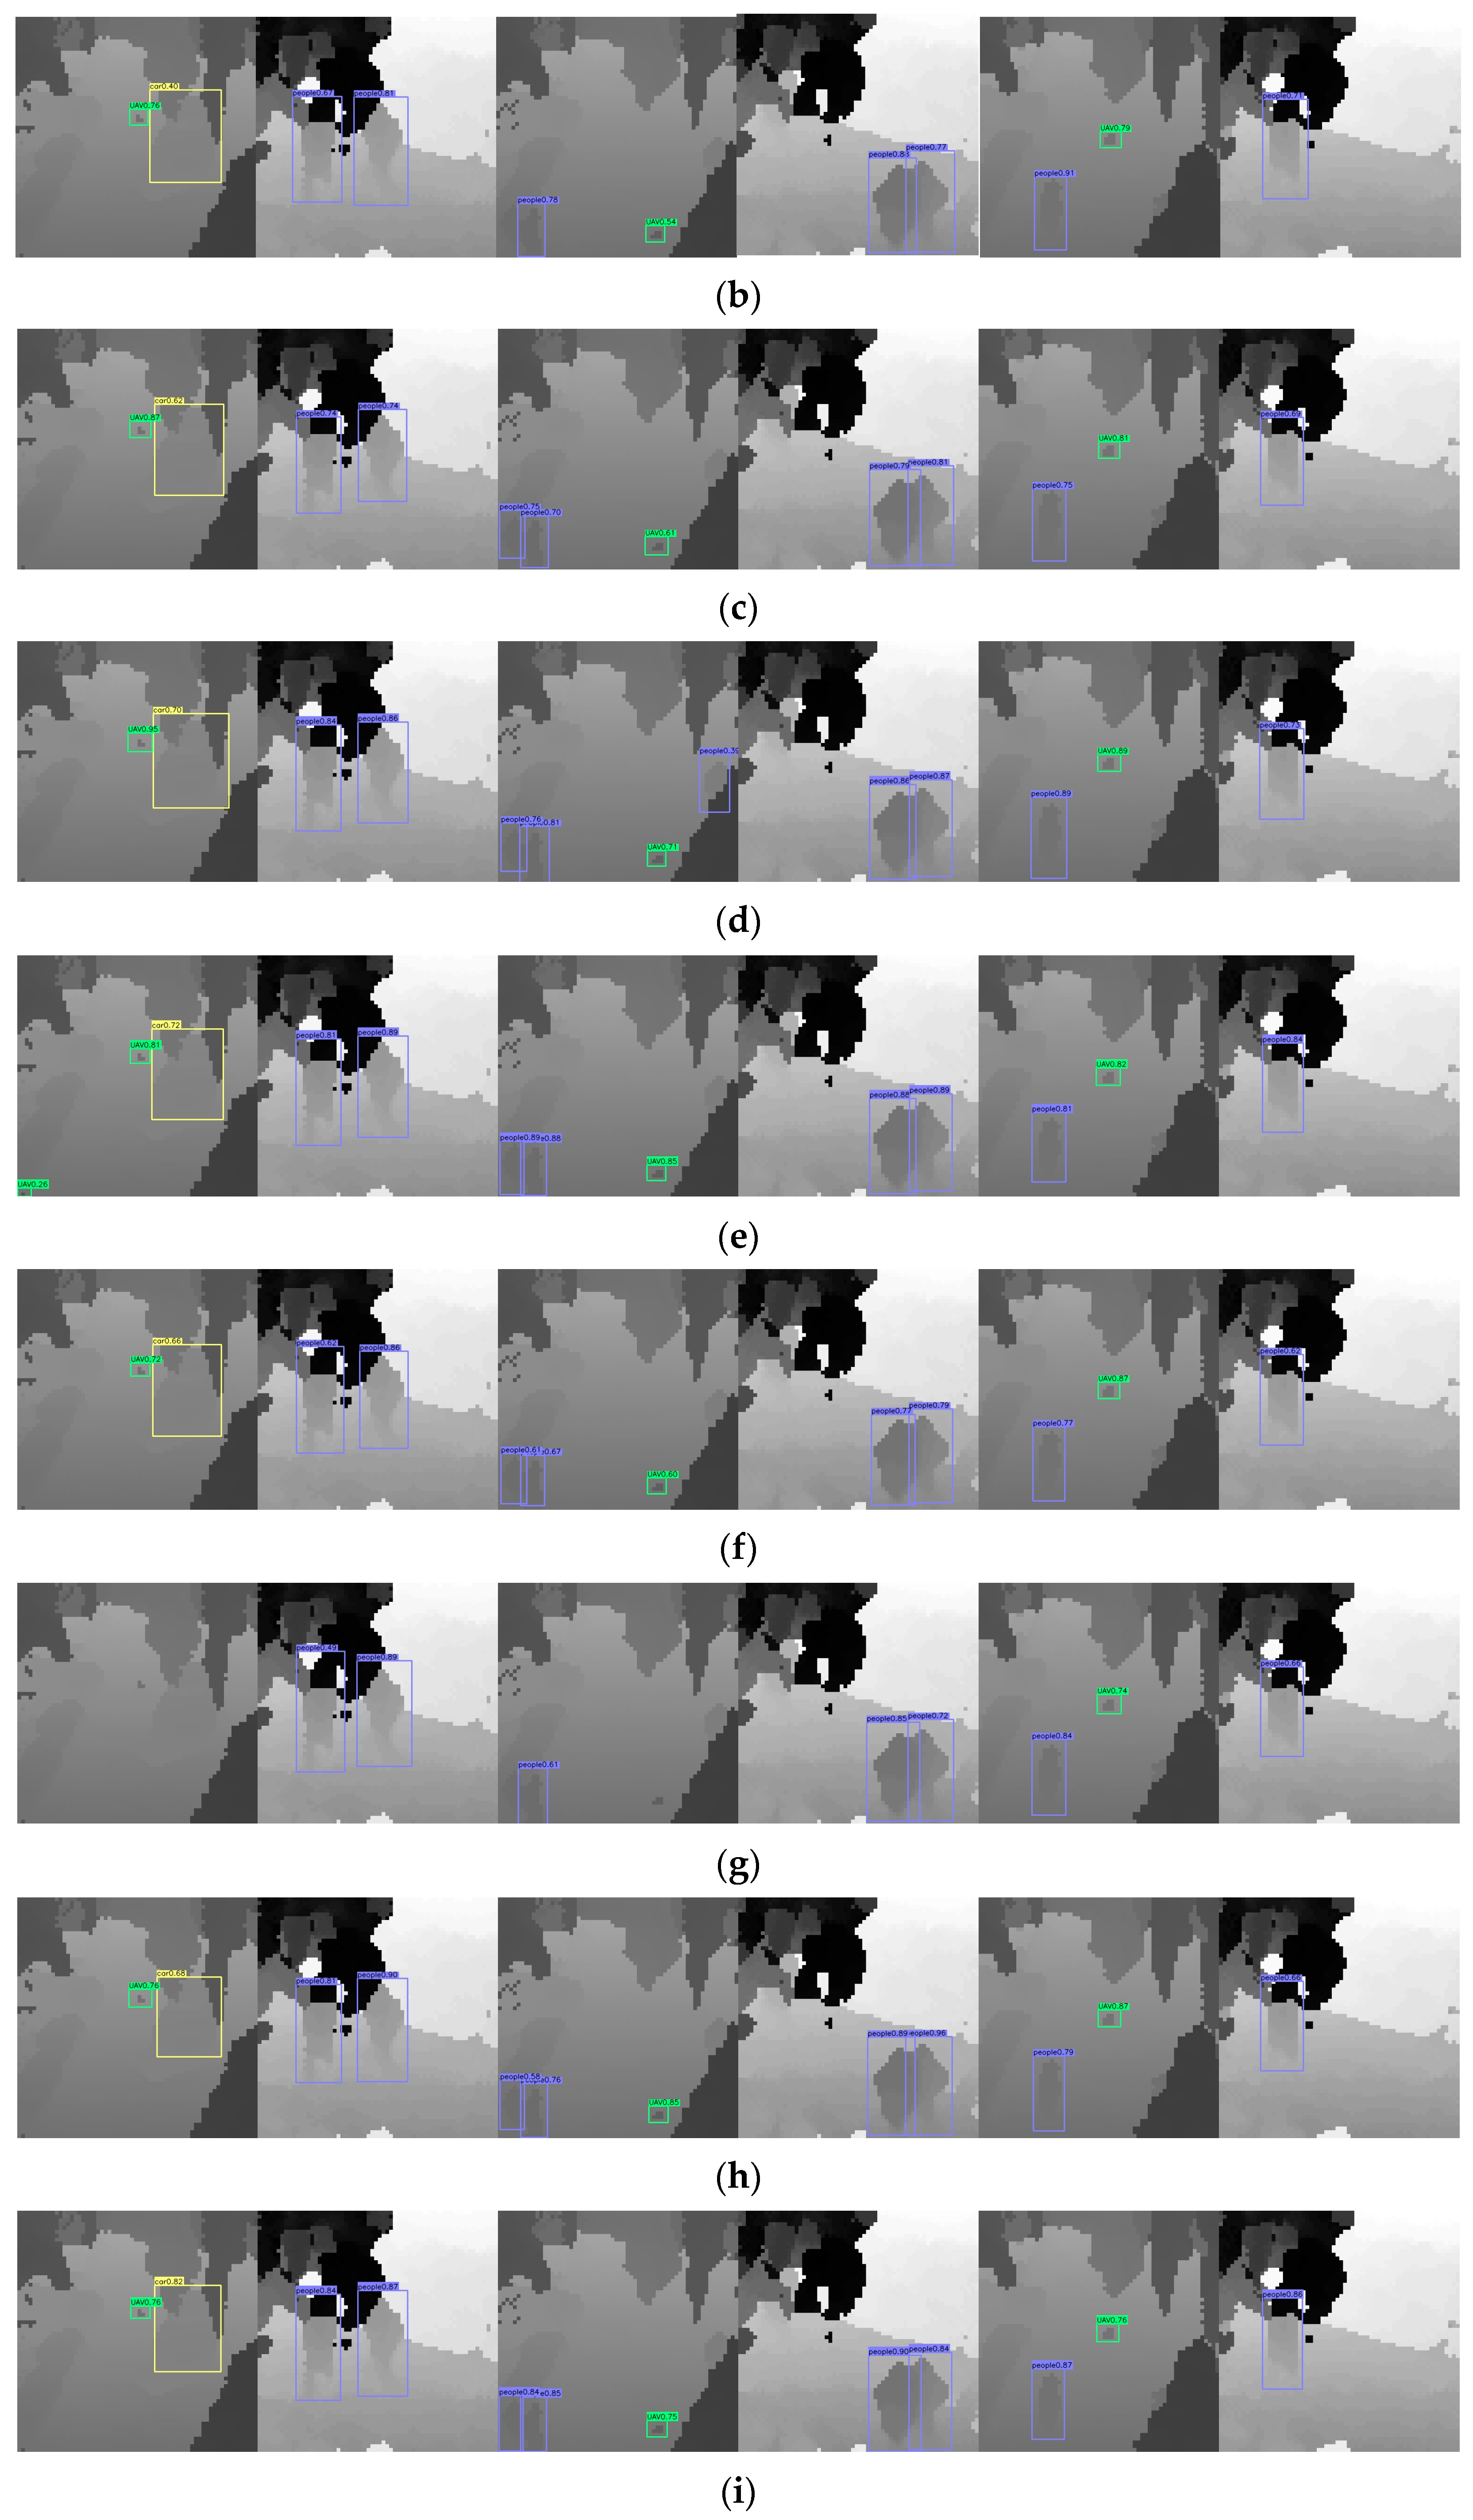
4.3. The Detection Results for Different Methods

To validate the effectiveness of the MSTOD-Net, we compared it with the current advanced object detection algorithms based on anchor and anchor-free approaches. The anchor-based networks include Faster RCNN [13], SSD [25], RetinaNet [26], YOLOv3 [15], and YOLOv5 [17]. The anchor-free networks include CenterNet [23], FOCS [28], YOLOX [30], and YOLOv8 [31]. We used AP50, AP75, AP, mAP50, mAR50, Params, and FLOPs to jointly evaluate all of the experiments. For a fair comparison, we used the same training, validation, and test sets, and all methods were trained for 100 epochs. The detection results for the different methods are shown in Table 3, where we evaluated the detection results for three types of objects: people, UAVs, and cars. Anchor-based networks require setting anchors of different scales, generating many anchors during training, and necessitating non-maximum suppression (NMS) for post-processing. Compared to anchor-free networks, these networks incur additional computational costs but achieve relatively higher detection precision.
As shown in Table 3, among the anchor-based detection networks, YOLOv5 demonstrates the best performance, with an mAP50 of 94.2% and an mAR50 of 96.1%. For UAV detection, YOLOv3 achieves an AP50 of 94.5% and an AP75 of 49.9%, which is higher than those of the other networks. For people detection, YOLOv5 achieves an AP50 of 96.2%. It is evident that the anchor-based YOLO series networks, which employ multi-scale detection and various data augmentation methods, exhibit a better detection performance compared to that of the other networks.
Among the anchor-free detection networks, YOLOv8 achieves the highest AP of 63.3% for people detection, surpassing our network by 0.3%. For car detection, YOLOX achieves the highest AP75 of 92.9%. However, while these methods achieve the best results in some metrics, our proposed method attains optimal results in all other metrics. We propose a dual-channel feature extraction network and design a lightweight backbone network, integrating features from different levels to enhance the object’s gradient information, expand the object’s receptive field, and improve the multi-scale information. Our method achieves an mAP50 of 96.4% and an mAR50 of 96.9%. For people detection, the AP75 is 79.4%; for UAV detection, the AP is 49.8%; and for car detection, the AP is 72.1%, with an AP50 of 99.5%. Our proposed method achieves superior detection metrics across various categories of object detection. With the network Params at 12.43 M and FLOPs at 37.08 G, it has fewer parameters and a lower complexity compared to these values for the other methods, which effectively enhances the detection speed.
Figure 6 and Figure 7 depict the visual detection results for the Gm-APD LiDAR sequences in scenario 1 and scenario 2, respectively. As shown in Figure 6, scenario 1 mainly consists of three types of objects of different scales. In the first column, RetinaNet, CenterNet, and YOLOX consistently detect cars, while YOLOv5 does not. Our proposed method can accurately detect these objects with high precision. In the second column, most of the methods fail to detect partially occluded people. However, YOLOv3, YOLOv5, YOLOv8, and our proposed method successfully detect all of the objects in the image, with our method exhibiting a higher detection precision than that of the other three methods. In the third column, all of the methods successfully detect all of the objects in the image, with YOLOv3 and YOLOX achieving the highest detection precision. Although our method slightly lags behind these two methods, it also accurately detects all objects. In the fourth column, Faster-RCNN, YOLOv5, YOLOv8, and our method can detect all objects, including occluded people. Compared to the other three methods, our method more accurately detects occluded people. In the fifth column, SSD and FOCS fail to detect small UAVs, and FOCS shows repeated detections when identifying car data. Although other methods can also detect all objects, our method demonstrates a higher precision and better alignment of the detected objects with their actual positions. Our approach simultaneously considers multi-scale spatial and temporal information while emphasizing the edges of blurred objects to enhance the clarity of their effective features. Consequently, compared to the baseline methods, our approach demonstrates significant advantages.
As shown in Figure 7, scenario 2 primarily involves objects that occlude people during movement. In the first column, only the proposed model detects the occluded people, while the other methods only identify the unoccluded people in the image. In the second column, all of the methods are able to detect partially occluded people. However, the detection scores for occluded objects are all 0.82 or lower, whereas our method achieves a detection score of 0.87. In the third column, the detection of incomplete people in the image is shown, where RetinaNet, CenterNet, and our method are successful. Among these, our method achieves the highest detection score. In the fourth and fifth columns, all of the methods detect the object. In the fourth column, due to the large size of the object and the minimal occlusion, all of the methods succeed in detection. However, our method achieves the highest detection score and more accurate positioning than that of the others. In the fifth column, where a person is occluded by trees, the detection scores of the other methods are low, with the highest being 0.82. In contrast, our method achieves a detection score of 0.88. Therefore, the visual detection results from Scenarios 1 and 2 demonstrate that the proposed method offers significant detection advantages and a superior performance in identifying small and occluded objects compared to other advanced object detection methods.
Figure 8 illustrates a visualization of heat maps corresponding to the detection outcomes produced by the proposed model across the two scenarios. The heat maps generated by our method are entirely concentrated on the object regions, effectively distinguishing them from the background. This demonstrates the model’s strong ability to capture and understand the intrinsic differences between objects and their surroundings, significantly enhancing the interpretability of the proposed approach.

4.4. Ablation Experiments

The effectiveness of the individual modules in the MSTOD-Net is evaluated through ablation experiments. The contributions of the current frame and previous frame sequence (CFAPF), the FF module, the EDGP module, and the MSCA module are analyzed independently. Finally, the robustness of the proposed model under varying levels of occlusion is examined. The baseline represents a single-channel, single-frame object detection network using only the modified ResNet backbone.

4.4.1. Analysis of the Different Modules

  • Analysis of the CFAPF Module
By introducing the CFAPF, the network’s input now includes the current frame image, the heat map of the previous frame, and the detection result of the previous frame. A time offset prediction head is added to the network output to predict the X/Y direction offset of the object’s position in the current frame relative to its position in the previous frame. A greedy match between the predicted offset and the distance between the center point detected in the previous frame establishes the temporal correlation. This allows the network to recover potentially unobserved objects in the current frame based on clues from the previous frame. As shown in Table 4, introducing the CFAPF increases the model’s complexity. Params grows by 0.14 M, and the FLOPs increase by 2.42 G. However, compared to the network without time sequence information, the mAP50 improves by 2.4%, and the mAR50 improves by 3.6%. Therefore, incorporating the CFAPF significantly enhances the detection performance.
2.
Analysis of the FF module
The FF module is employed to fuse the range and intensity images of the Gm-APD LiDAR system at various levels of the network. By considering both the global and local information, this module integrates distinct data from the two sources to extract valuable complementary features. As shown in the detection results in Table 4, introducing the FF module significantly improves most of the metrics compared to the baseline without it. However, compared to a single-channel network, the dual-channel feature extraction network leads to an increase in Params and FLOPs. Despite this increase, the real-time detection performance of the model remains unaffected, and the detection precision is significantly improved over that of the baseline.
3.
Analysis of the EDGP module
Given the lack of texture information in the image data from the Gm-APD LiDAR system, edge feature information becomes critical for detection. To address this, the EDGP module employs edge gradient operators to enhance these features, improving the object detection precision. As shown in Table 4, introducing the EDGP module leads to only a negligible increase in Params by 0.01 M and FLOPs by 0.05 G, while significantly boosting the detection performance, with a 1.4% increase in mAP and a 0.8% increase in mAR50.
4.
Analysis of the MSCA module
The MSCA module expands the receptive field of the features and perceives more scale information through different expansion ratios. Objects are detected during motion, and their scale changes according to the object’s distance. Adding this module expands the receptive field of the object and improves the detection precision at different scales. As shown in Table 4, compared to not including the MSCA module, the parameters and FLOPs only increased by 1.11 M and 0.28 G, respectively, with a 0.5% increase in the mAP50 and a 0.4% increase in the mAR50. Therefore, this module slightly increases the model’s complexity while significantly improving its object detection performance.

4.4.2. Analysis of Different Backbone Networks

To verify the effectiveness of the improved ResNet backbone in our proposed network, we compared it with various ResNet series backbone networks. The results demonstrate that our improved lightweight backbone network offers significant advantages over the others. As shown in Table 5, we compared ResNet18 and ResNet34 in terms of the model parameters, GPU memory usage, and detection precision. Generally, as the network depth increases, the feature representation and extraction capabilities improve, leading to higher detection precision. However, a greater network depth also increases the number of model parameters, raising the risk of overfitting. Additionally, continuous chain derivation during backpropagation can cause gradients to vanish or explode, complicating the training process.
As shown in Table 5, our proposed network achieves the lowest Params at 12.43 M and FLOPs at 37.08 G among all of the backbone networks compared. Additionally, it demonstrates the shortest detection time per frame at 0.03091 s, enabling real-time detection capabilities. In terms of precision, the mAP50 reaches 96.4%, which is 1.6% higher than that of ResNet18 and 1.5% higher than that of ResNet34, while an mAP of 61.7% is achieved, surpassing that of ResNet18 by 0.7% and that of ResNet34 by 1.6%. Similarly, the mAR50 reaches 96.9%, outperforming that of ResNet18 and ResNet34 by 1.6% and 1.5%, respectively. Notably, as the network depth increases, a discernible decline in the mAP index is observed. These results highlight the superior detection capabilities of our improved backbone network, particularly under conditions of low Params and FLOPs, validating its effectiveness for real-time and high-precision object detection tasks.

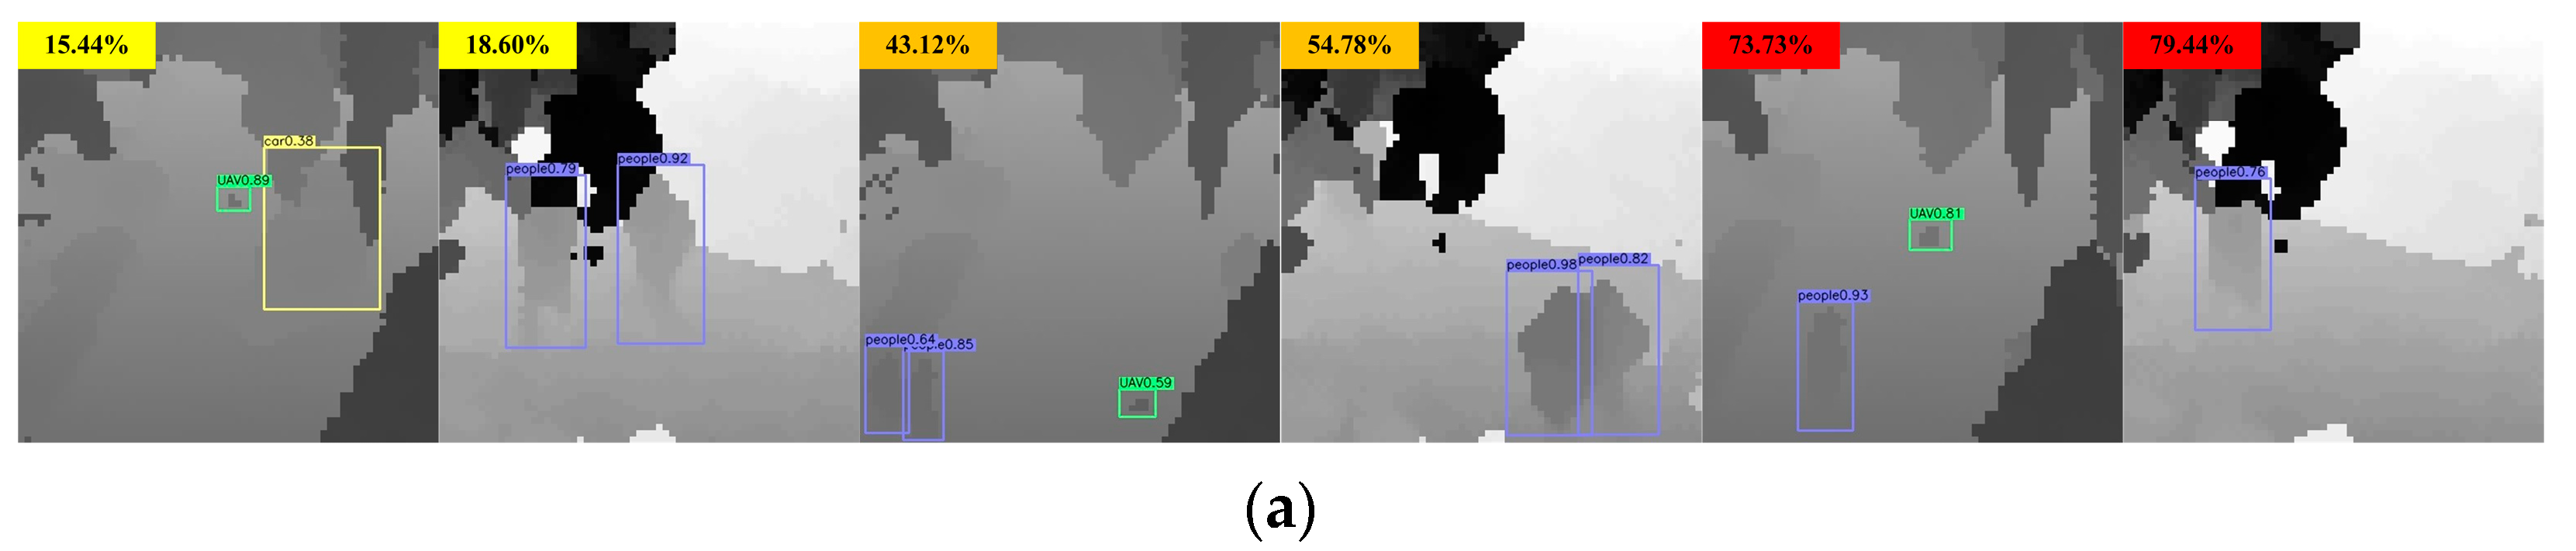
4.4.3. Analysis of Data with Different Occlusion Ratios

To evaluate the performance of our proposed method in detecting objects under varying levels of occlusion further, we calculated the occlusion ratios for the occluded objects in the test set and categorized them into light, medium, and heavy occlusion levels. As shown in Table 6, we compared the performance of our method with that of other state-of-the-art detection methods.
From Table 6, it can be seen that our method outperforms the state-of-the-art object detection methods, both anchor-based and anchor-free, across all three occlusion levels. Under light occlusion, our method achieves an mAP50 of 92.9% and an mAR50 of 93.8%, which are 0.1% higher than those of the second-ranked YOLOv5. Under medium occlusion, it achieves an mAP50 of 87.8% and an mAR50 of 88.6%, surpassing YOLOv8 by 2.6%. In cases of heavy occlusion, our method reaches an mAP50 of 67.3% and an mAR50 of 67.6%, which is 4.1% higher than YOLOv8 in both metrics. These results demonstrate the significant advantages of our method for detecting occluded objects, as it effectively handles varying degrees of occlusion.
The detection results for partial data with various occlusion ratios are shown in Figure 9. The first and second columns show the detection results for low occlusion, the third and fourth columns for medium-occlusion data, and the fifth and sixth columns for heavy occlusion. In the first column, the detection score of our method for occluded cars is 0.85, the highest among those of all methods. In the second column, our method achieves a detection score of 0.85 for occluded people, again outperforming the other methods. In the third column, both our method and YOLOv3 successfully detect occluded people, with our method achieving a detection score of 0.45, compared to YOLOv3’s 0.39. For the fourth column, with an occlusion rate of 54.78%, only our method detects the occluded people, with a detection score of 0.55. In the fifth and sixth columns, where people are heavily occluded at occlusion rates of 73.73% and 79.44%, respectively, only our method successfully detects the occluded people.

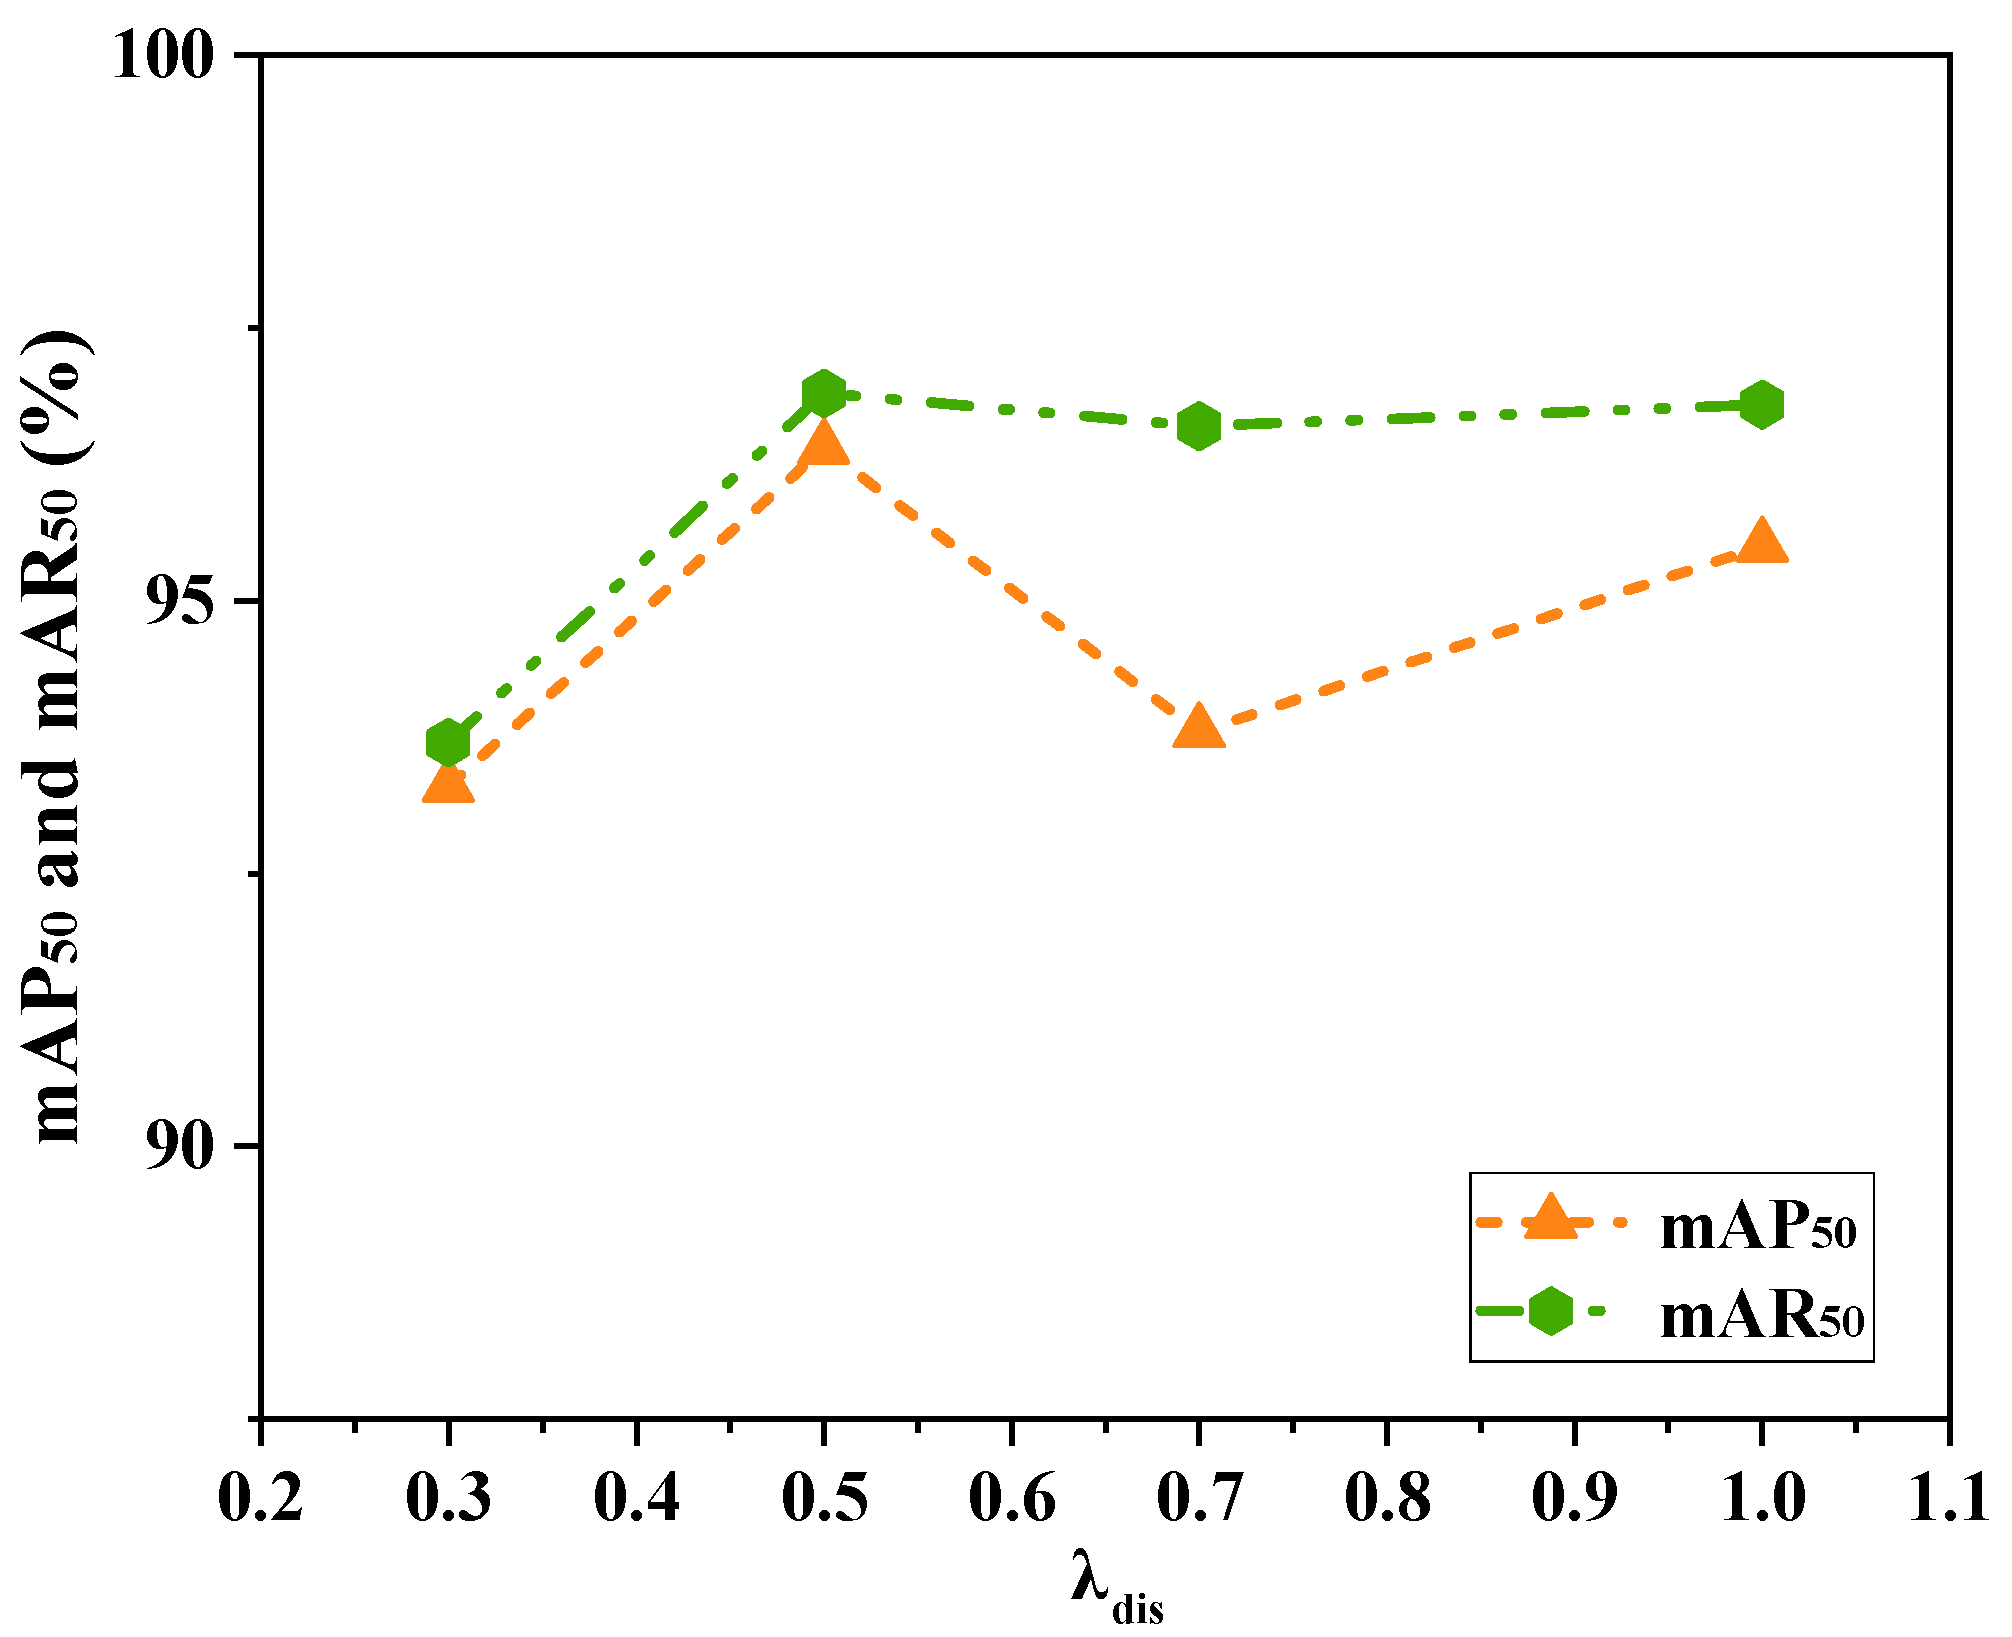
4.4.4. Analysis of Different λ Values in Loss Functions

Our loss function consists of four components: the object center point loss L h m , the object size loss L s i z e , the center point offset loss L o f f , and the object displacement loss L d i s , with the corresponding weights λ h m , λ s i z e , λ o f f , and λ d i s , respectively. In our experiments, we set the values of λ h m , λ s i z e , and λ o f f to 1 and primarily focus on analyzing the impact of different values of the weight λ d i s associated with the object displacement loss L d i s , which incorporates the temporal information from consecutive frames, on the detection performance of the proposed algorithm.
As shown in Figure 10, we evaluate the detection performance by setting λ d i s to four different values—0.3, 0.5, 0.7, and 1—and analyze the variations in the mean average precision mAP50 and the mean average recall mAR50. Specifically, with λ d i s = 0.3 , the mAP50 is 93.3%, and the mAR50 is 93.7%; with λ d i s = 0.5 , the mAP50 reaches 96.4%, and the mAR50 is 96.9%; with λ d i s = 0.7 , the mAP50 is 93.8%, and the mAR50 is 96.6%; and with λ d i s = 1 , the mAP50 is 95.5%, and the mAR50 is 96.8%. The best detection performance is achieved at λ d i s = 0.5 , primarily because the object displacement loss is designed to optimize the differences in the displacement between consecutive frames, thereby enhancing the temporal consistency. When the weight is too small (e.g., λ d i s = 0.3 ), the temporal constraint is insufficient, making it difficult for the model to effectively utilize inter-frame information, thereby impairing the consistency of modeling motion. Conversely, when the weight is too large (e.g., λ d i s = 0.7 or λ d i s = 1 ), the model may overemphasize temporal information at the expense of learning the spatial features in the current frame, reducing the detection accuracy. This effect is particularly evident in occlusion scenarios, where excessive reliance on the temporal information may lead to error accumulation, affecting the model’s robustness. Therefore, setting λ d i s = 0.5 achieves a well-balanced trade-off between the temporal information and spatial feature learning, ultimately yielding the optimal detection performance.

4.4.5. Analysis of Bidirectional Scene Generalization

To further evaluate the generalization capability of the proposed method across different scenarios and its applicability to larger and more diverse environments, cross-validation was conducted using the two datasets employed in this study. The overall dataset consists of a total of 3032 frames, with 1466 frames from scenario 1 and 1566 frames from scenario 2. Since scenario 1 contains only a single object category, people, the cross-validation analysis focuses exclusively on this class. Specifically, while all the frames in scenario 1 contain people, only 1184 frames in scenario 2 include this category. During training, all frames containing people were utilized, while the test set comprised 400 randomly selected frames from the other scenario. Accordingly, the cross-validation dataset partitioning was structured as follows: training on 1466 frames from scenario 1 and testing on 400 frames from scenario 2, and vice versa—training on 1184 frames from scenario 2 and testing on 400 frames from scenario 1. Through cross-validation across both scenarios, the proposed method was compared with other object detection algorithms, with the comparative results presented in Table 7 and Table 8.
As shown in Table 7 and Table 8, despite conducting cross-validation across the two scenarios, the proposed method achieves a higher detection accuracy compared to that of the other object detection approaches. This result demonstrates the robustness and generalization capability of the proposed method across different environments. The superior performance can be attributed to the adoption of a multi-scale spatiotemporal fusion strategy, which integrates two different types of data collected from the same device at multiple levels while incorporating temporal information. This enables the model to effectively learn the diverse and dynamic characteristics of objects, thereby improving the detection accuracy across different scenarios and enhancing the adaptability to scene variations. Furthermore, the proposed method exhibits a stable detection performance in both cross-validation settings, further validating its applicability to larger-scale and more complex environments.

5. Conclusions

In this paper, we address the challenges of occluded and small object detection in Gm-APD LiDAR images and propose a spatio-temporal object detection network, MSTOD-Net, which significantly improves the detection accuracy. By leveraging sequence information from previous frames, our network effectively restores occluded objects in the current frame. To enhance the objects’ edge features, we incorporate the EDGP module, while the FF module fully exploits the complementary features of range and intensity images. Additionally, the MSCA module integrates multi-level features, preserving low-level details critical for detecting weak and small objects. Our proposed network delivers a superior performance, particularly in scenarios where objects are occluded during motion or when weak, small objects closely resemble the background. Extensive comparative experiments and ablation studies validate its effectiveness, showing that it outperforms the state-of-the-art detection methods and provides a robust solution for challenging detection tasks.
Although the proposed method performs well in many cases, its effectiveness is limited under severe occlusion conditions. For objects with slow motion and minor positional variations between consecutive frames, the method can accurately detect occluded objects. In contrast, for objects exhibiting rapid motion and significant positional differences between frames, the detection performance declines, as the method struggles to infer the object’s position in the subsequent frame based on the detection result from the previous frame.
Future research should explore the integration of multimodal data, such as visible light, infrared, and millimeter-wave radar, to leverage the complementary advantages of different sensors to enhance the detection accuracy for occluded and small objects. Additionally, generative models can be incorporated for image reconstruction under occlusion, further improving the robustness of models in detecting occluded objects. To further enhance occluded object detection, LiDAR point cloud data can be utilized, as they capture the shape, size, and relative position of objects in three-dimensional space. Even in occluded scenarios, three-dimensional data can provide sufficient geometric information to aid in reconstructing the occluded parts of a scene.

Author Contributions

Conceptualization: Y.D. and D.D. Methodology: Y.D. Software: Y.D. Investigation: D.D. and J.L. Data curation: L.M., X.Y. and R.H. Writing—original draft preparation: Y.D. Writing—review and editing: Y.D. Supervision: Y.Q. Project administration: J.S. All authors have read and agreed to the published version of the manuscript.

Funding

This research received no external funding.

Data Availability Statement

The original contributions presented in the study are included in the article; further inquiries can be directed to the corresponding author.

Conflicts of Interest

Author Jie Lu was employed by the company The 44th Research Institute of China Electronics Technology Group Corporation. The remaining authors declare that the research was conducted in the absence of any commercial or financial relationships that could be construed as a potential conflict of interest.

References

  1. Chen, S.; Chen, P.; Ding, L.; Pan, D. A New Semi-Analytical MC Model for Oceanic LIDAR Inelastic Signals. Remote Sens. 2023, 15, 684. [Google Scholar] [CrossRef]
  2. Jiang, J. Moving object detection algorithm and motion capture based on 3D LiDAR. Opt. Quantum Electron. 2024, 56, 585. [Google Scholar] [CrossRef]
  3. Cho, Y.; Kim, G.; Lee, S.; Ryu, J.-H. OpenStreetMap-Based LiDAR Global Localization in Urban Environment Without a Prior LiDAR Map. IEEE Robot. Autom. Lett. 2022, 7, 4999–5006. [Google Scholar] [CrossRef]
  4. Zha, B.; Xu, G.; Chen, Z.; Tan, Y.; Qin, J.; Zhang, H. Design of Scanning Units for the Underwater Circumferential-Scanning LiDAR Based on Pyramidal-Shaped Reflectors and a Rapid Detection Method for Object Orientation. Remote Sens. 2024, 16, 2131. [Google Scholar] [CrossRef]
  5. Xu, W.; Cai, Y.; He, D.; Lin, J.; Zhang, F. FAST-LIO2: Fast Direct LiDAR-Inertial Odometry. IEEE Trans. Robot. 2022, 38, 2053–2073. [Google Scholar] [CrossRef]
  6. Zhang, X.; Li, S.; Sun, J.; Ma, L.; Zhou, X.; Yang, X.; He, R. Dynamic object feature selection in pixel change space for array GM-APD lidar. Infrared Phys. Technol. 2024, 140, 105396. [Google Scholar] [CrossRef]
  7. Liu, D.; Sun, J.; Lu, W.; Li, S.; Zhou, X. 3D reconstruction of the dynamic scene with high-speed objects for GM-APD LiDAR. Opt. Laser Technol. 2023, 161, 109114. [Google Scholar] [CrossRef]
  8. Tao, B.; Yan, F.; Yin, Z.; Nie, L.; Miao, M.; Jiao, Y.; Lei, C. A Multimodal 3D Detector with Attention from the Corresponding Modal. IEEE Sens. J. 2023, 23, 8581–8590. [Google Scholar] [CrossRef]
  9. Xu, C.; Wang, J.; Yang, W.; Yu, H.; Yu, L.; Xia, G.S. RFLA: Gaussian Receptive Field Based Label Assignment for Tiny Object Detection. Eur. Conf. Comput. Vis. 2022, 13669, 526–543. [Google Scholar]
  10. Ma, R.; Yin, Y.; Chen, J.; Chang, R. Multi-modal information fusion for LiDAR-based 3D object detection framework. Multimed Tools Appl. 2024, 83, 7995–8012. [Google Scholar] [CrossRef]
  11. Hong, M.; Li, S.; Yang, Y.; Zhu, F.; Zhao, Q.; Lu, L. SSPNet: Scale Selection Pyramid Network for Tiny Person Detection from UAV Images. IEEE Geosci. Remote Sens. Lett. 2022, 19, 1–5. [Google Scholar] [CrossRef]
  12. Girshick, R. Fast r-cnn. In Proceedings of the IEEE International Conference on Computer Vision, Santiago, Chile, 7–13 December 2015; pp. 1440–1448. [Google Scholar]
  13. Ren, S.; He, K.; Girshick, R.; Sun, J. Faster r-cnn: Towards real-time object detection with region proposal networks. IEEE Trans. Pattern Anal. Mach. Intell. 2016, 39, 1137–1149. [Google Scholar] [CrossRef] [PubMed]
  14. Redmon, J.; Divvala, S.; Girshick, R.; Farhadi, A. You Only Look Once: Unified, Real-Time Object Detection. In Proceedings of the IEEE Conference on Computer Vision and Pattern Recognition, Las Vegas, NV, USA, 27–30 June 2016. [Google Scholar]
  15. Redmon, J.; Farhadi, A. Yolov3: An incremental improvement. Comput. Vis. Pattern Recognit. 2018, 1804, 1–6. [Google Scholar]
  16. Bochkovskiy, A.; Wang, C.Y.; Liao, H.Y.M. YOLOv4: Optimal speed and accuracy of object detection. arXiv 2020, arXiv:2004.10934. [Google Scholar]
  17. YOLOv5. Available online: https://github.com/ultralytics/yolov5 (accessed on 12 April 2021).
  18. Leng, J.; Liu, Y.; Gao, X.; Wang, Z. CRNet: Context-guided Reasoning Network for Detecting Hard Objects. IEEE Trans. Multimed. 2024, 26, 3765–3777. [Google Scholar] [CrossRef]
  19. Liu, W.; Zhou, B.; Wang, Z.; Yu, G.; Yang, S. FPPNet: A Fixed-Perspective-Perception Module for Small Object Detection Based on Background Difference. IEEE Sens. J. 2023, 23, 11057–11069. [Google Scholar] [CrossRef]
  20. Wang, F.; Yang, X.; Wei, J. YOLO-ESL: An Enhanced Pedestrian Recognition Network Based on YOLO. Appl. Sci. 2024, 14, 9588. [Google Scholar] [CrossRef]
  21. Han, Y.; Wang, F.; Wang, W.; Li, X.; Zhang, J. YOLO-SG: Small traffic signs detection method in complex scene. J. Supercomput. 2024, 80, 2025–2046. [Google Scholar] [CrossRef]
  22. Zhou, L.; Xu, J. Enhanced Abandoned Object Detection through Adaptive Dual-Background Modeling and SAO-YOLO Integration. Sensors 2024, 24, 6572. [Google Scholar] [CrossRef]
  23. Zhou, X.; Wang, D.; Krähenbühl, P. Objects as points. arXiv 2019, arXiv:1904.07850. [Google Scholar]
  24. Ming, Q.; Miao, L.; Zhou, Z.; Dong, Y. CFC-Net: A Critical Feature Capturing Network for Arbitrary-Oriented Object Detection in Remote-Sensing Images. IEEE Trans. Geosci. Remote Sens. 2022, 60, 1–14. [Google Scholar] [CrossRef]
  25. Liu, W.; Anguelov, D.; Erhan, D.; Szegedy, C.; Reed, S.; Fu, C.Y.; Berg, A.C. SSD: Single shot multibox detector. In European Conference Computer Vision; Springer: Cham, Switzerland, 2016; pp. 21–37. [Google Scholar]
  26. Lin, T.-Y.; Goyal, P.; Girshick, R.; He, K.; Dollár, P. Focal loss for dense object detection. In Proceedings of the IEEE International Conference on Computer Vision, Venice, Italy, 22–29 October 2017; pp. 2980–2988. [Google Scholar]
  27. Law, H.; Deng, J. CornerNet: Detecting Objects as Paired Keypoints. Int. J. Comput. Vis. 2019, 128, 642–656. [Google Scholar] [CrossRef]
  28. Tian, Z.; Shen, C.; Chen, H.; He, T. Fcos: Fully convolutional one-stage object detection. In Proceedings of the IEEE/CVF International Conference on Computer Vision, Seoul, Republic of Korea, 27 October–2 November 2019; pp. 9627–9636. [Google Scholar]
  29. Zhou, X.; Zhuo, J.; Krahenbuhl, P. Bottom-up object detection by grouping extreme and center points. In Proceedings of the IEEE/CVF Conference on Computer Vision and Pattern Recognition, Long Beach, CA, USA, 15–20 June 2019; pp. 850–859. [Google Scholar]
  30. Ge, Z.; Liu, S.; Wang, F.; Li, Z.; Sun, J. YOLOX: Exceeding YOLO Series in 2021. arXiv 2021, arXiv:2107.08430. [Google Scholar]
  31. YOLOv8. Available online: https://github.com/ultralytics/ultralytics (accessed on 10 January 2023).
  32. Feng, J.; Liang, Y.; Zhang, X.; Zhang, J.; Jiao, L. SDANet: Semantic-Embedded Density Adaptive Network for Moving Vehicle Detection in Satellite Videos. IEEE Trans. Image Process. 2023, 32, 1788–1801. [Google Scholar] [CrossRef]
  33. Shen, J.; Zhou, W.; Liu, N.; Sun, H.; Li, D.; Zhang, Y. An Anchor-Free Lightweight Deep Convolutional Network for Vehicle Detection in Aerial Images. IEEE Trans. Intell. Transp. Syst. 2022, 23, 24330–24342. [Google Scholar] [CrossRef]
  34. Yi, C.; Zhao, Y.-Q.; Chan, J.C.-W. Spectral super-resolution for multispectral image based on spectral improvement strategy and spatial preservation strategy. IEEE Trans. Geosci. Remote Sens. 2019, 57, 9010–9024. [Google Scholar] [CrossRef]
  35. Yu, L.; Zhi, X.; Hu, J.; Jiang, S.; Zhang, W.; Chen, W. Small-Sized Vehicle Detection in Remote Sensing Image Based on Keypoint Detection. Remote Sens. 2021, 13, 4442. [Google Scholar] [CrossRef]
  36. Wang, M.; Ma, H.; Liu, S.; Yang, Z. A novel small-scale pedestrian detection method base on residual block group of CenterNet. Comput. Stand. Interfaces 2023, 84, 103702. [Google Scholar] [CrossRef]
  37. Min, L.; Fan, Z.; Lv, Q.; Reda, M.; Shen, L.; Wang, B. YOLO-DCTI: Small Object Detection in Remote Sensing Base on Contextual Transformer Enhancement. Remote Sens. 2023, 15, 3970. [Google Scholar] [CrossRef]
  38. Cao, X.; Wang, H.; Wang, X.; Hu, B. DFS-DETR: Detailed-Feature-Sensitive Detector for Small Object Detection in Aerial Images Using Transformer. Electronics 2024, 13, 3404. [Google Scholar] [CrossRef]
  39. Qin, C.; Zhang, L.; Wang, X.; Li, G.; He, Y.; Liu, Y. RDB-DINO: An Improved End-to-End Transformer with Refined De-Noising and Boxes for Small-Scale Ship Detection in SAR Images. IEEE Trans. Geosci. Remote Sens. 2025, 63, 1–17. [Google Scholar] [CrossRef]
  40. Palffy, A.; Kooij, J.F.P.; Gavrila, D.M. Detecting darting out pedestrians with occlusion aware sensor fusion of radar and stereo camera. IEEE Trans. Intell. Veh. 2023, 8, 1459–1472. [Google Scholar] [CrossRef]
  41. Li, Q.; Su, Y.; Gao, Y.; Xie, F.; Li, J. OAF-Net: An Occlusion-Aware Anchor-Free Network for Pedestrian Detection in a Crowd. IEEE Trans. Intell. Transp. Syst. 2022, 23, 21291–21300. [Google Scholar] [CrossRef]
  42. Bao, H.; Shu, P.; Zhang, H.; Liu, X. Siamese-based twin attention network for visual tracking. IEEE Trans. Circuits Syst. Video Technol. 2022, 33, 847–860. [Google Scholar] [CrossRef]
  43. Nie, Y.; Bian, C.; Li, L. Object Tracking in Satellite Videos Based on Siamese Network with Multidimensional Information-Aware and Temporal Motion Compensation. IEEE Geosci. Remote Sens. Lett. 2022, 19, 1–5. [Google Scholar] [CrossRef]
  44. Zhang, T.; Han, Z.; Xu, H.; Zhang, B.; Ye, Q. CircleNet: Reciprocating Feature Adaptation for Robust Pedestrian Detection. IEEE Trans. Intell. Transp. Syst. 2020, 21, 4593–4604. [Google Scholar] [CrossRef]
  45. Cui, K.; Tang, W.; Zhu, R.; Wang, M.; Larsen, G.D.; Pauca, V.P.; Alqahtani, S.; Yang, F.; Segurado, D.; Fine, P.; et al. Real-Time Localization and Bimodal Point Pattern Analysis of Palms Using UAV Imagery would provide valuable insights. In Proceedings of the IEEE/CVF Conference on Computer Vision and Pattern Recognition (CVPR), Seattle, WA, USA, 19–21 June 2024. [Google Scholar]
  46. He, K.; Zhang, X.; Ren, S.; Sun, J. Deep Residual Learning for Image Recognition. In Proceedings of the IEEE Conference on Computer Vision and Pattern Recognition (CVPR), Las Vegas, NV, USA, 27–30 June 2016. [Google Scholar]
  47. Sobel, I.; Feldman, G. A 3x3 isotropic gradient operator for image processing. Pattern Classif. Scene Anal. 1968, 1968, 271–272. [Google Scholar]
  48. Chen, L.-C.; Papandreou, G.; Kokkinos, I.; Murphy, K.; Yuille, A.L. DeepLab: Semantic Image Segmentation with Deep Convolutional Nets, Atrous Convolution, and Fully Connected CRFs. IEEE Trans. Pattern Anal. Mach. Intell. 2018, 40, 834–848. [Google Scholar] [CrossRef]
  49. Lin, T.T. LabelImg. Available online: https://github.com/tzutalin/labelImg (accessed on 1 January 2020).
Figure 1. Overall architecture of MSTOD-Net.
Remotesensing 17 00764 g001
Figure 2. EDGP module.
Remotesensing 17 00764 g002
Figure 3. FF module.
Remotesensing 17 00764 g003
Figure 4. MSCA module.
Remotesensing 17 00764 g004
Figure 5. Data acquisition system.
Remotesensing 17 00764 g005
Figure 6. Detection results for different methods in scenario 1. (a) Faster-RCNN; (b) SSD; (c) RetinaNet; (d) YOLOv3; (e) YOLOv5; (f) CenterNet; (g) Focs; (h) YOLOX; (i) YOLOv8; (j) ours.
Remotesensing 17 00764 g006aRemotesensing 17 00764 g006b
Figure 7. Detection results of different methods in scenario 2. (a) Faster-RCNN; (b) SSD; (c) RetinaNet; (d) YOLOv3; (e) YOLOv5; (f) CenterNet; (g) Focs; (h) YOLOX; (i) YOLOv8; (j) ours.
Remotesensing 17 00764 g007aRemotesensing 17 00764 g007b
Figure 8. Detection results and corresponding heat maps. (a) Scenario 1; (b) scenario 2.
Remotesensing 17 00764 g008
Figure 9. Detection results under different occlusion ratios using different methods. (a) Faster-RCNN; (b) SSD; (c) RetinaNet; (d) YOLOv3; (e) YOLOv5; (f) CenterNet; (g) Focs; (h) YOLOX; (i) YOLOv8; (j) ours.
Remotesensing 17 00764 g009aRemotesensing 17 00764 g009bRemotesensing 17 00764 g009c
Figure 10. Detection results with different λ d i s values.
Remotesensing 17 00764 g010
Table 1. Backbone network parameter structure.
Layer NameOutput SizeOutput ChannelConv Kernel
Conv1(256, 256)647 × 7
Maxpooling(128, 128)643 × 3
EDGP(128, 128)643 × 3
ResBlock1(64, 64)1283 × 3
ResBlock2(32, 32)2563 × 3
ResBlock1(16, 16)5123 × 3
Table 2. Detailed information of collected data.
Scenario 1
Seq collection
time
Num of seq
frames
Seq collection
time
Num of seq
frames
Seq 1: 19:03:22250Seq 6: 19:07:07250
Seq 2: 19:04:18250Seq 7: 19:07:20250
Seq 3: 19:05:22250Seq 8: 19:07:55250
Seq 4: 19:05:56250Seq 9: 19:08:31250
Seq 5: 19:06:29250Seq 10: 19:09:02250
Scenario 2
Seq 1: 15:38:59971Seq 3: 15:41:301575
Seq 2: 15:40:051278
Table 3. Comparison of results of different methods.
MethodBackbonePeopleUAVCar
AP50
(%)
AP75
(%)
AP
(%)
AP50
(%)
AP75
(%)
AP
(%)
AP50
(%)
AP75
(%)
AP
(%)
mAP50
(%)
mAR50
(%)
Param
s(M)
FLOP
s(G)
Anchor-based
Faster-RCNNResNet5095.872.961.193.723.641.389.875.053.893.196.041.7563.58
SSDVGG1694.461.355.182.79.328.993.255.554.290.195.824.0187.83
RetinaNetResNet1893.675.460.086.039.745.887.374.558.989.090.419.8139.53
YOLOv3DarkNet5395.675.262.590.749.949.390.190.167.692.192.861.5449.58
YOLOv5CSPDarknet5396.273.461.794.537.747.392.069.0 56.894.296.121.2049.00
Anchor-free
CenterNetResNet1892.574.961.793.639.348.575.889.057.591.792.819.2739.81
FocsResNet1893.673.461.190.944.648.895.388.469.593.395.519.1038.86
YOLOXCSPDarknet5393.678.162.491.045.748.898.592.970.794.495.425.3073.80
YOLOv8CSPDarknet5393.778.663.391.938.346.498.492.771.894.795.625.9078.90
OursModified
ResNet
95.779.463.093.946.049.899.592.472.196.496.912.4337.08
Table 4. Comparison of detection performance of different modules.
MethodCFAPFFFEDGPMSCAParamMethodCFAPFFFEDGPMSCA
Baseline 7.5720.6756.466.490.091.2
1 7.7123.0958.869.692.494.8
2 11.3136.7560.270.394.795.7
3 11.3236.8061.670.895.996.5
412.4337.0861.772.696.496.9
Table 5. Comparison of different backbone networks.
BackboneParam
s(M)
FLOP
s(G)
mAP
(%)
mAP75
(%)
mAP50
(%)
mAR50
(%)
Time
(s)
ResNet1830.5954.9461.072.794.895.30.03097
ResNet3440.6974.3160.170.094.995.40.03305
Ours12.4337.0861.772.696.496.90.03091
Table 6. Comparison of detection results under different occlusion ratios from different methods.
MethodLight Occlusion (<30%)Medium Occlusion (30%~70%)Heavy Occlusion (>70%)
mAP50 (%)mAR50 (%)mAP50 (%)mAR50 (%)mAR50 (%)mAP50 (%)
Anchor-based
Faster-RCNN89.790.782.883.061.461.8
SSD91.393.682.282.561.662.8
RetinaNet90.791.881.481.560.260.5
YOLOv392.093.684.885.362.062.1
YOLOv592.893.885.385.862.362.4
Anchor-free
CenterNet85.486.681.782.157.158.2
Focs88.689.785.085.358.458.8
YOLOX91.792.985.185.963.063.0
YOLOv892.593.685.686.063.263.5
Ours92.993.887.888.667.367.6
Table 7. Comparison of results of different methods (trained on scenario 1, validated on scenario 2).
MethodBackbonePeople
AP50
(%)
AR50
(%)
Anchor-based
Faster-RCNNResNet5075.679.7
SSDVGG1669.874.7
RetinaNetResNet1859.460.7
YOLOv3DarkNet5374.675.9
YOLOv5CSPDarknet5377.081.2
Anchor-free
CenterNetResNet1865.766.2
FocsResNet1872.775.1
YOLOXCSPDarknet5375.877.1
YOLOv8CSPDarknet5378.182.7
OursModified
ResNet
80.582.0
Table 8. Comparison of results of different methods (trained on scenario 2, validated on scenario 1).
MethodBackbonePeople
AP50
(%)
AR50
(%)
Anchor-based
Faster-RCNNResNet5077.581.7
SSDVGG1672.678.5
RetinaNetResNet1865.766.2
YOLOv3DarkNet5377.578.6
YOLOv5CSPDarknet5379.979.9
Anchor-free
CenterNetResNet1867.468.2
FocsResNet1873.476.5
YOLOXCSPDarknet5377.180.1
YOLOv8CSPDarknet5379.179.9
OursModified
ResNet
82.784.0
Disclaimer/Publisher’s Note: The statements, opinions and data contained in all publications are solely those of the individual author(s) and contributor(s) and not of MDPI and/or the editor(s). MDPI and/or the editor(s) disclaim responsibility for any injury to people or property resulting from any ideas, methods, instructions or products referred to in the content.

