Abstract
Aerosols significantly impact the brightness temperature (BT) in thermal infrared (IR) channels, and ignoring their effects can lead to relatively large observation-minus-background (OMB) bias in radiance calculations. The accuracy of aerosol datasets is essential for BT simulations and bias reduction. This study incorporated aerosol reanalysis datasets from the Modern-Era Retrospective Analysis for Research and Applications, Version 2 (MERRA-2) and Copernicus Atmosphere Monitoring Service (CAMS) into the Advanced Radiative Transfer Modeling System (ARMS) to compare their impacts on BT simulations from the Geostationary Interferometric Infrared Sounder (GIIRS) and their effectiveness in reducing OMB biases. The results showed that, for a sandstorm event on 10 April 2023, incorporating total aerosol data from the MERRA-2 improved the BT simulations by 0.56 K on average, surpassing CAMS’s 0.11 K improvement. Dust aerosols notably impacted the BT, with the MERRA-2 showing a 0.17 K improvement versus CAMS’s 0.06 K due to variations in the peak aerosol level, thickness, and column mass density. Improvements for sea salt and carbonaceous aerosols were concentrated in the South China Sea and Bay of Bengal, where the MERRA-2 outperformed CAMS. For sulfate aerosols, the MERRA-2 excelled in the Bohai Sea and southern Bay of Bengal, while CAMS was better in the northern Bay of Bengal. These findings provide guidance for aerosol assimilation and retrieval, emphasizing the importance of quality control and bias correction in data assimilation systems.
1. Introduction
Over the past half-century, numerical weather prediction (NWP) has made significant advancements, greatly enhancing forecasting accuracy [1,2]. Recently, incorporating atmospheric components, including aerosols, into NWP has become a key direction in the development of Earth system numerical prediction [3,4]. Atmospheric aerosols, composed of absorbing and scattering components, originate primarily from natural and anthropogenic emissions and are further generated through secondary chemical reactions. They significantly impact the energy exchange within the Earth-atmosphere system by absorbing and scattering solar radiation, exerting profound effects on the climate system [5,6,7,8,9]. As a crucial yet often overlooked driver in NWP, the radiative effects of aerosols can introduce temperature biases and critically influence the accuracy of other meteorological parameter forecasts [10]. Therefore, precise aerosol datasets and a comprehensive evaluation of aerosol radiative effects are of both scientific and practical importance for effectively incorporating aerosols into NWP [11,12].
Meteorological satellite data serve as a crucial source of observations for NWP and are among the key factors driving advancements in NWP. The assimilation of satellite observations significantly enhances NWP accuracy [13,14]. Fast radiative transfer models (RTMs) serve as observation operators in data assimilation, retrieval, and other satellite remote sensing applications, linking atmospheric physical parameters with satellite-observed radiation. The simulation accuracy of the RTMs used directly impacts the effectiveness of assimilating observational data in NWP and plays a pivotal role in the accuracy of satellite retrievals. In the infrared (IR) region, the wavelengths are closer to the size of aerosol particles, resulting in significant scattering effects as they fall into the Mie scattering regime. This makes IR radiation more susceptible to being influenced by aerosol [15,16], which not only increases the complexity of the radiative transfer process but also reduces the simulation accuracy of RTMs.
The brightness temperature (BT) in satellite infrared observations is typically measured in the long-wave infrared (LWIR) range, which ranges from 8 to 14 µm, while the mid-wave infrared (MWIR) range generally spans from 3 to 5 µm. Aerosols have a particularly significant impact on the 8–12 µm infrared window channels, which are sensitive to aerosol-induced effects. Numerous studies have shown that aerosols significantly affect BT simulations in the IR region [17,18,19,20]. In the Sahara Dust Experiment, downwelling measurements from the Airborne Research Interferometer Evaluation System (ARIES) indicated that aerosols induced a cooling effect of 2–4 K on BTs in the IR window region [21]. Pierangelo et al. [22] and Peyridieu et al. [23] demonstrated that the atmospheric impact of dust increases significantly with a higher aerosol optical depth (AOD) and greater dust altitude. Furthermore, they noted that short-wave IR channels (3–5 µm) are more sensitive to changes in the total AOD, while long-wave IR channels (8–12 µm) exhibit greater sensitivity to the vertical distribution of dust. In sea-surface temperature retrieval, these IR channels have been extensively utilized to detect and quantify the impact of dust, effectively isolating its interference with the retrieval accuracy [24]. Quan et al. [25] found that, during mid-latitude summer, the brightness temperature difference (BTD) within the IASI spectral range of 645–1200 cm⁻1 exhibited the greatest variability, with peak fluctuations reaching up to 1 K. This indicates that this spectral region is particularly sensitive to aerosol effects. Wei et al. [26] conducted sensitivity experiments using idealized dust profiles and reported that the mass loading and altitude of the dust layer are the primary and secondary factors that influence BT simulations, respectively. In contrast, variations in the fine-to-coarse particle ratio have a relatively minor impact on BT simulations. Sun et al. [27] incorporated aerosols from the Copernicus Atmosphere Monitoring Service (CAMS) into RTTOV to evaluate their impact on BT simulations for the Advanced Himawari Imager (AHI) aboard the Himawari-8 geostationary satellite. Their findings indicated that, in dust-dominated regions, accounting for the radiative effects of dust aerosols could correct BT biases by up to 4 K and reduce observation-minus-background (OMB) biases by up to 0.7 K. These research advancements emphasize the significant impact of dust aerosol properties on radiance corrections in the infrared region under cloud-free clear-sky conditions following cloud detection processing. The findings further underscore the critical role of the aerosol distribution and aerosol properties in obtaining accurate radiance simulations. However, despite these progressions, significant gaps remain in the understanding of aerosol distribution, its characteristics, and their radiative effects. Moreover, previous studies have primarily relied on polar-orbiting satellites to track atmospheric pollution events, such as dust storms. Due to their limited spatial and temporal resolutions, these studies were unable to continuously monitor the dynamic evolution of atmospheric pollutants. In contrast, geostationary satellites offer continuous, high-resolution monitoring. The Geostationary Interferometric Infrared Sounder (GIIRS) onboard the FY-4 series satellite, the first high-spectral-resolution infrared atmospheric sounder in a geostationary orbit, provides continuous three-dimensional observations of the atmospheric temperature and water vapor under conditions of atmospheric pollution [28].
Aerosols are not only essential to the accuracy of atmospheric retrievals but also significantly impact satellite radiance observations assimilated in the form of BTs. Neglecting the role of aerosols in radiative calculations can introduce OMB biases [29,30]. Currently, the common approach is to exclude IR observational data affected by clouds and aerosols [31,32,33], but this results in the underutilization of valuable spectral information. Although the impact of clouds on IR radiation is more pronounced, aerosols also significantly influence temperature and humidity analyses. Obtaining accurate aerosol datasets is crucial for the precision of BT simulations, as it determines whether aerosols play a positive role in the simulation process or contribute to the introduction of bias. Aerosol reanalysis datasets provide global information on aerosol concentration, distribution, and variation, covering all oceanic regions and filling gaps that site-specific data cannot address, and thus offering a more comprehensive basis for research [34]. To date, no study has separately incorporated different aerosol reanalysis datasets into the Advanced Radiative Transfer Modeling System (ARMS) to compare their respective effects on the improvement in BT simulations and OMB biases for the GIIRS on the FY-4B satellite. For a sandstorm event on 10 April 2023, this study designed three experiments: Experiment 1 involved BT simulation calculations without aerosol, serving as a baseline reference. Experiment 2 and experiment 3 introduced aerosol from the Modern-Era Retrospective Analysis for Research and Applications, Version 2 (MERRA-2) and the CAMS into the ARMS, respectively, to compare and quantitatively assess the impact of the aerosol from both datasets on BT simulations. Additionally, the experiments further compared and analyzed the specific contributions of different aerosol types in the MERRA-2 and CAMS to the BT simulations. This work not only provides guidance for the use of accurate aerosol datasets in subsequent data assimilation and retrieval studies but also lays the foundation for incorporating aerosol radiative properties into NWP.
The structure of this paper is as follows: Section 2 introduces the datasets used in this study and the fast RTM. Section 3 provides a detailed description of the setup for the three experiments. Section 4 presents a comparison and analysis of the results from the three experiments, and, finally, the conclusions and discussion are presented in Section 5.
2. Model and Dataset
2.1. Advanced Radiative Transfer Modeling System (ARMS)
As a forward operator, ARMS takes into account both atmospheric conditions and the characteristics of satellite instruments, including those from the NOAA (National Oceanic and Atmospheric Administration) and EUMETSAT (European Meteorological Satellite Organization) satellite series, as well as the Fengyun satellite series. In addition, ARMS incorporates capabilities from other fast RTMs used in U.S. and European satellite programs. The system allows for the integration of additional radiative transfer modules, which can be applied to a wide range of sensors [35,36], enabling the more accurate simulation of radiance measurements ARMS includes a fast transmittance module, updated particle absorption and scattering tables, a surface emissivity component, and a polarized radiative transfer solver.
This study focuses on using ARMS’s aerosol module for sensitivity experiments. ARMS simulates different aerosol types using an aerosol transport model, covering the optical properties of dust, sea salt, carbonates (black carbon and organic carbon), and sulfates. Particle absorption and scattering are key components of fast RTMs. ARMS incorporates the latest advancements in aerosol particle optical property parameterization. The model uses a superellipsoid approach to represent aerosol particles, offering more accurate optical properties compared to traditional spherical models, and allowing for a more accurate representation of the geometric shapes of real atmospheric particles. This, in turn, enables a more precise calculation of their optical properties, enhancing the accuracy of the model. The single-scattering properties of the super-spheroids are calculated using the invariant imbedding T-matrix method [37,38] and an improved geometric optics method [39]. The super-spheroid model provides a unified approach that is applicable to different types of aerosols, such as sulfates, sea salt, and dust [40,41], enhancing the model’s applicability and accuracy in simulating different aerosol types. ARMS uses precomputed lookup tables to calculate the optical properties of aerosols, particularly their extinction coefficients, single scattering albedos, asymmetry factors, and phase function coefficients. In practical applications, by specifying the aerosol type, effective radius, and column mass density, ARMS can generate the aerosol optical profiles required for radiative transfer solvers. These optical profiles are used for multiple scattering simulations, radiative calculations, and the evaluation of the AOD.
2.2. MERRA-2 Dataset
The MERRA-2 is a next-generation reanalysis dataset developed by NASA based on the Goddard Earth Observing System, Version 5 (GEOS-5) Earth system model [42] and the Gridpoint Statistical Interpolation (GSI) assimilation system [43,44]. The MERRA-2 enhances the accuracy of its analysis by assimilating bias-corrected AOD observations from the ground-based aerosol robotic network (AERONET), the Multi-angle Imaging Spectroradiometer sensor (MISR), the Moderate Resolution Imaging Spectroradiometer (MODIS), and the Advanced Very High Resolution Radiometer (AVHRR). The accuracy of the MERRA-2’s three-dimensional aerosol data has been validated through comparisons with multiple datasets, including Cloud-Aerosol Lidar and Infrared Pathfinder Satellite Observations (CALIPSO), ground-based AERONET network observations, and MODIS observations [45,46,47]. The high correlation with these datasets indicates the high reliability of the MERRA-2 aerosol data.
The three-dimensional aerosol dataset from the MERRA-2 covers a period from 10 April 2023, and is used as the input to ARMS. The dataset includes dust with five particle size bins (radii of 0.1–1.0, 1.0–1.8, 1.8–3, 3–6, and 6–10 μm), sea salt with four particle size bins (radii of 0.1–0.5, 0.5–1.5, 1.5–5, and 5–10 μm), sulfate, hydrophilic and hydrophobic organic/black carbon aerosols, and sulfate aerosols (with their hydrophilic and hydrophobic forms being indistinguishable in ARMS). The data have a temporal resolution of three hours and a spatial resolution of 0.625° × 0.5°, with 72 vertical model layers. Specifically, the aerosol mixing ratios are interpolated spatially and temporally to the observation points of the GIIRS and then converted to column mass density values suitable for ARMS simulations. Additionally, the effective radius of different aerosol types at the observation points is determined by the local atmospheric conditions.
2.3. CAMS Dataset
The CAMS reanalysis dataset is the latest global atmospheric composition reanalysis product produced by the European Centre for Medium-Range Weather Forecasts (ECMWF). It provides three-dimensional, temporally consistent atmospheric composition fields, including aerosols and chemical components. The CAMS assimilates AOD retrieval data from the advanced along-track scanning radiometer (AATSR) onboard the Envisat satellite, and from the MODIS sensors aboard NASA’s Aqua and Terra satellites [48]. Several studies have validated CAMS’s aerosol data, with Ansari and Ramachandran [49] reporting a high correlation of over 80% between the CAMS AOD and AERONET data in Asia, including South Asia, Southeast Asia, and East Asia. Liu et al. [50] demonstrated that the CAMS shows good consistency with MODIS data across all time scales.
This study utilizes the CAMS three-dimensional aerosol datasets from 9 to 10 April 2023, which includes sea salt (with three bins: 0.03–0.5 µm, 0.5–5 µm, and 5–20 µm), dust (with three bins: 0.030–0.55 µm, 0.55–0.9 µm, and 0.9–20 µm), hydrophilic and hydrophobic organic carbon (OC), black carbon (BC), and sulfate aerosols. In ARMS, the distinction between hydrophilic and hydrophobic organic carbon is not made. The CAMS data have a temporal resolution of three-hour intervals and a spatial resolution of 0.75° × 0.75°, with 60 vertical model layers. As with the interpolation method used for the MERRA-2, the aerosol mixing ratios for each type of aerosol are spatially and temporally matched to the corresponding GIIRS observation locations and converted to column mass density units suitable for ARMS simulations. The standard Lorenz–Mie algorithm is used to calculate the properties of each aerosol species, assuming external mixing. In this approach, each aerosol species is considered to coexist within the same air volume, retaining its individual optical and chemical properties, and the contributions of each species are corrected based on their relative proportion to the total aerosol [51,52].
2.4. FY-4B GIIRS Data
The FY-4B satellite, launched on 3 June 2021, as a satellite service, features significant advancements over its predecessor, FY-4A, in its spectral, temporal, and spatial resolution, as well as its calibration accuracy. The GIIRS onboard FY-4B observes atmospheric outgoing radiance in the long-wave infrared (LWIR, 8.8–14.7 µm or 680–1130 cm⁻1) and mid-wave infrared (MWIR, 4.4–6.1 µm or 1650–2250 cm⁻1) bands. These observations are designed to support applications such as the retrieval of three-dimensional atmospheric temperature and humidity fields data and data assimilation for NWP models [53]. Each field-of-regard (FOR) of the FY-4B/GIIRS has 128 detectors. The FY-4B/GIIRS has 8 detectors in the east–west direction and 16 detectors in the north–south direction, as shown in Figure 1a.
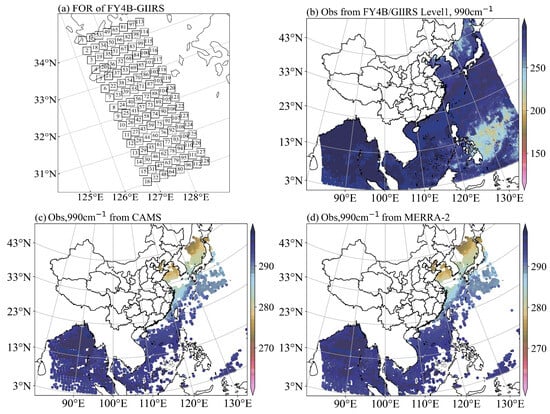
Figure 1.
(a) The FOR of FY-4B/GIIRS during the scanning period from 11:33 to 11:38 (UTC) on 10 April 2023; (b) the spatial distribution observed by FY-4B/GIIRS level 1 data from channel 498 (990 cm⁻1) prior to cloud detection; (c) the spatial distribution of BT observed by FY-4B/GIIRS channel 498 (990 cm⁻1) after matching with CAMS and before cloud detection; and (d) the spatial distribution of BT observed by FY-4B/GIIRS channel 498 (990 cm⁻1) after matching with MERRA-2 and before cloud detection.
The FY-4B/GIIRS level 1 data on 10 April 2023, are provided by the National Satellite Meteorological Center. The comparison between the observation and the BT simulation by the ARMS was conducted over an oceanic region spanning from 80°E to 140°E and from 3°N to 50°N, with a spatial resolution of 12 km × 12 km. Since IR hyperspectral radiation is highly sensitive to cloud interference, only clear-sky and aerosol conditions were considered for this study. The cloud detection was performed on the observational data using the cloud mask product from FY-4B/AGRI. Figure 1b shows the BT distribution for channel 496 (990 cm⁻1) before cloud detection. Figure 1c,d illustrate the BT distributions of FY-4B/the GIIRS after spatial and temporal matching with the CAMS and MERRA-2 datasets and subsequent cloud detection. A total of 4209 points were matched with the CAMS and 7500 points with the MERRA-2. The difference is primarily attributable to the slightly higher spatial resolution of the MERRA-2 compared to the CAMS, although both datasets share the same temporal resolution.
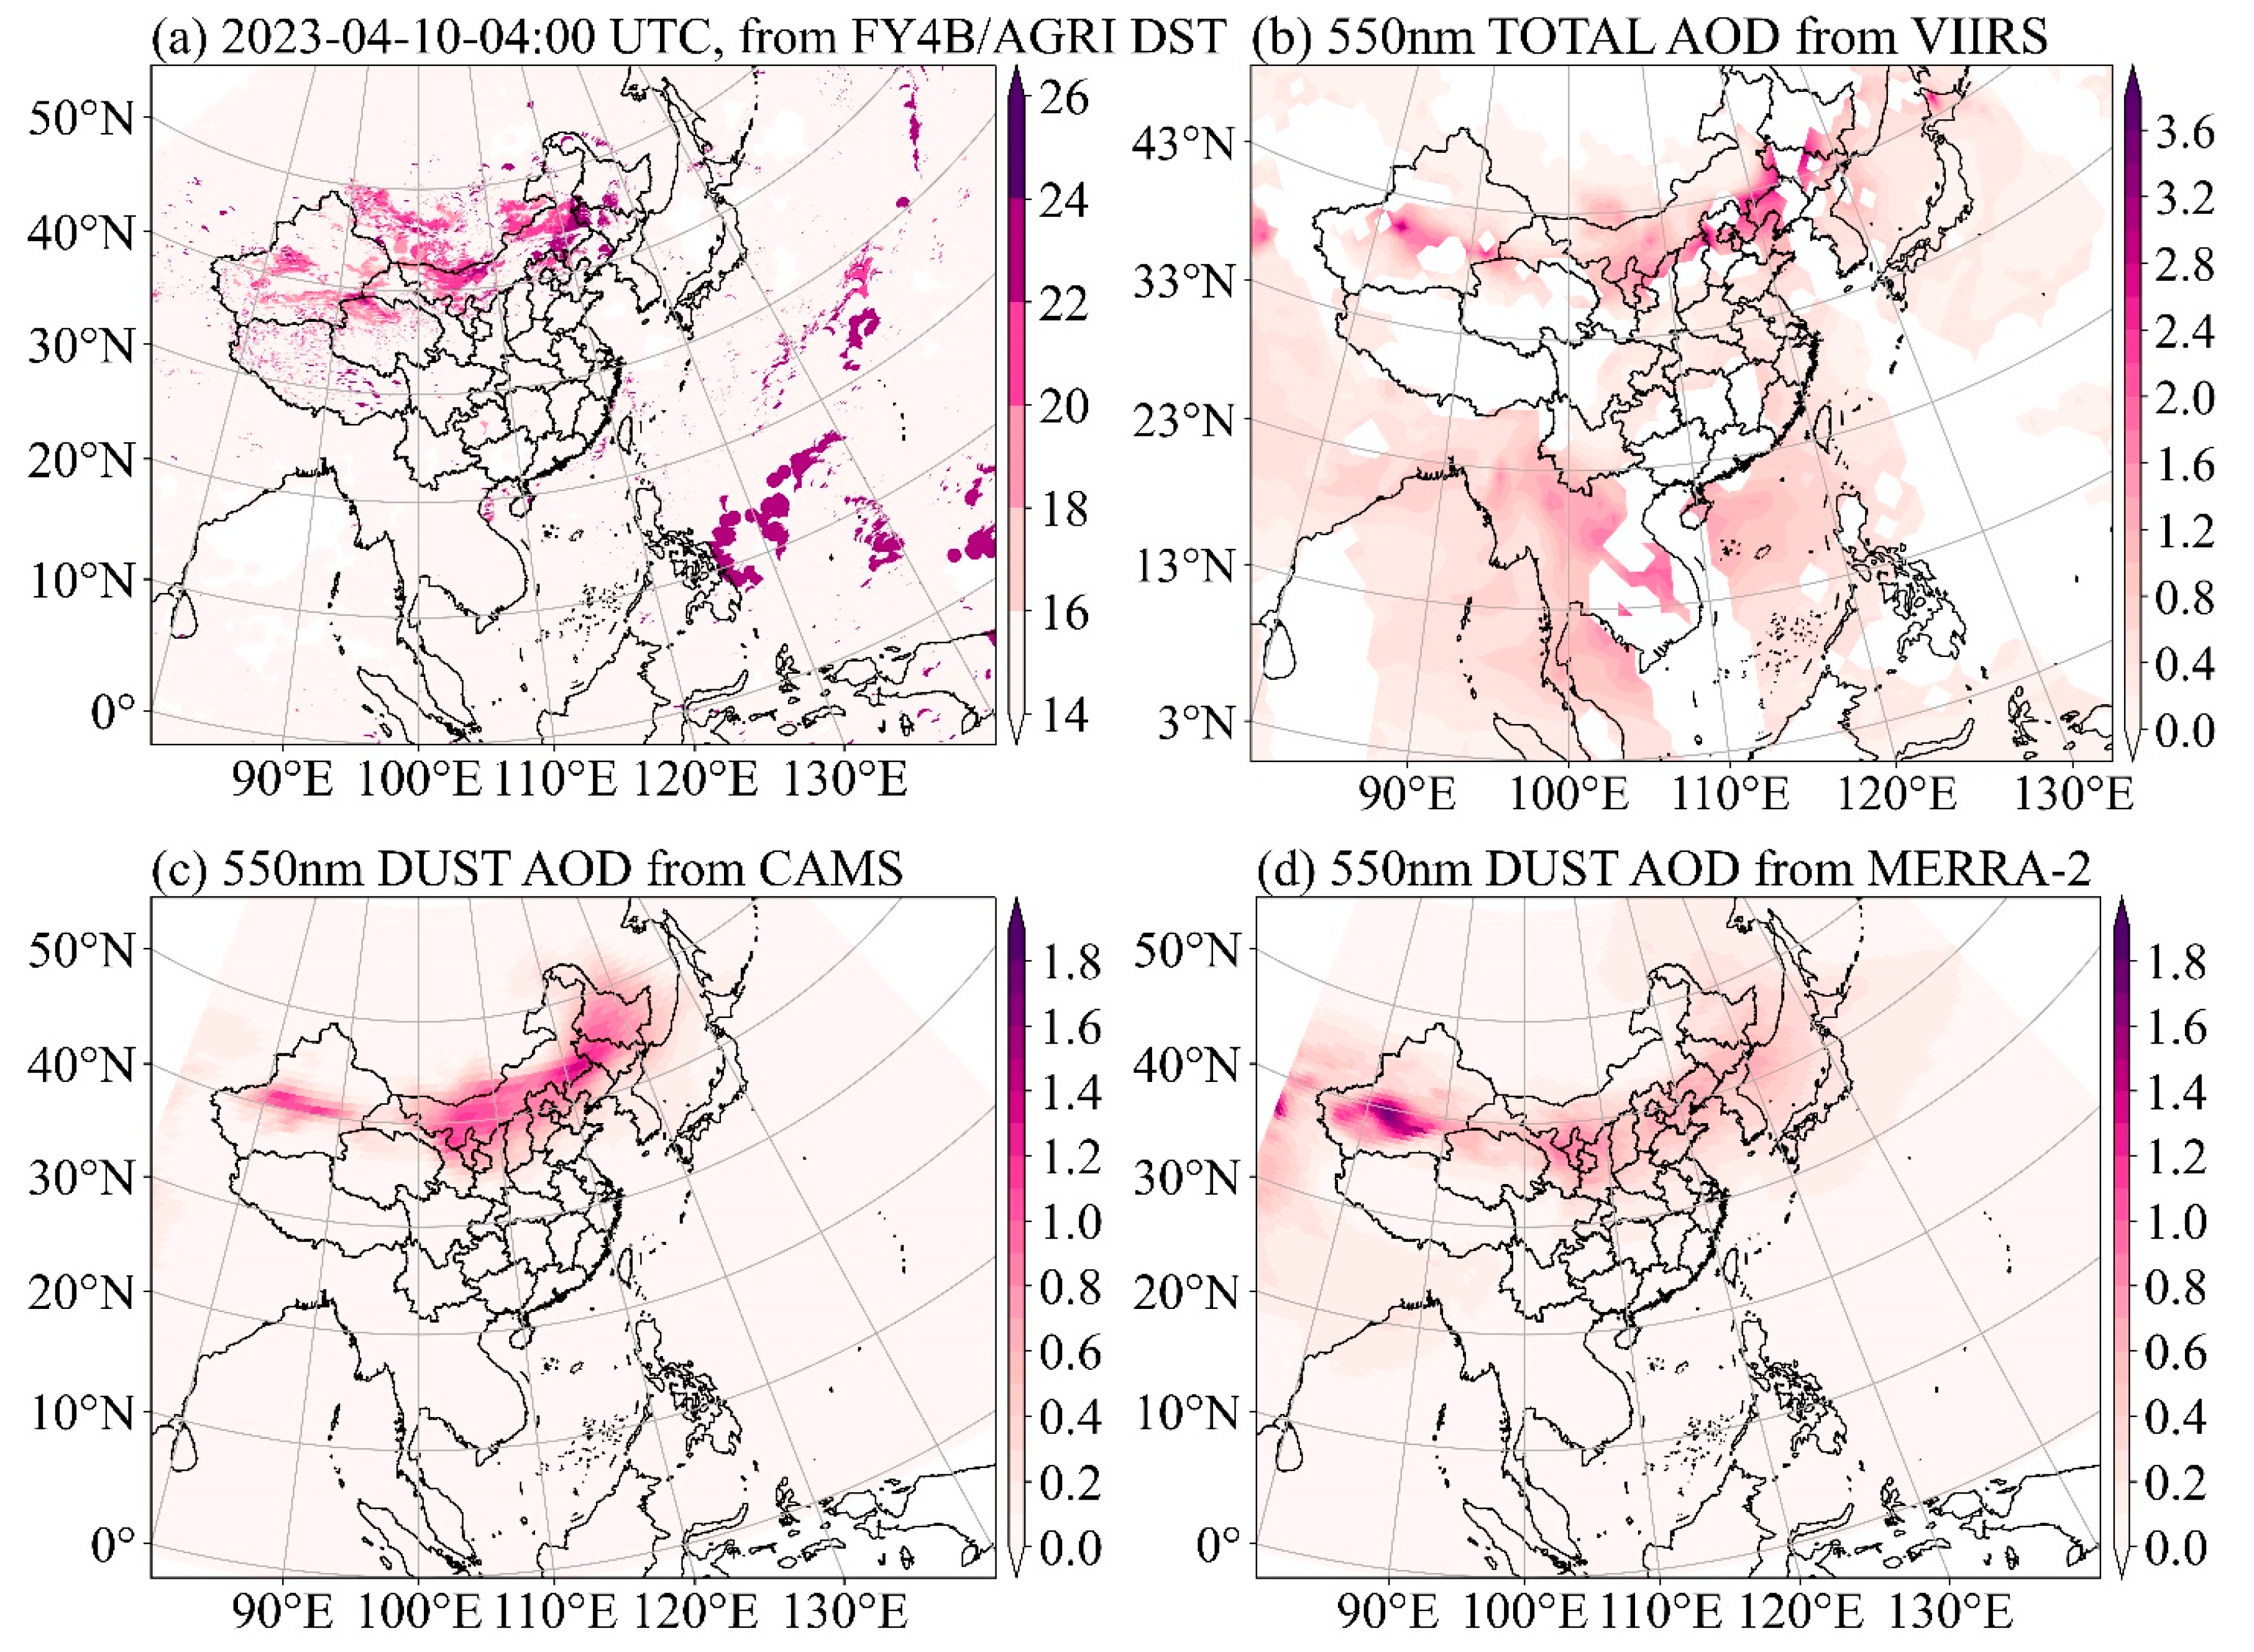
Figure 2 illustrates the severe dust storm event that occurred on 10 April 2023, as a result of a Mongolian cyclone. The intensification of the cyclone in April promoted the eastward transport of aerosols from western Inner Mongolia and southern Mongolia. Dust aerosols originating from the Gobi Desert affected not only northern and northeastern China but also extended to the coastal regions of the Bohai Sea and the Sea of Japan. Figure 2a presents dust fraction data from the FY-4B/AGRI DST product, with pixels exhibiting a dust fraction greater than or equal to 16 considered as dust pixels. Figure 2b shows the total AOD at 550 nm from Visible Infrared Imaging Radiometer Suite (VIIRS)/NOAA-20, while Figure 2c,d display dust the AOD at 550 nm from the CAMS and MERRA-2, respectively. It can be observed that the overall trend is consistent across the datasets.
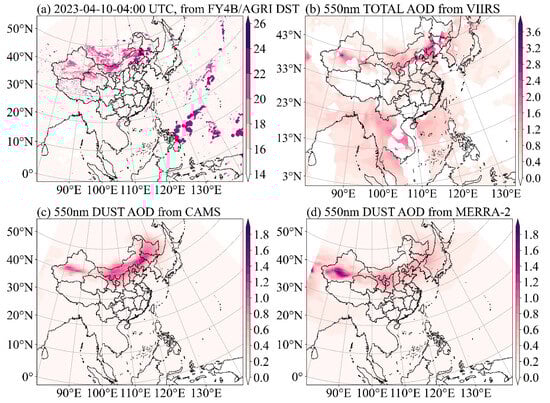
Figure 2.
(a) The FY-4B/AGRI DST product at 04:00 UTC on 10 April 2023. (b) Visible Infrared Imaging Radiometer Suite (VIIRS)/NOAA20 550 nm total AOD. (c,d) Dust AOD at 550 nm from CAMS and MERRA-2, respectively.
3. Experiment Design
3.1. Data Pre-Processing
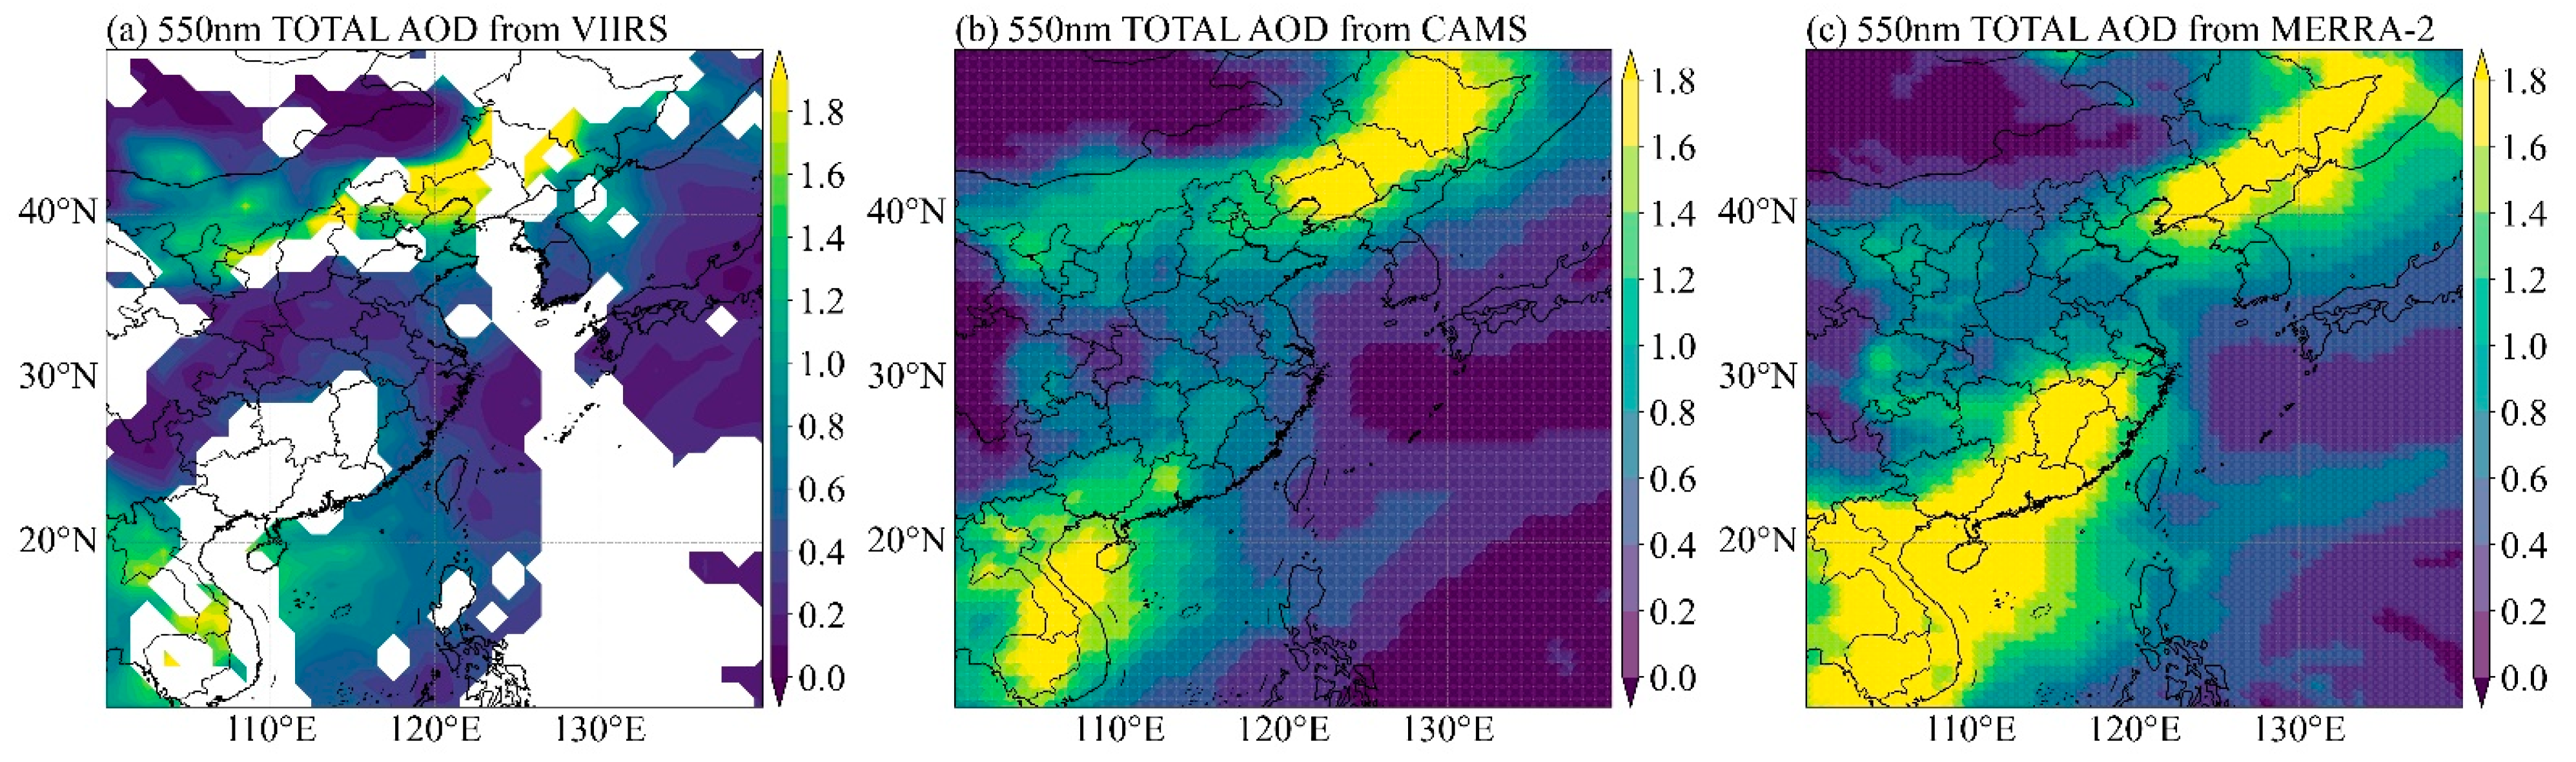
Figure 3a illustrates the AOD distribution at a wavelength of 550 nm as observed by the VIIRS. VIIRS/NOAA-20 provides high-quality AOD data through its multispectral imaging capabilities, supporting global aerosol monitoring. The comparisons with the CAMS and MERRA-2 data, shown in Figure 3b,c, reveal consistency in the spatial distribution of high AOD among the datasets. Notably, elevated AOD levels are observed over the Bohai Sea and adjacent northeastern land regions, as well as in northwestern coastal regions of the South China Sea. These findings underscore the significant impact of the dust storm event on the aerosol distribution in the area.
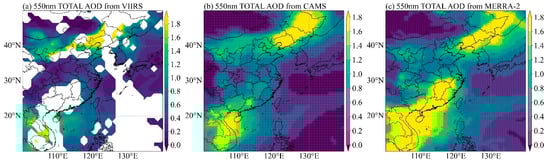
Figure 3.
Spatial distribution of AOD estimated at 550 nm over land and ocean on 10 April 2023: (a) VIIRS/NOAA20, (b) CAMS, (c) MERRA-2.
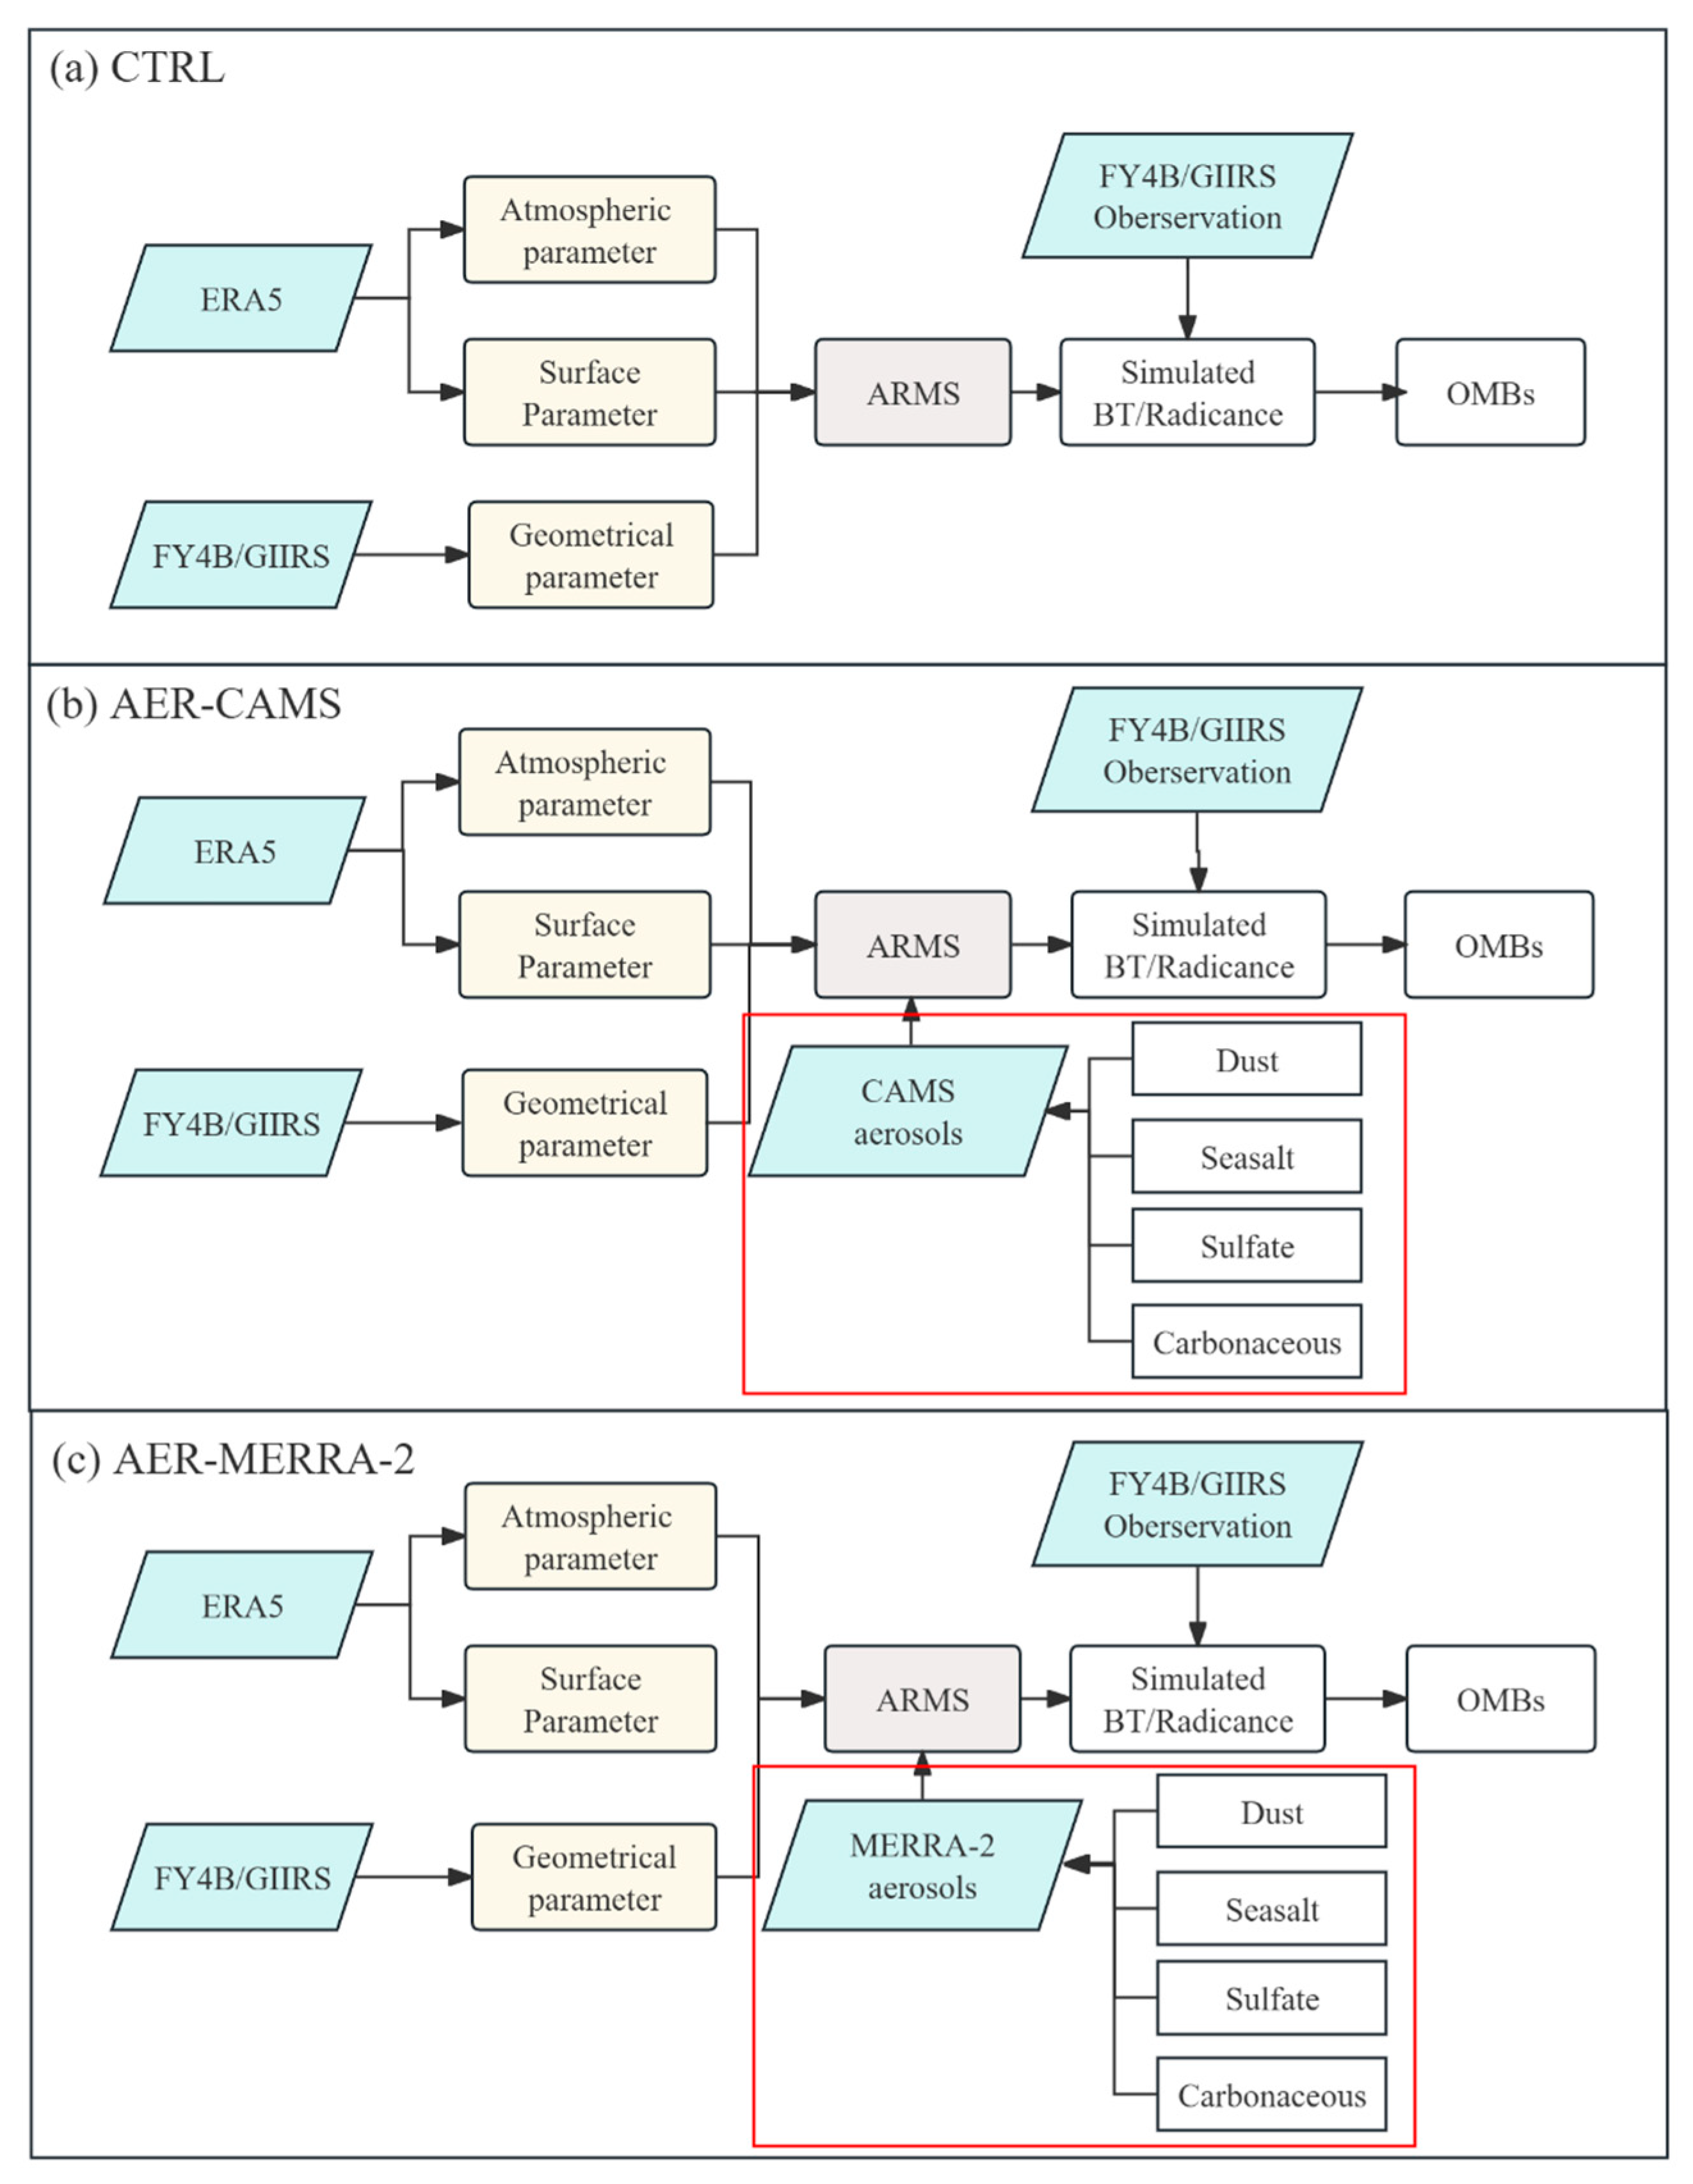
The experimental design for conducting BT simulations using ARMS with the CAMS and MERRA-2 aerosol reanalysis data is depicted in Figure 4. In this study, the fifth-generation ECMWF atmospheric reanalysis data (ERA5) were used to determine atmospheric parameters such as the temperature, humidity, ozone, and pressure, as well as surface parameters like the surface temperature and 10 m wind direction and speed, all of which were input into ARMS. The ERA5 atmospheric and surface parameters have a horizontal resolution of 0.25° × 0.25°, with an hourly temporal resolution. The atmospheric profiles cover pressure levels from 1000 hPa to 1 hPa, with a total of 137 vertical layers. Additionally, geometric parameters from the GIIRS were used, including the latitude, longitude, solar azimuth angle, solar zenith angle, sensor azimuth angle, and sensor zenith angle. The MERRA-2 and CAMS provide dust, sea salt, sulfate, and carbonate aerosols in the AER_CAMS and AER_MERRA-2 experiments, respectively. Therefore, in the ARMS input profiles, the aerosol profiles come from different data sources, while the atmospheric parameters such as the atmospheric temperature, humidity, ozone, and pressure profiles, as well as surface parameters like the surface temperature and 10 m wind direction and speed, are all derived from ERA5 reanalysis data. The geometric parameters are obtained from the FY-4B/the GIIRS level 1 data. To account for differences in data resolution among the CAMS, MERRA-2, GIIRS, and ERA5, spatiotemporal matching was performed. To convert the three-dimensional aerosol mixing ratio (kg/kg) from the MERRA-2 and CAMS reanalysis into the aerosol mass density (kg/m2) for ARMS, we conducted unit transformations following the methodology of Buchard et al. [45]. Three experiments were designed for this study:
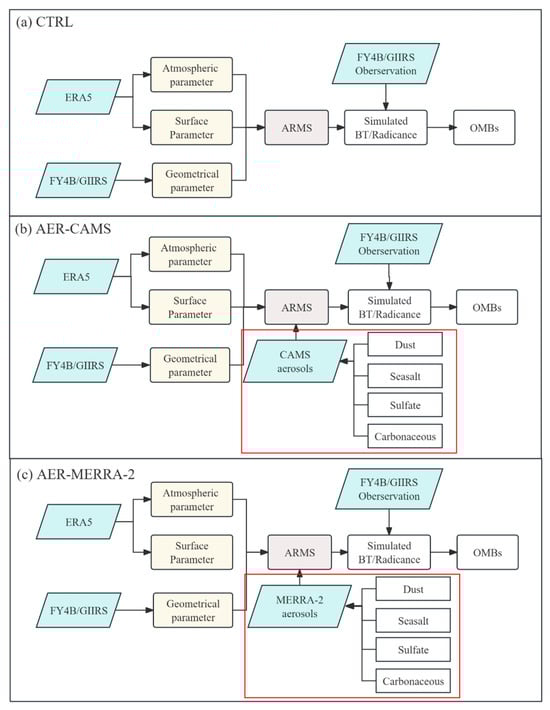
Figure 4.
Diagram illustrating the experimental design: (a) the aerosol-blind experiment (CTRL), (b) the aerosol-aware experiment (AER_CAMS) using datasets from CAMS, and (c) the aerosol-aware experiment (AER_MERRA) using datasets from MERRA-2.
- (a)
- Control (CTRL) experiment: a baseline reference experiment conducted without incorporating aerosol (aerosol-blind configuration);
- (b)
- Aerosol from the CAMS (AER-CAMS) experiment: incorporates aerosol data from the CAMS reanalysis into the ARMS, considering dust, sea salt, sulfate, and carbonaceous aerosols separately, as well as a scenario where all four aerosol types are considered together;
- (c)
- Aerosol from the MERRA-2 (AER-MERRA-2) experiment: incorporates aerosol data from the MERRA-2 reanalysis into the ARMS, considering dust, sea salt, sulfate, and carbonaceous aerosols separately, as well as a combined scenario with all four aerosol types.
This study aims to compare and quantitatively evaluate the impact of the aerosols from the two datasets on the TOA of BT simulations. Additionally, to investigate the influence of different aerosol types within the datasets on the simulation results, four aerosol types were selected for analysis. It is important to note that the CAMS provides three bins for both dust and sea salt aerosols, whereas the MERRA-2 includes five bins for dust aerosols and four bins for sea salt aerosols. In this study, aerosols of different particle sizes were aggregated, and the merged aerosol profiles were utilized as input data for the ARMS model.
3.2. Aerosol Distribution
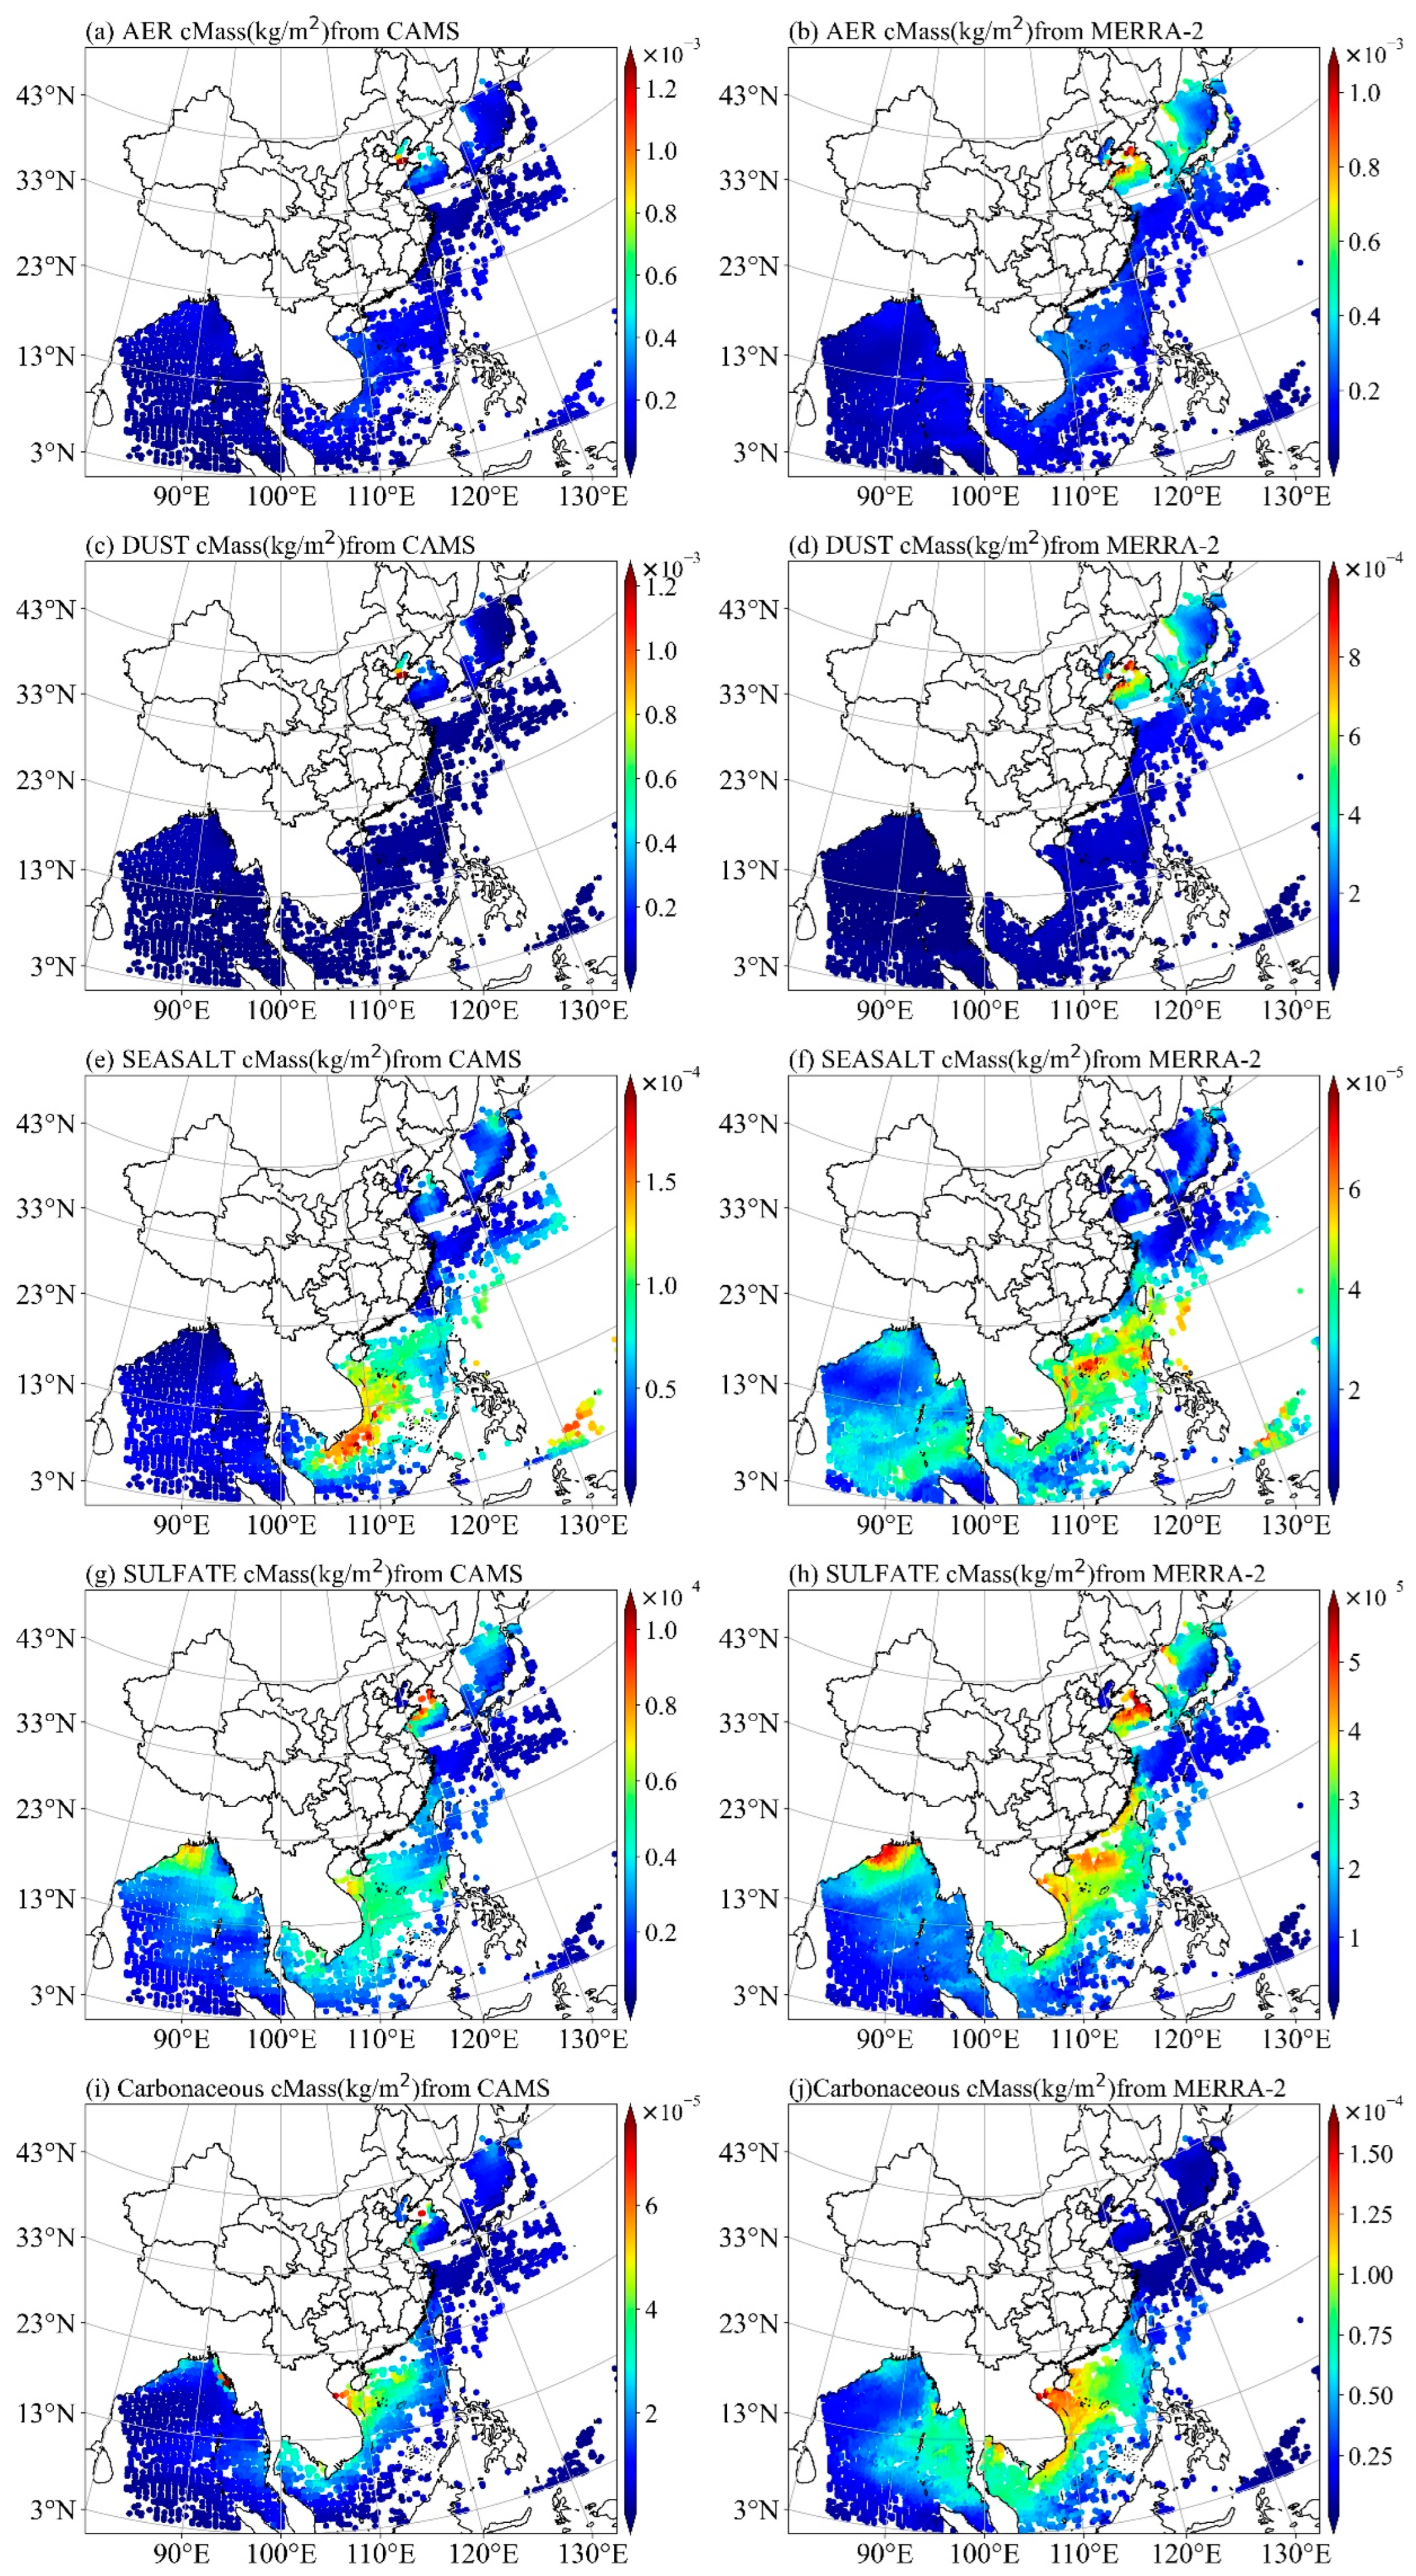
Figure 5 illustrates the spatial distribution of the aerosol column mass density over the oceanic region within FY-4B/the GIIRS observational domain on 10 April 2023, as derived from the CAMS and MERRA-2 datasets. In April 2023, a dust storm originating from the Mongolian Plateau propagated southeastward, reaching the Bohai Sea on 10 April. Accordingly, Figure 5a,b indicate that the regions of high column mass density, encompassing four aerosol types, were concentrated over the Bohai Sea. Specifically, the region with the largest column mass density in the CAMS dataset was located in the southern Bohai Sea near the Yellow River estuary, with a maximum value of 1.26 × 10⁻3 kg/m2. In contrast, the region with the largest column mass density in the MERRA-2 dataset was located near the land area of the Bohai Strait, with a value of 1.06 × 10⁻3 kg/m2.
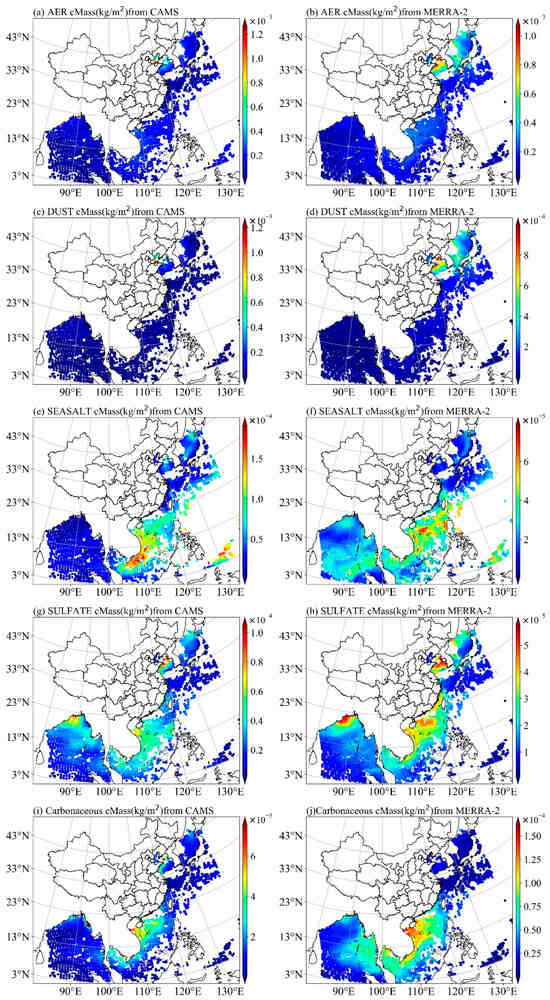
Figure 5.
The spatial distribution of aerosol column mass density over the ocean within the FY-4B/GIIRS observation range on 10 April 2023, as derived from CAMS and MERRA-2. Panels (a,b) depict the total aerosol column mass density (sum of dust, sea salt, sulfates, and carbonaceous aerosols) from CAMS and MERRA-2, respectively. Panels (c–j) illustrate the spatial distribution of column mass densities for different aerosol types from the two datasets.
Additionally, the MERRA-2 identified a larger area of elevated aerosol column mass density near the Sea of Japan, whereas the corresponding values in the CAMS dataset were relatively lower. Ukhov et al. found that the CAMS, compared to AERONET data, overestimates the volume of fine particles with radii ranging from 0.55 to 0.9 μm, while underestimating the volume of coarse particles with radii ranging from 0.9 to 20 μm [54]. Shukla et al. pointed out that the variability of dust and PM10 in the MERRA-2 reanalysis is relatively closer to that in the observed data. This study is consistent with previous analyses [55,56]. Comparing Figure 5b,c, it is evident that dust aerosols account for over 80% of the total aerosol column mass density. Although the spatial distribution of sea salt aerosols is generally consistent across both datasets, the concentration of sea salt in the CAMS dataset is approximately twice that in the MERRA-2. Both datasets show regions with high column mass density of sea salt aerosols in the South China Sea. In the CAMS, the high column mass density region is located at the southernmost part of the South China Sea, with a maximum value of 1.91 × 10⁻⁴ kg/m2, whereas, in the MERRA-2, the high-density region is located in the central part of the South China Sea, with a maximum value of 7.87 × 10⁻⁵ kg/m2. This difference can be attributed to the complex oceanic dynamic processes in the South China Sea, including frequent internal waves, intense typhoons, and storm surges, which exacerbate wave breaking. Additionally, contributions from terrestrial activities further enhance the generation of sea salt aerosols [57]. Although oceanic dynamic processes and terrestrial contributions are likely the primary drivers of the observed spatial differences, discrepancies between the MERRA-2 and CAMS may also arise from differences in their assimilation systems, retrieval algorithms, and models. The MERRA-2 exhibits a higher sea salt aerosol column mass density in the Bay of Bengal compared to the CAMS. For sulfate aerosols, the CAMS reports column mass densities that are approximately twice those of the MERRA-2. However, the overall distribution trends of both datasets are generally consistent, with higher values concentrated in the Bohai Sea. The maximum sulfate aerosol mass density observed in the CAMS is 1.05 × 10⁻⁴ kg/m2, while that of the MERRA-2 reaches a maximum of 5.75 × 10⁻⁵ kg/m2. Shukla et al. found that both the CAMS and MERRA-2 tend to reproduce the overall observed variability in sulfate and sea salt (r = 0.76–0.86), and apart from winter, the CAMS reports higher sulfate concentrations compared to the MERRA-2 [58]. The distributional similarity between sulfate and dust aerosols suggests that, in regions impacted by intense dust storms, both the dust aerosol and sulfate aerosol column mass densities tend to be higher. This phenomenon may be attributed to the substantial increase in fine particles caused by secondary dust resuspension in regions affected by dust storms, as well as the secondary formation of sulfate and organic aerosols and their heterogeneous reactions on particle surfaces. Secondary maxima of sulfate aerosols are observed in the northern Bay of Bengal near coastal regions. The distribution of carbonaceous aerosols is predominantly concentrated in the South China Sea and parts of the Bay of Bengal. The maximum carbonaceous aerosol column mass density in the MERRA-2 data is 1.6 × 10⁻⁴ kg/m2, whereas the CAMS reports a maximum of 9.12 × 10⁻⁵ kg/m2 in the South China Sea. The magnitude in the MERRA-2 data is twice that of the CAMS, suggesting that the CAMS likely underestimates carbonaceous aerosol concentrations compared to the MERRA-2. The CAMS exhibits high-value regions of carbonaceous aerosol column mass density in the Bohai Strait and the northeastern Bay of Bengal near coastal areas. In contrast, the MERRA-2 shows a notable distribution in the eastern part of the Bay of Bengal.
The regions of maximum column mass density for different aerosol types in both the CAMS and MERRA-2 play an important role in the forward model of ARMS, highlighting the significance of accurate aerosol representation in these datasets. For studies at the local or regional level, these results provide guidance for selecting the most suitable data source. In the case of global studies, despite differences in the statistical characteristics of both aerosol products, they are both regarded as appropriate for use [59].
4. Result Analysis
4.1. Sensitivity of Simulated BT to Total Aerosol
This section presents a comparative analysis of the GIIRS-observed BT and the experimental results from the CAMS and MERRA-2 datasets, with a particular focus on evaluating the OMB bias. The objective of this study is to assess the improvements in the OMB bias achieved by incorporating aerosol data from the CAMS and MERRA-2 into the ARMS model and to further investigate the impact of different aerosol types on BT simulations. By comparing the results of the three experiments, this analysis provides deeper insights into the role of aerosols in atmospheric radiation processes and their influence on observational data.
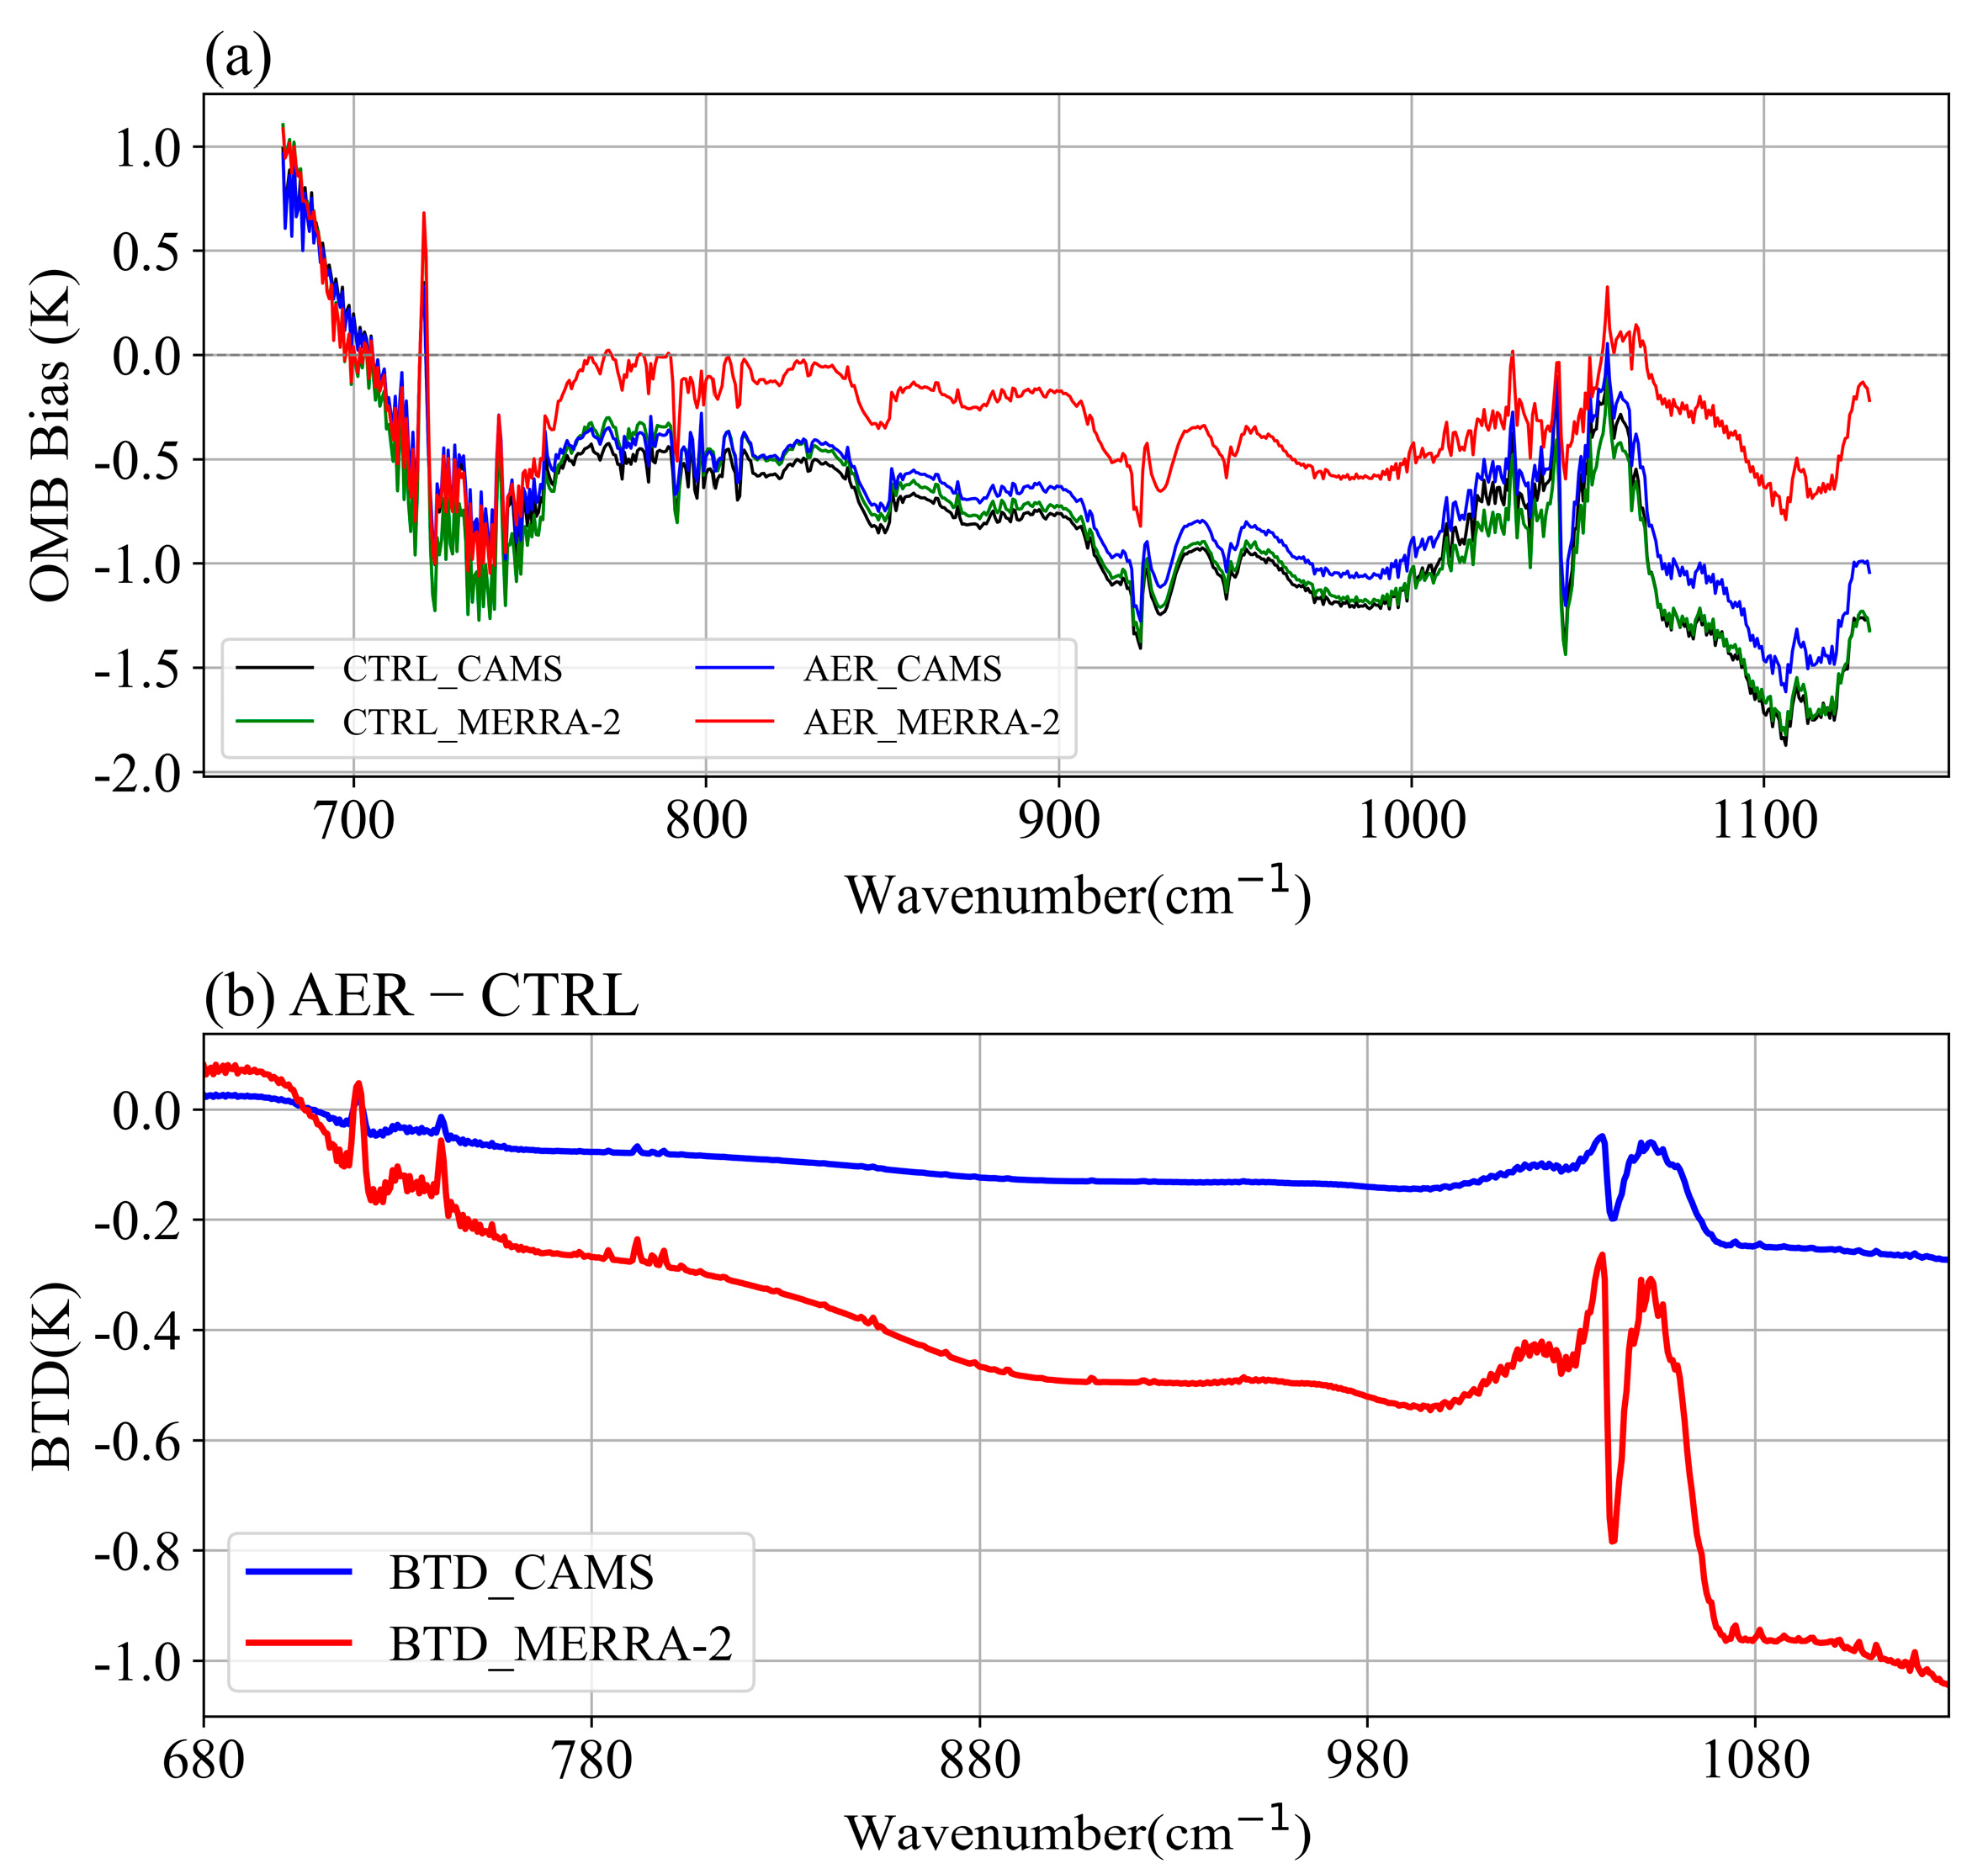
- As shown in Figure 6a, both CTRL_CAMS (black line) and CTRL_MERRA-2 (green line) display negative biases across all long-wave infrared channels of the GIIRS, with the CAMS containing 4209 points and the MERRA-2 containing 7500 points. The average OMB bias for CTRL_CAMS is −0.94 K, while for CTRL_MERRA-2 it is −0.96 K, with the values being very close. The maximum bias occurs in channel 679 (1105 cm⁻1), reaching −2.17 K. The errors in the ERA5 atmospheric and surface data can indeed affect the BT simulation results from ARMS [60,61]. However, in regions affected by dust storms and other areas with high concentrations of coarse aerosol particles, the errors introduced in the BT simulations are relatively small. For example, Niu et al. [62] used ERA5 atmospheric and surface data as input parameters for RTTOV to simulate the BT of FY-4B/the GIIRS under clear-sky conditions. Their results showed that the error range was between 0 and 1 K, which is consistent with the CTRL_CAMS and CTRL_MERRA-2 results presented in Figure 6a of this study;
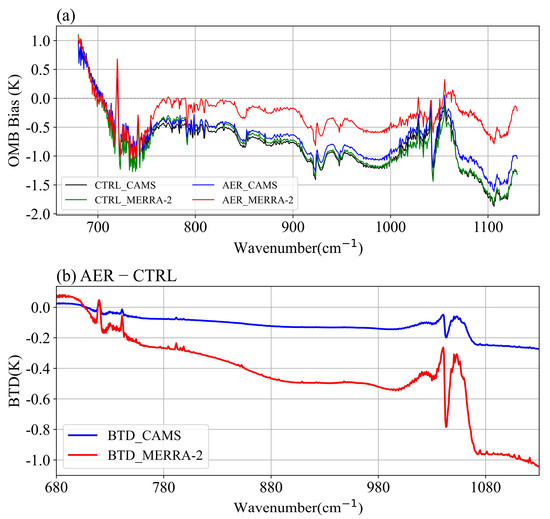 Figure 6. (a) Comparison of OMB biases between the CTRL and AER experiments in the 680–1130 cm⁻1 region for GIIRS from CAMS and MERRA-2. The AER experiment includes all aerosol types (dust, sea salt, sulfates, and carbonaceous aerosols). The selected region for calculation focuses on areas significantly affected by dust storms, such as the Bohai Sea and the Japan Sea. (b) BTD between AER_CAMS, AER_MERRA, and CTRL in the 680–1130 cm⁻1 region for GIIRS.
 - After incorporating total aerosols (including dust, sea salt, sulfate, and carbonate) into ARMS, the OMB biases for AER_CAMS and AER_MERRA-2 show improvements compared to the CTRL experiment. Figure 6b presents the simulated BTD, which illustrates the difference in BT simulations between the total aerosols (AER) and no aerosols (CTRL) in ARMS. Negative BTD values indicate a cooling effect, suggesting that aerosols lead to a decrease in the BT in long-wave infrared channels. The improvement is especially pronounced in the window region between channels 750 cm⁻1 and 1130 cm⁻1. AER_MERRA-2 shows an average improvement of 0.56 K compared to AER_CTRL, while AER_CAMS shows a smaller improvement of 0.11 K compared to CAMS_CTRL. These results clearly indicate that incorporating aerosol data from the MERRA-2 into ARMS yields a more significant improvement than using the CAMS data;
- To more clearly illustrate the correlation between regions of OMB improvement and areas with a higher aerosol column mass density, the aerosol activity over ocean grid points is used, as it provides a valuable opportunity for comparison, enabling an in-depth analysis of the differences in OMB bias. This analysis includes 7500 points from the MERRA-2 and data from the CAMS. Figure 7 focuses on the window channel at 990 cm⁻1, which shows significant OMB improvement, thereby helping to more accurately reveal the impact of aerosols on the OMB bias. Figure 7a,b display the spatial distribution of the OMB bias for the 990 cm⁻1 channel from the CTRL experiment, while Figure 7e,f show the bias between OMB_AER and OMB_CTRL. It is evident that regions influenced by dust storms, such as the Bohai Sea, Bohai Strait, and Japan Sea, exhibit larger average OMB bias values, reaching −1.11 K. Figure 7c,d show the spatial distribution of OMB biases after incorporating the total aerosols for both the CAMS and MERRA-2. In regions with higher aerosol column mass density, as illustrated in Figure 5, particularly in areas with frequent aerosol activity, the OMB negative values are relatively larger. This suggests that the BT simulations in these areas may be overestimated. In the Bohai Sea, Bohai Strait, and Japan Sea regions, the OMB biases were improved to varying degrees. The regions of improvement correspond exactly to the areas of high aerosol column mass density shown in Figure 5a,b. For AER_CAMS, the average OMB improvement in these areas is 0.2 K, with the largest improvement occurring near the coast of the Bohai Sea, where the OMB bias decreased from −2.51 K to −0.12 K, a maximum improvement of 2.63 K. However, in a small part of the Bohai Sea near the coast, the OMB bias increased from −1 K to 1.2 K after the incorporation of aerosols, showing an increase in bias. This may be due to the overestimation of the total aerosol column mass density by the CAMS in this region, which led to slight errors in the BT simulation in ARMS. Except for the areas affected by dust storms, the improvements in other regions are not as significant. After the incorporation of aerosols, the MERRA-2 shows an average improvement of 0.57 K in the OMB biases, with the largest improvement occurring in the Bohai Strait, where the OMB bias decreases from −3.42 K to −0.4 K, reaching a maximum improvement of 3 K. This improvement corresponds to regions of high aerosol column mass density in the MERRA-2 data, as seen in Figure 5b. Additionally, the areas of improvement for the MERRA-2 data also extend to the South China Sea, Yellow Sea, East China Sea, and southern Bay of Bengal. The above results suggest that there are discrepancies in the regions of high aerosol column mass density between the MERRA-2 and CAMS datasets, leading to differences in the maximum OMB bias improvements that were observed. Overall, the aerosol improvement effect is more significant in the MERRA-2 data compared to those of the CAMS. However, after incorporating the total aerosols, the MERRA-2 data show an increase in OMB bias in some small areas of the South China Sea compared to CTRL, and even a bias as large as 2 K in the northern part of the Bay of Bengal. In contrast, the CAMS does not exhibit such an outcome after the inclusion of aerosol data. The detailed causes of this result will be further investigated in subsequent studies focusing on the column mass densities of different aerosol types and the peak aerosol layers.
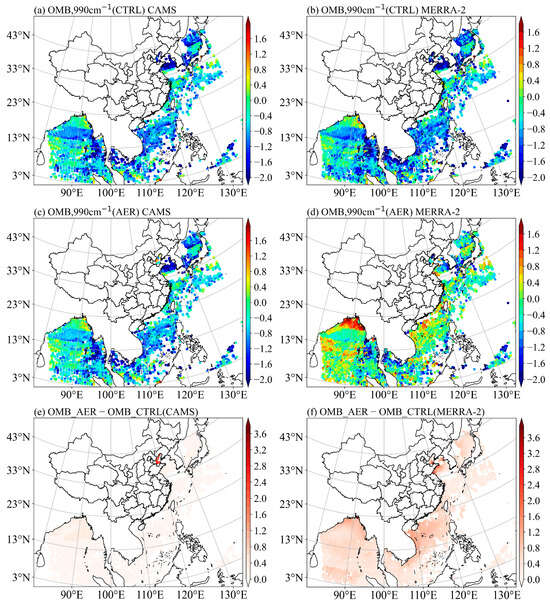 Figure 7. Spatial distribution of the CTRL experiment for CAMS (a) and MERRA-2 (b), and the OMB bias results of the AER experiment for CAMS (c) and MERRA-2 (d) at the 990 cm⁻1 channel on April 10, 2023. Panels (e,f) show the biases of OMB relative to CTRL for CAMS and MERRA-2, respectively.
4.2. Sensitivity of Simulated BT to Four Aerosol Types
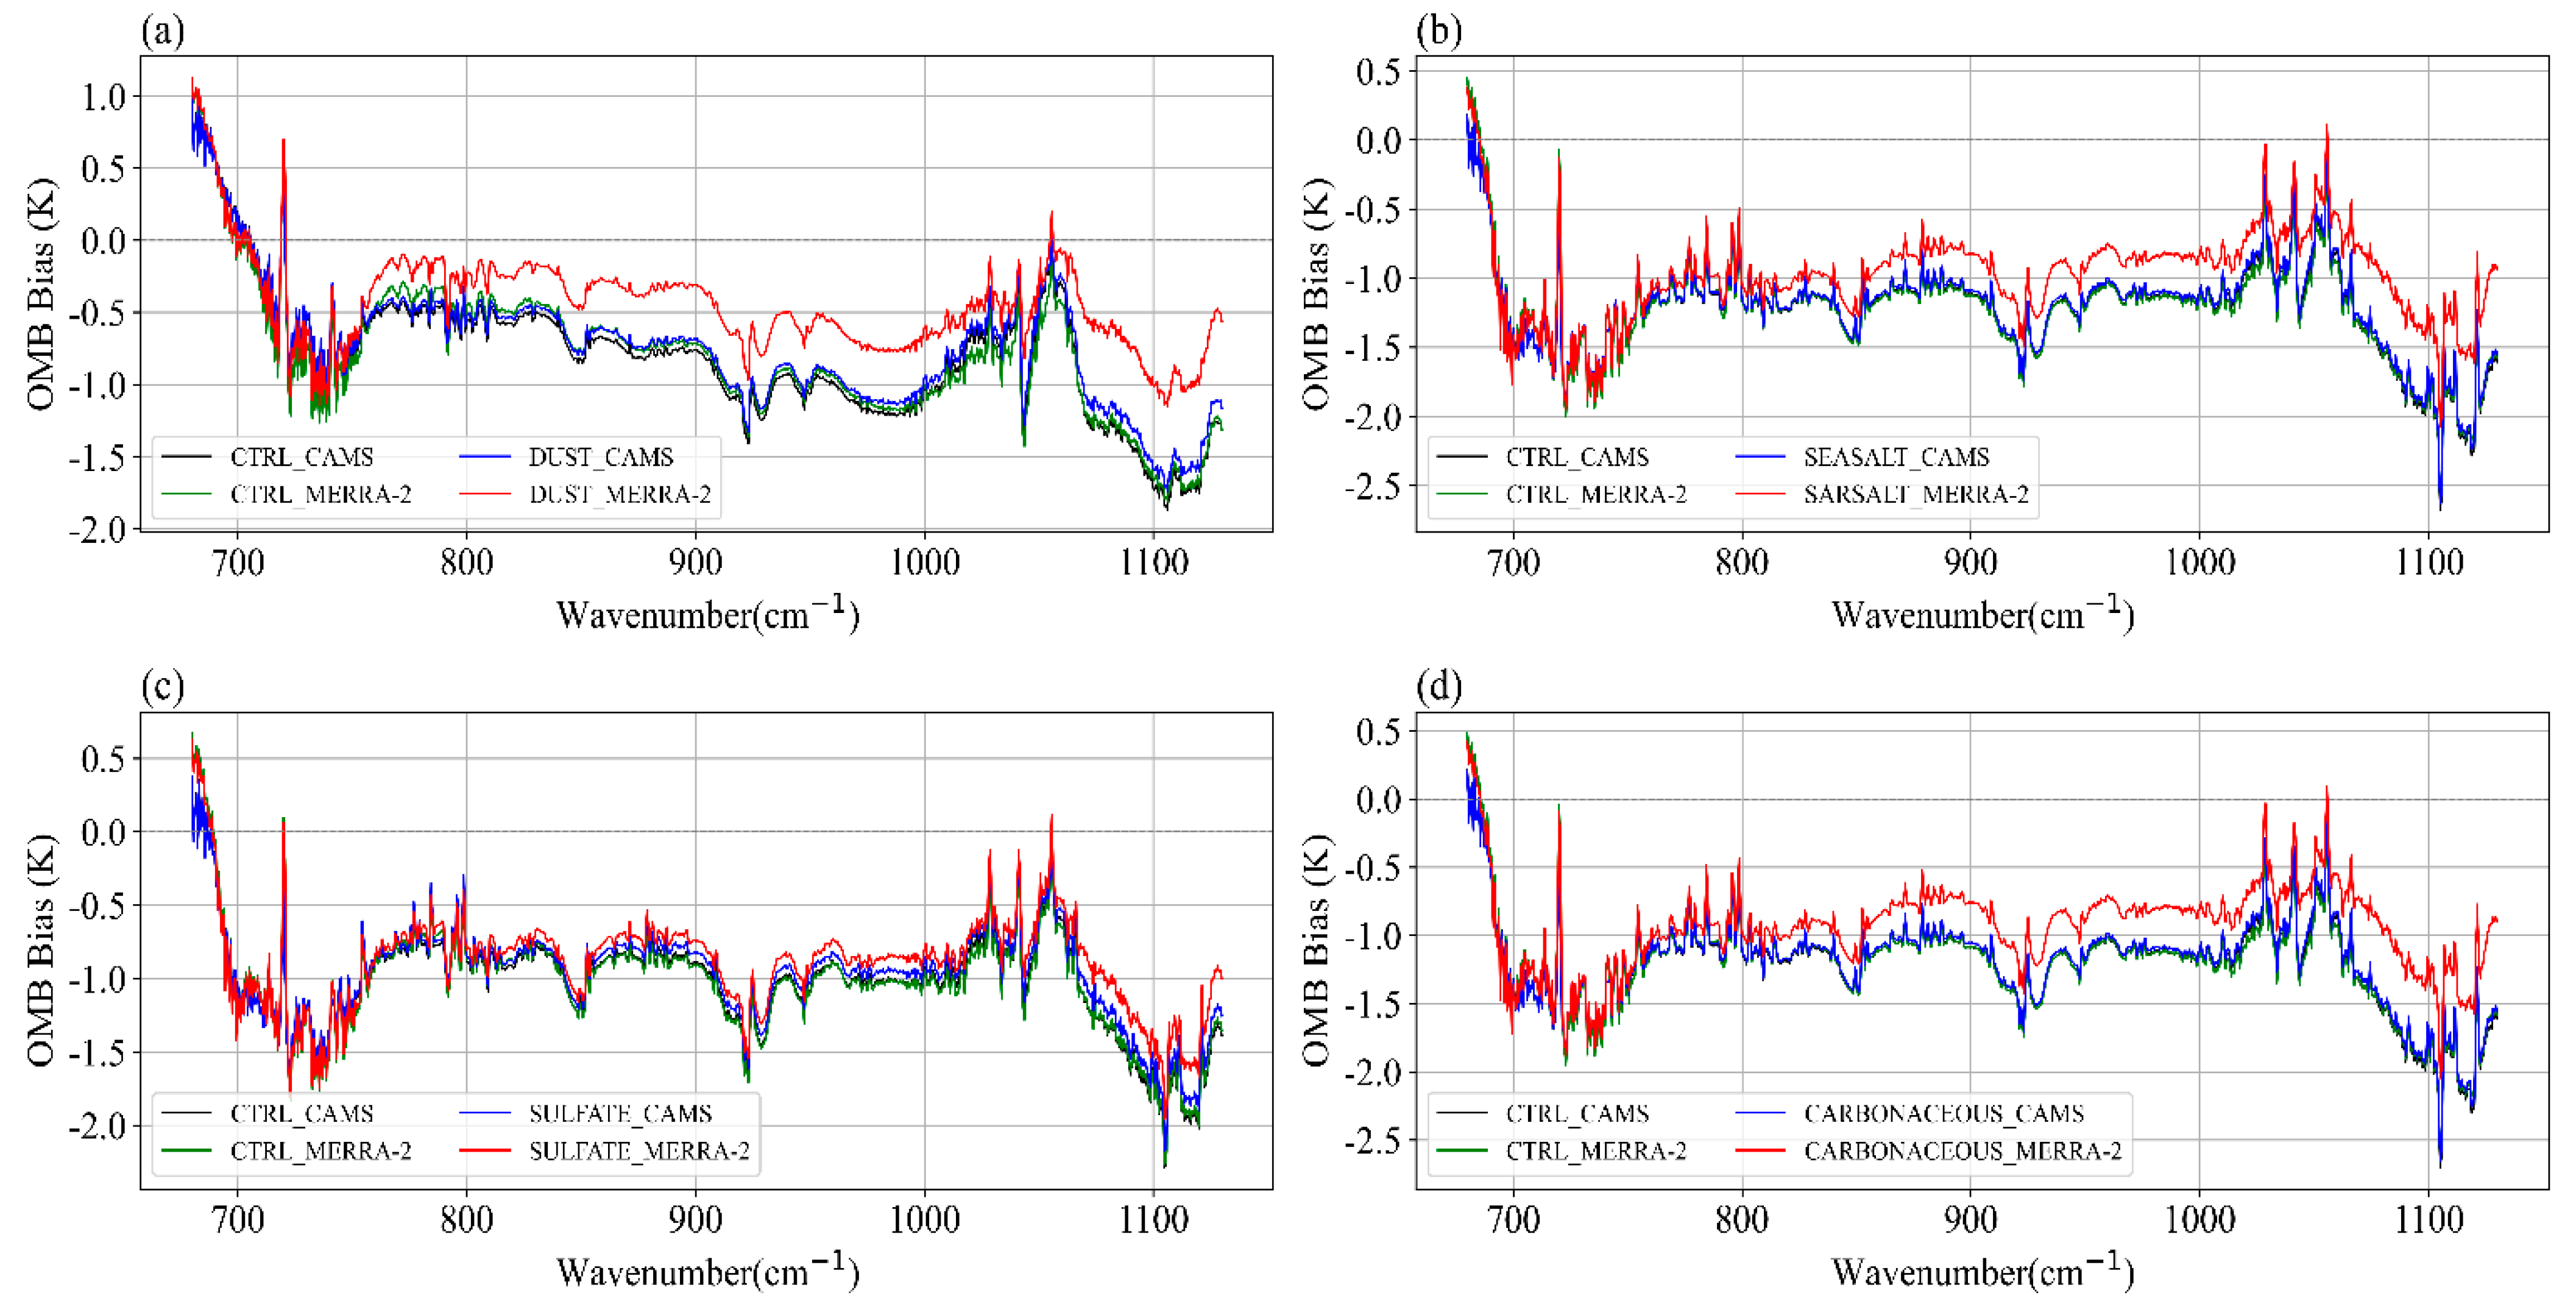
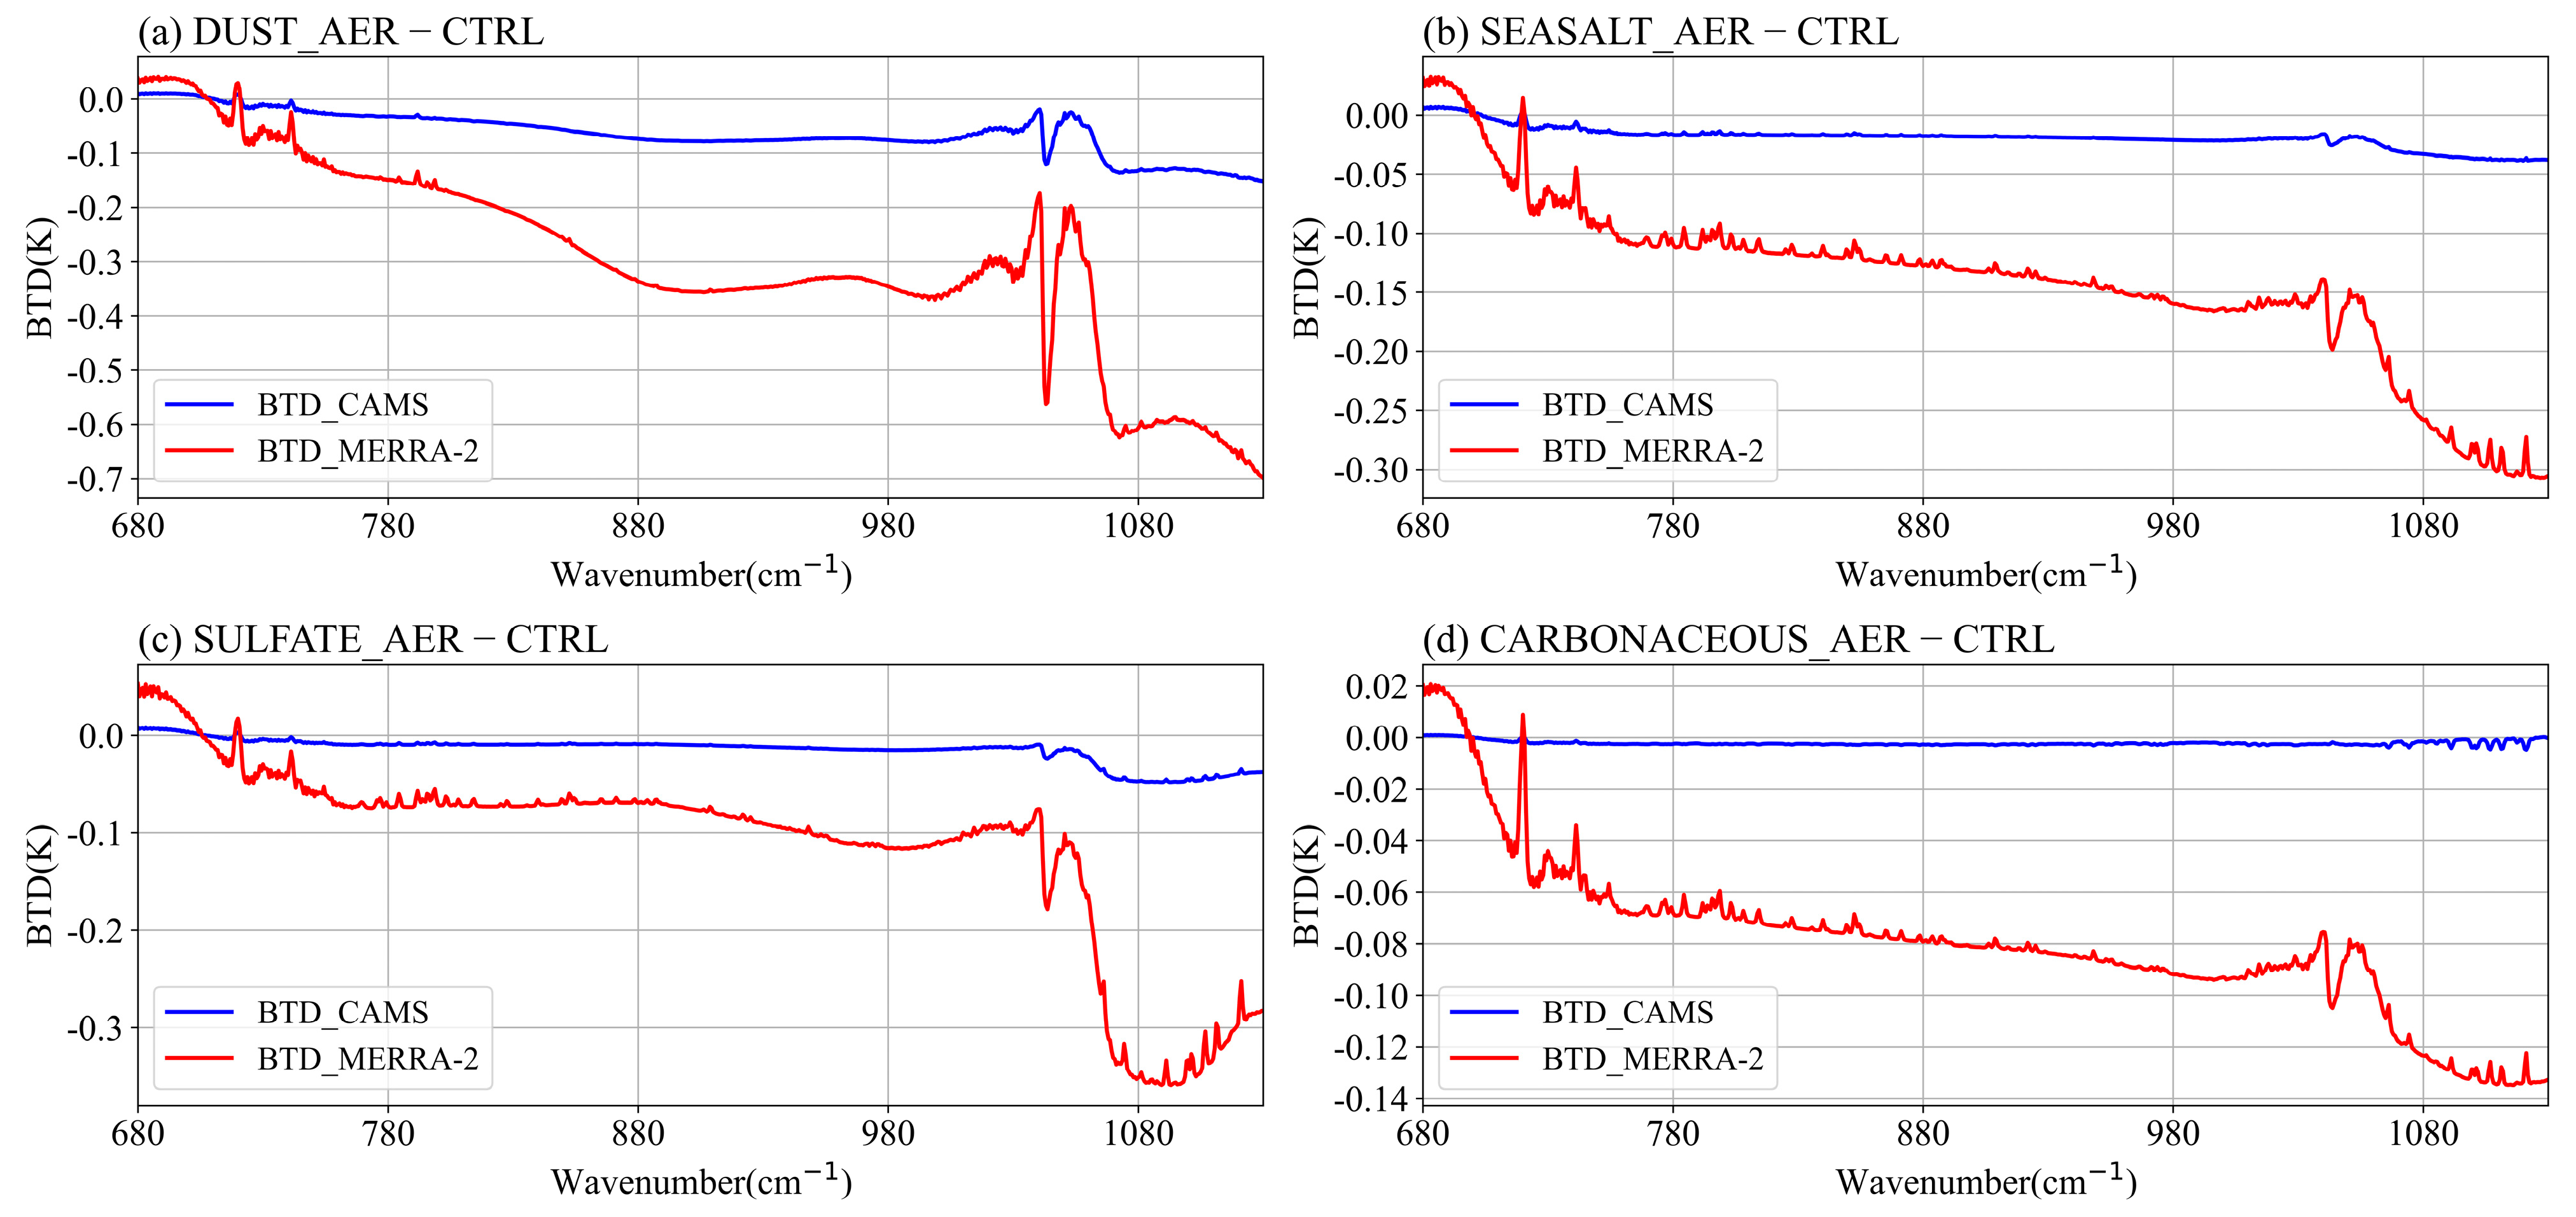
To relate the above results to aerosol types and investigate the radiative effects of different aerosol species, this study conducted four independent experiments using the CAMS and MERRA-2 aerosol datasets. In each experiment, ARMS considered only one aerosol type at a time, including dust, sea salt, sulfate, and carbonaceous aerosols. Additionally, the average OMB bias and BTD between the CTRL experiment and the single aerosol experiments were analyzed. To better highlight the improvement effects of different aerosol types, the OMB and BTD calculations in Figure 8 and Figure 9 are based on the high-value regions corresponding to each aerosol type. The results are shown in Figure 8 and Figure 9.
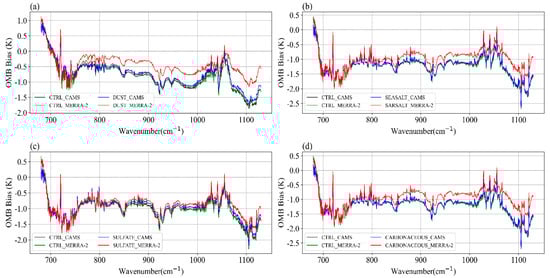
Figure 8.
Comparison of OMB bias between the CTRL and AER experiments in the 680–1130 cm⁻1 region for GIIRS, including the contributions of four aerosol types: (a) dust, (b) sea salt, (c) sulfates, and (d) carbonaceous. The calculation regions are averaged within the respective high-quality aerosol density regions for the four aerosol types from both the CAMS and MERRA-2, highlighting the areas with significant aerosol presence for each type.
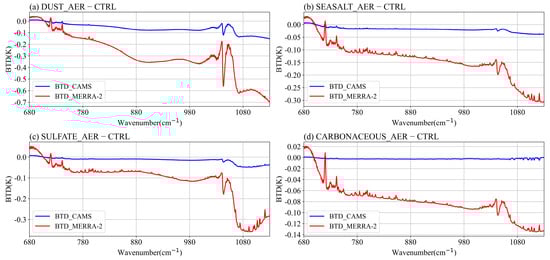
Figure 9.
Comparison of BTD between the CTRL and AER experiments in the 680–1130 cm⁻1 region for GIIRS, including the contributions of four aerosol types: (a) dust, (b) sea salt, (c) sulfates, and (d) carbonaceous aerosols. The calculation regions are averaged within the respective high-quality aerosol density regions for the four aerosol types from both the CAMS and MERRA-2, highlighting the areas with significant aerosol presence for each type.
As shown in Figure 8a, after incorporating dust in ARMS, the MERRA-2 dataset’s dust led to an average BT decrease of 0.28 K, while the CAMS data caused a decrease of 0.06 K. The average OMB improvements were 0.06 K for the CAMS and 0.34 K for the MERRA-2. The improvement in the MERRA-2 dataset is more significant than that in the CAMS, which can be attributed to the larger coverage area of dust in the MERRA-2 data compared to the CAMS data. Figure 8b shows that, in the high-value region for sea salt, the average OMB bias improvement for the CAMS and MERRA-2 is 0.02 K and 0.24 K, respectively, with the MERRA-2 showing a greater improvement than the CAMS. As seen in Figure 8c,d, the improvements after incorporating sulfate and carbonaceous aerosols in the MERRA-2 data are more pronounced than in the CAMS data. Specifically, the average OMB bias improvements for sulfate are 0.13 K for the MERRA-2 and 0.06 K for the CAMS, while for carbonaceous aerosols, the improvements are 0.31 K for the MERRA-2 and 0.03 K for the CAMS.
A comprehensive analysis of the results for different aerosol types shows that the dust aerosol datasets from both the CAMS and MERRA-2 have the largest impact on BT simulations in the infrared window region, exhibiting the strongest cooling effect and the most significant improvement. This is primarily because dust aerosols have larger particle sizes and columnar mass densities compared to other aerosol types, allowing them to block a portion of the radiation emitted from the Earth’s surface. For other aerosol types, their impact on BT simulations is more limited due to their relatively smaller particle sizes and extinction coefficients. The improvement effect is largest for sea salt, followed by that for sulfate, and the smallest effect is seen for carbonaceous aerosols. However, there are some exceptions where the inclusion of aerosols does not always improve the OMB bias. For example, the improvement in the CO2 channel is not significant, possibly because the channels affected by aerosols are mainly concentrated in the infrared window region. Furthermore, the improvements observed in the four MERRA-2 experiments are consistently better than those in the CAMS experiment.
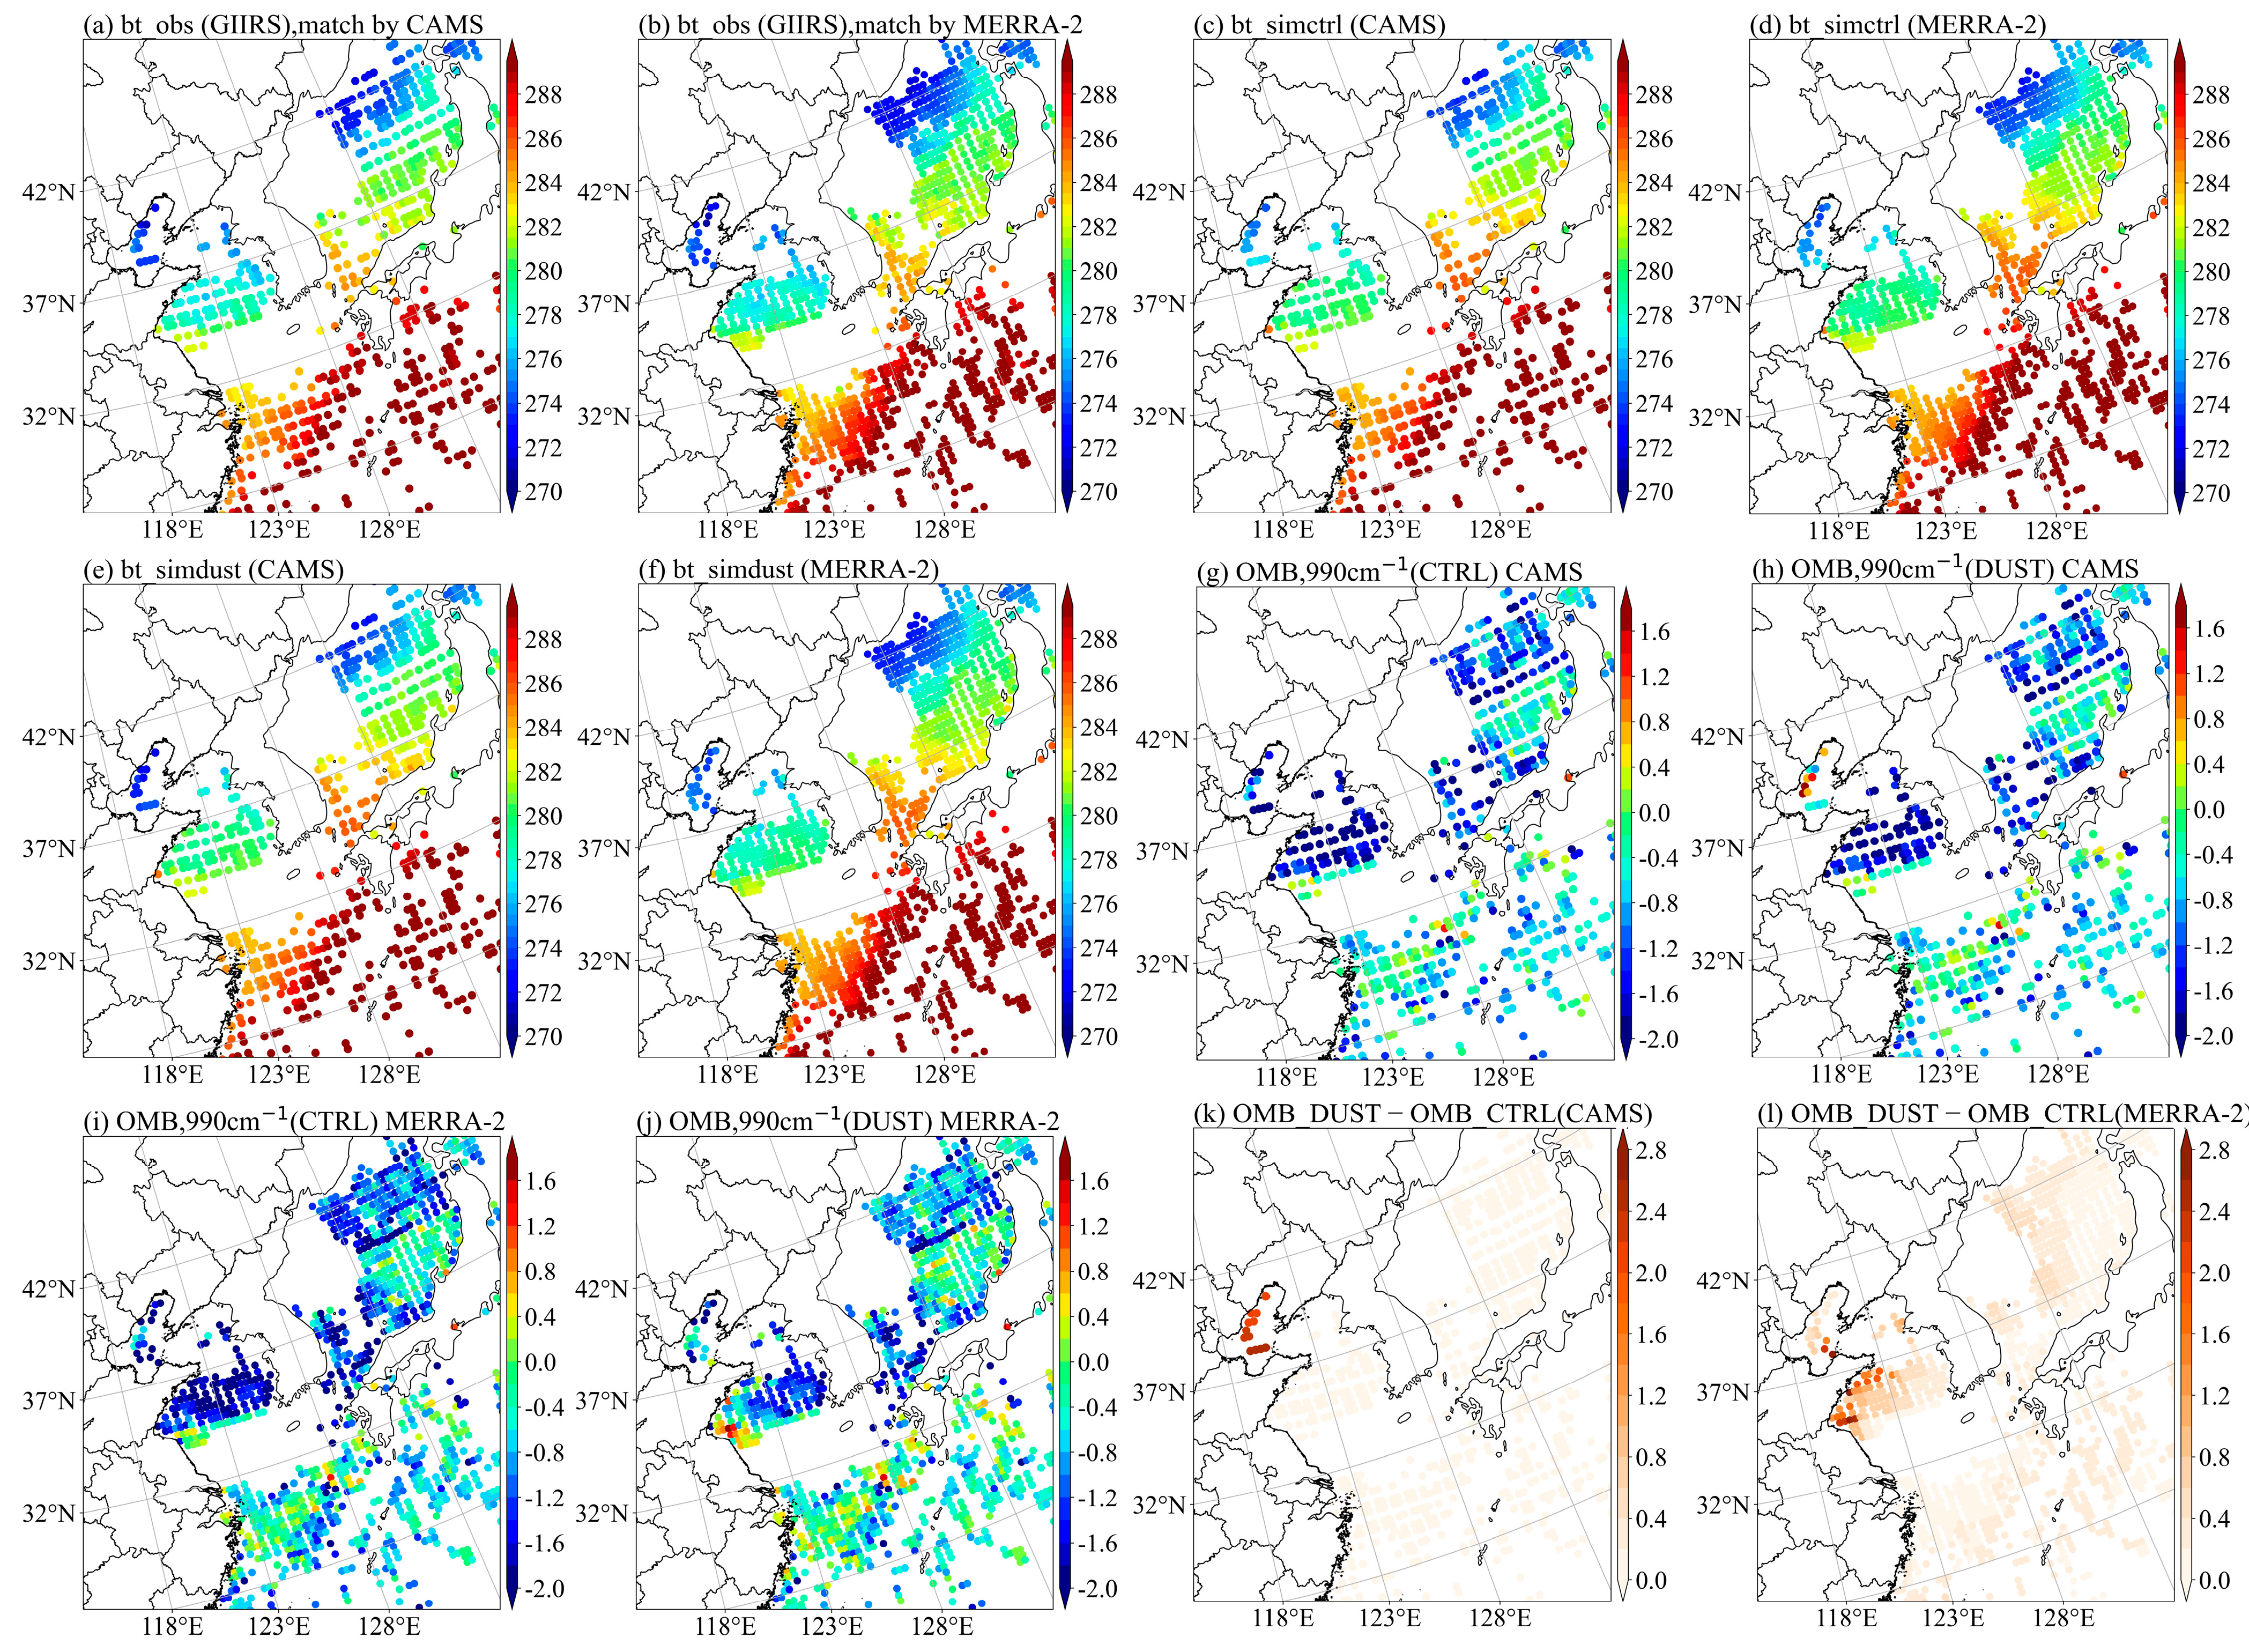
Figure 10 illustrates the correspondence between the regions of improvement for dust aerosols in the CAMS and MERRA-2 and the areas of high aerosol column mass density. The aerosol activity over ocean grid points provides an excellent opportunity to compare the differences in OMB bias. Here, the window channel at 990 cm⁻1, which shows significant improvement in the OMB bias, is chosen as a representative example. Specifically, the dust aerosol is analyzed in the region affected by the dust storm, 27–45°N and 118–135°E.
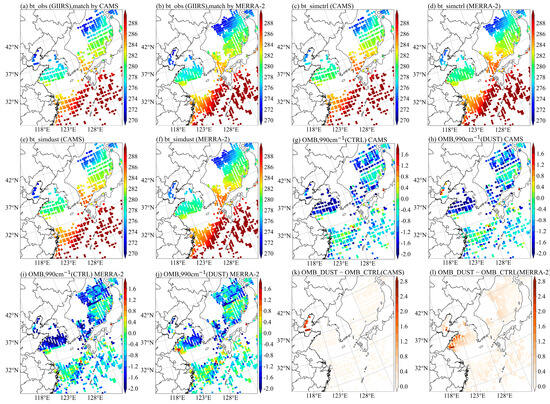
Figure 10.
(a,b) show the observed BT from FY-4B/GIIRS level 1. (c,d) display simulated BT under clear sky without aerosols. (e,f) present simulated BT with dust aerosols from CAMS and MERRA-2. (g,j) illustrate the OMB comparison between the aerosol experiments and the CTRL experiment for both datasets. (k,l) show the bias between OMB and CTRL after incorporating dust aerosols from CAMS and MERRA-2. The red-bordered areas highlight regions affected by dust storms, where significant improvements in OMB are observed. All panels focus on high column mass density regions for the dust aerosol at the 990 cm⁻1 channel on 10 April 2023.
Figure 10a,b show that the pixels near the land areas of the Bohai Sea, the northwestern part of the Yellow Sea near the land, and the northwestern part of the Japan Sea near the northern Japanese land all exhibit a lower observed BT from the GIIRS. As shown in Figure 3, this decrease in observed BT is attributed to the influence of dust storms. In contrast, Figure 10c,d show that, under clear-sky conditions and without aerosols in the ARMS, the simulated BT in dust-affected regions is warmer compared to the observed BT. This is because dust aerosols have strong absorption and scattering effects, especially during dust storms, where aerosols lead to cooling of the surface and atmosphere. Since the model does not account for this aerosol effect, the simulated BT in the dust-affected regions tends to be higher than the actual observed values. Figure 10e,f show that, after incorporating aerosols into the ARMS, the simulated BT in dust-impacted regions decreases, aligning more closely with the observed BT, particularly with that of the MERRA-2 reanalysis data. However, the CAMS slightly overestimates the dust aerosol mass density in certain pixels near the Bohai Sea, leading to an underestimation of the simulated BT in these areas. Figure 10k,l show that, in areas impacted by dust storms, the average OMB bias improvement for the dust aerosols in the CAMS and MERRA-2 is 0.1 K and 0.37 K, respectively, with maximum improvements of 2.54 K and 2.76 K. Compared to the CTRL, the standard deviation decreases by 0.01 and 0.03, respectively, corresponding to the regions of high dust column mass density shown in Figure 5c,d. However, along the coastal edge of the Bohai Sea, the MERRA-2 shows larger discrepancies, which could be due to the overestimation of the dust aerosol mass density in this region, leading to an underestimation of the BT ine simulation. Despite the CAMS overestimating in the coastal areas near the Bohai Sea, it underestimates the aerosol column mass density of dust in the central Bohai Sea, the Yellow Sea, and the northwest part of the Sea of Japan. This is consistent with the findings from Ukhov et al. [54] and Cuevas et al. [63], who evaluated the MERRA-2 and CAMS reanalysis data and found that the MERRA-2 overestimated the PM10 by approximately 1.2 times, while the CAMS underestimated the PM10 by about 1.5 times on an annual average, with dust aerosols being the major component of PM10. Additionally, compared to the AERONET aerosol volume size distribution, the CAMS underestimated the volume of coarse dust particles with radii between 0.9–20 μm [54]. Therefore, the CAMS tends to underestimate the aerosol mass density in most dust-affected regions, leading to smaller improvements in the average OMB bias compared to the MERRA-2.
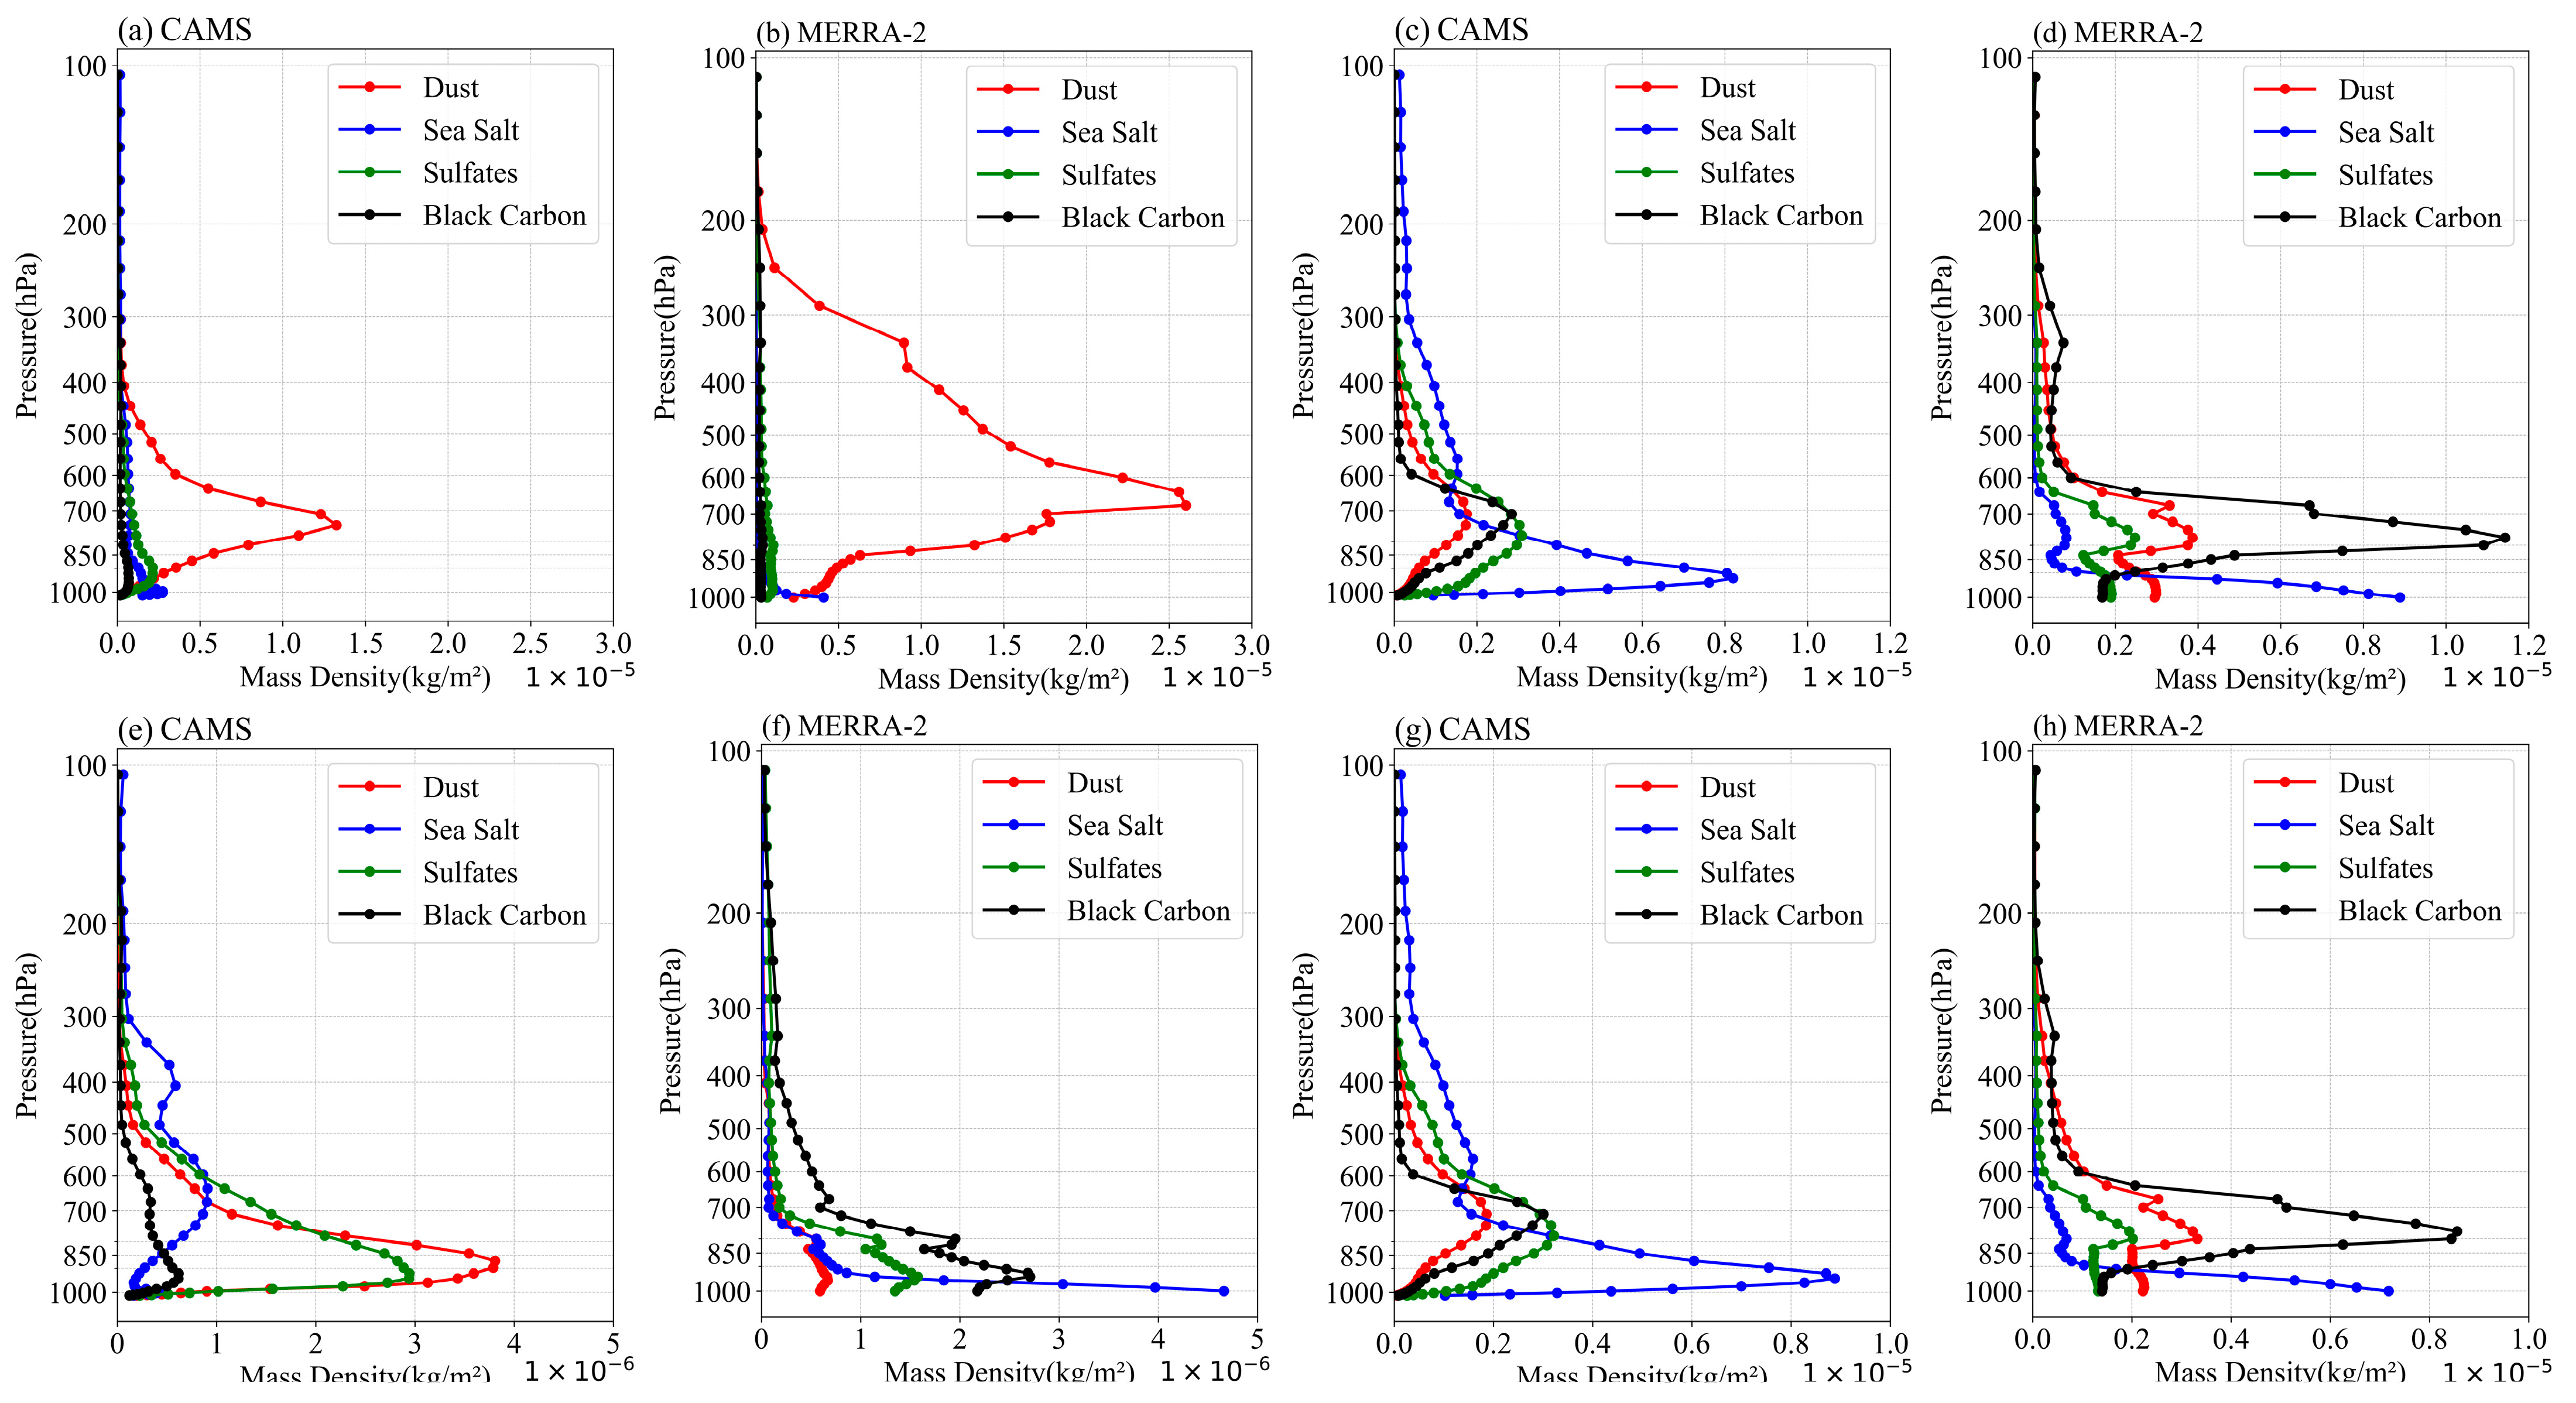
To further explain the differences in OMB bias improvements after the inclusion of different aerosol types in the MERRA-2 and CAMS, Figure 11 plots the vertical average profiles of the aerosol column mass density for the high column mass density regions corresponding to various aerosol types in the MERRA-2 and CAMS, as included in ARMS. Figure 11b,d show the average aerosol mass density profiles across all aerosol layers within the high column mass density regions in the dust areas. It is apparent that there are differences in the altitude of the peak dust layer between the CAMS and MERRA-2. In the CAMS, the peak dust layer is located at 750 hPa, whereas in the MERRA-2, it is at 680 hPa, with the MERRA-2’s peak dust layer being at a higher altitude compared to that of the CAMS. In terms of sensitivity to the peak dust layer height, the magnitude of the BT cooling effect decreases as the peak layer altitude lowers. A lower peak height results in a warmer BT, which leads to a smaller OMB improvement. Additionally, the aerosol peak load in the MERRA-2 is greater than that in the CAMS. This is partly due to its thicker aerosol layer, which can block more infrared radiation emitted from the layers below the dust peak. [26]. The MERRA-2 has broader dust coverage, and its peak dust layer is higher and thicker and has a higher column mass density, resulting in more significant OMB bias improvements than the CAMS.
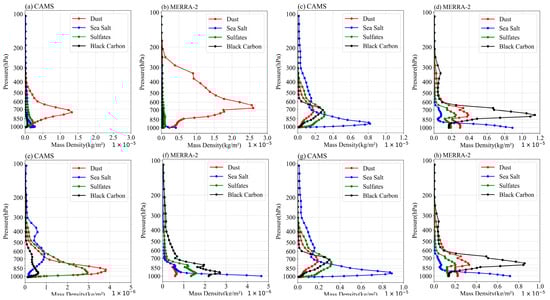
Figure 11.
The aerosol mass density profiles, averaged within their respective high-quality density regions for the four aerosol types from CAMS and MERRA-2, are compared in the following panels: (a,b) dust region, (c,d) sea salt region, (e,f) sulfate region, and (g,h) carbonaceous region.
Since the regions of high aerosol column mass density differ for different aerosols, it is necessary to analyze the average OMB bias for each specific high column mass density region. In addition to the regions impacted by dust storms, this study also analyzed the OMB bias in the high column mass density areas of other aerosol types. Specifically, the sea salt aerosol is analyzed in the region of 4–23°N, 100–118°E; sulfate in the region of 3–45°N, 85–126°E; and carbonaceous aerosol in the region of 5–23°N, 101–118°E.
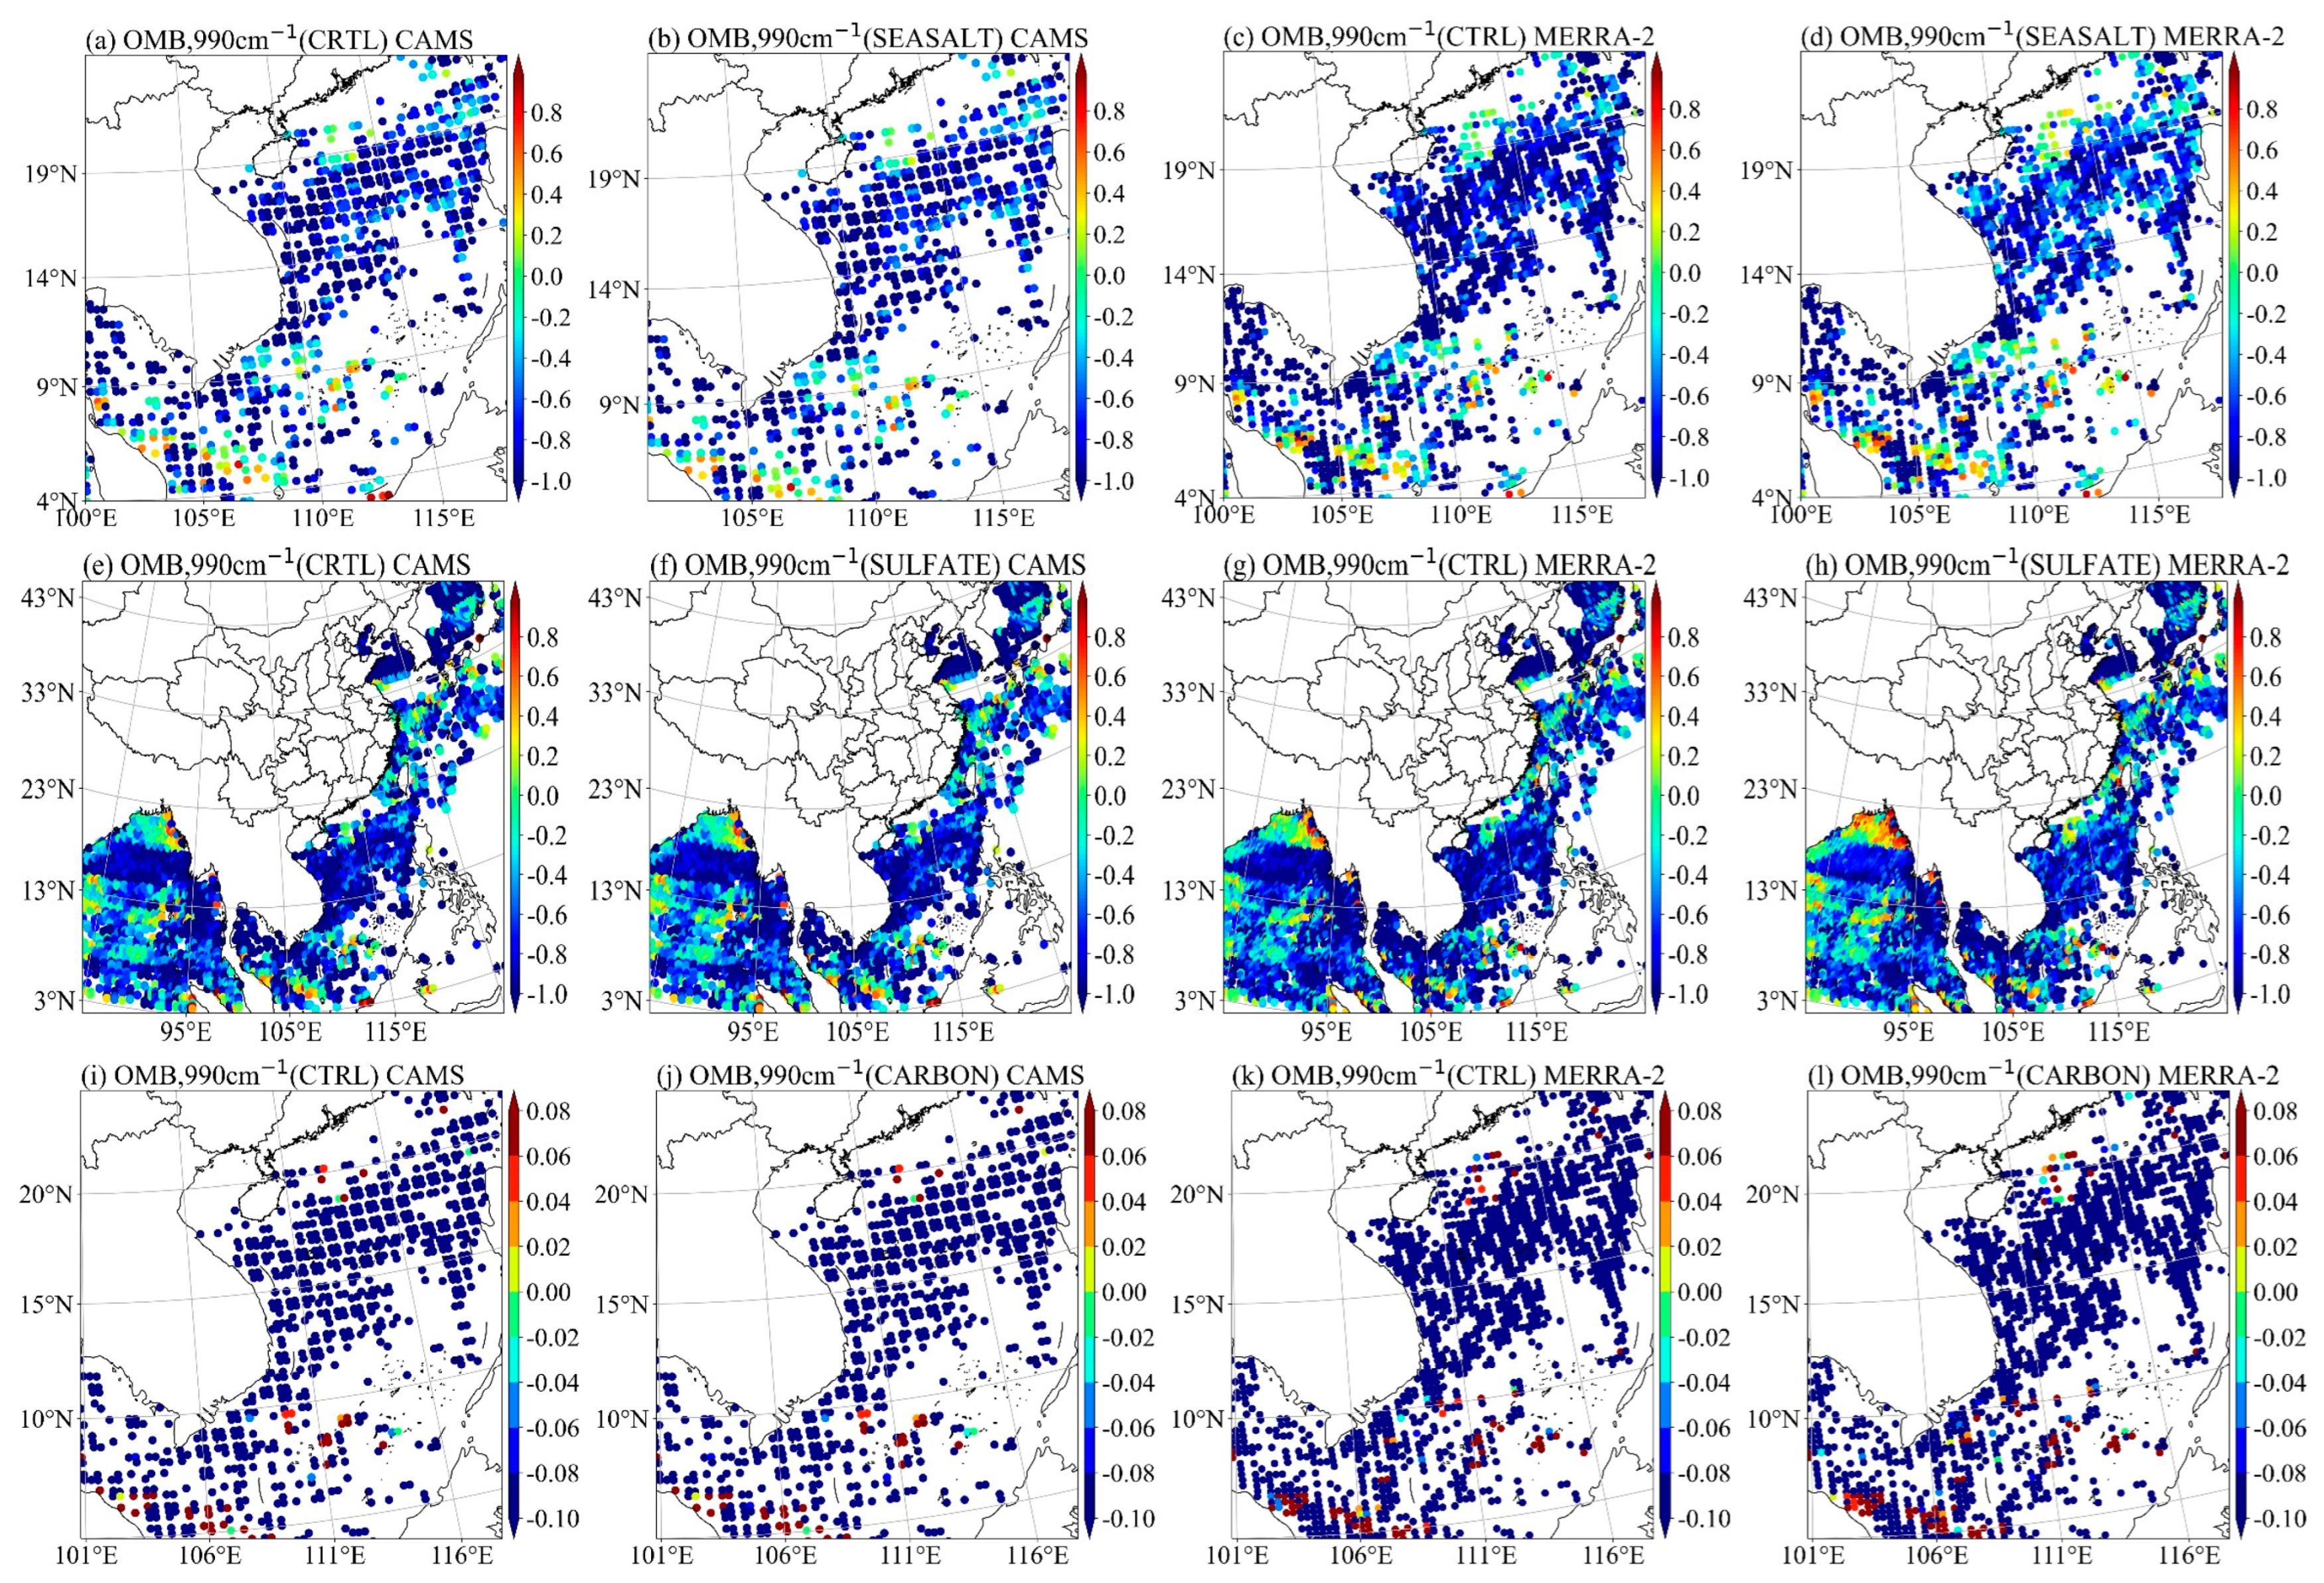
As shown in Figure 5e,f, along with Figure 12a–d and Figure 13a,b, the column mass density of sea salt aerosols is relatively higher in the South China Sea and the Gulf of Thailand. The maximum OMB improvements in these areas for the CAMS and MERRA-2 were 0.06 K and 0.36 K, respectively. Although Figure 5e,f show that the maximum column mass density of sea salt in the CAMS data is twice that of the MERRA-2 data, the column mass density of sea salt aerosols in the MERRA-2 data is greater than in the CAMS data in most of the South China Sea and Gulf of Thailand regions. This is due to the CAMS underestimating the volume of coarse sea salt particles with radii between 9–20 μm [54], leading to better BT simulation results in the MERRA-2, which are closer to the GIIRS-observed BT and thus exhibit superior improvements in OMB bias. Based on the analysis of Figure 11c,d, the peak altitude of sea salt in the MERRA-2 data is primarily located at 1000 hPa, with a column mass density of 8 × 10⁻⁶ kg/m2, indicating a higher column mass density of sea salt near the ocean surface. In contrast, the peak layer in the CAMS data is found at 870 hPa, with a maximum column mass density of 3.4 × 10⁻⁶ kg/m2, reflecting a relatively lower column mass density of sea salt aerosols near the surface. Although the peak aerosol layer in the CAMS data is positioned at a higher altitude than in the MERRA-2 data, the mass loading at the peak is smaller in the CAMS data. Consequently, the MERRA-2 demonstrates better OMB improvements.
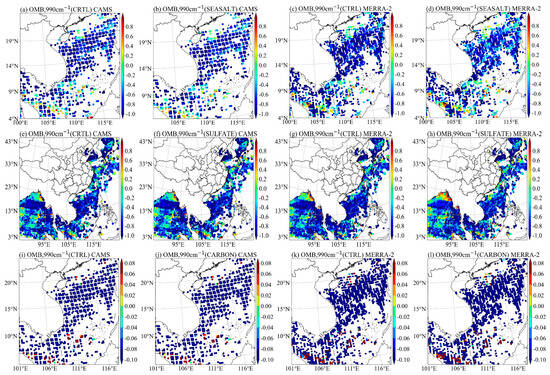
Figure 12.
Spatial comparison of OMB between the aerosol experiments and the CTRL experiment for CAMS and MERRA-2, focusing on high column mass density regions of the other three aerosol types at the 990 cm⁻1 channel on 10 April 2023: (a–d) sea salt region, (e–h) sulfate region, and (i–l) carbonaceous region.
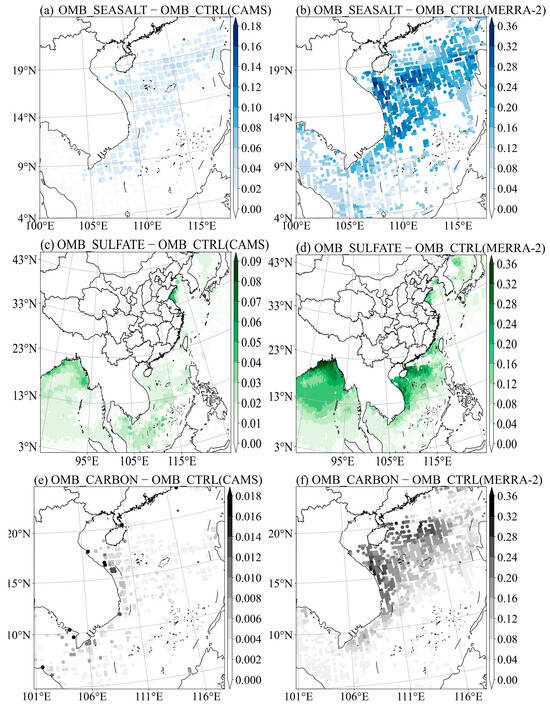
Figure 13.
Bias between OMB and CTRL after incorporating different aerosol types from MERRA-2 and CAMS. (a,b) Sea salt, (c,d) sulfate, (e,f) carbonaceous aerosols.
For sulfate aerosols, the primary areas of improvement are the Yellow Sea and Bay of Bengal. As shown in Figure 12e–h and Figure 13c,d, the MERRA-2 shows better performance than the CAMS in the Yellow Sea and southern Bay of Bengal, with an average improvement of 0.01 K. However, in the northern Bay of Bengal, negative improvement is observed, as shown in Figure 5g,h. The MERRA-2 overestimates the sulfate column mass density in this region compared to the CAMS, leading to excessively low BT simulations and larger OMB biases when considering sulfate aerosols in ARMS. The CAMS performs better in the northern Bay of Bengal, whereas, in the Yellow Sea, which is affected by dust storms, the MERRA-2 shows a higher sulfate column mass density than the CAMS. The CAMS underestimates the sulfate aerosol mass in this region; thus, the MERRA-2 demonstrates better OMB improvement than the CAMS. This is consistent with the findings of Huang et al. in their studies on long-range dust transport events in 2018 and 2020, where the CAMS underestimated sulfate aerosol concentrations compared to actual observations [64].
In the Gulf of Thailand, as shown in Figure 12i–l and Figure 13e,f, the MERRA-2 exhibits more pronounced improvements for carbonaceous aerosols compared to the CAMS, attributed to its higher and broader column mass density distribution. Figure 11g,h further show that, while the peak layers of carbonaceous aerosols are consistent between the datasets, the MERRA-2’s aerosol column mass density at the peak is four times greater than in the CAMS, resulting in superior performance.
5. Discussion and Conclusions
Accurate aerosol measurements are crucial for the precision of BT simulations. Therefore, this study incorporates different aerosol reanalysis datasets into ARMS to compare their effects on FY-4B/the GIIRS BT simulations and improvements in OMB biases. Three experiments were designed: experiment 1 was a baseline reference experiment conducted without incorporating aerosol, while experiments 2 and 3 included aerosol data from the MERRA-2 and CAMS, respectively, to compare and quantitatively evaluate their effects on BT simulations. Additionally, the experiments further compared and analyzed the impact of different aerosol types from the MERRA-2 and CAMS on BT simulations. The main conclusions are as follows.
After incorporating all aerosol types (dust, sea salt, sulfate, and carbonates) into the MERRA-2, the average improvement (0.56 K) was significantly higher than that of the CAMS (0.11 K), with the most notable improvements observed in the long-wave infrared window channels between 750 cm⁻1 and 1130 cm⁻1. Significant OMB improvements were found in regions with a high aerosol mass density, especially around the Bohai Sea, Bohai Strait, and Sea of Japan. While the MERRA-2 outperformed the CAMS in many areas, it showed larger biases (up to 2 K) in certain regions, such as small areas of the South China Sea and the northern Bay of Bengal, where the CAMS did not exhibit similar large OMB biases.
Dust aerosols have the most significant impact on BT simulations. After incorporating the MERRA-2 dust aerosols, the OMB bias improvement (with an average improvement of 0.17 K) was superior to that of the CAMS (with an average improvement of 0.06 K). Due to their larger particle size and higher column mass density, dust aerosols block more infrared radiation emitted upwards from the surface, exhibiting the strongest cooling effect, which reaches up to 0.35 K. For other aerosol types, the impact on BT simulations is more limited, likely due to their relatively smaller particle sizes and extinction coefficients. Overall, dust aerosols, with their larger particle sizes and higher column mass densities, have the strongest radiative impact, and the MERRA-2 consistently outperforms the CAMS in terms of improvement across all aerosol types.
The difference in the peak aerosol level, aerosol thickness, and column mass density significantly influences the OMB improvement. Specifically, the peak altitude of the dust layer in the MERRA-2 dataset is at a higher altitude (680 hPa) compared to that of the CAMS (750 hPa). Due to its higher column mass density, greater aerosol layer thickness, and broader spatial coverage, the MERRA-2 results in a more substantial improvement in the OMB bias in dust regions, with an average improvement of 0.37 K and a maximum of 2.76 K. In comparison, the CAMS shows an average improvement of 0.1 K and a maximum of 2.54 K. For other aerosol types, the regions of improvement for sea salt and carbonates are mainly observed in the South China Sea and the Bay of Bengal, respectively. However, the MERRA-2 also shows better performance in these areas compared to the CAMS. Regarding sulfate aerosols, the MERRA-2 performs better in the Bohai Strait and southern Bay of Bengal, while the CAMS shows superior results in the northern Bay of Bengal.
These findings provide valuable guidance for local or regional studies, particularly in selecting the most suitable data source. For regions frequently affected by dust storms, the MERRA-2 demonstrates clear advantages, offering a more accurate capture of aerosol characteristics and significantly improving BT simulations. In contrast, for regions involving multiple aerosol types (such as sea salt, sulfate, and carbonaceous aerosols), both the CAMS and MERRA-2 have their respective strengths. Therefore, when choosing the appropriate data source, researchers should carefully balance the specific requirements of their studies.
On a global scale, despite differences in the statistical characteristics of aerosol simulations from the CAMS and MERRA-2, both datasets are considered suitable for use, particularly in global climate studies or atmospheric composition analyses. Given the differences in performance for various aerosol types (e.g., dust, sea salt, sulfate, and carbonaceous aerosols), combining the strengths of both datasets could further enhance the accuracy of BT simulation.
These key findings offer important insights for aerosol assimilation and retrieval studies, especially concerning quality control and bias correction methods in aerosol data assimilation. If observational data under conditions such as haze or dust storms are assimilated as clear-sky observations (i.e., neglecting aerosol effects), this may lead to significant OMB biases in BT simulations. Additionally, BT simulations influenced by aerosols may introduce biases into the RTM used in physics-based inversion methods, thereby compromising the accuracy and reliability of atmospheric temperature and humidity retrievals. Furthermore, this study reveals the quantitative relationships between the aerosol column mass density, the peak aerosol concentration, and BT simulations, providing a scientific basis for optimizing the sensitivity of retrieval algorithms to aerosol radiative effects. As such, this work not only offers guidance for future aerosol assimilation and retrieval studies through the use of accurate aerosol datasets, but also lays the foundation for integrating aerosol radiative properties into NWP systems.
Author Contributions
Conceptualization, W.P. and F.W.; methodology, W.P. and F.W.; validation, F.W. and C.Y.; writing—original draft preparation, W.P.; writing—review and editing, F.W. All authors have read and agreed to the published version of the manuscript.
Funding
This research is supported by the Hunan Provincial Natural Science Foundation of China (grant2021JC0009), the National Natural Science Foundation of China (grantU2142212).
Data Availability Statement
The Modern-Era Retrospective Analysis for Research and Applications, Version 2 (MERRA-2) reanalysis data sets are publicly available online through the Goddard Earth Sciences Data and Information Services Center (GES DISC; https://disc.gsfc.nasa.gov/, accessed on 25 December 2024). ECMWF Reanalysis (ERA5) is obtained at (10.24381/cds.bd0915c6 and 10.24381/cds.e2161bac, accessed on 25 December 2024). FY-4B/GIIRS dataset can be requested from the National Satellite Meteorological Center of the China Meteorological Administration for their technical support in data provision (https://satellite.nsmc.org.cn/portalsite/default.aspx,accessed on 25 December 2024). The CAMS (Copernicus Atmosphere Monitoring Service) aerosol reanalysis data were downloaded from the CDS (https://www.ecmwf.int/en/forecasts/dataset/cams-global-reanalysis, accessed on 25 December 2024).
Acknowledgments
We also would like to thank the anonymous reviewers for their valuable comments and suggestions, which helped to greatly improve the scientific content and quality of this article.
Conflicts of Interest
The authors declare no conflicts of interest.
Abbreviations
The following abbreviations are used in this manuscript:
| AOD | Aerosol Optical Depth |
| AHI | Advanced Himawari Imager |
| AERONET | Aerosol Robotic network |
| AVHRR | Advanced Very High Resolution Radiometer |
| ARMS | Advanced Radiative Transfer Modeling System |
| ARIES | Airborne Research Interferometer Evaluation System |
| BT | Brightness Temperature |
| CAMS | Copernicus Atmosphere Monitoring Service |
| ERA5 | the fifth generation ECMWF atmospheric reanalysis |
| ECMWF | European Centre for Medium-Range Weather Forecasts |
| FOR | Field of Regard |
| GSI | Gridpoint Statistical Interpolation |
| GEOS-5 | Goddard Earth Observing System, Version 5 |
| MODIS | Moderate Resolution Imaging Spectroradiometer |
| MISR | Multi-angle Imaging Spectroradiometer |
| NWP | Numerical Weather Prediction |
| NOAA | National Oceanic and Atmospheric Administration |
| OMB | Observation Minus Background |
| RTM | Radiative Transfer Model |
| VIIRS | Visible Infrared Imaging Radiometer Suite |
References
- Hong, S.-Y.; Dudhia, J. Next-Generation Numerical Weather Prediction: Bridging Parameterization, Explicit Clouds, and Large Eddies. Bull. Am. Meteorol. Soc. 2012, 93, ES6–ES9. [Google Scholar] [CrossRef]
- Bauer, P.; Thorpe, A.; Brunet, G. The Quiet Revolution of Numerical Weather Prediction. Nature 2015, 525, 47–55. [Google Scholar] [CrossRef] [PubMed]
- Baklanov, A.; Schlünzen, K.; Suppan, P.; Baldasano, J.; Brunner, D.; Aksoyoglu, S.; Carmichael, G.; Douros, J.; Flemming, J.; Forkel, R.; et al. Online Coupled Regional Meteorology Chemistry Models in Europe: Current Status and Prospects. Atmos. Chem. Phys. 2014, 14, 317–398. [Google Scholar] [CrossRef]
- Chaohua, D. A Review of Optimal Algorithm for Physical Retrieval of Atmospheric Profiles. Adv. Earth Sci. 2010, 25, 133–139. [Google Scholar]
- Ackerman, A.S.; Toon, O.B.; Stevens, D.E.; Heymsfield, A.J.; Ramanathan, V.; Welton, E.J. Reduction of Tropical Cloudiness by Soot. Science 2000, 288, 1042–1047. [Google Scholar] [CrossRef] [PubMed]
- Coakley, J.A.; Cess, R.D.; Yurevich, F.B. The Effect of Tropospheric Aerosols on the Earth’s Radiation Budget: A Parameterization for Climate Models. J. Atmos. Sci. 1983, 40, 116–138. [Google Scholar] [CrossRef]
- Albrecht, B.A. Aerosols, Cloud Microphysics, and Fractional Cloudiness. Science 1989, 245, 1227–1230. [Google Scholar] [CrossRef]
- Forster, P.; Ramaswamy, V.; Artaxo, P.; Berntsen, T.; Betts, R.; Fahey, D.W.; Haywood, J.; Lean, J.; Lowe, D.C.; Raga, G.; et al. Solomon, S., Qin, D., Manning, M., Chen, Z., Marquis, M., Averyt, K.B., Tignor, M., Miller, H.L., Eds.; Changes in Atmospheric Constituents and in Radiative Forcing. In Climate Change 2007: The Physical Science Basis. Contribution of Working Group I to the Fourth Assessment Report of the Intergovernmental Panel on Climate Change; Changes in Atmospheric Constituents and in Radiative Forcing; Cambridge University Press: Cambridge, UK, 2007; Chapter 2; pp. 131–234. [Google Scholar]
- Zhang, H.; Liu, L.; Bi, L.; Lin, W.; Liu, C.; Yi, B.; Liu, L.; Chen, Q.; Wei, X.; Letu, H.; et al. Advances in Atmospheric Radiation: Theories, Models, and Their Applications. Part I: Atmospheric Gas Absorption and Particle Scattering. J. Meteorol. Res. 2024, 38, 151–182. [Google Scholar] [CrossRef]
- Zhang, P.; Wang, C.; Chen, L.; Bai, W.; Qi, C.; Qi, J. Current Status of Satellite-Based Dust Aerosol Remote Sensing and Some Issues to Be Concerned. Meteorol. Mon. 2018, 44, 725–736. [Google Scholar] [CrossRef]
- Huang, X.; Ding, A. Aerosol as a Critical Factor Causing Forecast Biases of Air Temperature in Global Numerical Weather Prediction Models. Sci. Bull. 2021, 66, 1917–1924. [Google Scholar] [CrossRef]
- Whitaker, J.S.; Hamill, T.M.; Wei, X.; Song, Y.; Toth, Z. Ensemble Data Assimilation with the NCEP Global Forecast System. Mon. Weather Rev. 2008, 136, 463–482. [Google Scholar] [CrossRef]
- Collard, A.D.; McNally, A.P.; Hilton, F.I.; Healy, S.B.; Atkinson, N.C. The Use of Principal Component Analysis for the Assimilation of High-Resolution Infrared Sounder Observations for Numerical Weather Prediction. Q. J. R. Meteorol. Soc. 2010, 136, 2038–2050. [Google Scholar] [CrossRef]
- Dong, P.; Xue, J.; Huang, B.; Wang, D. Application Status and Development of Satellite Data Assimilation in Numerical Weather Forecast. Meteorol. Sci. Technol. 2008, 36, 1–7. [Google Scholar]
- Shi, G.; Wang, B.; Zhang, H.; Zhao, J.; Tan, S.; Wen, T. The Radiative and Climatic Effects of Atmospheric Aerosols. Chin. J. Atmos. Sci. 2008, 32, 826–840. [Google Scholar] [CrossRef]
- Petty, G. A First Course in Atmospheric Radiation. Available online: https://www.semanticscholar.org/paper/A-First-Course-in-Atmospheric-Radiation-Petty/57d0220e60cc76fd85c0c0a17a5759bceac11e8b (accessed on 26 June 2024).
- Weaver, C.J.; Joiner, J.; Ginoux, P. Mineral Aerosol Contamination of TIROS Operational Vertical Sounder (TOVS) Temperature and Moisture Retrievals. J. Geophys. Res. Atmos. 2003, 108, 4246. [Google Scholar] [CrossRef]
- Matricardi, M. The Inclusion of Aerosols and Clouds in RTIASI, the ECMWF Fast Radiative Transfer Model for the Infrared Atmospheric Sounding Interferometer. Available online: https://www.ecmwf.int/en/elibrary/75596-inclusion-aerosols-and-clouds-rtiasi-ecmwf-fast-radiative-transfer-model-infrared (accessed on 26 June 2024).
- Liu, Q.; Han, Y.; van Delst, P.; Weng, F. Modeling Aerosol Radiance for NCEP Data Assimilation. In Fourier Transform Spectroscopy/Hyperspectral Imaging and Sounding of the Environment; Paper HThA5; Optica Publishing Group: Washington, DC, USA, 2007. [Google Scholar]
- Marquis, J.W.; Oyola, M.I.; Campbell, J.R.; Ruston, B.C.; Córdoba-Jabonero, C.; Cuevas, E.; Lewis, J.R.; Toth, T.D.; Zhang, J. Conceptualizing the Impact of Dust-Contaminated Infrared Radiances on Data Assimilation for Numerical Weather Prediction. J. Atmos. Ocean. Technol. 2021, 38, 209–221. [Google Scholar] [CrossRef]
- Haywood, J.; Francis, P.; Osborne, S.; Glew, M.; Loeb, N.; Highwood, E.; Tanré, D.; Myhre, G.; Formenti, P.; Hirst, E. Radiative Properties and Direct Radiative Effect of Saharan Dust Measured by the C-130 Aircraft During SHADE: 1. Solar Spectrum. J. Geophys. Res. Atmos. 2003, 108, 8577. [Google Scholar] [CrossRef]
- Pierangelo, C.; Chédin, A.; Heilliette, S.; Jacquinet-Husson, N.; Armante, R. Dust Altitude and Infrared Optical Depth from AIRS. Atmos. Chem. Phys. 2004, 4, 1813–1822. [Google Scholar] [CrossRef]
- Peyridieu, S.; Chédin, A.; Tanré, D.; Capelle, V.; Pierangelo, C.; Lamquin, N.; Armante, R. Saharan Dust Infrared Optical Depth and Altitude Retrieved from AIRS: A Focus over North Atlantic—Comparison to MODIS and CALIPSO. Atmos. Chem. Phys. 2010, 10, 1953–1967. [Google Scholar] [CrossRef]
- Merchant, C.J.; Embury, O.; Le Borgne, P.; Bellec, B. Saharan Dust in Nighttime Thermal Imagery: Detection and Reduction of Related Biases in Retrieved Sea Surface Temperature. Remote Sens. Environ. 2006, 104, 15–30. [Google Scholar] [CrossRef]
- Quan, X.; Huang, H.-L.; Zhang, L.; Weisz, E.; Cao, X. Sensitive Detection of Aerosol Effect on Simulated IASI Spectral Radiance. J. Quant. Spectrosc. Radiat. Transf. 2013, 122, 214–232. [Google Scholar] [CrossRef]
- Wei, S.-W.; Lu, C.-H.; Johnson, B.T.; Dang, C.; Stegmann, P.; Grogan, D.; Ge, G.; Hu, M. The Influence of Aerosols on Satellite Infrared Radiance Simulations and Jacobians: Numerical Experiments of CRTM and GSI. Remote Sens. 2022, 14, 683. [Google Scholar] [CrossRef]
- Sun, H.; Wang, D.; Han, W.; Yang, Y. Quantifying the Impact of Aerosols on Geostationary Satellite Infrared Radiance Simulations: A Study with Himawari-8 AHI. Remote Sens. 2024, 16, 2226. [Google Scholar] [CrossRef]
- Hua, J.; Wang, Z.; Duan, J.; Li, L.; Zhang, C.; Wu, X.; Fan, Q.; Chen, R.; Sun, X.; Zhao, L.; et al. Review of Geostationary Interferometric Infrared Sounder. Chin. Opt. Lett. 2018, 16, 111203. [Google Scholar]
- Kim, J.; Akella, S.; da Silva, A.M.; Todling, R.; McCarty, W. Preliminary Evaluation of Influence of Aerosols on the Simulation of Brightness Temperature in the NASA’s Goddard Earth Observing System Atmospheric Data Assimilation System; Goddard Space Flight Center: Greenbelt, MD, USA, 2018. [Google Scholar]
- Wei, S.-W.; Lu, C.-H.; Liu, Q.; Collard, A.; Zhu, T.; Grogan, D.; Li, X.; Wang, J.; Grumbine, R.; Bhattacharjee, P.S. The Impact of Aerosols on Satellite Radiance Data Assimilation Using NCEP Global Data Assimilation System. Atmosphere 2021, 12, 432. [Google Scholar] [CrossRef]
- Eresmaa, R.; Letertre-Danczak, J.; Lupu, C.; Bormann, N.; McNally, A.P. The Assimilation of Cross-Track Infrared Sounder Radiances at ECMWF. Q. J. R. Meteorol. Soc. 2017, 143, 3177–3188. [Google Scholar] [CrossRef]
- Geer, A.J.; Migliorini, S.; Matricardi, M. All-Sky Assimilation of Infrared Radiances Sensitive to Mid- and Upper-Tropospheric Moisture and Cloud. Atmos. Meas. Tech. 2019, 12, 4903–4929. [Google Scholar] [CrossRef]
- Letertre-Danczak, J. The Use of Geostationary Radiance Observations at ECMWF and Aerosol Detection for Hyper-Spectral Infrared Sounders: 1st and 2nd Years Report. Available online: https://www.ecmwf.int/en/elibrary/79241-use-geostationary-radiance-observations-ecmwf-and-aerosol-detection-hyper (accessed on 1 July 2024).
- Ma, X.; Yan, P.; Zhao, T.; Jia, X.; Jiao, J.; Ma, Q.; Wu, D.; Shu, Z.; Sun, X.; Habtemicheal, B.A. Evaluations of Surface PM10 Concentration and Chemical Compositions in MERRA-2 Aerosol Reanalysis over Central and Eastern China. Remote Sens. 2021, 13, 1317. [Google Scholar] [CrossRef]
- Weng, F.; Yu, X.; Duan, Y.; Yang, J.; Wang, J. Advanced Radiative Transfer Modeling System (ARMS): A New-Generation Satellite Observation Operator Developed for Numerical Weather Prediction and Remote Sensing Applications. Adv. Atmos. Sci. 2020, 37, 131–136. [Google Scholar] [CrossRef]
- Yang, J.; Zhang, Z.; Wei, C.; Lu, F.; Guo, Q. Introducing the New Generation of Chinese Geostationary Weather Satellites, Fengyun-4. Bull. Am. Meteorol. Soc. 2017, 98, 1637–1658. [Google Scholar] [CrossRef]
- Bi, L.; Yang, P. Accurate Simulation of the Optical Properties of Atmospheric Ice Crystals with the Invariant Imbedding T-Matrix Method. J. Quant. Spectrosc. Radiat. Transf. 2014, 138, 17–35. [Google Scholar] [CrossRef]
- Tang, X.; Bi, L.; Lin, W.; Liu, D.; Zhang, K.; Li, W. Backscattering Ratios of Soot-Contaminated Dusts at Triple LiDAR Wavelengths: T-Matrix Results. Opt. Express 2019, 27, A92–A116. [Google Scholar] [CrossRef]
- Yang, P.; Liou, K.N. Geometric-Optics—Integral-Equation Method for Light Scattering by Nonspherical Ice Crystals. Appl. Opt. 1996, 35, 6568–6584. [Google Scholar] [CrossRef] [PubMed]
- Bi, L.; Lin, W.; Wang, Z.; Tang, X.; Zhang, X.; Yi, B. Optical Modeling of Sea Salt Aerosols: The Effects of Nonsphericity and Inhomogeneity. J. Geophys. Res. Atmos. 2018, 123, 543–558. [Google Scholar] [CrossRef]
- Lin, W.; Bi, L.; Dubovik, O. Assessing Superspheroids in Modeling the Scattering Matrices of Dust Aerosols. J. Geophys. Res. Atmos. 2018, 123, 13917–13943. [Google Scholar] [CrossRef]
- Gelaro, R.; McCarty, W.; Suárez, M.J.; Todling, R.; Molod, A.; Takacs, L.; Randles, C.A.; Darmenov, A.; Bosilovich, M.G.; Reichle, R.; et al. The Modern-Era Retrospective Analysis for Research and Applications, Version 2 (MERRA-2). J. Clim. 2017, 30, 5419–5454. [Google Scholar] [CrossRef] [PubMed]
- Kleist, D.T.; Parrish, D.F.; Derber, J.C.; Treadon, R.; Wu, W.-S.; Lord, S. Introduction of the GSI into the NCEP Global Data Assimilation System. Weather Forecast. 2009, 24, 1691–1705. [Google Scholar] [CrossRef]
- Molod, A.; Takacs, L.; Suarez, M.; Bacmeister, J. Development of the GEOS-5 Atmospheric General Circulation Model: Evolution from MERRA to MERRA2. Geosci. Model Dev. 2015, 8, 1339–1356. [Google Scholar] [CrossRef]
- Buchard, V.; da Silva, A.M.; Randles, C.A.; Colarco, P.; Ferrare, R.; Hair, J.; Hostetler, C.; Tackett, J.; Winker, D. Evaluation of the Surface PM2.5 in Version 1 of the NASA MERRA Aerosol Reanalysis over the United States. Atmos. Environ. 2016, 125, 100–111. [Google Scholar] [CrossRef]
- Qian, Z.; Zengxin, P.; Feiyue, M.; Ruixing, S.; Lin, Z.; Xin, L. Comparison and Verification of 3D Parameters of Aerosols Between CALIPSO and MERRA-2 in China. Infrared Laser Eng. 2020, 49, 20200350. [Google Scholar]
- Su, X.; Huang, Y.; Wang, L.; Cao, M.; Feng, L. Validation and Diurnal Variation Evaluation of MERRA-2 Multiple Aerosol Properties on a Global Scale. Atmos. Environ. 2023, 311, 120019. [Google Scholar] [CrossRef]
- Inness, A.; Ades, M.; Agustí-Panareda, A.; Barré, J.; Benedictow, A.; Blechschmidt, A.-M.; Dominguez, J.J.; Engelen, R.; Eskes, H.; Flemming, J.; et al. The CAMS Reanalysis of Atmospheric Composition. Atmos. Chem. Phys. 2019, 19, 3515–3556. [Google Scholar] [CrossRef]
- Ansari, K.; Ramachandran, S. Optical and Physical Characteristics of Aerosols over Asia: AERONET, MERRA-2 and CAMS. Atmos. Environ. 2024, 326, 120470. [Google Scholar] [CrossRef]
- Liu, H.; Yan, R.; Yang, J. Credibility and Statistical Characteristics of CAMSRA and MERRA-2 AOD Reanalysis Products over the Sichuan Basin During 2003–2018. Atmos. Environ. 2021, 244, 117980. [Google Scholar] [CrossRef]
- Morcrette, J.-J.; Boucher, O.; Jones, L.; Salmond, D.; Bechtold, P.; Beljaars, A.; Benedetti, A.; Bonet, A.; Kaiser, J.W.; Razinger, M.; et al. Aerosol Analysis and Forecast in the European Centre for Medium-Range Weather Forecasts Integrated Forecast System: Forward Modeling. J. Geophys. Res. Atmos. 2009, 114, D06206. [Google Scholar] [CrossRef]
- Mangold, A.; De Backer, H.; Delcloo, A.; De Paepe, B.; Dewitte, S.; Chiapello, I.; Derimian, Y.; Kacenelenbogen, M.; Léon, J.-F.; Huneeus, N.; et al. Aerosol Analysis and Forecast in the ECMWF Integrated Forecast System: Evaluation by Means of Case Studies. In Air Pollution Modeling and Its Application XXI; Steyn, D.G., Trini Castelli, S., Eds.; Springer: Dordrecht, The Netherlands, 2012; pp. 525–528. [Google Scholar]
- Schmit, T.J.; Li, J.; Ackerman, S.A.; Gurka, J.J. High-Spectral- and High-Temporal-Resolution Infrared Measurements from Geostationary Orbit. J. Atmos. Ocean. Technol. 2009, 26, 2273–2292. [Google Scholar] [CrossRef]
- Ukhov, A.; Mostamandi, S.; da Silva, A.; Flemming, J.; Alshehri, Y.; Shevchenko, I.; Stenchikov, G. Assessment of Natural and Anthropogenic Aerosol Air Pollution in the Middle East Using MERRA-2, CAMS Data Assimilation Products, and High-Resolution WRF-Chem Model Simulations. Atmos. Chem. Phys. 2020, 20, 9281–9310. [Google Scholar] [CrossRef]
- Ou, Y.; Li, Z.; Chen, C.; Zhang, Y.; Li, K.; Shi, Z.; Dong, J.; Xu, H.; Peng, Z.; Xie, Y.; et al. Evaluation of MERRA-2 Aerosol Optical and Component Properties over China Using SONET and PARASOL/GRASP Data. Remote Sens. 2022, 14, 821. [Google Scholar] [CrossRef]
- Errera, Q.; Bennouna, Y.; Schulz, M.; Eskes, H.J.; Basart, S.; Benedictow, A.; Blechschmidt, A.-M.; Chabrillat, S.; Clark, H.; Cuevas, E.; et al. Validation Report of the CAMS Global Reanalysis of Aerosols and Reactive Gases, Years 2003–2020; Copernicus: Göttingen, Germany, 2021. [Google Scholar] [CrossRef]
- Kong, Y.-W.; Sheng, L.-F.; Liu, Q.; Li, X.-Z. Impact of Marine-Atmospheric Process on Aerosol Number Size Distribution in the South China Sea. Environ. Sci. 2016, 37, 2443–2452. [Google Scholar]
- Shukla, G.; Ojha, N.; Kumar, A.; Harithasree, S.; Girach, I.; Sahu, L.K. Chemical Composition of Aerosols over the Arabian Sea Based on Global Reanalyses Data and On-Board Ship Measurements. Atmos. Environ. 2025, 347, 121085. [Google Scholar] [CrossRef]
- Gueymard, C.A.; Yang, D. Worldwide Validation of CAMS and MERRA-2 Reanalysis Aerosol Optical Depth Products Using 15 Years of AERONET Observations. Atmos. Environ. 2020, 225, 117216. [Google Scholar] [CrossRef]
- Chen, J.; Shi, X.; Wen, M. Applicability of ERA5 Surface Wind Speed Data in the Region of “Two Oceans and One Sea”. Meteormon 2023, 49, 39–51. [Google Scholar] [CrossRef]
- Alkhalidi, M.; Al-Dabbous, A.; Al-Dabbous, S.; Alzaid, D. Evaluating the Accuracy of the ERA5 Model in Predicting Wind Speeds Across Coastal and Offshore Regions. J. Mar. Sci. Eng. 2025, 13, 149. [Google Scholar] [CrossRef]
- Niu, Z.; Zhang, L.; Han, Y.; Dong, P.; Huang, W. Performances Between the FY-4A/GIIRS and FY-4B/GIIRS Long-Wave InfraRed (LWIR) Channels Under Clear-Sky and All-Sky Conditions. Q. J. R. Meteorol. Soc. 2023, 149, 1612–1628. [Google Scholar] [CrossRef]
- Cuevas, E.; Camino, C.; Benedetti, A.; Basart, S.; Terradellas, E.; Baldasano, J.M.; Morcrette, J.J.; Marticorena, B.; Goloub, P.; Mortier, A.; et al. The MACC-II 2007–2008 Reanalysis: Atmospheric Dust Evaluation and Characterization over Northern Africa and the Middle East. Atmos. Chem. Phys. 2015, 15, 3991–4024. [Google Scholar] [CrossRef]
- Huang, W.-S.; Griffith, S.M.; Lin, Y.-C.; Chen, Y.-C.; Lee, C.-T.; Chou, C.C.-K.; Chuang, M.-T.; Wang, S.-H.; Lin, N.-H. Satellite-Based Emission Inventory Adjustments Improve Simulations of Long-Range Transport Events. Aerosol Air Qual. Res. 2021, 21, 210121. [Google Scholar] [CrossRef]


Disclaimer/Publisher’s Note: The statements, opinions and data contained in all publications are solely those of the individual author(s) and contributor(s) and not of MDPI and/or the editor(s). MDPI and/or the editor(s) disclaim responsibility for any injury to people or property resulting from any ideas, methods, instructions or products referred to in the content. |
© 2025 by the authors. Licensee MDPI, Basel, Switzerland. This article is an open access article distributed under the terms and conditions of the Creative Commons Attribution (CC BY) license (https://creativecommons.org/licenses/by/4.0/).