Article

Anthropogenic Aerosol Dominates the Decadal Change in Evapotranspiration over Southeastern China in the Past Four Decades

by
Zhiyong Kong
1,
Jian Cao
1,2,* and
Boyang Wang
1
1
State Key Laboratory of Climate System Prediction and Risk Management/Key Laboratory of Meteorological Disaster, Ministry of Education/Collaborative Innovation Center on Forecast and Evaluation of Meteorological Disasters, Nanjing University of Information Science and Technology, Nanjing 210044, China
2
Earth System Modeling Center, Nanjing University of Information Science and Technology, Nanjing 210044, China
*
Author to whom correspondence should be addressed.
Remote Sens. 2025, 17(3), 561; https://doi.org/10.3390/rs17030561
Submission received: 17 January 2025 / Revised: 1 February 2025 / Accepted: 5 February 2025 / Published: 6 February 2025

Abstract

:
Evapotranspiration (ET) is vital for global water balance, energy cycle, and biological processes, representing a key component of Earth systems interactions. However, how human activities affect regional ET is still unknown. This study identified a decadal decrease in ET before 2000, followed by an increase over southeastern China in observations. Simulations from the coupled model intercomparison project phase 6 (CMIP6) models well reproduced the observed decadal ET change, with a lag of 10 years, which may be due to the spatial and temporal simplification of aerosol forcing data in CMIP6. Attribution analysis reveals that the change in anthropogenic aerosol emissions was the primary driver of the ET change, while the contribution of greenhouse gas was negligible. The Penman–Monteith framework identified that the net surface radiation contributed 77% of the ET trend change in the anthropogenic aerosol-only experiment. The increase and reduction in anthropogenic aerosol emissions reduce and increase the shortwave radiation reaching the Earth’s surface, respectively, resulting in the different trends of energy sources for ET. Our findings underscore the critical role of aerosols in shaping surface energy balance and influencing regional hydrological cycles.

1. Introduction

Evapotranspiration (ET) is a critical component of the hydrological cycle, linking water, soil, vegetation, energy, and carbon exchanges, and plays a pivotal role in land-atmosphere interactions [1,2,3,4,5]. Over southeastern China, with dense vegetation and abundant water vapor, ET contributes about 50% of the moisture for summer precipitation, underscoring its vital importance [6,7,8]. In the past decades, southeastern China experienced rapid socio-economic development, fast population growth, and high aerosol and greenhouse gas emissions. Thus, southeastern China is a typical region with strong human activity and high ET. In the context of global warming, intensifying hydrological cycles have driven significant changes in ET, as demonstrated by existing ET datasets over the past several decades [9,10,11,12,13,14,15,16,17]. Understanding the drivers and mechanisms of ET changes is at the forefront of climate change research [7,18,19]. Such understanding is essential for assessing future climate, hydrological environments, and ecosystems over southeastern China [20,21,22].
Recent studies have aimed to explain the mechanisms driving ET changes under global warming. A range of mechanisms have been identified, including climatic drivers, terrestrial hydrological processes, and biophysical feedbacks, that influence ET patterns across different regions and timescales. Zeng and Cai [23] suggested that precipitation dominates interannual ET variance in arid regions, while potential ET governs ET variance in humid regions. Terrestrial water storage dampens ET variance in arid climates and strengthens ET variance in humid climates. Rigden and Salvucci [24] estimated ET changes in the United States using historical meteorological data from weather stations. They attributed the observed decline to reduced surface conductance. Brutsaert [25] analyzed the satellite data mainly over the world’s ocean surfaces and revealed that the ET increase during 1986–2006 closely aligns with calculations based on the Clausius-Clapeyron equation, suggesting a strong correlation between ET and global temperature. McVicar et al. [26] suggested that for wet catchments under steady-state conditions, a reduction in wind speed significantly decreases ET, where the dynamics of actual evapotranspiration are more closely aligned with precipitation patterns for dry catchments. Martens et al. [27] suggested that teleconnections account for up to 40% of ET trends in regions with high variability. Zhu et al. [8], using the Penman–Monteith equation and a variable contribution separation method, quantitatively analyzed ET changes in the Asian monsoon region from 1950 to 2014, identifying net surface radiation as the dominant climatic factor influencing ET trends. Additionally, studies on the impact of vegetation greening on ET consistently conclude that vegetation greening leads to an increase in ET, particularly through enhanced transpiration [28,29].
Several studies have examined ET changes in China over the past few decades, but it is still unclear the temporal feature of ET over southeastern China and its driving mechanisms. Gao et al. [30] identified solar radiation as the primary contributor to ET changes in China. Gao et al. [31] further pointed out a consistent decline in ET across southeastern China during 1960–2002. While precipitation was the dominant factor driving ET changes in most parts of China, potential ET was identified as the main driver in southeastern China. Hong et al. [7] concluded that ET in Southeast China’s coastal regions significantly increased from 1981 to 2020, likely driven by concurrent increases in temperature and precipitation. Zhang et al. [32] quantified the impacts of global warming and vegetation greening on ET changes across 110 humid catchments in China during 1982–2016. They found that surface warming was the dominant driver of ET variations in these regions.
During the past decades, anthropogenic emissions have significantly increased and altered regional hydrological cycles [8,33,34,35]. Douville et al. [36] noted the influence of anthropogenic radiative forcing on decadal ET changes. Using coupled model intercomparison project phase 6 (CMIP6) simulations, Liu et al. [37] attributed 84% of the global ET trend during 1980–2020 to anthropogenic forcing, which is primarily driven by greenhouse gases (GHGs). From the perspective of the mechanism of anthropogenic aerosols (AAs) and GHGs, the warming effect of GHGs can enhance the vapor pressure difference between land and atmosphere, leading to increased ET [38,39]. Additionally, CO2, the primary component of GHGs, enhances plant transpiration and water storage capacity by enhancing photosynthesis and reducing stomatal conductance [17,40,41,42]. Aerosols impact ET by scattering and absorbing solar radiation, modifying surface energy and hydrological conditions [43,44]. These processes modify the surface energy balance, reducing net surface radiation and consequently weakening ET [8,35,45,46]. Furthermore, Rai et al. [47] demonstrated that aerosols can reduce plant transpiration rates by depositing on vegetation surfaces, further complicating their role in the hydrological cycle.
In the 1980s, North America and Europe implemented clean air initiatives, leading to a gradual reduction in aerosol emissions over these regions [48,49]. Similarly, with the implementation of emission control policies in China in the early 21st century, aerosol emissions in China also began to decline [50,51,52,53]. The change in anthropogenic forcing may have triggered changes in the trends of ET. Although significant progress has been made in understanding ET variations, gaps in knowledge still exist: (1) Does ET steadily increase over southeastern China along with anthropogenic-driven global warming? (2) What are the roles of anthropogenic aerosol (AA) and greenhouse gas (GHG) on the ET changes? (3) Which climatic factor does play a key role in the decadal scale ET change? This study addresses these gaps of knowledge by leveraging multiple ET datasets [54,55,56] and CMIP6 simulations [57] to investigate ET changes in China, particularly in the southeastern region with intense monsoon precipitation and ET. The remainder of this paper is structured as follows: Section 2 introduces the datasets and methods. Section 3 analyzes the observed and simulated ET trend change over southeastern China in the early 21st century and attributes the reversal from a declining to an increasing ET trend to changes in aerosol forcing and net surface radiation. Section 4 summarizes the key findings of this study. Finally, Section 5 provides discussions.

2. Datasets and Methods

2.1. Datasets

Three widely used ET product datasets are employed in this study: (a) Version 2.1 of the Global Land Data Assimilation System (GLDAS) with the Noah model, which generates various land surface states and flux fields through offline land surface modeling combined with data assimilation techniques, covers 1950–2020 [54]. (b) Version 3.8a of the Global Land Evaporation Amsterdam Model (GLEAM) dataset, derived from state-of-the-art diagnostic actual ET products, covers 1980–2020 [58]. (c) The Highly Generalized Land ET (HG-Land) dataset, which integrates satellite-observed vegetation information, ET observations, precipitation observations, and reanalysis datasets using machine learning algorithms, covers 1982–2018 [56]. Although the temporal coverages of the datasets are different, the three datasets share a similar decadal change in ET over southeastern China. Thus, we focus on the period of 1980–2020. We also utilize aerosol data provided by the Modern-Era Retrospective Analysis for Research and Applications, Version 2 (MERRA–2) [59], covering the period from 1980 to 2020, to validate the influence of aerosol forcing on ET variations.
Simulation data from historical experiments, the Scenario Model Intercomparison Project (ScenarioMIP), and the Detection and Attribution Model Intercomparison Project (DAMIP) are used [60,61]. The historical and ScenarioMIP simulations are forced by all anthropogenic and natural external forcings (ALL forcing). In this study, the Shared Socioeconomic Pathway (SSP) 2-4.5 scenario from CMIP6 is selected as the future climate scenario, as it is considered to more closely aligned with the anticipated future emission pathways. The impact of individual external forcing is derived from the anthropogenic aerosol-only (AA forcing) and well-mixed greenhouse gas-only (GHG forcing) experiments in the DAMIP. The AA forcing experiment and GHG forcing experiment are designed as historical experiments but are forced by anthropogenic aerosol only and well-mixed greenhouse gas only during 1850–2014, respectively [60]. Four models in DAMIP conducted AA forcing and GHG forcing experiments from 1850 to 2099, with future forcing from the SSP 2-4.5 scenario (Table 1). These models are used to attribute the contribution of individual forcings to the changes in ET. To obtain the multi-model mean, we first averaged the ensembles from individual models and then calculated the four models’ mean. In this study, we focus only on the period after 1950, as the impact of anthropogenic factors was relatively weaker prior to that time. By analyzing the results from model simulations, we can investigate the reversal in the ET trend on a centennial scale and compare them with observations for validation. The climate variables provided by the models, such as surface radiation, temperature, wind speed, humidity, and pressure, are used to explore the main factors and mechanisms influencing the change in the ET trend.

2.2. Methods

To determine whether an abrupt change in ET has occurred, we applied a moving t-test [62,63] to perform a climatic abrupt change detection on the temporal evolution of ET in the study region.
The t-value for the moving t-test is calculated using the following formula:
t i = x 1 ¯ x 2 ¯ s × 1 n 1 + 1 n 2
s = n 1 s 1 2 + n 2 s 2 2 n 1 + n 2 2
For a given climate sequence, n 1 and n 2 represent two subsequences of equal length before and after a specific time point. x 1 ¯ and x 2 ¯ are the mean values of these two subsequences, while s 1 2 and s 2 2 are their respective variances. By sliding through the entire period, the t-value is computed. If the absolute value of the t-value exceeds the given significance level t α , a significant change at the t α confidence level occurs at that time point in the time series. In this work, the length of the two adjacent subsequences is chosen as 10 years.
To investigate the mechanism of ET trend change, we used the Penman–Monteith equation to diagnose ET [8,9,64], which is the only standard method in the Food and Agriculture Organization of the United Nations (FAO) for calculating ET [9]. ET can be derived from precipitation, net surface radiation, surface temperature, vapor pressure deficiency, and 2 m wind speed by the following equation:
PET = 0.408 Δ Rn G + γ 900 Ts + 273 U · VPD Δ + γ 1 + 0.34 u
ET = P + PET P [ 1 + PET P ω - ] 1 / ω -
where PET is the potential ET (mm d−1), Rn is the net surface radiation (MJ m−2 d−1), which is the difference between the net downward and upward of radiation flux at the surface; G is the soil heat-flux density (MJ m−2 d−1); γ and Δ are the psychometric constant (kPa °C−1) and slope of the vapor pressure curve, respectively; Ts is the 2 m air temperature (K); and U is the 2 m wind speed (m s−1). VPD means the vapor pressure deficit (kPa), P is the precipitation (mm d−1), ω - denotes a parameter reflecting landscape characteristics (e.g., vegetation cover, soil properties, and topography) within one catchment. According to Allan et al. [9], G is set to 0.
To quantify the contribution of each variable to ET changes, we conducted a series of sensitivity calculations. Using the method developed by Sun et al. [65,66,67], we separated the ET changes caused by variations in each climate variable. We first calculate the ET as the control experiment using the aforementioned equation and corresponding climate variables. Subsequently, we conduct five sensitivity experiments, each targeting a specific climate variable, denoted as ET_P, ET_Rn, ET_Ts, ET_VPD, and ET_U. In each sensitivity experiment, the targeted climate variable is held constant at its value in the initial year, while all other variables remain the same as in the control experiment. The difference in ET trends between the control experiment and each sensitivity experiment can be attributed to the contribution of the specific climate variable to the ET trend. To eliminate errors caused by interactions among climate variables, we further apply the following separation method to isolate the contribution of each specific variable.
k i n   C k = E T trend _ i
C i = k i n   E T trend _ k ( n 2 ) E T trend _ i n 1
where k i n Ck is the total contribution to the trend in ET from all climatic variables except for the ith factor; n denotes the number of sensitivity experiments (n = 5 in this study); and ET trend _ i represents the ET trend in each experiment, respectively. The C_i is the contribution of each driving factor to the ET trend. In this study, we identify the year of significant ET trend change under the ALL forcing experiment and calculate the ET trends and contributions of each variable for the periods before and after the turning time. The difference in variable contributions between the two periods is considered the actual contribution to the ET trend change. The calculation results show that the sum of the contributions from all variables is consistent with the ET trend change.
Since the most significant change in the ET trend is concentrated in the southeastern region of China, we focus study area on southeastern China, defined as the land area of China within coordinates 105°E to 122°E and 22°N to 31°N, and focusing on the changes in summer from July to September.

3. Results

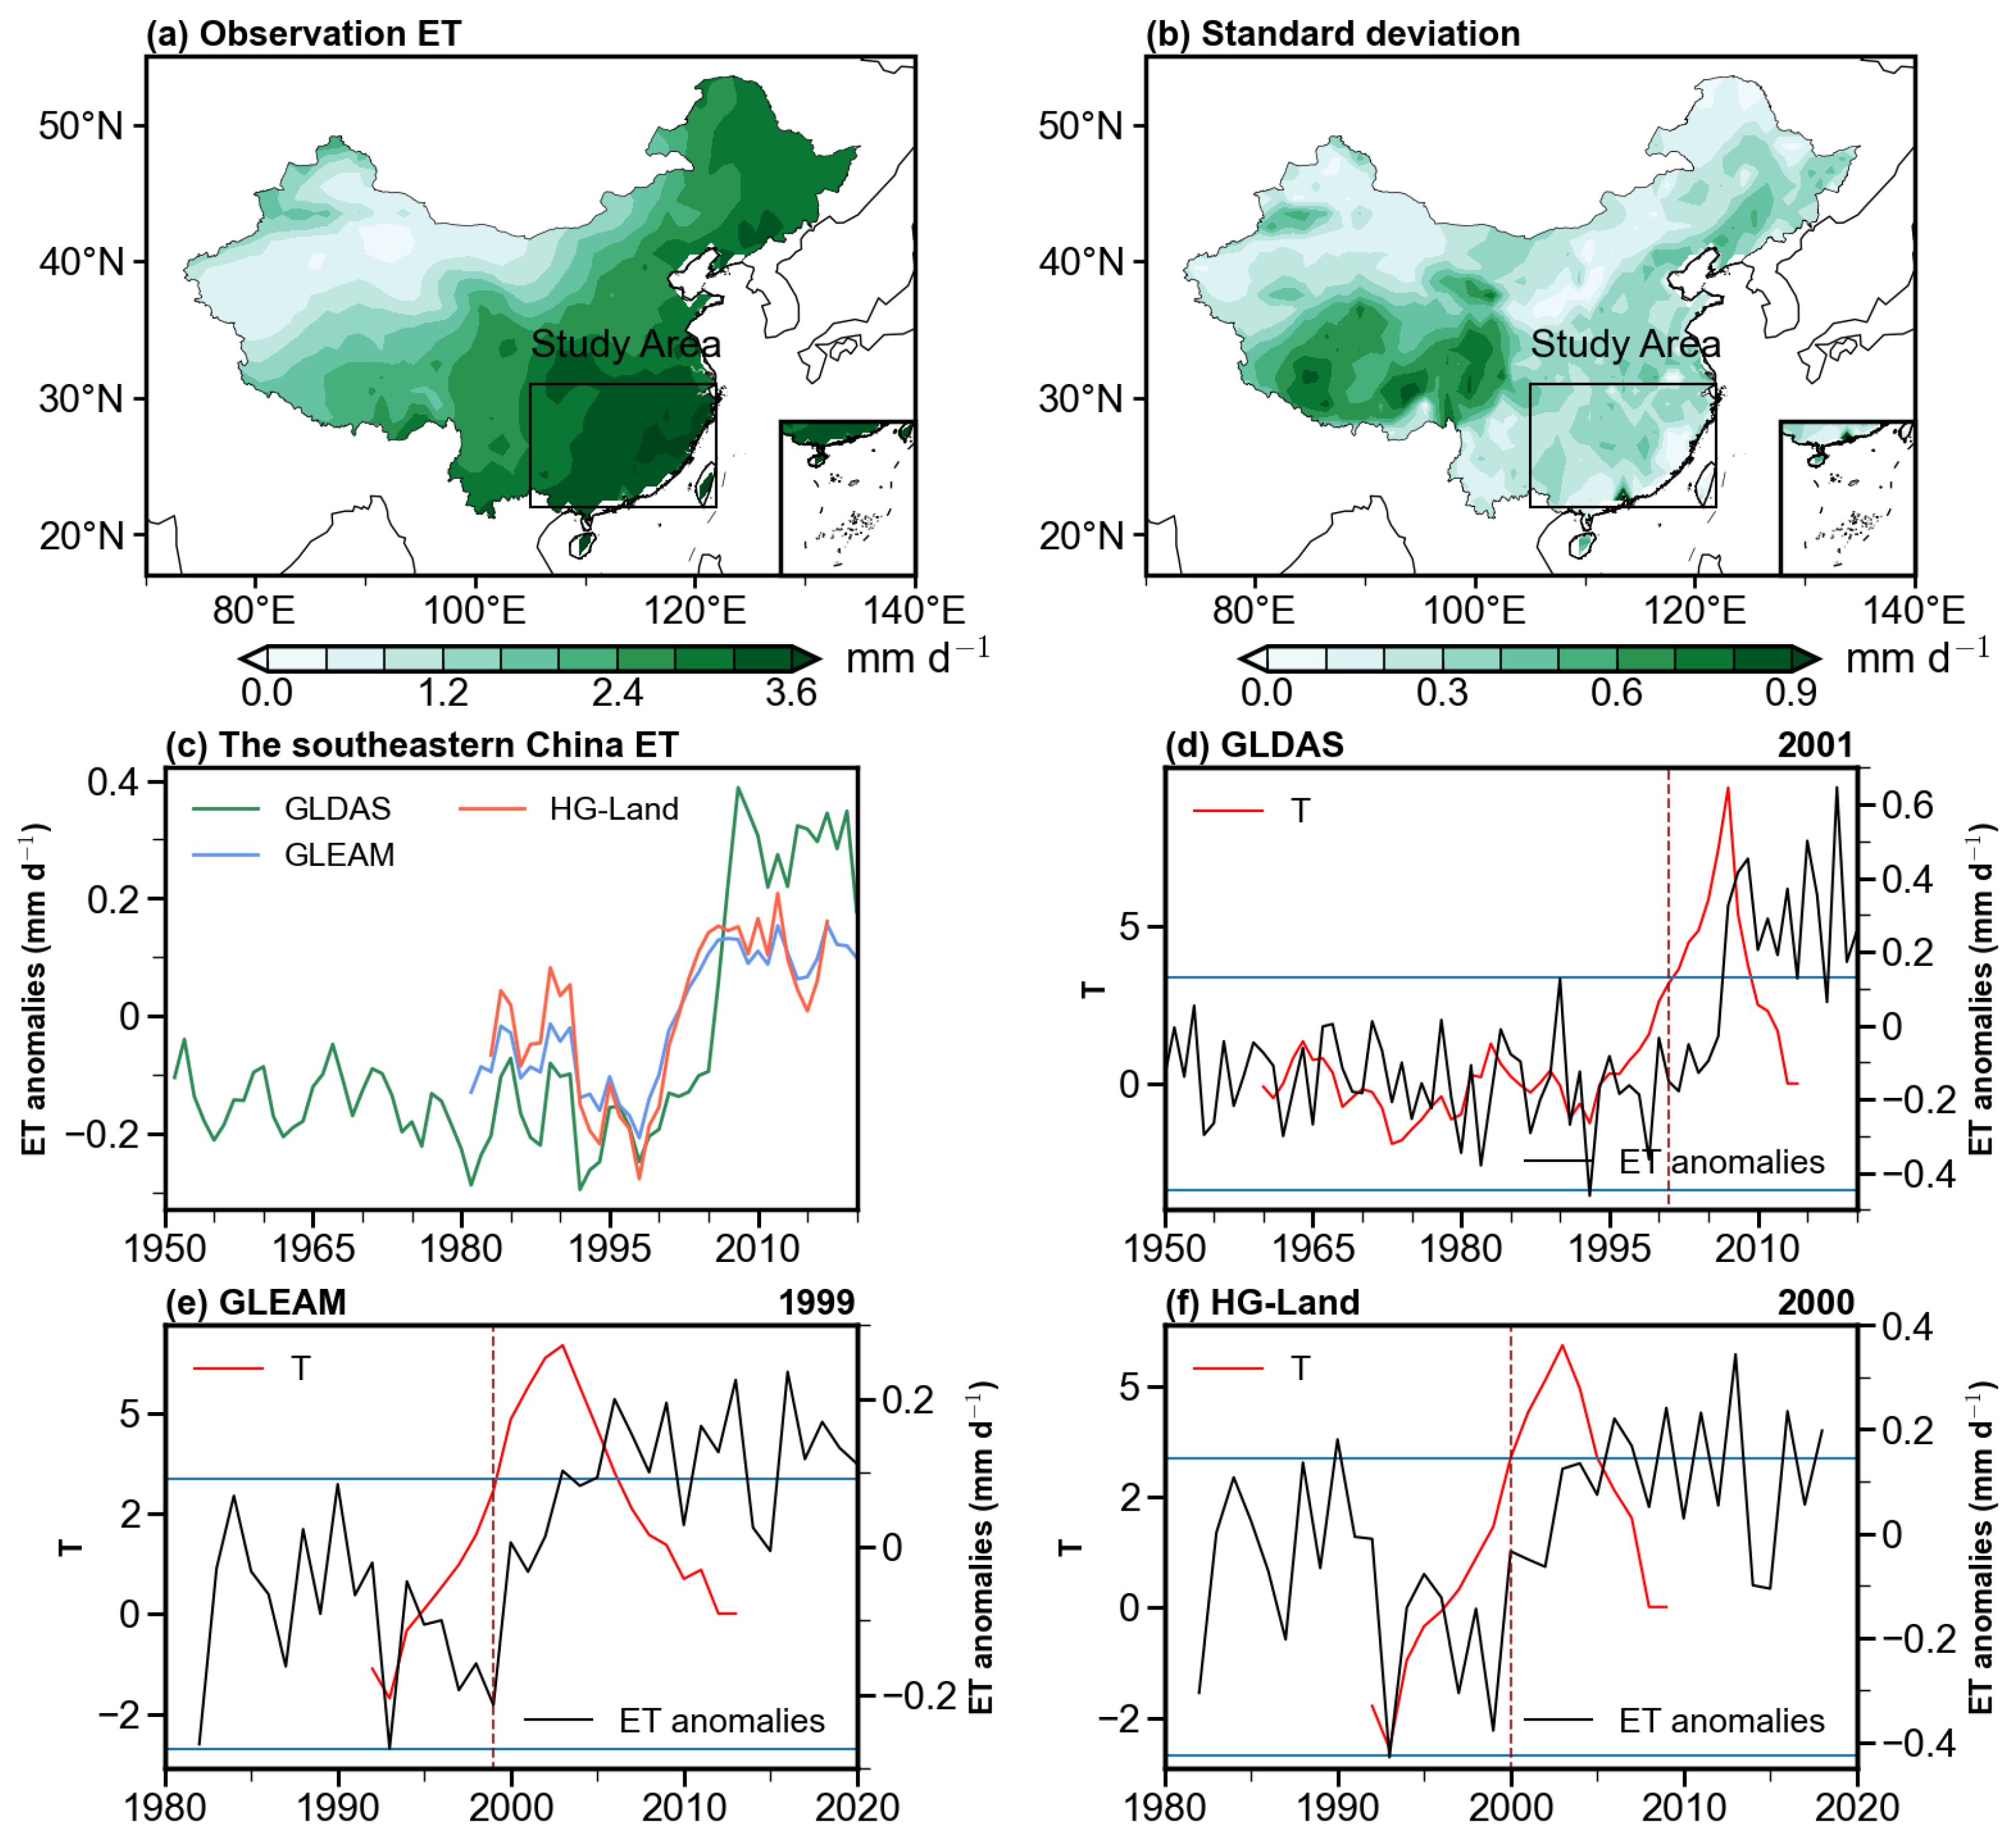
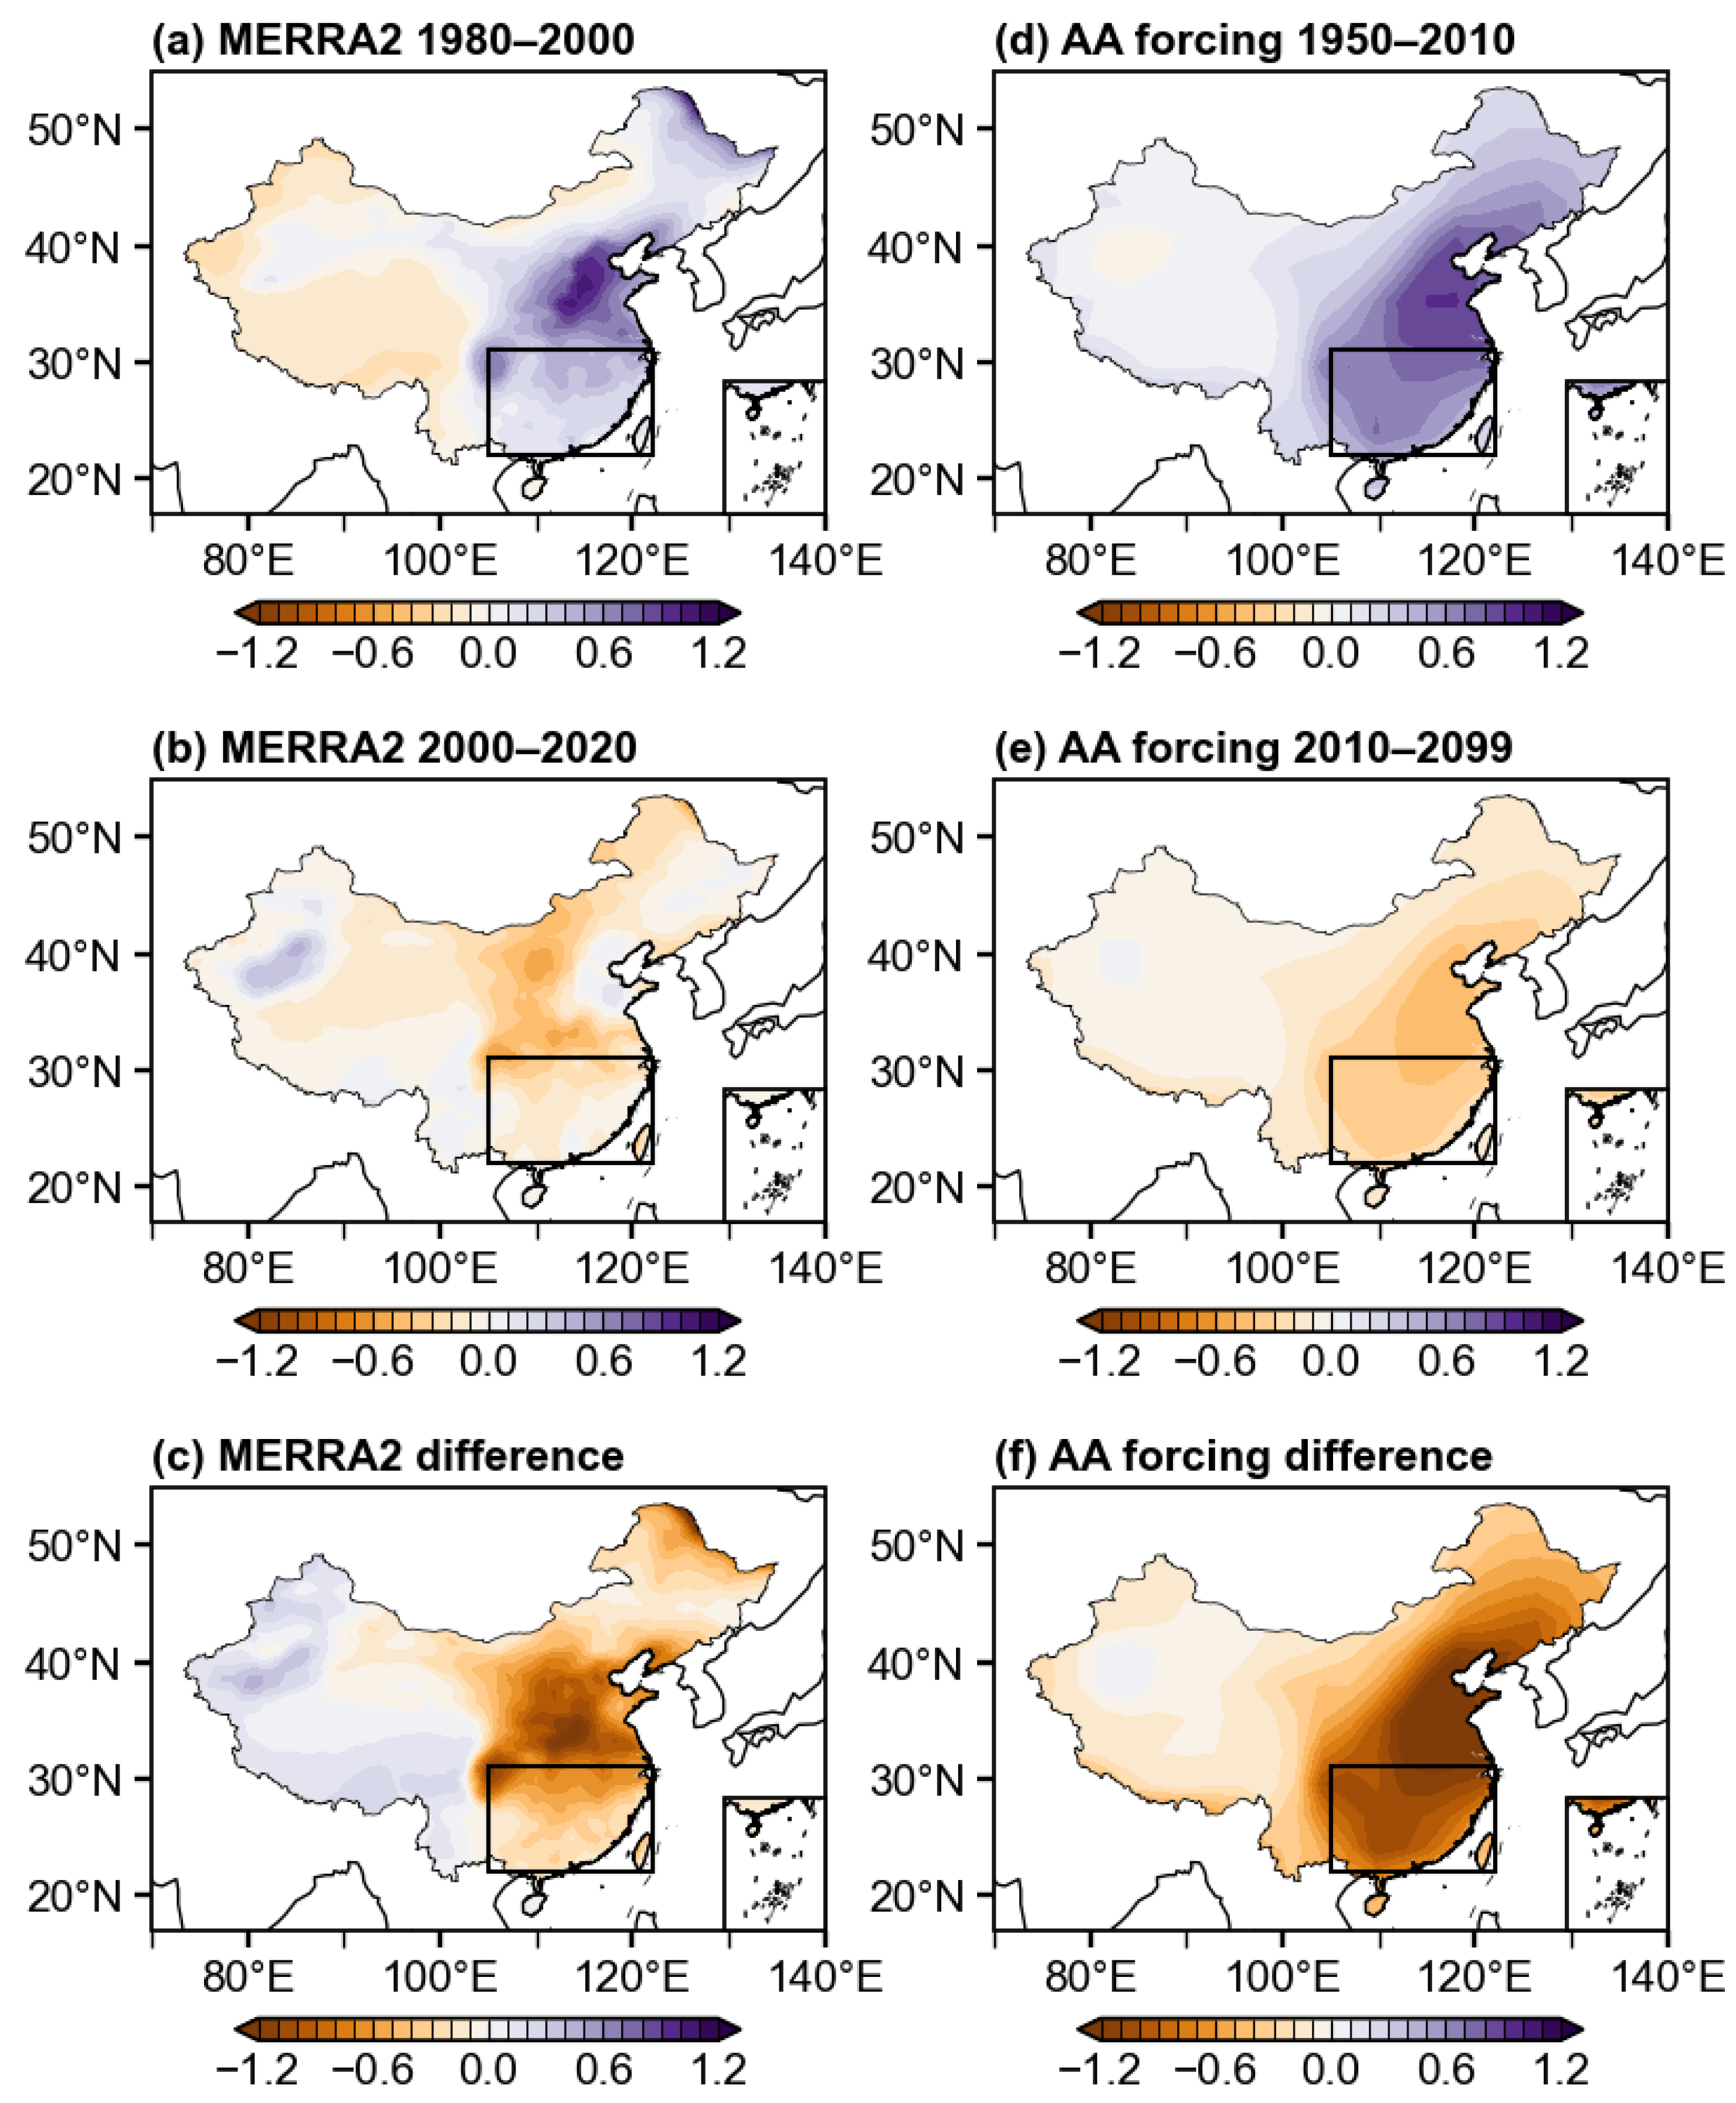
3.1. The Change in the ET Trend in Observations and Models

Figure 1a shows the spatial distribution of summer ET over China during 1980–2020, based on the average of the three observational datasets. It shows that extensive ET is observed over southeastern China, and it decreases progressively toward the northwest. We will focus on southeastern China (105°E–122°E, 22°N–31°N), where there is a dense population, vegetation, and atmosphere–land interactions [7,31,68]. Moreover, there are unique decadal changes in ET over southeastern China compared to other regions (Figure 1 and Figure 2). Figure 1b illustrates the variation of average summer ET over southeastern China derived from three observational datasets. The three datasets consistently indicate that ET exhibited a declining trend since the late 20th century. However, a notable strengthening trend is observed beginning in the early part of this century, signifying a clear decadal trend change in ET (Figure 1c–e). A moving t-test was applied to detect abrupt changes in ET trends. It reveals a consistent and significant (p < 0.05) abrupt change in ET trends around 2000 across all three datasets, although the temporal coverages of the datasets are different. This is different from the monotonous increased global annual mean ET since 1980 [69]. These findings emphasize the importance of southeastern China as a critical area for investigating the mechanisms and impacts of ET changes in the context of climate variability and human activities.
Using the average abrupt change year of 2000 as the turning point, we investigate the decadal trend changes in each dataset between the two time periods: the late 20th century (1980–2000) and the early 21st century (2000–2020). Figure 2 illustrates the spatial patterns of summer ET trends over China during the two time periods, as well as the spatial distribution of trend differences from the averages of the three observations. During 1980–2000, ET trends across China exhibited a notable spatial pattern. Positive trends were observed in the majority of western China and northeastern China. There is a tripole pattern in eastern China, with a pronounced drying trend over southeastern China (105°E–122°E, 22°N–31°N). In contrast, during 2000–2020, summer ET trends across China became uniformly positive, with significant increases, particularly in the southeastern and northeastern regions. Thus, a clear decadal ET trend change has mainly occurred over southeastern China in the ensemble mean of the three observations. The decreasing and increasing trends of ET over southeastern China before and after 2000, respectively, are the common features among the three datasets, while the consistency is low over other regions. It also indicates the unique decadal feature of ET over our study area (105°E–122°E, 22°N–31°N).
Figure 2c highlights the trend difference in ET between the periods before and after 2000. Apart from a weak negative reversal over Tibet, the majority of China experienced a generally consistent accelerating ET. Prominent ET acceleration happens over the southeastern coastal, North, and Northeast China, with a maximum value of 3.97 mm d−1 cent−1 in southeastern China. The transition in ET underscores that southeastern China not only experienced the most pronounced positive reverse but also emerged as a hotspot for ET trend acceleration. This spatially coherent intensification in southeastern China highlights the heightened sensitivity to climate modes and/or anthropogenic forcings, positioning it as a key area for further investigation into the mechanisms driving ET changes.
Here we mainly focus on the role of anthropogenic forcings on ET trend change. We rely on the ensemble mean of multi-realizations from the four DAMIP models to minimize the impacts from the Earth system’s internal modes. Figure 3a illustrates the spatial distribution of simulated summer ET over China from 1980 to 2020 in the CMIP6 ALL forcing experiment. The ensemble mean of DAMIP model simulations successfully reproduces the spatial patterns of the observed ET, showing a gradual decrease from southeast to northwest, with high ET concentrated in southeastern China. Consistent with observations, the ALL forcing experiment revealed the pronounced ET trend change during the early 21st century (Figure 3b). Results from the moving t-test indicate a statistically significant abrupt change in ET trends at the 95% confidence level in 2010 under ALL forcing. Taking 2010 as the turning point, ET over southeastern China under the ALL forcing decreased at a rate of −0.31 mm d−1 cent−1 from 1950 to 2010. After 2010, it shifted to an increasing trend of 0.37 mm d−1 cent−1, continuing through the end of the 21st century (Figure 3b). Thus, the anthropogenic forcing has a significant contribution to the observed ET trend change over southeastern China, although the timing of the turning is delayed compared to the observations. This delay may originate from the coarse aerosol temporal resolution in the CMIP6 forcing data [70]. It will be discussed later.

3.2. Critical Role of Anthropogenic Aerosol on ET Trend Change

Anthropogenic aerosols and greenhouse gases are the dominant forcings from the historical period to the end of this century. The impacts of the individual anthropogenic forcings could be derived from the single forcing experiments [57,60]. Figure 3b shows the impacts of AAs and GHGs on the evolution of ET in southeastern China. The AA forcing experiment shows a clear ET trend change during the early 21st century, similar to the ALL forcing experiment. The trend turning point is also in the year 2010 in the AA forcing experiment. Under the AA forcing, ET initially declined at −0.55 mm d−1 cent−1 before 2010 but reversed to a growth rate of 0.34 mm d−1 cent−1 after 2010. In contrast, under the GHG forcing, ET over southeastern China exhibited a relatively weak increasing trend throughout the entire period from 1950 to 2099, with no evident turning point identified.
Figure 4 illustrates the spatial pattern of the ET trend change under ALL, AA, and GHG forcing. In the ALL forcing experiment, southeastern China exhibits the most pronounced ET trend change, consistent with the trend change in the observation (Figure 2c). This spatial pattern mirrors the ET climatology, characterized by a gradual decrease in ET from the southeast to the northwest. In the northwest, the trend reversal is predominantly negative, highlighting a contrast with the southeast (Figure 4a). It indicates that the anthropogenic forcing may hardly explain the increase in ET over Northwest China in the observation.
In terms of the impact of individual forcing, the AA forcing experiment reveals a strong ET trend change (Figure 4b). The positive trend reversal under AA forcing extends over a broader region, encompassing not only southeastern China but also parts of central and northern China. In contrast, the impact of GHG forcing displays a weak ET trend change across the entire area, with significantly lower values compared to the AA forcing (Figure 4c). Comparing the impact of the forcings, the spatial patterns of the ET trend change under the ALL forcing, and AA forcing are remarkably similar and closely align with observations, particularly over southeastern China. More importantly, the results suggest that the significant spatio-temporal ET trend change is primarily driven by AA forcing, which is dominant over the GHG’s influence in ET. This differs from a previous study that mainly attributed the global-scale ET trend change to GHG [37], indicating the significant role of aerosols on the spatial pattern of ET change.
We further confirm the consistency of changes in key climate variables under ALL and AA forcing. Following the Penman–Monteith equation approach, five key climate variables are investigated, including precipitation, net surface radiation, 2 m surface temperature, vapor pressure deficit, and 2 m surface wind speed. Figure 5a shows the trend changes in the five key climate variables over southeastern China before and after 2010 in ALL, AA, and GHG forcing experiments. In both the ALL and AA forcing experiments, the key climate variables exhibit generally consistent increased trends. They are positively contributing to the ET trend changes in ALL and AA forcing experiments. The trend changes in the five key climate variables are comparable between ALL and AA forcing experiments, indicating the dominant role of AA in modulating the physical processes of ET. Conversely, under the GHG forcing, only precipitation demonstrates a modest positive reversal, while net surface radiation and surface temperature experience slight decreases (Figure 5a). The magnitude of the variable changes under GHG forcing is much smaller than that under the AA and ALL forcing.
Figure 6 shows the spatial patterns of the ET trend change and the five key variables’ trend changes in the ALL forcing experiment. The trend change in precipitation is primarily concentrated in southern China, where wetting trends dominate (Figure 6b). Meanwhile, the northeastern region experiences a weaker wetting trend, and the northwestern region exhibits a weak drying trend. Notably, the precipitation patterns do not fully align with that of the ET trend change, indicating that precipitation alone does not dictate ET variations (Figure 6b). Net surface radiation shows a remarkable enhancement across eastern China. Conversely, the Tibetan Plateau stands out with slight reductions in net surface radiation, reflecting its unique climatic response (Figure 6c). Surface temperature trends similarly reveal significant regional variations, with pronounced cooling trends near the Tibetan Plateau but warming elsewhere. Notably, the peak of surface warming occurs further north than the peak of net surface radiation, suggesting complex interactions between radiative and thermal processes (Figure 6d). Unlike the relatively consistent spatial patterns of ET and precipitation trends, the vapor pressure deficit exhibits its most substantial increases along the northwestern region of China, highlighting the distinct climatic drivers of the ET change in the arid regions compared to the humid South China (Figure 6e). On the other hand, wind speed changes show strong regional features. (Figure 6f). Although the spatial patterns of the variables are different, there are consistently increased precipitation, net surface irradiance, surface temperature, water vapor pressure deficit, and surface wind speed over southeastern China, all benefits for the enhanced ET trend (Figure 6a).
There are high consistencies of the changes in key climate variables over southeastern China between the ALL and AA forcing, while the trends are not always consistent between the ALL and AA forcing over other regions. It demonstrates the uniqueness of southeastern China. For instance, the change in precipitation trend shows a zonal dipole mode under AA forcing, different from the meridional tripole pattern under ALL forcing. Fortunately, there is increasing precipitation over southeastern China. Under AA forcing, net surface radiation, surface temperature, and vapor pressure deficit trends over eastern China closely mirror those under the ALL forcing. However, unlike the ALL forcing results, these variables also exhibit increases over the Tibetan Plateau, signifying a broader spatial coverage of AA effects (Figure 7c–e). The wind speed changes under the AA forcing display an increased trend over the majority of China, different from the regional change in wind speed under ALL forcing.
Importantly, consistent with the ALL forcing experiment, all climate variables exhibit a positive trend change in southeastern China, highlighting the significant role of AA in shaping the regional hydrological cycle. These findings collectively demonstrate that while both ALL forcing and AA forcing replicate ET trend change consistent with observations, they underscore the importance of AA as a primary driver of ET changes.

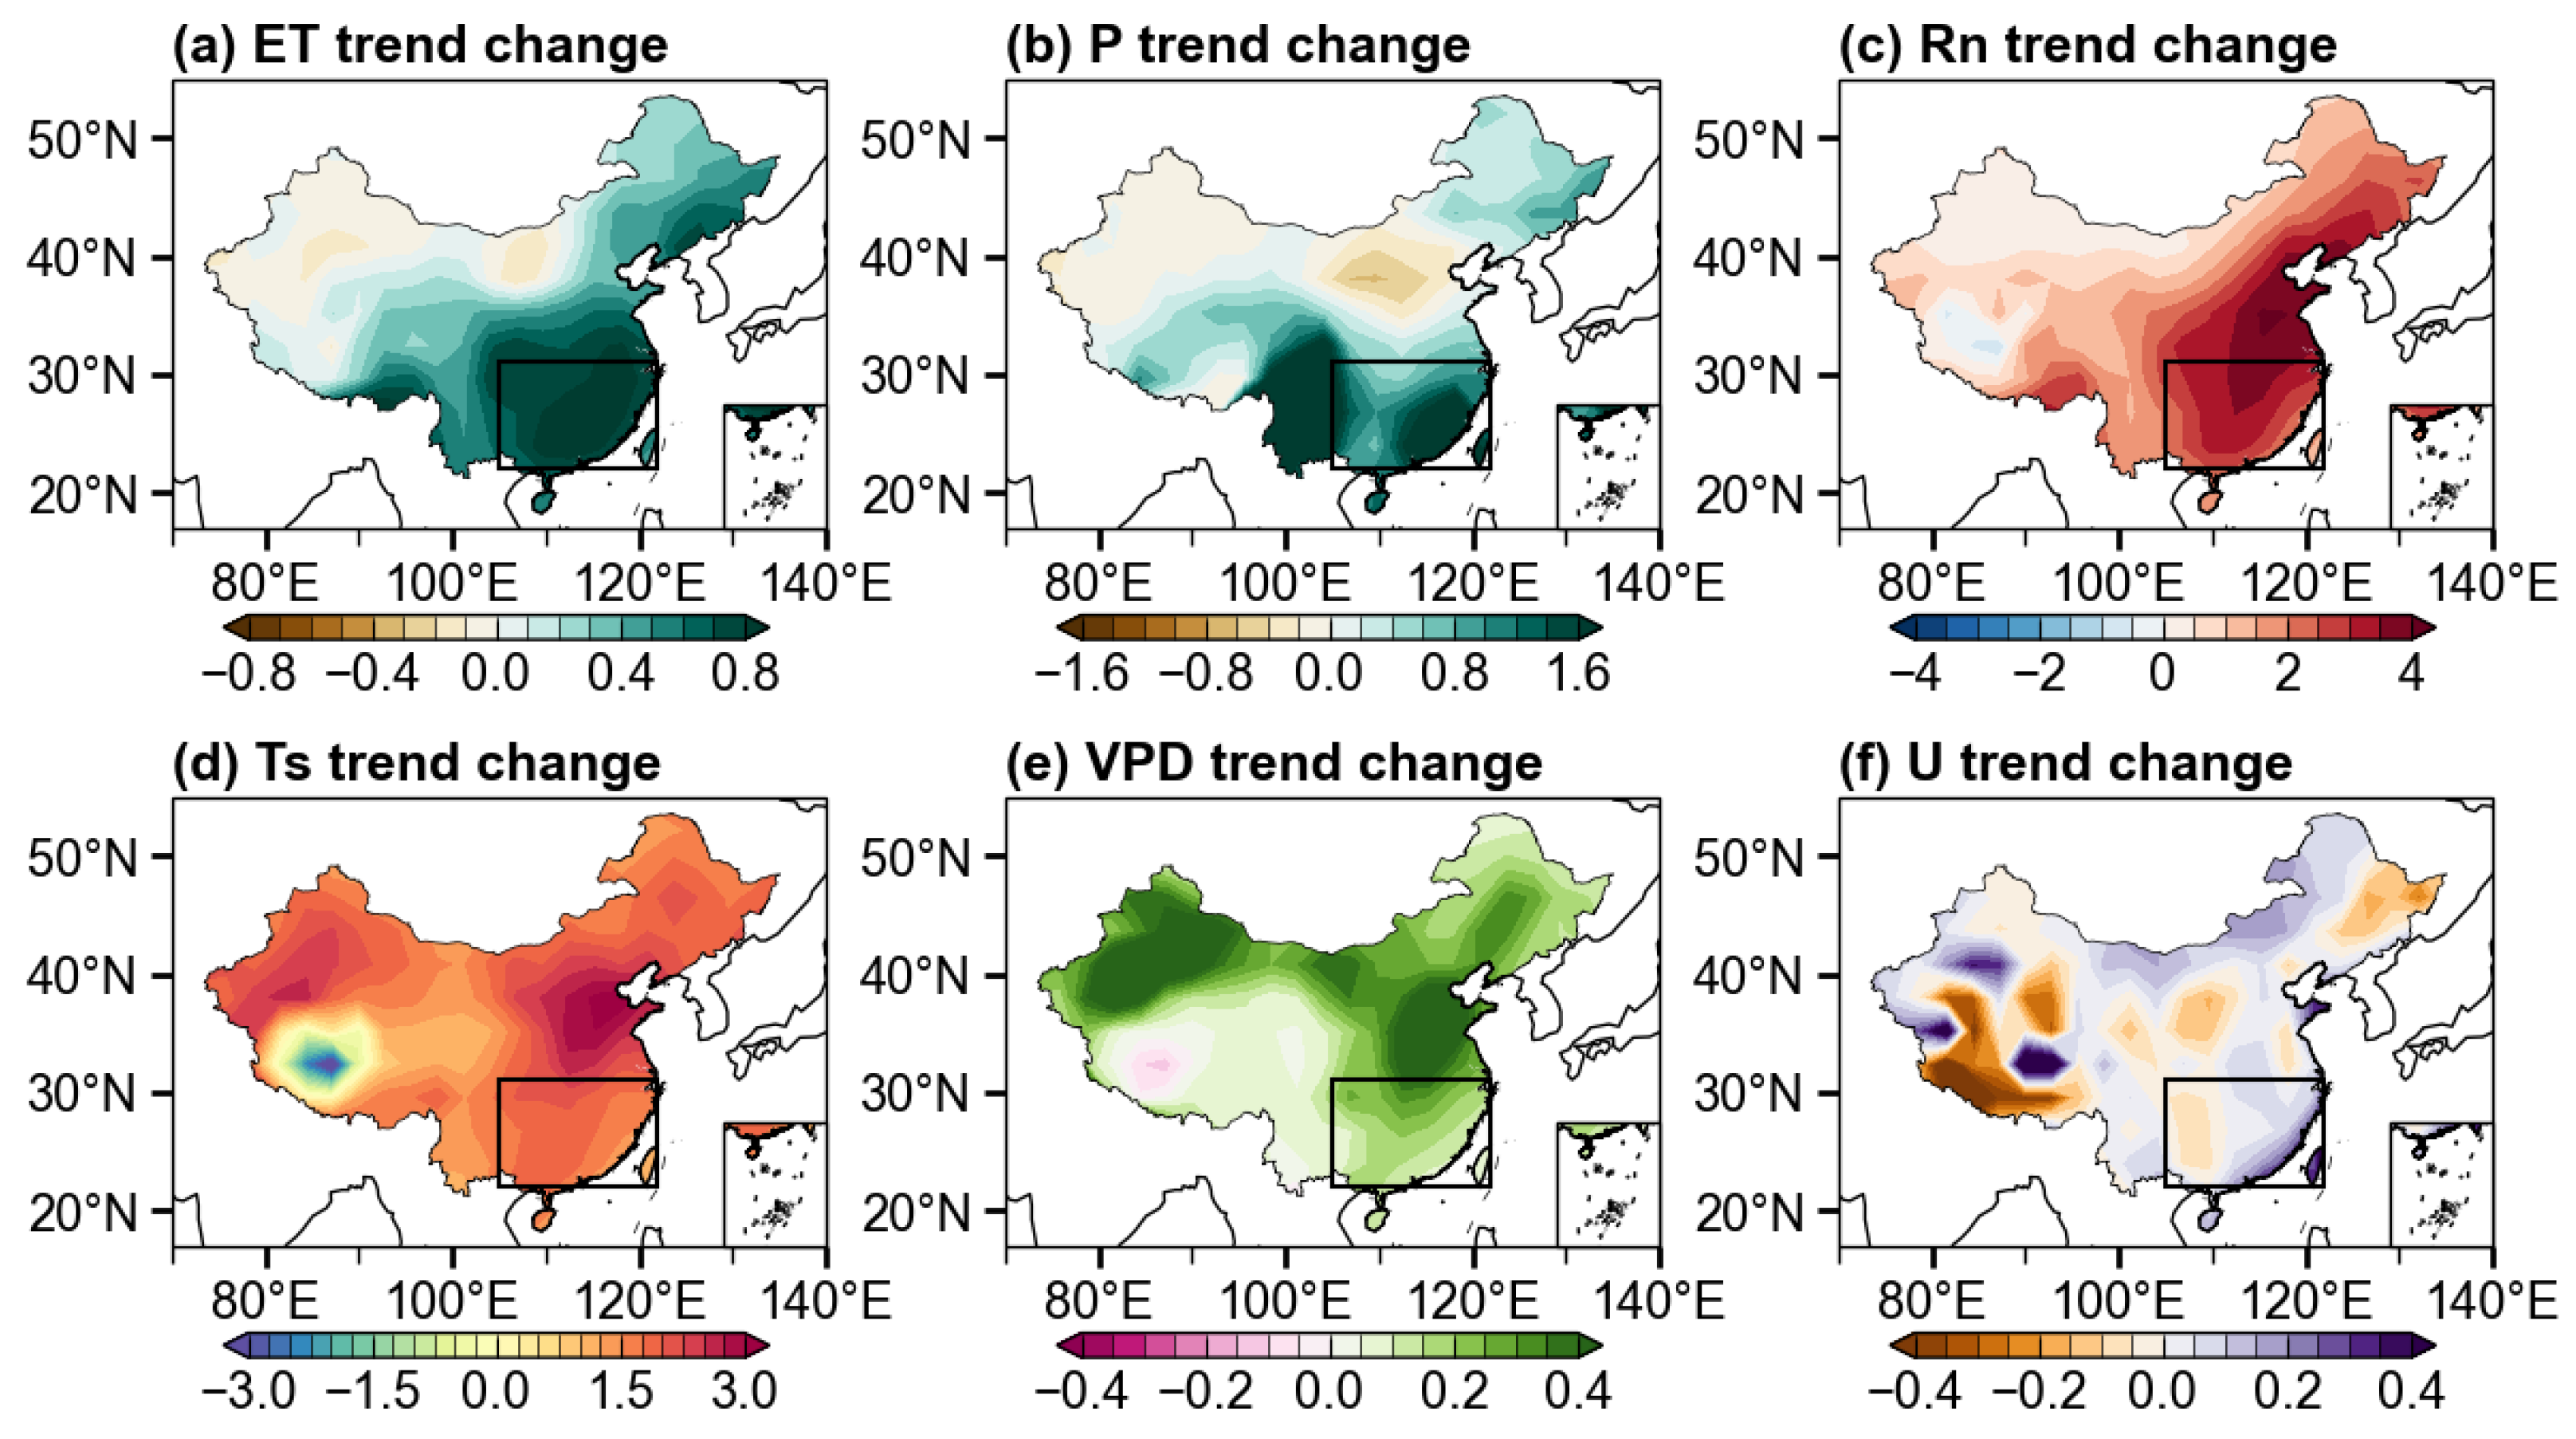
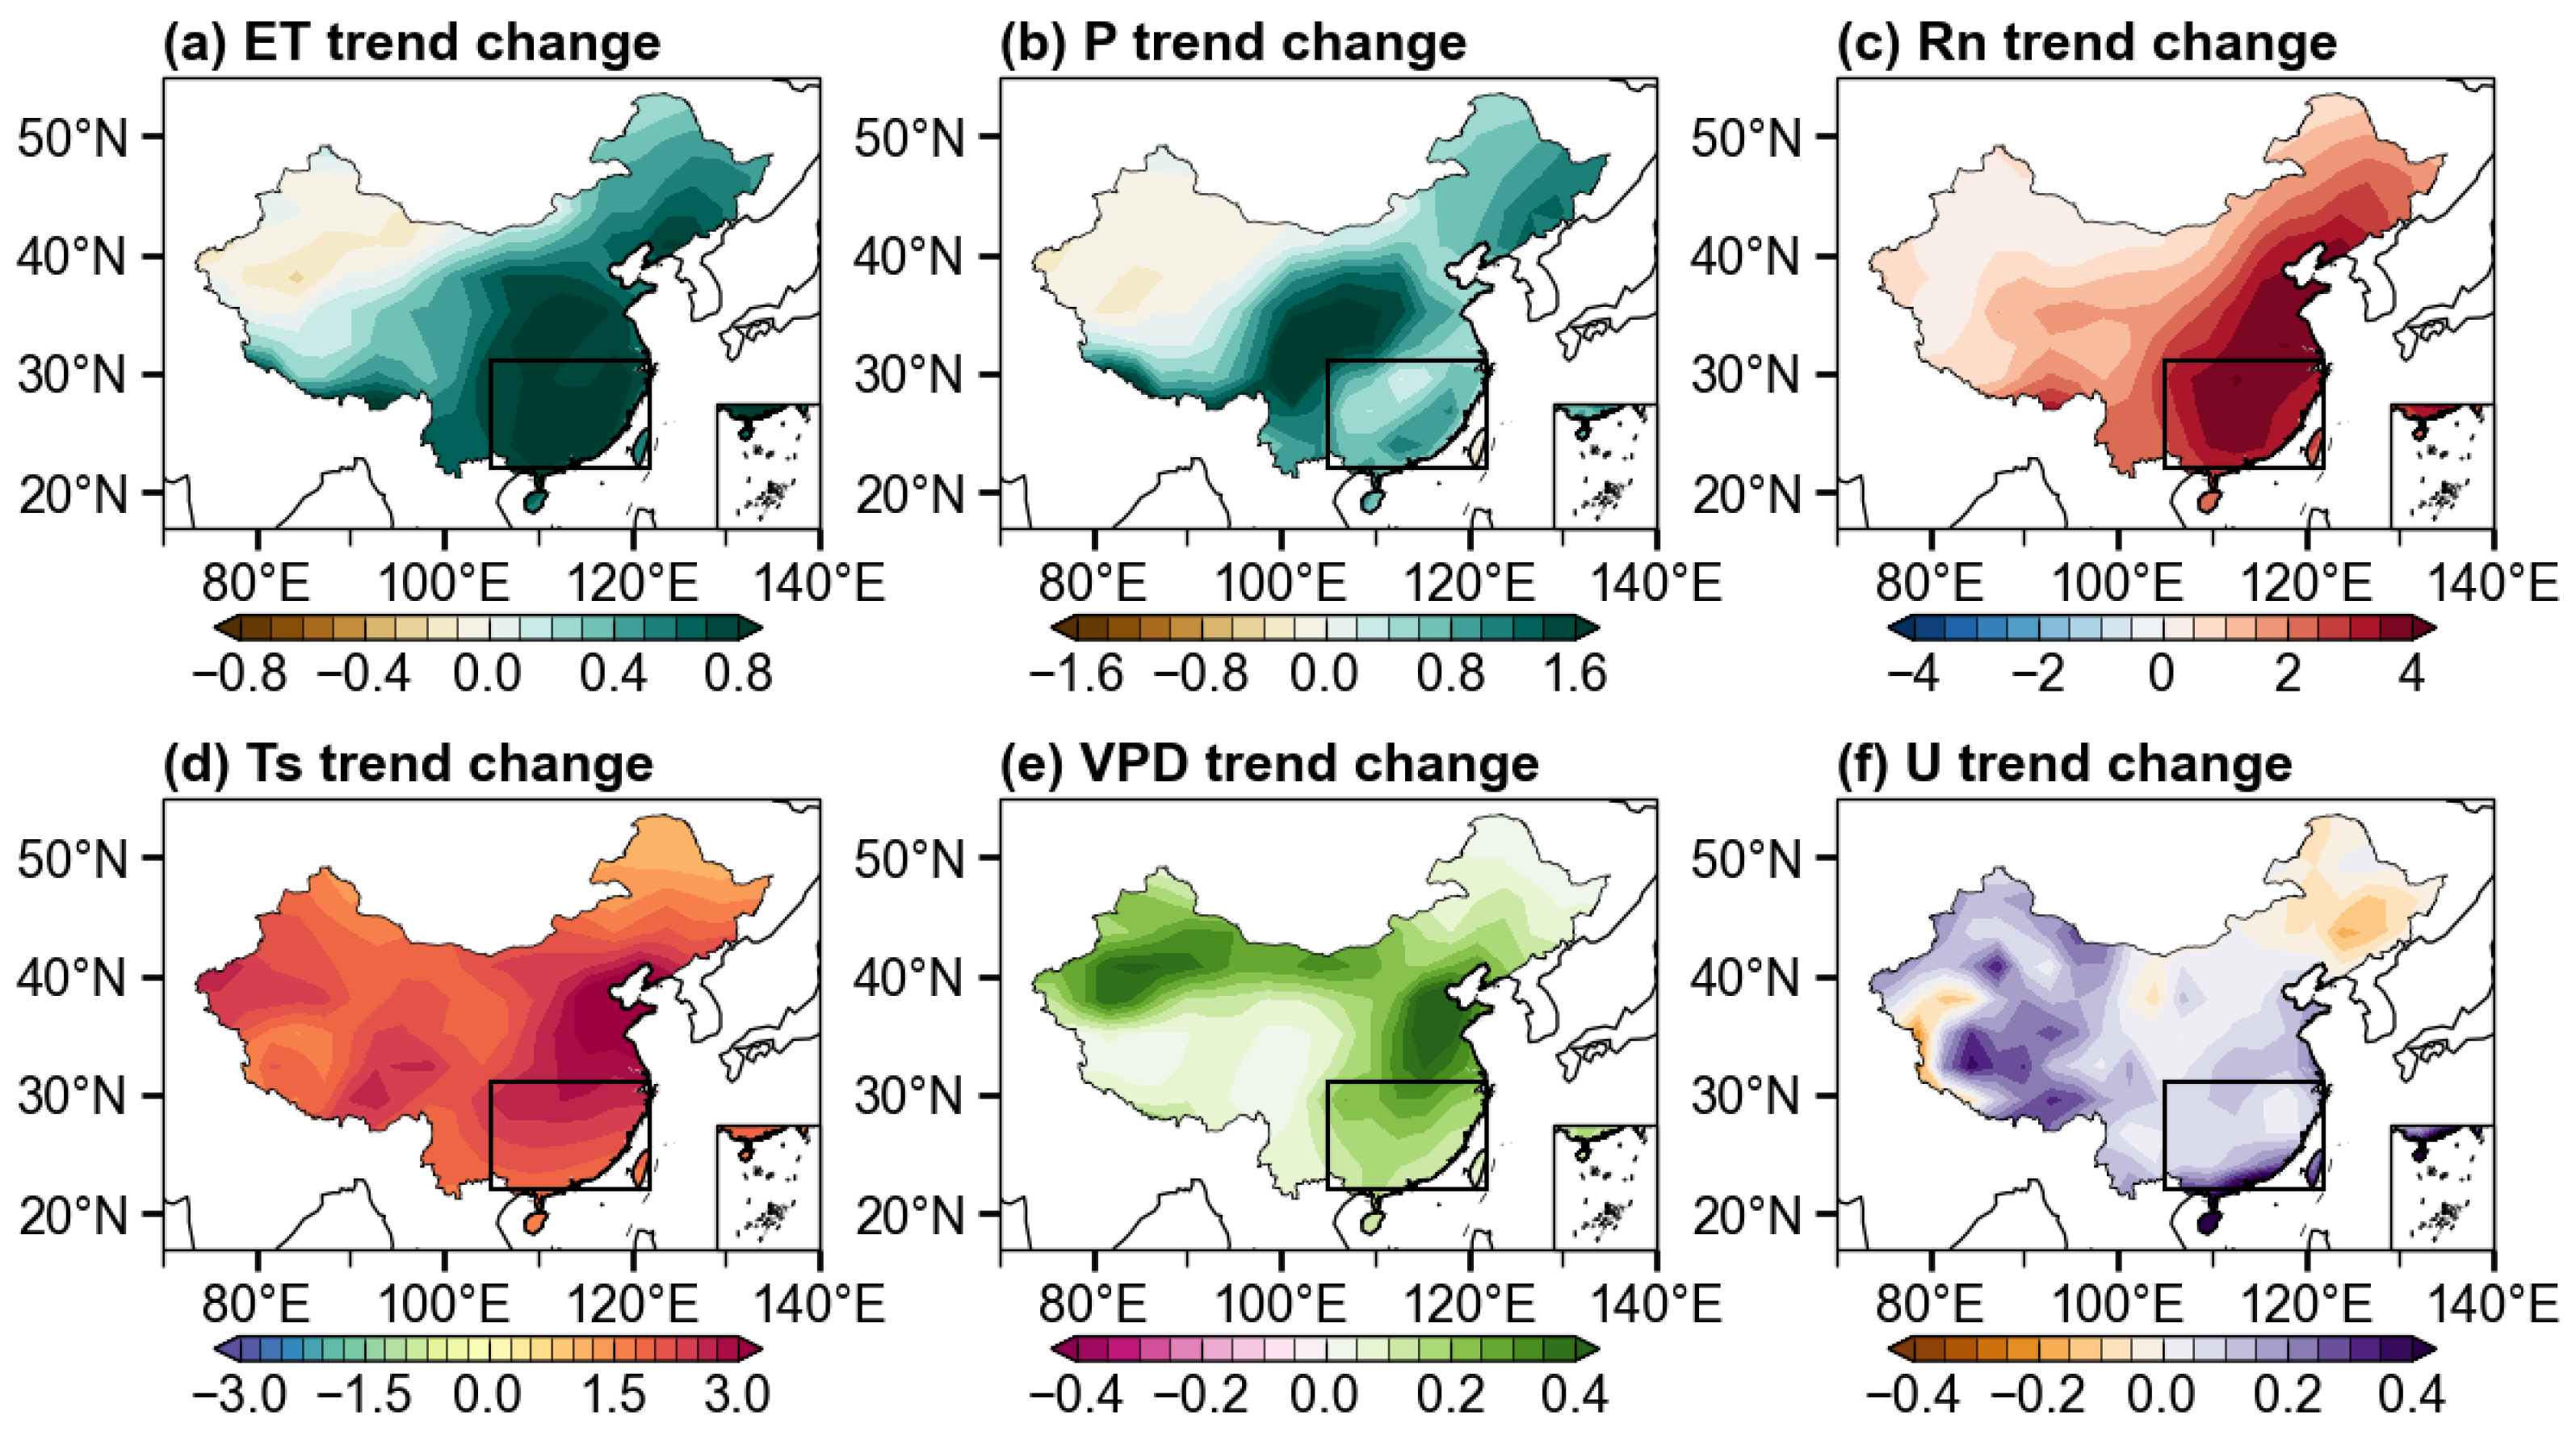
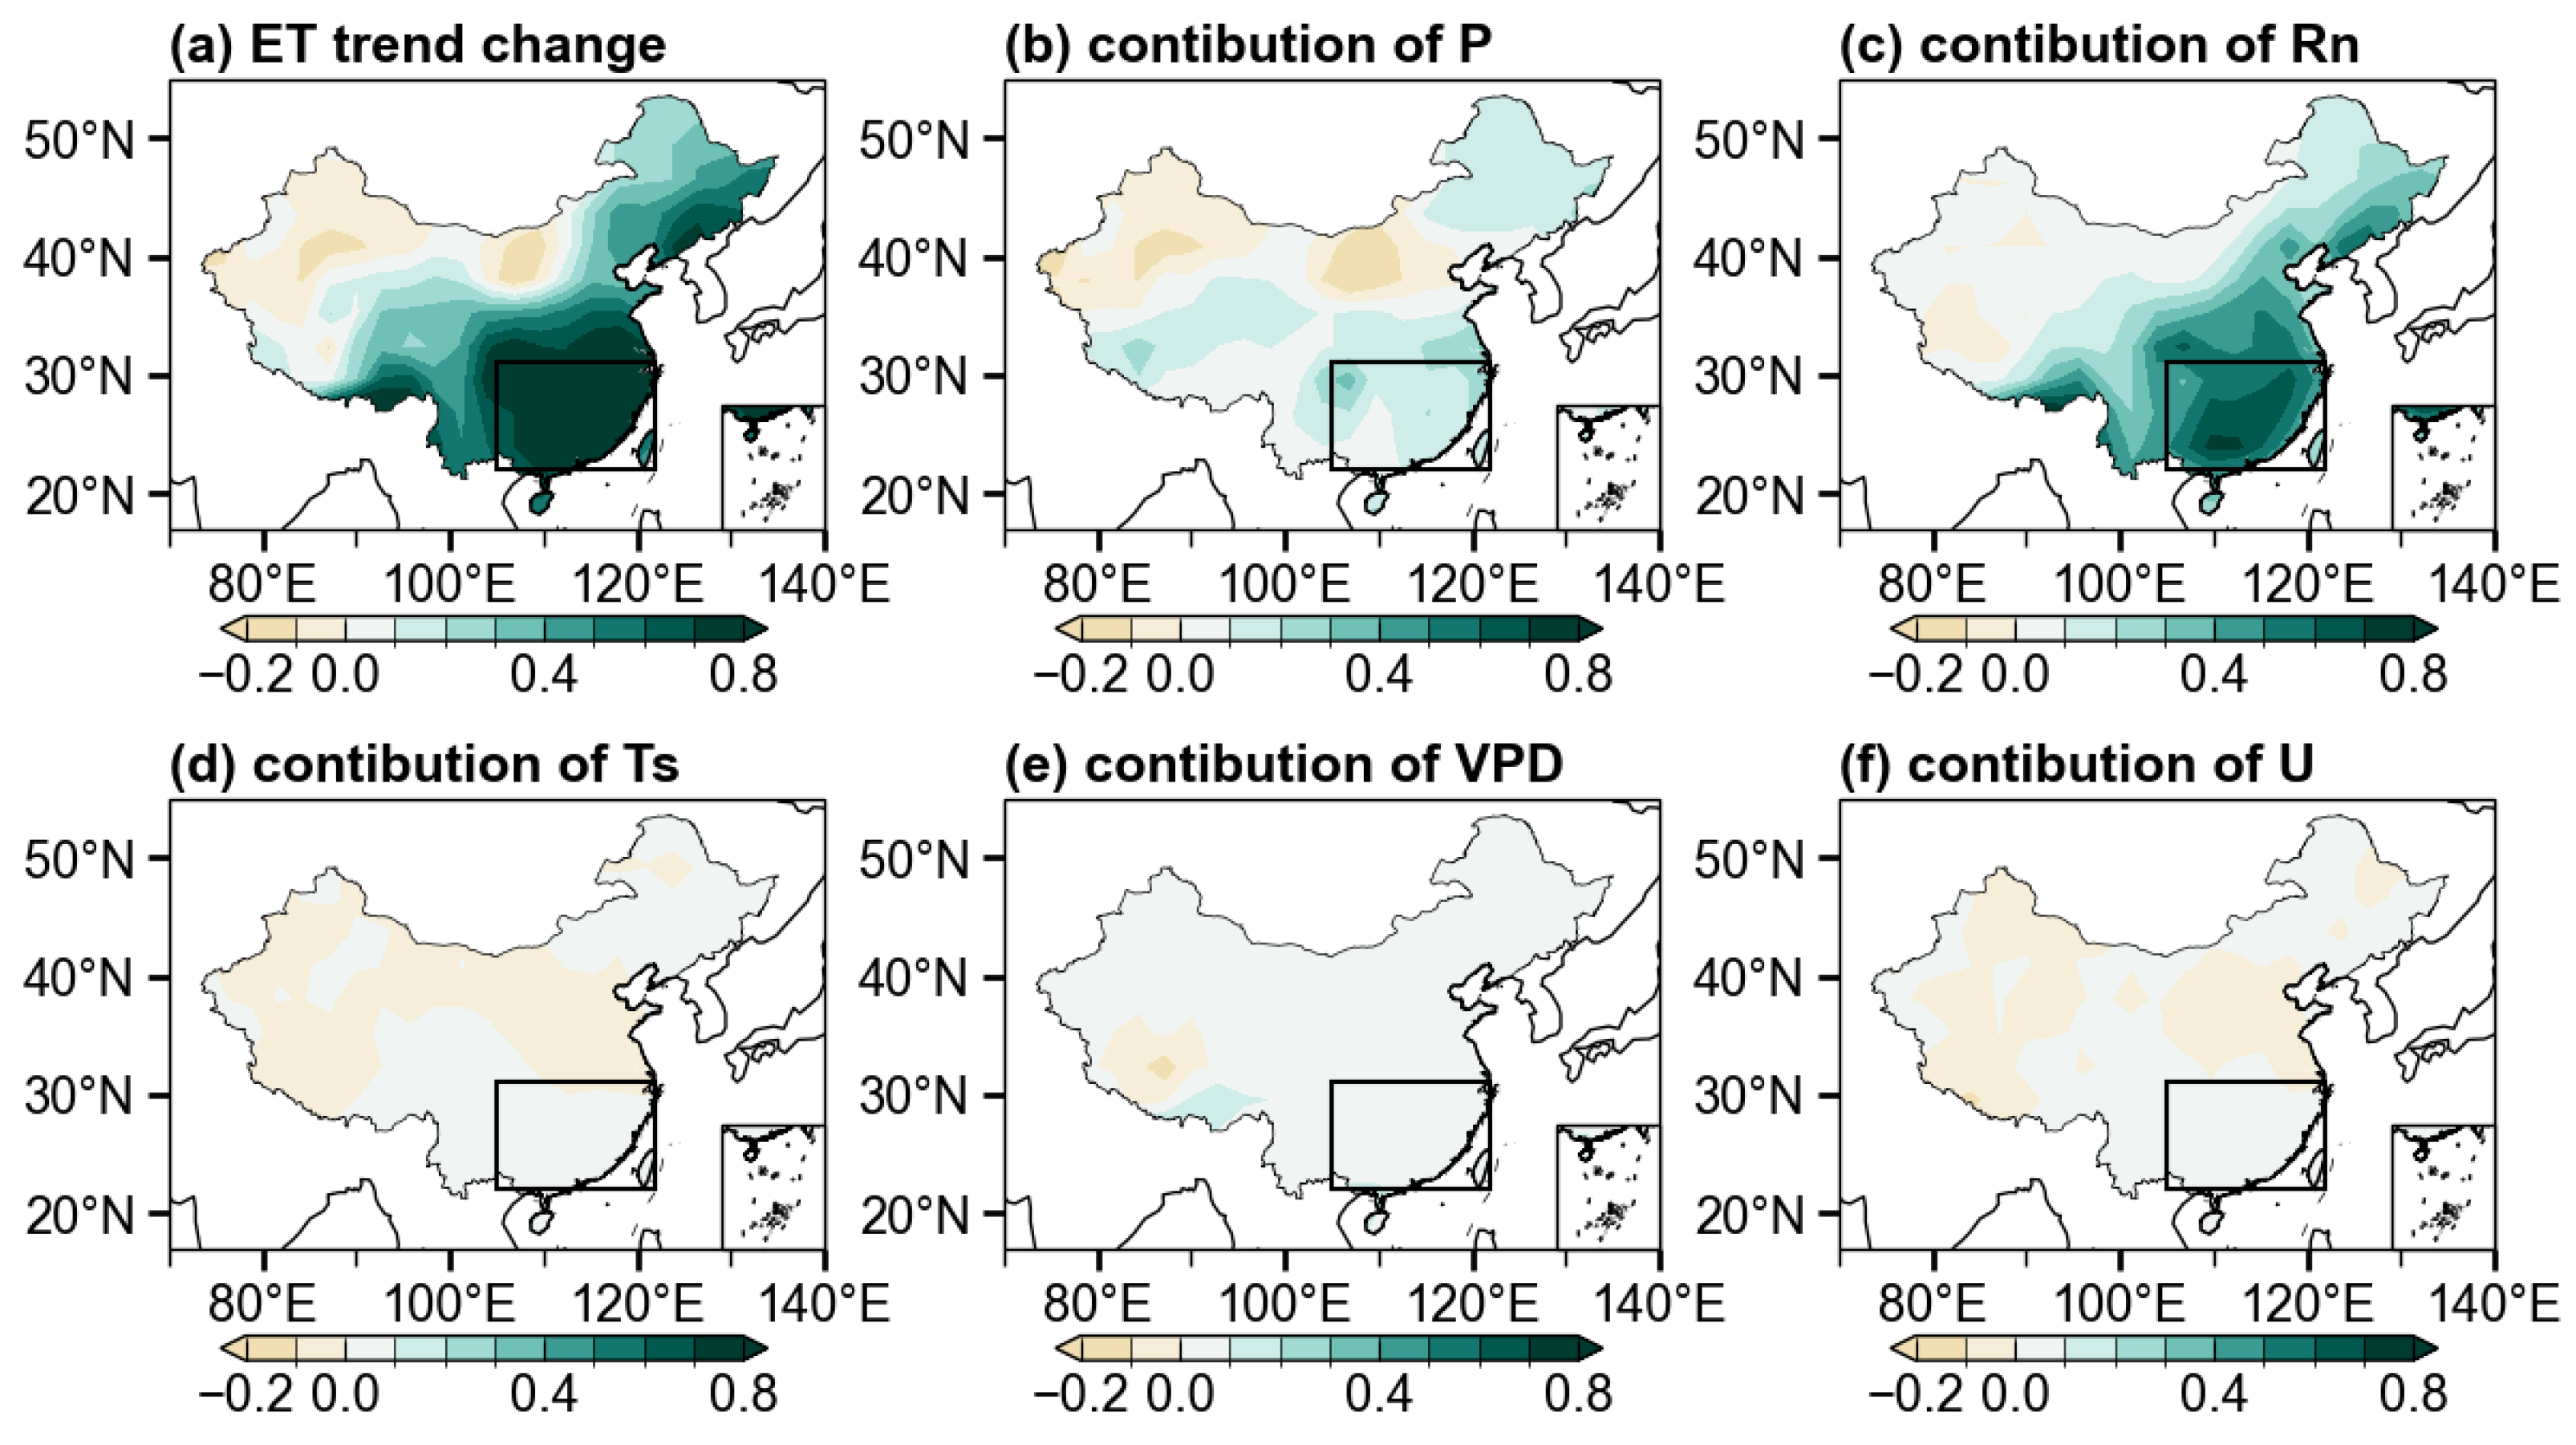
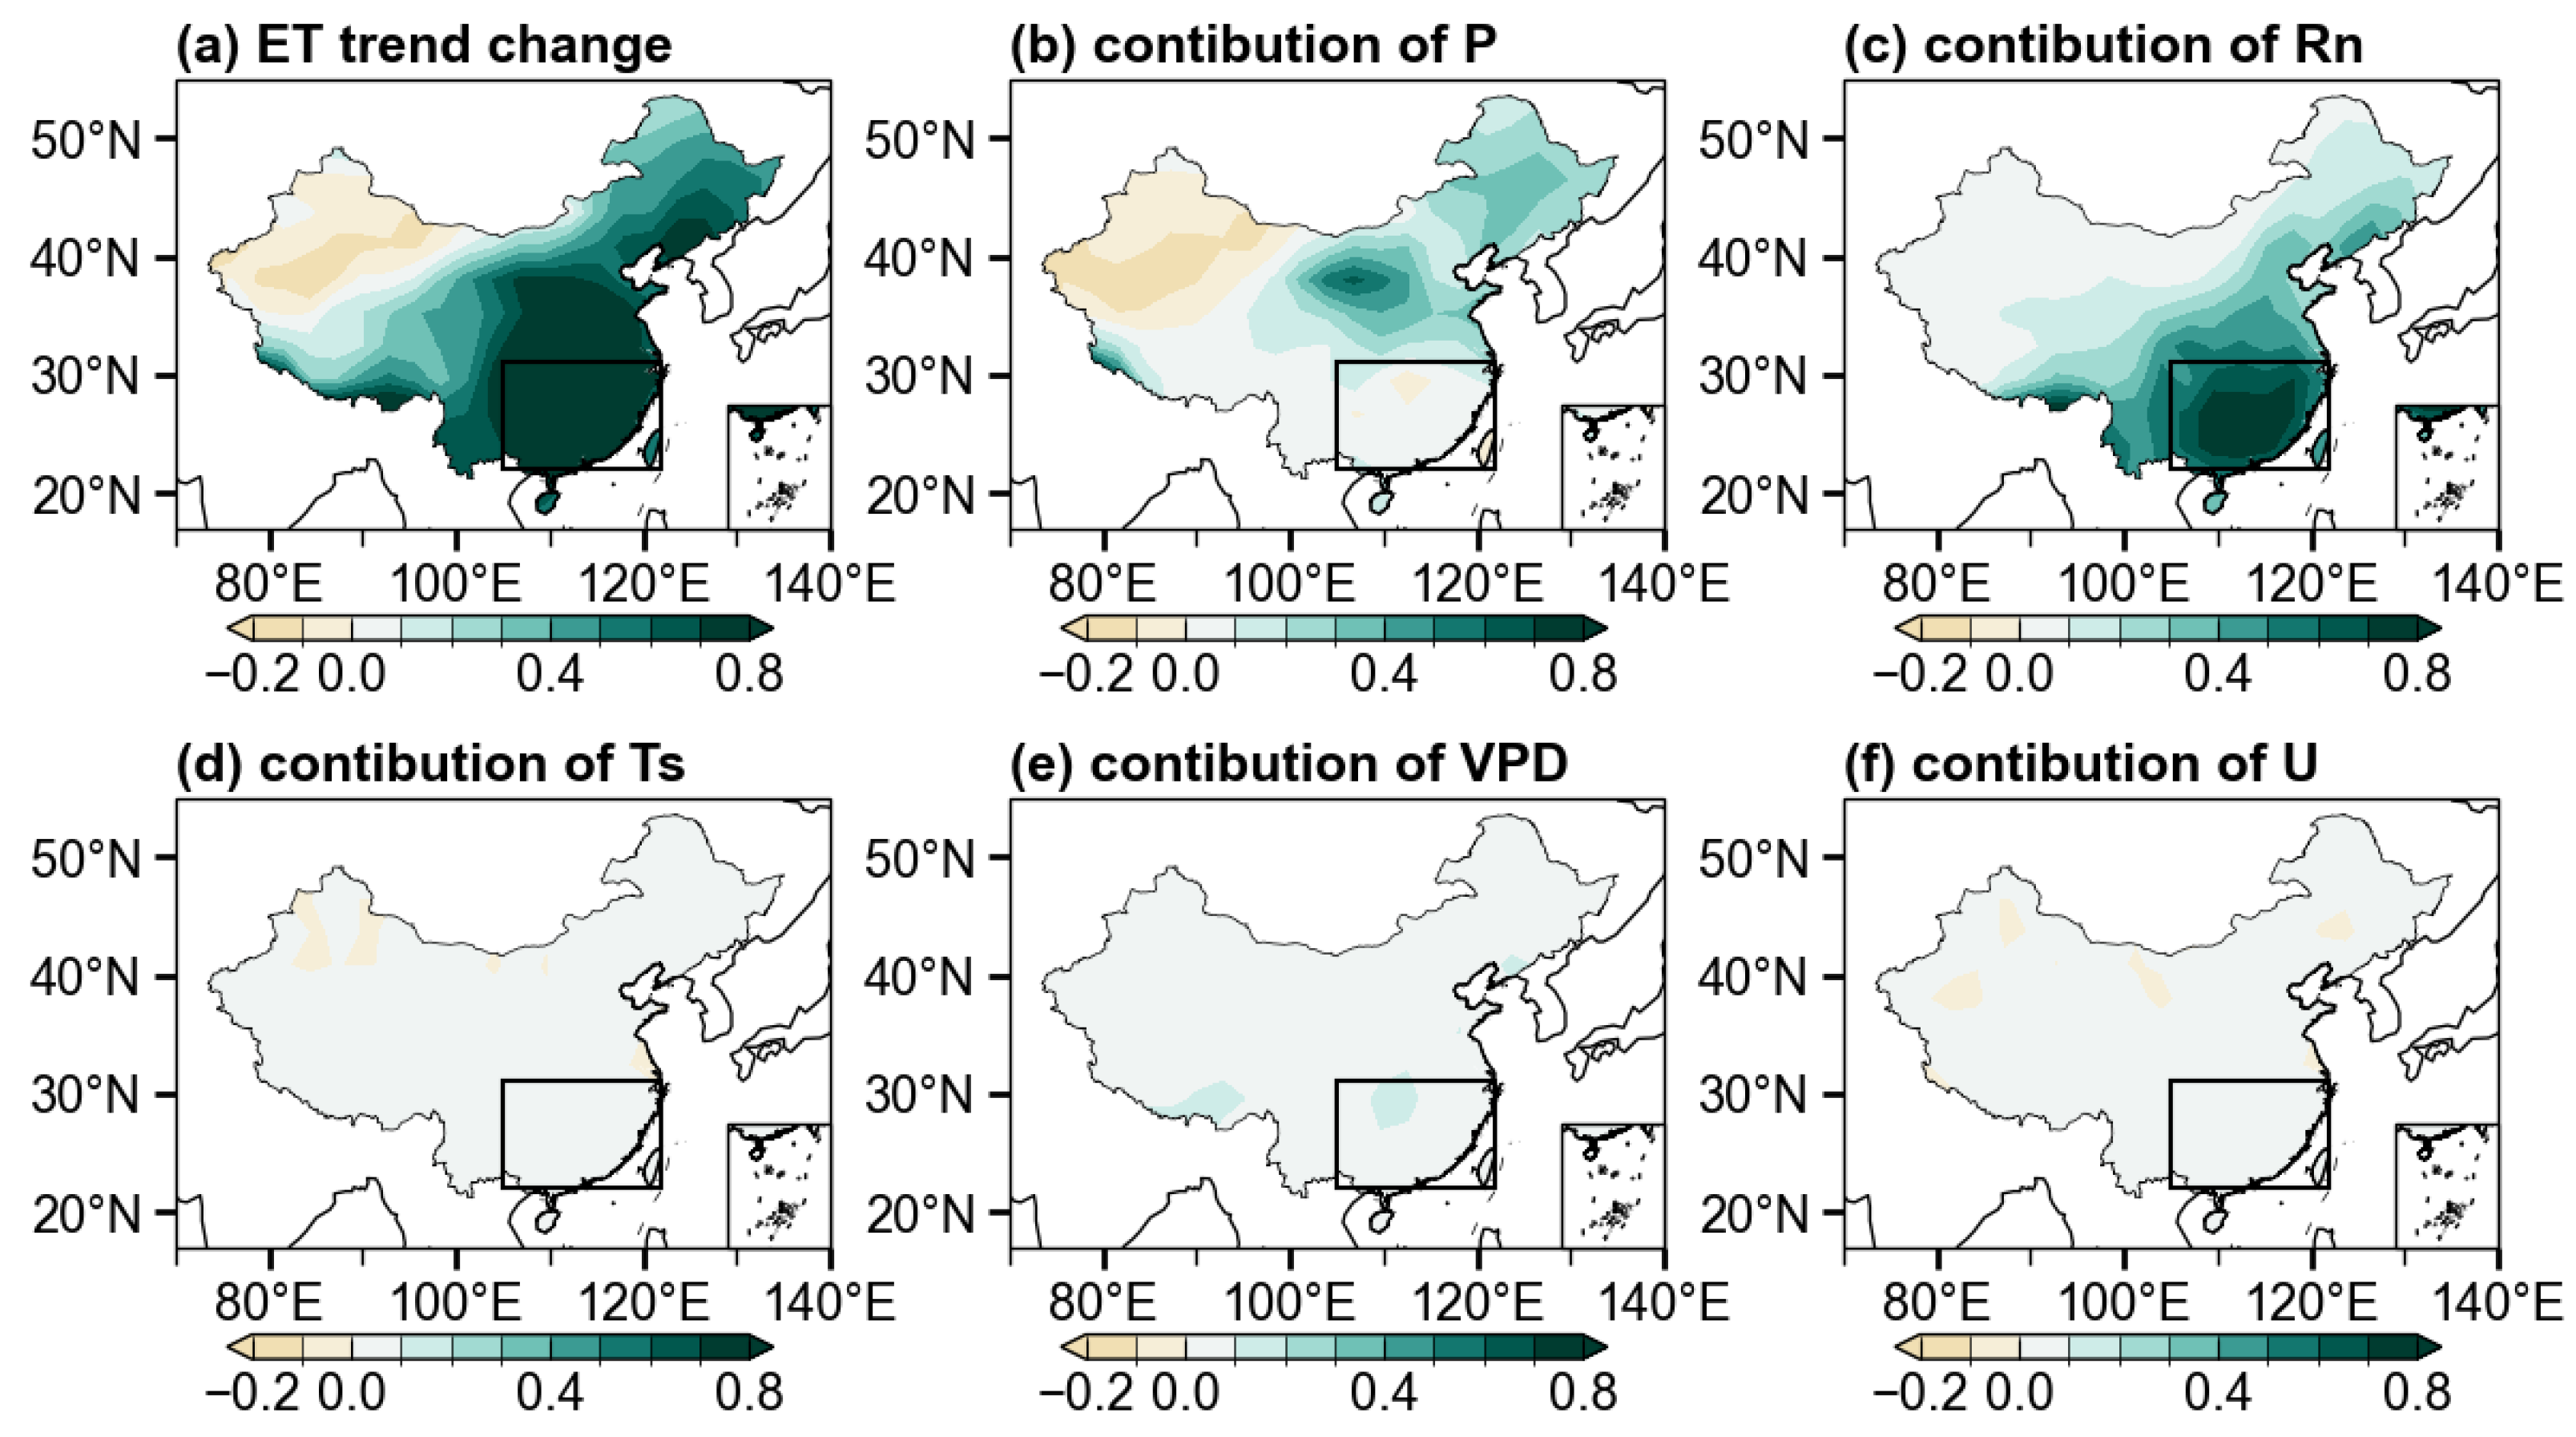
3.3. Key Climate Variables in Changing ET Trend from AA Forcing

To further understand how individual climate variables influence ET trend change and to quantify their contributions, we independently calculate the contribution of each variable to the ET trend change. Figure 5b presents the contributions of precipitation, net surface radiation, surface temperature, vapor pressure deficit, and surface wind speed to ET trend changes under the ALL forcing, AA forcing, and GHG forcing. Under the ALL forcing, net surface radiation emerges as the most significant contributor. Its contribution is 0.37 mm d−1 cent−1, accounting for 60% of the total ET trend change, followed by precipitation, which contributes 28%. Although surface temperature exhibits a notable trend change, its contribution, along with that of vapor pressure deficit and surface wind speed, is limited (Figure 5b).
From a spatial pattern perspective, precipitation’s contribution is generally positive across most regions, with relatively uniform intensity (Figure 8b), while the decreased precipitation could reduce the ET over northwestern China and parts of Inner Mongolia (Figure 8b). The spatial distribution of the contribution from net surface radiation closely mirrors that of the ET trend change, significantly concentrated in southeastern China (Figure 8c). Notably, in southeastern China, the contribution of net surface radiation to ET change reaches up to 0.83 mm d−1 cent−1. In contrast, the contributions of surface temperature, vapor pressure deficit, and wind speed are negligible across all of China (Figure 8d–f). These findings suggest that the ET trend change in southeastern China under ALL forcing is primarily driven by the change in net surface radiation. It is worth noting that in northwestern China, where other climatic factors demonstrate limited contributions, the negative ET trend change is predominantly driven by reduced precipitation (Figure 8a,b).
The impact of AA on ET trend change also demonstrates the vital role of net surface radiation. Under the AA forcing, the contribution of net surface radiation to the ET trend change is 0.65 mm d−1 cent−1, accounting for 77% of the ET trend change. The roles of precipitation and vapor pressure deficit are much less important, only contributing 8% and 10%, respectively (Figure 5b). Spatially, the contribution of net surface radiation is mainly located over southeastern China with a northwestward decrease pattern. This pattern is highly consistent with that from the ALL forcing experiment. The increase in vapor pressure deficit has a coherent positive contribution to ET change over all of China. The contribution of precipitation is mainly in northeastern and northern China, with a marginal contribution in southeastern China (Figure 9b). The contributions of surface temperature and wind speed remain weak across China (Figure 9d–f).
In summary, the trend change in ET in southeastern China under ALL forcing is predominantly attributed to changes in net surface radiation. Consistently, net surface radiation is the dominant factor driving ET trend change under AA forcing, reinforcing the critical role of aerosols in shaping regional land hydrological processes.

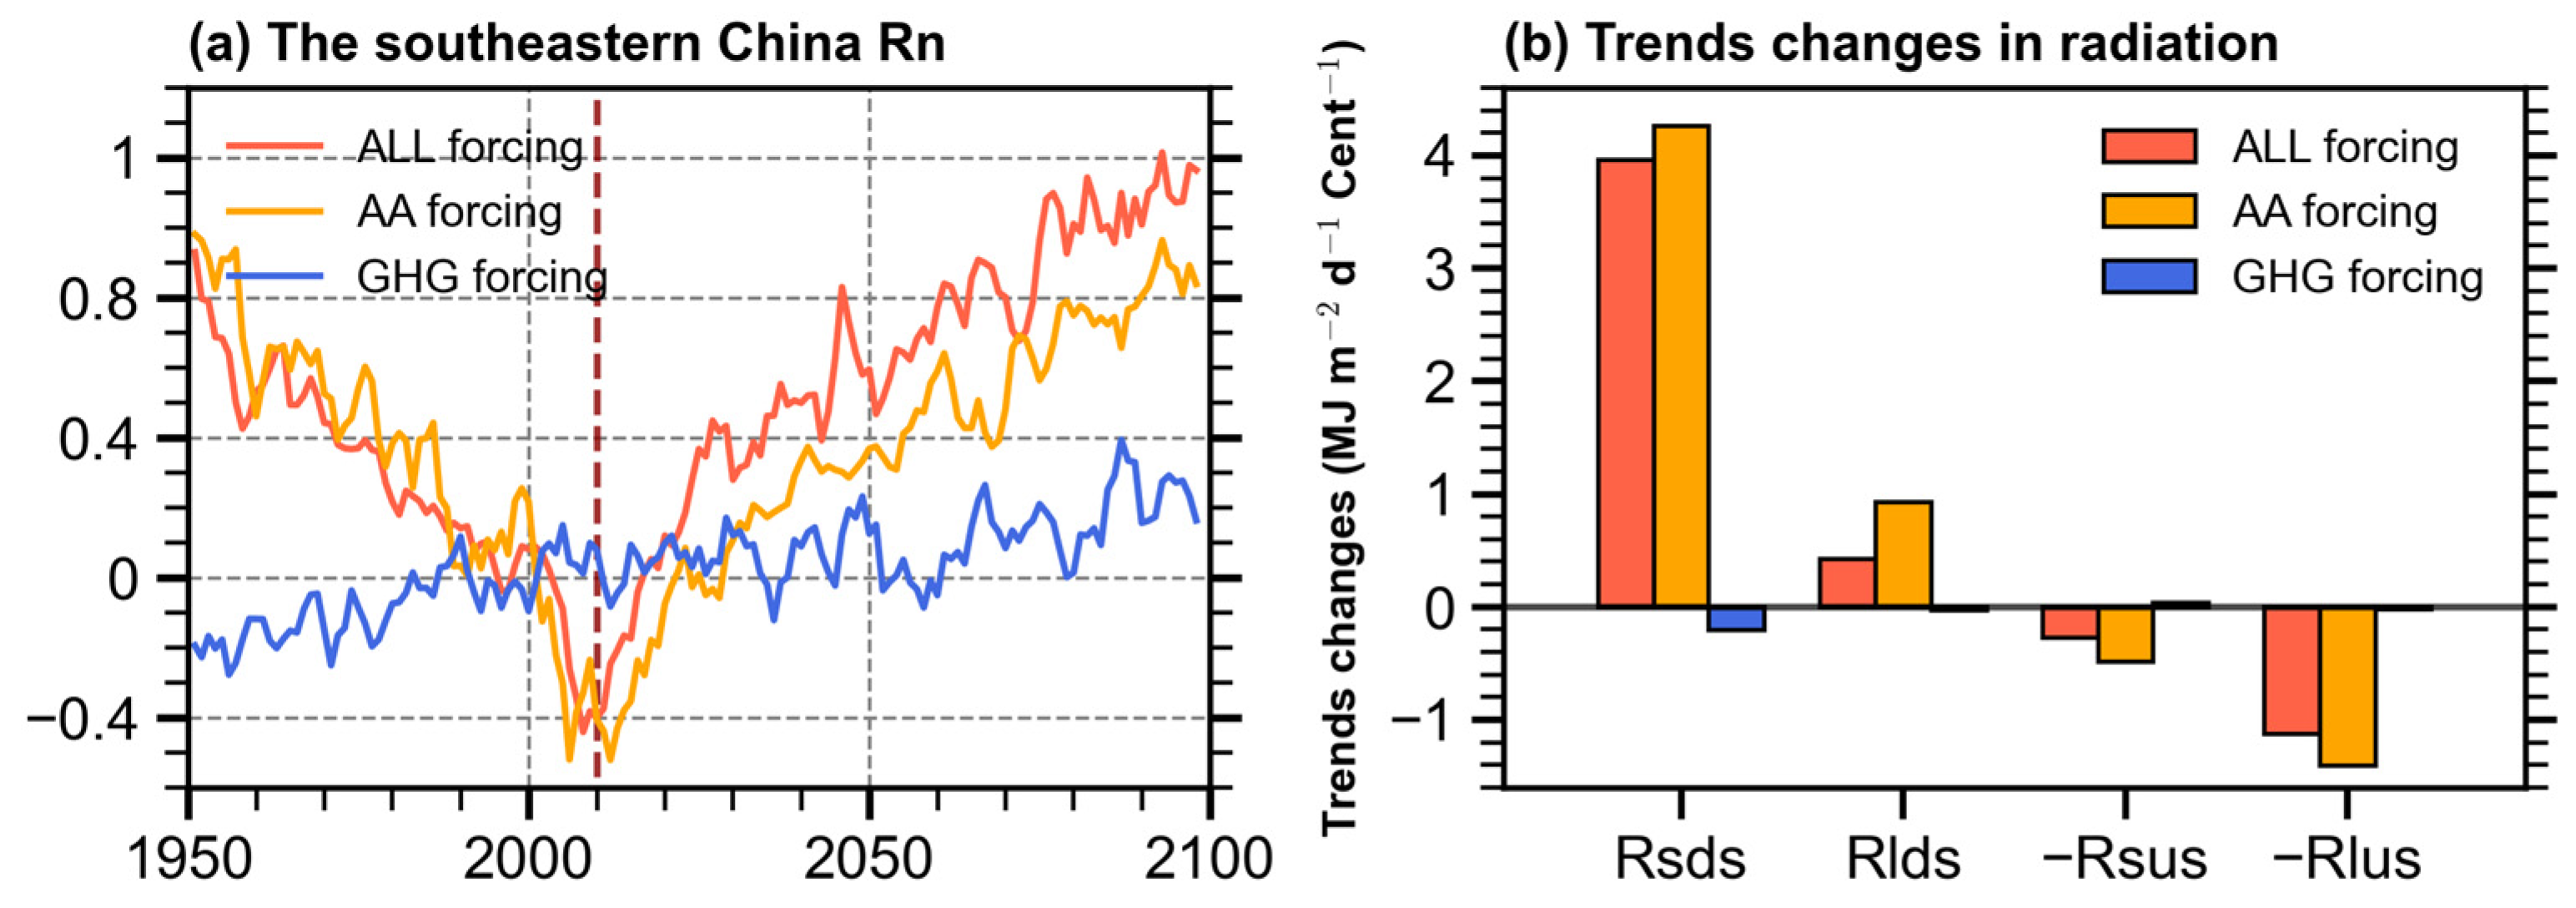
3.4. Physical Processes Responsible for Net Surface Radiation Change Under AA Forcing

What is the cause of the change in net surface radiation under AA forcing? As illustrated in Figure 10a, under both ALL forcing and AA forcing, the net surface radiation during summer in southeastern China exhibits a marked transition around 2010. The magnitude of the trend change under ALL forcing is close to that in the AA forcing. In contrast, under GHG forcing, the summer ET in southeastern China is relatively stable, showing a gradual increase without a clear turning point. Thus, it is essential to understand the causes of net surface radiation under AA forcing.
Net surface radiation is the balance of incoming and outgoing radiation. It can be decomposed into the contributions of downward and upward shortwave and longwave radiation terms. Figure 10b highlights the trend changes in these radiation components under the three types of forcings. There are downward shortwave radiation (Rsds), downward longwave radiation (Rlds), upward shortwave radiation (Rsus), and upward longwave radiation (Rlus). Under the ALL and AA forcing, the significant increase in downward shortwave radiation was the dominant factor driving changes in net radiation. However, the contributions from other radiation terms are relatively small.
The spatial pattern of the downward solar radiation shows that the apparent change is in eastern China, but a weaker change is located in northwestern China in the ALL forcing experiment (Figure 11a–c). It is mainly due to the fact that the AA decreases and increases the downward shortwave radiation in a similar pattern and magnitude as that in the ALL forcing experiment before and after 2010, respectively. Especially, the AA forcing dominates the changes over southeastern China. The downward shortwave radiation due to GHG forcing is small over southeastern China. It indicates that the AA forcing is the key to forming the pattern and magnitude of the downward surface radiation.
Prior studies have found that aerosols can significantly alter the solar radiation received by the Earth through their absorption, reflection, and scattering effects [35,43,44]. These processes significantly modulate the amount of solar radiation reaching the Earth’s surface, thereby influencing net surface radiation. Figure 12a–c show the trends in aerosol optical depth in reanalysis during 1980–2000, 2000–2020, and the trend difference. Since the late 20th century, changes in aerosol concentrations and spatial distributions show an increase in eastern China and a decrease in western China (Figure 12a). The aerosol emission is gradually reduced after 2000, resulting in the apparent change in aerosol optical depth trend (Figure 12c). The CMIP6 models well reproduced the spatial pattern of the aerosol optical depth changes, while the trend change happened in 2010. Before 2010, the model simulated an increase in aerosol optical depth over eastern China (Figure 12d). The increase in aerosols enhances the reflectance of downward shortwave radiation by increasing albedo, strengthens the scattering of shortwave radiation, and absorbs solar radiation by absorbing aerosols [35,43,44]. It leads to a decrease in shortwave radiation reaching the Earth’s surface (Figure 11a,d). After 2010, the aerosol emission is gradually reduced, which leads to an increase in solar radiation reaching the surface (Figure 11b,e). Thus, the trend in downward shortwave radiation could be changed over southeastern China before and after 2010.
Notably, this resulted in a pronounced aerosol optical depth trend change between the two periods, primarily concentrated in eastern China (Figure 12f). The spatial patterns of aerosol optical depth trend change closely align with those of downward shortwave radiation trend change under AA forcing.
Why does the simulated aerosol optical depth trend change delay about 10 years compared to the reanalysis? There are two possible uncertainty sources in the climate models. The original data for generating CMIP6 forcing data with the MACv2-SP method has spare temporal and spatial resolutions [70]. For instance, the temporal resolution of the original aerosol emission in the CMIP6 forcing data is about 10 years. It has been interpolated to the yearly data to drive historical and anthropogenic aerosol-only experiments. Studies have shown that the sulfate aerosol emission for all of China peaked around 2006 [51], which may have caused the peak of aerosol emission forcing in 2010 [71]. However, observations over large cities in southeastern China indicate the peak of aerosol emission is around 2004 [72]. In the MACv2-SP method, nine plumes of aerosol emissions are specified over the globe [73]. The plume centers are placed where the local aerosol optical depth maximizes. The East Asia plume is specified at 30°N and 114°E; it is located at the north boundary of southeastern China [73]. It would represent the evolution of aerosol over central China, rather than southeastern China. This temporal and spatial mismatching may lead to a delay of 10 years in aerosol forcing between the CMIP6 simulation and observation.

4. Conclusions

This study provides a comprehensive investigation into the mechanisms underlying the observed decadal change in summer ET over southeastern China during the past four decades. Multiple ET products indicate a decreasing trend in ET before 2000, followed by an increasing trend after 2000 over southeastern China, yielding a significant decadal reversal in ET. The ensemble means of the CMIP6 ALL forcing simulations well reproduced the trend change in ET over southeastern China, although the simulated timing lagged by approximately 10 years. Utilizing single-forcing experiments from the DAMIP, we found that the significant ET trend change is only shown in the anthropogenic aerosol-only experiment, while GHG forcing had a negligible impact. The trend changes in key climatic variables in the ALL forcing experiment are close to those in the AA forcing experiment, further confirming the vital role of AA.
Applying the attribution method, we quantified the contributions of individual climate variables to the ET trend change. Our findings reveal that the ET trend change was predominantly driven by the change in net surface radiation, which accounted for about three-quarters of the total trend change under AA forcing. The contributions of precipitation and vapor pressure deficit are both about 10%. Other climate variables, including surface temperature and wind speed, had relatively small impacts on ET trends. This finding underscores that ET in southeastern China, where it is heavily influenced by monsoon systems, is primarily limited by surface available energy rather than other climate factors. This aligns with previous studies emphasizing the dominant role of available energy in determining ET in humid monsoon regions [8,74,75].
The trend change in the net surface radiation was concentrated in southeastern China, aligning with regions where surface downward shortwave radiation experienced a marked decrease and increase before and after 2010, respectively, due to a significant change in aerosol optical depth. This is physically consistent with the radiative effect of aerosols. Observations showed that aerosol optical depth trends in East Asia reversed during the early 21st century, with a consistent increase before 2000 followed by a decline due to stricter emission controls [50,51,52,53]. The strong correspondence between aerosol optical depth changes and surface radiation changes provides compelling evidence that radiation alterations driven by aerosols are the primary drivers of the observed ET trends. The delayed response of the ET trend in the CMIP6 models may be due to the simplified treatment of aerosol forcing in spatial distribution and temporal evolution.

5. Discussions

In this study, we identified the decadal change in the ET trend during 1980–2020 over southeastern China, extending the temporal changes in ET from long-term trend to shorter time scales [7,8,25,31]. The decadal change in the ET trend is attributed to the aerosol emissions rather than the GHG. This differs from the vital role of GHG on a global scale ET change, indicating the difference in dominating physics over global and regional scales. Our findings suggest that targeted aerosol emission controls in rapidly developing monsoon countries could deliver dual benefits: mitigating regional hydrological extremes while simultaneously improving air quality. Specifically, regional policymakers could prioritize synergistic strategies that integrate air pollution control with water resource management.
Our attribution study relies on the simulations from CMIP6 models. Many studies pointed out that the CMIP6 aerosol forcing data have a large bias over China, which may be responsible for the 10-year delay in the ET trend change. Improving the anthropogenic emission data quality should be considered in the experimental design of the next phase of CMIP. In addition, the model outputs from the CMIP6 may not well separate the impacts from the scattering and absorbing effects of aerosols on ET change. This could be achieved once the CMIP7 provides more variables. The current state-of-the-art climate models still have significant biases in stimulating the radiative effect of aerosols. Thus, improving the model’s ability to indirectly effect could potentially mitigate the bias in global and regional scale ET changes.
The current study used the Penman–Monteith equation to attribute the impacts from different climate factors. This method neglects the mechanisms of terrestrial hydrological and biophysical feedback processes. These aspects warrant further investigation in future studies.

Author Contributions

Conceptualization, J.C. and Z.K.; analysis, Z.K. and J.C.; methodology, J.C. and Z.K.; writing, Z.K., J.C. and B.W. All authors have read and agreed to the published version of the manuscript.

Funding

This research was jointly funded by the National Key R&D Program of China (2023YFF0805402), the Natural Science Foundation of China of Jiangsu Province (BK20220108), and the Natural Science Foundation of China (42375034).

Data Availability Statement

The CMIP6 model data are available from https://aims2.llnl.gov/search/cmip6/ (accessed on 12 January 2025).

Acknowledgments

We acknowledge the World Climate Research Programme’s Working Group on Coupled Modelling, which is responsible for CMIP. The authors acknowledge the computer resources at the NUIST High Performance Computer Center.

Conflicts of Interest

The authors declare no conflicts of interest.

References

  1. Zhang, K.; Kimball, J.S.; Running, S.W. A Review of Remote Sensing Based Actual Evapotranspiration Estimation. WIREs Water 2016, 3, 834–853. [Google Scholar] [CrossRef]
  2. Trenberth, K.E.; Fasullo, J.T.; Kiehl, J. Earth’s Global Energy Budget. Bull. Am. Meteorol. Soc. 2009, 90, 311–324. [Google Scholar] [CrossRef]
  3. Koster, R.D.; Sud, Y.C.; Guo, Z.; Dirmeyer, P.A.; Bonan, G.; Oleson, K.W.; Chan, E.; Verseghy, D.; Cox, P.; Davies, H.; et al. GLACE: The Global Land–Atmosphere Coupling Experiment. Part I: Overview. J. Hydrometeorol. 2006, 7, 590–610. [Google Scholar] [CrossRef]
  4. Wang, K.; Dickinson, R.E. A Review of Global Terrestrial Evapotranspiration: Observation, Modeling, Climatology, and Climatic Variability. Rev. Geophys. 2012, 50, 2011RG000373. [Google Scholar] [CrossRef]
  5. Fisher, J.B.; Melton, F.; Middleton, E.; Hain, C.; Anderson, M.; Allen, R.; McCabe, M.F.; Hook, S.; Baldocchi, D.; Townsend, P.A.; et al. The Future of Evapotranspiration: Global Requirements for Ecosystem Functioning, Carbon and Climate Feedbacks, Agricultural Management, and Water Resources. Water Resour. Res. 2017, 53, 2618–2626. [Google Scholar] [CrossRef]
  6. Oki, T.; Kanae, S. Global Hydrological Cycles and World Water Resources. Science 2006, 313, 1068–1072. [Google Scholar] [CrossRef]
  7. Hong, S.; Deng, H.; Zheng, Z.; Deng, Y.; Chen, X.; Gao, L.; Chen, Y.; Liu, M. The Influence of Variations in Actual Evapotranspiration on Drought in China’s Southeast River Basin. Sci. Rep. 2023, 13, 21336. [Google Scholar] [CrossRef]
  8. Zhu, X.; Kong, Z.; Cao, J.; Gao, R.; Gao, N. Attributing the Decline of Evapotranspiration over the Asian Monsoon Region during the Period 1950–2014 in CMIP6 Models. Remote Sens. 2024, 16, 2027. [Google Scholar] [CrossRef]
  9. Allan, R.; Pereira, L.; Smith, M. Crop Evapotranspiration-Guidelines for Computing Crop Water Requirements-FAO Irrigation and Drainage Paper 56; FAO: Rome, Italy, 1998; Volume 56. [Google Scholar]
  10. Huntington, T.G. Evidence for Intensification of the Global Water Cycle: Review and Synthesis. J. Hydrol. 2006, 319, 83–95. [Google Scholar] [CrossRef]
  11. Wentz, F.J.; Ricciardulli, L.; Hilburn, K.; Mears, C. How Much More Rain Will Global Warming Bring? Science 2007, 317, 233–235. [Google Scholar] [CrossRef]
  12. Thomas, A. Spatial and Temporal Characteristics of Potential Evapotranspiration Trends over China. Int. J. Climatol. 2000, 20, 381–396. [Google Scholar] [CrossRef]
  13. Roderick, M.L.; Farquhar, G.D. The Cause of Decreased Pan Evaporation over the Past 50 Years. Science 2002, 298, 1410–1411. [Google Scholar] [CrossRef]
  14. Roderick, M.L.; Farquhar, G.D. Changes in Australian Pan Evaporation from 1970 to 2002. Int. J. Climatol. 2004, 24, 1077–1090. [Google Scholar] [CrossRef]
  15. Chen, D.; Gao, G.; Xu, C.-Y.; Guo, J.; Ren, G. Comparison of the Thornthwaite Method and Pan Data with the Standard Penman-Monteith Estimates of Reference Evapotranspiration in China. Clim. Res. 2005, 28, 123–132. [Google Scholar] [CrossRef]
  16. Xu, C.; Gong, L.; Jiang, T.; Chen, D. Decreasing Reference Evapotranspiration in a Warming Climate—A Case of Changjiang (Yangtze) River Catchment during 1970–2000. Adv. Atmos. Sci. 2006, 23, 513–520. [Google Scholar] [CrossRef]
  17. Zhu, Z.; Piao, S.; Myneni, R.B.; Huang, M.; Zeng, Z.; Canadell, J.G.; Ciais, P.; Sitch, S.; Friedlingstein, P.; Arneth, A.; et al. Greening of the Earth and Its Drivers. Nat. Clim. Change 2016, 6, 791–795. [Google Scholar] [CrossRef]
  18. Deng, H.; Chen, Y.; Chen, X. Driving Factors and Changes in Components of Terrestrial Water Storage in the Endorheic Tibetan Plateau. J. Hydrol. 2022, 612, 128225. [Google Scholar] [CrossRef]
  19. Nistor, M.-M.; Satyanaga, A.; Dezsi, Ş.; Haidu, I. European Grid Dataset of Actual Evapotranspiration, Water Availability and Effective Precipitation. Atmosphere 2022, 13, 772. [Google Scholar] [CrossRef]
  20. Kong, D.; Gu, X.; Li, J.; Ren, G.; Liu, J. Contributions of Global Warming and Urbanization to the Intensification of Human-Perceived Heatwaves Over China. J. Geophys. Res. Atmos. 2020, 125, e2019JD032175. [Google Scholar] [CrossRef]
  21. Liu, J.; Zhang, Q.; Feng, S.; Gu, X.; Singh, V.P.; Sun, P. Global Attribution of Runoff Variance Across Multiple Timescales. J. Geophys. Res. Atmos. 2019, 124, 13962–13974. [Google Scholar] [CrossRef]
  22. Xiao, M.; Yu, Z.; Kong, D.; Gu, X.; Mammarella, I.; Montagnani, L.; Arain, M.A.; Merbold, L.; Magliulo, V.; Lohila, A.; et al. Stomatal Response to Decreased Relative Humidity Constrains the Acceleration of Terrestrial Evapotranspiration. Environ. Res. Lett. 2020, 15, 094066. [Google Scholar] [CrossRef]
  23. Zeng, R.; Cai, X. Climatic and Terrestrial Storage Control on Evapotranspiration Temporal Variability: Analysis of River Basins around the World. Geophys. Res. Lett. 2016, 43, 185–195. [Google Scholar] [CrossRef]
  24. Rigden, A.J.; Salvucci, G.D. Stomatal Response to Humidity and CO2 Implicated in Recent Decline in US Evaporation. Glob. Change Biol. 2017, 23, 1140–1151. [Google Scholar] [CrossRef] [PubMed]
  25. Brutsaert, W. Global Land Surface Evaporation Trend during the Past Half Century: Corroboration by Clausius-Clapeyron Scaling. Adv. Water Resour. 2017, 106, 3–5. [Google Scholar] [CrossRef]
  26. McVicar, T.R.; Roderick, M.L.; Donohue, R.J.; Van Niel, T.G. Less Bluster Ahead? Ecohydrological Implications of Global Trends of Terrestrial near-Surface Wind Speeds. Ecohydrology 2012, 5, 381–388. [Google Scholar] [CrossRef]
  27. Martens, B.; Waegeman, W.; Dorigo, W.A.; Verhoest, N.E.C.; Miralles, D.G. Terrestrial Evaporation Response to Modes of Climate Variability. Npj Clim. Atmos. Sci. 2018, 1, 43. [Google Scholar] [CrossRef]
  28. Liu, Y.; Xiao, J.; Ju, W.; Xu, K.; Zhou, Y.; Zhao, Y. Recent Trends in Vegetation Greenness in China Significantly Altered Annual Evapotranspiration and Water Yield. Environ. Res. Lett. 2016, 11, 094010. [Google Scholar] [CrossRef]
  29. Wang, L.; Good, S.P.; Caylor, K.K. Global Synthesis of Vegetation Control on Evapotranspiration Partitioning. Geophys. Res. Lett. 2014, 41, 6753–6757. [Google Scholar] [CrossRef]
  30. Gao, G.; Chen, D.; Ren, G.; Chen, Y.; Liao, Y. Spatial and Temporal Variations and Controlling Factors of Potential Evapotranspiration in China: 1956–2000. J. Geogr. Sci. 2006, 16, 3–12. [Google Scholar] [CrossRef]
  31. Gao, G.; Chen, D.; Xu, C.; Simelton, E. Trend of Estimated Actual Evapotranspiration over China during 1960–2002. J. Geophys. Res. Atmos. 2007, 112, D11120. [Google Scholar] [CrossRef]
  32. Zhang, D.; Liu, X.; Zhang, L.; Zhang, Q.; Gan, R.; Li, X. Attribution of Evapotranspiration Changes in Humid Regions of China from 1982 to 2016. J. Geophys. Res. Atmos. 2020, 125, e2020JD032404. [Google Scholar] [CrossRef]
  33. Wu, G.; Li, Z.; Fu, C.; Zhang, X.; Zhang, R.; Zhang, R.; Zhou, T.; Li, J.; Li, J.; Zhou, D.; et al. Advances in Studying Interactions between Aerosols and Monsoon in China. Sci. China Earth Sci. 2016, 59, 1–16. [Google Scholar] [CrossRef]
  34. Cao, J.; Wang, B.; Wang, B.; Zhao, H.; Wang, C.; Han, Y. Sources of the Intermodel Spread in Projected Global Monsoon Hydrological Sensitivity. Geophys. Res. Lett. 2020, 47, e2020GL089560. [Google Scholar] [CrossRef]
  35. Cao, J.; Wang, H.; Wang, B.; Zhao, H.; Wang, C.; Zhu, X. Higher Sensitivity of Northern Hemisphere Monsoon to Anthropogenic Aerosol Than Greenhouse Gases. Geophys. Res. Lett. 2022, 49, e2022GL100270. [Google Scholar] [CrossRef]
  36. Douville, H.; Ribes, A.; Decharme, B.; Alkama, R.; Sheffield, J. Anthropogenic Influence on Multidecadal Changes in Reconstructed Global Evapotranspiration. Nat. Clim. Change 2013, 3, 59–62. [Google Scholar] [CrossRef]
  37. Liu, J.; Zhang, J.; Kong, D.; Feng, X.; Feng, S.; Xiao, M. Contributions of Anthropogenic Forcings to Evapotranspiration Changes Over 1980–2020 Using GLEAM and CMIP6 Simulations. J. Geophys. Res. Atmos. 2021, 126, e2021JD035367. [Google Scholar] [CrossRef]
  38. Ficklin, D.L.; Novick, K.A. Historic and Projected Changes in Vapor Pressure Deficit Suggest a Continental-Scale Drying of the United States Atmosphere. J. Geophys. Res. Atmos. 2017, 122, 2061–2079. [Google Scholar] [CrossRef]
  39. Scheff, J.; Frierson, D.M.W. Robust Future Precipitation Declines in CMIP5 Largely Reflect the Poleward Expansion of Model Subtropical Dry Zones. Geophys. Res. Lett. 2012, 39, L18704. [Google Scholar] [CrossRef]
  40. Thompson, S.L.; Govindasamy, B.; Mirin, A.; Caldeira, K.; Delire, C.; Milovich, J.; Wickett, M.; Erickson, D. Quantifying the Effects of CO2-Fertilized Vegetation on Future Global Climate and Carbon Dynamics. Geophys. Res. Lett. 2004, 31, L23211. [Google Scholar] [CrossRef]
  41. Bonfils, C.; Anderson, G.; Santer, B.D.; Phillips, T.J.; Taylor, K.E.; Cuntz, M.; Zelinka, M.D.; Marvel, K.; Cook, B.I.; Cvijanovic, I.; et al. Competing Influences of Anthropogenic Warming, ENSO, and Plant Physiology on Future Terrestrial Aridity. J. Clim. 2017, 30, 6883–6904. [Google Scholar] [CrossRef] [PubMed]
  42. Swann, A.L.S.; Hoffman, F.M.; Koven, C.D.; Randerson, J.T. Plant Responses to Increasing CO2 Reduce Estimates of Climate Impacts on Drought Severity. Proc. Natl. Acad. Sci. USA 2016, 113, 10019–10024. [Google Scholar] [CrossRef]
  43. Xie, X.; Wang, T.; Yue, X.; Li, S.; Zhuang, B.; Wang, M. Effects of Atmospheric Aerosols on Terrestrial Carbon Fluxes and CO2 Concentrations in China. Atmos. Res. 2020, 237, 104859. [Google Scholar] [CrossRef]
  44. Zhou, H.; Yue, X.; Lei, Y.; Tian, C.; Ma, Y.; Cao, Y. Aerosol Radiative and Climatic Effects on Ecosystem Productivity and Evapotranspiration. Curr. Opin. Environ. Sci. Health 2021, 19, 100218. [Google Scholar] [CrossRef]
  45. Li, J.; Carlson, B.E.; Yung, Y.L.; Lv, D.; Hansen, J.; Penner, J.E.; Liao, H.; Ramaswamy, V.; Kahn, R.A.; Zhang, P.; et al. Scattering and Absorbing Aerosols in the Climate System. Nat. Rev. Earth Environ. 2022, 3, 363–379. [Google Scholar] [CrossRef]
  46. Mercado, L.M.; Bellouin, N.; Sitch, S.; Boucher, O.; Huntingford, C.; Wild, M.; Cox, P.M. Impact of Changes in Diffuse Radiation on the Global Land Carbon Sink. Nature 2009, 458, 1014–1017. [Google Scholar] [CrossRef]
  47. Rai, A.; Kulshreshtha, K.; Srivastava, P.K.; Mohanty, C.S. Leaf Surface Structure Alterations Due to Particulate Pollution in Some Common Plants. Environmentalist 2010, 30, 18–23. [Google Scholar] [CrossRef]
  48. Smith, S.J.; van Aardenne, J.; Klimont, Z.; Andres, R.J.; Volke, A.; Delgado Arias, S. Anthropogenic Sulfur Dioxide Emissions: 1850–2005. Atmos. Chem. Phys. 2011, 11, 1101–1116. [Google Scholar] [CrossRef]
  49. Hoesly, R.M.; Smith, S.J. Informing Energy Consumption Uncertainty: An Analysis of Energy Data Revisions. Environ. Res. Lett. 2018, 13, 124023. [Google Scholar] [CrossRef]
  50. Gielen, D.; Changhong, C. The CO2 Emission Reduction Benefits of Chinese Energy Policies and Environmental Policies: A case study for Shanghai, period 1995–2020. Ecol. Econ. 2001, 39, 257–270. [Google Scholar] [CrossRef]
  51. Schreifels, J.J.; Fu, Y.; Wilson, E.J. Sulfur Dioxide Control in China: Policy Evolution during the 10th and 11th Five-Year Plans and Lessons for the Future. Energy Policy 2012, 48, 779–789. [Google Scholar] [CrossRef]
  52. Chunmei, W.; Zhaolan, L. Environmental Policies in China over the Past 10 Years: Progress, Problems and Prospects. Procedia Environ. Sci. 2010, 2, 1701–1712. [Google Scholar] [CrossRef]
  53. Wang, Q.; Chen, Y. Energy Saving and Emission Reduction Revolutionizing China’s Environmental Protection. Renew. Sustain. Energy Rev. 2010, 14, 535–539. [Google Scholar] [CrossRef]
  54. Rodell, M.; Houser, P.R.; Jambor, U.; Gottschalck, J.; Mitchell, K.; Meng, C.-J.; Arsenault, K.; Cosgrove, B.; Radakovich, J.; Bosilovich, M.; et al. The Global Land Data Assimilation System. Bull. Am. Meteorol. Soc. 2004, 85, 381–394. [Google Scholar] [CrossRef]
  55. Martens, B.; Miralles, D.G.; Lievens, H.; van der Schalie, R.; de Jeu, R.A.M.; Fernández-Prieto, D.; Beck, H.E.; Dorigo, W.A.; Verhoest, N.E.C. GLEAM v3: Satellite-Based Land Evaporation and Root-Zone Soil Moisture. Geosci. Model Dev. 2017, 10, 1903–1925. [Google Scholar] [CrossRef]
  56. Feng, Q.; Shen, J.; Yang, F.; Liang, S.; Liu, J.; Kuang, X.; Wang, D.; Zeng, Z. Long-Term Gridded Land Evapotranspiration Reconstruction Using Deep Forest with High Generalizability. Sci. Data 2023, 10, 908. [Google Scholar] [CrossRef]
  57. Eyring, V.; Bony, S.; Meehl, G.A.; Senior, C.A.; Stevens, B.; Stouffer, R.J.; Taylor, K.E. Overview of the Coupled Model Intercomparison Project Phase 6 (CMIP6) Experimental Design and Organization. Geosci. Model Dev. 2016, 9, 1937–1958. [Google Scholar] [CrossRef]
  58. Miralles, D.G.; Holmes, T.R.H.; De Jeu, R.a.M.; Gash, J.H.; Meesters, A.G.C.A.; Dolman, A.J. Global Land-Surface Evaporation Estimated from Satellite-Based Observations. Hydrol. Earth Syst. Sci. 2011, 15, 453–469. [Google Scholar] [CrossRef]
  59. Randles, C.A.; Da Silva, A.M.; Buchard, V.; Colarco, P.R.; Darmenov, A.; Govindaraju, R.; Smirnov, A.; Holben, B.; Ferrare, R.; Hair, J.; et al. The MERRA-2 Aerosol Reanalysis, 1980 Onward. Part I: System Description and Data Assimilation Evaluation. J. Clim. 2017, 30, 6823–6850. [Google Scholar] [CrossRef] [PubMed]
  60. Gillett, N.P.; Shiogama, H.; Funke, B.; Hegerl, G.; Knutti, R.; Matthes, K.; Santer, B.D.; Stone, D.; Tebaldi, C. The Detection and Attribution Model Intercomparison Project (DAMIP v1.0) Contribution to CMIP6. Geosci. Model Dev. 2016, 9, 3685–3697. [Google Scholar] [CrossRef]
  61. O’Neill, B.C.; Tebaldi, C.; van Vuuren, D.P.; Eyring, V.; Friedlingstein, P.; Hurtt, G.; Knutti, R.; Kriegler, E.; Lamarque, J.-F.; Lowe, J.; et al. The Scenario Model Intercomparison Project (ScenarioMIP) for CMIP6. Geosci. Model Dev. 2016, 9, 3461–3482. [Google Scholar] [CrossRef]
  62. Jia, X.; Lin, H.; Ge, J. The Interdecadal Change of ENSO Impact on Wintertime East Asian Climate. J. Geophys. Res. Atmos. 2015, 120, 918–935. [Google Scholar] [CrossRef]
  63. Karl, T.R.; Riebsame, W.E. The Identification of 10- to 20-Year Temperature and Precipitation Fluctuations in the Contiguous United States. J. Appl. Meteorol. Climatol. 1984, 23, 950–966. [Google Scholar] [CrossRef]
  64. Wang, B.; Sun, W.; Jin, C.; Luo, X.; Yang, Y.-M.; Li, T.; Xiang, B.; McPhaden, M.J.; Cane, M.A.; Jin, F.; et al. Understanding the Recent Increase in Multiyear La Niñas. Nat. Clim. Change 2023, 13, 1075–1081. [Google Scholar] [CrossRef]
  65. Sun, Y.; Zhou, T.; Ramstein, G.; Contoux, C.; Zhang, Z. Drivers and Mechanisms for Enhanced Summer Monsoon Precipitation over East Asia during the Mid-Pliocene in the IPSL-CM5A. Clim. Dyn. 2016, 46, 1437–1457. [Google Scholar] [CrossRef]
  66. Sun, S.; Chen, H.; Sun, G.; Ju, W.; Wang, G.; Li, X.; Yan, G.; Gao, C.; Huang, J.; Zhang, F.; et al. Attributing the Changes in Reference Evapotranspiration in Southwestern China Using a New Separation Method. J. Hydrometeorol. 2017, 18, 777–798. [Google Scholar] [CrossRef]
  67. Li, S.; Wang, G.; Sun, S.; Fiifi Tawia Hagan, D.; Chen, T.; Dolman, H.; Liu, Y. Long-Term Changes in Evapotranspiration over China and Attribution to Climatic Drivers during 1980–2010. J. Hydrol. 2021, 595, 126037. [Google Scholar] [CrossRef]
  68. Jiang, Z.; Hou, Q.; Li, T.; Liang, Y.; Li, L. Divergent Responses of Summer Precipitation in China to 1.5 °C Global Warming in Transient and Stabilized Scenarios. Earths Future 2021, 9, e2020EF001832. [Google Scholar] [CrossRef]
  69. Yang, Y.; Roderick, M.L.; Guo, H.; Miralles, D.G.; Zhang, L.; Fatichi, S.; Luo, X.; Zhang, Y.; McVicar, T.R.; Tu, Z.; et al. Evapotranspiration on a Greening Earth. Nat. Rev. Earth Environ. 2023, 4, 626–641. [Google Scholar] [CrossRef]
  70. Wang, Z.; Lin, L.; Xu, Y.; Che, H.; Zhang, X.; Zhang, H.; Dong, W.; Wang, C.; Gui, K.; Xie, B. Incorrect Asian Aerosols Affecting the Attribution and Projection of Regional Climate Change in CMIP6 Models. Npj Clim. Atmos. Sci. 2021, 4, 2. [Google Scholar] [CrossRef]
  71. Paulot, F.; Paynter, D.; Ginoux, P.; Naik, V.; Horowitz, L.W. Changes in the Aerosol Direct Radiative Forcing from 2001 to 2015: Observational Constraints and Regional Mechanisms. Atmos. Chem. Phys. 2018, 18, 13265–13281. [Google Scholar] [CrossRef]
  72. Ali, A.; Bilal, M.; Wang, Y.; Qiu, Z.; Nichol, J.E.; de Leeuw, G.; Ke, S.; Mhawish, A.; Almazroui, M.; Mazhar, U.; et al. Evaluation and Comparison of CMIP6 Models and MERRA-2 Reanalysis AOD against Satellite Observations from 2000 to 2014 over China. Geosci. Front. 2022, 13, 101325. [Google Scholar] [CrossRef]
  73. Stevens, B.; Fiedler, S.; Kinne, S.; Peters, K.; Rast, S.; Müsse, J.; Smith, S.J.; Mauritsen, T. MACv2-SP: A Parameterization of Anthropogenic Aerosol Optical Properties and an Associated Twomey Effect for Use in CMIP6. Geosci. Model Dev. 2017, 10, 433–452. [Google Scholar] [CrossRef]
  74. Liepert, B.G.; Feichter, J.; Lohmann, U.; Roeckner, E. Can Aerosols Spin down the Water Cycle in a Warmer and Moister World? Geophys. Res. Lett. 2004, 31, L06207. [Google Scholar] [CrossRef]
  75. Roderick, M.L.; Sun, F.; Lim, W.H.; Farquhar, G.D. A General Framework for Understanding the Response of the Water Cycle to Global Warming over Land and Ocean. Hydrol. Earth Syst. Sci. 2014, 18, 1575–1589. [Google Scholar] [CrossRef]
Figure 1. (a) The spatial distribution of summer ET (mm d−1) in China from 1980 to 2020 in observations and (b) the standard deviation of the three observational datasets. The black box indicates southeastern China (105°E–122°E, 22°N–31°N). (c) The summer ET (mm d−1) in southeastern China is based on GLDAS (green), HG-Land (red), and GLEAM (blue). ET anomalies are with respect to 1980–2020, except that 1982–2020 is used for HG-land, with a 3-year running mean applied. Results of the moving t-test for ET from (d) GLDAS, (e) GLEAM, (f) HG-Land. The red curves represent the moving t-test values (t-value), the black curves represent the ET anomalies, the blue horizontal lines indicate the significance thresholds, and the brown dashed lines along with the numbers in the top-right corner indicate the years of abrupt change.
Remotesensing 17 00561 g001
Figure 2. The spatial distribution of trends in summer ET (mm d−1 cent−1) in China from (a) 1980 to 2000, (b) 2000 to 2020, and (c) the differences between the two time periods, averaged across the three observations. The black box indicates southeastern China.
Remotesensing 17 00561 g002
Figure 3. (a) The spatial distribution of summer ET (mm d−1) over China from 1980 to 2020 from ALL forcing experiment simulations. The black box indicates southeastern China. (b) Anomalies of southeastern China summer ET (mm d−1) due to ALL forcing (red), AA forcing (yellow), and GHG forcing (blue). ET anomalies are with respect to 1980–2020, with a 3-year running mean applied. The brown dashed line along with the number in the top-right corner indicates the year of abrupt change in ALL forcing experiment.
Remotesensing 17 00561 g003
Figure 4. The spatial distribution of summer ET trend changes (mm d−1 cent−1) over China under (a) AA forcing, (b) AA forcing, and (c) GHG forcing, with 2010 identified as the turning point. The black box indicates southeastern China.
Remotesensing 17 00561 g004
Figure 5. (a) Trend changes in ET (mm d−1 cent−1), precipitation (P, mm d−1 cent−1), net surface radiation (Rn, MJ m−1 d−1 cent−1), 2 m surface temperature (Ts, K cent−1), vapor pressure deficit (VPD, KPa cent−1), and 2 m surface wind speed (U, m s−1 cent−1). (b) Their contributions (mm d−1 cent−1) to ET trend changes over southeastern China under the ALL forcing (red bar), AA forcing (yellow bar), and GHG forcing (blue bar).
Remotesensing 17 00561 g005
Figure 6. Trend changes in the (a) ET (mm d−1 cent−1), (b) precipitation (P, mm d−1 cent−1), (c) net surface radiation (Rn, MJ m−1 d−1 cent−1), (d) 2 m surface temperature (Ts, K cent−1), (e) vapor pressure deficient (VPD, KPa cent−1), and (f) 2 m wind speed (U, m s−1 cent−1) under ALL forcing. The black box indicates southeastern China.
Remotesensing 17 00561 g006
Figure 7. Trend changes in the (a) ET (mm d−1 cent−1), (b) precipitation (P, mm d−1 cent−1), (c) net surface radiation (Rn, MJ m−1 d−1 cent−1), (d) 2 m surface temperature (Ts, K cent−1), (e) vapor pressure deficient (VPD, KPa cent−1), and (f) 2 m wind speed (U, m s−1 cent−1) under AA forcing. The black box indicates southeastern China.
Remotesensing 17 00561 g007
Figure 8. Trend change in the (a) ET (mm d−1 cent−1) and the contributions (mm d−1 cent−1) from (b) precipitation (P), (c) net surface radiation (Rn), (d) 2 m surface temperature (Ts), (e) vapor pressure deficient (VPD), and (f) 2 m wind speed (U) under ALL forcing. The black box indicates southeastern China.
Remotesensing 17 00561 g008
Figure 9. Trend change in the (a) ET (mm d−1 cent−1) and its contributions (mm d−1 cent−1) from (b) precipitation (P), (c) net surface radiation (Rn), (d) 2 m surface temperature (Ts), (e) vapor pressure deficient (VPD), and (f) 2 m wind speed (U) under AA forcing. The black box indicates southeastern China.
Remotesensing 17 00561 g009
Figure 10. (a) Anomalies of southeastern China summer net surface radiation (Rn, MJ m−2 d−1) due to ALL forcing (red), AA forcing (yellow), and GHG forcing (blue). ET anomalies are with respect to 1980–2020, with a 3-year running mean applied. The brown dashed line indicates the year of trend change in ALL forcing. (b) Trend changes in surface downward shortwave radiation (Rsds, MJ m−2 d−1 cent−1), downward longwave radiation (Rlds, MJ m−2 d−1 cent−1), upward shortwave radiation (Rsus, MJ m−2 d−1 cent−1), and upward longwave radiation (Rlus, MJ m−2 d−1 cent−1) over southeastern China under the ALL forcing (red bar), AA forcing (yellow bar), and GHG forcing (blue bar).
Remotesensing 17 00561 g010
Figure 11. The spatial distribution of surface downward shortwave radiation trend changes (MJ m−2 d−1 cent−1) over China from (a) 1950 to 2010, (b) 2010 to 2099, and (c) the differences between the two time periods under ALL forcing. And the spatial distribution of surface downward shortwave radiation trend changes (MJ m−2 d−1) over China from (d) 1950 to 2010, (e) 2010 to 2099, and (f) the differences between the two time periods under AA forcing. The black box indicates southeastern China.
Remotesensing 17 00561 g011
Figure 12. The spatial distribution of trends in summer aerosol optical depth over China from (a) 1980 to 2000, (b) 2000 to 2020, (c) the differences between the two time periods, (d) 1950 to 2010, (e) 2010 to 2099, and (f) the differences between the two time periods. (ac) are derived from MERRA-2 observational data, (df) are derived from AA forcing experiment. The black box indicates southeastern China.
Remotesensing 17 00561 g012
Table 1. CMIP6 models used in this study. The total numbers of the realizations are in the parenthesis.
Model NameRealizations (Number)
CanESM5r1i1p1f1-r10i1p1f1 (10)
GISS-E2-1-Gr1i1p1f2-r5i1p1f2 (5)
MIROC6r1i1p1f1-r10i1p1f1 (10)
NorESM2-LMr1i1p1f1 (1)
Disclaimer/Publisher’s Note: The statements, opinions and data contained in all publications are solely those of the individual author(s) and contributor(s) and not of MDPI and/or the editor(s). MDPI and/or the editor(s) disclaim responsibility for any injury to people or property resulting from any ideas, methods, instructions or products referred to in the content.

