1. Introduction
Ecological integrity encompasses the sum of organisms and their habitats, is intrinsically linked to human production and daily life, and serves as the fundamental basis for human survival and development [
1,
2,
3]. However, with rapid urbanization, ecological systems have endured severe disruptions from human activities [
4,
5,
6]. Population growth and urban expansion have transformed extensively vegetated areas into urban land, causing irreversible damage to terrestrial ecosystems [
7]. Moreover, the overexploitation of natural resources has profoundly affected the ecological state of many regions, even on a global scale [
8,
9].
The accurate assessment of ecological states and changes is a long-standing issue in the conservation of natural ecosystems [
3,
10,
11]. The International Geosphere-Biosphere Programme (IGBP) focuses on core research initiatives that include two main aspects: global change and terrestrial ecosystems (GCTE) and land use/cover change (LUCC) [
12,
13,
14]. This underscores the need for a quantitative study of urbanization- and human activity-induced changes to ecological states. Recently, a number of in-depth discussions have been conducted to monitor and assess ecological quality, which is important for ecological risk control and sustainable economic development [
15,
16,
17]. Urban ecosystems, which are significantly impacted by human activities, are characterized by drastic land use changes, urban heat island effects, and air pollution [
12,
15]. Implementing multi-factor and high-temporal-efficiency monitoring of urban ecological quality is vital for urban ecological early warning, conservation, and improvement.
Remote sensing technology has emerged as an effective tool for monitoring and assessing ecological quality [
18,
19]. Scholars have utilized various indicators derived from remote sensing data to evaluate the ecological states of forests, grasslands, urban areas, rivers, and watersheds [
4,
16,
20]. However, most ecological indices are based on a single indicator, such as vegetation indexes [
4], leaf area indexes [
21], and land surface temperature [
22]. However, these methods do not fully capture the ecological conditions of urban areas [
23,
24]. Xu [
25] integrated available land surface parameters such as greenness, wetness, heat, and dryness to construct a Remote Sensing Ecological Index (RSEI) based on the pressure-state-response (PSR) framework [
26] using the principal component analysis (PCA) method, and it provides for more objective and comprehensive assessments than single-factor indicators. In recent years, numerous studies have employed the RSEI to investigate urban ecological quality, such as in Fuzhou City, Zhengzhou City, and 35 other major cities in China [
27,
28,
29,
30]. To integrate multiple factors into an efficient indicator, statistical and mathematical methods, such as the entropy weight method, have also been used to improve the fitting methods of the traditional RSEI. In summary, the evaluation of ecological quality has transitioned from qualitative to quantitative analyses, from single indicators to comprehensive indices, and from a single computational discipline to various models [
31,
32]. Although some researchers have focused on studying the application of the RSEI and its improved indicators, the components and calculation methods for these indices are still insufficient. The main problems to be solved can be summarized as follows:
- ♦
How can the traditional index components of the RSEI be improved or extended to achieve a more comprehensive assessment of ecological quality? Currently, the index components of the RSEI primarily consist of available land surface parameters, while the complex relationship between socioeconomic factors (such as population density) and ecological quality is excluded [
4,
5,
11]. Considering only physical land surface factors prevents the RSEI from comprehensively evaluating ecological conditions.
- ♦
How can the nonlinearity issue in the combination of index components of the RSEI be addressed to improve the prediction performance of ecological quality evaluation? The RSEI is formulated by integrating four indicators via PCA and is generally represented by the first component of the PCA (PC1) [
28]. However, as the number of index components increases, the amount of redundant data grows, leading to a situation where a significant portion of the information fails to contribute meaningfully to the analysis, and the prediction accuracy of ecological quality generally decreases [
33]. The PCA method only considers linear relationships between index components and neglects nonlinear relationships [
34].
Recently, the emergence of deep learning has advanced a number of research fields, including remote sensing [
35,
36]. Significant improvements have been made in many tasks, such as image scene classification, object detection, and image retrieval [
37,
38,
39,
40,
41]. Deep learning approaches have the powerful ability to automatically learn high-level features from input data, which is vital for bridging the gap between multi-source remote sensing images at the feature level. Meanwhile, previous studies have indicated that deep-learning-based models are also an effective remote sensing processing method for handling nonlinear effects between explanatory variables without much information loss [
42,
43]. Therefore, deep-learning-based fusion methods are promising for integrating traditional ecological indicators using multi-source remote sensing data.
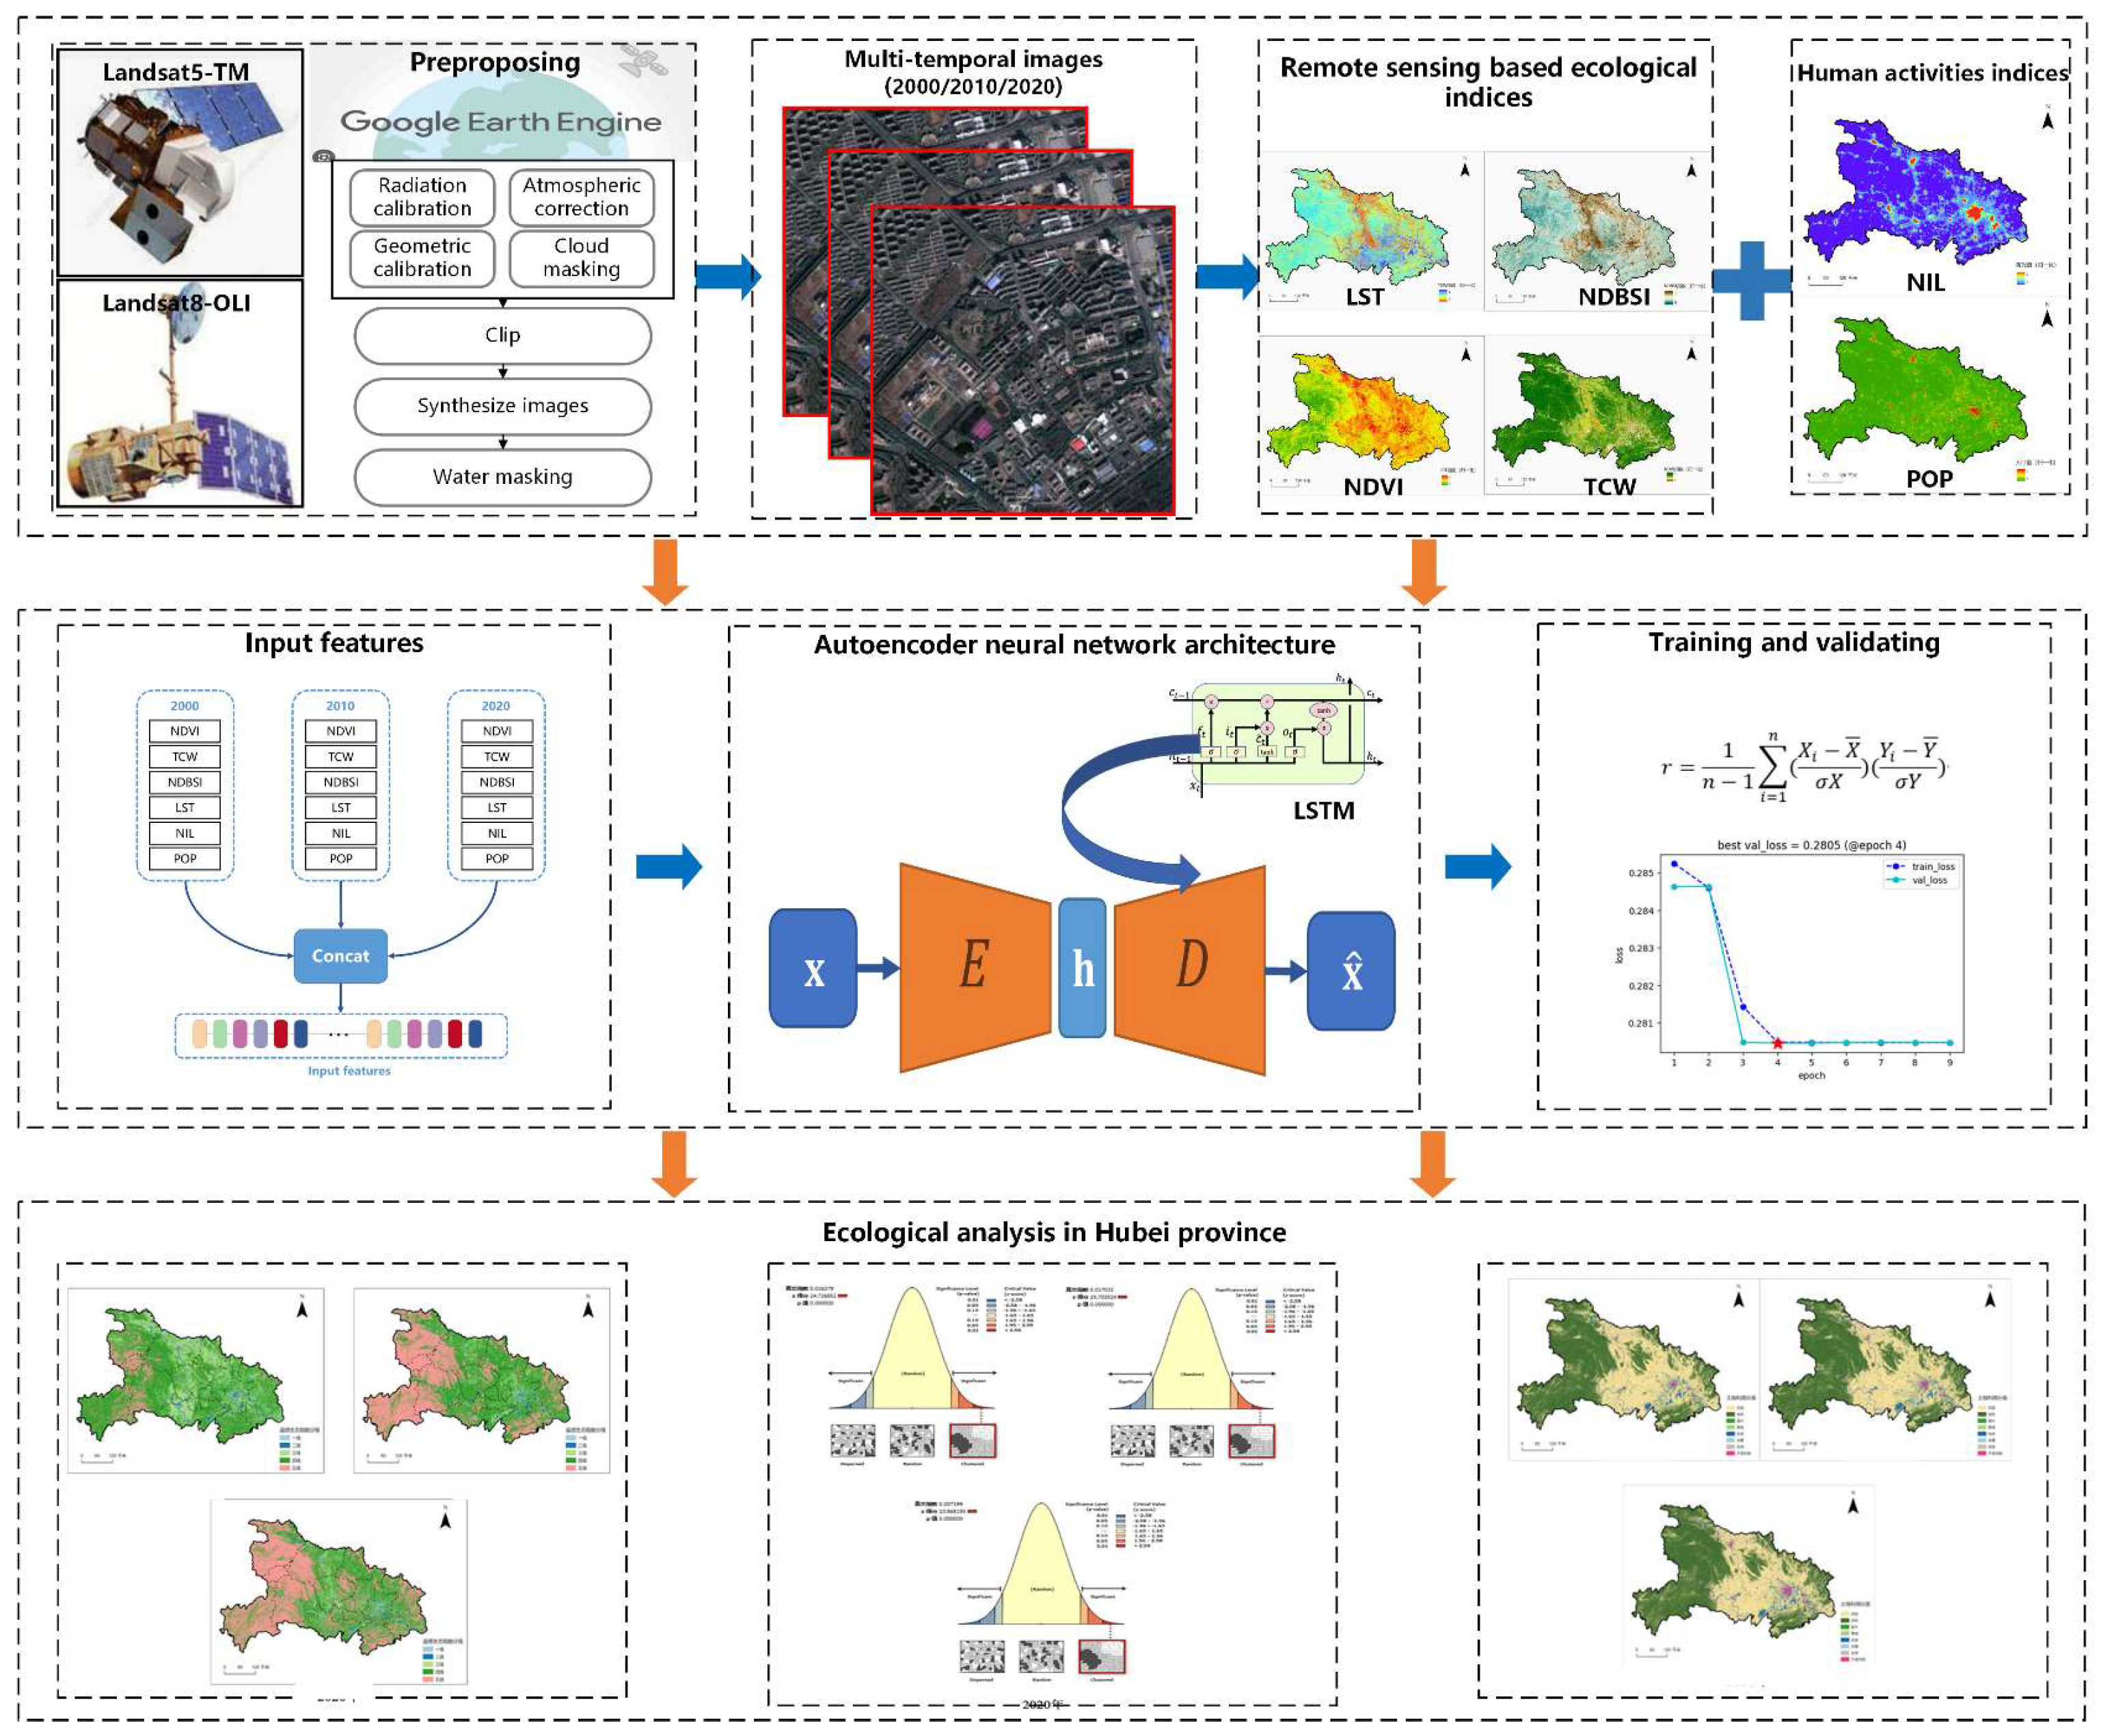
To this end, we propose a conceptual framework for evaluating the ecological quality by highlighting the effects of human activity and nonlinear issues and introduce a Deep-learning-based Remote Sensing Ecological Index (DRSEI) which follows the conceptual framework. Specifically, the DRSEI extends the traditional RSEI by adding indicators of human economic activity to the current index components. Moreover, a deep learning model is introduced, and we utilize an autoencoder neural network architecture with long short-term memory (LSTM) modules to combine the index components to address the issue of nonlinearity. Several trials were performed to determine an appropriate ecological indicator for our case study in Hubei Province, China.
2. Study Area and Data Collection
The study area, Hubei Province, is located between latitudes 29°05′53″N and 33°6′47″ N and longitudes 108°21′42″E and 116°07′50″E in the subtropical zone of China (
Figure 1). Except for some high mountain areas, the majority of the region experiences a humid subtropical monsoon climate. The terrain is generally characterized by mountains surrounding the east, west, and north sides, with the central part consisting of plains formed by the Yangtze and Han rivers, thus resembling an open basin to the south. In Hubei Province, forested and arable lands dominate the land types, followed by urban and rural construction sites and water bodies, with an overall distribution of 50% forested land, 30% arable land, 10% urban and rural areas, and 10% water bodies. Hubei Province governs 13 prefecture-level administrative regions and 103 county-level administrative regions. Over the past 20 years, the population has remained relatively stable at approximately 58.44 million, making it one of the major provinces in Central China.
In 2021, China promulgated the Yangtze River Protection Law, which emphasizes the importance of ecological and environmental protection in the Yangtze River Basin [
44]. Hubei Province is located at the core of the Yangtze River Basin, and approximately one-third of its total area is located within the basin. Thus, among the provinces in China, the longest stretch of the Yangtze River flows through Hubei Province. However, the rapid economic development in China since 2000 has rapidly expanded the supporting industries in Hubei Province, such as automobile manufacturing, steel smelting, and the medical chemical industry. In the context of insufficient clean energy and intensified pollutant emissions, ecological and environmental issues in Hubei Province have become increasingly severe, with the main problems being soil erosion, water/atmospheric/industrial pollution, water body shrinkage, and geological disasters [
8,
45,
46]. Investigating the ecological environmental quality of Hubei Province and addressing the conflicts in natural resources, ecological protection, and spatial layout are of great significance for promoting economic development in China. Such issues also impact the development of important urban agglomerations and city clusters downstream of the Yangtze River.
This study utilized remote sensing imagery data from 2000, 2010, and 2020 sourced from Landsat 5 TM and Landsat 8 OLI/TIRS. To ensure comparability across different years and mitigate variations in the calculation results due to temporal resolution and cloud cover, data from the same period (June to September) across different years were selected. These data were then composited into a single dataset, with preprocessing steps, such as radiometric calibration, atmospheric correction, geometric correction, cloud removal, and cropping, performed on the Google Earth Engine (GEE) platform. Population characteristics were derived from the WorldPop dataset (
http://www.worldpop.org.uk accessed on 1 June 2023), which has a resolution of 100 m. Socioeconomic characteristics were inferred from nighttime light remote sensing data, with DMSP-OLS data selected for 2000 and 2010 and NPP-VIIRS data selected for 2020. All data were resampled to a resolution of 100 m. Land use data for each year, including land cover types such as cultivated land, forests, shrubland, grassland, water bodies, ice/snow, barren land, and impervious surfaces, was obtained from the China Land Cover Dataset (CLCD) (
http://irsip.whu.edu.cn/recent_achi/recent_show.php?16 accessed on 1 June 2023) and resampled to a resolution of 100 m. Land use data were included as separate maps for each time period (2000, 2010, and 2020). This approach allowed us to capture the temporal changes in land use/land cover and their impact on ecological quality over the study period.
Auxiliary data included vector data for Hubei Province’s administrative divisions and ecological environment statistical data. Vector data on the administrative divisions were utilized for image cropping and regional analysis, sourced from the Geospatial Data Cloud (
https://www.gscloud.cn/ accessed on 1 June 2023). Ecological environment statistical data (Ecological Index, EI) sourced from the official website of Hubei Province’s Department of Ecology and Environment (
http://sthjt.hubei.gov.cn/ accessed on 1 June 2023) were used to verify the accuracy of the proposed method. The EI is a composite measure of multiple ecological factors including biodiversity, vegetation cover, water balance, soil dryness and so on, it is widely used in ecological research. The EI data from Hubei Province’s Department of Ecology and Environment were collected through standardized procedures and rigorous quality control measures, ensuring their credibility for our validation purposes.
3. Methodology
This study established a framework tailored to the ecological environment assessment of Hubei Province, which expands the indicator components of the EI based on multi-temporal remote sensing data from the Landsat series, WorldPop, and NPP-VIIRS sources. It incorporates an autoencoder neural network architecture, which is a deep learning method, to improve traditional index fitting methods by introducing the DRSEI. This model provides theoretical support for an accurate assessment of the ecological environment and a better understanding of the patterns of ecological environment change. It was applied here to study the ecological environment of Hubei Province, which was evaluated over the past 20 years, and analyze the spatiotemporal changes and evolutionary characteristics of ecological environment quality. A flowchart of the proposed framework is shown in
Figure 2.
3.1. Index Components
When selecting the evaluation system, this study thoroughly considered the difficulty of obtaining indicators and expanded the base of important indicators, such as greenness, dryness, wetness, and heat, by adding socioeconomic and population indicators according to research on the RSEI. The index components proposed in this study emphasize the interdependent relationship between human activities and the ecological environment, with the aim of objectively and accurately reflecting the actual condition of ecological quality in the study area.
The index components are listed in
Table 1. The greenness, wetness, dryness, and heat indicators are represented by the Normalized Difference Vegetation Index (NDVI), Tasseled Cap Wetness Index (TCW), Normalized Difference Bare Soil Index (NDBSI), and Land Surface Temperature Index (LST), respectively. The socioeconomic indicator is represented by the Nighttime Light Index (NLI), which was derived from nighttime light imagery, and the population density indicator is represented by the Population Density Index (POP), which was derived from WorldPop data.
Given the lack of uniformity in the dimensions of the indicators and significant differences in their means, the expressiveness of the data was enhanced by normalizing each of the six indicators before building the deep learning model, thereby converting different indicators into dimensionless scalars. Furthermore, due to the variability in the impact of each indicator on ecological environment quality within the index components, the uniform direction of each indicator was ensured by adopting a value of 1 minus the normalized components that have a negative impact to ensure that the effects of all index components were positive. Specifically, this involved using a value of 1 minus the normalized values of the NDBSI, LST, NLI, and POP to obtain the adjusted indicators. After adjustment, the impacts of all index components on the environment were positive, meaning that higher values of the DRSEI indicate better ecological quality conditions.
3.2. Autoencoder Neural Network Architecture
The construction of an RSEI fundamentally involves information compression and feature extraction, with the remote sensing ecological model employing PCA for information compression [
28,
30]. However, due to the limitations of the PCA method, the traditional RSEI only considers the linear relationships within the index components during the fitting process, failing to discover the non-linear relationships implied in complex ecological systems. The autoencoder, a renowned unsupervised learning method and nonlinear dimensionality reduction technique, operates by encoding the input data into a lower-dimensional latent space through multiple layers of neural networks and then reconstructing the original data from this latent space, leveraging nonlinear activation functions to capture complex relationships. The autoencoder is known for its simplicity in reconstruction, foundation in neuroscience, and ability to be stacked in multiple layers, and it has been widely applied in various research areas, such as image classification, video anomaly detection, pattern recognition, and data generation [
47,
48,
49]. The autoencoder is applicable to ecological data analysis, and the nonlinearity in autoencoders is particularly beneficial for remote sensing data, which often exhibit intricate spatial and temporal dependencies. For instance, in the context of RSEI, autoencoders can reveal nonlinear patterns in vegetation growth over time, which may be influenced by factors such as climate change, land use changes, and human interventions. Therefore, this study adopted the autoencoder neural network architecture to address the issues of feature wastage and limited predictive capacity inherent in PCA-based models. Additionally, the RSEI integrates LSTM neural networks to enhance the autoencoder architecture, thereby improving its applicability for long-term continuous modeling.
The goal of the autoencoder architecture is to ensure that the input data and output data are as consistent as possible. If and tend toward similarity, then the intermediate layer generated during the compression process captures the majority of the original data features. In this study, the input features were various indicator values; the encoder transformed the input data into a lower-dimensional representation, namely the ecological environment quality index; and the decoder transformed the index data into features that reconstructed the input data. The model was adjusted to maximize the similarity between the input and reconstructed features, thereby minimizing data loss. Unlike traditional PCA methods, this approach addresses the issue of feature nonlinearity. It is well-suited to the complex and large dataset characteristics of this study and significantly reduces the data loss rate during the compression process.
The structure of the autoencoder architecture consists of encoding and decoding processes, and its mathematical expression is as follows:
where
and
are the weights and biases of the encoding process, respectively;
and
are the weights and biases of the decoding process, respectively; and
and
are nonlinearly functions, such as sigmoid, tanh, relu, and other activation functions. The loss function
should minimize the
and
errors as follows:
During the training of the autoencoder architecture, high-dimensional data are encoded into a lower dimension, and then an attempt is made to reconstruct the low-dimensional data back into high-dimensional reconstructed features that are similar to the input data. In this process, the function of real significance is not the reconstruction of data but rather the generation of low-dimensional representation during the data training process.
Although the autoencoder architecture shares similarities with PCA because it is also an unsupervised machine learning method capable of achieving data dimensionality reduction, PCA is limited to linear transformations, while the autoencoder architecture can perform both linear and nonlinear transformations. Unlike PCA, which projects data only in orthogonal directions, the autoencoder architecture is not restricted to such projections. The autoencoder architecture, with its ability to fit complex nonlinear relationships, is more sophisticated than PCA, which only fits simple linear transformations. Moreover, although PCA is suitable for smaller datasets, the autoencoder architecture is applicable for complex large-scale datasets. Therefore, this study posits that employing an autoencoder architecture to refine the RSEI can address the issues inherent in large and complex datasets.
The encoding and decoding processes of the autoencoder architecture consist of multiple linear layers, thereby rendering the model relatively simple. To address the challenges of large-scale and continuous ecological environment fitting, this study enhanced the autoencoder architecture by incorporating three layers of LSTM neural networks, as illustrated in
Figure 3. The three-layer LSTM architecture processes (Detailed explanation can be found at
Supplementary Material File S1) these sequences as follows:
First LSTM Layer: This layer takes the input sequence and processes it sequentially by year, capturing short-term dependencies and temporal dynamics within each sequence. The output of this layer is a sequence of hidden states, each representing the ecological state at a specific year.
Second LSTM Layer: This layer takes the output of the first LSTM layer and further processes it to capture more complex temporal relationships, refining the temporal features and understanding the cumulative effects over the years.
Third LSTM Layer: The final LSTM layer processes the output of the second layer and generates the final hidden states, which are then used to predict the ecological quality index (DRSEI) for each location.
Incorporating the LSTM module into the autoencoder architecture increases the model complexity and improves the model fitting accuracy. Furthermore, the LSTM neural network considers the temporal characteristics of the training data, making the model more suitable for studying temporal variations in ecological environments.
3.3. Training and Validating
When training the proposed model, the input entities were raster data synthesized from the input data. The model treats each raster as a training entity, with various indicators serving as raster feature values. However, because of the large number of rasters in the study area and the extensive computational requirements of the model, calculating the RSEI for each year is time-consuming and prohibits analyses of temporal changes in the ecological environment. Therefore, when constructing the input features of the model, we concatenated the indicator features of the same raster across different times. After completing the model training, the indicators of each year can be separated.
As shown in
Figure 4, the 18 indicator components from 2000, 2010, and 2020 were concatenated into a single image. Specifically, each year has six indicator components (NDVI, TCW, NDBSI, LST, NLI, and POP). The raster feature values consisted of numerical components from different years and indicators, and the merged image served as input data for the autoencoder architecture. This approach not only enhances the model’s temporal efficiency but also improves the computational performance by considering the correlations of the ecological environment at the same location across different times during training.
4. Experimental Results and Analysis
4.1. Model Training
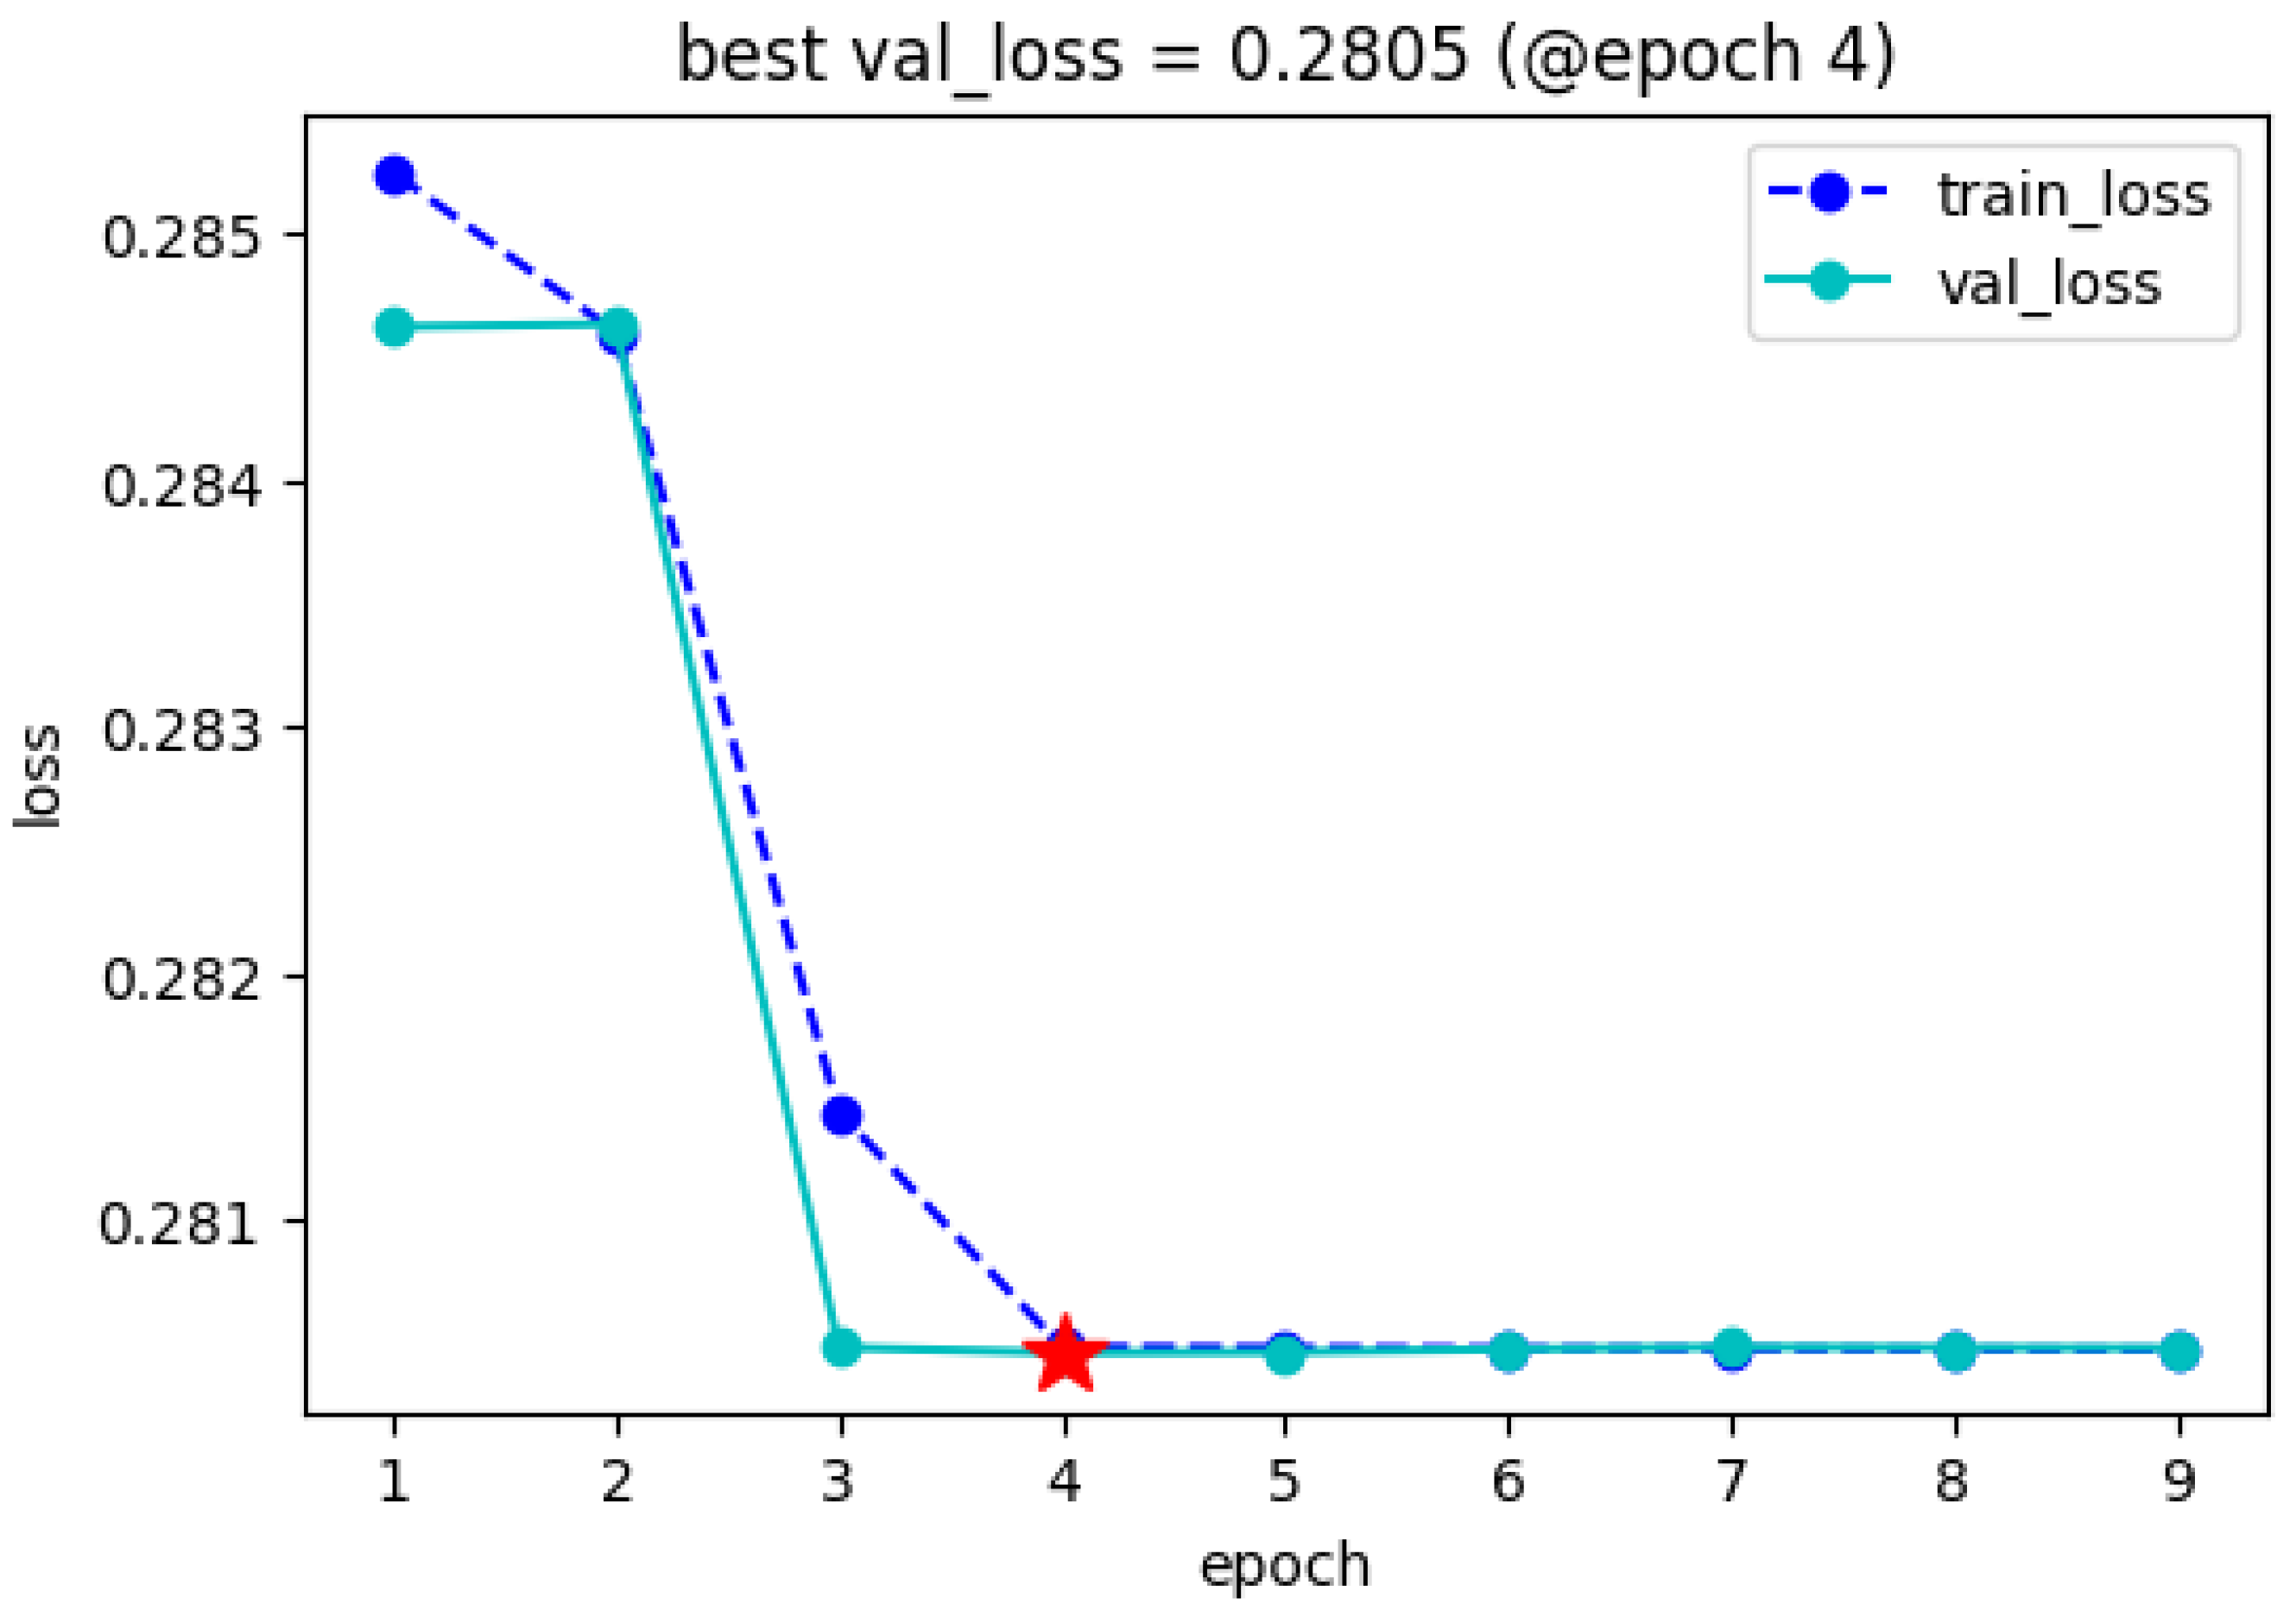
In this study, we employed a common machine learning approach of iterative model training, and the parameters for the proposed deep learning method were set as follows: a maximum of 10 epochs, with an early stopping strategy to select the optimal fitting parameters; a batch size of 512; and a training-to-validation data ratio of 7:3. All other parameters were set to the default model configurations. The model training process utilized the mean absolute error (MAE) as the loss evaluation metric.
Changes in model training losses are illustrated in
Figure 5. During the training process, both the training and validation losses gradually decreased with an increasing number of iterations until they stabilized and ceased to change. Subsequently, the training model corresponding to the iteration with the best-fitting performance (i.e., epoch = 4, marked with a red star in the figure) was selected as the final model for further analysis.
4.2. Model Validation
After ensuring the accuracy and scientific validity of the index components, the reliability and accuracy of the deep learning remote sensing ecological model were further examined.
The model was validated according to its precision and ability to recognize ecological environments in different scenarios.
Table 2 presents different ecological indicators for all districts of Hubei Province in 2020; each value is calculated from the mean of the corresponding ecological indicators for all rasters included in the district. To examine the model precision, the Pearson correlation coefficients were calculated for both sets of data, with a coefficient of 0.731 between the RSEI and EI and 0.895 between the DRSEI and EI. Both sets of data had
p-values less than 0.05, indicating statistical significance. A comparison of the correlations between the two datasets revealed that the Pearson correlation coefficient for the DRSEI was higher. This indicates that the DRSEI has higher similarity to the EI than the original RSEI, with both dataset classifications exhibiting very strong correlations.
To validate the training performance of the DRSEI proposed in this study, four sets of ablation experiments were conducted by creating pairwise combinations of two modeling approaches (PCA and autoencoder architecture) and two types of index components (traditional RSEI components and DRSEI components proposed in this study). The results of these experiments are summarized in
Table 3.
Table 4 presents the comparative results of the experiments with different combinations of component indicators using the deep learning remote sensing ecological method. The
p-value of each experimental group was less than 0.05, indicating statistical significance. As component indicators were added, the value of the Pearson correlation coefficient gradually increased, indicating that the richness of the index components significantly affected the fitting of the DRSEI in the ecological quality assessment. Furthermore, a comparison revealed that the addition of two socioeconomic component indicators—NLI and POP (experimental groups No. 5–7 in
Table 4)—enhanced the model’s fitting effect compared to the traditional index components that only considered natural environment component indicators (experimental group 4 in
Table 4). This underscores the applicability of the improved index component proposed in this work.
Furthermore, to verify the impact of the LSTM modules on the experimental results within the autoencoder architecture of the DRSEI, we conducted ablation experiments on the incorporation of LSTM modules. The results, as shown in
Table 5, indicate that the
p-value of each experimental group was less than 0.05, demonstrating statistical significance. The results demonstrated that following the integration of the LSTM modules, a significant improvement in the Pearson correlation coefficient was observed (increasing from 0.825 to 0.895). When the LSTM modules were replaced with the ordinary linear layer in the autoencoder, the Pearson correlation coefficient was nearly unchanged from that of the model without the LSTM (0.834). These ablation experiments highlighted the importance of the LSTM modules of the autoencoder architecture in DRSEI.
4.3. Comparison Analysis with Different Scenarios
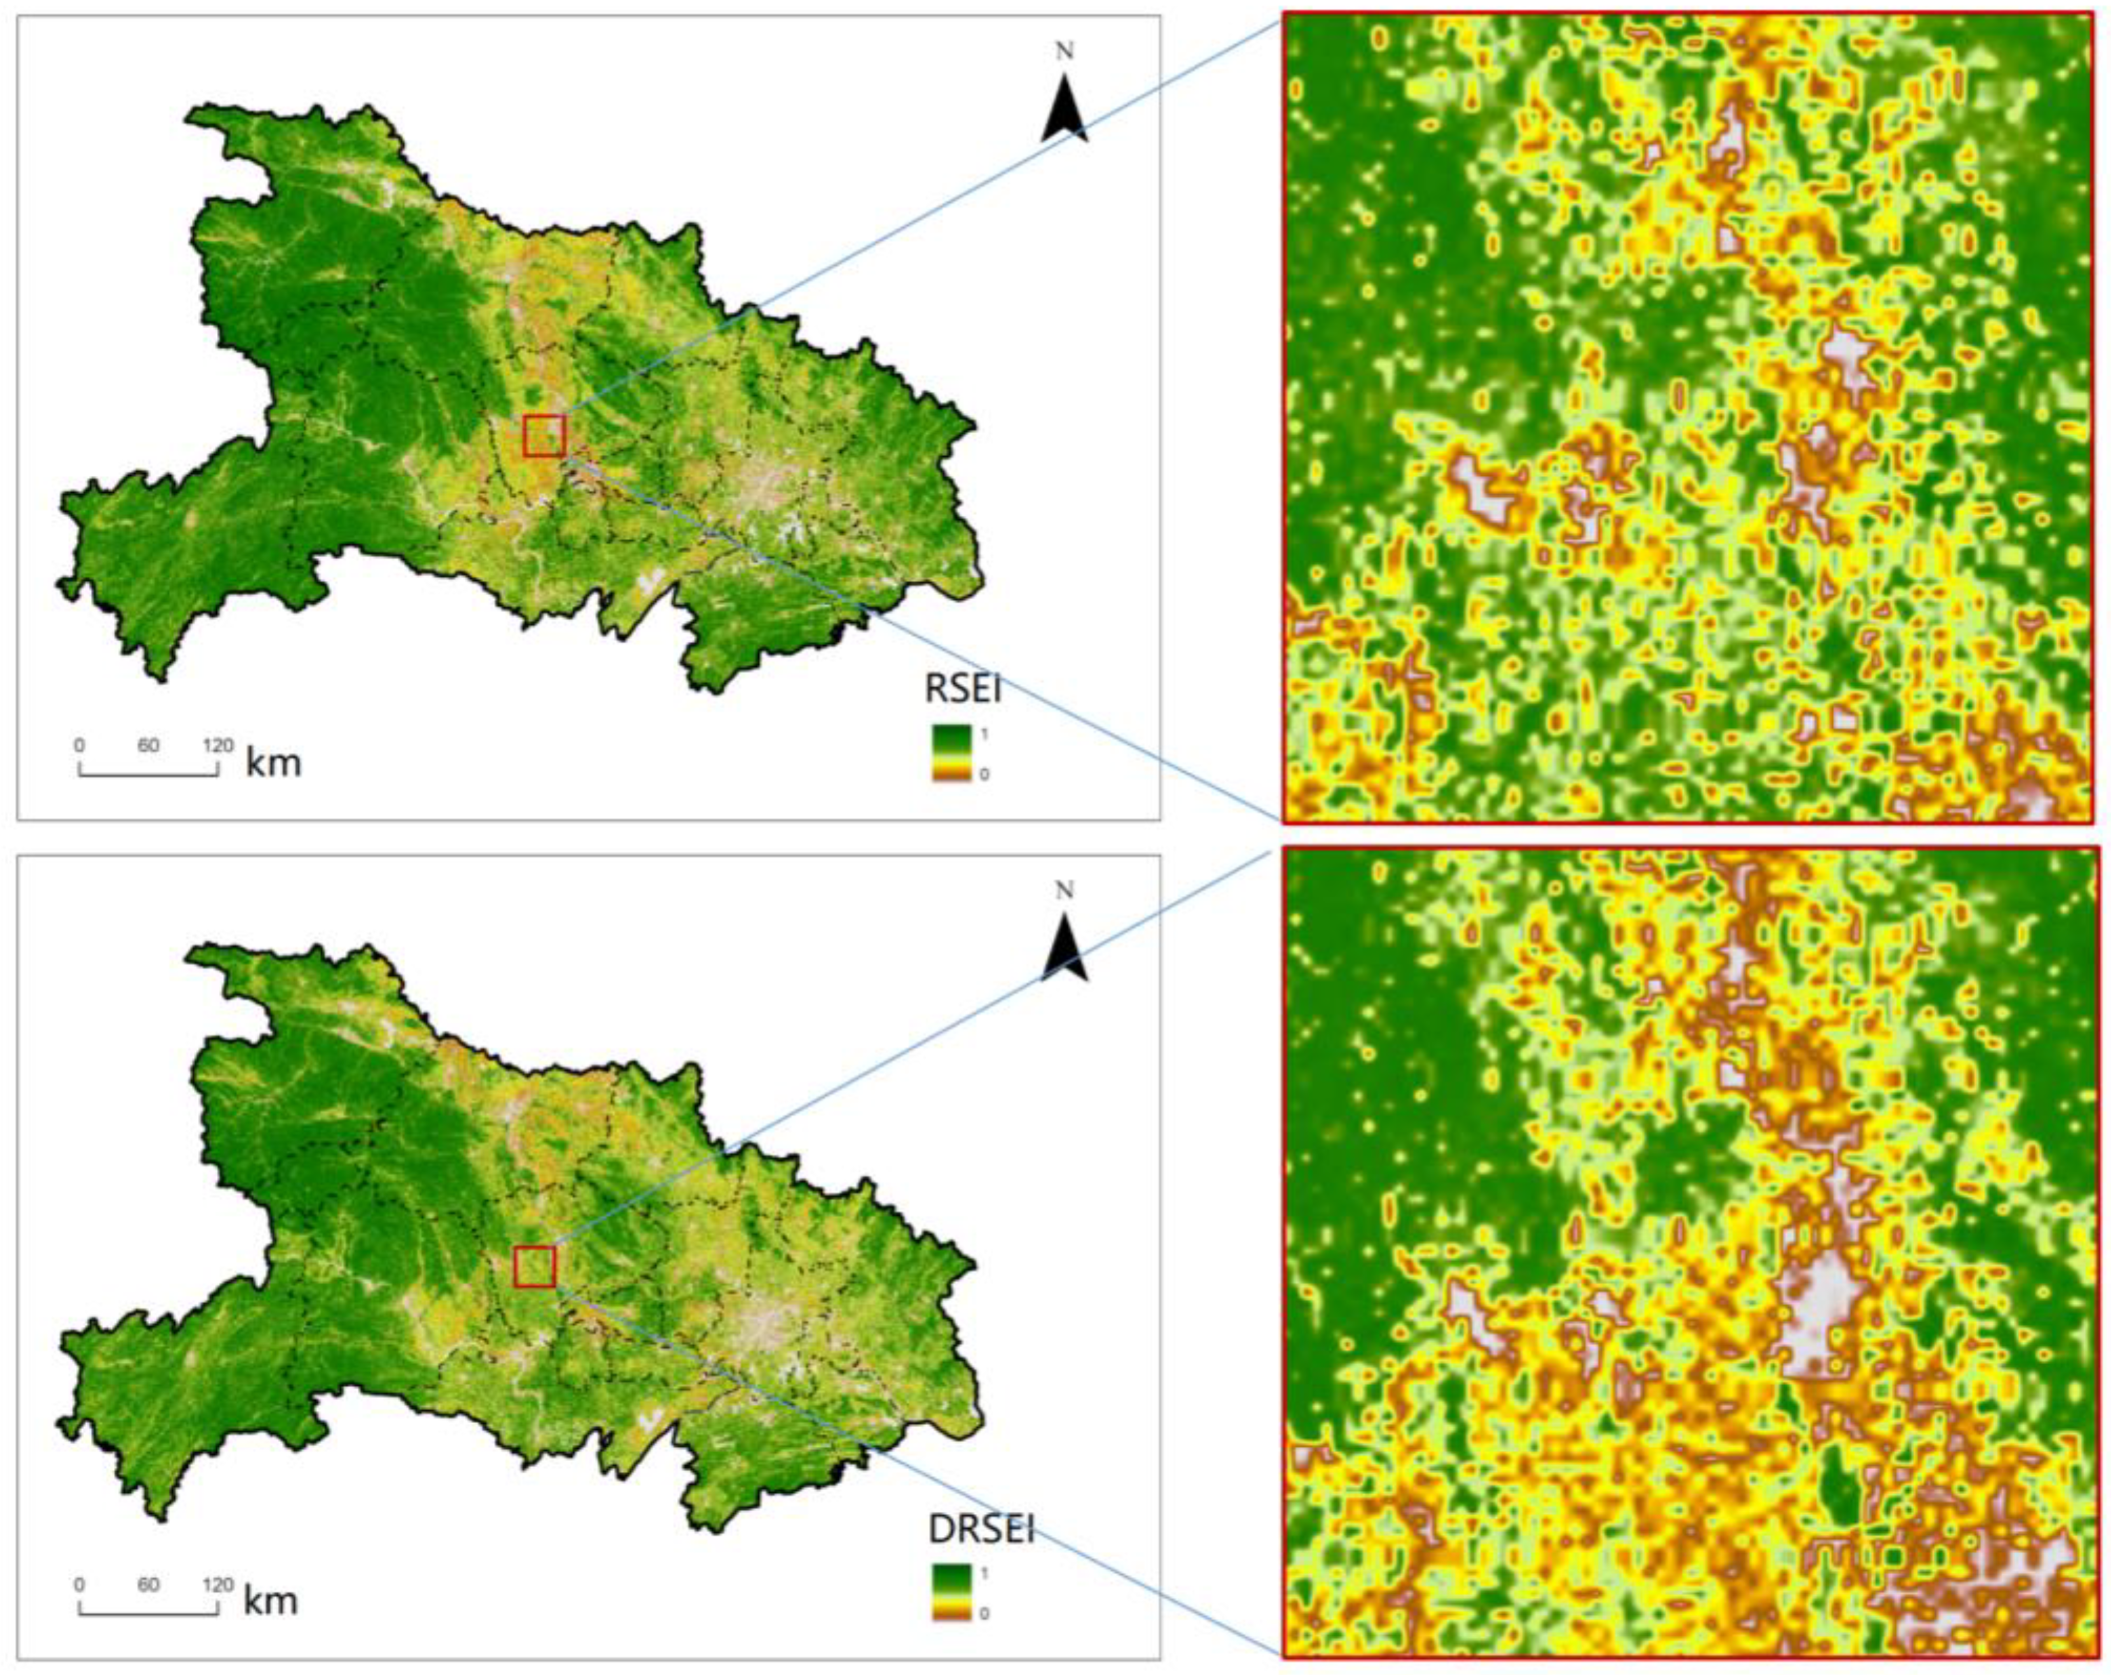
In terms of the spatial distribution of the EI,
Figure 6 displays the results calculated by the DRSEI and traditional RSEI for Hubei Province in 2020. A comparison of the two resulting maps shows that both indices essentially reflect the same overall trend in Hubei Province’s ecological environment, with the western and eastern regions displaying better ecological quality than the central region. Furthermore, the spatial information expressed by the DRSEI is clearer, with more pronounced local texture details, and aligns more closely with the actual ground conditions.
Figure 6 features a typical area in Hubei Province as an example, which showcases some differences in local details and key areas between the RSEI and DRSEI. The DRSEI depicts mountain ranges and river courses (top left corner) more clearly and cohesively than the RSEI. Meanwhile, the DRSEI exhibits spatial continuity in the detection of complex ecological areas in the central region, thus showing a continuous trend in ecological changes. In contrast, the RSEI tends to depict a scattered, small-area dot distribution, leading to a disorganized presentation of ecological conditions. Consequently, the DRSEI provides a clearer depiction of ecological environment details and fully considers the spatial continuity of the ecological environment. It is thus more suitable for monitoring and research in areas with complex terrain and ecological environments.
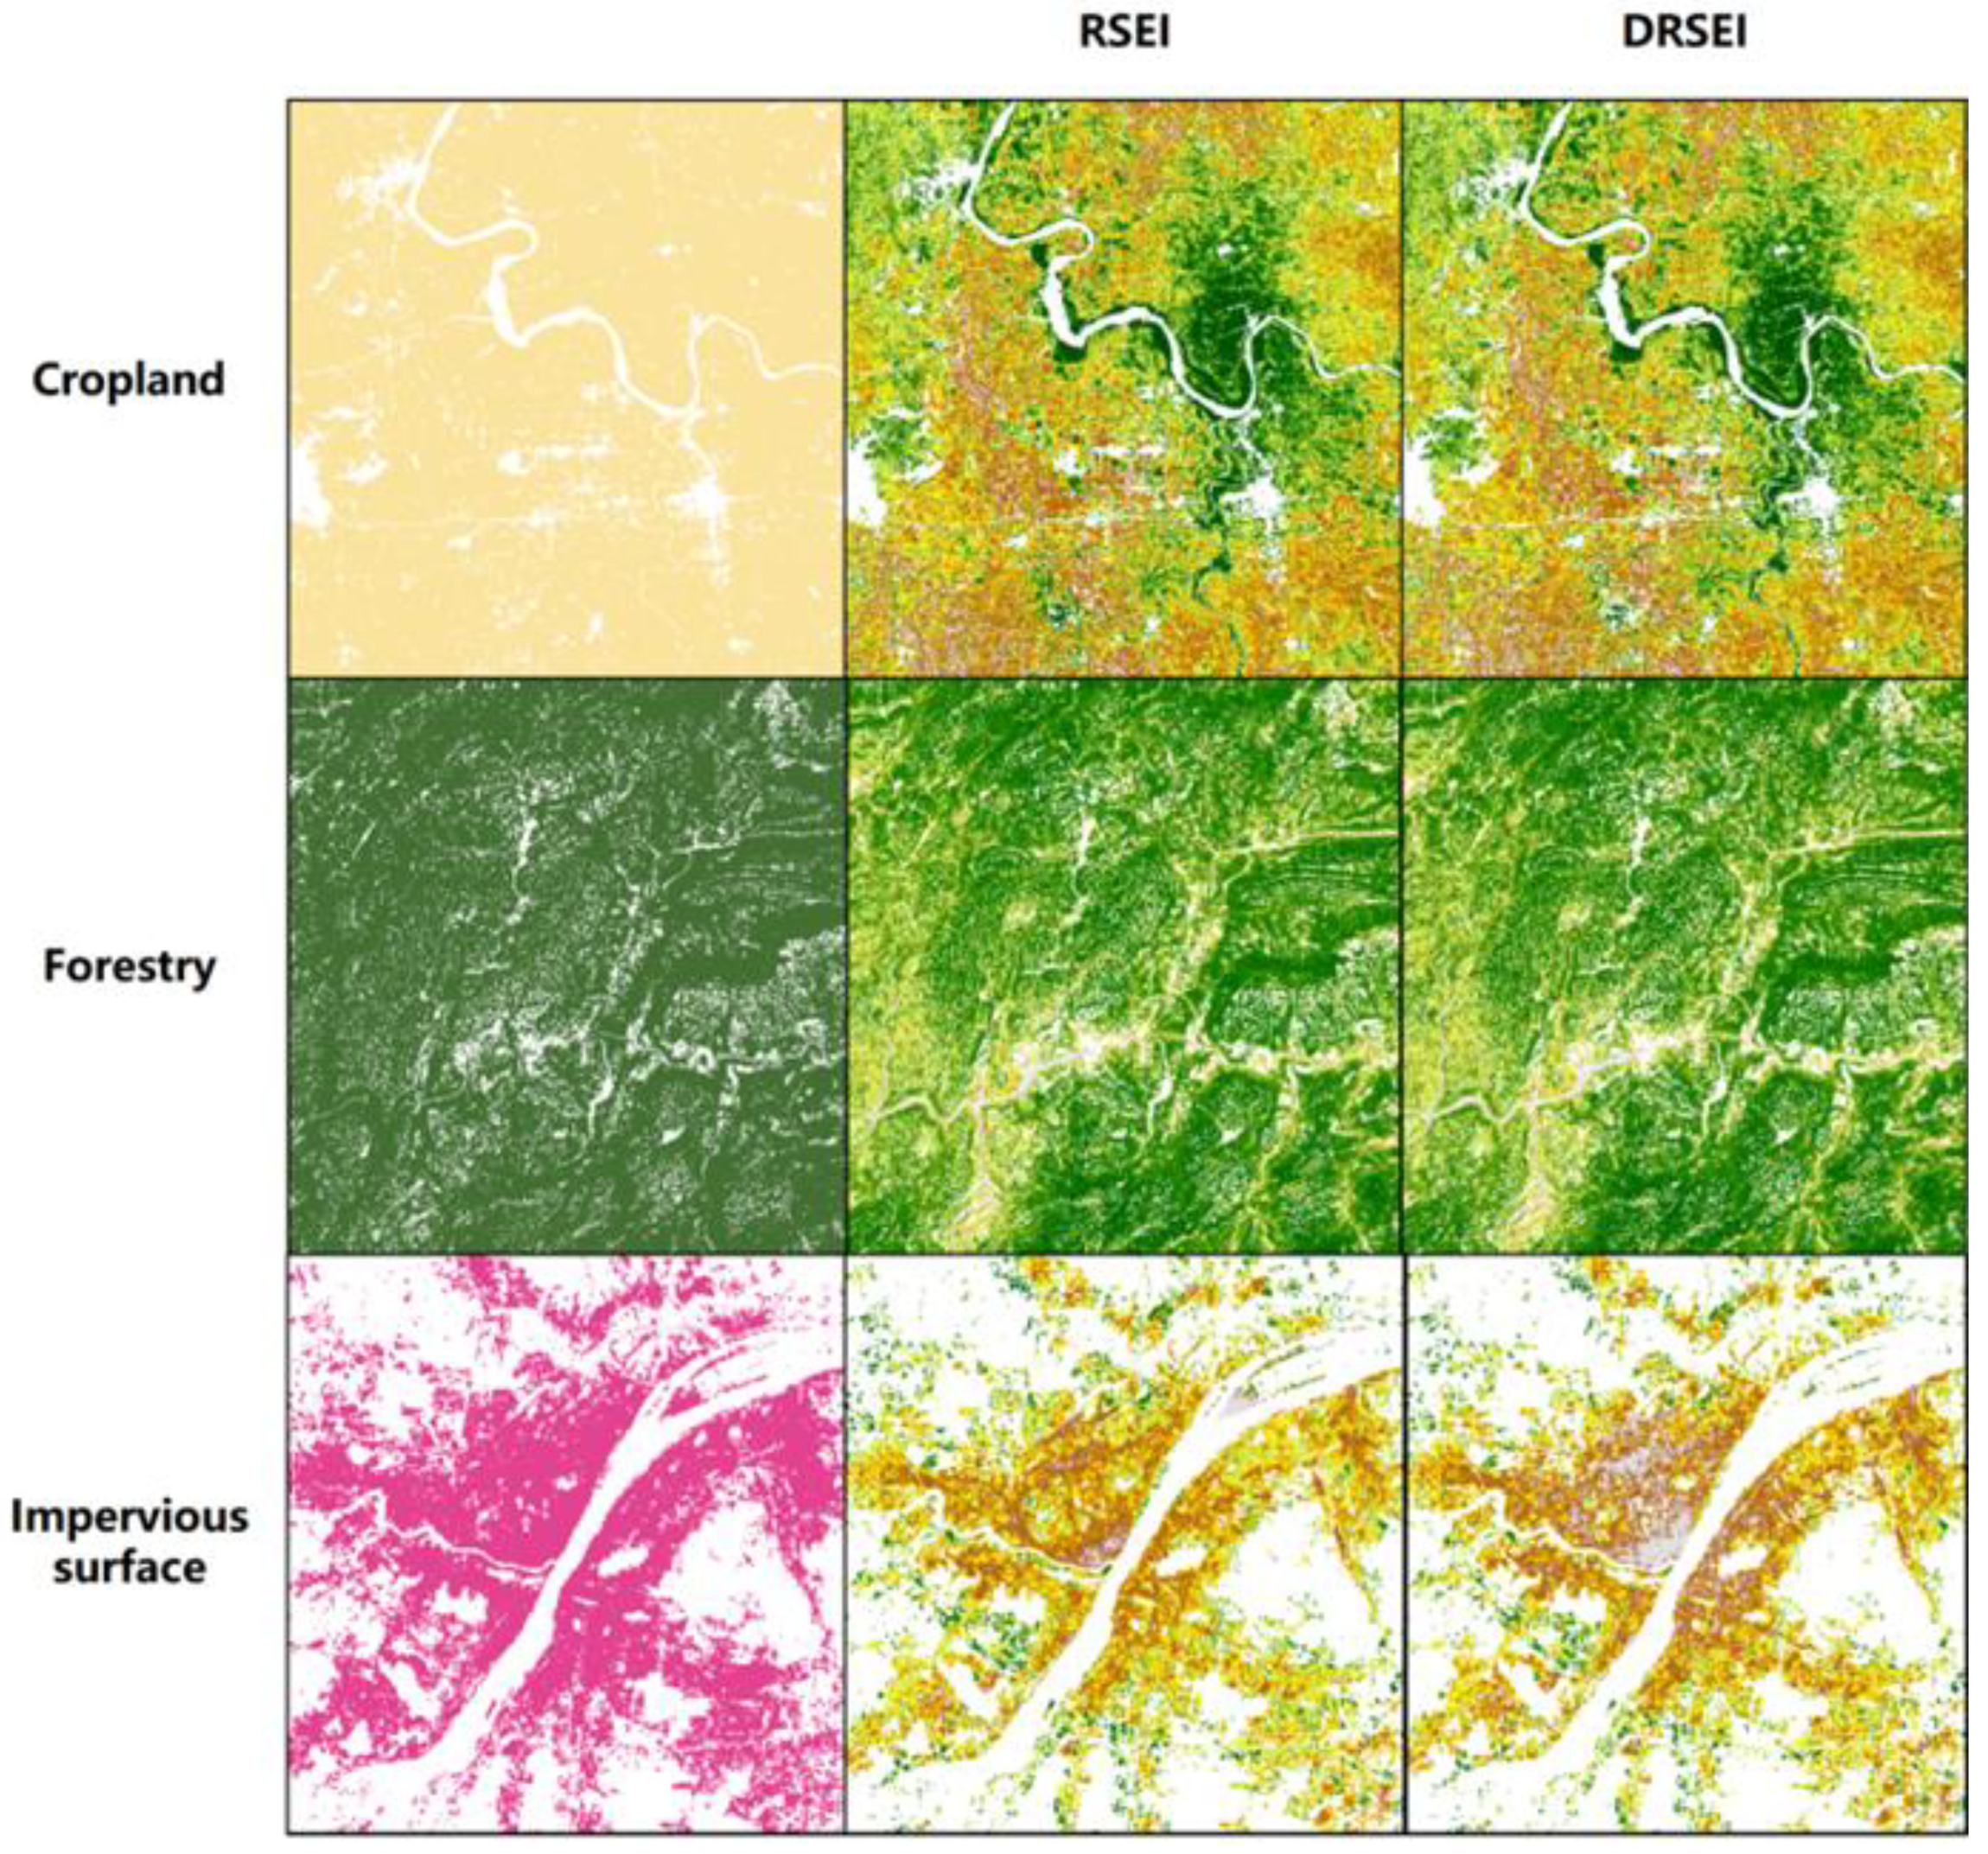
To further compare the two methods, scenarios of different land use types identified by the two models were selected, including cropland, forest, and impervious surfaces, which are widely distributed in the study area. As shown in
Figure 7, for cropland land use/land cover type identification, both models produced results with clear boundaries and essentially matched the actual distribution characteristics. Furthermore, the DRSEI identification results exhibited more continuous spatial distribution changes, whereas the RSEI results were more dispersed and showed noticeable point-like features. In the identification of forested areas, the overall recognition results of both models were consistent. The DRSEI provided richer layering in its results, especially in the identification of areas along riverbanks, which were more distinct than those identified by the RSEI, which showed less-clear riverbank areas and less-defined boundaries. For impervious surface land use type identification, the DRSEI detected two large areas of impervious surfaces within the region that were aligned with the urban areas of the region.
4.4. Ecological Analysis of Hubei Province
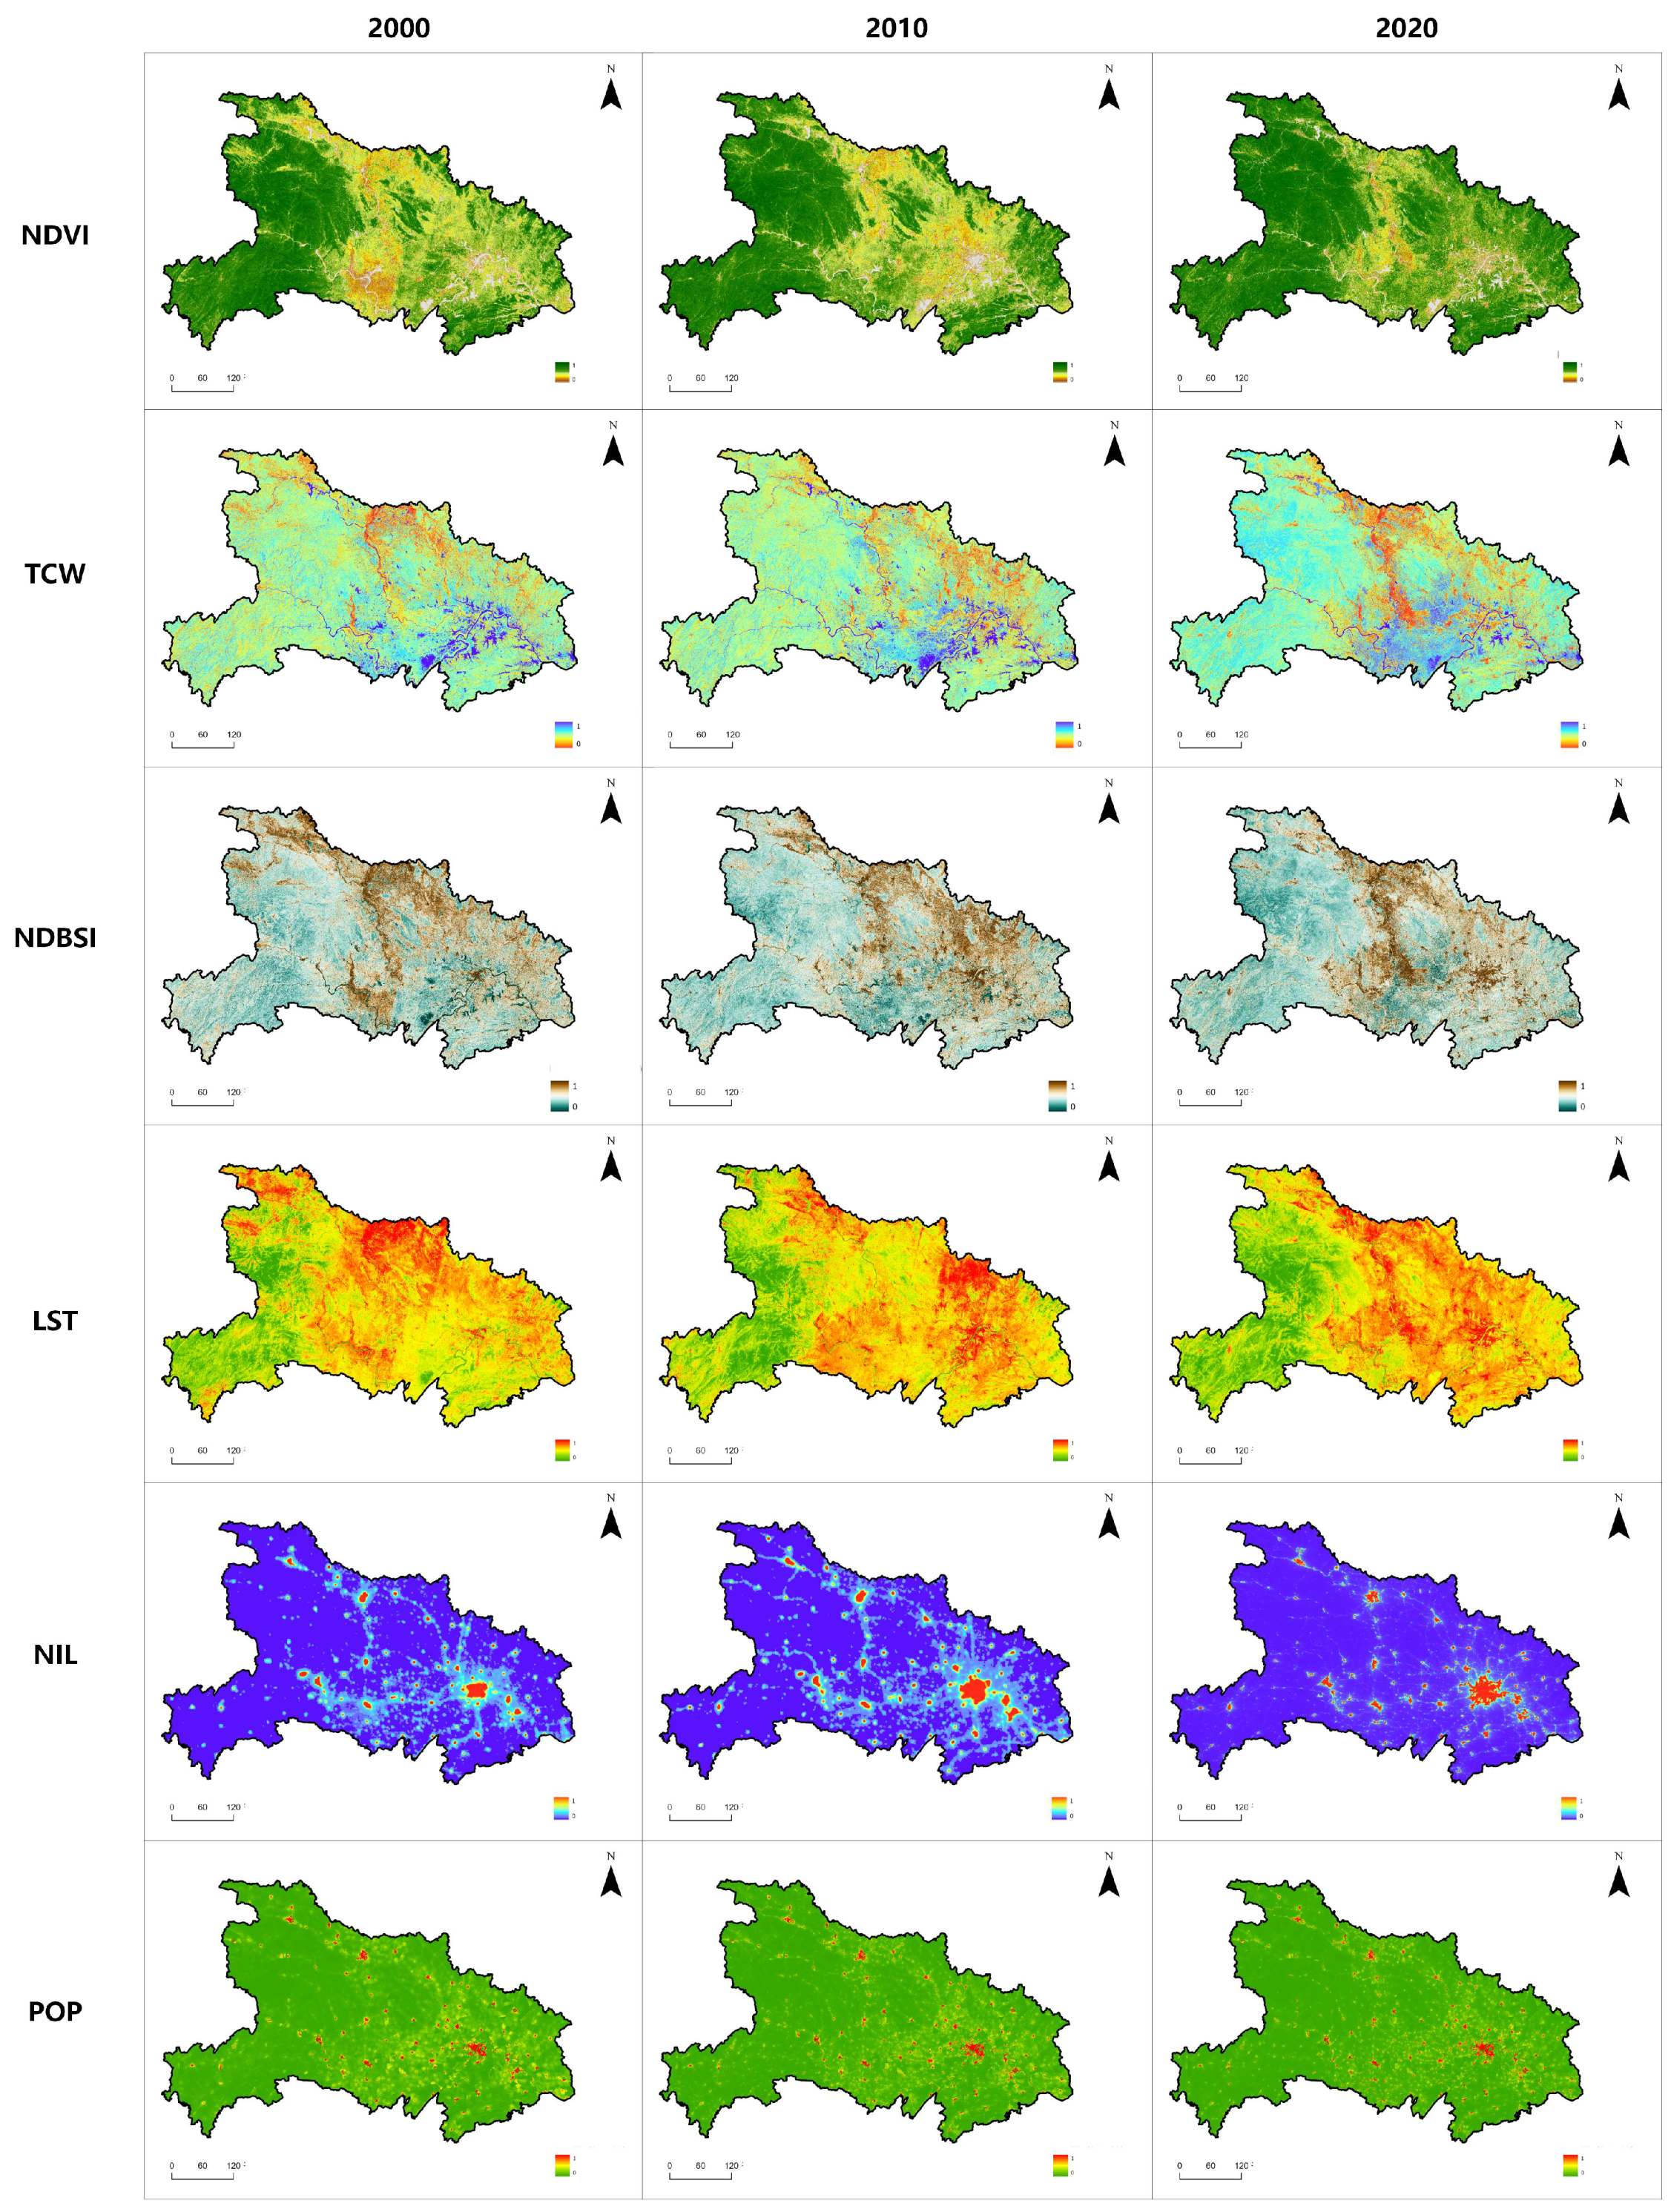
In this study, we calculated six component indicators for 2000, 2010, and 2020. The indicators were normalized as shown in the spatial distribution in
Figure 8. Simultaneously, the distribution of humidity was influenced by terrain, latitude, and rivers, resulting in uneven results. The surface temperature in Hubei Province has increased annually. The central and eastern regions are home to many large cities, and the land use types predominantly consist of farmland; therefore, the urban heat island effect is pronounced. Areas with high LST values are widely distributed in the central region. The rise in the NLI is associated with the rapid socioeconomic development of Hubei Province. Although the population of Hubei Province has not changed significantly, considerable differences are observed in population density. Areas with a high population density are sporadically distributed and located in the central urban areas of various districts of Hubei Province, for instance, in cities such as Wuhan, Xiangyang, and Jingzhou. Of these, Wuhan has the largest area with the highest population density.
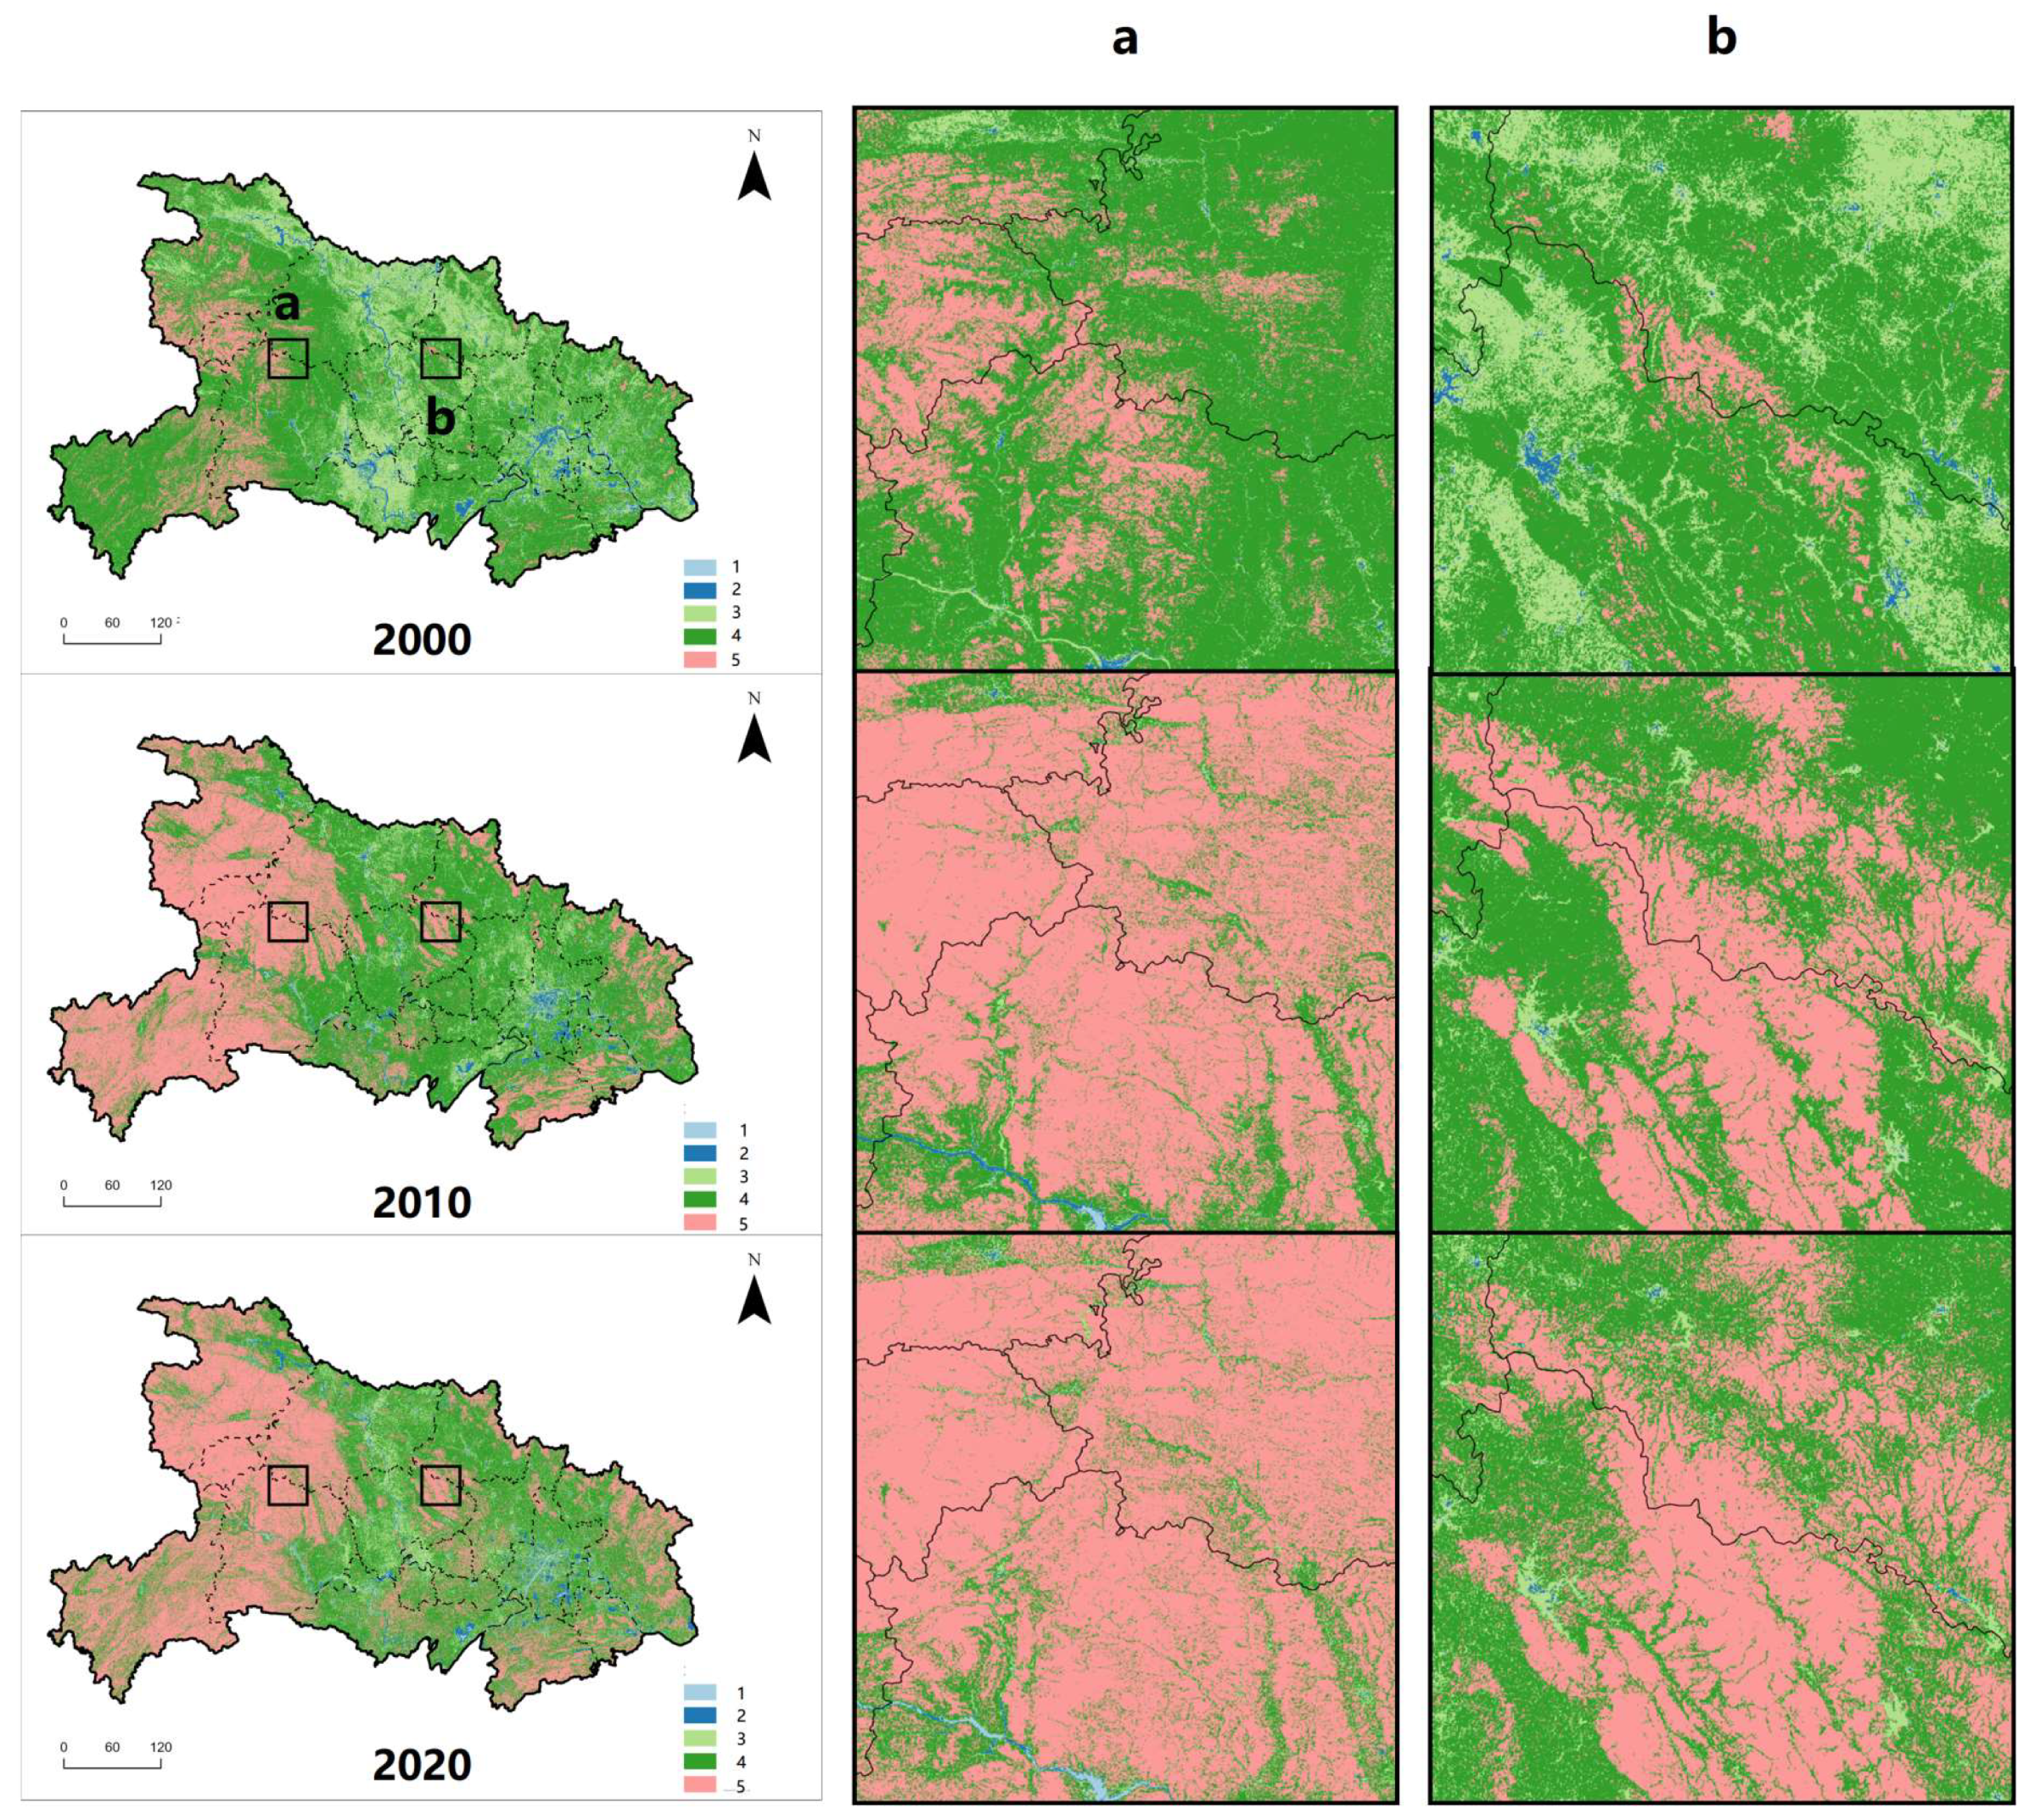
To more intuitively display the spatial distribution of the ecological environment, the DRSEI was further divided in accordance with Environmental Quality Assessment Standards [
50] into five ecological environment grades. When the index value was within the interval [0,0.2), it was categorized as Grade 1, which corresponds to poor ecological environment quality. [0.2,0.4), [0.4,0.6), [0.6,0.8), and [0.8,1) are classified as Grade 2, Grade 3, Grade 4, and Grade 5, respectively, corresponding to poor, average, good, and excellent ecological environment quality. As depicted in
Figure 9, the ecological environmental quality of Hubei Province in 2000, 2010, and 2020 all exhibited an overall distribution characteristic of poorer in the central region and better in the western and eastern regions. From 2000 to 2020, the areas with better ecological environment quality in the eastern and western regions expanded to the central region, and more and more areas with excellent ecological environment quality appeared in the central region. This indicates that the quality of the ecological environment has been gradually improving, especially in the central region, where a large amount of farmland has been transformed into forestland. This transformation is beneficial for the recovery of regional vegetation species diversity and soil conservation capacity and contributes to improving the ecological environment quality.
In terms of spatial distribution, the western region had a higher DRSEI and was predominantly forested, with a relatively minor impact of human activity. Moreover, a small area of poor ecological environmental quality was observed in the central region, centered around Wuhan City. In 2000, a strip of poor ecological environment quality was distributed over a relatively large area along the Han River Basin. This showed an improvement in ecosystem quality based on the decrease in area by 2010 but slight increase again by 2020. Since 2010, a large area of excellent ecological environmental quality has emerged in the central region in the border areas of the cities of Jingmen and Suizhou, which are distributed with forested land. With the reduction in agricultural activities, such as cultivation, and the subsequent restoration of vegetation, the ecological environment quality in this area has gradually improved.
Based on the ecological environment quality grading statistics in
Table 6, the changes in the ecological environment quality of Hubei Province can be further quantitatively assessed. Overall, the mean value of the DRSEI fell within the range of good ecological environment quality and showed an increasing trend over time, indicating continuous improvement in the ecological environment of Hubei Province. However, the rate of improvement slowed between 2010 and 2020. The proportion of areas with poor ecological conditions remained low, with a slow increase from 2000 to 2010 mostly in areas affected by water bodies, which could be considered negligible. Areas with poor to average ecological environmental quality decreased significantly from 2000 to 2010 and showed a slight rebound by 2020, although such areas still accounted for a relatively small proportion of the total area.
The area of regions with good to excellent ecological environment quality accounted for more than half of the total area of Hubei Province and showed a significant increase in both 2010 and 2020 compared with that in 2000, with the proportion reaching approximately 85%. Such regions were primarily located in the western part of Hubei Province, which is extensively covered in forest land. Thus, this land use type plays a significant role in the ecological environment quality of this province. The proportion of areas with excellent ecological environmental quality has been continuously increasing, although the combined proportion of good and excellent areas remains unchanged, suggesting a transition from good to excellent ecological environmental quality in some areas. These changes reflect that the ecological quality status of Hubei Province is relatively good and has been gradually improving over time, which is consistent with the RSEI findings.
5. Discussion
The protection of ecological and environmental systems is gaining increasing societal attention, and the monitoring and evaluation of ecological conditions have also become current research hotspots [
3,
16,
51]. China has introduced several policies to address these ecological issues. Hubei Province represents an important transportation hub and central province of the Yangtze River Basin in China, and protection of its ecological environment is of significant importance for sustainable socioeconomic development and ecological barrier construction in China [
46]. Therefore, this study proposes the DRSEI and applies it to Hubei Province as the study area to investigate the ecological environmental conditions and associated spatiotemporal change trends over the past two decades.
In this study, Both Landsat 5 and Landsat 8 data were extensively calibrated and validated, ensuring high data quality. Although there are differences in sensor characteristics, the data from these missions were harmonized and normalized to ensure consistency in our analysis. We applied rigorous preprocessing steps, including radiometric calibration, atmospheric correction, and geometric correction, to minimize any potential discrepancies. We conducted a correlation analysis between the indices derived from Landsat 5 and Landsat 8 data. The results showed a high correlation coefficient, indicating that the indices are consistent across the different datasets. Moreover, the consistency of the indices was further validated using ground truth data and other independent datasets. This validation step ensured that the indices accurately reflect the ecological conditions on the ground.
The DRSEI is innovative based on the construction of index components and fitting method for the model. In addition to common natural indicators, the index components incorporate socioeconomic and demographic indicators, thus highlighting the interdependent and mutually restrictive relationship between human economic activities and the ecological environment. In the model fitting method, the principal component analysis was replaced with an autoencoder architecture to address issues such as the limitation of the PCA to linear relationships and data wastage. Furthermore, three-layer LSTM neural network modules were integrated within the autoencoder architecture, making the model more suitable for long-term continuous monitoring.
The DRSEI, established using an autoencoder architecture and LSTM modules, exhibited good scientific validity and accuracy and was well suited for ecological environment quality research in Hubei Province. The model was validated based on an accuracy analysis, ablation experiments, and a comparative scenario analysis. The experimental results indicated that by using the EI as the actual data for comparison, the DRSEI compared with RSEI showed an increase in the Pearson correlation coefficient from 0.731 to 0.895 (an approximate increase of 22.4%). The inclusion of the LSTM modules also enhanced the accuracy of the model. Furthermore, the evaluation results of the DRSEI were spatially continuous and provided a clearer depiction of the ecological environment details, which verifies that the model possesses good scientific validity and accuracy and is well suited for ecological environment quality research in Hubei Province.
The ecological environmental status of Hubei Province improved, especially from 2000 to 2010, which experienced significant ecological enhancements. However, when compared to the relatively rapid improvement rate from 2000 to 2010, the rate of improvement decreased gradually between 2010 and 2020. In terms of spatial distribution, considerable differences remain, with the western region exhibiting better ecological environment quality and a more balanced distribution. The central plains have relatively poor ecological environment quality, with more pronounced spatial distribution differences. The distribution and transformation of the ecological environment are closely related to the urban construction process in Hubei Province.
Besides, our proposed model incorporates specific land use/land cover changes as variables rather than treating each time period as a one-off independent of the others. The input data for each time period include land use/land cover information. This information is used to capture changes in land use/land cover over the 20-year period. The LSTM layers process the input data sequentially, maintaining an internal state that evolves over the time series. This allows the model to learn the temporal relationships between land use/land cover changes and ecological quality. The model captures the cumulative effects of land use/land cover changes over the entire time period, providing a more comprehensive and accurate assessment of ecological quality.
While our study has made significant contributions to the field of ecological quality assessment using deep learning techniques, there are several limitations that we acknowledge. First, the current study used data from 2000, 2010, and 2020, which provides 10-year intervals for analysis. This may not capture short-term ecological changes and annual variations. Higher temporal resolution data, such as annual or quarterly data, would provide a more detailed view of ecological dynamics. Second, the spatial resolution of the data used (100 m) may not be sufficient to capture fine-scale ecological features, especially in complex terrain and urban areas. Higher spatial resolution data could improve the accuracy of the DRSEI in these areas. Moreover, while we included the Population Density Index and the Nighttime Light Index as socioeconomic indicators, other factors such as economic development, land use policies, and environmental regulations could also play a significant role in ecological quality. Incorporating these additional indicators could provide a more comprehensive assessment. Finally, the three-layer LSTM model, while effective, may be computationally intensive and require significant resources for training and validation. Simplifying the model or using more efficient architectures could improve computational efficiency without sacrificing performance.
Future studies should consider using higher temporal resolution data to capture short-term ecological changes and annual variations. This could include monthly or quarterly remote sensing data, which would provide a more detailed temporal profile of ecological conditions. On the other hand, exploring more efficient deep learning architectures, such as convolutional LSTM (ConvLSTM) or attention mechanisms, could improve the model’s performance while reducing computational requirements.


