1. Introduction
Synthetic Aperture Radar (SAR) is an active microwave imaging technology that offers all-weather, day-and-night, and high-resolution ground observation capabilities, making it widely applicable in military surveillance, environmental remote sensing, and natural disaster detection [
1,
2,
3]. However, SAR differs from optical imaging in its underlying mechanisms, and its imaging algorithms are diverse, including range-Doppler Algorithm [
4], chirp-scaling Algorithm [
5], polar-format algorithm [
6], and compressed sensing Algorithm [
7]. The SAR images obtained through these algorithms contain abundant information about target scattering intensity and exhibit high dynamic range (HDR) characteristics. This characteristic results in a vast intensity dynamic range in the images. Traditional methods, such as uniform quantization and log quantization, often struggle with the impact of strong scatterers when processing SAR images, leading to poor overall visual quality and significant quantization distortion. This distortion diminishes the quality of SAR image products and adversely affects the subsequent processing of SAR images.
In practical applications, SAR images are often quantized into 8-bit or 16-bit grayscale images for efficient storage and display. However, due to the HDR of SAR images, the visual quality of these quantized grayscale images is often poor, with significant quantization distortion. To improve visual quality, researchers often discard the pixel values of strong scatterers and then apply linear stretching to the remaining pixel values to span the full dynamic range [
8], while this approach enhances visual quality, it results in a loss of radiometric information in strong scattering regions, thus reducing the accuracy of subsequent applications [
9]. Dynamic range compression must be applied to SAR images before quantization to minimize the negative impact of HDR characteristics on quantization performance while preserving critical information. This compression is a crucial step in nonlinear quantization, effectively mitigating the influence of HDR on quantization outcomes and enhancing overall quantization performance.
Dynamic range compression methods are generally divided into two categories: filter-based techniques and transfer function-based techniques. However, filter-based methods tend to disrupt the ranks of intensity levels, making them fundamentally unsuitable for SAR image dynamic range compression, with inherent limitations [
10,
11,
12]. In contrast, transfer function-based methods preserve intensity rank by using a monotonic function to map input HDR image values to low dynamic range (LDR) image values, ensuring that the output histogram maintains the correct grayscale order. Transfer function-based methods can be further categorized into handcrafted mapping functions and histogram–based techniques. Handcrafted mapping functions rely on expert-designed tone mapping operator (TMO) curves to map radiometric intensity values to a suitable dynamic range [
13,
14,
15,
16]. However, these methods do not achieve the theoretically minimal compression loss. For instance, an adaptive logarithmic mapping method was proposed, which adjusts the dynamic range by introducing a logarithmic bias [
17]. An automatic transformation technique is proposed to enhance image brightness by using gamma correction and the probability distribution of brightness pixels [
18]. At the same time, Reinhard et al. designed a complex mapping model inspired by biological photoreceptors, adjusting image dynamic range by simulating light adaptation effects [
19]. In the context of adjusting the dynamic range of SAR images, several mapping functions from the optical image domain have been applied to the dynamic range compression of SAR images, and an interactive visualization framework for SAR data has been developed [
20]. Gavrovska et al. explored the effects of different mapping functions on SAR image quality [
21]. However, since handcrafted tone mapping curves depend heavily on expert knowledge, they struggle to adapt automatically to the statistical properties of SAR images, making the design process complex and limiting the performance of the quantization results. Typical histogram–based mapping techniques include Histogram Equalization (HE) and its various variants [
22,
23,
24,
25,
26,
27]. A locally constrained HE method is introduced to ensure continuous variation of local grayscale transformations in the spatial domain [
28]. Duan et al. combined HE with linear mapping using a weighted fusion method, proposing a formula for calculating the weight parameters, thereby achieving a balanced fusion between linear mapping and histogram equalization in terms of visual effect [
29]. To further preserve brightness and naturalness, some researchers have developed derived methods of HE, which decompose the histogram into multiple sub-histograms and apply equalization independently to each sub-histogram. For example, Wang et al. divided the histogram into two sub-images based on the probability density distribution of the image and then equalized and merged them into a single image [
30]. Histogram equalization brightness preservation model is proposed, which segments the image histogram based on the grayscale mean criterion and applies equalization to each sub-histogram separately [
31]. The Brightness Preserving Dynamic Histogram Equalization (BPHE) algorithm is proposed, which partitions the histogram based on local extrema, ensuring that the average brightness of the output image is nearly identical to that of the input image [
32]. To address the over-enhancement issue inherent in HE, a method was proposed that transforms the dynamic range compression problem into finding the maximum weighted path in a K-edge graph [
33]. This method uses linear programming to solve the contrast enhancement problem under constraint optimization and achieves the desired visual effect by imposing distortion constraints, ensuring the dynamic range meets visual expectations. Wu et al. developed a contrast enhancement framework with optional constraints, allowing the desired visual effect to be achieved by adding and fine-tuning constraints [
34]. A nonlinear quantization method based on information entropy was proposed to address the HE issue in SAR images [
35]. By constraining reflectance distortion, this method preserves the maximum entropy of the SAR image and visualizes the images.
In practical application, existing dynamic range compression techniques tend to prioritize image visual quality. However, there is often a trade-off between reducing quantization distortion and improving visual appearance, meaning these techniques fail to achieve an optimal nonlinear quantization result with minimal distortion. Furthermore, current quantization methods focus on global quantization outcomes, neglecting optimization for specific weak scattering region. In complex scenes, the diverse object types and complex statistical characteristics of SAR images can adversely affect the quantization performance of these weak scattering regions. A nonlinear quantization method for SAR images based on a segmentation strategy is proposed to enhance the performance of quantization algorithms for weak scatterers in complex scenes. Firstly, the method specifically extracts and quantizes sparse, strong scatterers in SAR images. Further, a quantization distortion optimization model is refined to minimize the quality difference between the reconstructed and original images. Considering weak scatterers’ signal-to-noise ratio (SNR), a quantization method guided by SNR is employed. Therefore, this approach significantly improves the quantization SNR of weak scatterers while maintaining a near-globally optimal SNR.
This paper is organized as follows. In
Section 2, related research on nonlinear quantization is introduced, covering the construction of a global quantization distortion model and the concept of segmentation-guided nonlinear quantization.
Section 3 provides some basic information about the SAR nonlinear quantization method, including an overview of the process and several vital innovations.
Section 4 validates the effectiveness of the proposed method using GF data.
Section 5 discusses the algorithm and experimental results, and in
Section 6, we summarize the main findings of this paper.
2. Insights of Existing Quantization Distortion Models
This section mainly introduces the research related to nonlinear quantization, including an overview of the global quantization distortion model, the application of image segmentation strategies in nonlinear quantization, and the fundamental assumptions in the nonlinear quantization process.
2.1. Quantization Distortion Model
Dynamic range compression is the core of the nonlinear quantization method for SAR images. Dynamic range compression aims to preserve sufficient information in the LDR image while ensuring high-quality reconstruction of the HDR SAR image during inverse mapping. As a result, the quantization performance depends on the discrepancy between the reconstructed and original images. Nonlinear quantization aims to identify the optimal global tone mapping curve that minimizes the mean squared error between the reconstructed and original images. The optimization process for the mapping function in the nonlinear quantization method is shown in
Figure 1. Let
x denote the input SAR amplitude image, and
y denote the amplitude image after mapping. Let
also represent the quantized reconstructed amplitude image, and
denote the reconstructed amplitude image after inverse mapping. Additionally, let
represent the parameter set that controls the mapping. The objective of the optimization function is to find the optimal mapping parameters that minimize the mean square error (MSE).
In typical distortion scenarios, the optimization problem for quantization distortion can be approximated by a near-optimal, simplified, closed-form solution. Piecewise linear functions are often employed instead of continuous, non-decreasing tone mapping functions to ease the solution process. Specifically, suppose the segments of the piecewise linear function have a constant width between nodes within the HDR amplitude range. In that case, the mapping function can be uniquely determined by a set of defined slopes:
where each segment
k has an equal width, and the width is
.
Since uniform quantization is employed in the quantization process, it can be assumed that the variance of the distortion noise introduced by quantization is independent of the signal distribution. Furthermore, if we assume that the true mapping function
exhibits local linear characteristics (meaning that the slopes at the distorted pixel values and the corresponding original pixel values are equal), then the optimization problem can be expressed in Equation (
3):
where
represents the histogram of the image. The assumption underlying this simplification is that the quantization distortion is not significant enough to disrupt the local linear characteristics, implying that the slope of the mapping curve remains unaffected by the distortion error introduced during quantization. This assumption enables us to avoid non-differentiable situations in uniform quantization. By utilizing the first-order Lagrange Karush–Kuhn–Tucker (KKT) optimality conditions, the solution can be expressed as follows:
Similarly, in the study of the optimal quantizer, it has been demonstrated that the contribution of each quantization unit to the total average distortion should be approximately equal [
36,
37]. This finding leads to deriving the optimal quantization point density function for the compander [
38].
It can be observed that the optimal quantization point density function’s form closely resembles that of Equation (
4), with both being proportional to the probability density function of the input image’s intensity values.
2.2. Segmentation-Guided Nonlinear Quantization
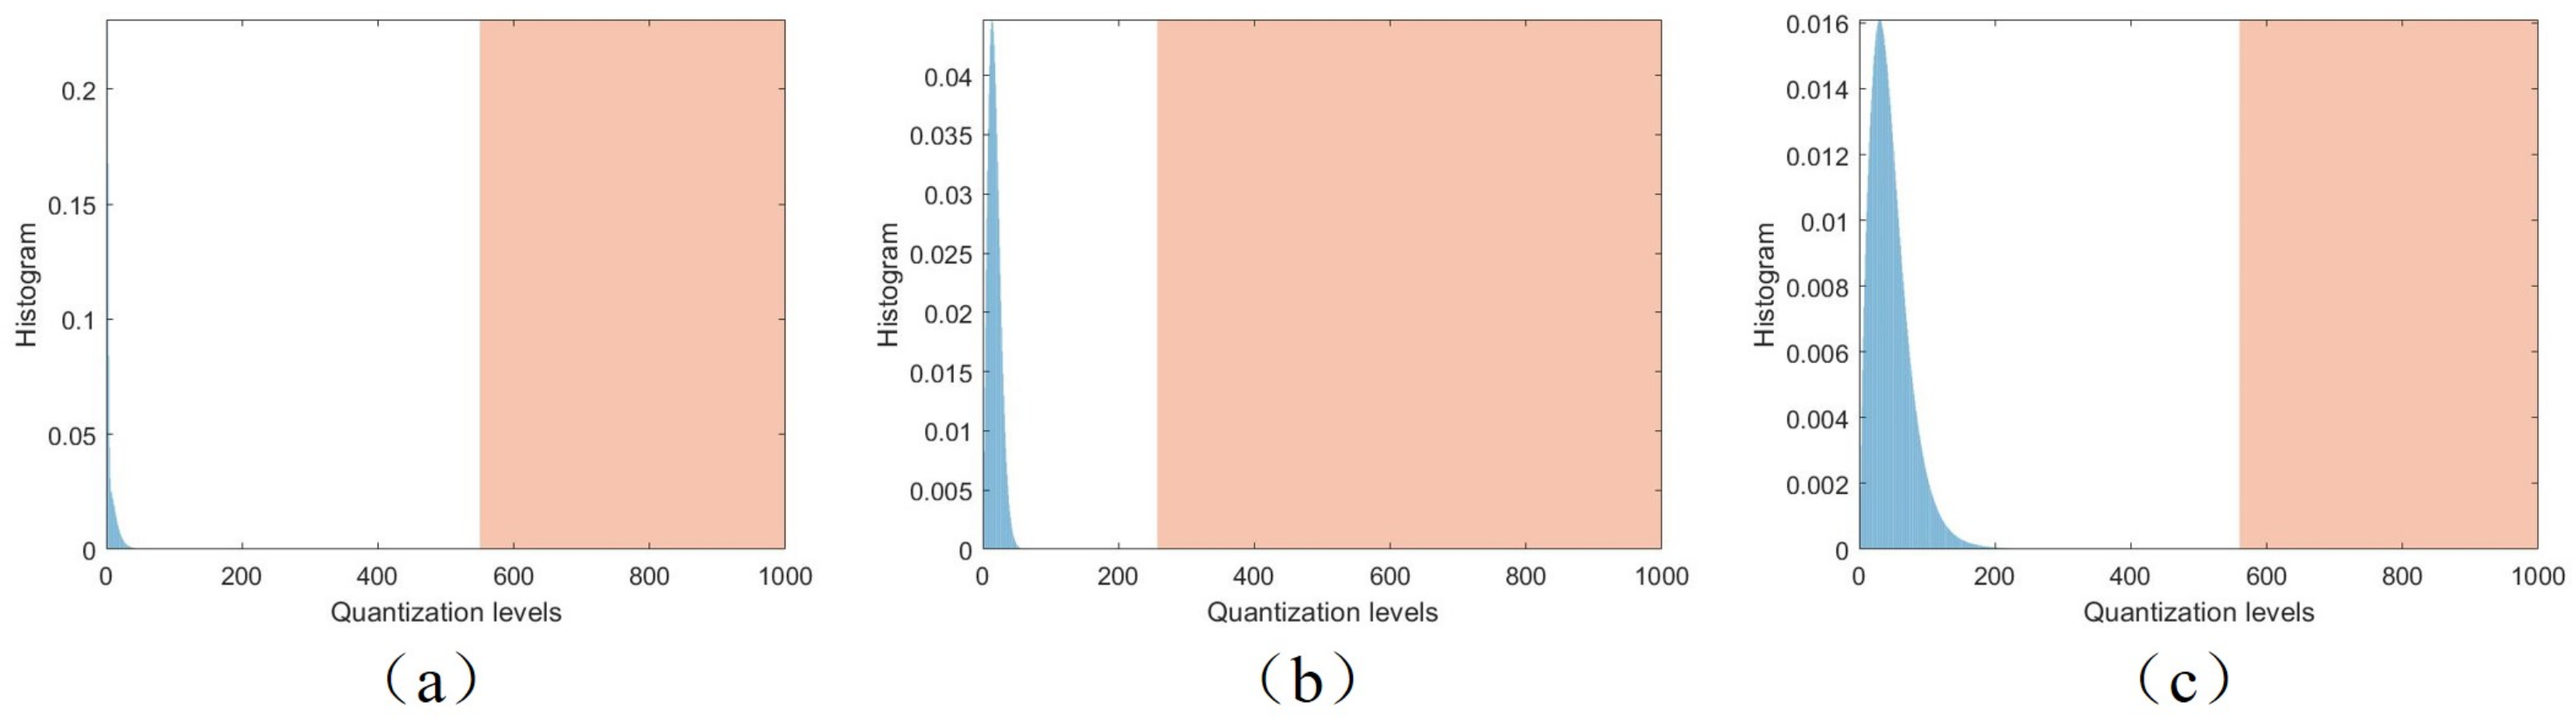
In the previous section, it was mentioned that the core idea of the optimal quantizer is to ensure that each quantization unit’s total average distortion contribution remains consistent. The optimal quantizer can automatically adapt to the statistical distribution characteristics of the image, providing significant advantages. On the one hand, the optimal quantizer does not require any prior information; on the other hand, its global quantization distortion can achieve a theoretical minimum, thus approaching the maximum quantization SNR. However, because the optimal quantizer aims to achieve global minimum quantization distortion, it may result in significant distortion in local quantization performance. Specifically, for quantization noise of the same magnitude, the quantization SNR of strong scatterers is typically much higher than that of weak scatterers. Moreover, the magnitude distribution of SAR images is unique, with a small number of sparse strong scatter points that may affect the stability of the optimal quantizer. Therefore, handling separately sparse strong scattering pixel values is necessary to avoid excessive compression in the strong scattering regions during quantization.
From the form of Equation (
4), it is clear that the shape of the mapping curve is directly related to the distribution characteristics of the image. Additionally, during the mapping process, the density distribution of the quantization cells in the quantizer is closely linked to the shape of the curve. Therefore, adjusting the histogram distribution of the image during quantization can enhance the local performance of the quantizer. The image segmentation-based nonlinear quantization method strategy involves distinguishing between strong and weak scattering regions based on the segmentation results. This leads to the creation of a new weighted histogram by merging the two sub-histograms, which is then used to derive an improved distribution of quantization intervals through the optimal quantizer method.
Based on the above analysis, it can be assumed that the strong and weak scattering regions in SAR images exhibit distinct statistical distribution characteristics, and these regions can be effectively distinguished using a simple and efficient histogram segmentation approach. The segmentation-guided nonlinear quantization essentially involves fine-tuning the image histogram based on spatial information. This paper employs a segmentation method that combines histogram segmentation with morphological transformations, aiming to differentiate regions of varying scattering intensities. By incorporating the segmentation results to refine the quantization intervals, the nonlinear quantization algorithm can effectively enhance the quantization performance in weak scattering regions.
3. Proposed Algorithm
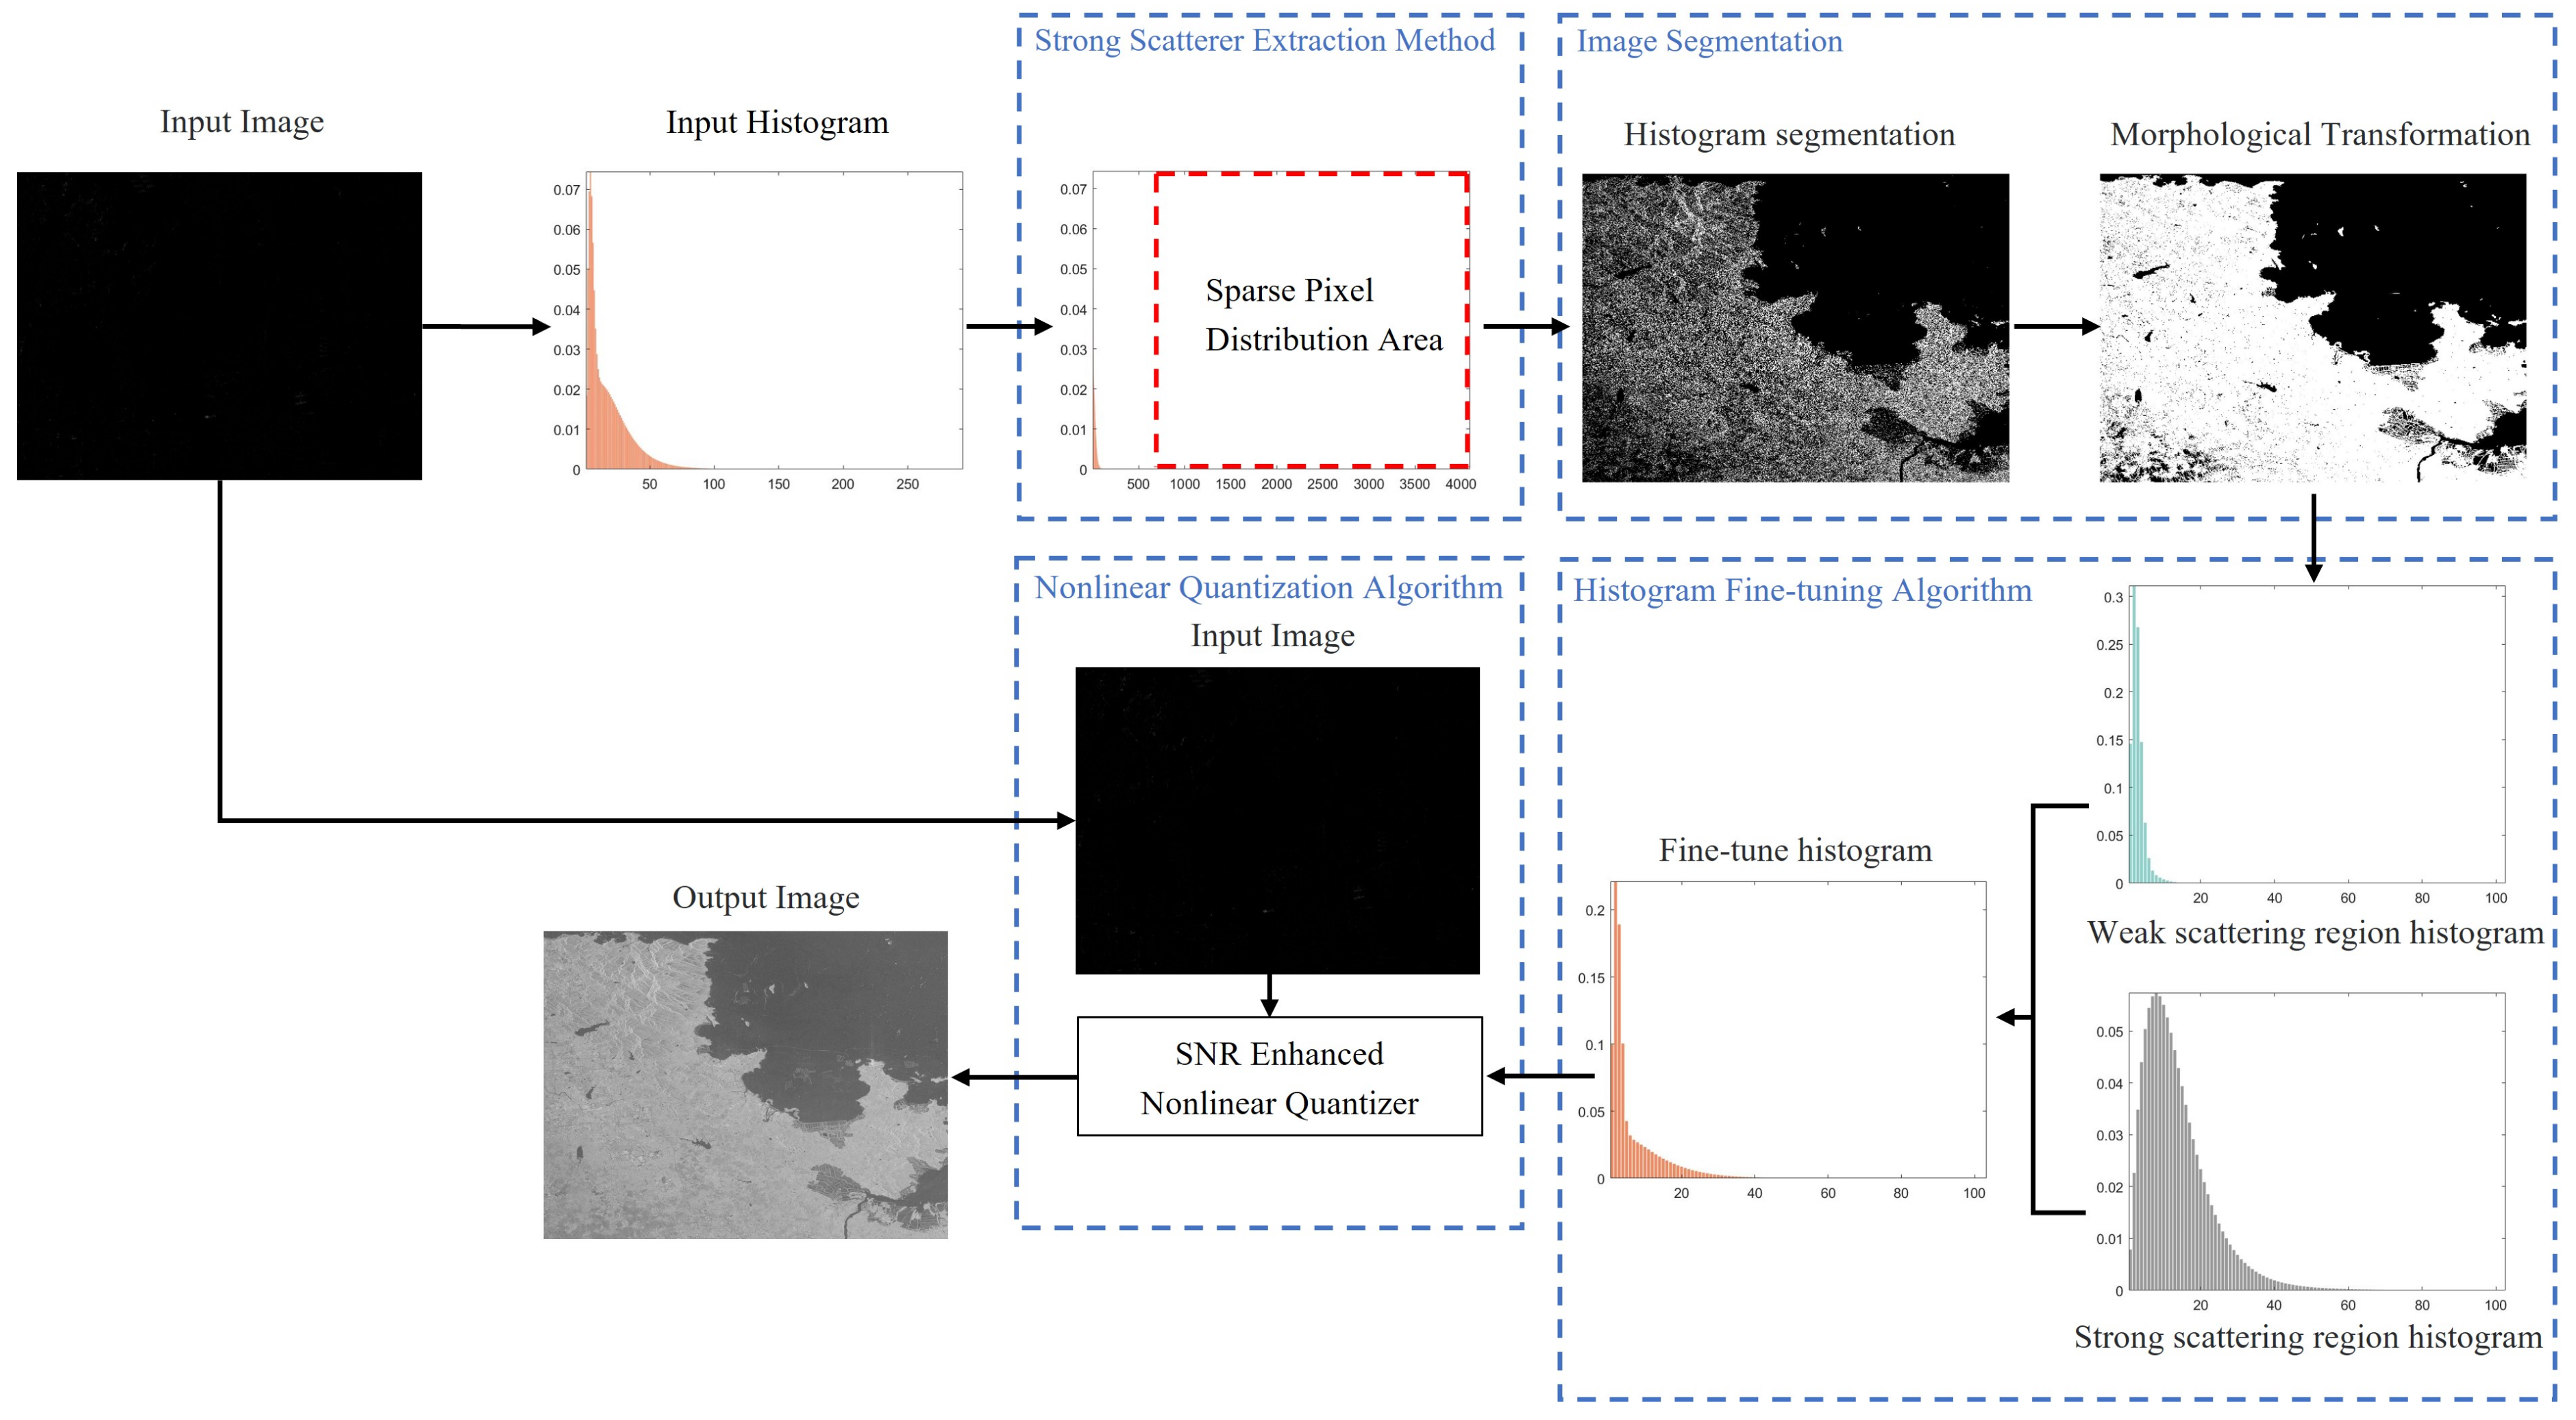
This section primarily introduces the nonlinear quantization method based on signal-to-noise ratio enhancement and segmentation guidance.
Figure 2 illustrates the overall framework of the algorithm, which encompasses the extraction of sparse strong scatterers, the histogram fine-tuning method guided by segmentation, and the nonlinear quantization algorithm designed to enhance the local SNR.
The task of nonlinear quantization aims to suppress quantization distortion and enhance the visualization of SAR images. As depicted in
Figure 2, the proposed method consists of four modules: (i) a sparse strong scatterer extraction method is employed to address the long-tailed histogram distribution of SAR images, where strong scatterers occupy an excessively large range, thus improving algorithm stability; (ii) image segmentation is utilized to distinguish between sea and land regions, obtaining histogram distribution characteristics for each area; (iii) a histogram fine-tuning method based on cross-information entropy is introduced to merge sub-histograms into a new fine-tune histogram; (iv) to address the issue of imbalanced SNR allocation, the optimization function of the nonlinear quantizer is improved, and the refined histogram is used to generate the final quantization interval distribution.
3.1. Sparse Strong Scatterer Extraction Method
Before performing nonlinear quantization on SAR images, extracting sparse, strong scattering points is a crucial preprocessing step. The histogram of SAR images typically exhibits an unimodal shape, with most pixel values concentrated in the lower quantization levels. Therefore, extracting these sparse, strong scattering points is especially important to avoid excessive compression in subsequent nonlinear quantization. Strong scattering points often correspond to important targets and features in the image, such as buildings and metallic structures. Extracting and quantizing these points separately can prevent excessive compression during subsequent quantization, thereby enhancing the algorithm’s stability.
The extraction of strong scattering points for 16-bit quantization consists of three main steps. First, a coarse uniform quantization of the obtained SAR magnitude image is conducted to generate a histogram with a lower quantization bit depth (set to 12 bits). This step allows us to determine the distribution of sparse, strong scatterers at a larger scale. Next, we identify the sparse strong scatterers from the coarse quantized histogram, extracting their locations and determining a truncation threshold. Finally, the coarse quantization thresholds are mapped back to the magnitude of the original image. The sparse, strong scatterers are assigned their own quantization intervals in the subsequent quantization process. The main workflow of the algorithm is illustrated in Algorithm 1. Coarse quantization is used to obtain the coarse quantization intervals
. During the quantization process, the image amplitude
satisfies
, meaning
belongs to the
n-th quantization level. The truncation threshold
t for sparse strong scatterers is extracted by finding the zero value index. For image amplitudes greater than
t, a one-to-one mapping between quantization intervals and amplitudes is applied to suppress the impact of strong scatterers on subsequent nonlinear quantization.
| Algorithm 1 Sparse Strong Scatterer Extraction Algorithm |
Input: SAR magnitude image, Coarse quantization bit depth bits
Output: Truncation threshold t, Sparse point quantization intervals |
1: Perform N-bit uniform quantization on the amplitude image, the normalized histogram of the image is computed, along with the quantization intervals .
2: Search for the first index where the normalized histogram equals zero, and truncation threshold .
3: Extract the pixel points greater than the threshold t and sort them in ascending order to obtain .
4: Use to store the boundaries of the quantization intervals.
5: for each do
6:
7: end for
8: return t, |
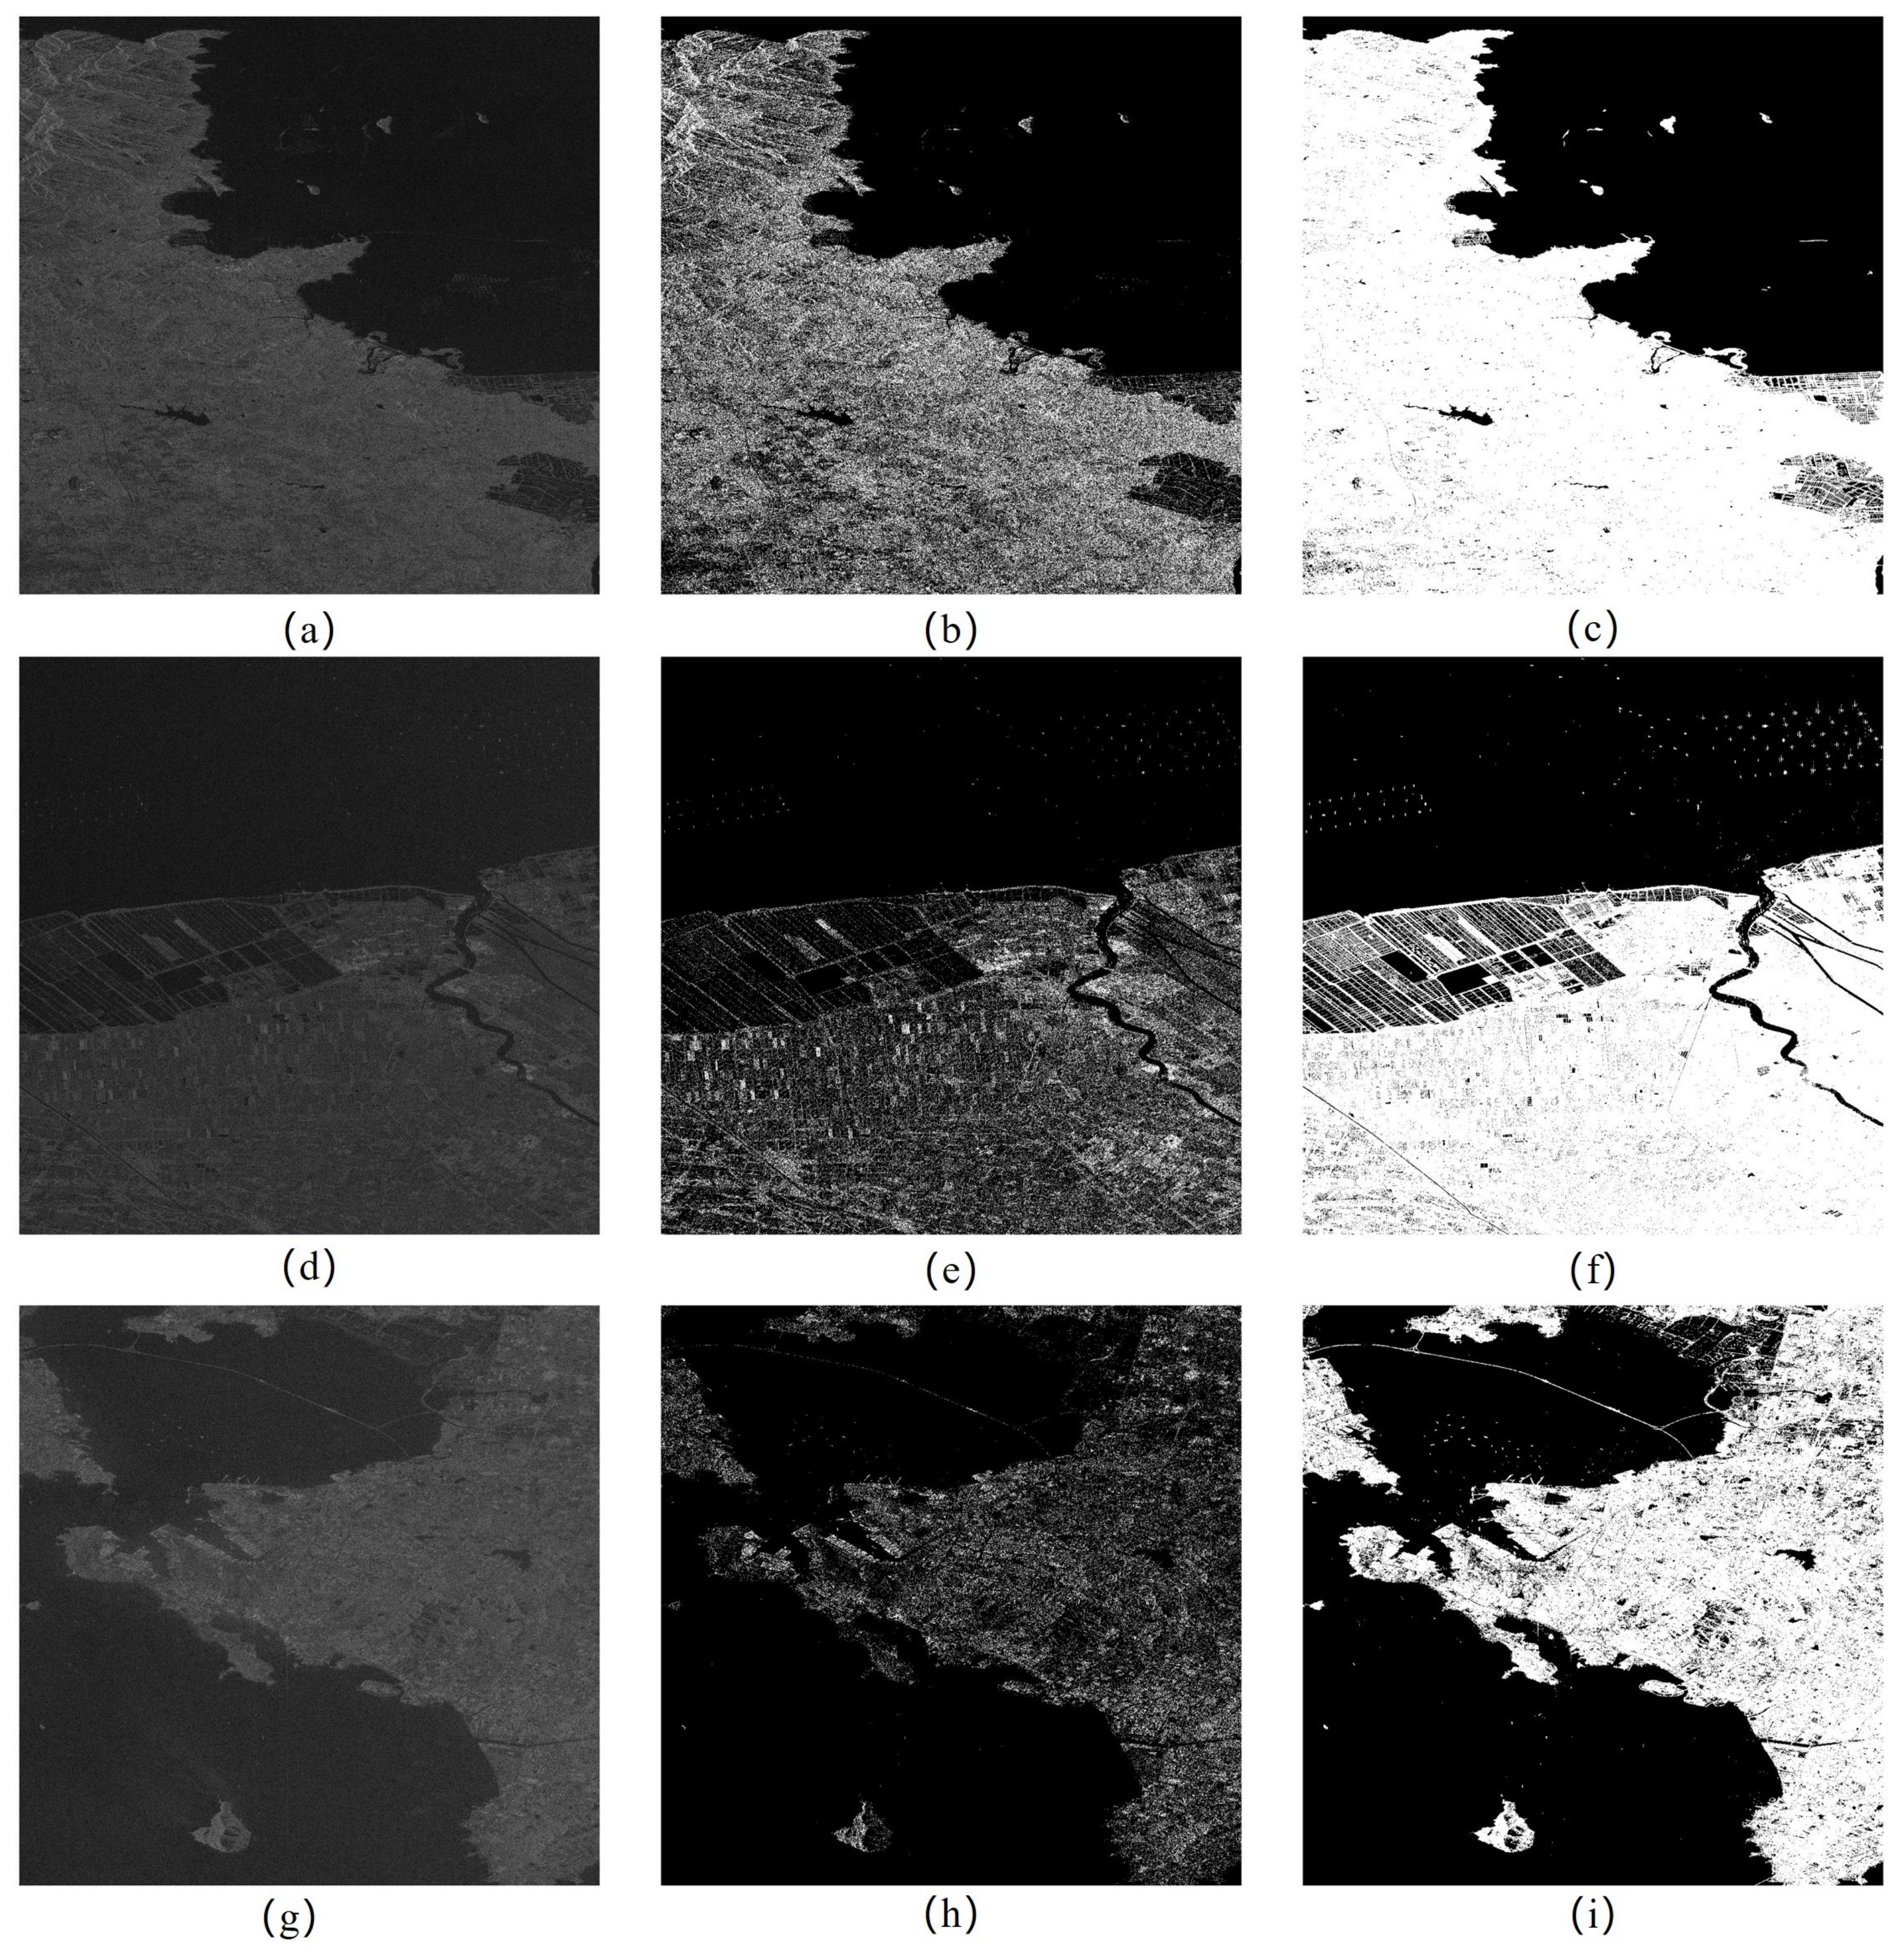
3.2. Histogram Refinement Method Guided by Image Segmentation
3.2.1. Image Segmentation Method
Various methods are available for segmenting SAR images. In the context of nonlinear quantization, the segmentation results are utilized to enhance the quantization performance of specific image regions. In traditional uniform quantization and logarithmic quantization, strong scattering regions in SAR images can compress the dynamic range of weak scattering pixels, leading to a decline in quantization performance and poor visual quality of the generated images. The introduction of image segmentation results provides spatial prior information for the nonlinear quantization algorithm to improve the quantization effectiveness in local regions.
We propose a segmentation method that combines histogram segmentation with morphological processing to address the weak quantization signal-to-noise ratio in the weak scattering regions of images. First, histogram segmentation intuitively distinguishes between weak and strong scattering areas in the SAR image, where the histograms of different regions do not overlap. This segmentation result serves as prior information for the nonlinear quantization algorithm, effectively enhancing quantization performance at low quantization levels. The histogram segmentation employs the Otsu method, using class variance as the criterion, selecting the image grayscale value that maximizes inter-class variance while minimizing intra-class variance as the optimal segmentation threshold [
39,
40]. The optimization problem can be expressed as follows:
where
is the cumulative probability for low quantization levels,
is the cumulative probability for high quantization levels,
is the overall mean grayscale value of the image,
is the mean grayscale value for low quantization levels, and
is the mean grayscale value for high quantization levels. By solving the above optimization problem, the optimal segmentation threshold can be obtained.
However, in SAR images, the histograms of weak and strong-scattering target regions often have overlapping intervals. A single histogram segmentation method can only differentiate between low quantization levels without considering spatial information. Morphological processing is also needed to incorporate spatial contextual information into the segmentation results. The connectivity and completeness of the local regions can be enhanced by applying dilation to the histogram segmentation results. The process can be expressed as follows:
where
B represents the histogram segmentation result of the SAR image, and
A denotes the structuring element used in the dilation operation. This method employs a circular structuring element with a radius of 5.
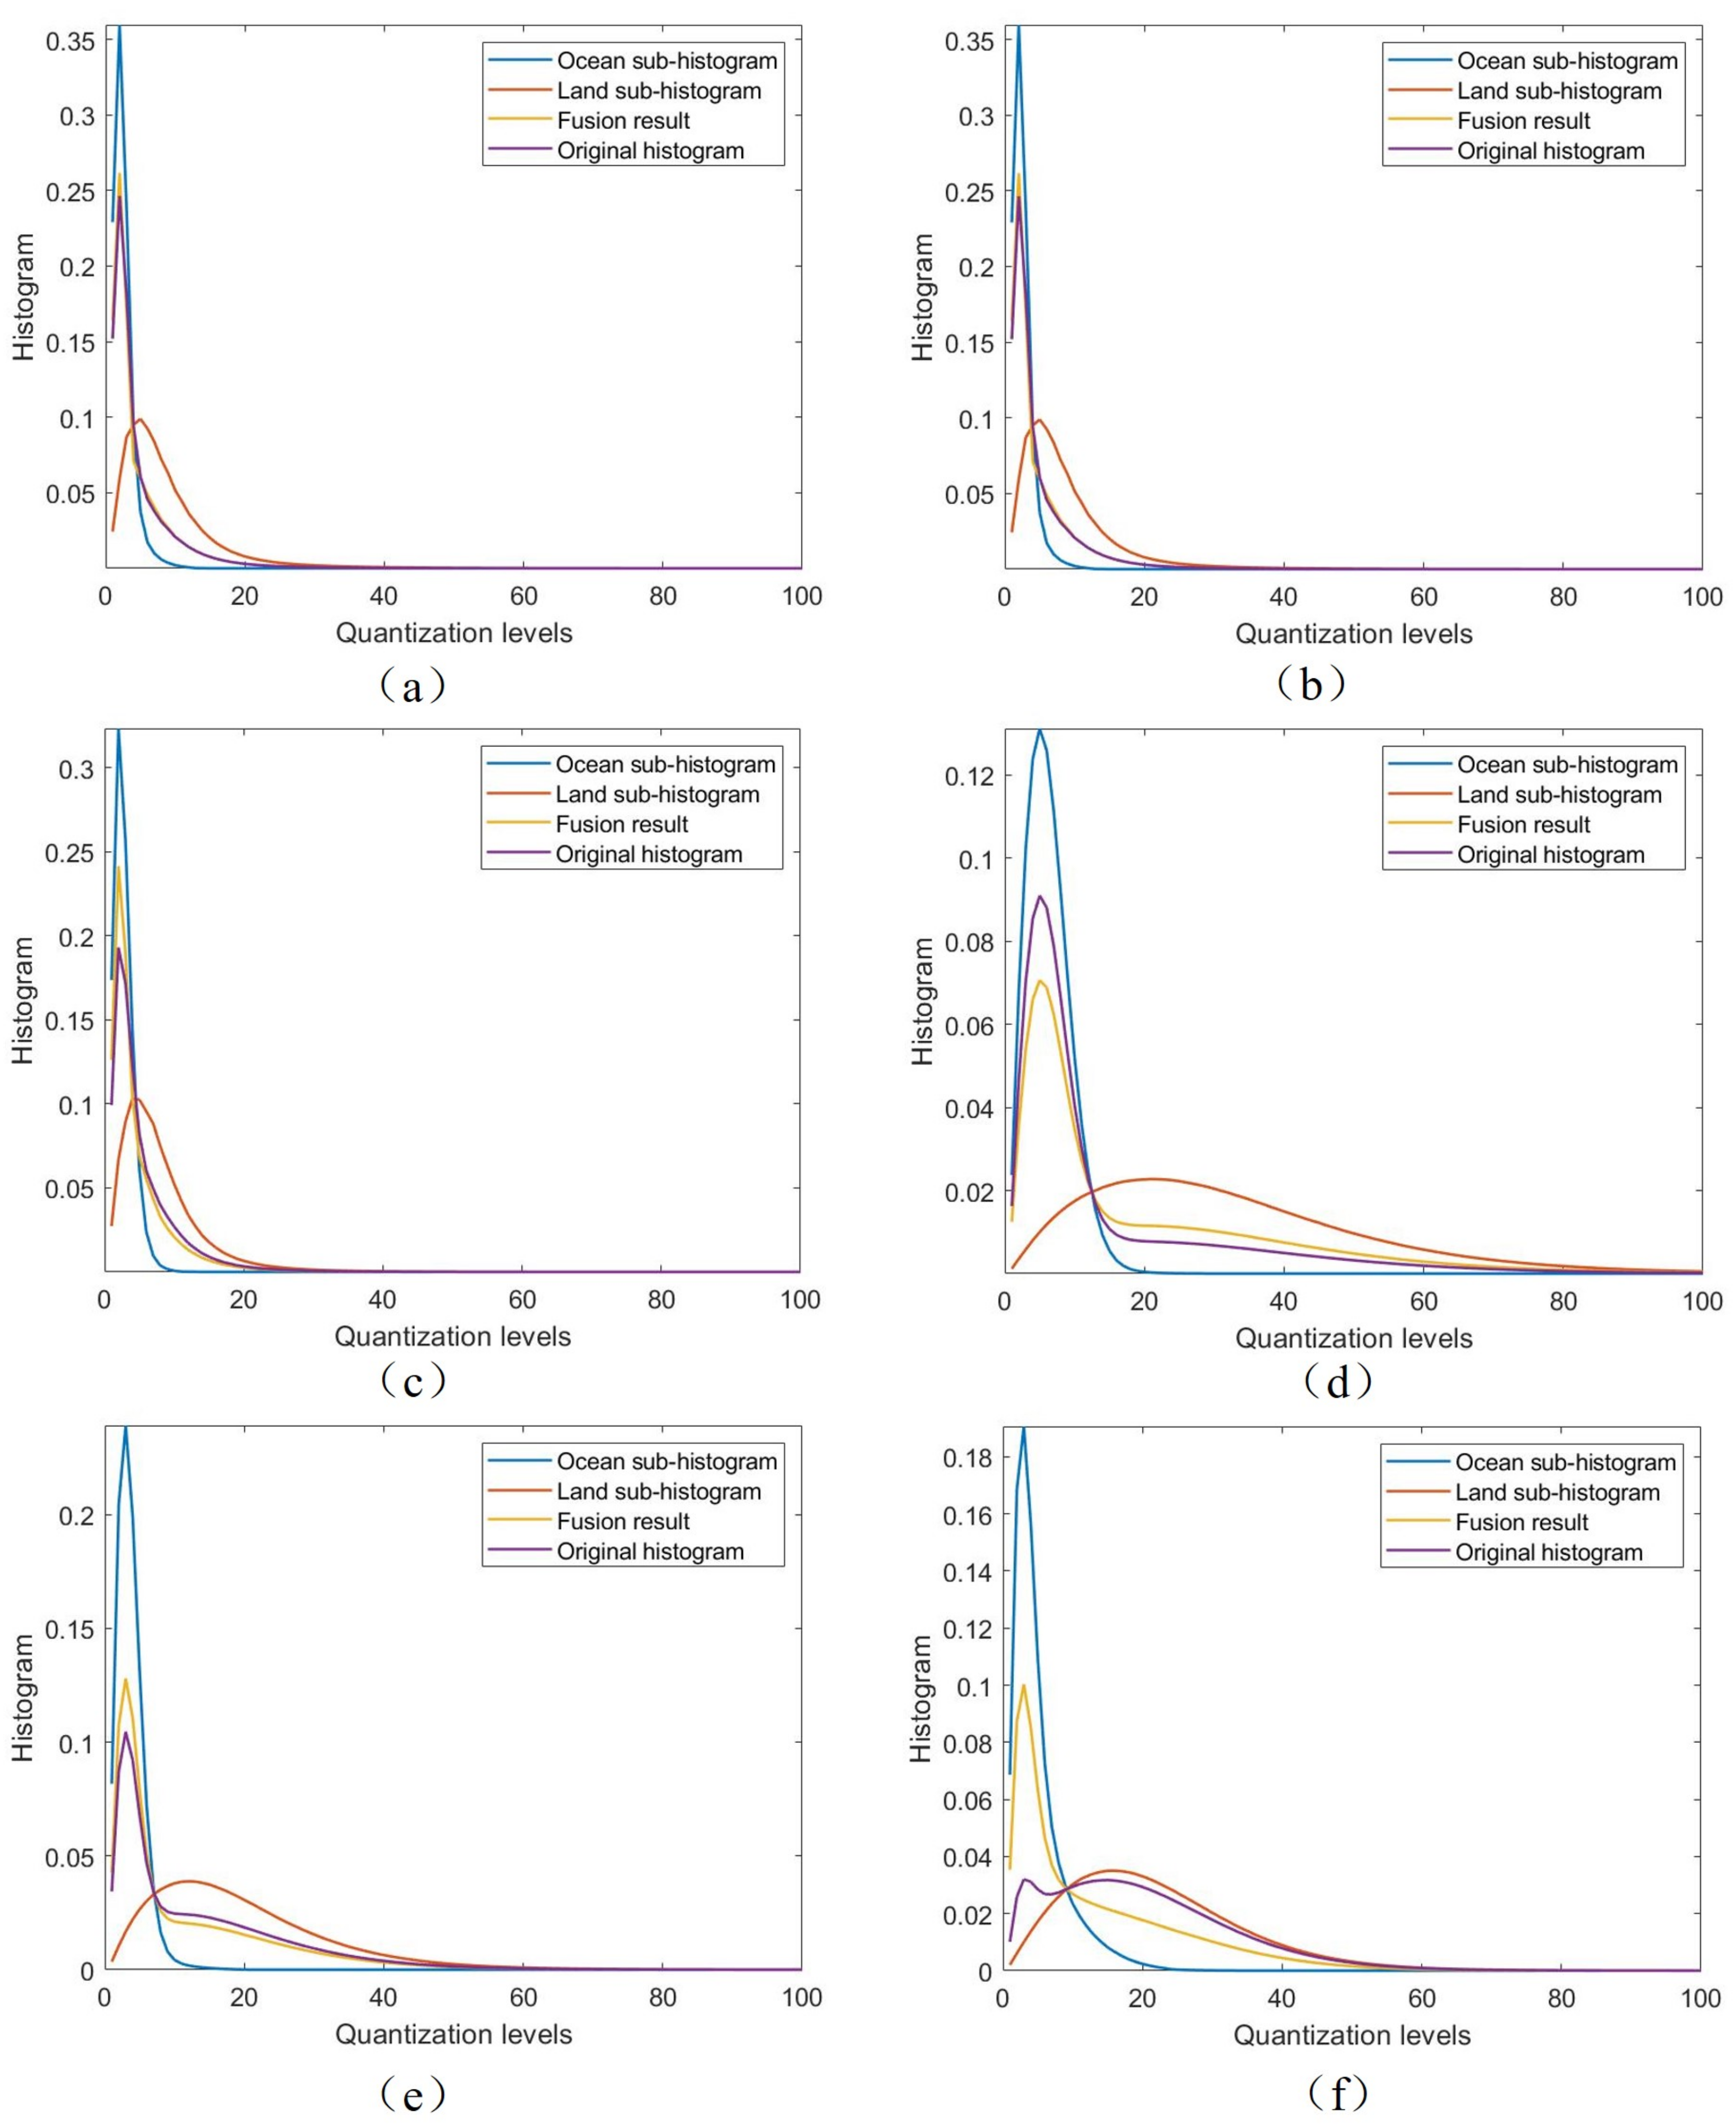
3.2.2. Histogram Fine-Tuning Algorithm
The core idea behind the histogram fine-tuning algorithm is to adjust the shape of the histogram to control the distribution of the quantizer’s intervals. Specifically, we select a sub-histogram as a template for adjustment and apply a fine-tuning algorithm to perform weighted fusion, resulting in a new histogram. The fine-tuned histogram is then used as the input to the nonlinear quantization algorithm, which enhances the local quantization performance of the image. Moreover, adjusting different template histograms can improve the quantization performance of specific local regions. The formula for histogram fusion is as follows:
where
represents the global histogram,
represents the sub-histogram of the weak scattering region, and
represents the sub-histogram of the strong scattering region.
w is the weight vector, and each quantization level corresponds to a weight in the vector.
To improve the quantization SNR in the weak scattering region, the sub-histogram of the weak scattering region is used as the template histogram, and the weight vector parameters are optimized, ensuring that the fused histogram closely approximates the template. A quantitative metric is necessary to measure the similarity between the two histograms. Cross-entropy, a common measure in information theory to describe the divergence between two probability distributions, is employed here. We use cross-entropy to quantify the difference between the fused histogram and the template sub-histogram. Cross-entropy intuitively reflects the degree of information loss. Moreover, it imposes a noticeable penalty on the weights during computation, meaning that when the fused histogram distribution deviates significantly from the sub-histogram distribution, it contributes more to the loss. By minimizing the cross-entropy function, we can derive the optimized weight vector. The form of the cross-entropy function is as follows:
where
N represents the number of quantization levels corresponding to the histogram. A constraint is applied to the weight w, ensuring it remains within the range (0,1). Without such constraints, the optimization algorithm would directly adjust the fused histogram to take the shape of the template sub-histogram. We introduce the sigmoid function to enforce this range constraint to adjust the weight w. The form of the sigmoid function is as follows:
where
w serves as the true optimization variable, allowing it to take any real number. During the subsequent optimization process, no further constraints need to be applied
w. The range constraint of (0,1) is applied to
to ensure that the fused histogram does not overfit. The new form of the optimization problem is as follows:
By applying the sigmoid function to replace the range constraint on
w, the constrained optimization problem (
10) is transformed into an unconstrained optimization problem (
12). We solve this optimization problem using the gradient descent algorithm. The iteration formula of the algorithm is as follows:
where
,
. The gradient calculation only requires the sub-histograms of the strong scattering and weak scattering regions. During the optimization process, the shape of the fused histogram gradually aligns with the template sub-histogram. However, due to the constraint imposed by the sigmoid function, the optimization result of the fused histogram will not overfit the template sub-histogram.
3.3. SNR Enhanced Nonlinear Quantization Method
In
Section 2.1, it was mentioned that each quantization unit of an optimal quantizer should contribute roughly equally to the total average distortion. This conclusion is primarily based on minimizing the global quantization distortion to achieve the optimal overall SNR. However, weak scattering targets often exhibit much lower scattering intensity in practical applications. For the same level of quantization distortion, the SNR in weak scattering regions is typically much lower than in strong scattering regions. We aim to enhance the local SNR while keeping the overall quantization distortion relatively low. To address this, we propose an SNR-enhanced nonlinear quantization method. This method introduces SNR constraints for each quantization unit into the distortion model discussed in
Section 2.1, ensuring that the quantization SNR across all quantization units is more balanced. The SNR is used to measure the distortion between the original intensity and the quantized intensity in different quantization units:
where
represents the set of pixel points belonging to the k-th quantization cell, denotes the pixel values of the original image and indicates the pixel values of the reconstructed image. In the optimization problem modeling presented in Equation (
3), the original optimization objective focused solely on uniformly distributing the total average distortion across different quantization units without considering the quantization SNR of each cell. To address this issue, the objective function of the optimization problem needs to incorporate a new SNR constraint, which can be expressed as follows:
In this formulation, the optimization objective function’s first term represents the quantization’s global distortion. Retaining this term ensures that the global quantization performance is considered during optimization. The second term is the sum of the quantization SNRs for the N quantization cells. Incorporating this term into the optimization objective aims to achieve a consistent quantization SNR across each quantization unit. This approach aims to enhance the SNR in weak scattering regions while simultaneously suppressing the SNR in strong scattering regions.
However, the expression in Equation (
17) presents some challenges in practical applications. Due to the HDR of SAR images, the magnitude order of the second part, which represents the SNR objective function, does not align with that of the first part, which represents the distortion objective function. This mismatch can lead to instability in the optimization results. Consequently, the optimal solution might heavily favor either minimizing the global distortion or maximizing the sum of the SNRs, both undesirable outcomes. To avoid this potential overfitting issue, we introduce a power normalization factor to the second term of Equation (
17), transforming it into:
where
d represents the total power of the original image. By normalizing the power coefficient, the optimization problem of the objective function will no longer experience overfitting. To solve the expression in Equation (
18), we can utilize the first-order Karush-Kuhn-Tucker optimality conditions, resulting in the solution taking the following form:
5. Discussion
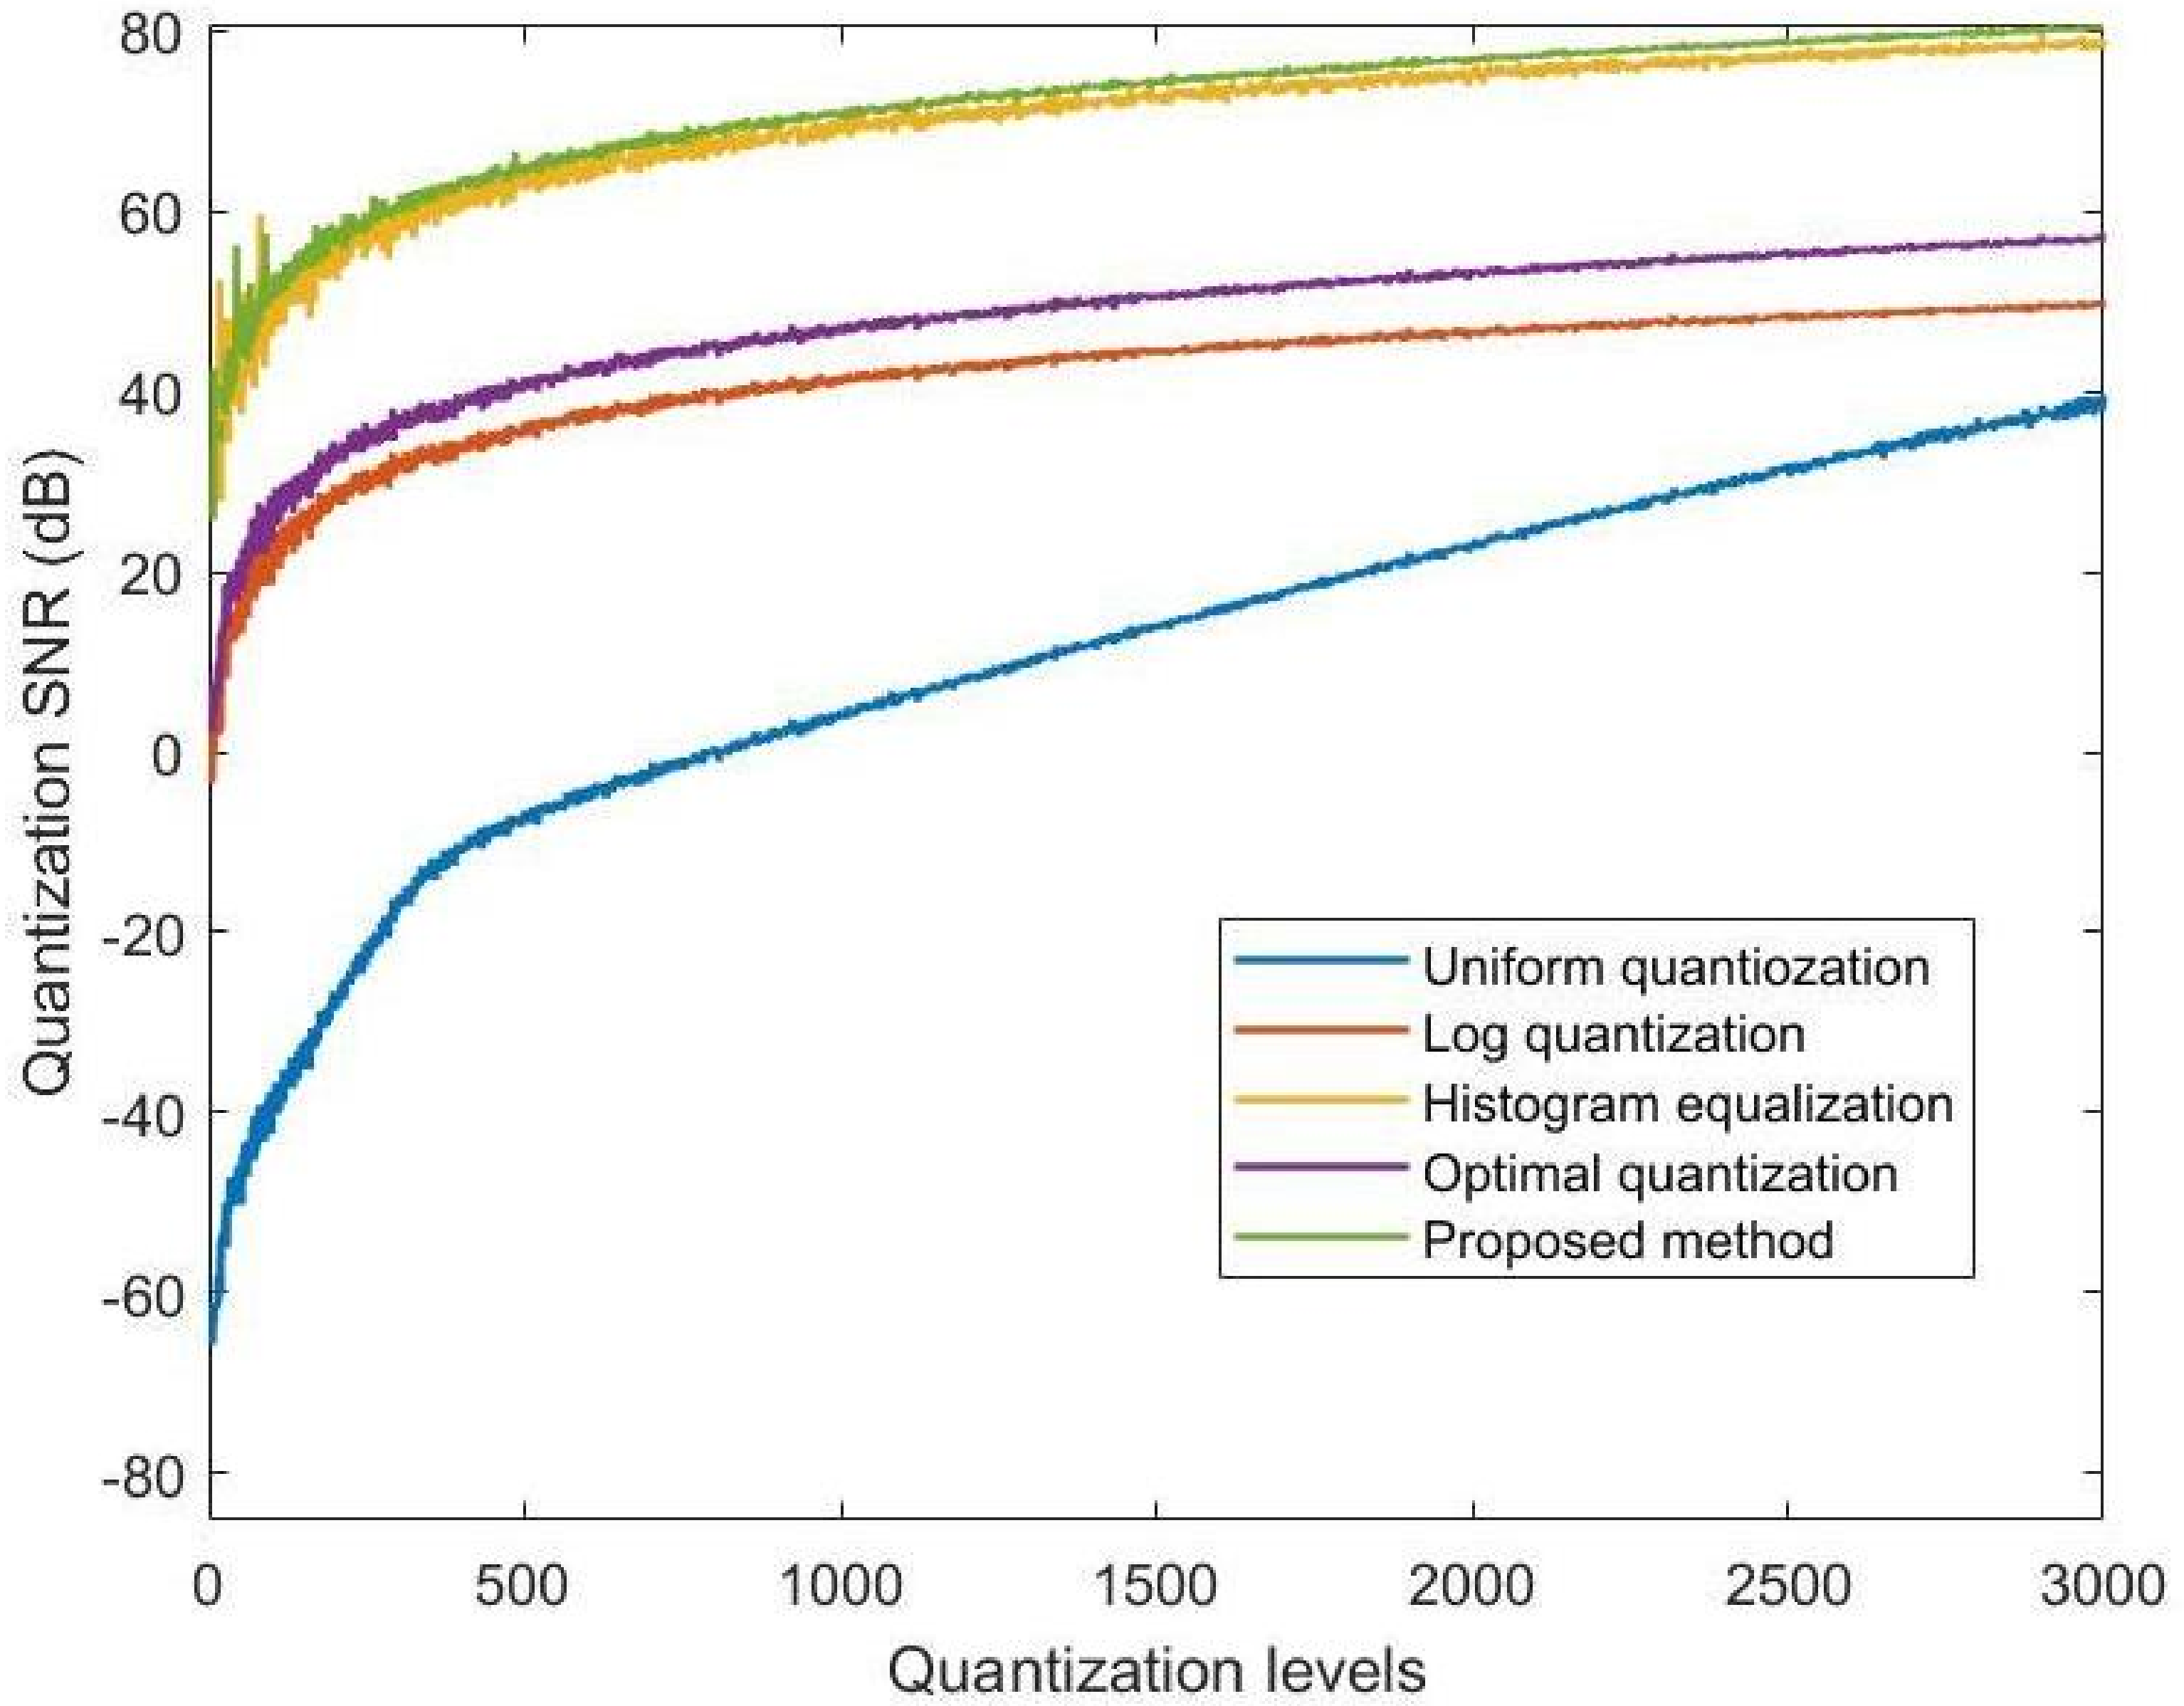
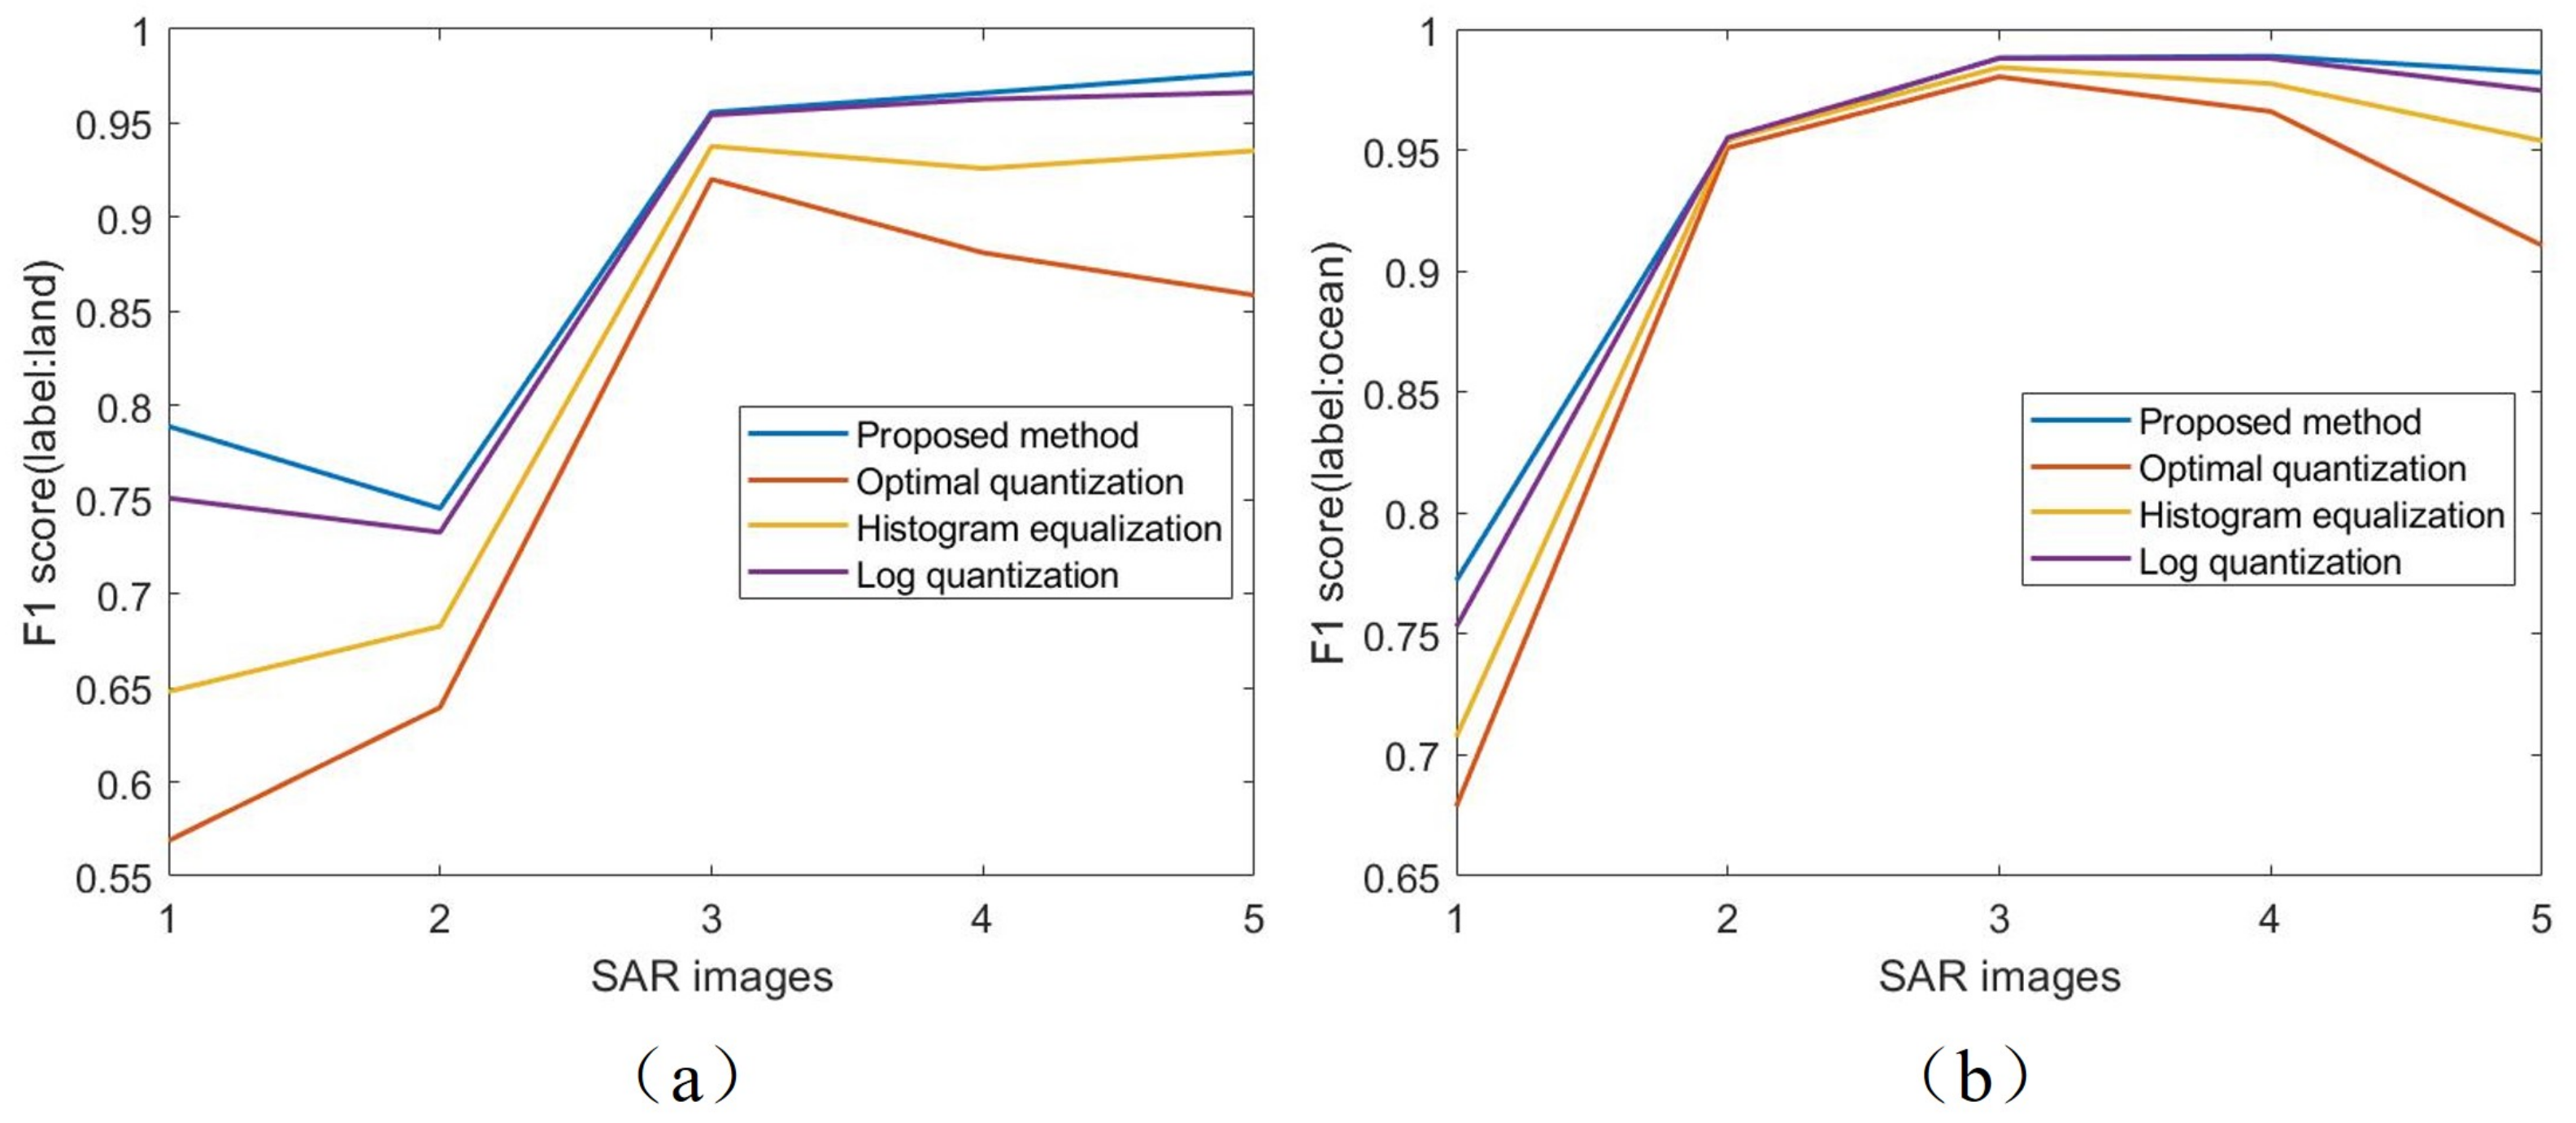
This paper proposes a nonlinear quantization method for SAR images based on SNR enhancement and segmentation guidance validated through experiments on GF-3 image data. The main innovations of this work include optimizing the objective function of the quantization distortion model to improve the quantization SNR at low quantization levels, achieve better SNR allocation compared to optimal quantization, and minimize global quantization loss. Additionally, a segmentation-guided quantization model is introduced, which directs the quantizer to allocate quantization performance across different regions, enhancing the quantization of weak scattering regions.
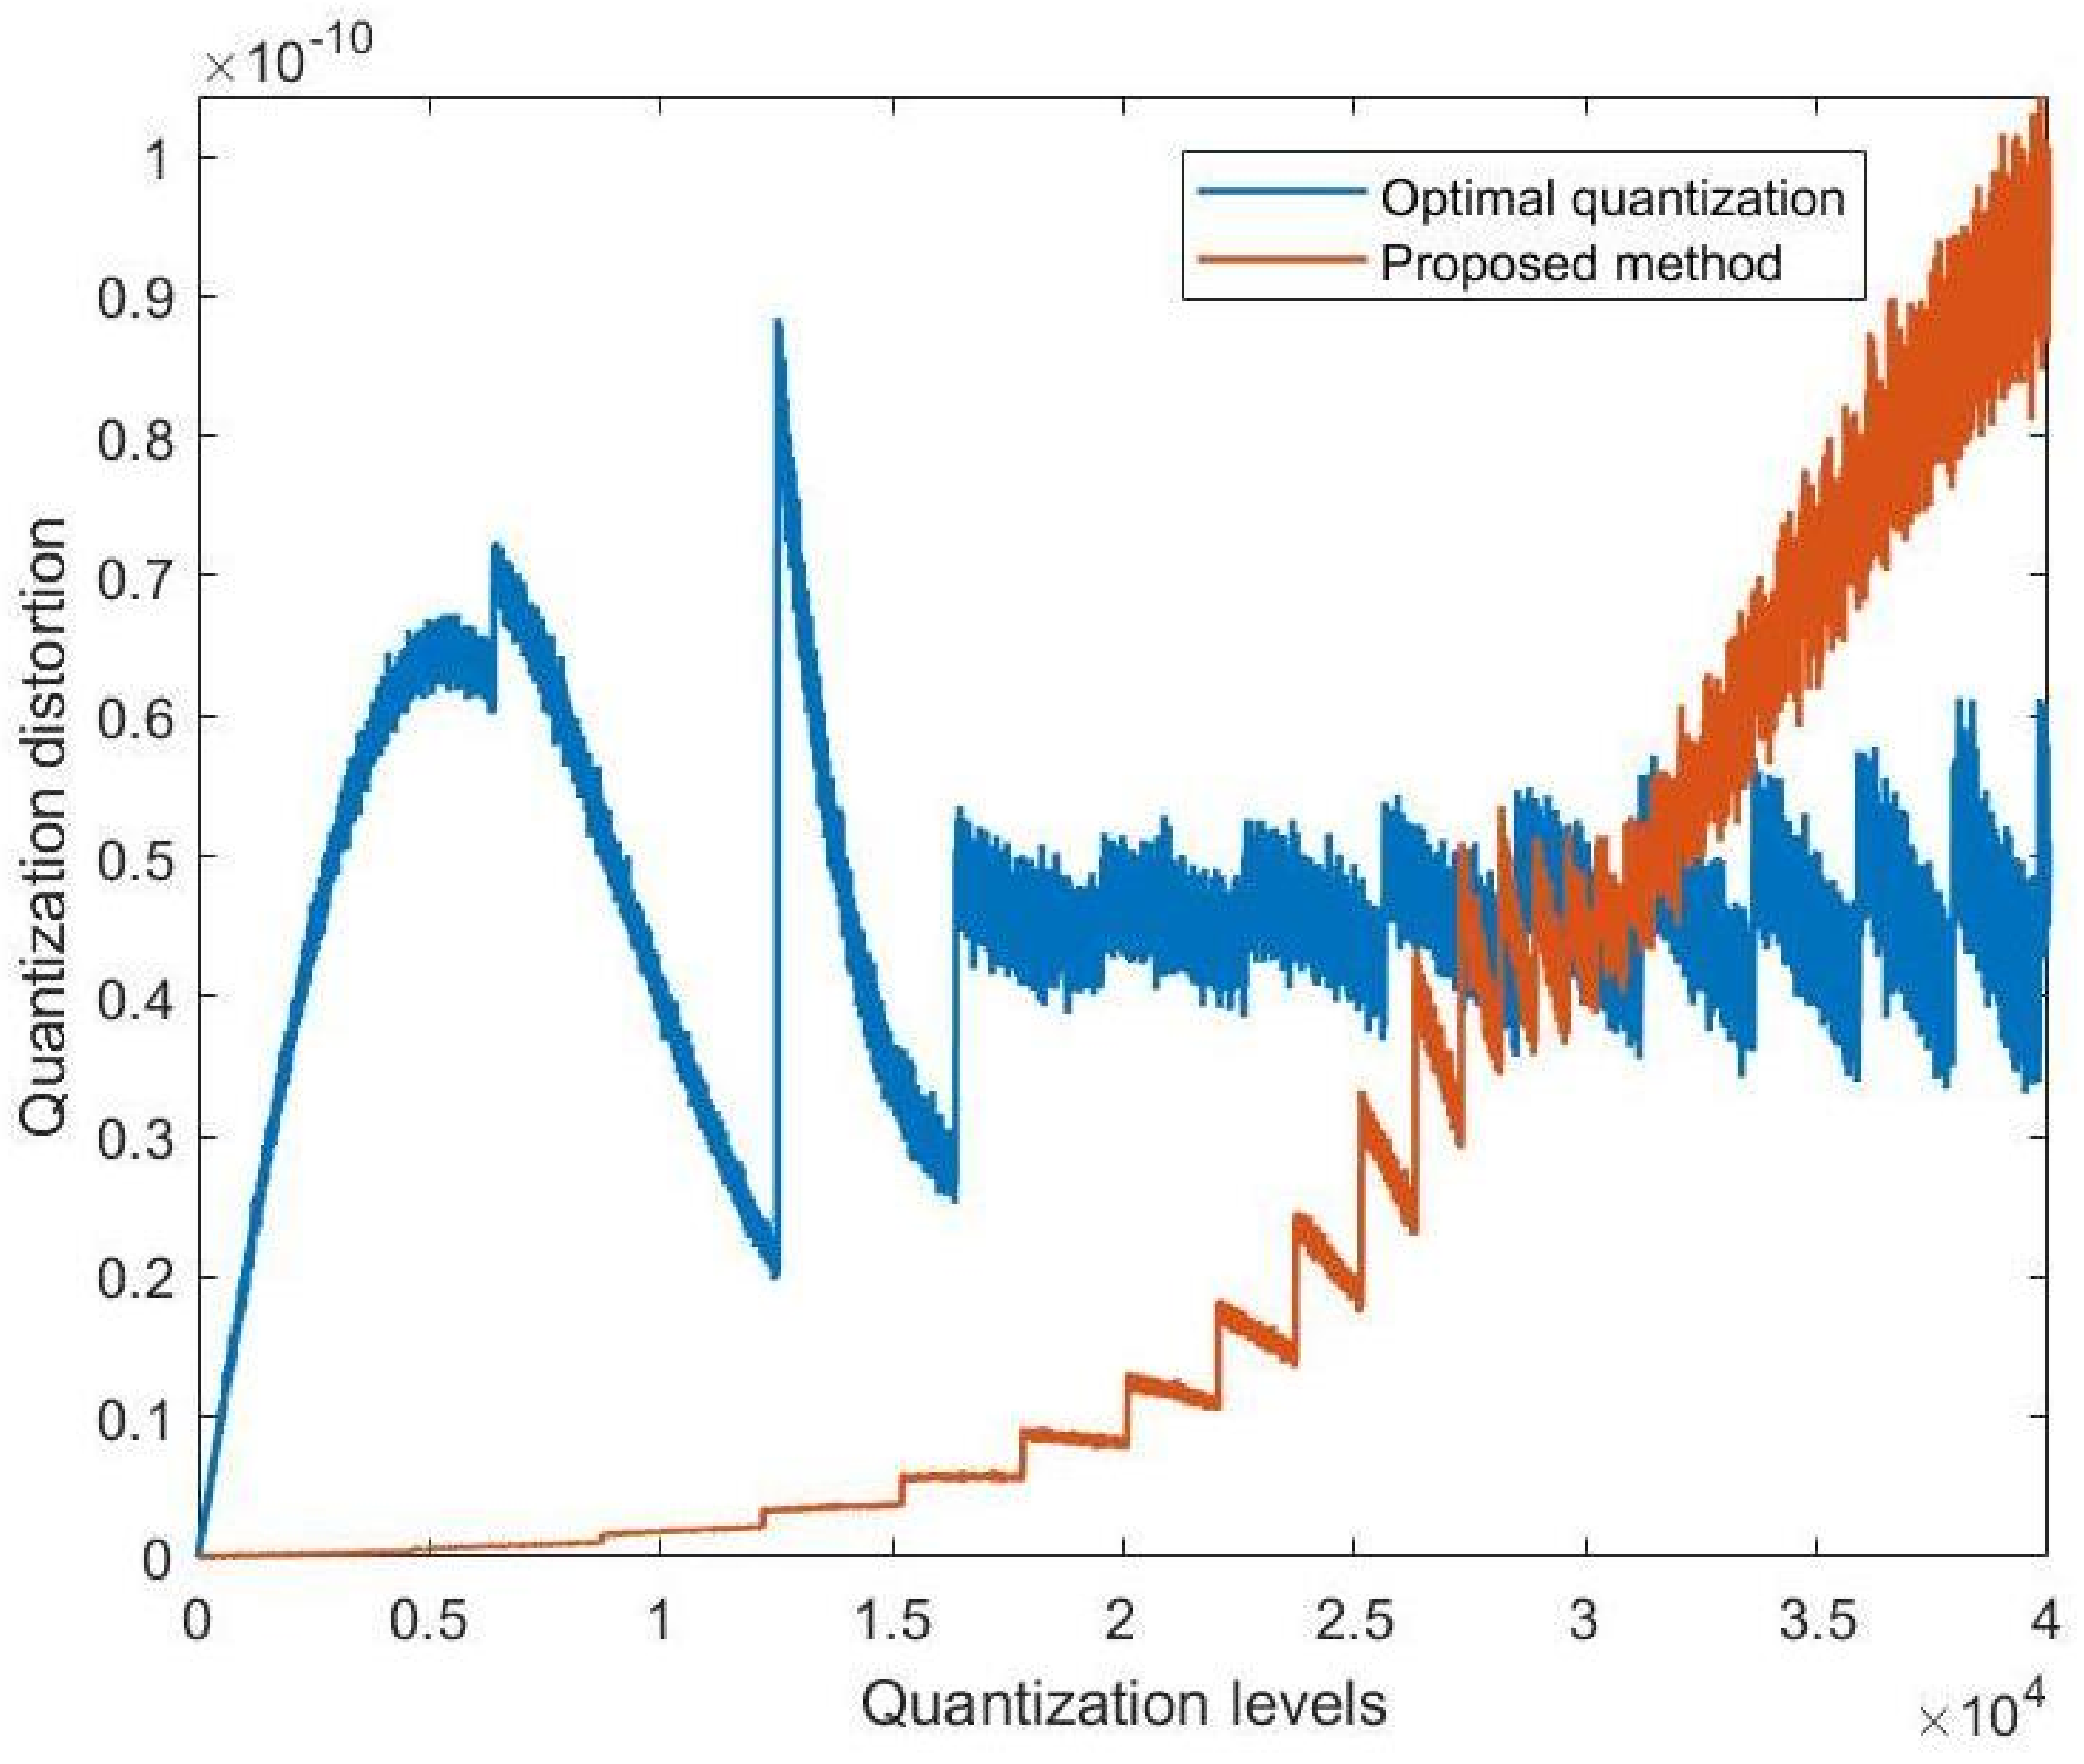
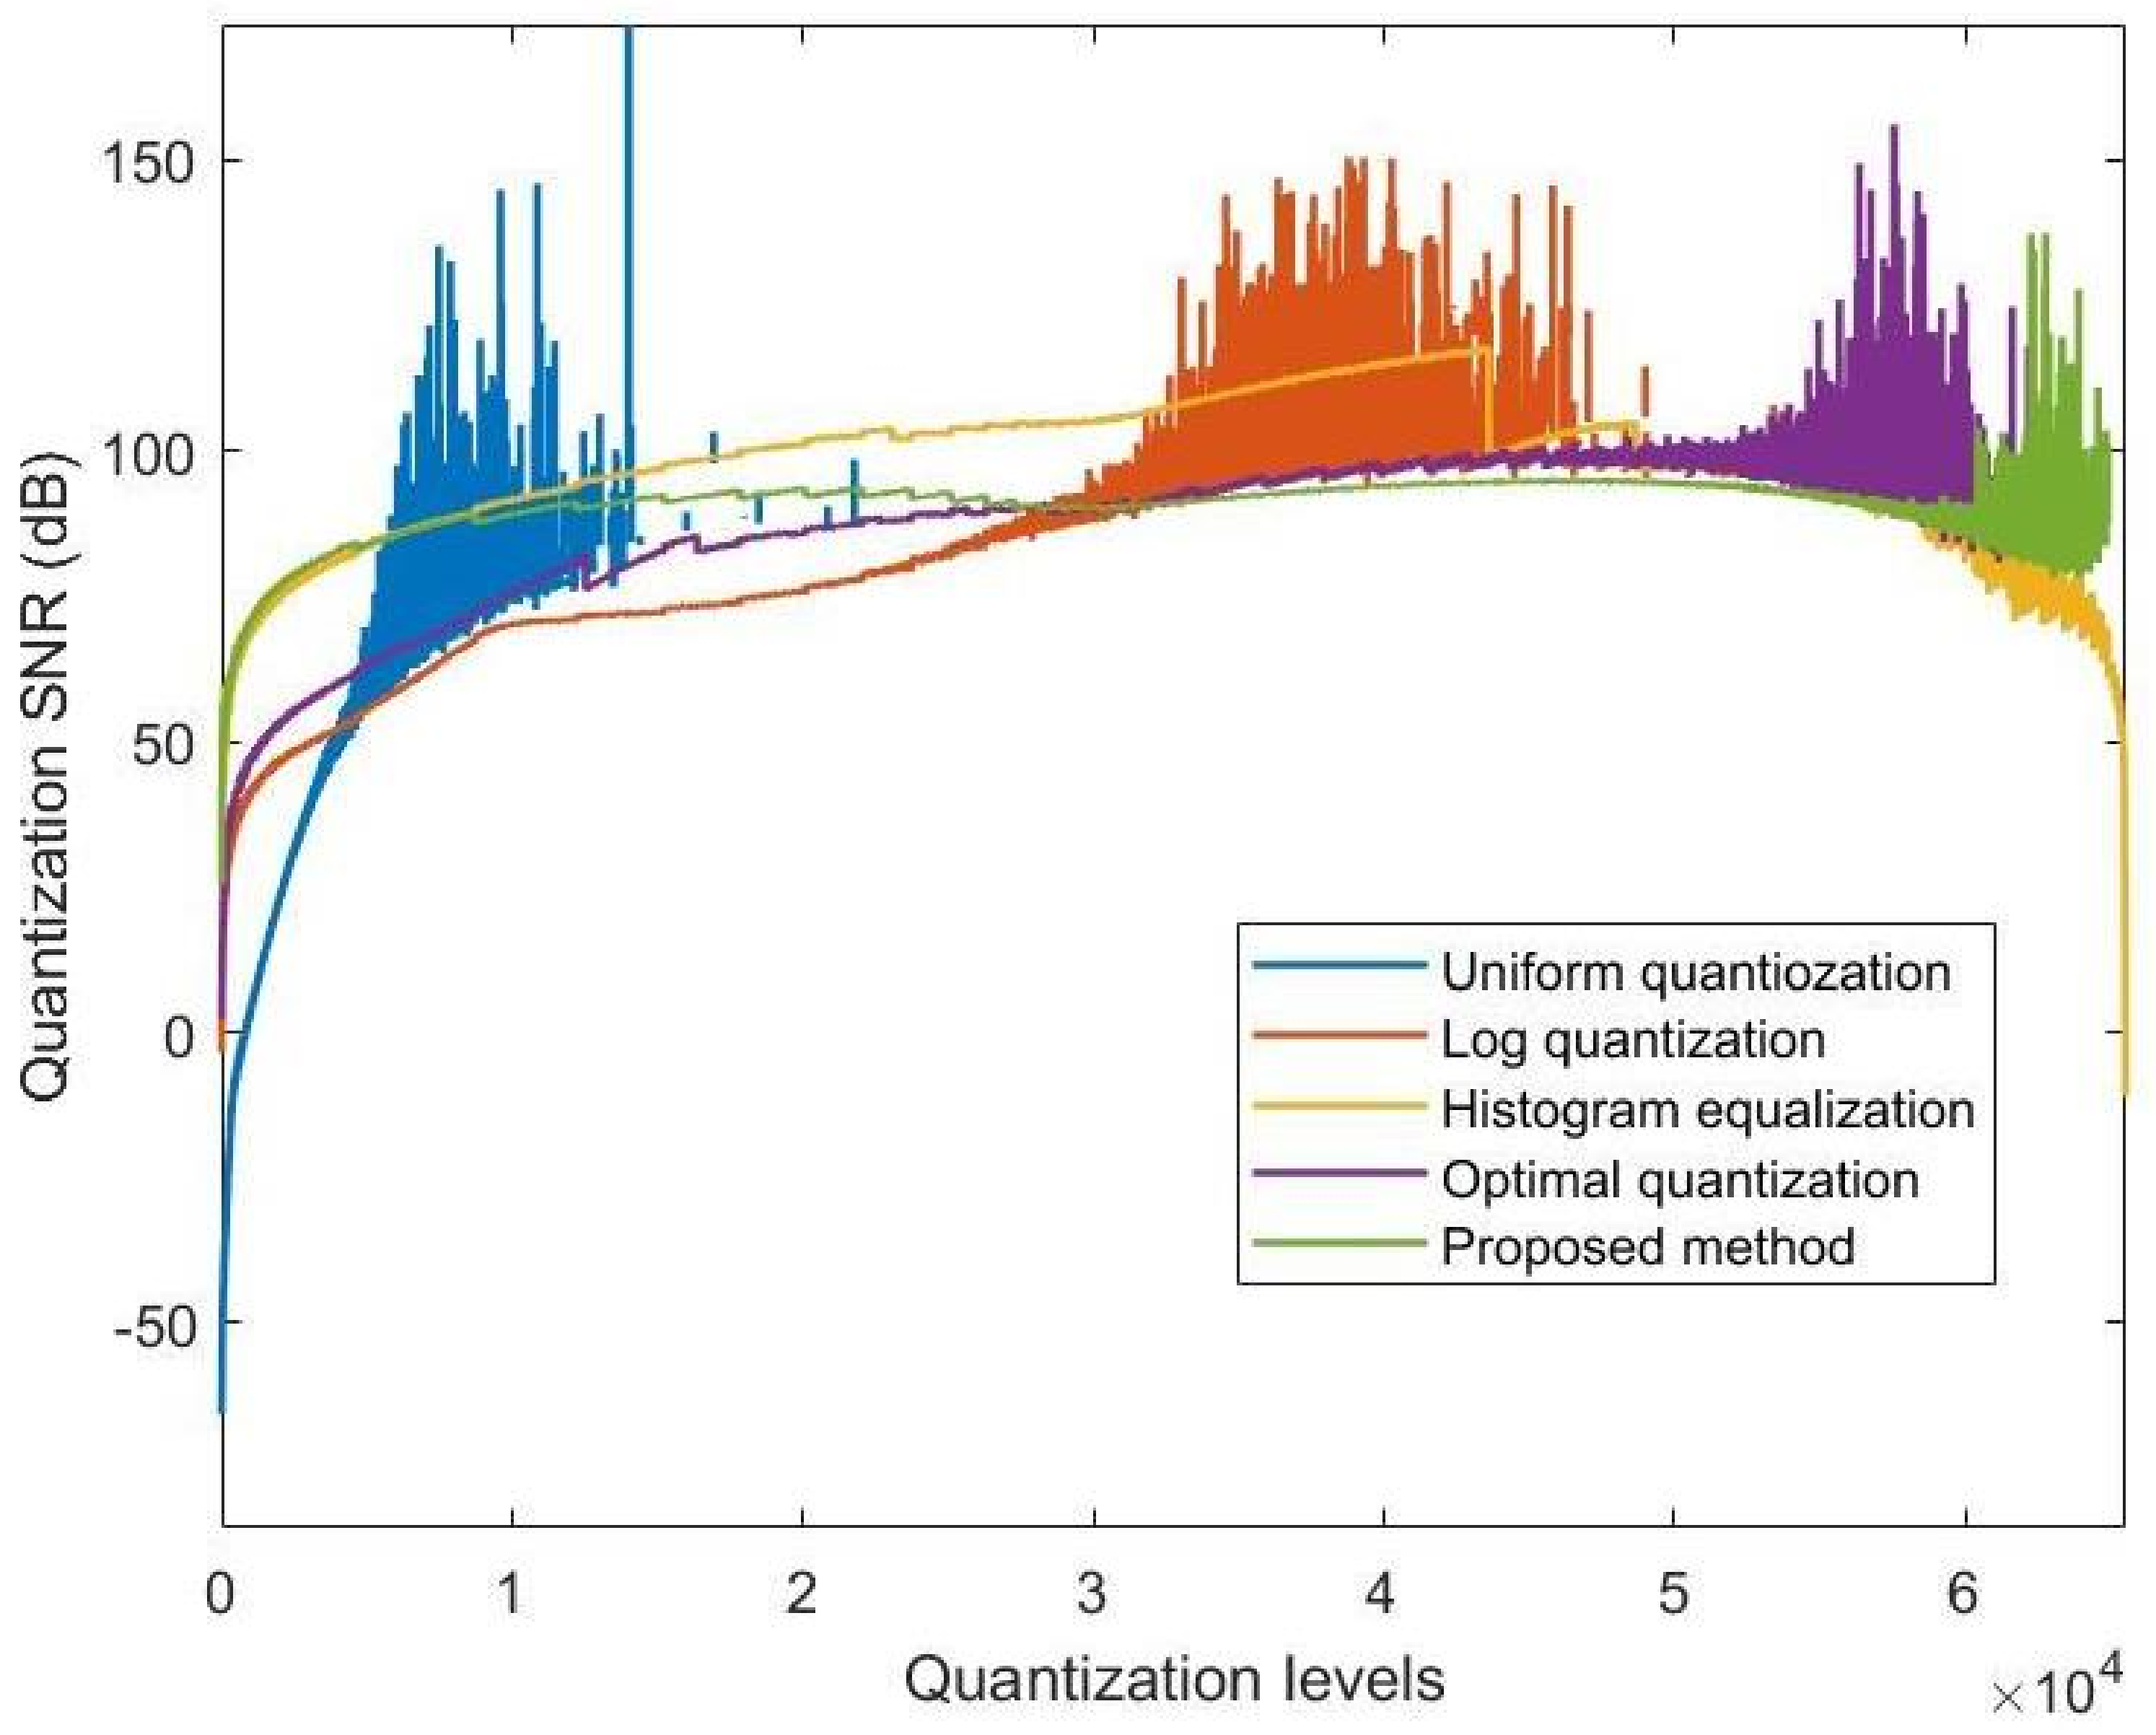
In the optimization of the quantization distortion model, it is essential to balance the global and local Q–SNR. The research results show that the improved objective function can effectively enhance local quantization performance. By comparing the global Q–SNR and local Q–SNR, it becomes evident that enhancing the local quantization SNR inevitably leads to a reduction in the global quantization SNR. Due to the 16-bit quantization limitation, which restricts the number of quantization levels, the quantizer allocates more levels to weak scatterers during optimization. This, in turn, reduces the number of quantization levels for strong scatterers. As a result, the quantization distortion for strong scatterers increases while the distortion for weak scatterers decreases. The balance of quantization distortion is disrupted, and more distortion is assigned to strong scatterers. Consequently, the total global quantization distortion increases, leading to a decrease in global Q–SNR. However, this effectively enhances the Q–SNR for weak scatterers, improving the visual quality of weak scatterer regions. Despite the slight degradation in global quantization SNR, the local quantization SNR is significantly improved.
Furthermore, while the method introduced in this paper directly incorporates an SNR-based optimization objective to constrain SNR allocation during quantization, it does not consider the correlation between the two types of objective functions. As a result, the achieved performance is not optimal. In future research, it is recommended that researchers focus more on the issue of quantization interval allocation to develop a more comprehensive and theoretically rigorous quantization distortion model. Moreover, regarding segmentation-guided nonlinear quantization, this paper primarily implements the fusion of segmentation results on the histogram. The goal of guided quantization is to adjust the distribution of the histogram through features other than the histogram itself, thereby influencing the quantization performance of the quantizer. It is hoped that future researchers will propose more referable guided quantization methods in the field of SAR nonlinear quantization.
6. Conclusions
This paper presents a nonlinear quantization algorithm for SAR images based on SNR enhancement and segmentation strategy guidance, building upon the optimal quantizer. We have improved the mapping function to address the impact of the HDR characteristics of SAR images on quantization performance. First, a sparse, strong scatter point extraction method is developed to prevent excessive dynamic range compression. Next, a histogram fine-tuning approach guided by segmentation strategies is introduced, enabling the design of nonlinear quantization methods tailored for different scenes. Finally, we effectively resolved the issue of uneven SNR distribution in the optimal quantizer by enhancing the objective function for optimization.
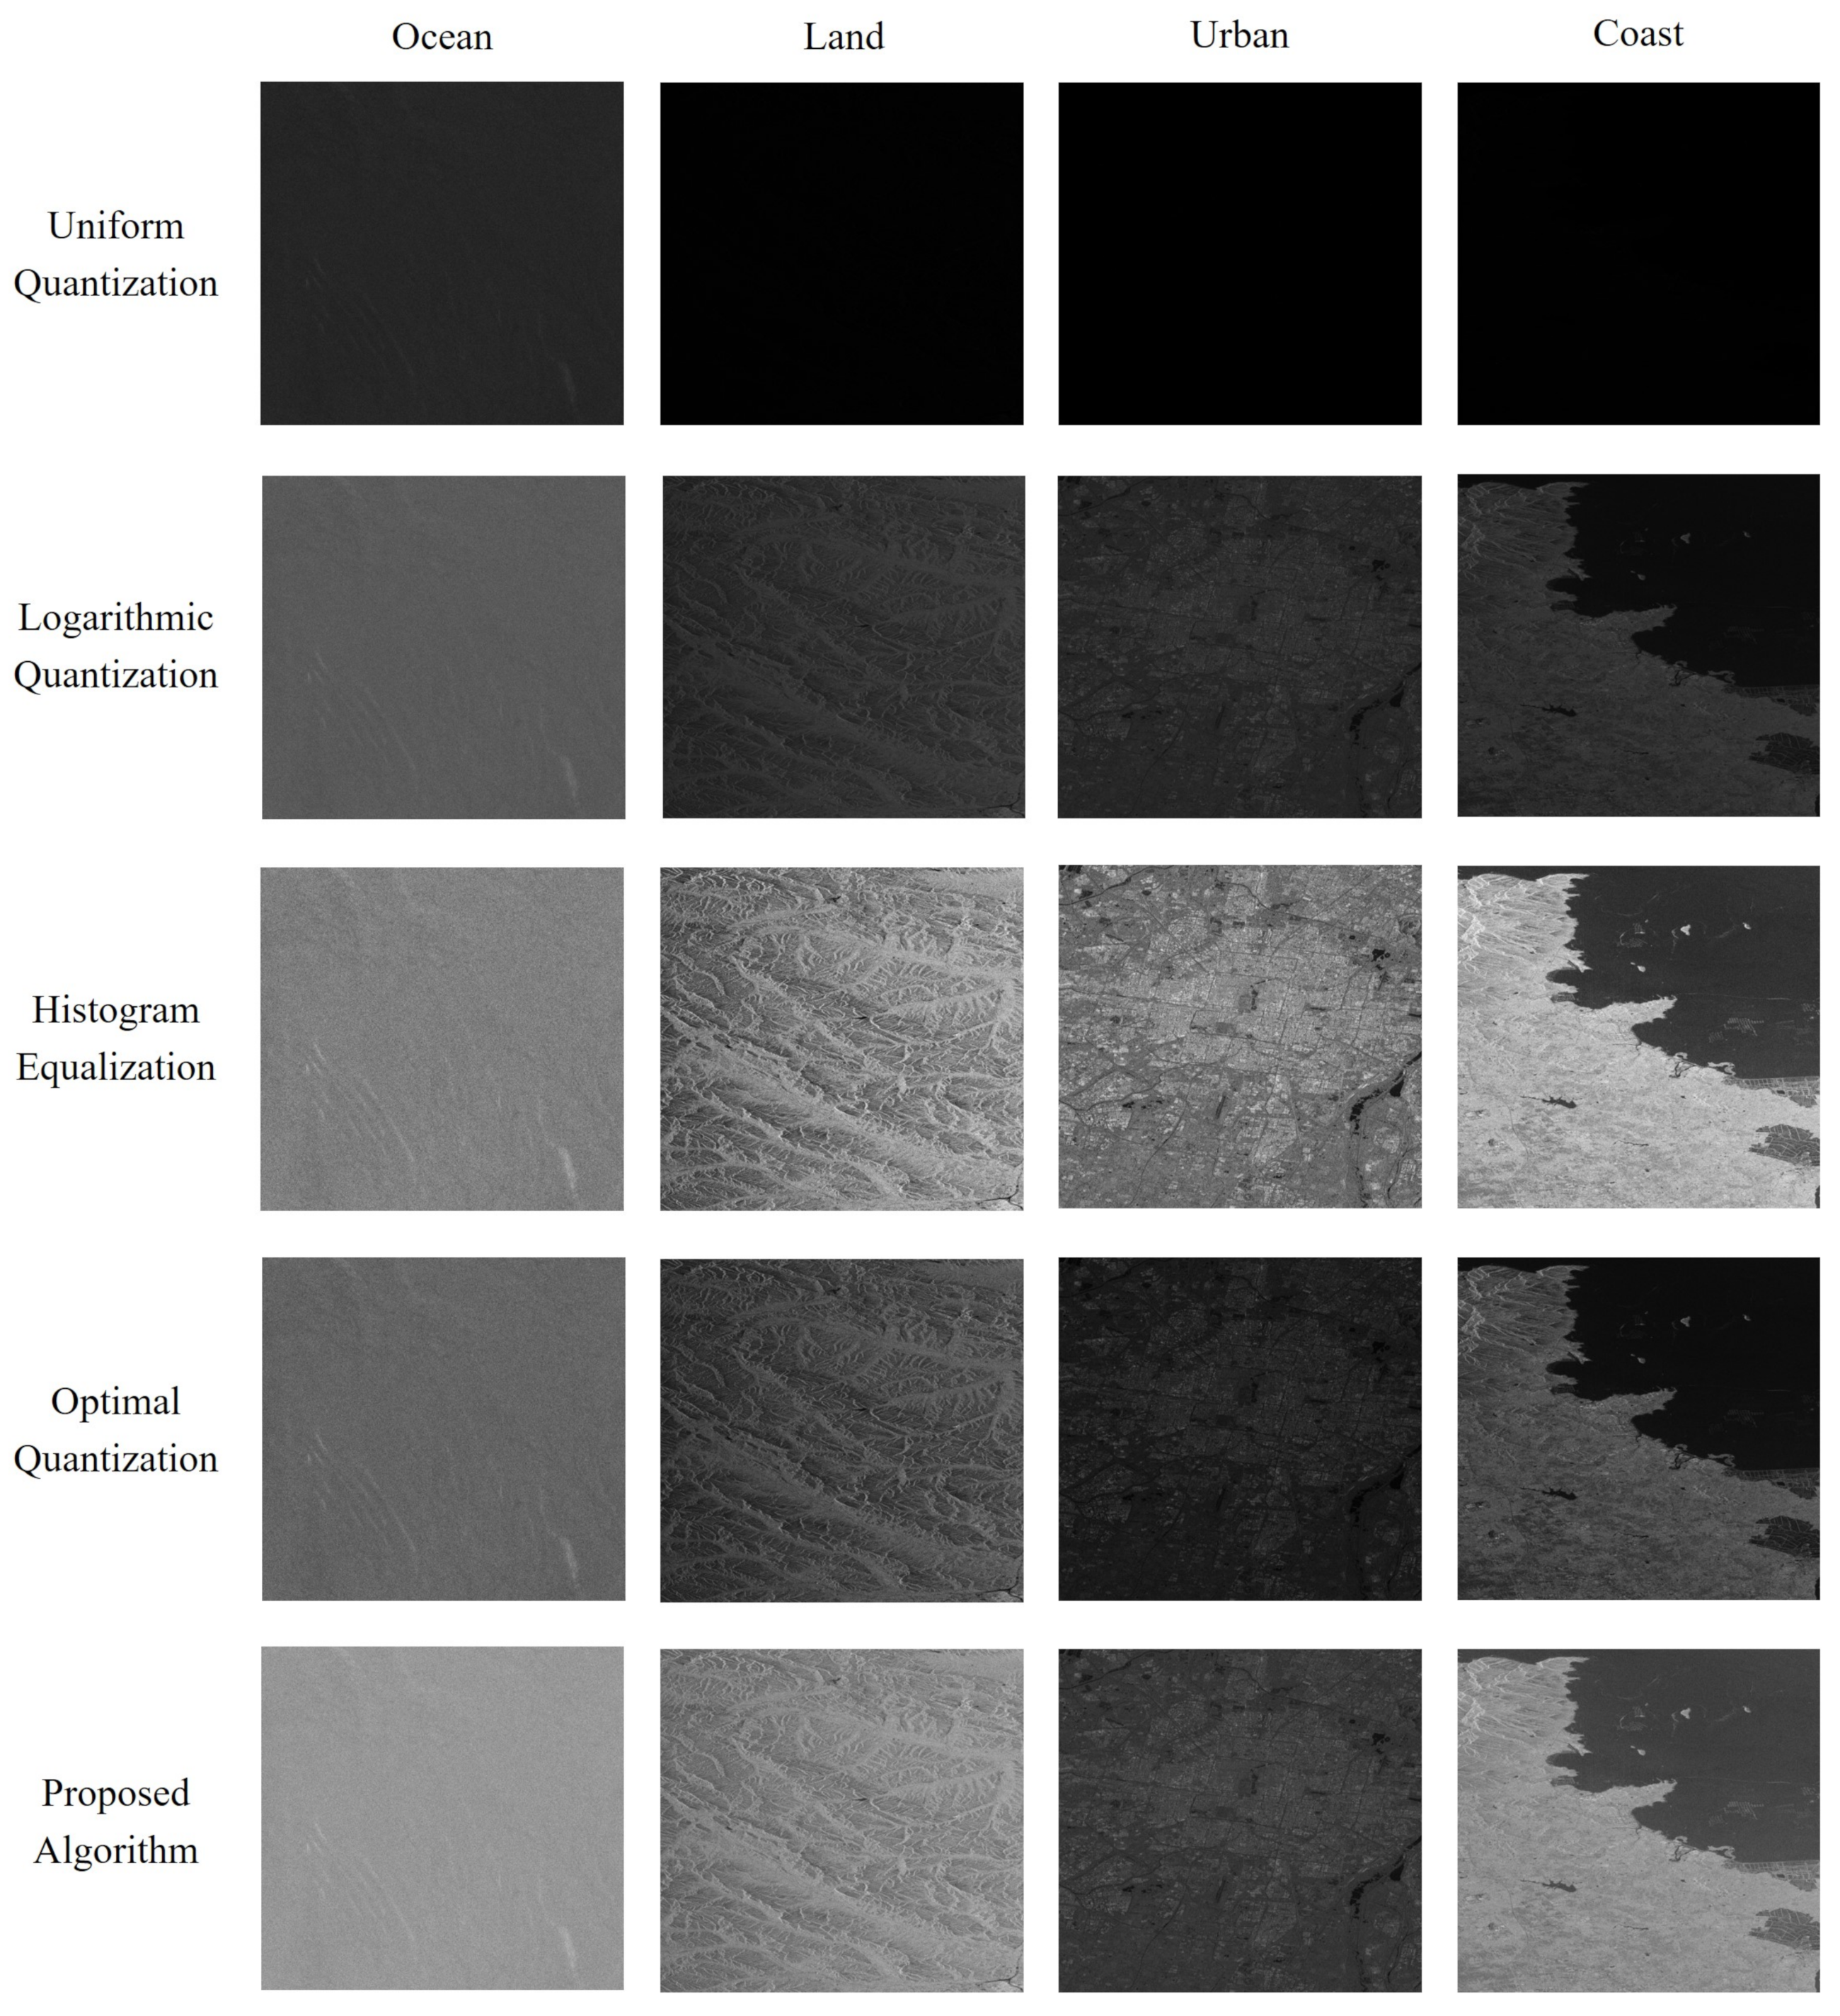
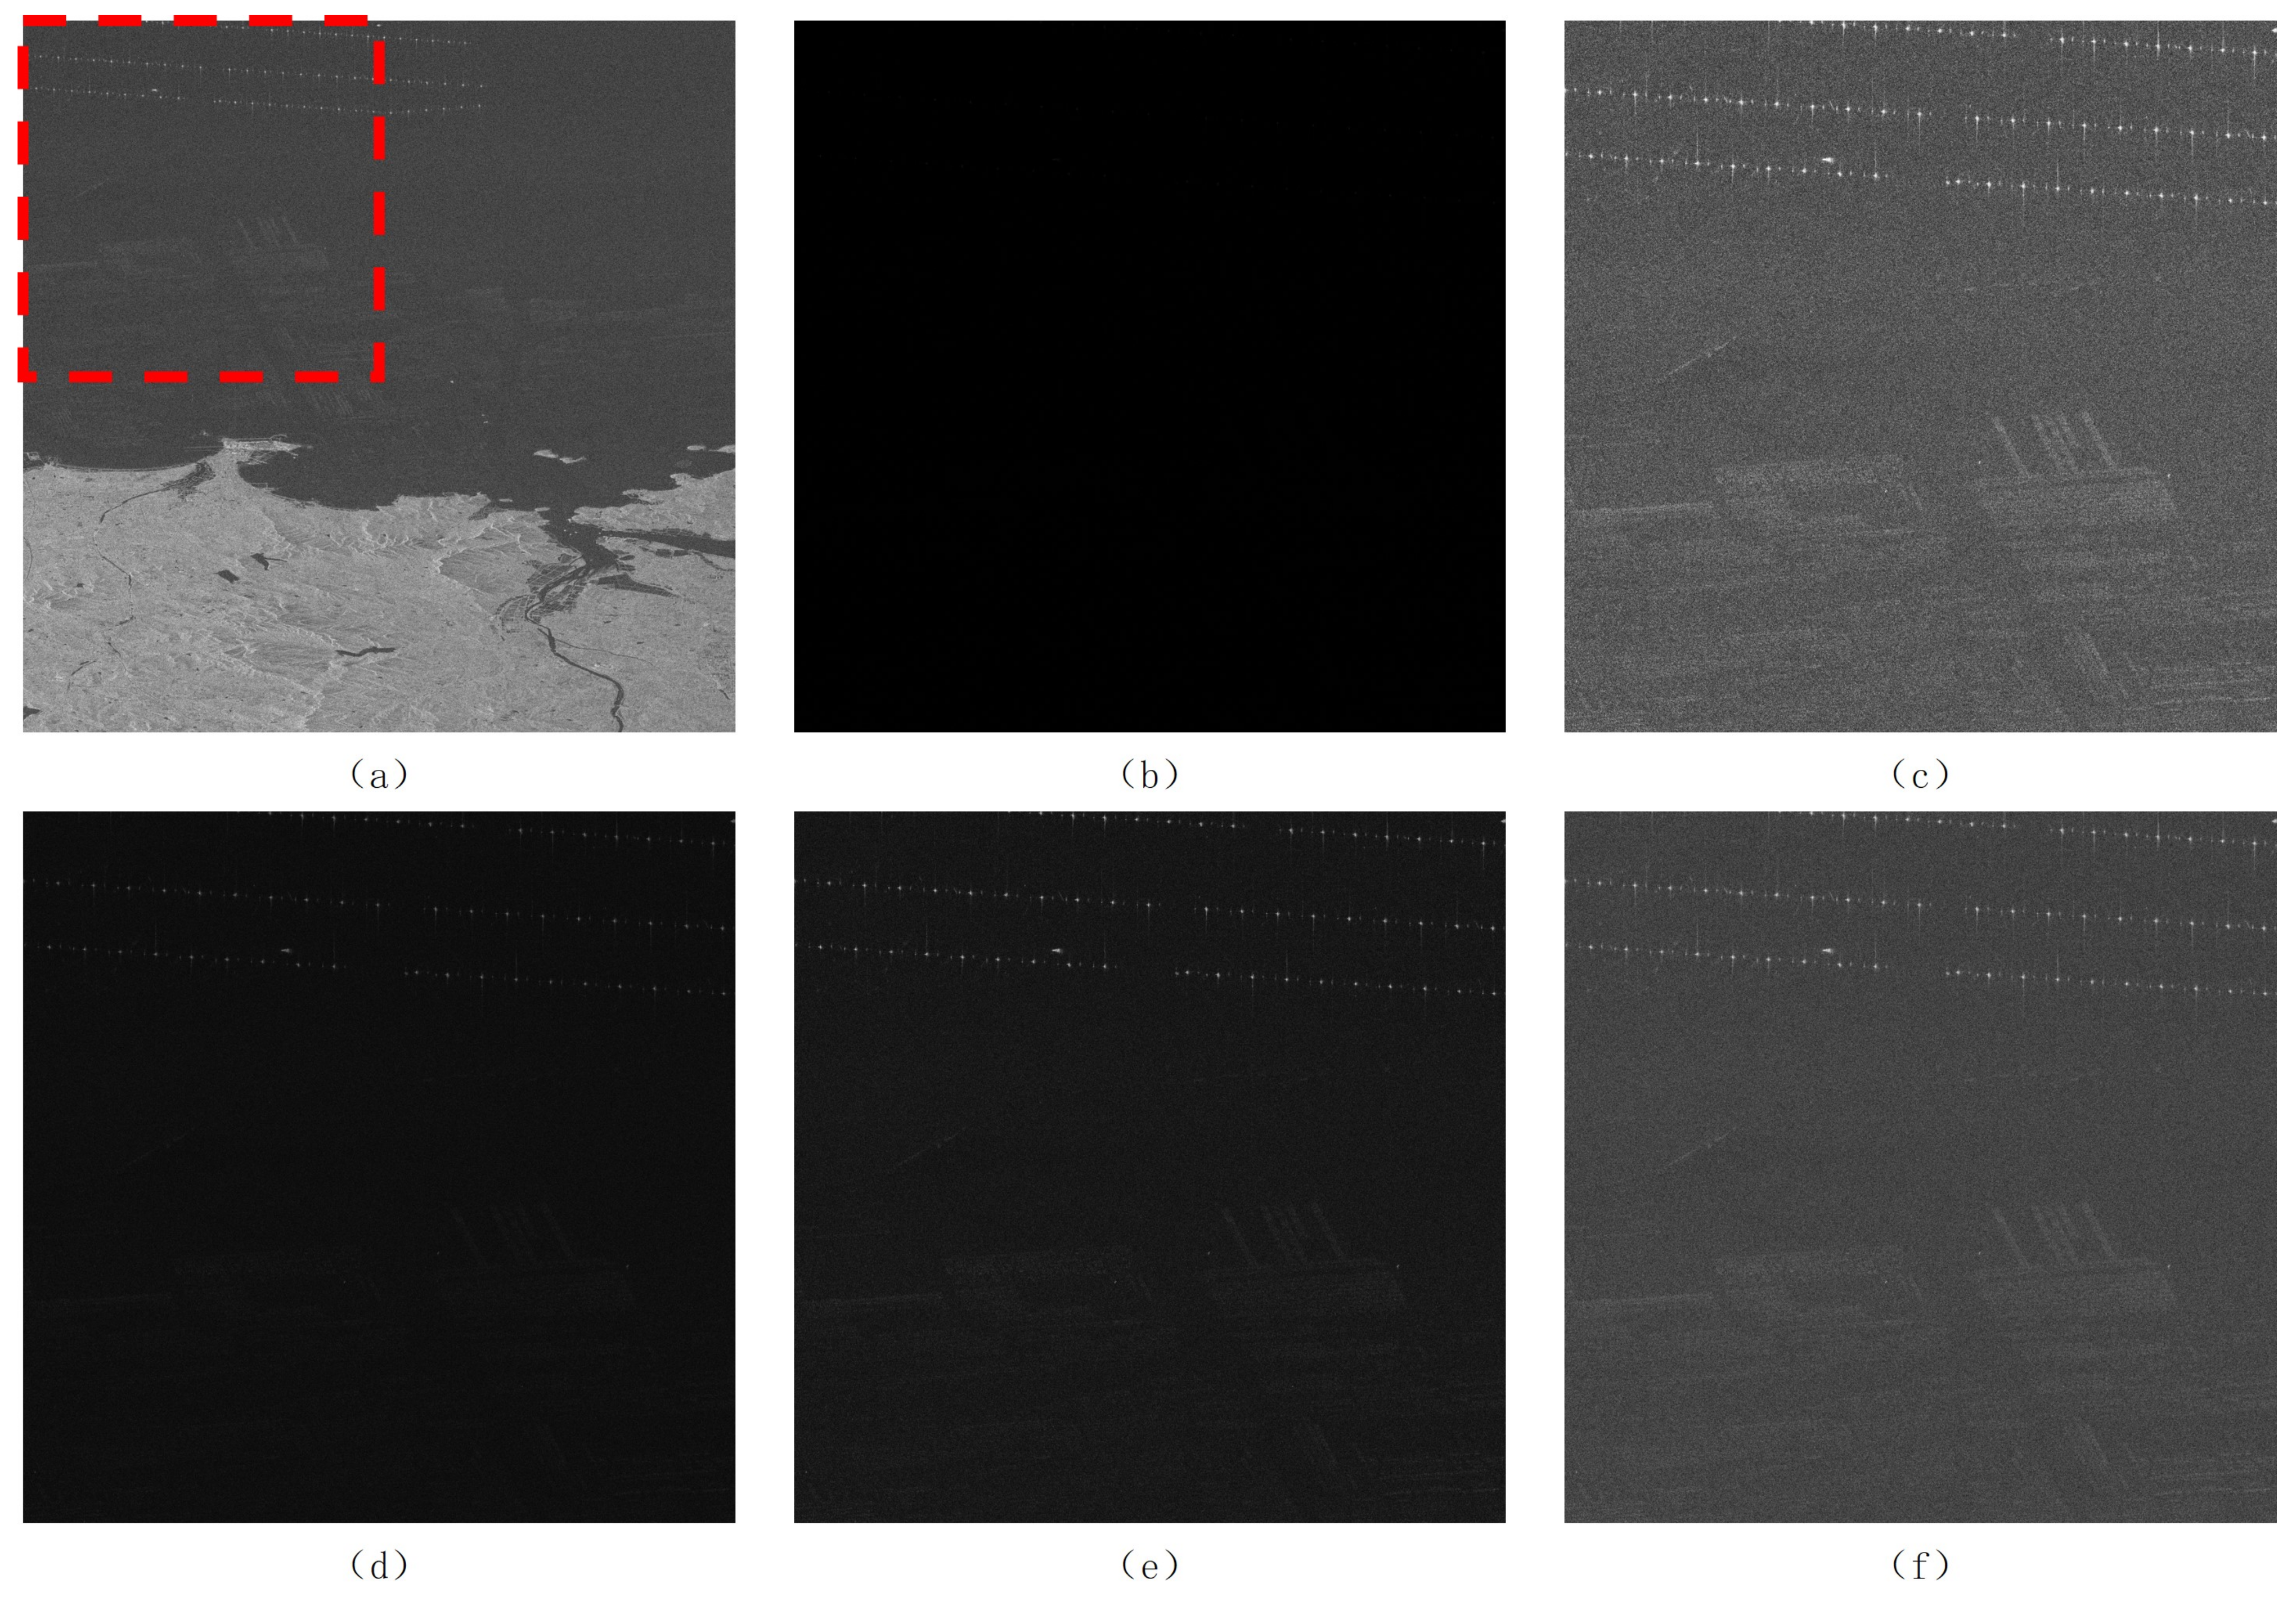
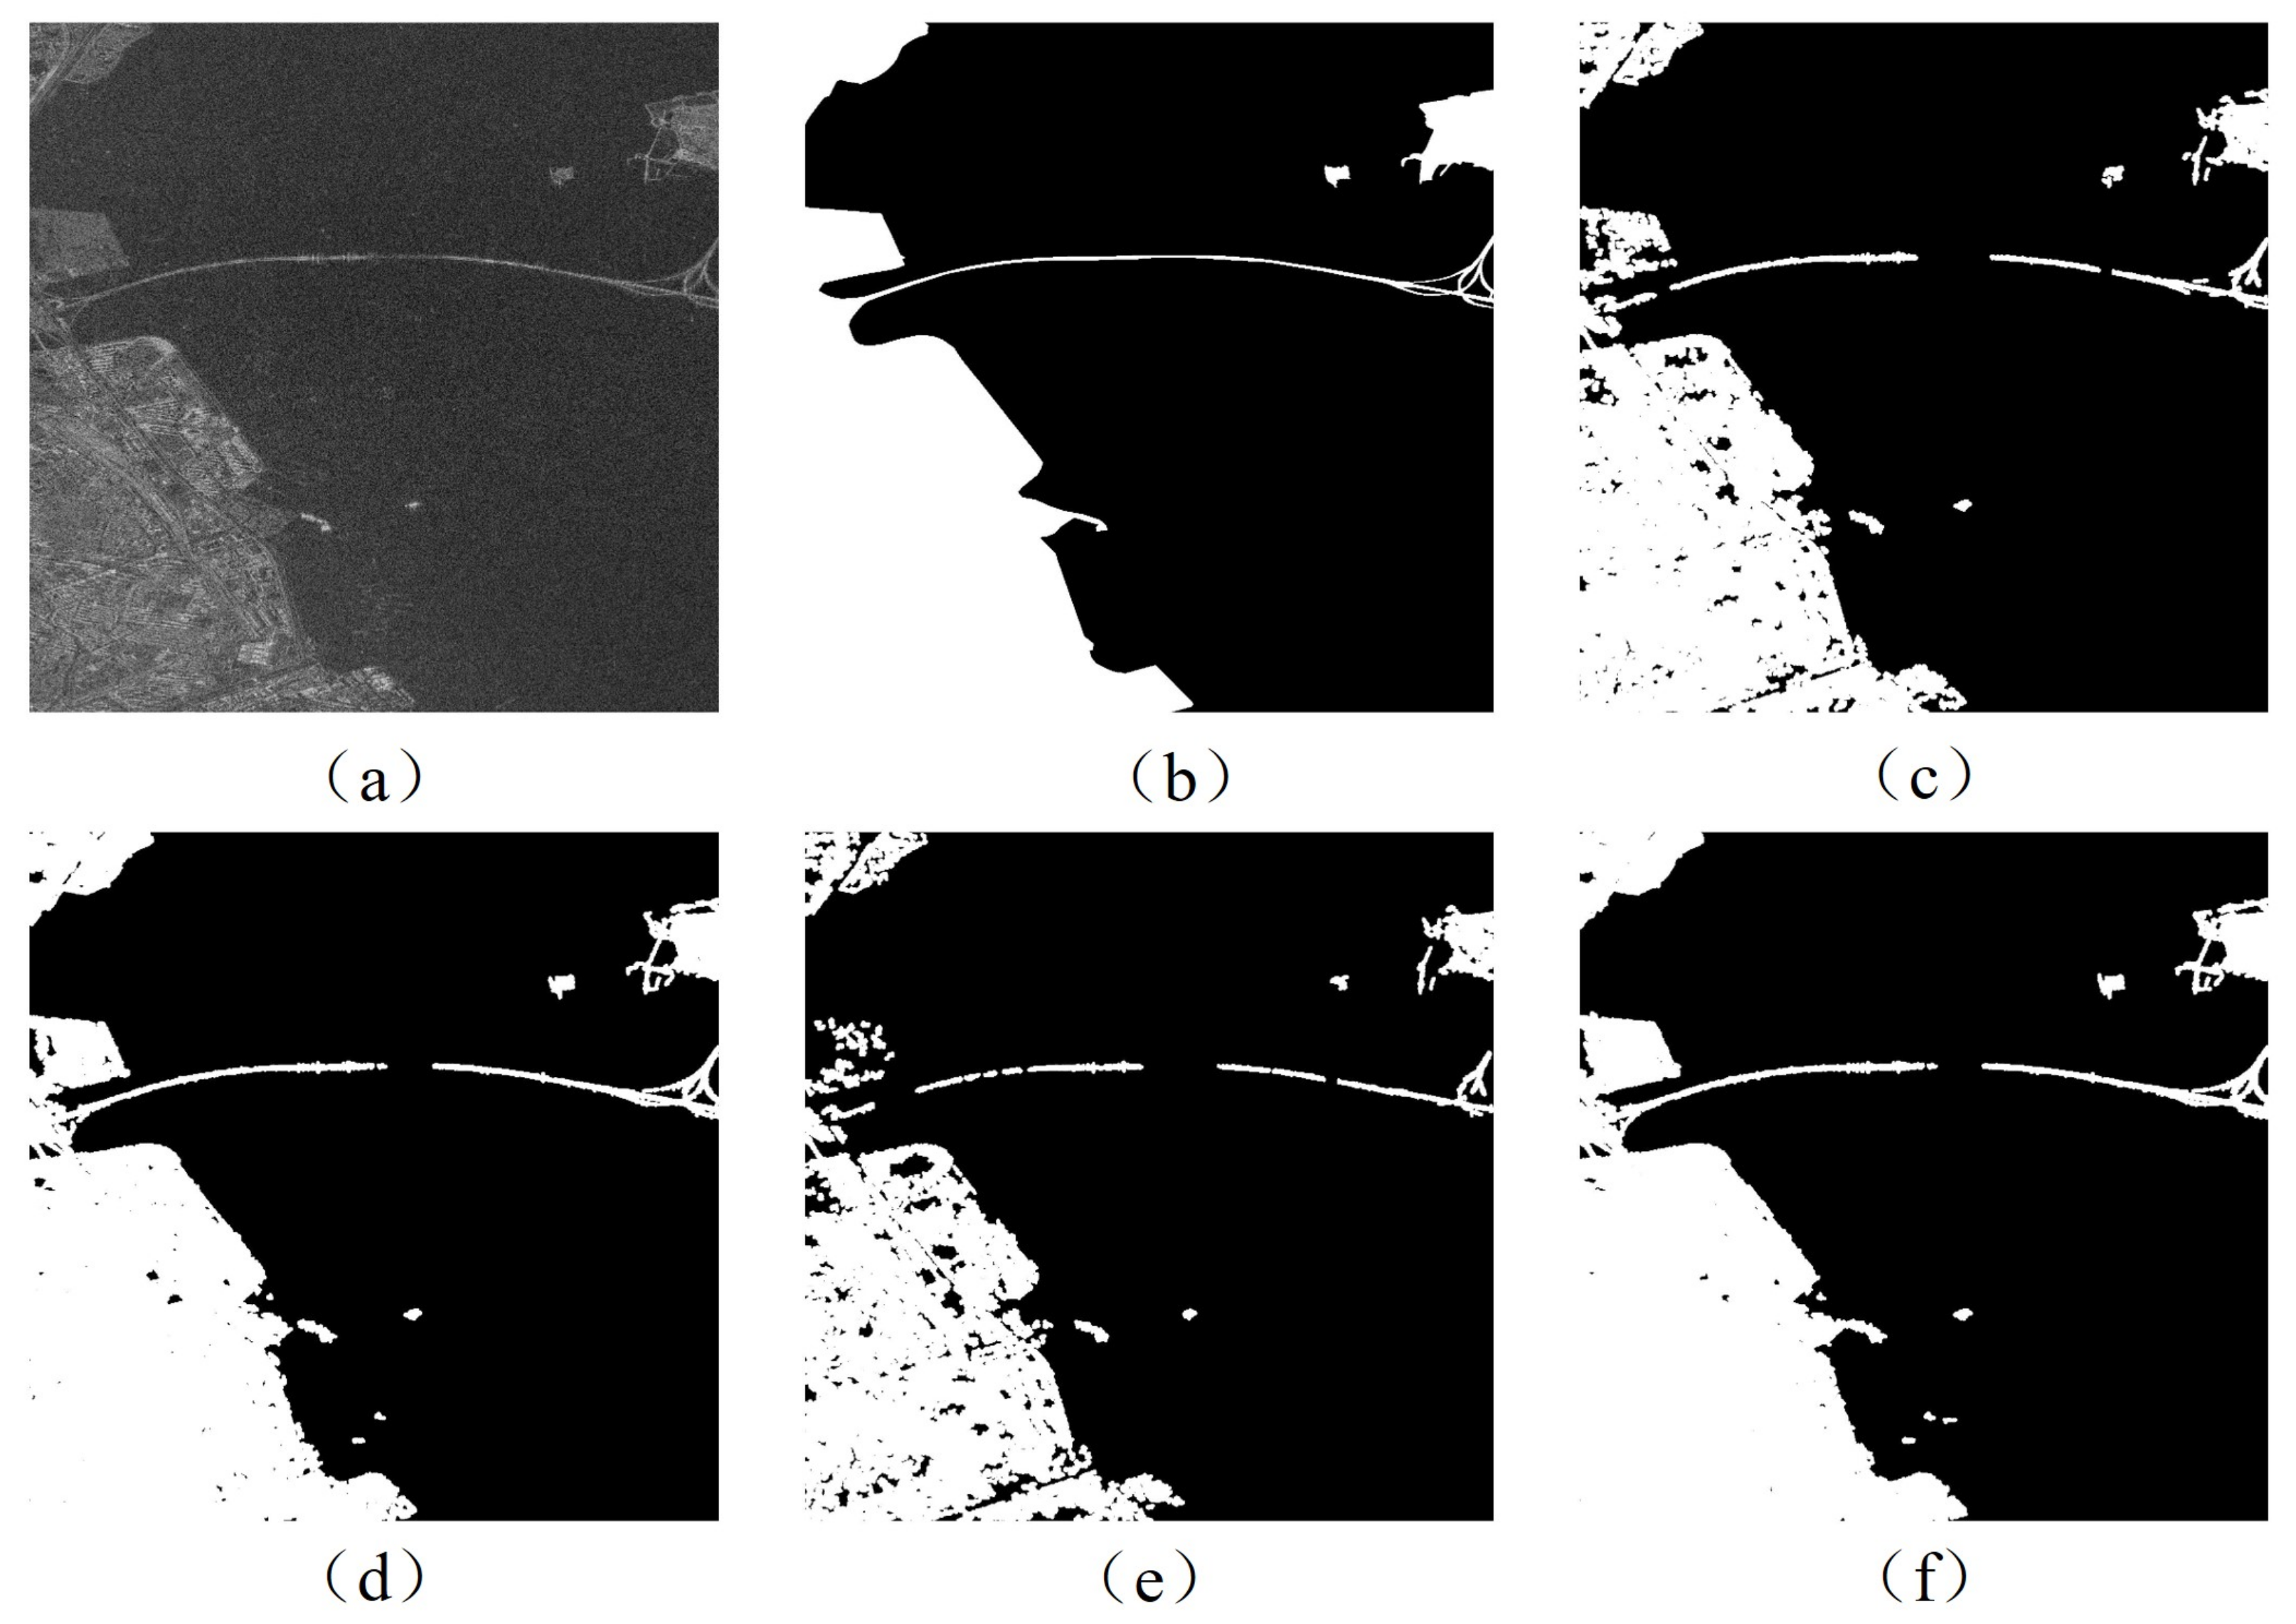
Our method achieved better visual results through nonlinear quantization experiments on GF-3 data than uniform quantization and optimal quantization. It effectively suppressed quantization distortion, particularly enhancing the quantization performance of the quantizer in the low quantization level range. The extraction of sparse, strong scatter points improved the stability of the quantization method. Although our SNR distribution method effectively enhances the SNR at low quantization levels, it sacrifices some degree of global quantization performance. Experimental results demonstrate that the global quantization performance of the proposed method is still superior to other methods, except for the optimal quantizer, while improving the quantization performance at low levels. The reduced quantization distortion also provides a solid data foundation for downstream tasks such as SAR target interpretation.


