1. Introduction
In contemporary armed conflicts, the extensive utilization of thermal weapons not only poses a grave threat to live targets but also presents a significant peril to the natural landscape and human environment [
1]. Particularly, the devastation of urban infrastructure incurs substantial costs in terms of both material resources and humanitarian consequences such as triggering a “refugee wave” [
2]. Consequently, the indiscriminate destruction of civilian infrastructure including residential homes, commercial buildings, and cultural landscapes is deemed both inhumane and constitutes a war crime.
Since the beginning of the 21st century, the international community has been in turmoil due to various conflicts such as the Iraq War, Syrian War, and civil war in Myanmar, which have inflicted significant damage on mankind’s living environment and profoundly impacted global peace and development [
3,
4,
5]. The ongoing Russian–Ukrainian conflict and the new round of Israeli–Palestinian conflict have also resulted in extensive destruction of non-military facilities like urban infrastructure and civilian buildings. Concerningly, the blockade of war zones and deteriorating security conditions pose challenges for United Nations peacekeeping efforts [
6]. Restricted access for relevant personnel hampers field mapping activities while blocked information impedes the international community’s supervision and mediation guidance within these areas. Therefore, there is an urgent need to conduct rapid and accurate mapping of destroyed buildings in war zones to facilitate timely intervention and protection of humanitarian rights [
7].
The development of earth observation technology provides people with an observation perspective that is not restricted by the region so that the destroyed buildings can be observed more objectively and comprehensively in armed conflicts. However, the resolution of early remote sensing images is not high, and the application of destroyed building detection mainly focuses on the disaster assessment after the occurrence of natural disasters such as earthquakes and mudslides [
8]. Currently, Interferometric Synthetic Aperture Radar (InSAR) technology and regional spectral change measurement have been used to perform rough regional damage perception [
9]. Janalipour et al. [
10] proposed an automatic building damage detection framework based on the LiDAR data after a disaster, which combines texture features with average digital projectors and can greatly improve the detection accuracy under the conditions of effective texture feature extraction. Huang et al. [
11] combined synthetic aperture radar images with different simultaneous phases for coherence calculation, combined with open-source building vectors for classification extraction of destroyed buildings, and obtained regional detection results consistent with events. Based on optical remote sensing images, Ghandourj et al. [
12] proposed a method to estimate building damage by using shadow features and gray co-occurrence matrix features and conducted building damage assessments in areas affected by the Syrian war near Damascus. In addition, some scholars have studied the collaborative detection of collapsed buildings by pre-disaster and post-disaster data from the perspective of multi-source data [
13,
14]. However, due to the diversity of data and the limitation of low resolution, there was no unified method for the detection of destroyed buildings during this period. Most of the methods were highly complex, and the classification features depended on artificial design, so the damage degree of buildings could only be roughly estimated.
Nowadays, countries all over the world have developed and launched high-resolution military, civilian, and commercial remote sensing satellites, such as Worldview, SPOT, and GF-2. The resolution of remote sensing images has been improved to the submeter level, enabling high-resolution and fine-grained imaging of individual buildings. Data resources are no longer the bottleneck restricting the acquisition of information in war zones. Therefore, how to quickly and accurately detect destroyed building individuals from wide-area remote sensing images has become the focus of attention [
15].
Fortunately, advances in computer vision and artificial intelligence technology have made it possible to quickly detect destroyed buildings from a massive and large range of high-resolution remote sensing images. Many high-performance methods have been used or are being used in this field for research and application, the most typical cases are convolutional neural networks (CNNs) (e.g., Faster-RCNN [
16], SSD [
17], YOLOs [
18,
19,
20,
21,
22,
23,
24,
25,
26]) and the detection with Transformers (e.g., ViT-FRCNN [
27], RT-DET [
28]). Ji et al. [
29] took the lead in using a VGG [
30] network to detect collapsed buildings after earthquakes in remote sensing images, and after fine-tuning, the detection accuracy of the network was effectively improved. Aiming at the classification of collapsed buildings, Wu et al. [
31] used the improved U-Net [
32] network to segment collapsed buildings at the pixel level, and the classification accuracy reached 0.792. Shi et al. [
33] propose an improved YOLOv4 [
20] algorithm for detecting collapsed buildings in aerial images after earthquakes. However, the actual post-disaster scene is complex and diverse, the collapsed buildings and the background are easily confused, there are still some difficulties in extracting robust features, and the detection accuracy is still not high. To solve these problems, Bai et al. [
34] proposed a pyramid-pool modular semi-twin network for detecting destroyed buildings and improved the detection accuracy by adding residual blocks with expansion convolution and extrusion excitation blocks into the network. Ma et al. [
35] took ShuffleNet v2 [
36] as the backbone network of YOLOv3 [
19] and introduced a generalized intersection over Union (GIoU) [
37] loss to improve the detection accuracy of the model under a complex background. Overall, the object detection method based on deep learning has been proven to be feasible in detecting destroyed buildings in satellite images. It is worth noting that the YOLO series algorithms have been widely adopted in recent years due to their advantages of both accuracy and efficiency. In addition, attention mechanisms [
38,
39,
40], feature pyramids [
41,
42,
43], sampling methods [
44,
45], and other methods are often used to improve the detection performance of networks in specific scenarios.
However, most of the current research focuses on the detection of destroyed buildings caused by natural disasters such as earthquakes and mudslides, and there are no studies on the detection of destroyed buildings in the context of armed conflict.
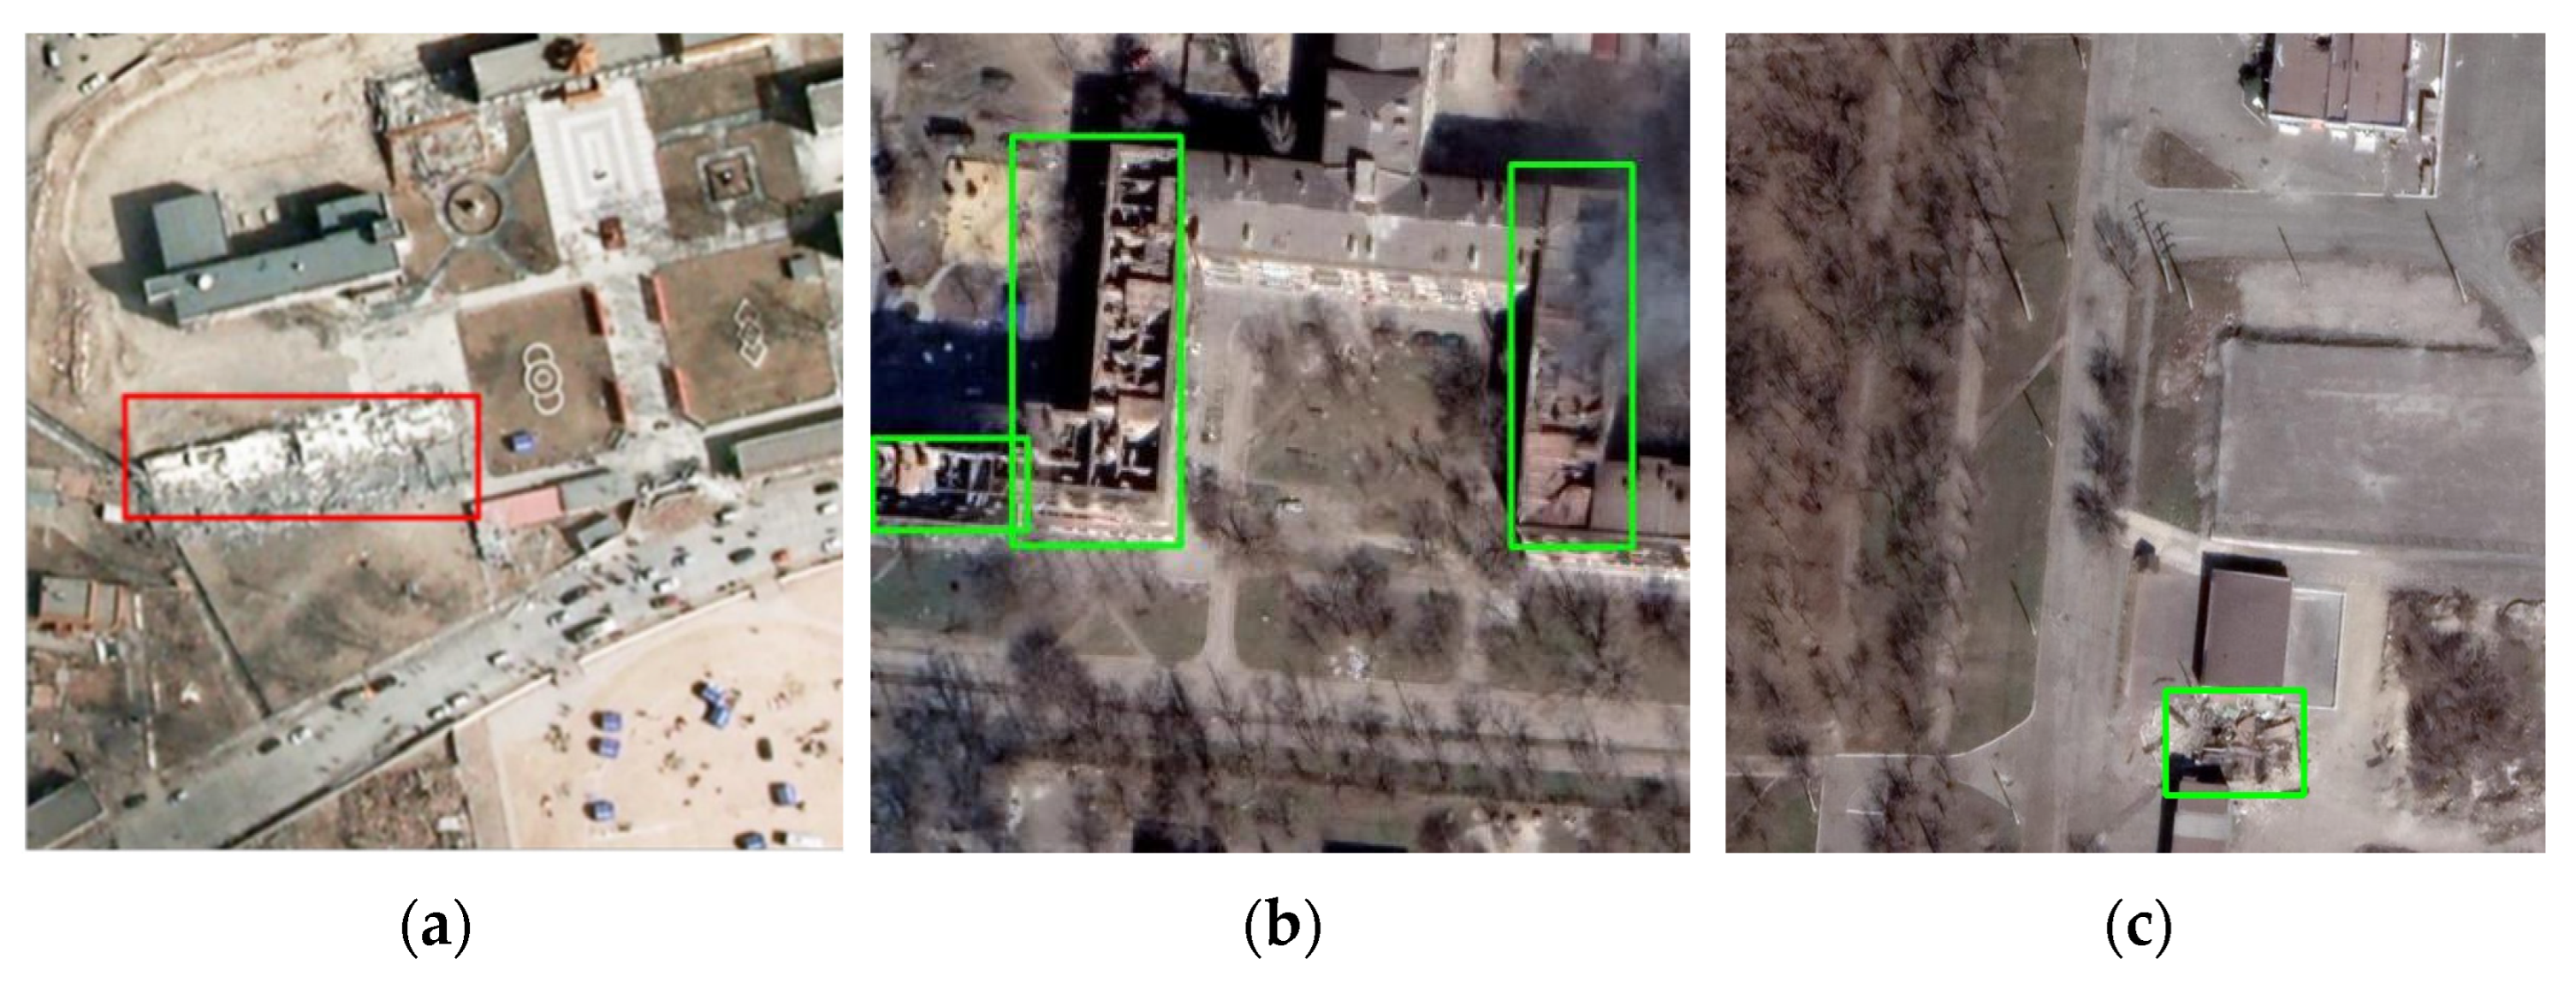
Figure 1 shows the difference in collapse between buildings destroyed by earthquake and war. Earthquake usually leads to overall structural damage to buildings. In particular, a seismic wave will cause the building to lose the support of the facade and collapse as a whole, as shown in
Figure 1a. In armed conflict, the damage caused by air strikes, shelling, and rockets to buildings is often localized and point-like. Large buildings often have partially or completely collapsed roofs and relatively intact facades, as shown in
Figure 1b, while small buildings show irregular ruins, as shown in
Figure 1c.
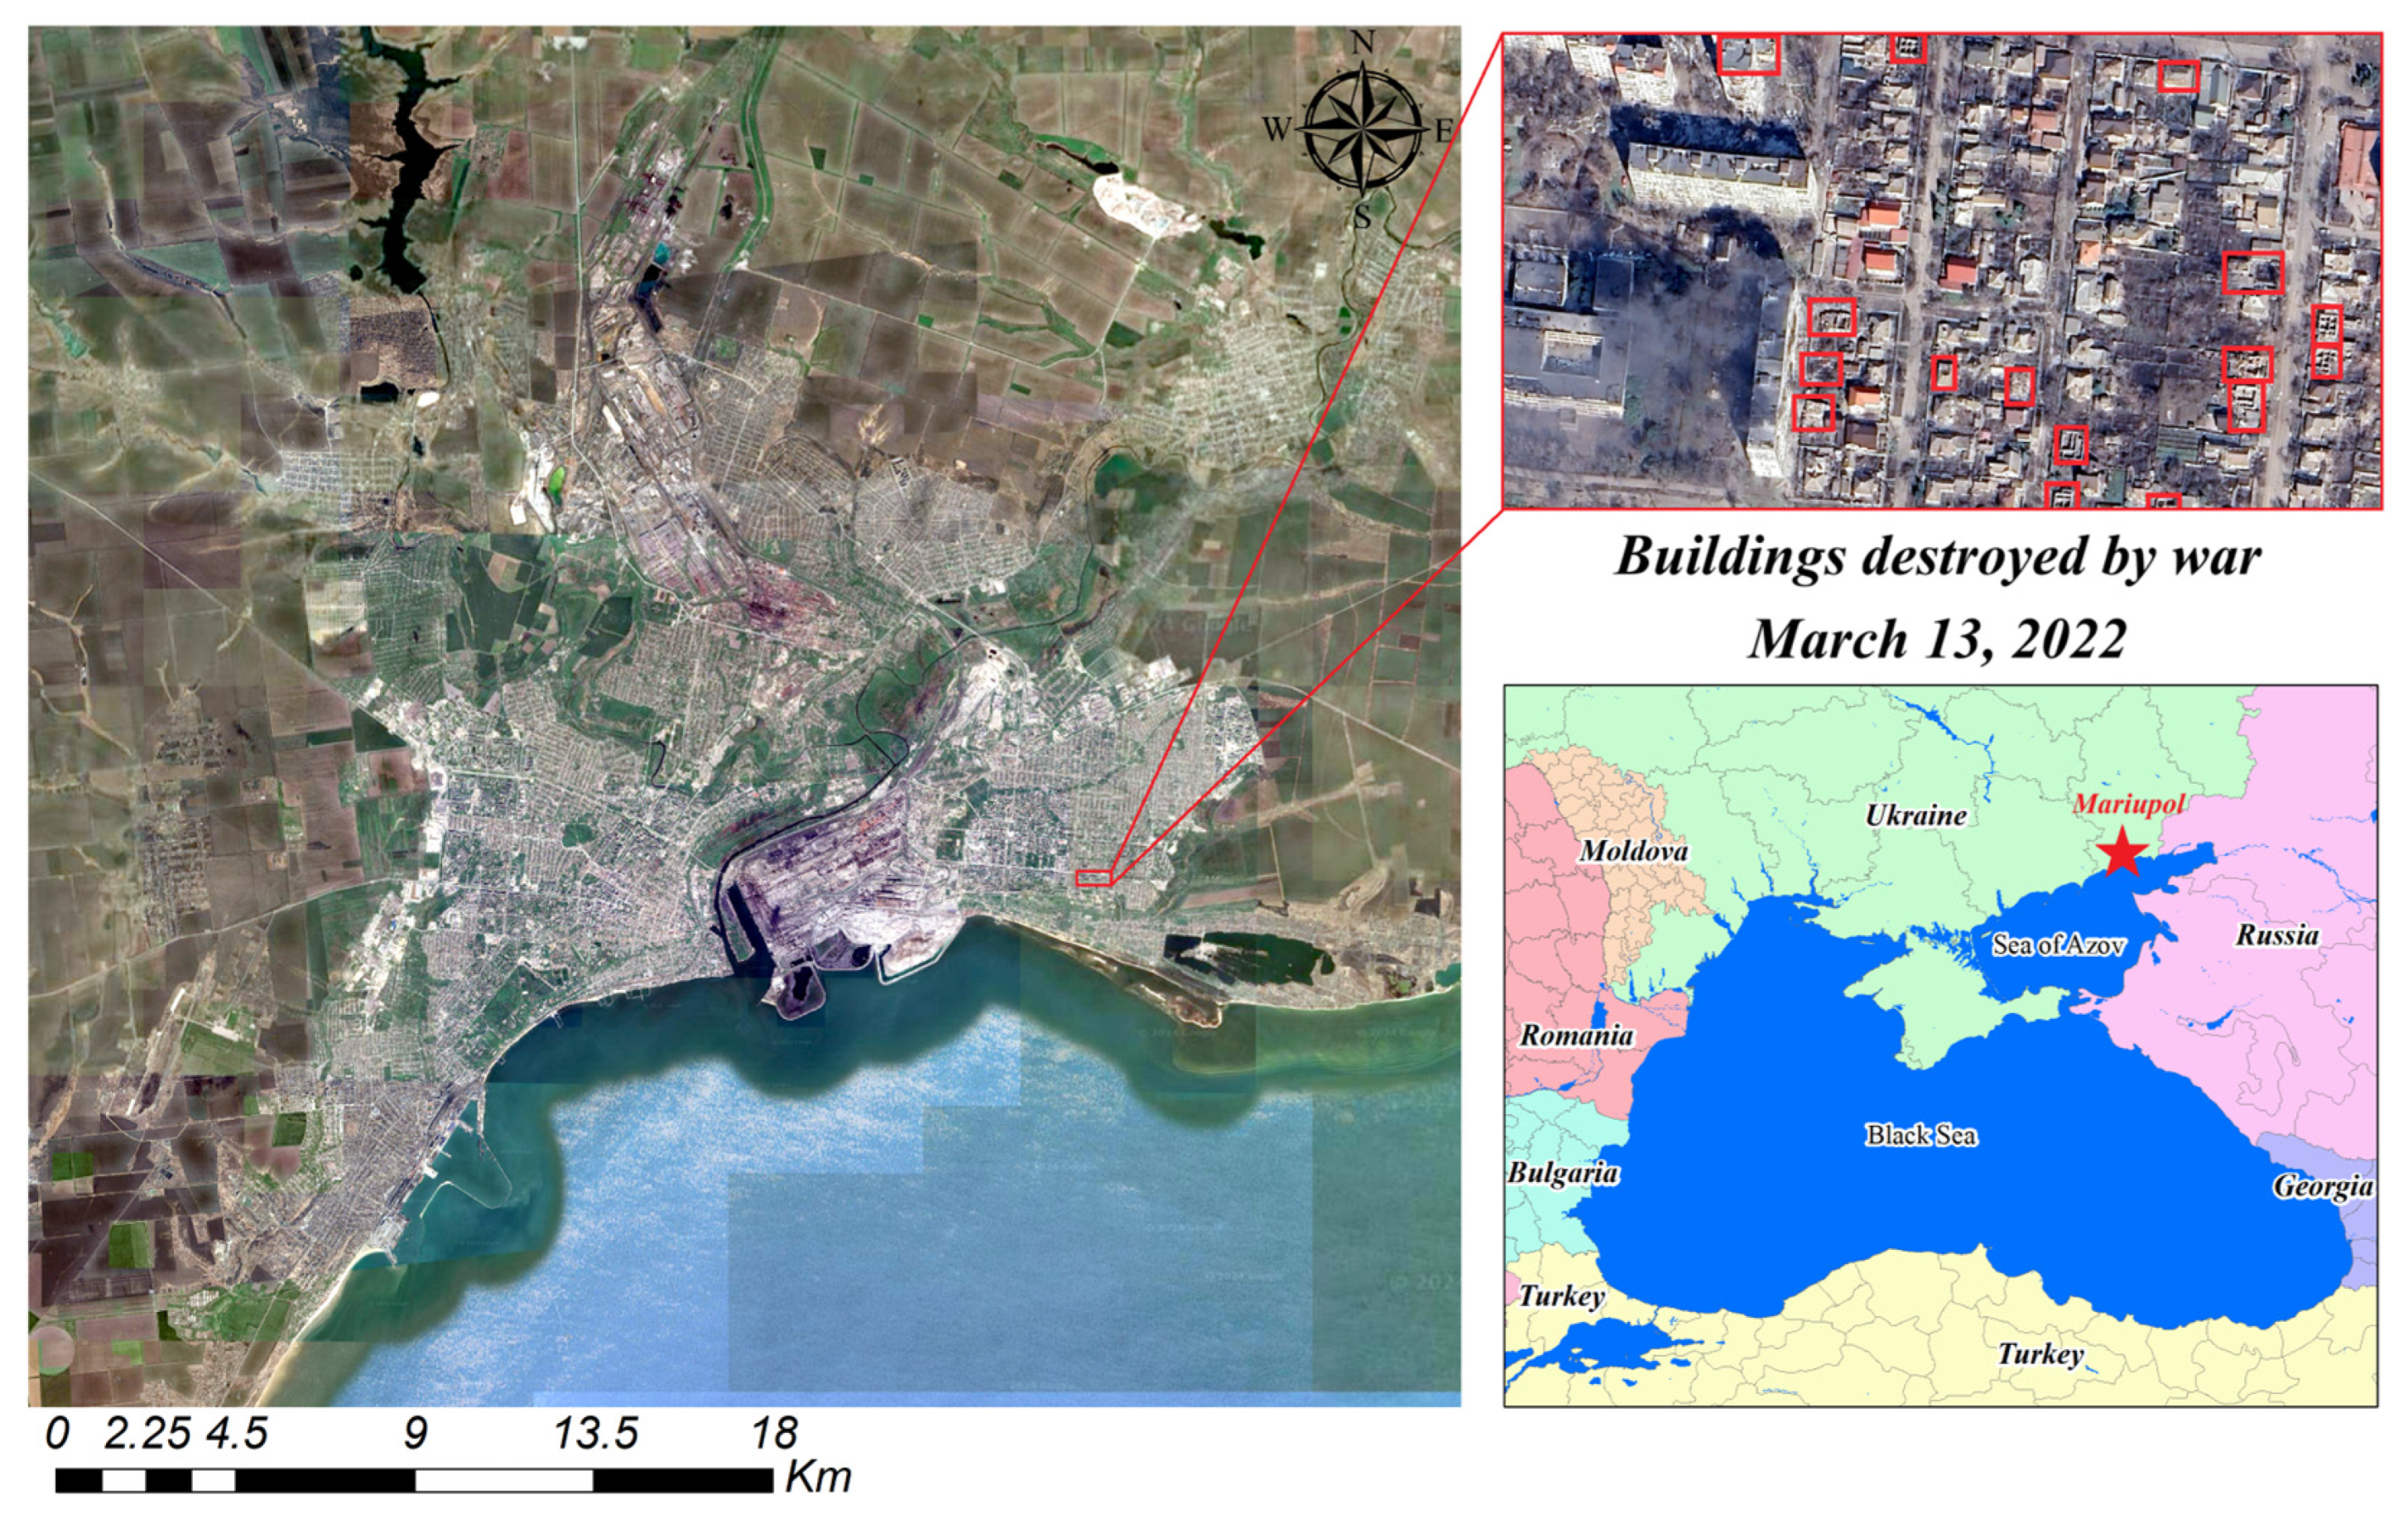
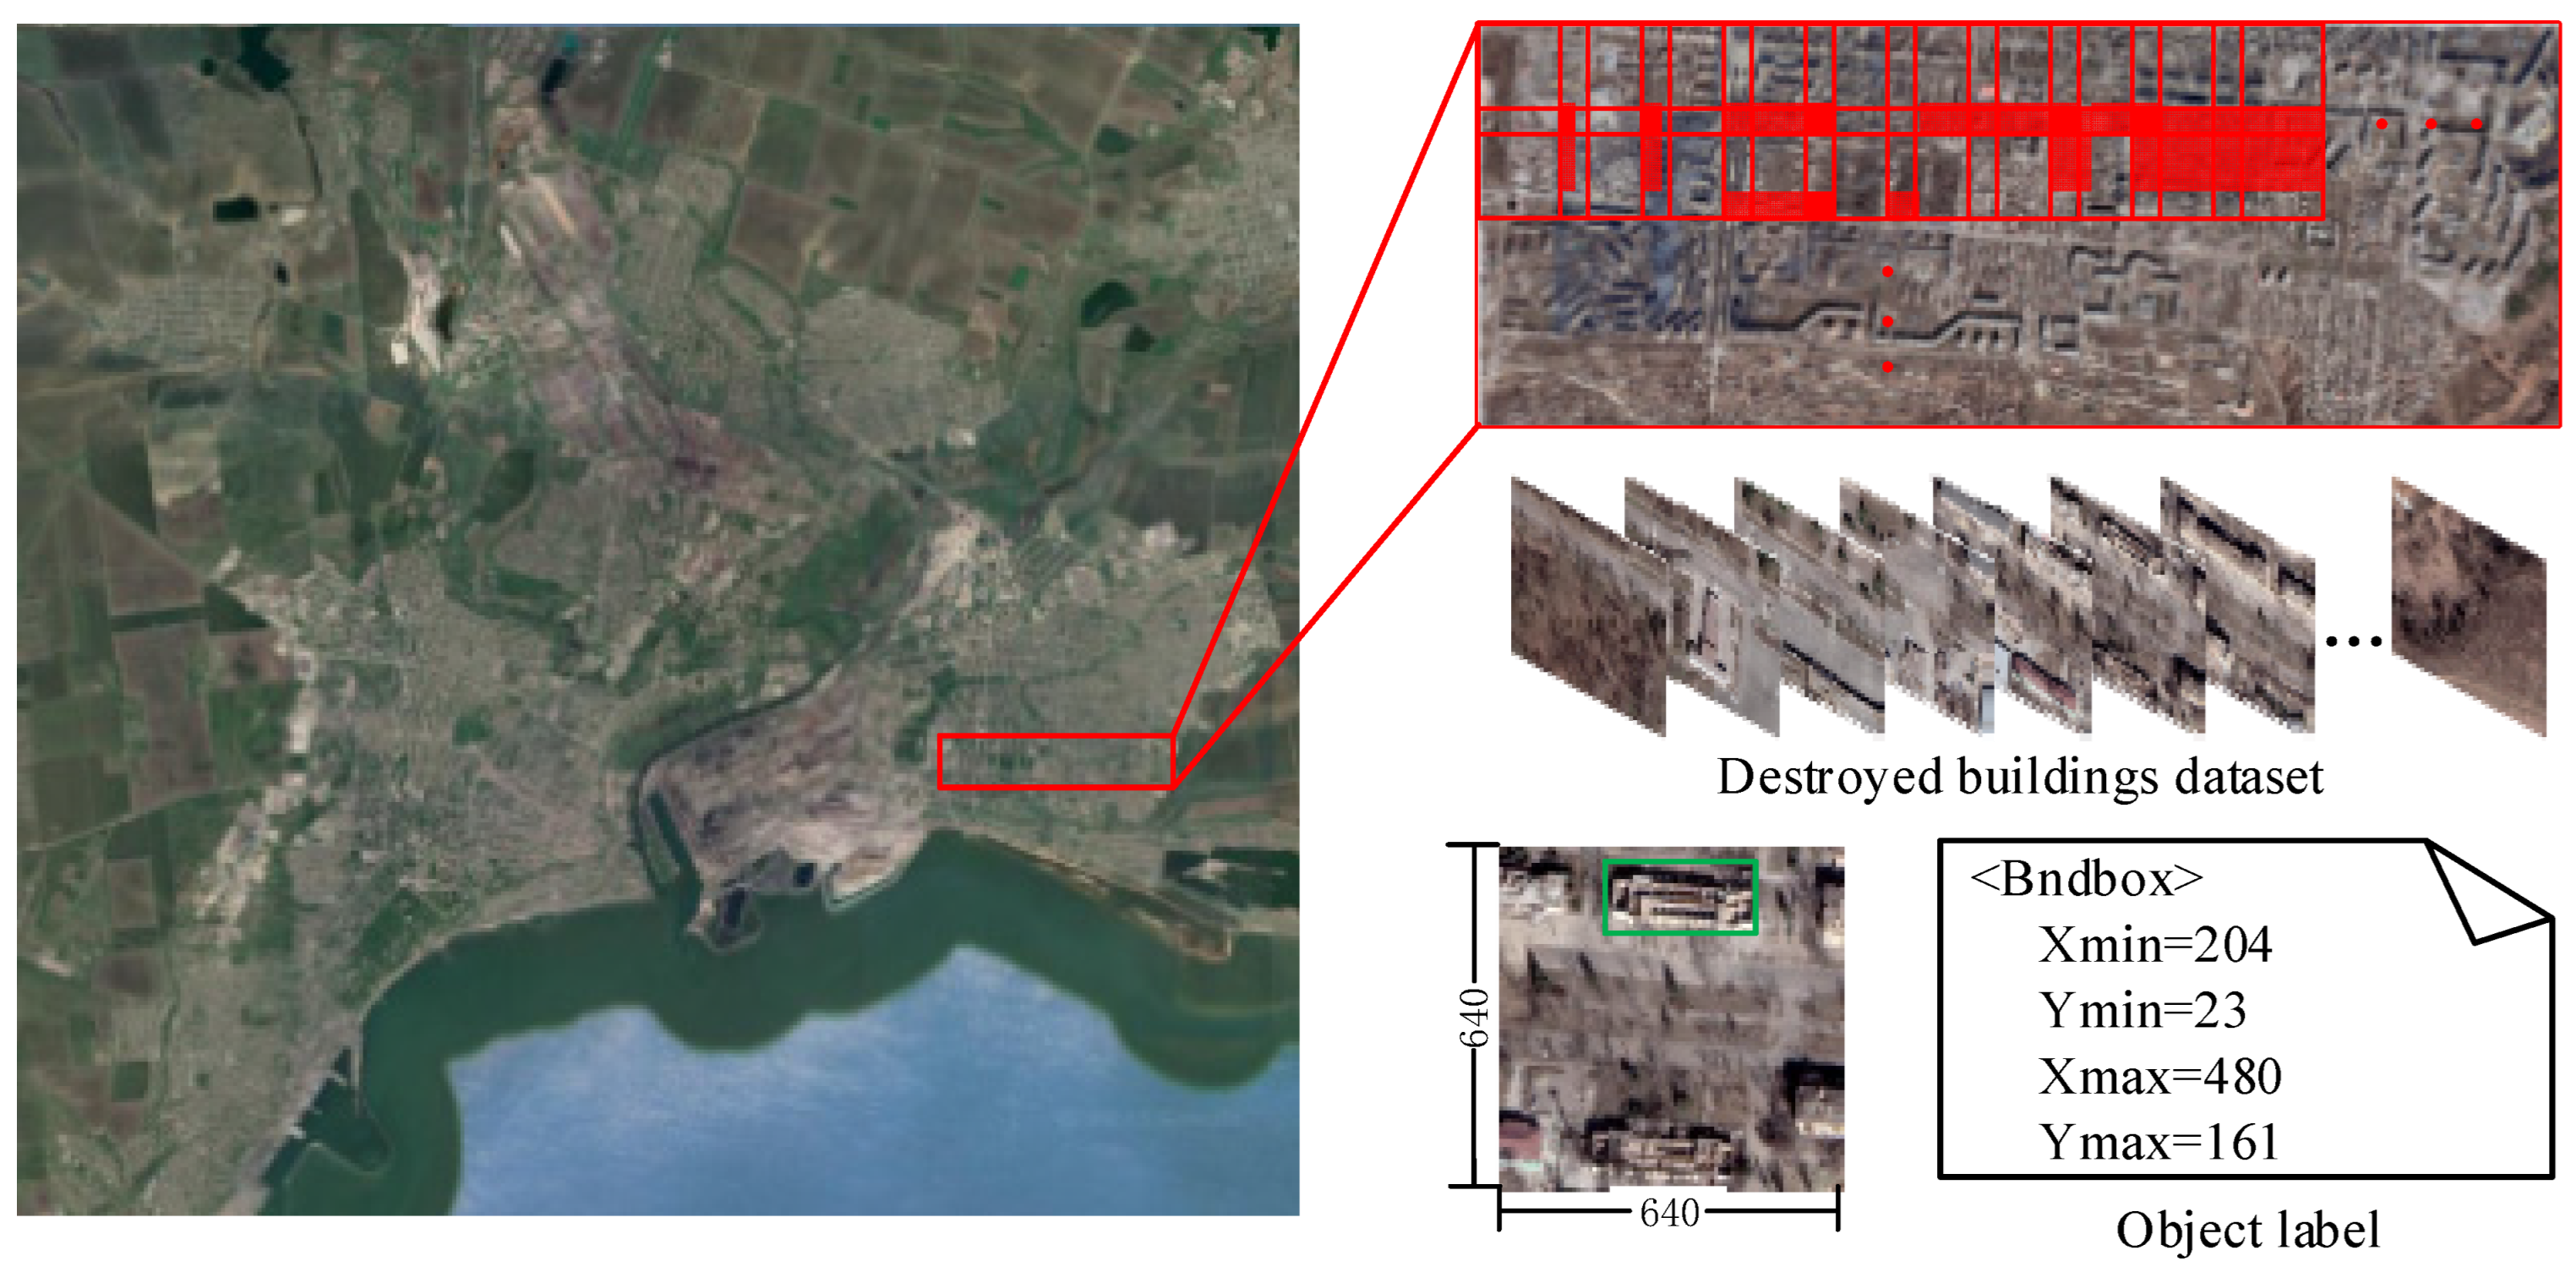
Since the detection of destroyed buildings in high-resolution remote sensing images is highly dependent on the robustness of spatial detail feature extraction, we have made targeted improvements to CNNs and proposed an effective detection method. The main contributions of this work are as follows: (1) obtaining high-resolution Google images of the Russian–Ukrainian conflict area, and making the first dataset for the detection of destroyed buildings by visual interpretation and expert annotation; (2) in view of the task’s dependence on spatial details, the Haar wavelet downsampling module (HWD), lightweight dynamic upsampling module (LDU), and coordinate attention mechanism (CA) were used to improve the convolutional neural network, effectively improving the detection accuracy of destroyed buildings; and (3) a comprehensive assessment and mapping of building damage in typical cities during the Russian–Ukrainian conflict is presented, and the advantages and limitations of our method for monitoring destroyed buildings in high-resolution optical remote sensing images are discussed.
3. Methodology
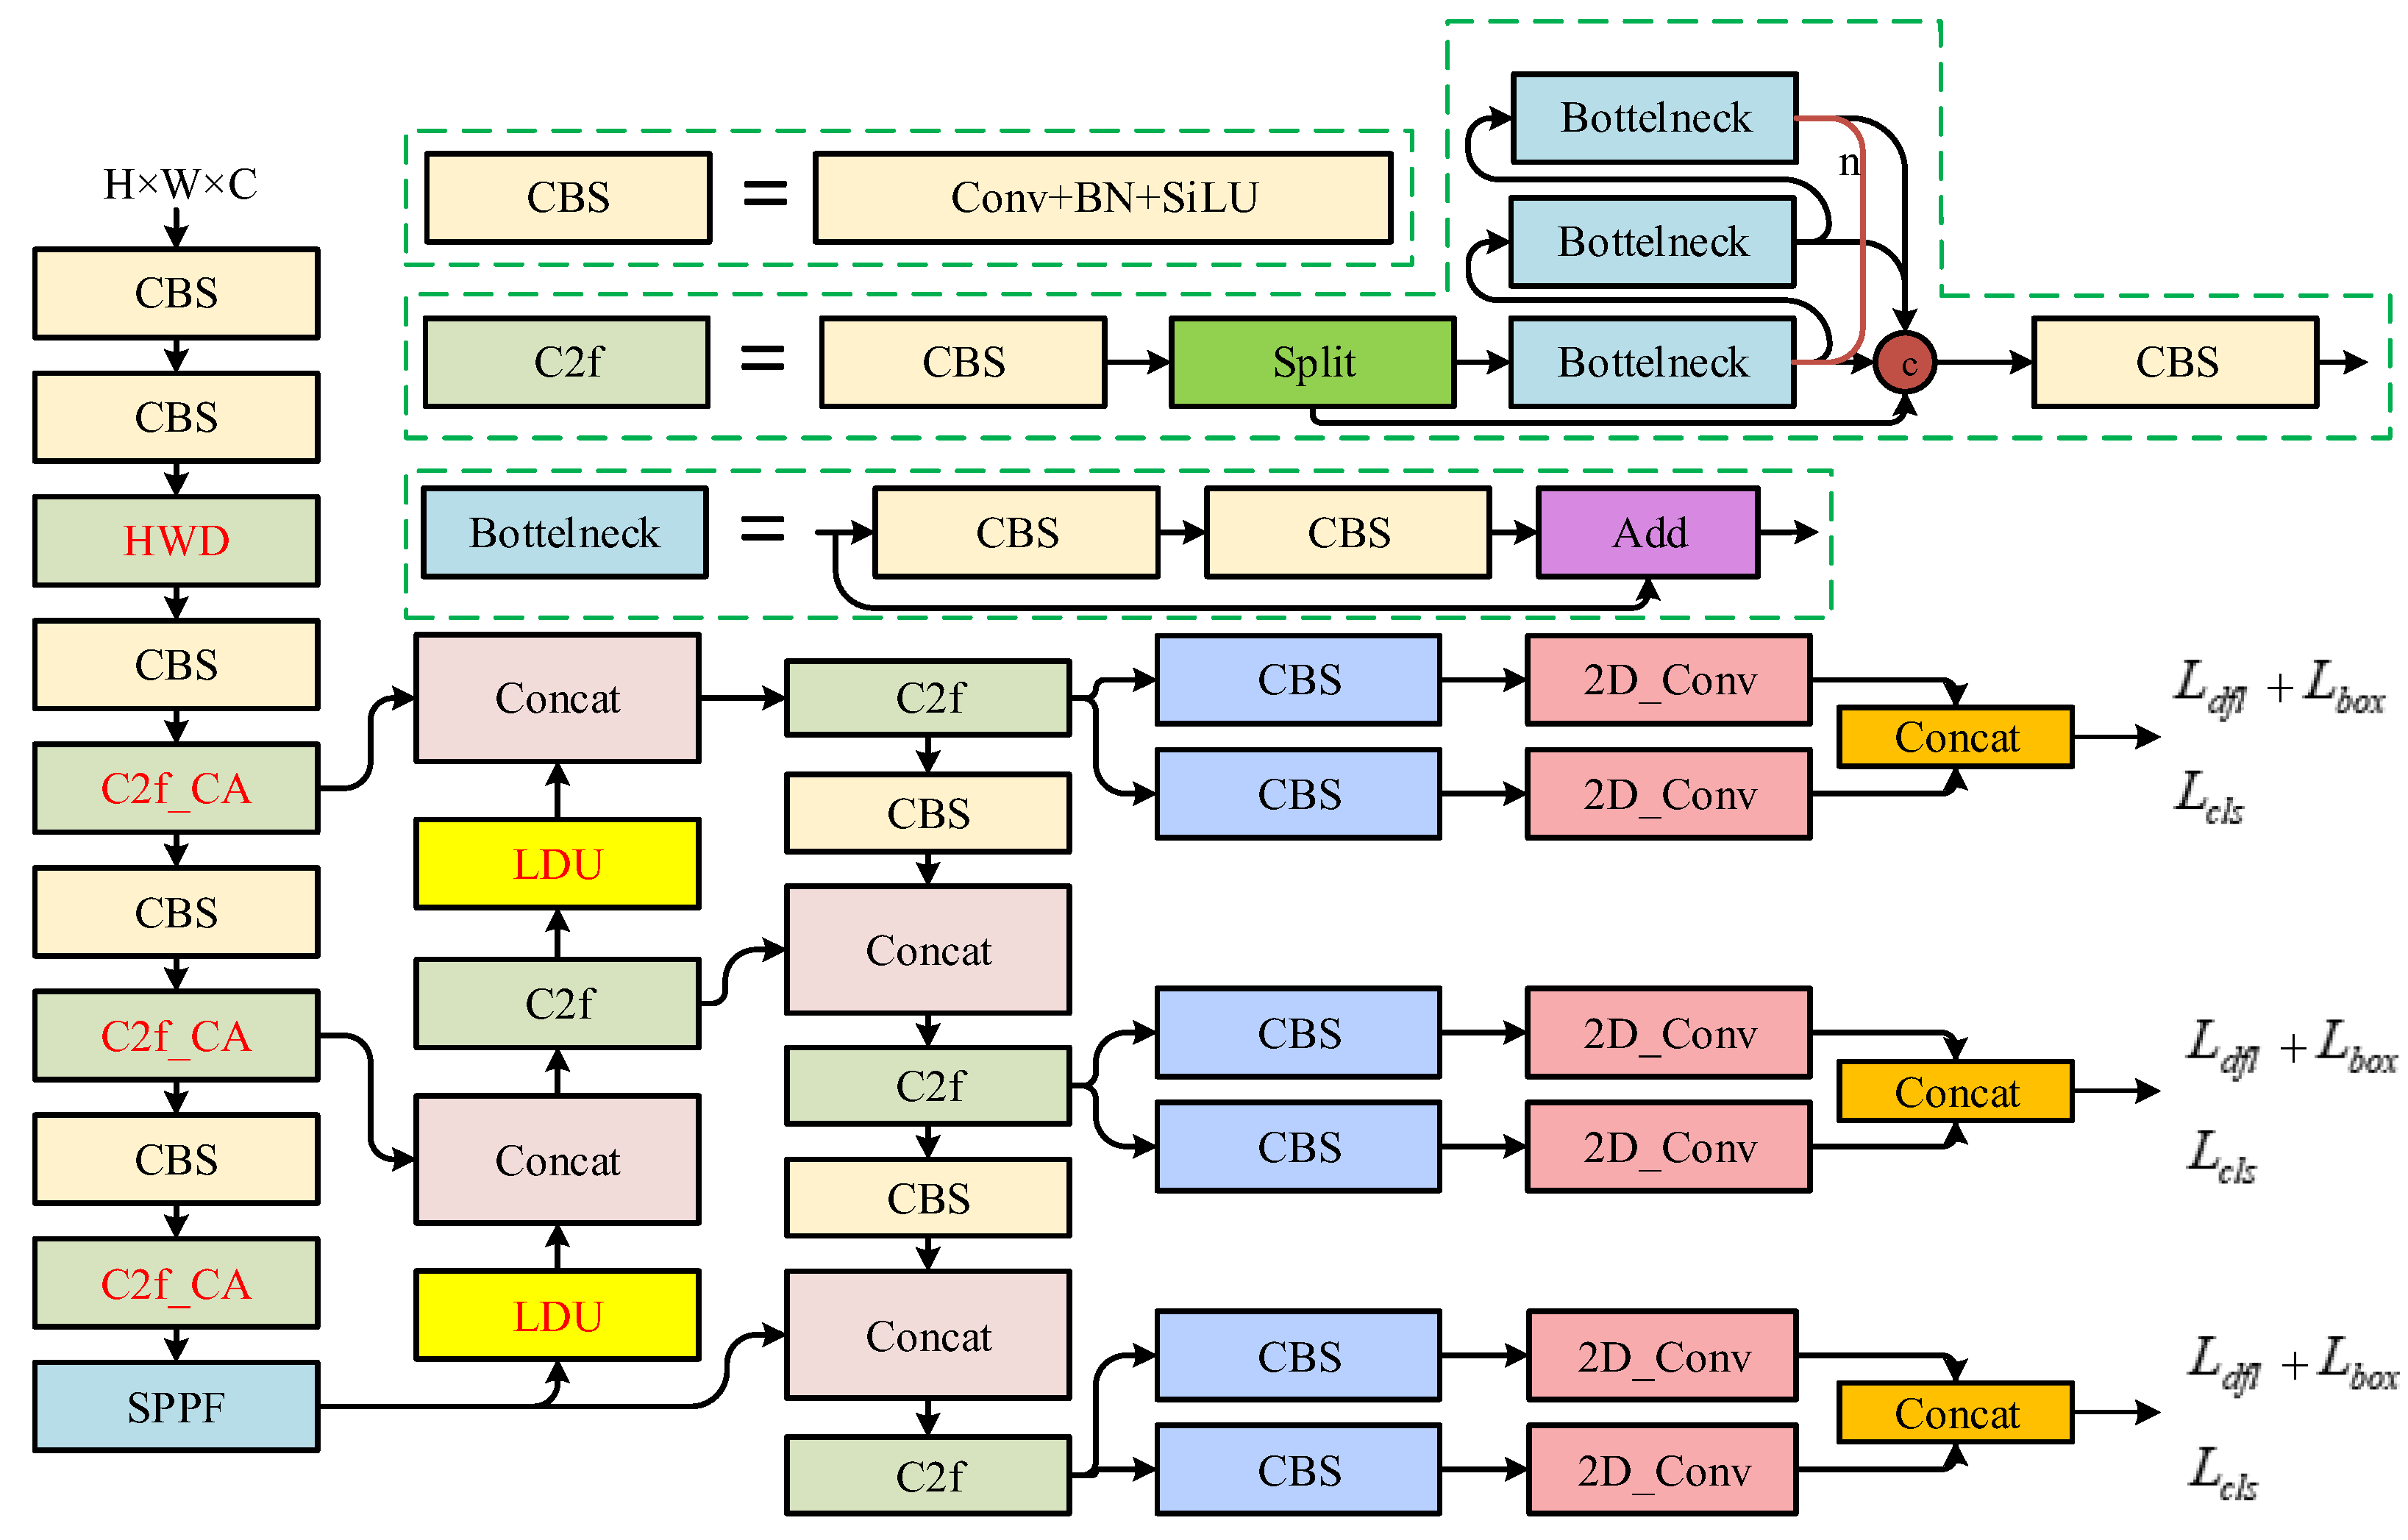
In order to effectively take advantage of the rich detail information of high-resolution remote sensing images, we improved the sampling method and feature expression of the CNN, including the extraction of shallow spatial features and the key screening and utilization of deep semantic features of the CNN. The network structure of SOCA-YOLO is shown in
Figure 4.
In the process of feature extraction, geometric features such as the shape and texture of the object are crucial for detecting destroyed buildings in high-resolution remote sensing images. In order to avoid excessive loss of shallow spatial details, we introduced the Haar wavelet 2D decomposition to replace the early stage of the backbone network for downsampling [
44]. In addition, we combined the coordinate attention [
40] with the C2f module in the backbone network to enhance feature representation with spatial detail information earlier, promoting cross-scale feature fusion.
In the stage of feature fusion, it is usually necessary to upsample the feature map and connect it with the shallow feature map to enrich the multi-scale object information and improve the detection performance. In this section, we introduce a lightweight dynamic upsampling module [
45] into the network. By combining point sampling and offset, a feature map with more spatial position perception can be obtained and the details of semantic features in the reconstructed feature map can be better retained.
3.1. Haar Wavelet Downsample
The structure of the Haar wavelet downsampling (HWD) module is shown in
Figure 5, which is composed of the Haar wavelet transform (HWT) and the convolution block (CBS).
Assume that the input image
has
channels of size
. Row
can be represented as
. According to the sequence of channels, each row of the image is transformed by the one-dimensional Haar wavelet:
where
and
are the low-frequency and high-frequency coefficients of pixels
, respectively.
Furthermore,
and
are made into low-frequency matrix
and high-frequency matrix
, and then each column of them is transformed by a one-dimensional Haar wavelet:
where
and
represent row and column indexes, respectively.
,
,
, and
represent the approximate component, horizontal detail component, vertical detail component, and diagonal detail component, respectively. These components form a temporary feature set
. Since this can be seen as a lossless coding process, the four components obtained after decomposition can contain more spatial features. In particular, the high-frequency detail features that damage the building are preserved. With
as the input of the CBS block, after convolution, batch normalization, and nonlinear activation of the SiLU function, the output feature set
of HWD is obtained. After HWD, the image can be downsampled, while the spatial details are fully preserved, and the application of the CBS block also enhances the training stability of the model.
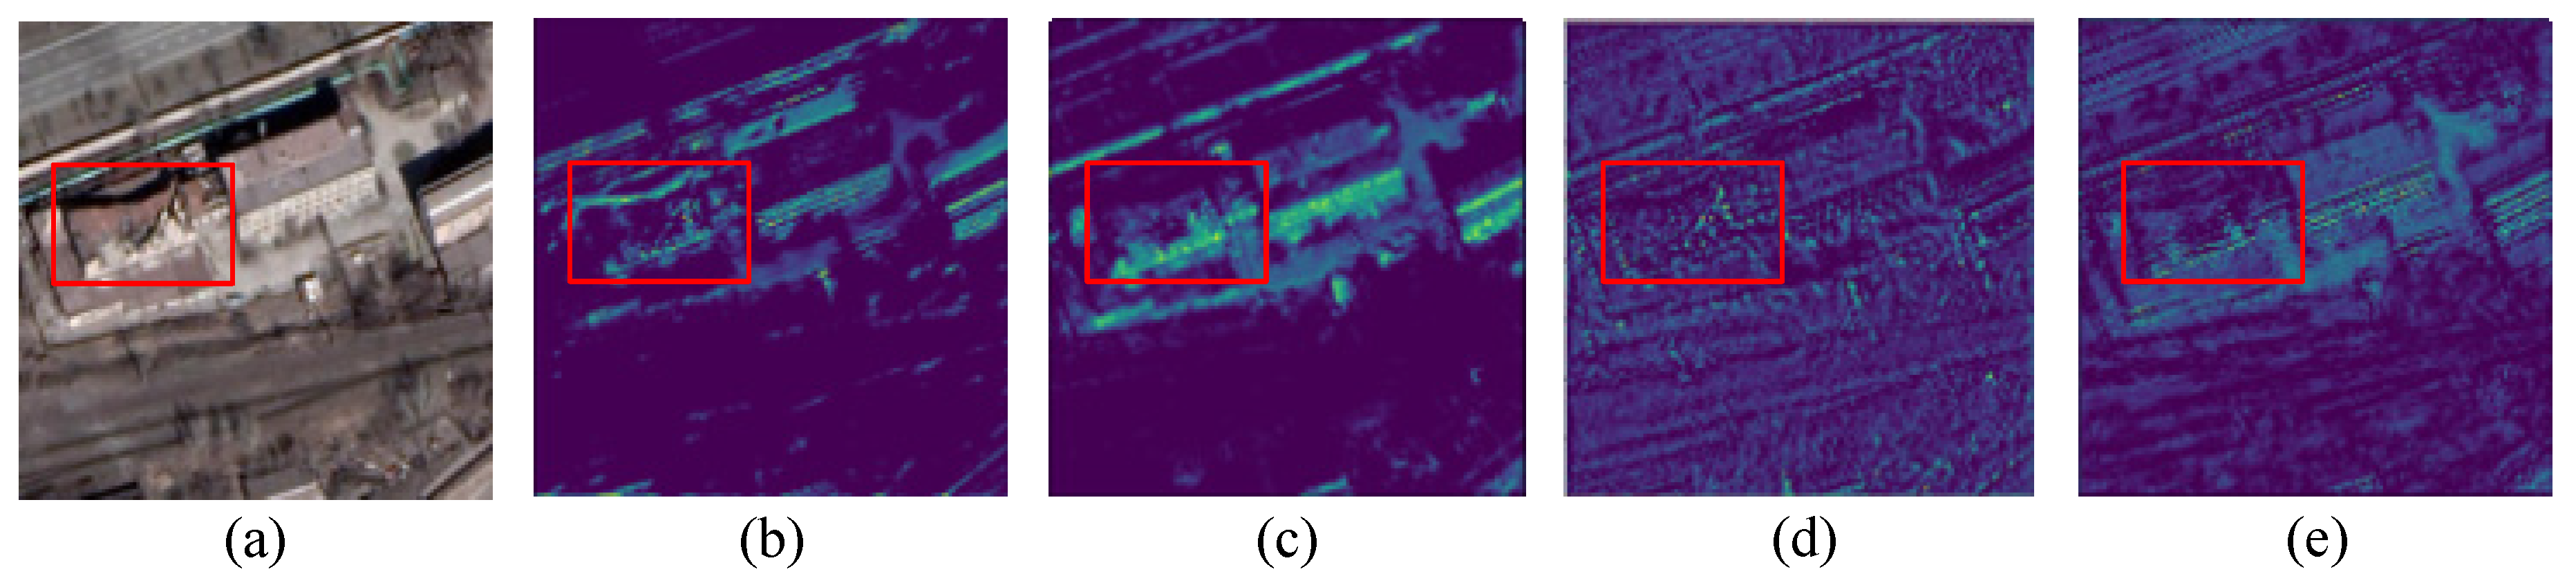
Figure 6 shows the visualization results of four downsampling methods, including Average pooling, Maximum pooling, Strided convolution, and HWD. It is evident that the image with Haar wavelet downsampling has clearer texture and shape features. In particular, the spatial details of the destroyed buildings in the red boxes are preserved to a greater extent.
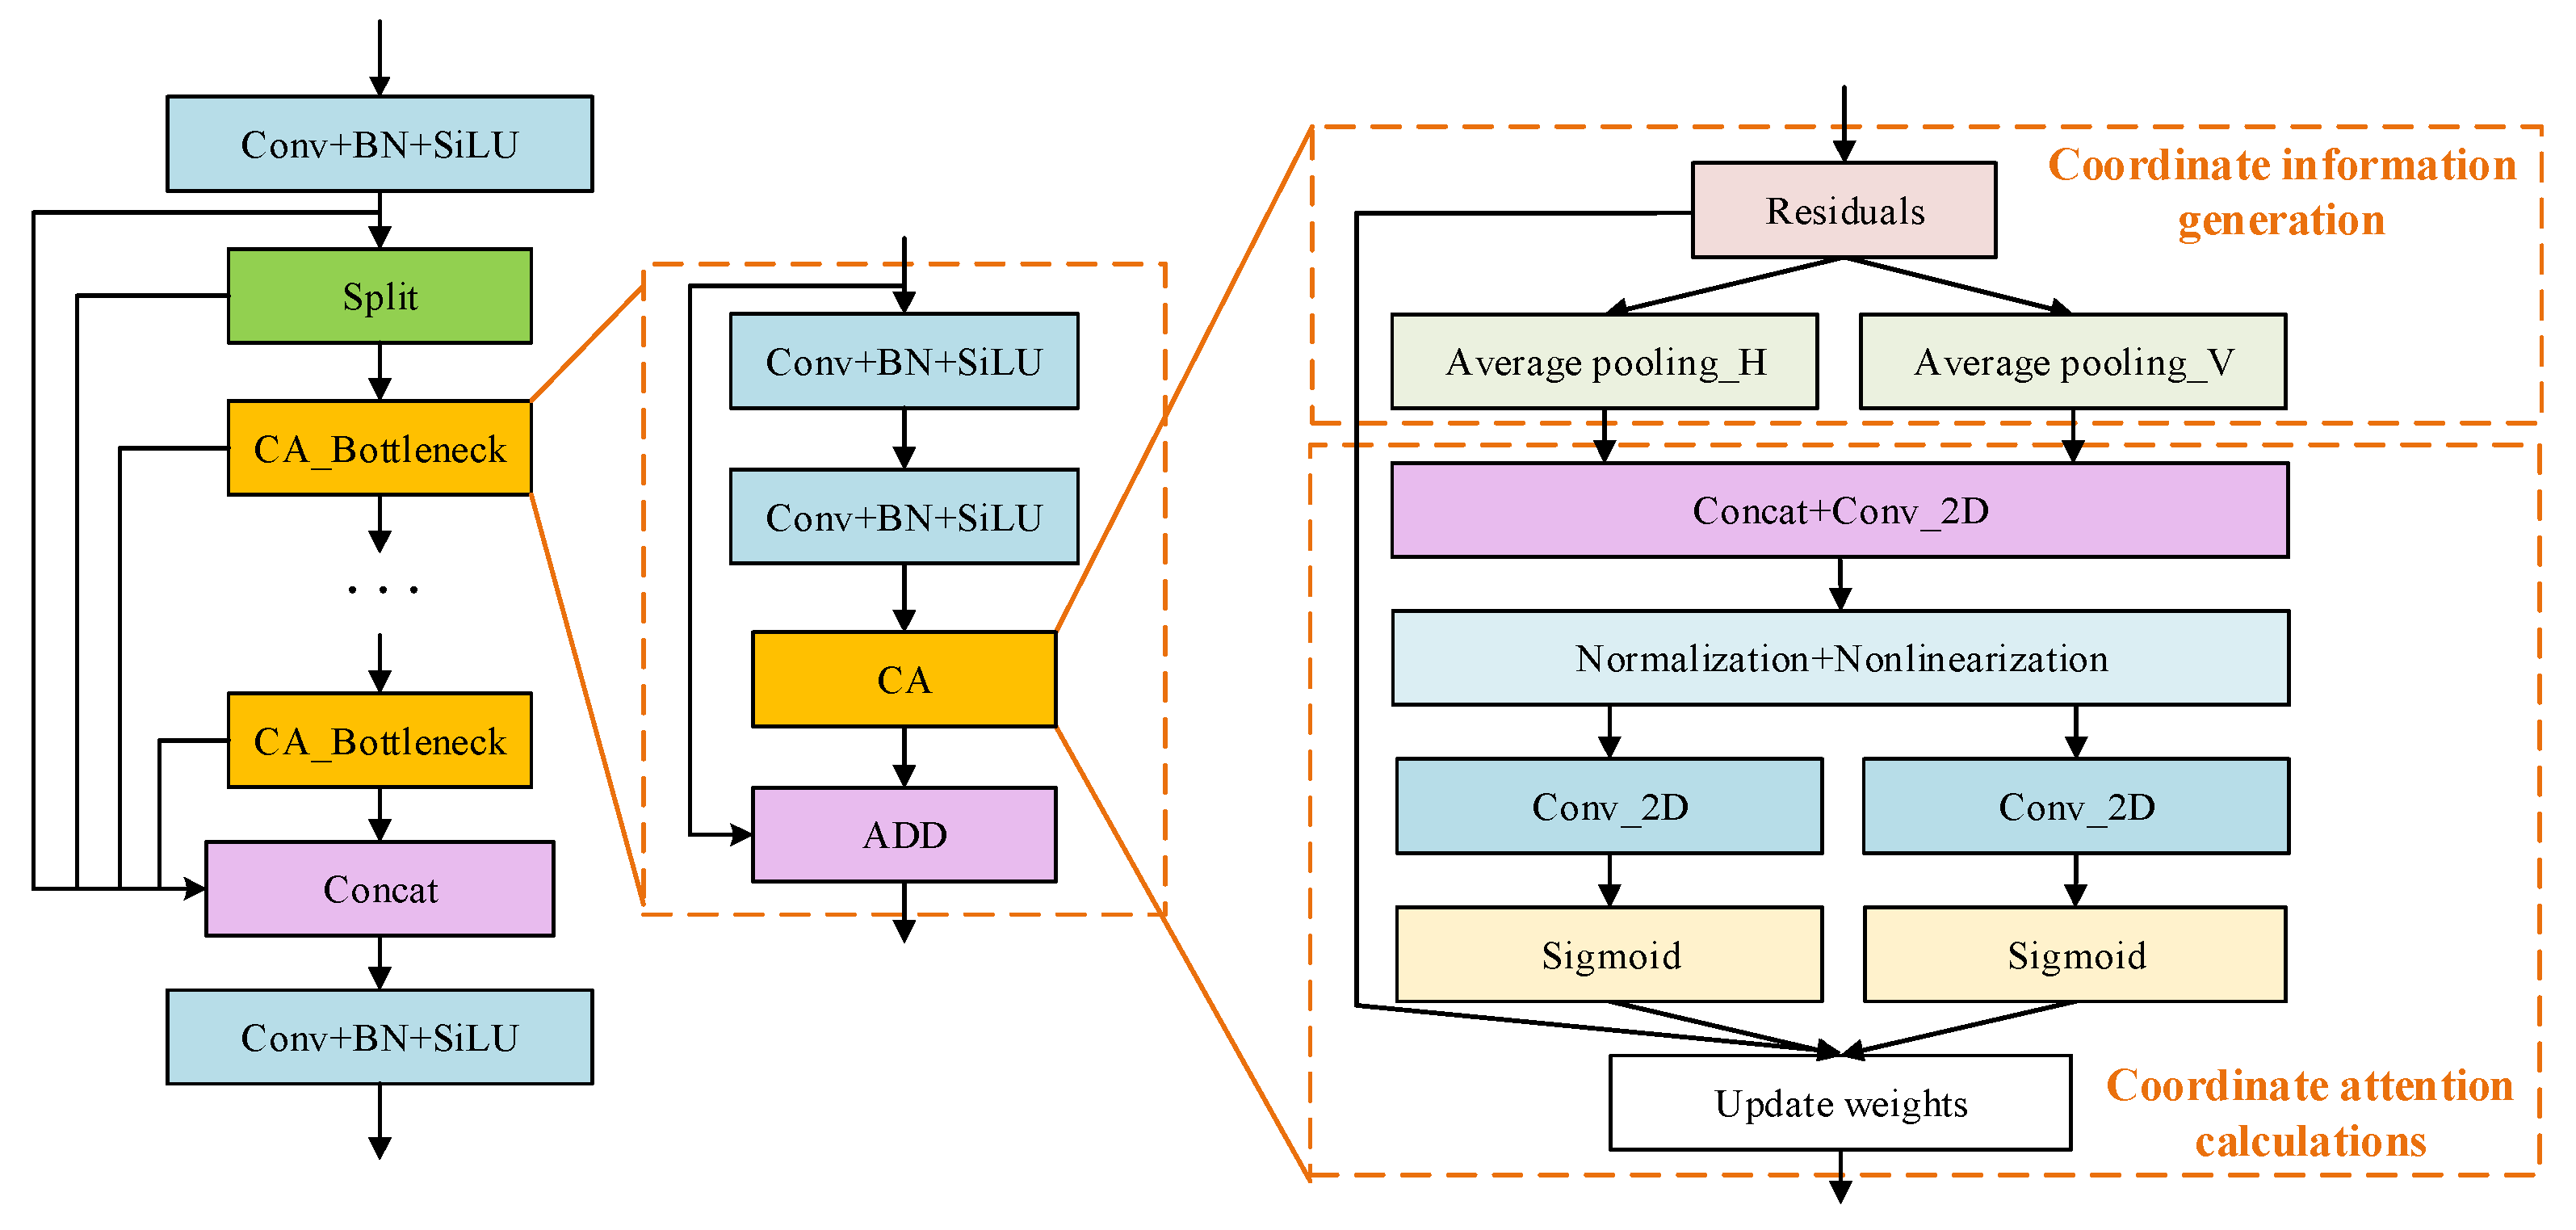
3.2. Coordinate Attention
To further enhance the ability of the CNN to extract and locate the features of destroyed buildings, we constructed a C2f_CA module integrating coordinate attention, as shown in
Figure 7. The CA module was input into Boottleneck through two stages of coordinate information generation and coordinate attention calculation to enhance spatial features and analyze dependency of inter-channel and inter-position dependency. The model’s space awareness and feature representation ability are improved by stacking multiple CA_Bottleneck.
In the generation stage of coordinate information, the CNN carries out one-dimensional spatial pooling in the horizontal and vertical directions of the input feature map, respectively, so that the attention module can capture accurate spatial position perception in different directions. In other words, while effectively capturing long-range dependencies in one spatial direction, the network can also obtain precise location information in the other direction, as shown in Equations (7) and (8):
where
and
, respectively, represent the output by the
channel with height
in the vertical direction and the
channel with width
in the horizontal direction;
is the
pixel value in row
of channel
for the input feature map; and
is the
pixel value in column
of channel
for the feature map.
In the coordinate attention calculation stage, the channel dimension of the feature graph output in the previous stage is combined to make it have two independent spatial direction feature perceptions at the same time. The intermediate feature graph is further generated through 2D convolution, normalization, and nonlinearization:
where
is the middle feature map;
is the h_swish activation function;
is a convolution operation;
is the splicing channels; and
and
are the feature maps generated in the vertical and horizontal directions, respectively, in the previous stage.
The intermediate feature map is decomposed again into vertical and horizontal vectors
and
, and the number of channels is adjusted by convolution and activated by a Sigmoid function to generate the attention weights
and
in the corresponding directions. Finally, the attention feature map is obtained by weighting the two directions with the input feature map:
where
is the output attention feature map,
is the input feature map, and
and
are the vertical and horizontal attention weights, respectively.
With embedding coordinate attention in C2f, different weights can be obtained to different spatial positions of input feature maps, enhancing or suppressing feature information. More importantly, the spatial context of local features can be better understood by the network, improving the utilization efficiency and recognition accuracy of spatial structure information.
3.3. Lightweight Dynamic Upsampling
The lightweight dynamic upsampling module consists of two parts: the Dynamic sampling point generator and Dynamic upsampling calculator, whose structures are shown in
Figure 8a and
Figure 8b, respectively.
The input feature map is denoted by
, whose size is
, and the sample set
has size
, where
is the number of channels,
is the height of the image,
is the width of the image, and 2 in the sample set
is the
and
coordinates. Given the premise that the upsampling rate is
, the upsampling process can be expressed as
where
is the upsampling output.
Based on this, a linear offset layer
with the number of input channels
and the number of output channels
is introduced into the sampling module on Dysample. The coordinate S of each point in the feature graph
can be obtained by
where
is the corresponding sampling point and
is its corresponding offset.
When
is non-0, the domain information of the sampling point can be taken into account. However, too large offset results in mixing other semantic cluster information when sampling the edge points of the semantic cluster, leading to the boundary being indivisible. Therefore, multiplying the scaling factor
in Equation (13) is used to limit the range of offset. After scaling and adjusting the offset, the coordinates are reordered by normalization and pixel recombination, and the final position coordinates are obtained by adding the positions of the corresponding sampling points. Finally, in order to make the offset process more flexible, the scaling factor is generated point by point by way of linear projection to adapt to different feature distributions:
In this case, the offset range is [0, 0.5]. Compared with the traditional upsampling method, the lightweight dynamic upsampling module can retain the geometric feature information of the feature graph, and be used against boundary discontinuity and detail ambiguity caused by simple upsampling.
3.4. Slicing-Aided Hyper Inference
To detect destroyed buildings rapidly in a wide range of remote sensing images, the slice-assisted super inference strategy [
48] is adopted in the process of network inference. The method cuts a wide range of remote sensing images into manageable sub-images, detects the destroyed building in sub-images one by one, and splices the detection results. It can greatly optimize memory usage and simplify the process of reasoning to visualize the geospatial location distribution of destroyed buildings.
5. Result
5.1. Comparison of Different Improvement Strategies
Considering that HWD modules and the coordinate attention mechanism have various embeddedness positions and embeddedness ways, we designed several sets of comparative experiments to discuss the validity and rationality of the embeddedness positions and methods in the above methods.
- (1)
The embedding position of HWD
Previous experiments have proved that HWD can fully retain the spatial detail features of destroyed buildings when downsampling shallow feature maps. Therefore, in this section, we discuss whether consecutively embedding different numbers of HWD modules in a backbone network contributes to network performance. To be specific, we still use YOLOv8 as the baseline. HWD replaces the first C2f layer (Group A experiment, ours), the first two C2f layers (Group B experiment), and all C2f layers (Group C experiment) in the backbone network according to the sequence. The comparison experiment results are shown in
Table 2.
It can be seen that the HWD module can significantly reduce the model size, model parameters, and required GFLOPs, which has the great advantage of being lightweight. When the HWD was used to replace the first C2f layer, the AP50 of the model increased by 0.7%, but with the continuous embedding of the HWD, the AP50 decreased. The reason is that the HWD can improve the expression of shallow spatial features such as edges and textures in the initial stage of the network and provide more effective feature input for subsequent layers. However, the description of deep feature maps is more dependent on semantic features, and the HWD is weak in extracting semantic features. Therefore, the continuous use of the HWD to replace the C2f layer will destroy the compatibility and consistency of the network structure, and thus reduce the detection accuracy.
- (2)
The embedding method of CA
To discuss the effectiveness of different embedding methods of the CA, we designed two sets of comparative experiments based on the Group A experiment. The first method is to take the CA as a single layer of the network (Group D experiment) and embed it into the last layer of the network’s detection head, enhancing the detection head’s focus on important features. The second method is to fuse the CA with a C2f layer in the backbone to constitute a C2f_CA module (Group E experiment, ours). The comparative experimental results are shown in
Table 3.
It can be seen that the AP50 of Group E is 0.5% higher than that of Group D. This is because C2f_CA can make full use of spatial information to enhance feature representation in the early stage of feature extraction and then make more effective use of global context information to generate richer spatial concern graphs on feature maps. In the follow-up inspection process, it is more helpful to accurately locate the destroyed building.
5.2. Ablation Experiment
Here, we design a group of ablation experiments to examine the effect of each component, as shown in
Table 4. Experimental parameters were set as epochs: 100; initial learning rate: 0.01; IoU threshold: 0.5; batch size: 16; input image size: 640 × 640; the optimizer adopts SGD; no pre-training weights are used.
It can be seen that adding the HWD, C2f_CA, and LDU separately improves the detection accuracy of the network, but the reasons are different. By retaining more spatial details at the beginning of the network calculation, the model with the HWD improved recall by 3.0%, indicating that it learned to more fully express the characteristics of the destroyed building. The model with C2f_CA can focus on the accurate expression of features, ensure the network learns more robust features, and improve the precision of the network. The introduction of the LDU can help the model to distinguish feature edges more effectively in the later stage, mainly in the improvement of recall.
In addition, in the ablation experiment, we observed that after adding the HWD, CA, and LDU to the baseline successively, the AP50 is successively increased by 0.7%, 1.8%, and 2.5%. It proves that the HWD module provides more spatial details for the subsequent feature extraction, and on this basis, C2f_CA can focus more on the expression of important features, and LDU can further distinguish the boundary distinction during the sampling process on the feature map. The information exchange of each module plays an active role in improving the detection accuracy of destroyed buildings.
At the same time, it is observed that the introduction of each module does not bring too much parameter number and calculation overhead, the model size is basically maintained at about 6.0 M, the number of model parameters is only increased by 0.59% compared with that of the baseline, and GFLOPs decreases from 8.2 to 7.9. It shows that our method can significantly improve the detection accuracy of destroyed buildings, as well as limit the increase in parameter number and algorithm complexity.
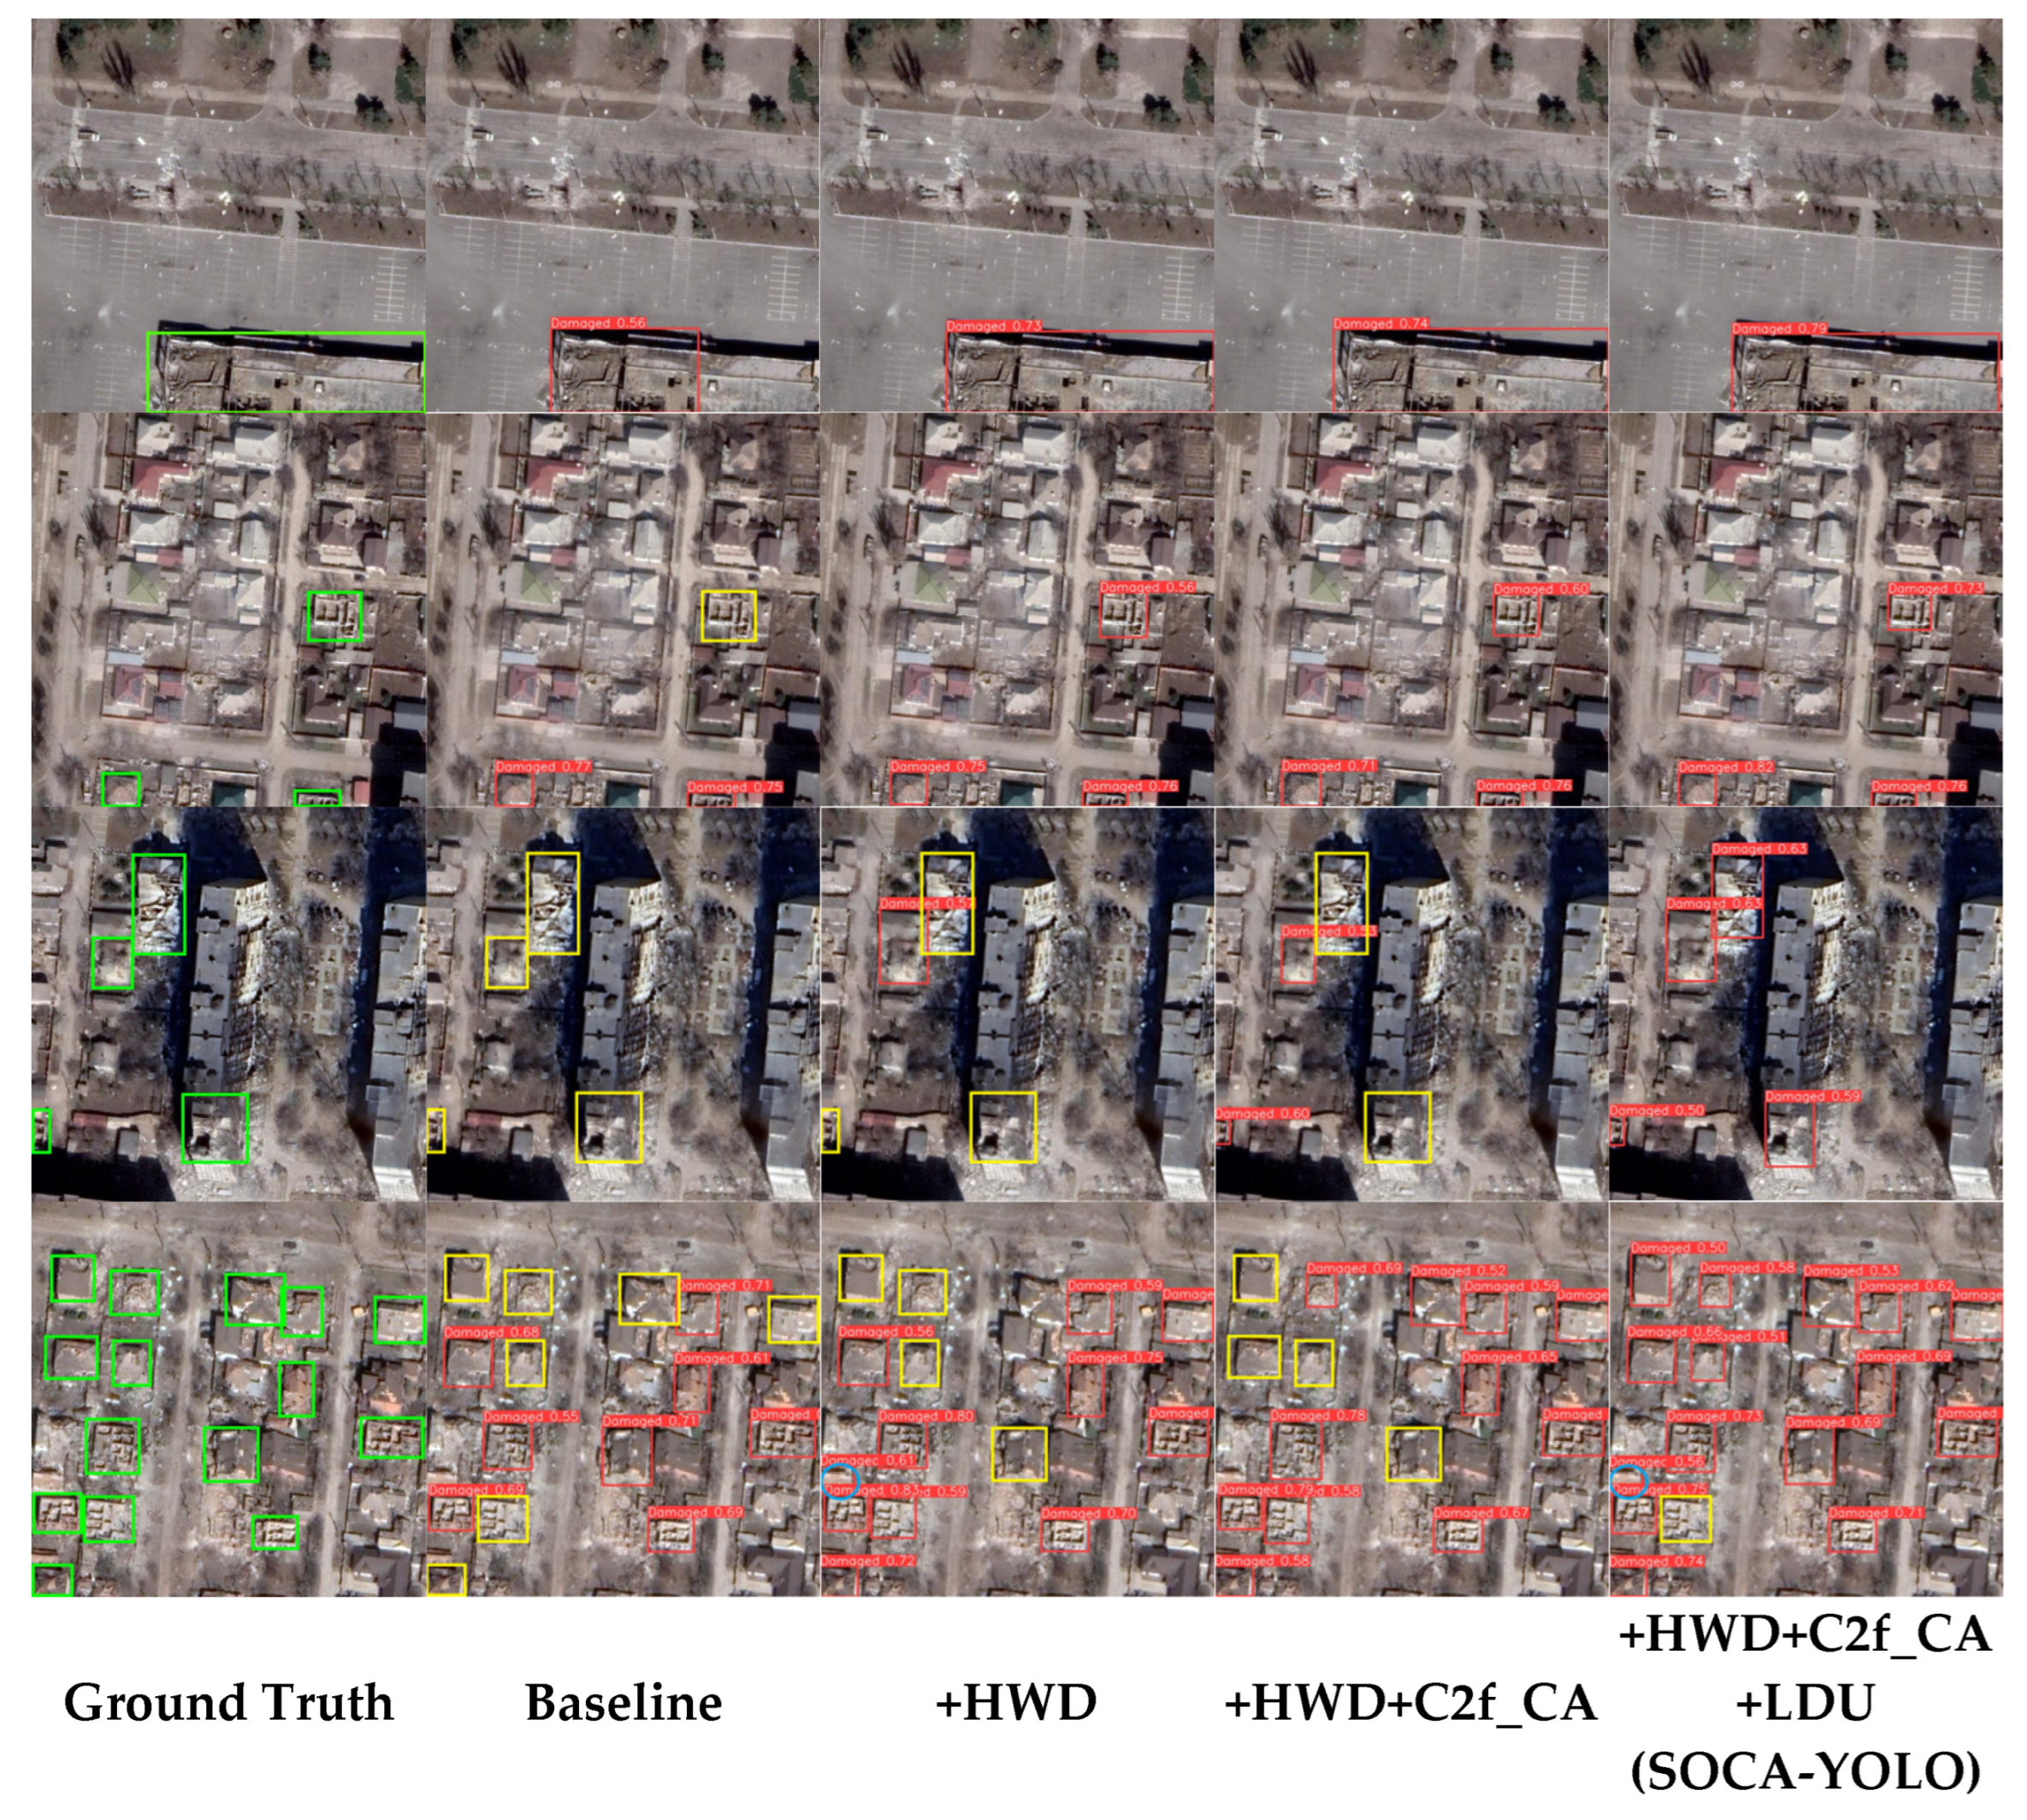
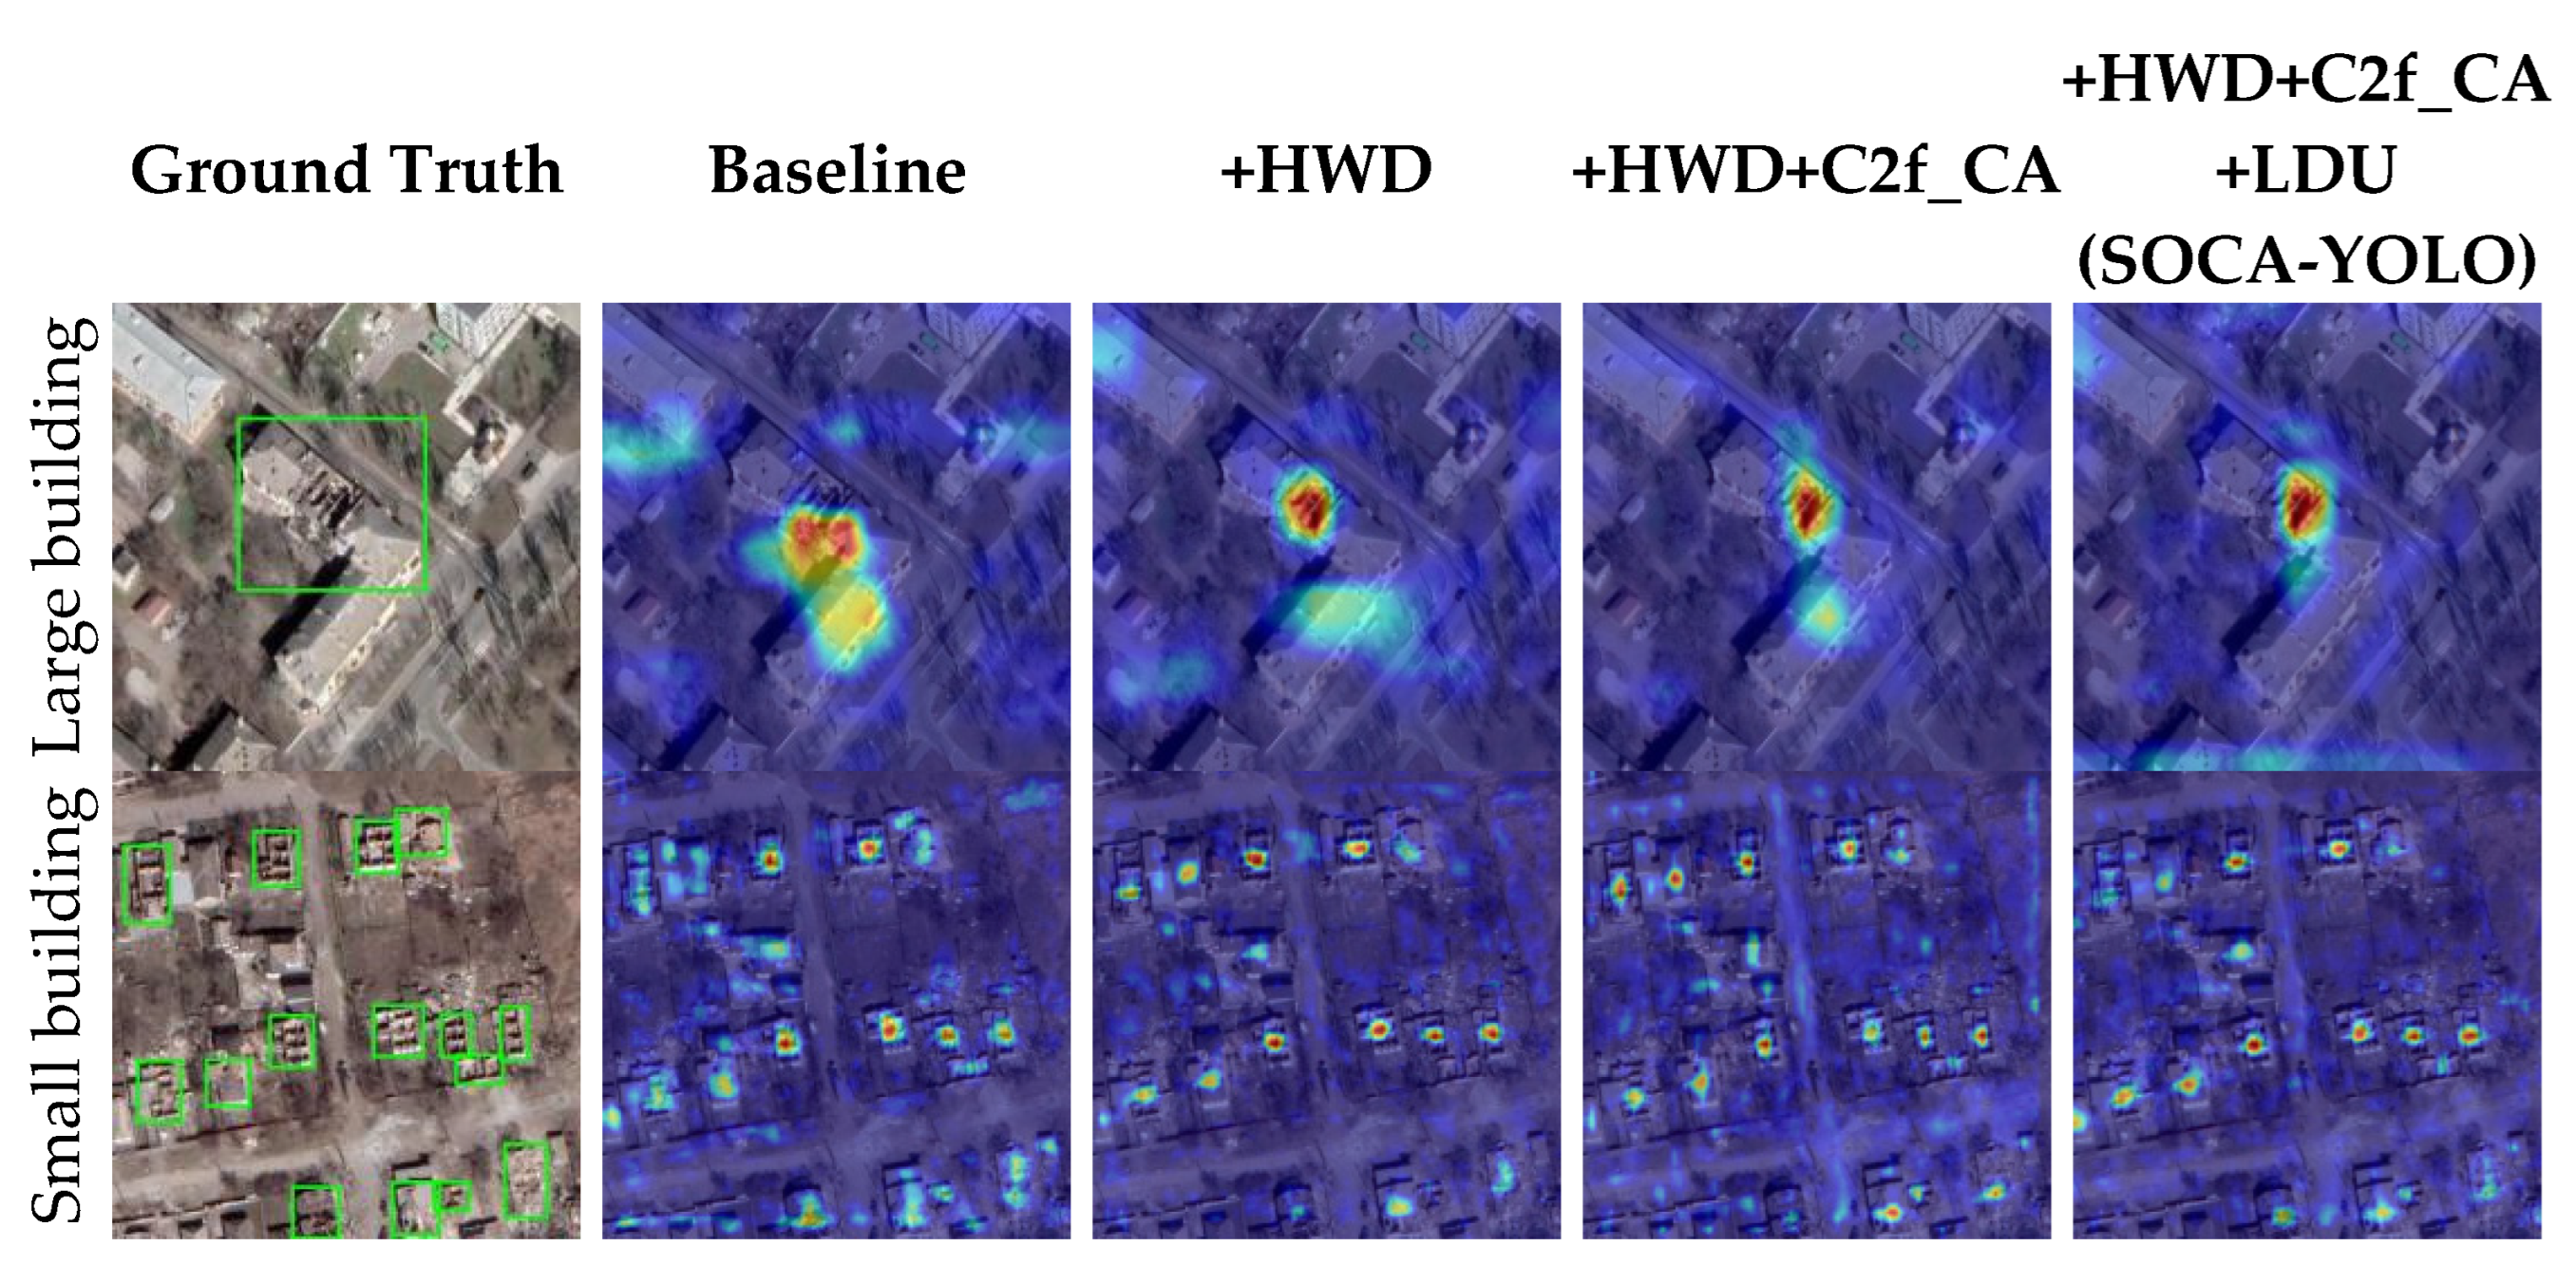
5.3. Visual Inspection
Figure 10 shows the detection results of each model in the ablation experiment under different scenarios. For large individual buildings, the improved model can more fully assess the size of the box, envelop destroyed buildings more completely, and improve confidence. Furthermore, it can also improve the recall rate in dense and small destroyed building scenes.
To illustrate the influence of each module on the attention area and degree of the network, we visualize the attention of the network detection layer for different sizes of objects, as shown in
Figure 11.
For large destroyed buildings, we visualize the attention of the large-scale object detection layer. It is found that the attention of the baseline has inaccurate positioning and excessive noise response. With the HWD, the noise response near the object is significantly reduced. With the C2f_CA and LDU, the attention is further focused on the destroyed area, indicating that the introduction of each module can make the network pay more attention to the important features of the destroyed building area. In the detection of small destroyed buildings, heatmaps have the same form. Particularly, C2f_CA and LDU modules enable the network to reconstruct large images with more details on the basis of enhanced attention and improve the detection accuracy of small destroyed buildings.
5.4. Comparison with Other Methods
To evaluate the comprehensive performance of the proposed method in terms of detection accuracy, model size, and detection efficiency, we compared the current mainstream same model size YOLO series algorithms, including YOLOv3-tiny, YOLOv5-n, YOLOv6-n, et al. As shown in
Table 5. During the experiment, the parameter settings of each algorithm are consistent with those in
Section 5.2. From the comparison results, it can be seen that the AP50 of SOCA-YOLO reaches 0.73, which is 0.3% higher than that of the second-best model, YOLOv3-tiny, but the model volume is much smaller than it. Overall, SOCA-YOLO achieves a balance of model size, number of parameters, GFLOPs, and inference time while ensuring high-precision detection, and its comprehensive performance is the best.
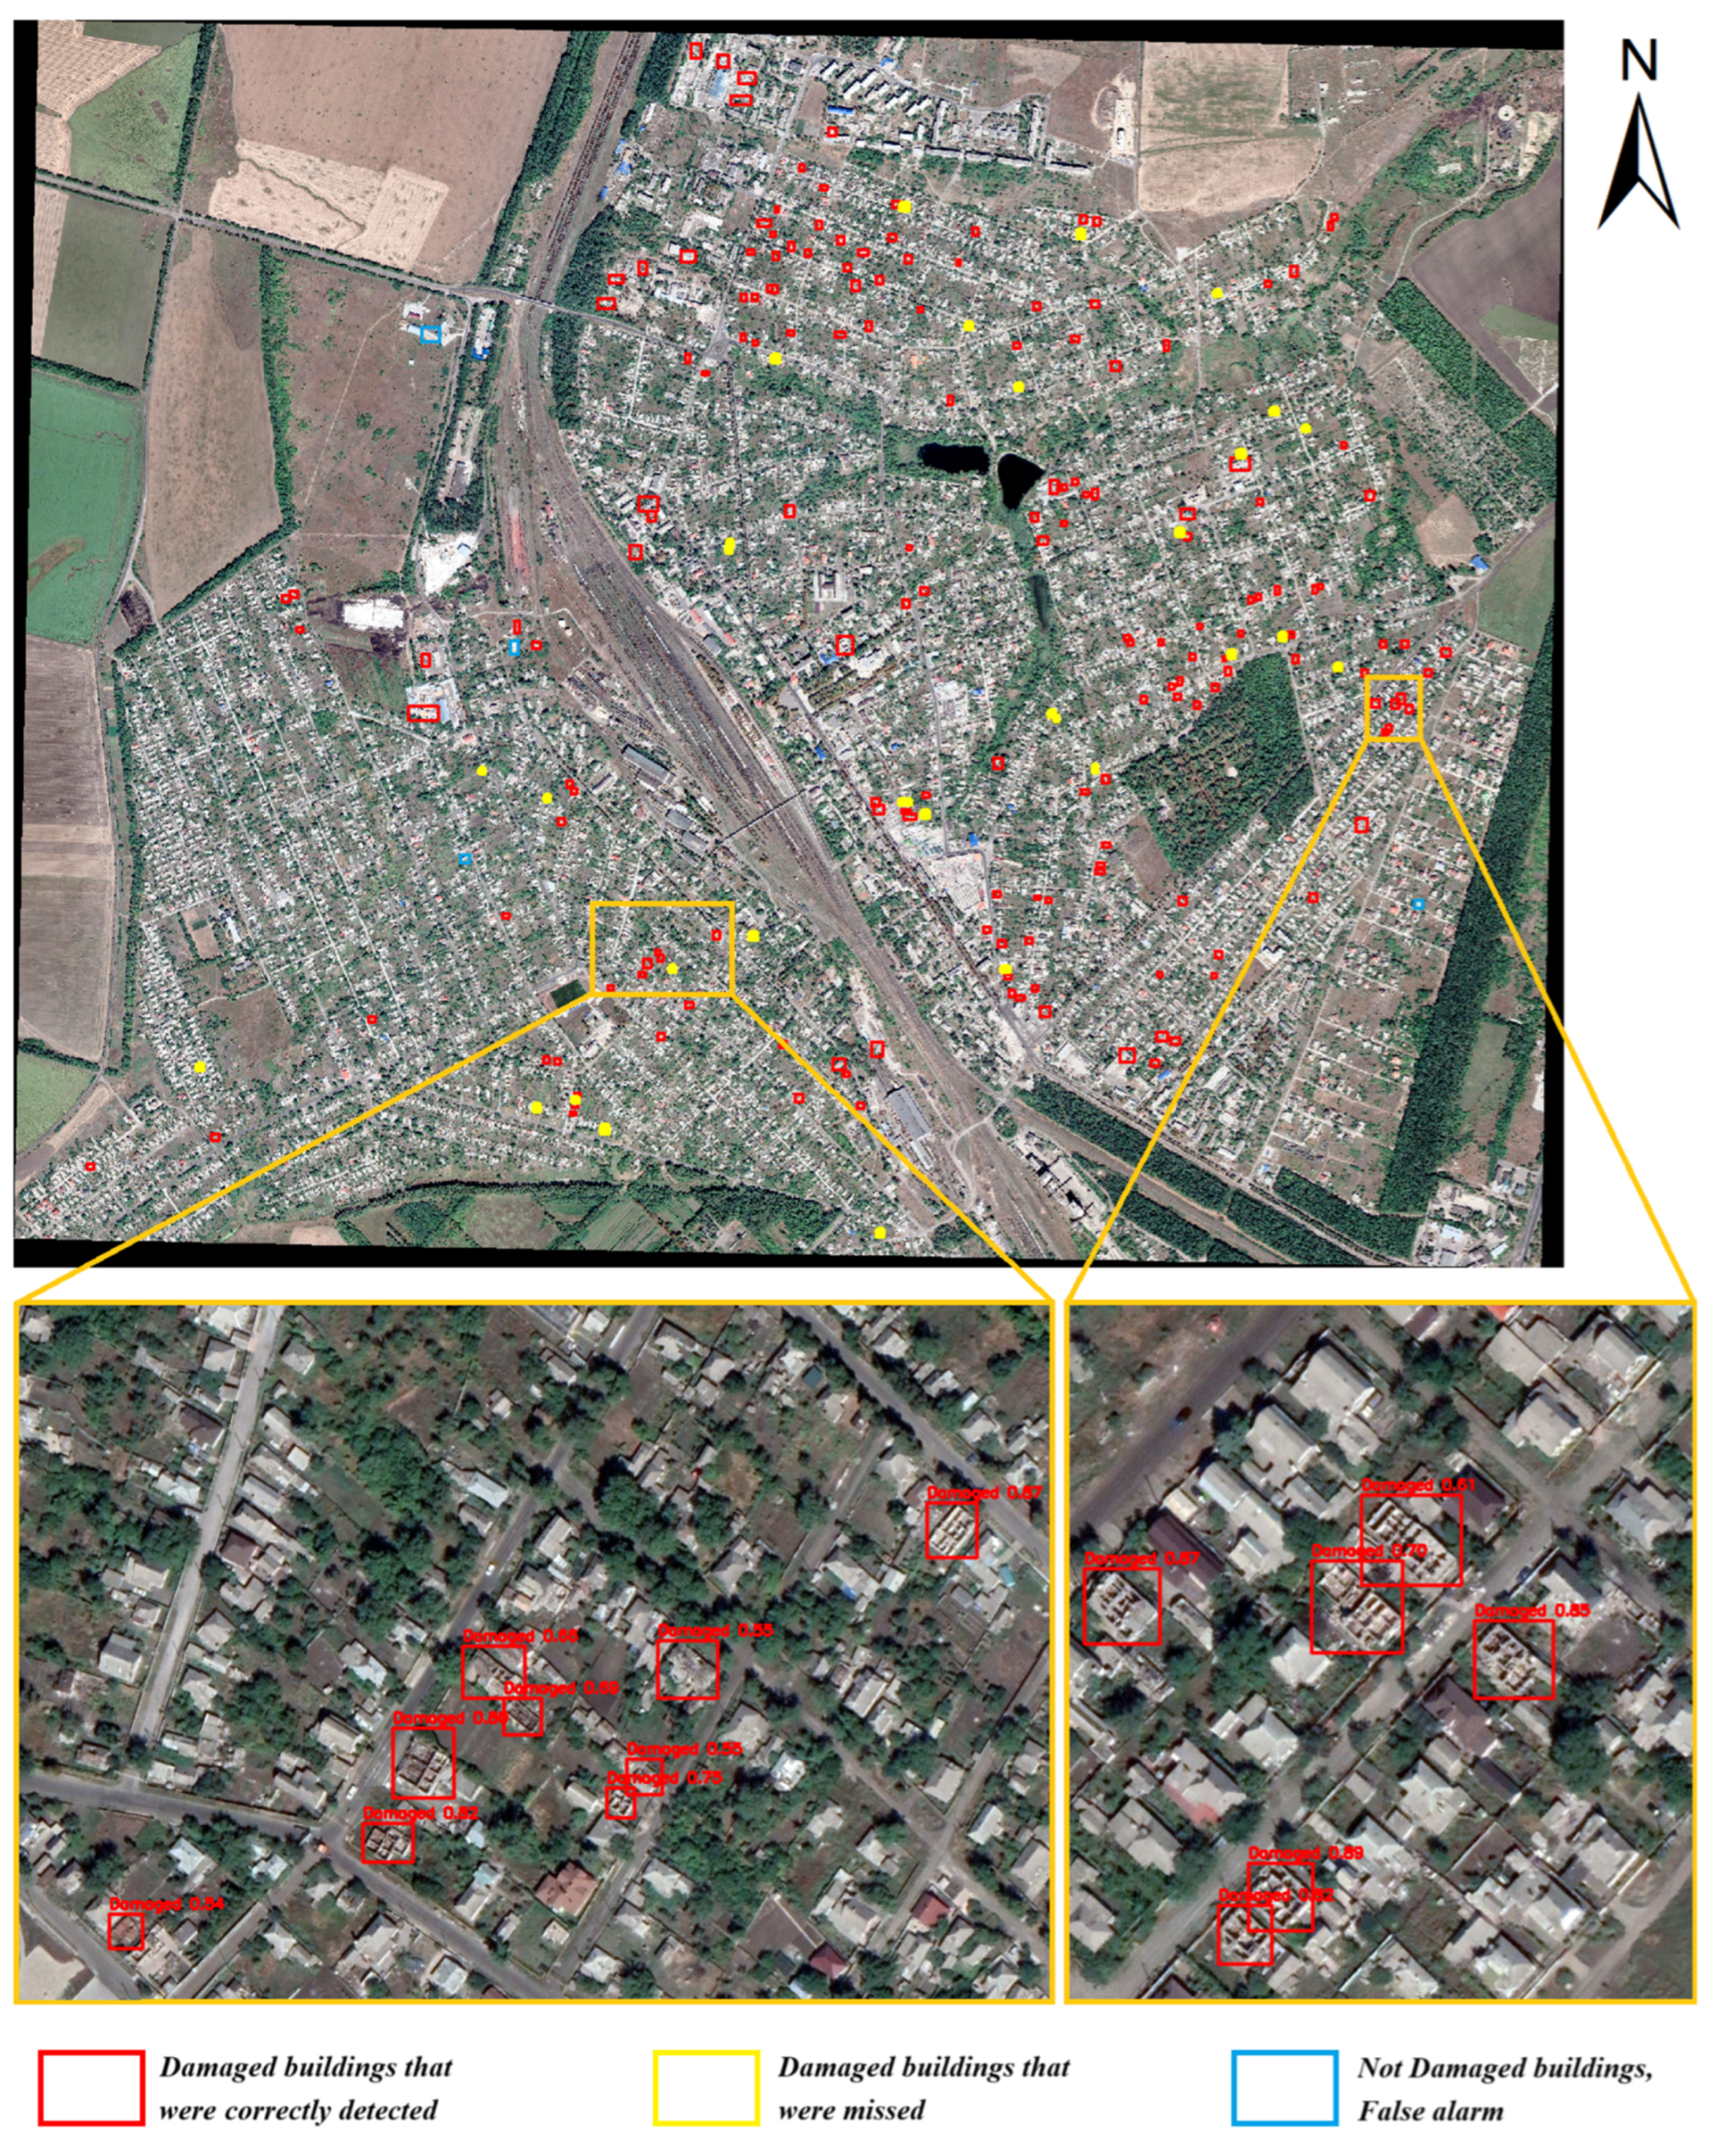
5.5. Generalization Ability Test
To test the generalization ability of the model on high-resolution remote sensing images outside the dataset, we selected high-resolution remote sensing images from the Vornovakha region of Ukraine as test data, which were also sourced from Google Earth. The image size was 34,318 × 27,634 and was taken on 2 September 2022, containing a large number of buildings destroyed by the war. In the process of the generalization ability test, a slice-assisted super reasoning strategy was adopted to conduct sliding window detection on the entire remote sensing image and Mosaic it into a large-scale image. The detection results are shown in
Figure 12, where the red boxes represent the correctly detected destroyed buildings, the yellow boxes represent the undetected destroyed buildings, and the blue boxes represent the false alarm objects. According to the results of the generalization ability test, as shown in
Table 6, the overall recall rate is 0.708, indicating that there is a certain number of missed tests. In addition, the missing objects were mostly small destroyed buildings (recall rate was 0.655), indicating that the detection ability of the model for small destroyed buildings needs to be improved. On the other hand, the overall precision is 0.986 with fewer false alarms, indicating that the model has good robustness for feature extraction of destroyed buildings. The comprehensive index F1 score is 0.824, which verifies that the proposed method has a certain generalization ability for the detection of destroyed buildings under different scenarios.
According to the visualization results of geospatial information, the destroyed buildings on 2 September 2022 were mainly distributed on the east side of the railway line. The main positions of the warring parties in the city were located on the east side of the railway line, and the destroyed buildings in the north and the south were especially concentrated. The above results show that the method proposed in this paper can provide an important reference for rapid disaster assessment and humanitarian relief.
6. Conclusions
In this study, we designed SOCA-YOLO, an object detection algorithm combining Haar wavelet downsampling, lightweight dynamic upsampling, and a coordinate attention mechanism to detect war-destroyed building objects in high-resolution remote sensing images. In the stage of feature extraction, Haar wavelet is used to decompose high-resolution remote sensing images in two dimensions to realize downsampling and retain the details of remote sensing images to a greater extent. In addition, coordinate attention is combined with C2f to make full use of spatial feature information, and a coordinate attention module is introduced in the early stage of feature extraction to achieve feature optimization and focus to a greater extent. Finally, a lightweight dynamic upsampling module is used in the feature fusion phase to further enrich and accurately detail information on the feature map.
To evaluate the effectiveness of the method, we collected high-resolution optical remote sensing images of the Mariupol region, Ukraine, and produced the world’s first datasets for the detection of buildings destroyed by war. The proposed method was verified by ablation experiments, and the validity and reasons for the embedding positions and methods of HWD and CA were discussed through multiple sets of comparative experiments. Compared with the classical deep learning object detection algorithm, the results show that the proposed method has better comprehensive performance in detection accuracy, model size, and inference speed.
It is worth noting that SOCA-YOLO mainly focuses on detecting individual destroyed buildings by making full use of spatial details and enhancing spatial perception. However, it still has some limitations: it is limited by the size and region of the training samples, the architectural styles of different countries and regions have obvious differences, and the generalization performance of the model needs to be further improved. In addition, the model has limited recognition of difficult objects, some destroyed buildings that look like ruins are still missed, and some structurally complex buildings are susceptible to false detection. In addition, the lightweighting and reasoning speed of the model need to be improved. In our following work, we will consider classifying destroyed buildings according to the degree of damage. By combining a feature recombination strategy and difficult object mining, fine-grained identification of buildings with different degrees of damage has become another exciting issue.


