Article

Transformer Architecture for Micromotion Target Detection Based on Multi-Scale Subaperture Coherent Integration

by
Linsheng Bu
,
Defeng Chen
*,
Tuo Fu
,
Huawei Cao
and
Wanyu Chang
School of Information and Electronics, Beijing Institute of Technology, Beijing 100081, China
*
Author to whom correspondence should be addressed.
Remote Sens. 2025, 17(3), 417; https://doi.org/10.3390/rs17030417
Submission received: 26 December 2024 / Revised: 20 January 2025 / Accepted: 24 January 2025 / Published: 26 January 2025
(This article belongs to the Special Issue Microwave Remote Sensing for Object Detection (2nd Edition))

Abstract

:
In recent years, long-time coherent integration techniques have gained significant attention in maneuvering target detection due to their ability to effectively enhance the signal-to-noise ratio (SNR) and improve detection performance. However, for space targets, challenges such as micromotion phenomena and complex scattering characteristics make envelope alignment and phase compensation difficult, thereby limiting integration gain. To address these issues, in this study, we conducted an in-depth analysis of the echo model of cylindrical space targets (CSTs) based on different types of scattering centers. Building on this foundation, the multi-scale subaperture coherent integration Transformer (MsSCIFormer) was proposed, which integrates MsSCI with a Transformer architecture to achieve precise detection and motion parameter estimation of space targets in low-SNR environments. The core of the method lies in the introduction of a convolutional neural network (CNN) feature extractor and a dual-attention mechanism, covering both intra-subaperture attention (Intra-SA) and inter-subaperture attention (Inter-SA). This design efficiently captures the spatial distribution and motion patterns of the scattering centers of space targets. By aggregating multi-scale features, MsSCIFormer significantly enhances the detection performance and improves the accuracy of motion parameter estimation. Simulation experiments demonstrated that MsSCIFormer outperforms traditional moving target detection (MTD) methods and other deep learning-based algorithms in both detection and estimation tasks. Furthermore, each module proposed in this study was proven to contribute positively to the overall performance of the network.

1. Introduction

In recent years, the rapid advancement in space technology has led to a significant increase in the number of various space objects, including satellites, space debris, and spacecrafts [1,2,3]. Among these, cylindrical targets, as a common structural form, have seen a notable rise in prevalence. The motion status of these objects in orbit directly impacts the safe operation of spacecraft and the efficient utilization of space resources. Consequently, timely and accurate detection of space targets, along with the estimation of their motion parameters, has become an essential prerequisite for ensuring the smooth progress of space activities.
Radar technology, with its high-precision velocity and range measurement capabilities and all-weather, all-time operational characteristics, has garnered significant attention in the field of space situational awareness. However, space targets are typically distant and small [4], leading to extremely low signal-to-noise ratios (SNRs) in the echoes, which significantly reduce the detection probability for traditional methods. A common approach to addressing this issue is long-time integration along the slow-time dimension, enhancing the SNR and thereby improving detection performance. Nevertheless, the high maneuverability of space targets or their rotational motion presents new challenges for effective signal integration. Specifically, high maneuverability can lead to signal energy dispersion across the range–Doppler unit (ARDU), which results in a low integration efficiency. Additionally, fluctuations in the amplitude and phase of scattering center echo, caused by micromotion, lead to signal decoherence and further hinder integration efficiency. To tackle these challenges, researchers continue to explore signal processing techniques and algorithms to promote deeper applications and developments of radar technology in space detection [5].
In previous research, long-time coherent integration techniques have primarily been categorized into two main types. The first type focuses on parameter search, which can effectively enhance integration performance under low-SNR conditions but is associated with relatively high computational complexity. Perry et al. [6] proposed the Keystone Transform (KT) algorithm, which decouples the relationship between range frequency and slow time through scaling transform. This technique effectively corrects first-order range migration caused by target velocity. Expanding on this, Su et al. [7] introduced the dechirp process to estimate target acceleration and compensate for phase discrepancies, eliminating first-order Doppler frequency migration. Li et al. [8] employed the fractional Fourier transform to not only remove Doppler frequency migration but also achieve coherent energy integration of the target. Additionally, Huang et al. [9] applied three-dimensional matched filtering in the range frequency and slow-time domain following KT, successfully decoupling range and slow time while correcting third-order range migration and compensating for Doppler frequency migration. However, KT processing often relies on interpolation, inevitably introducing interpolation loss and increasing computational load. In contrast, the Radon Fourier Transform (RFT), proposed by Xu et al. [10], achieves coherent integration for targets with first-order range migration through a joint search of range and velocity. Xu et al. demonstrated that, in a Gaussian white noise background, RFT serves as an optimal detector capable of maximum likelihood estimation [11]. Later, Xu et al. [12] further developed the generalized Radon Fourier transform (GRFT) algorithm, which, through multi-dimensional parameter search, constructs a matched filter to compensate for phase discrepancies in the extracted echo sequence. However, RFT integration outputs may be affected by blind speed sidelobes, increasing the false alarm rate (FAR) in target detection, while the multi-dimensional parameter search significantly raises GRFT’s computational costs. Building on these foundations, numerous KT and RFT variants have been proposed [13,14,15,16,17,18] in efforts to balance their respective advantages and limitations, thereby adapting these methods to different practical application scenarios.
Another approach is based on non-parametric search, which circumvents the search process by directly manipulating the correlation of the echo, thereby effectively reducing computational load, which makes it challenging to achieve the coherent integration of target echo energy in low-SNR environments. Zheng et al. [19] introduced the scaled inverse Fourier transform (SCIFT), which first uses frequency-domain autocorrelation to convert the echo into the range frequency and slow-time delay domain, followed by SCIFT to accumulate target energy. Niu et al. [20] proposed a fast algorithm based on the frequency domain, further optimizing computational efficiency. Additionally, Li et al. [21] applied sequence-reversing Transformation (SRT) along the slow-time dimension to achieve temporal correlation, correcting for range migration and enhancing energy integration. Zhang et al. [22] achieved energy integration and parameter estimation by computing the time-domain cross-correlation of adjacent echoes, which also significantly reduces computational complexity. Moreover, to achieve long-time coherent integration for targets with high-order motion parameters, researchers have combined parametric and non-parametric search techniques to correct the range migration of different orders. For example, Huang et al. [23] first applied KT to correct first-order range migration, then used the second-order Wigner–Ville distribution transform to estimate target acceleration and compensate for Doppler frequency migration. Zhang et al. [24] employed second-order KT (SKT) to correct second-order range migration and computed the symmetric instantaneous autocorrelation function of the corrected echo to address range and Doppler frequency migration. Li et al. [25] successively corrected third-, first-, and second-order range migration using time-reversal transformation and SKT, ultimately performing coherent integration with the Lv distribution. However, when the target contains multiple scattering centers and exhibits micromotion, the echo becomes highly complex [26]. In this case, the motion of each scattering center can no longer be accurately described by simple low-order polynomials. The application of higher-order motion models sharply increases the number of parameters, making parameter search methods impractical. Furthermore, during autocorrelation operations, multiple scattering centers tend to produce cross-terms, which degrade integration performance.
Recently, radar moving target detection (MTD) methods based on deep learning have gained popularity. Wang et al. [27] was one of the first to analyze the potential applications of deep neural networks (DNNs) in radar target detection (RTD), designing a detector based on DNNs and comparing it with traditional detectors. Jiang et al. [28] proposed a multi-task model based on convolutional neural networks (CNN), which leverages both time and frequency information to detect and localize targets in a multi-dimensional space of range, velocity, azimuth, and elevation. Wang et al. [29] introduced a dual-head CNN with one head for binary classification to determine target presence and another for estimating target offset, incorporating a non-maximum suppression mechanism at the network output to effectively reduce FAR. Subsequently, Tian et al. [30] proposed a fully convolutional network for rapid detection across the whole range-Doppler map and achieved accuracy comparable to the previous methods. The methods mentioned above typically assume a simple point target model. Extracting micromotion features remains a significant challenge in RTD. Su et al. [31] used time-frequency images as inputs to a CNN for detecting maritime targets under varying sea states. Research on targets with micromotion has predominantly focused on small unmanned aerial vehicles (UAVs). Sun et al. [32] introduced an LSTM-based detection, classification, and localization method for small UAVs utilizing micro-Doppler signatures (mDSs), but traditional methods were still used for feature extraction. In the case of highly maneuverable space targets, translational and micromotion information are coupled within the Doppler domain and are difficult to separate. Yang et al. [33] developed a UAV detection method based on the Transformer architecture. They first designed a complex encoder specifically for range-pulse echo data and employed the Transformer to extract both Doppler shift and mDSs simultaneously, achieving improved detection performance and measurement accuracy.
In space target detection, the signals of micromotion targets exhibit significant non-uniformity and sparsity in both intensity and spatial distribution, posing challenges for traditional feature extraction methods. The attention mechanism in Transformer effectively addresses this issue by adaptively focusing on key feature regions and allocating more computational resources to prominent scattering center signals, thereby enhancing the efficiency and accuracy of feature extraction. Furthermore, target echoes exhibit long temporal dependencies, which traditional recurrent neural network methods struggle to model due to gradient vanishing issues and low computational efficiency. In contrast, the Transformer, which does not rely on a recursive structure, offers the capability to efficiently process long sequences and enables superior modeling of the dynamic temporal variations in target echo signals [34].
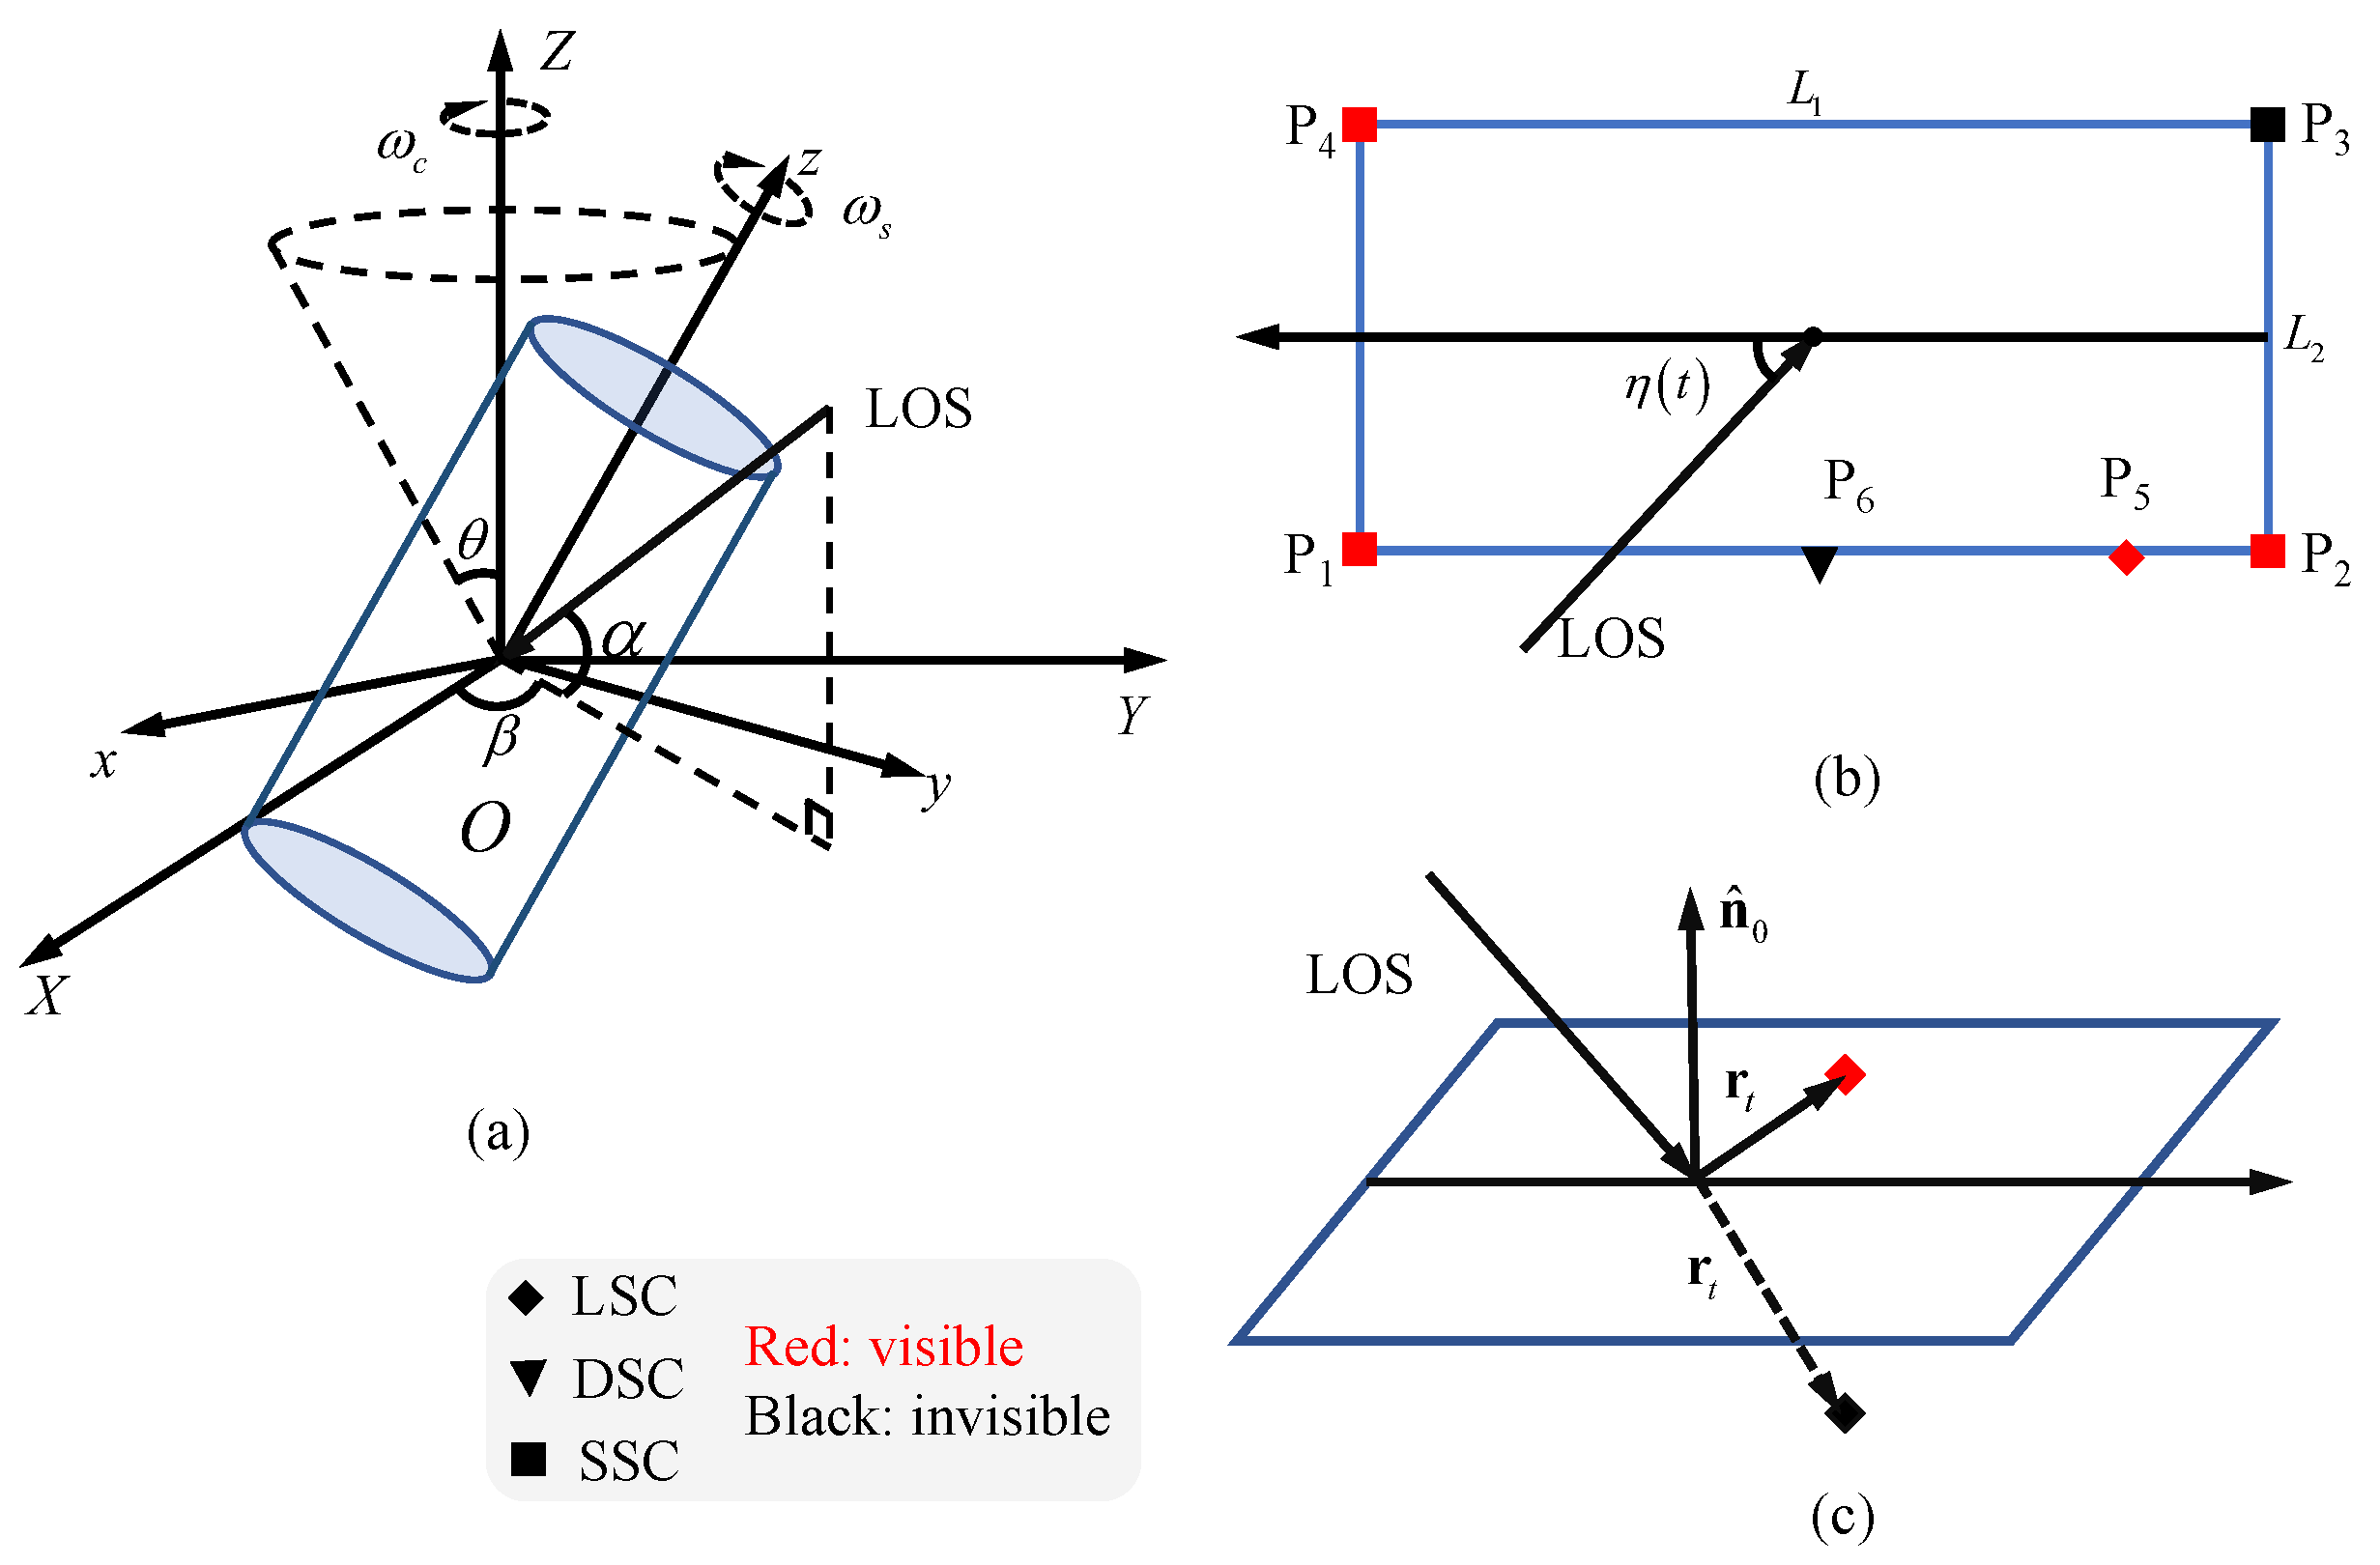
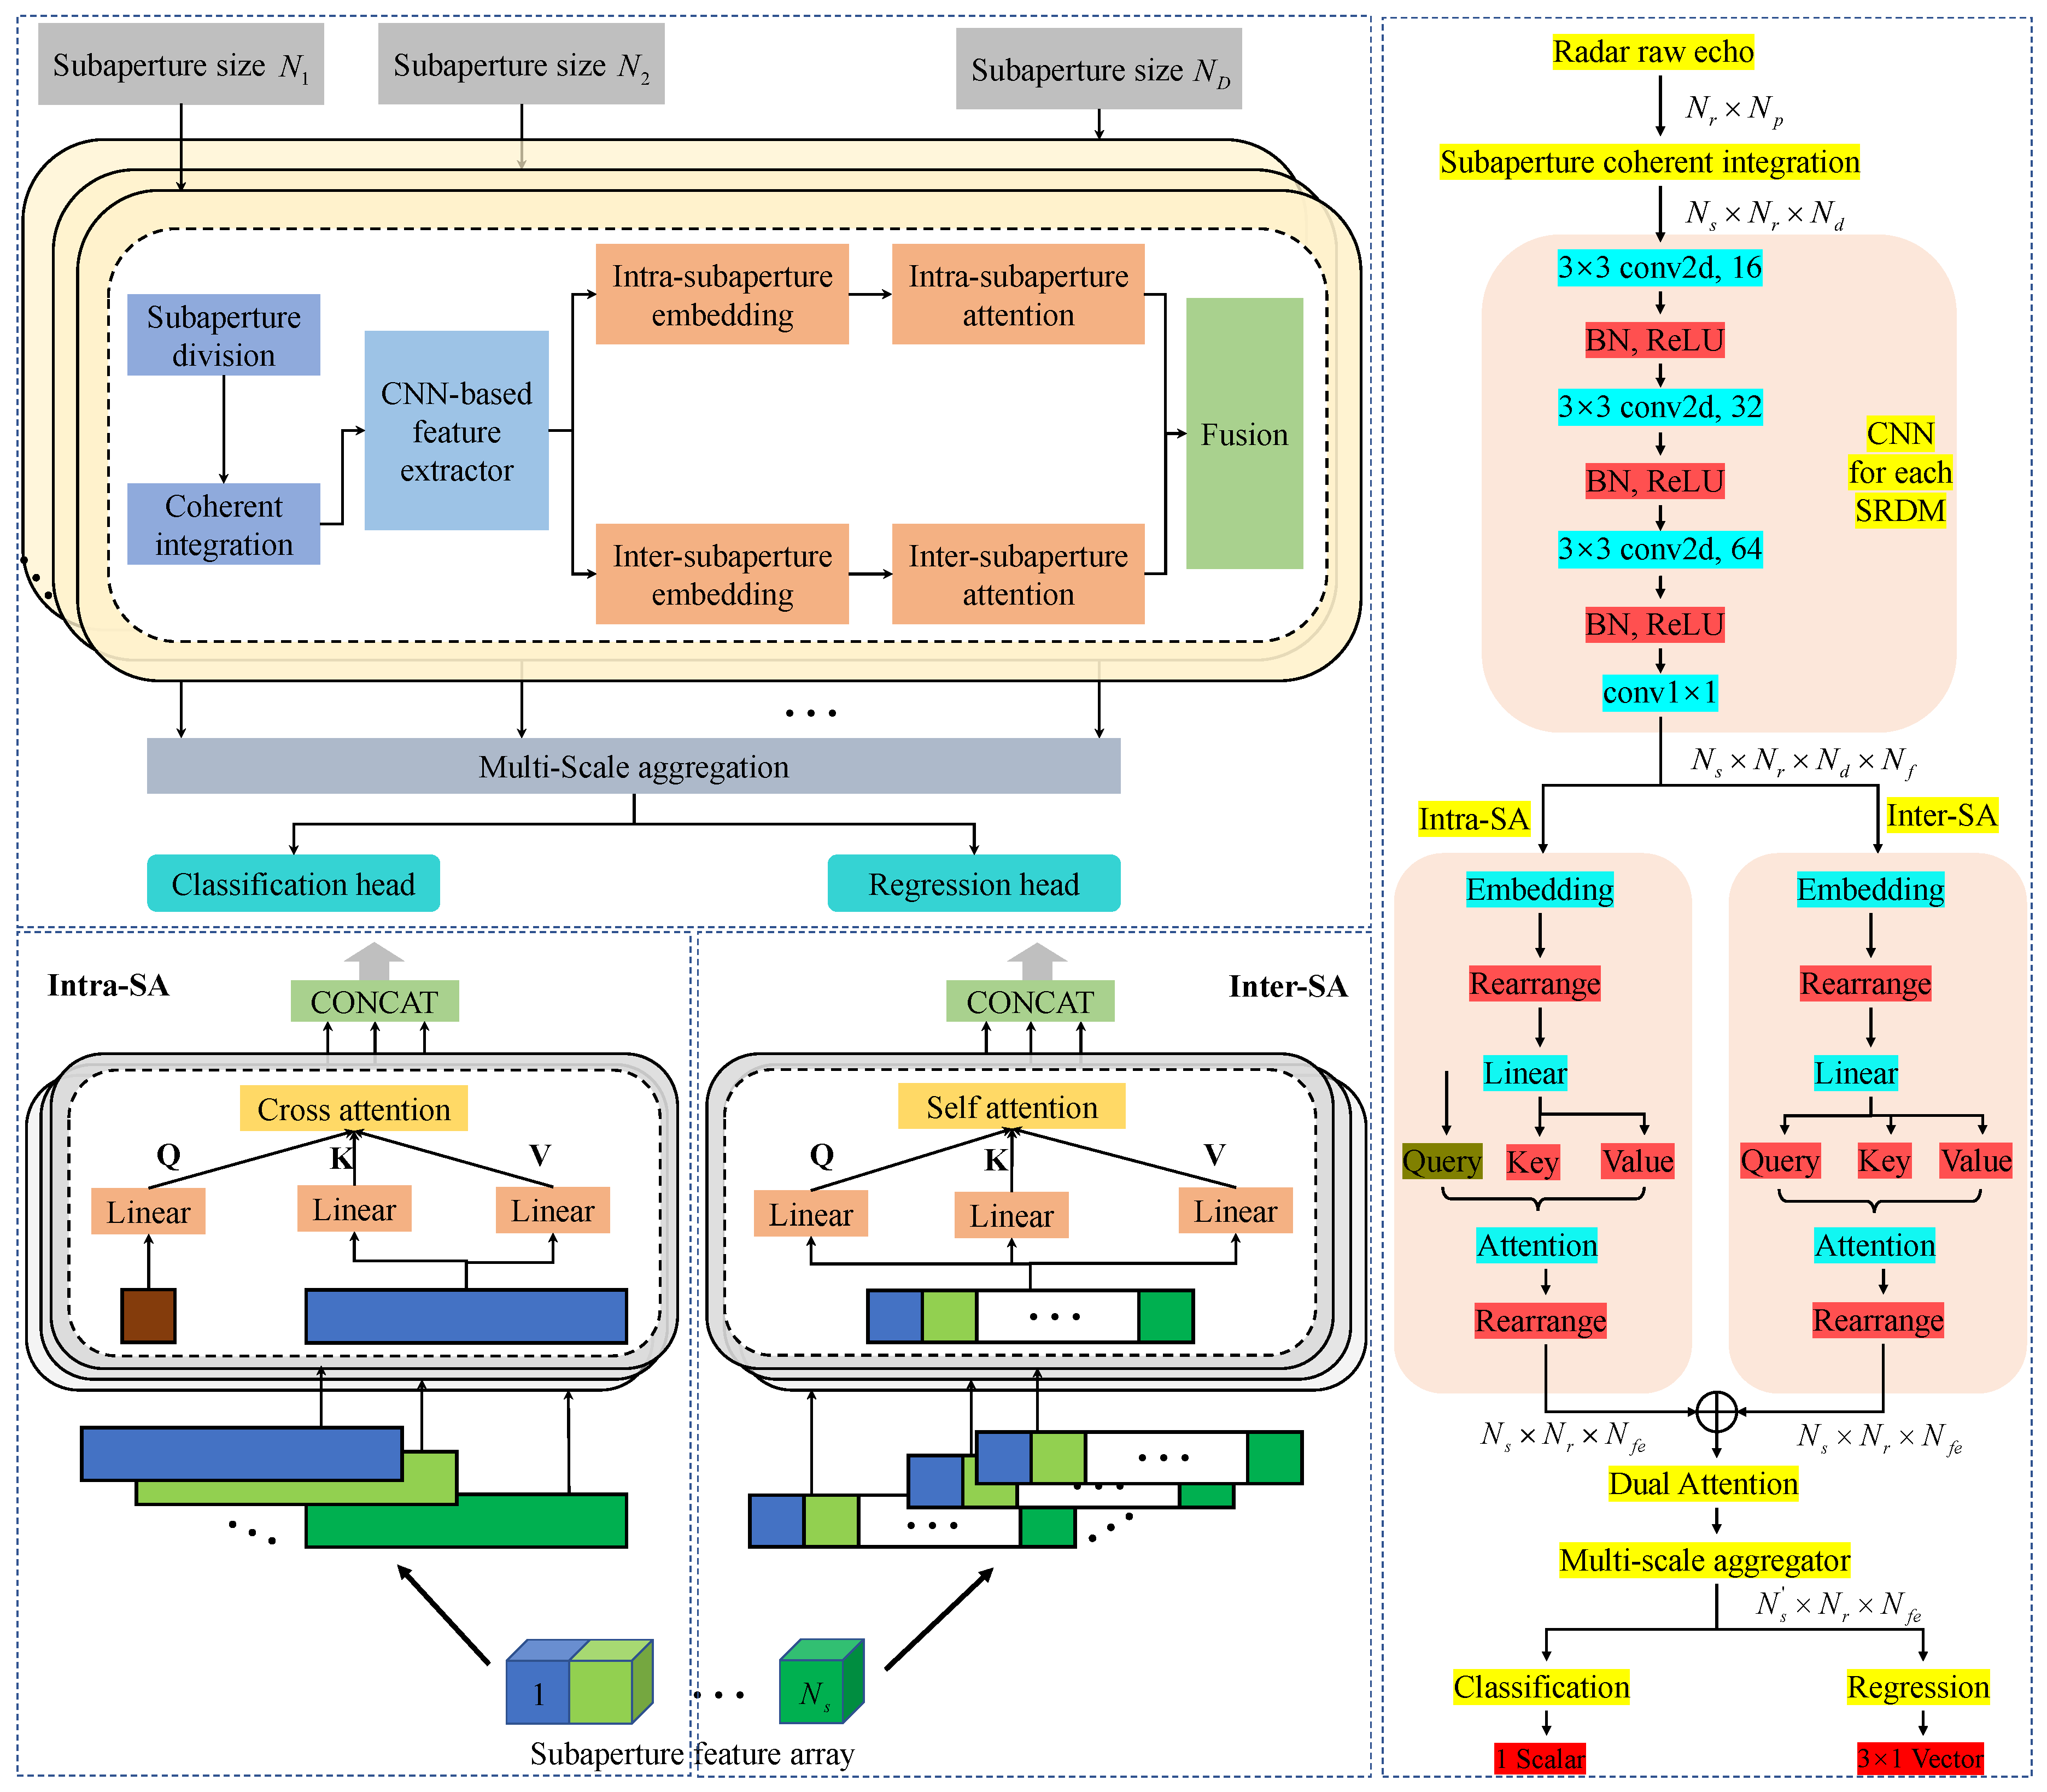
In this paper, we proposed a novel end-to-end approach called multi-scale subaperture coherent integration Transformer (MsSCIFormer) for detecting and estimating the parameters of cylindrical space targets (CSTs). The core of this method lies in the precise modeling of the scattering centers of CSTs, from which accurate signal models are derived. Furthermore, we designed a multi-scale subaperture processing module that segments the long-time echo along the slow-time dimension into multiple subapertures of varying scales and performs coherent integration within each. This strategy not only significantly enhances the SNR but also effectively mitigates the ARDU of scattering center energies. Building on this, a CNN-based feature extractor was introduced to perform deep feature extraction from each subaperture range-Doppler map (SRDM). Subsequently, a Transformer with a dual-attention mechanism was employed to process these feature arrays, efficiently fusing spatial and temporal characteristics of the target’s scattering centers. By aggregating multi-scale fused features, we utilized classification and regression heads to achieve precise target detection and accurate motion parameter estimation. The proposed method offers several key advantages:
(1)
The detailed modeling of scattering centers and the accurate derivation of signal models provide a solid foundation for subsequent processing, improving both target detection and parameter estimation accuracy.
(2)
The design of the multi-scale subaperture processing module addresses the ARDU of scattering centers while preserving the mDS and enhancing the robustness and applicability of the method.
(3)
The combination of CNN feature extraction and the Transformer’s dual-attention mechanism deeply integrates spatial and temporal features of scattering centers and, through multi-scale feature aggregation, significantly boosts overall detection and estimation performance.
The rest of this paper is organized as follows. In Section 2, we conduct an in-depth analysis of the scattering center variation patterns of a typical micromotion cylindrical space target and provide precise signal modeling. Section 3 offers a comprehensive overview of the MsSCIFormer architecture. In Section 4, the performance of MsSCIFormer is validated through a series of simulation experiments, including comparative analysis, ablation studies and robustness analysis. Finally, a summary and conclusion are presented in Section 5.

2. Theoretical Background

In this section, we begin by analyzing the micromotion characteristics of CSTs, focusing on the variation in micro-Doppler modulation in relation to the distribution of different scattering centers. Following this, we address the occlusion effects among the various scattering centers.

2.1. Typical Micromotion and Scattering Centers

The reference coordinate system O X Y Z and the local coordinate system O x y z are defined based on the target centroid O in Figure 1a. The O X Y Z remains time-invariant, whereas the O x y z varies according to the micromotion of the target. The axes, denoted as O z and O Z , represent the target’s precession axis and symmetry axis, respectively. The angle between these two axes is defined as the precession angle θ , with an associated precession angular velocity of ω c . Additionally, the target exhibits spin around its symmetry axis with a spin velocity of ω s . The incident angles, denoted as α and β , correspond to the line of sight (LOS), with the unit vector along the LOS defined as n = cos α cos β , cos α sin β , sin α T [26,35].
Typically, the scattering centers of a cylindrical target include sliding scattering centers (SSCs) located at the edge of the cylinder’s base, local scattering centers (LSCs) fixed on the target, and distributed scattering centers (DSCs) formed by reflections from the cylindrical surface [36,37]. As shown in Figure 1b, points P 1 to P 4 represent SSCs. Their positions correspond to the intersection of the LOS projection on the base of the cylindrical target and its edge. Consequently, these scattering centers slide along the edge of the base as the angle η t between the LOS and the target’s symmetry axis changes. The symmetry axis in O X Y Z can be expressed as
l r = R c t · R s t · R i n i t · l 0 ,
where l 0 = 0 , 0 , 1 T is the expression of the symmetry axis in O x y z , R i n i t represents the initial rotation matrix, which rotates θ around the O x axis from the initial local coordinate system, and R s t and R c t are the spinning matrix and coning matrix, respectively. The rotation matrices are expressed as
R i n i t = 1 0 0 0 cos θ sin θ 0 sin θ cos θ ,
R s t = I + sin ω s t E s + 1 cos ω s t E s 2 ,
R c t = I + sin ω c t E c + 1 cos ω c t E c 2 ,
where E s and E c are skew-symmetric matrices determined by the unit rotation vector. Then, the angle η t can be calculated by
η t = π arccos l r · n , η t 0 , π .
The radial distance trajectory of points P 1 to P 4 during precession, as determined by the geometric relationships in Figure 1b, can be expressed as
R M 1 4 t = 1 2 1 1 1 1 1 1 1 1 L 1 cos η t L 2 sin η t ,
where R M 1 4 t = [ R M 1 t , , R M 4 t ] T , L 1 is the length, and L 2 is the base diameter of the cylindrical target.
For the LSC at point P 5 in Figure 1b, its position in O x y z is fixed, denoted as r p = x , y , z T . Therefore, the slant range during precession is represented as
R M 5 t = r t T · n = R c t · R s t · R i n i t · r p T · n ,
where r t is the position vector of point P 5 in O X Y Z at time t.
Next, we consider the DSC of the CST. Due to the relatively limited observable range of the DSCs, this type of scattering center is often disregarded. However, the scattering intensities of the DSCs are typically tens to hundreds of times stronger than those of LSCs or SSCs. Therefore, it is essential to include DSCs in the multi-pulse integration process. As illustrated in Figure 1b, point P 6 represents the DSC formed by reflections from the cylindrical surface. Given the limited observable range of this scattering center, its radial distance is assumed to remain constant, with R M 6 t = L 2 / 2 .

2.2. Signal Model with Scattering Center Modulation

The narrowband linear frequency modulation signal transmitted by the radar is expressed as
s T ( t ) = rect t T p exp j 2 π f c t + j π μ t 2 ,
where rect · denotes the rectangular window function, and T p , f c , and μ represent the pulse width, carrier frequency, and chirp rate, respectively. After coherent detection, the expression for the received signal is given by
s R τ , m = i ρ i h i m r e c t τ 2 R i m 2 R i m c c T p exp j π μ τ 2 R i m c 2 exp j 4 π λ R i m ,
where τ represents fast time, m denotes slow time, c is the speed of light, λ represents the wavelength of the transmitted signal, and ρ i , h i ( m ) , and R i ( m ) correspond to the scattering intensity, visibility function, and radial distance of the i-th scattering center, respectively. Additionally, h i ( m ) represents the rectangular window function for the scattering center’s visible time. By performing pulse compression along the fast-time dimension on Equation (9) and substituting τ = 2 r 2 r c c , the range-pulse signal is obtained as
s r , m = i ρ i h i m s i n c 2 B c r R i m exp j 4 π λ R i m .
Here, ρ i denotes the scattering intensity of the i-th scattering center after pulse compression, and B represents the bandwidth of the transmitted signal.
Without loss of generality, the following assumptions are made: (1) After compensating the echo signal with the prior lead trajectory information, some translational motion remains, denoted as Δ R T m = Δ R 0 + Δ v 0 m + 1 2 Δ a m 2 , where Δ R 0 , Δ v 0 , and Δ a are typically the estimators of the required trajectory information. (2) Under narrowband observation conditions, the target’s micromotion only results in Doppler cell migration without causing range cell migration. Accordingly, Equation (10) can be rewritten as follows:
s r , m = s i n c 2 B c r Δ R T m exp j 4 π λ Δ R T m · i ρ i h i m exp j 4 π λ R M i m .

2.3. Visibility Analysis of Scattering Centers

The observed attitude of the target varies due to micromotion, leading to changes in the visibility of scattering centers [38]. For instance, in the monostatic observation, LSCs in shadowed regions are not visible to the radar; the visibility of DSCs is only limited to a narrow range, specifically when the radar LOS vector is nearly perpendicular to the cylindrical surface. In this subsection, the visibility of scattering centers on the CST is analyzed.
As illustrated in Figure 1b, the SSCs P 1 and P 2 remain continuously visible throughout the precession. In contrast, P 3 and P 4 are occluded when the LOS illuminates from opposite directions. Therefore, the visibility conditions for P 3 and P 4 are defined by π / 2 η t < π and 0 < η t π / 2 , respectively. Accordingly, as shown in Figure 2b, the time-frequency curves (TFCs) of P 3 and P 4 alternate in their appearance.
For the LSC P 5 , occlusion by the target body must be considered. As depicted in Figure 1b, this scattering center is visible when located on the illuminated side of the target. The visibility condition is given by r t T · n ^ 0 0 , where n ^ 0 = n × l r × l r represents the normal vector of the illuminated cross-section, oriented towards the illuminated side. Figure 2b shows the observation of P 5 is periodic and intermittent.
The DSC P 6 is visible only when the radar LOS vector is nearly perpendicular to the cylindrical surface, with its visibility condition specified as π / 2 ε η t < π / 2 + ε . Here, ε denotes the observable range of the DSC, which is inversely proportional to the electrical length of the cylinder, L 1 / λ . As shown in Figure 2b, the DSC appears as a vertical line on the time-frequency diagram, with the line length proportional to the size of the scattering center. Furthermore, the scattering intensity of the DSC is significantly greater than that of both SSCs and LSCs. Overall, the visibility conditions of the scattering centers can be found in Table 1.
Moreover, in the observation of multiple targets, the echoes from any single target are intermittent, as radar resources typically necessitate alternate monitoring of each target. The time-frequency diagram for this scenario is shown in Figure 2c, where gaps in the TFC are evident due to the intermittent nature of the observations.

3. Methodology

Previous deep-learning-based methods for RTD have typically considered targets as point objects, which appear as peaks in range-Doppler maps and can be detected and parameterized by annotating the bounding box. However, when targets have translational motions and micromotions, the echoes of scattering centers are affected by ARDU effects, causing energy to spread in the range-Doppler maps. This diffusion degrades detection performance and reduces parameter estimation accuracy. Different from previous methods, the proposed method divides target echoes into subapertures of varying sizes and performs coherent integration and feature extraction within each subaperture. This approach not only accumulates the energy of scattering centers separately but also preserves the target’s mDS. Additionally, a dual-attention multi-scale Transformer is introduced to effectively capture the spatial and temporal characteristics of the target’s scattering centers, facilitating both binary classification and motion parameter regression. Figure 3 illustrates the framework of the proposed algorithm, with detailed descriptions of each module provided below.

3.1. Coherent Integration in Subaperture

Subaperture processing is a commonly employed method for addressing the effects of ARDU [15,39]. For a given observation, let s n , m C N r × N p denote the discretized range-pulse echo, where N r and N p represent the number of range units and pulses, respectively, as shown in Figure 4a. Subaperture processing begins by segmenting the range-pulse echo along the pulse dimension into N s = N p / N d subapertures of equal size N d . Consequently, the echo of the l-th subaperture can be expressed as
s l d n , m = s n , m + l 1 N d , m = 1 , , N d , l = 1 , , N s ,
where, the superscript d corresponds to the subaperture size N d . Following this, coherent integration is performed within each subaperture by applying a Fourier transform, yielding the magnitude to obtain the SRDMs, as follows:
S l d n , f m = F m s l d n , m , S l d R N r × N d ,
where f m represents the Doppler frequency, and F m · denotes the Fourier transform along the pulse dimension. Figure 4b,c illustrates the segmentation process and subaperture coherent integration, where the energy of scattering centers is accumulated within each subaperture independently. As shown in Figure 4c, a single-frame SRDM reveals spatial dependencies among multiple scattering centers on the target, while multi-frame maps illustrate temporal dependencies during micromotions. Finally, the SRDMs are concatenated to form a preprocessed three-dimensional data cube:
S d = Concat S 1 d , , S N s d , S d R N s × N r × N d .

3.2. CNN-Based Feature Extractor

A multi-layer CNN is utilized to extract high-dimensional features from each SRDM while avoiding confusion among features from different subapertures. Initially, a new dimension is added to the three-dimensional data array S d , adjusting its size to N s × 1 × N r × N d . Convolutional operations are then applied to each SRDM to obtain high-dimensional feature representations X R N s × N f × N r × N d , where N f is the feature dimension. Finally, these feature arrays are rearranged into N s × N r × N d × N f .
It is essential to maintain a consistent number of range units during feature extraction from the SRDMs to ensure accurate regression of translational motion parameters. Therefore, a convolutional kernel size of 3 is used along the range dimension. This kernel size allows the aggregation of adjacent Doppler frequency features to mitigate measurement and sampling errors in the radar system without altering the number of range units. Additionally, high-dimensional features are more effective than low-dimensional features for representing characteristics of scattering centers. For downstream tasks such as regression and classification, they offer improved linear separability [33]. In addition, to accelerate the learning process of the neural network and address the vanishing gradient problem, a batch normalization layer is inserted between the convolutional layer and the ReLU activation function.

3.3. Multi-Scale Transformer with Dual Attention

In the multi-scale Transformer block, a multi-scale set D = N 1 , , N d , , N D is defined, consisting of D subaperture values, with each value corresponding to one instance of coherent integration in subaperture and CNN-based feature extraction. For the input range-pulse echo s n , m C N r × N p , the varying subaperture sizes within the set D result in different segmentation scales. These scales provide distinct resolution views of the target scattering centers, both within individual and across SRDMs, as illustrated in Figure 5. Based on this multi-scale segmentation, a dual-attention mechanism is proposed, capturing the motion trajectories of target scattering centers across both single-frame and multi-frame SRDMs.
Intra-subaperture attention (Intra-SA) establishes the relationships between Doppler units within each SRDM, capturing the spatial connections among target scattering centers at a given moment. Considering the feature array X d R N s × N r × N d × N f , we first embed along the feature dimension N f , resulting in X i t r d R N s × N r × N d × N f e , where N f e denotes the embedding dimension. The array is then rearranged to combine the subaperture count, range, and feature embedding dimensions, yielding X i t r d R N d × N s r f e , where N s r f e = N s × N r × N f e represents the combined dimensions. Next, a trainable linear transformation is applied to X i t r d to obtain the key and value for the attention mechanism, denoted as K i t r d and V i t r d R N d × N s r f e , respectively. Q i t r d R 1 × N s r f e serves as a trainable query matrix, merging the feature array along the Doppler dimension within each subaperture. The cross-attention between the query, key, and value can then be expressed as follows:
A t t n i t r d = S o f t m a x Q i t r d · K i t r d T N s r f e · V i t r d R 1 × N s r f e .
Subsequently, the Intra-SA is rearranged to form A t t n i t r d R N s × N r × N f e .
Inter-subaperture attention (Inter-SA) establishes relationships between corresponding range-Doppler units across subapertures, thereby capturing the temporal dependencies of target scattering centers over the entire observation period. Similar to Intra-SA, the feature array X d is first embedded along the feature dimension, yielding X i t e d R N s × N r × N d × N f e . However, Inter-SA combines the range, Doppler, and feature embedding dimensions, resulting in X i t e d R N s × N r d f e , where N r d f e = N r × N d × N f e represents the combined dimensions. Through this process, corresponding range-Doppler units across subapertures are merged, allowing the self-attention mechanism to model correlations between subapertures. To achieve this, linear transformations of X i t e d are applied to obtain the query, key, and values denoted as Q i t e d , K i t e d , and V i t e d R N s × N r d f e , respectively. The Inter-SA is then calculated as follows [40]:
A t t n i t e d = S o f t m a x Q i t e d · K i t e d T N r d f e · V i t e d R N s × N r d f e .
Subsequently, the Inter-SA is rearranged and aggregated along the Doppler dimension, resulting in A t t n i t e d R N s × N r × N f e . Finally, the dual attention for a subaperture size of N d is obtained from
A t t n d = A t t n i t r d + A t t n i t e d .
To achieve the integration of multi-scale features, a multi-scale aggregator is required at the end of the multi-scale Transformer block. Due to varying subaperture counts across different scales, the feature arrays produced by dual attention differ in size along this dimension. The multi-scale aggregator first applies a transformation function T · to align the subaperture count dimensions across different scales to a common value N s . Following this, the transformed feature arrays are summed, as shown in Equation (18). Here, w d represents the trainable weighting factor for subaperture processing at different scales.
A t t n = d = 1 D w d · T A t t n d .
Overall, the structure of the multi-scale Transformer with dual attention is illustrated in Figure 3. The multi-scale SRDMs offer distinct views of the target scattering center trajectories across various temporal scales. Variations in subaperture size further influence the dual attention, enabling it to capture changes in scattering centers at multiple time scales. Together, these components support the Transformer’s ability to model the movement of target scattering centers over diverse temporal scales.

3.4. Loss Function

Space target detection is treated as a binary classification task, while the estimation of target motion parameters is approached as a regression task. Both the classification and regression heads consist of fully connected layers, connected to the Transformer block, with output p, representing the predicted probability that a target is present in the echo, and q = Δ R ^ 0 , Δ v ^ 0 , Δ a ^ T , representing the estimated residual translational motion parameters. Similarly to most object detection networks for natural scene images, our detection network also employs a multi-task loss function. The cross-entropy loss is chosen as the classification loss:
L c l s = 1 N b k = 1 N b g k log p k + 1 g k log 1 p k ,
where N b represents the batch size, k denotes the batch index, and g k is the ground truth label, which is 1 if the echo contains a target and 0 otherwise. For regression loss, the smooth L1 loss is utilized:
L r e g = 1 N b k = 1 N b g k · 1 2 h k q k 2 , i f h k q k < 1 h k q k 1 2 , o t h e r w i s e ,
where h k = Δ R 0 , Δ v 0 , Δ a T denotes the true residual translational motion parameter. Equation (20) indicates that the regression loss for motion parameters is calculated if a target is present in the echo. The total loss function can then be expressed as follows [29]:
L t o t = L c l s + ζ L r e g ,
where ζ is a weighting factor that adjusts the relative contributions of the two loss components.

4. Experimental Evaluation

4.1. Experimental Setup

Experimental data. A widely accepted view in evaluating the effectiveness of deep learning models across various application scenarios is that their success largely depends on an efficient training process and access to abundant, high-quality data resources. However, due to the dynamic and unpredictable nature of the space environment, acquiring extensive real radar data to support the training of deep learning models is highly challenging. Therefore, this study employs simulation techniques to generate a substantial amount of labeled radar complex data. By accurately modeling the physical characteristics of radar systems and the electromagnetic scattering behavior of space targets, as discussed in Section 2, highly realistic radar echo data can be produced. These data contain authentic parameter information of the targets, such as initial range, initial velocity, acceleration and scattering properties, thereby ensuring both the practicality and representativeness of the simulated data.
In this study, the detailed parameter configurations of the simulated dataset are provided in Table 2. Specifically, a narrowband S-band pulsed radar system was selected as the research foundation, with a carrier frequency set at 3 GHz and a bandwidth of 10 MHz . The pulse repetition frequency was set to 100 Hz , while the sampling frequency was configured to be twice the bandwidth to ensure adequate signal sampling. Based on these parameters, the radar system’s range resolution is derived to be 7.5 m , with a maximum unambiguous velocity of 5 m / s . For the micromotion CST, a set of specific physical parameters and dynamic characteristics were predefined. The cylinder length was assumed to be 6 m , with a base diameter of 3 m . In terms of micromotion, the CST was configured to undergo precession with an angle of 10 , with spin and precession periods set to 2 s and 4 s , respectively. These configurations were designed to simulate the complex dynamic behavior that CSTs may exhibit in real-world scenarios. Notably, MsSCIFormer effectively models the spatial and temporal dynamics of target scattering center signals, ensuring that the structure and micromotion parameters of the CST do not affect the network’s performance.
To comprehensively evaluate the accuracy of MsSCIFormer in residual translational motion parameter regression, a uniform distribution strategy was adopted when constructing the dataset to select the target’s translational motion parameters. The initial range, velocity, and acceleration were sampled within the intervals of 75 m , 75 m , 1 m / s , 1 m / s and 0.1 m / s 2 , 0.1 m / s 2 , respectively. Considering the computational cost, the range-pulse echo samples were generated with 1024 pulses and 32 range cells, defining a detection window of 240 m in the range dimension. To comprehensively evaluate system performance, different noise environments were simulated by setting the SNR range from 20 dB to 10 dB , with increments of 3 dB ; we generated 5000 samples for each SNR. Considering the condition of target absence, the final simulated dataset consisted of 60,000 samples, with 80 % allocated for model training and the remaining 20 % reserved for testing.
Experimental metrics. In the evaluation section, we systematically applied various performance metrics to comprehensively and accurately assess the effectiveness of the MsSCIFormer. Specifically, we focused on two widely recognized evaluation criteria in RTD: detection probability and FAR. Within this framework, samples containing targets were defined as positive samples, while those without targets were considered negative samples. Additionally, algorithm predictions indicating the presence of a target were labeled as true, and predictions indicating the absence of a target were labeled as false. Based on this classification, four distinct cases were identified: n t p samples that contain a target and are correctly detected (true positives), n f n samples that contain a target but are missed (false negatives), n t n samples that do not contain a target and are correctly classified (true negatives), and n f p samples that do not contain a target but are incorrectly detected as containing one (false positives). Using these definitions, detection probability and FAR can be expressed as follows:
P d = n t p n t p + n f p ,
P f = n f p n t n + n f p .
In addition, given the focus of this algorithm on accurately estimating target translational motion parameters, measurement error was introduced as another key evaluation metric. Specifically, measurement errors assess the algorithm’s accuracy in estimating residual translational motion parameters, including range, velocity, and acceleration. The errors were quantified using the absolute errors, as shown in Equations (24)–(26).
Δ R 0 e r r = Δ R ^ 0 Δ R 0 ,
Δ v 0 e r r = Δ v ^ 0 Δ v 0 ,
Δ a e r r = Δ a ^ Δ a ,
where Δ R ^ 0 , Δ v ^ 0 and Δ a ^ represent the estimated residual range, velocity, and acceleration, respectively; Δ R 0 , Δ v 0 and Δ a denote the corresponding ground truths. By quantifying these errors, we can more precisely evaluate the performance of the MsSCIFormer in complex dynamic environments, especially when dealing with targets whose actual trajectories deviate from the guidance track. These error metrics provide a direct quantitative measure of the robustness and accuracy of the network.
Implementation Details. In the experimental setup of this paper, the batch size was set to 16 to balance memory efficiency and data throughput during the model training process. The MsSCIFormer model was optimized using the Adam optimizer, with the learning rate set to be 10 4 . The model was implemented in PyTorch version 2.1.2 and trained for 40 epochs on an NVIDIA RTX 3090 GPU. The GPU is manufactured by NVIDIA Corporation, which is based in Santa Clara, CA, USA. A key component of the MsSCIFormer model is the multi-scale subaperture processing block, which includes five varying scales, namely { 8 , 16 , 32 , 48 , 64 } .

4.2. Comparison Experiments

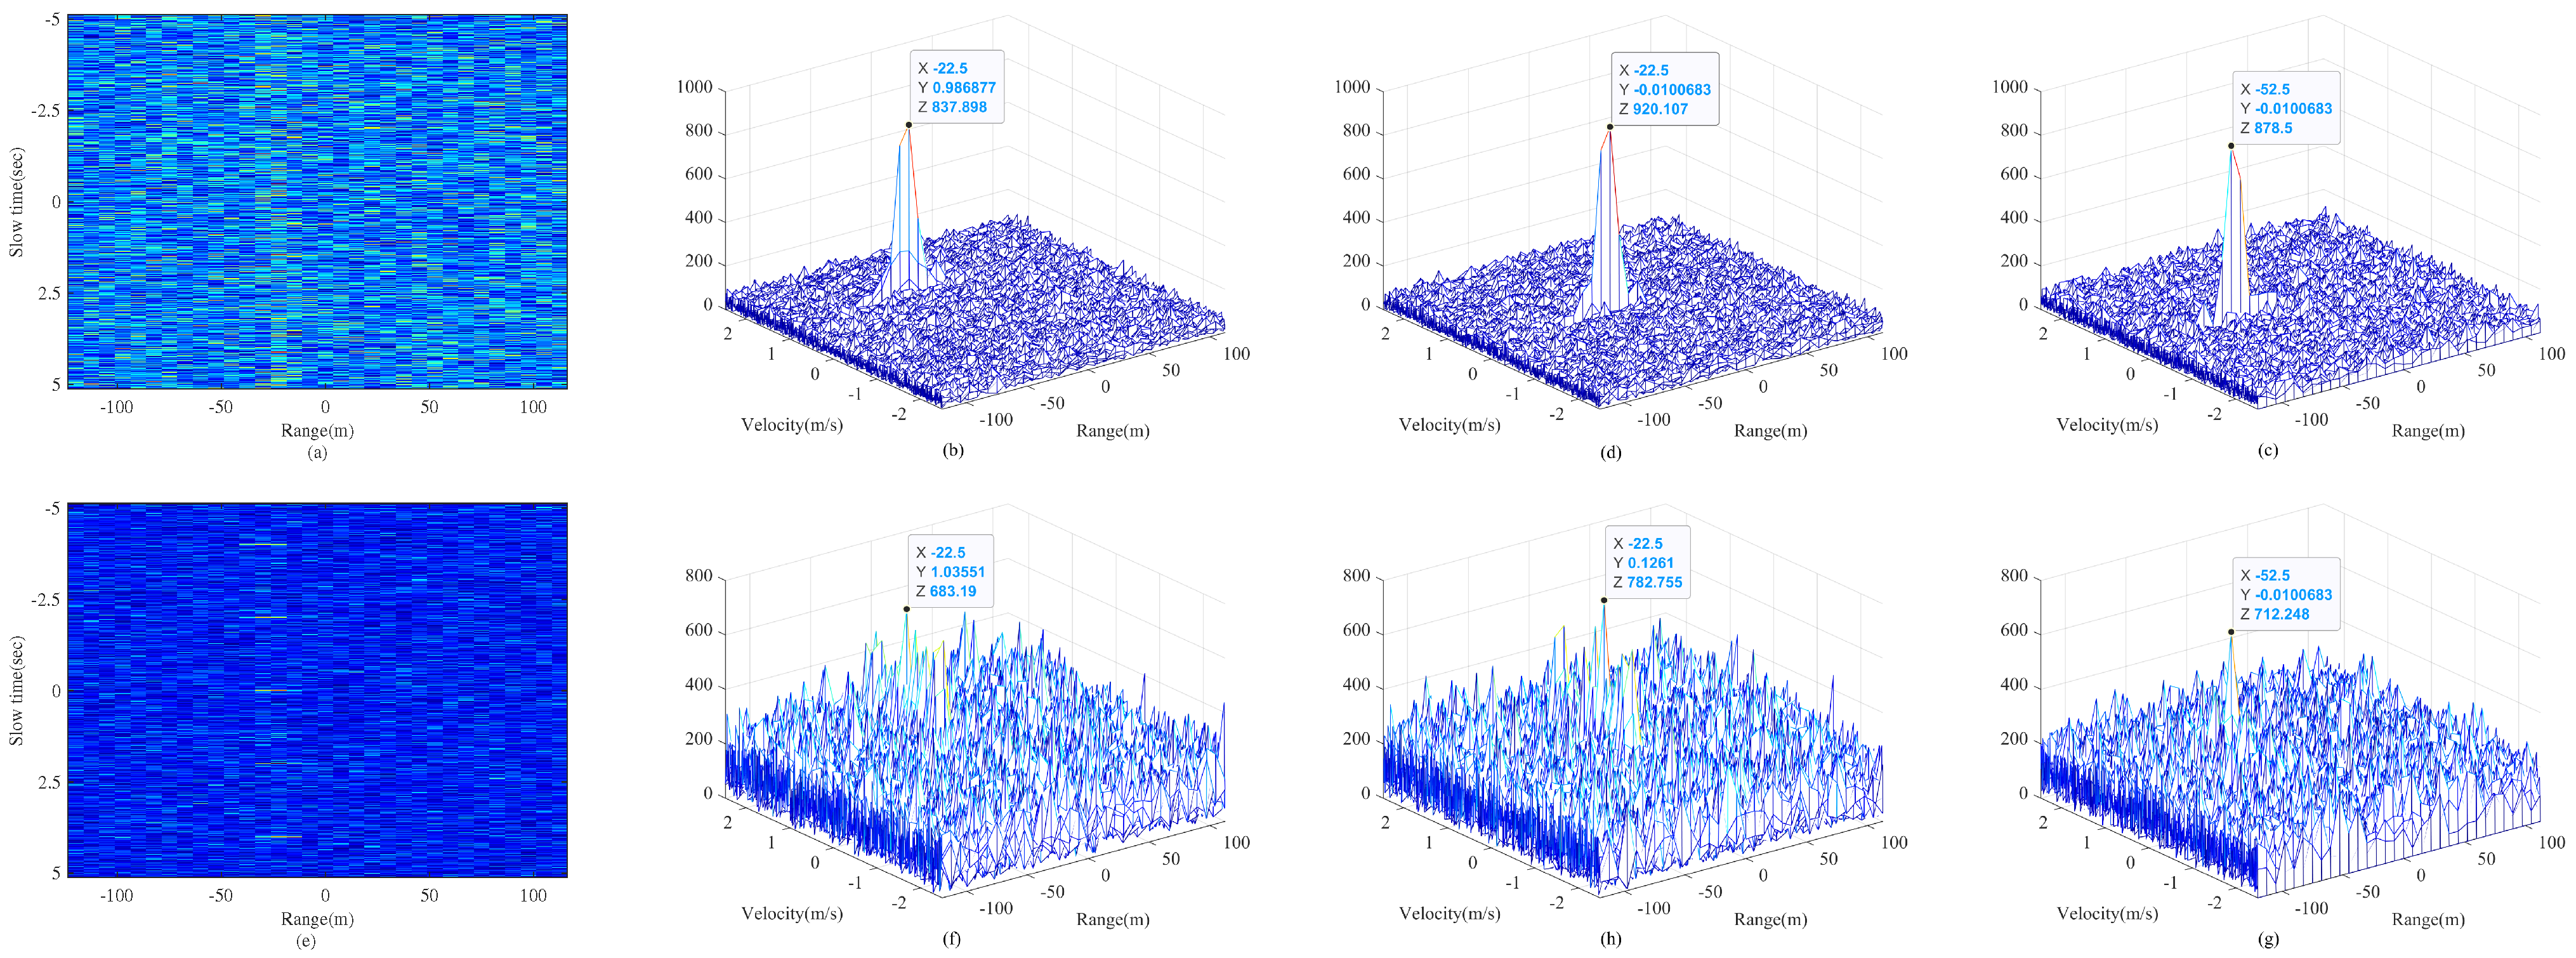
To demonstrate the superiority of the proposed algorithm, this section presents a comparative analysis of five previous RTD algorithms. In particular, two traditional algorithms were selected: the MTD, the SRT and the GRFT. Since deep learning-based detection algorithms lack constant FAR characteristics, the detection thresholds for traditional algorithms in this study were determined using Monte Carlo simulations based on preset FAR. The MTD method performs a Fourier transform along the slow-time dimension of echo data but overlooks the ARDU effects of target scattering centers. SRT applied time-reversed echo flipping along the slow-time dimension to achieve temporal correlation, only correcting for the first-order range migration and enhancing energy accumulation. GRFT, on the other hand, performs an ergodic search for translational parameters; however, for CSTs with multiple scattering centers and micromotions, the phase variation of the scattering centers becomes complex, making effective compensation challenging. Figure 6 illustrates the coherent integration results under low-SNR conditions ( SNR = 10 dB ) for point targets and CSTs with precession. Specifically, Figure 6b–d shows that all traditional algorithms effectively achieve energy integration for point targets. However, for CSTs, as shown in Figure 6f–h, their integration performance deteriorates significantly.
For scenarios involving CSTs with complex motion models, deep convolutional networks can autonomously learn and extract data features, enabling end-to-end target detection and parameter estimation. To facilitate comparison, three deep learning-based algorithms were selected for this study. The first is an RTD network based on DNN proposed by Wang [27], which includes only a binary classification head. The second is a multi-task model based on CNN proposed by Jiang [28], which outputs target range, velocity, azimuth, and elevation in addition to detection. The third is the EchoFormer proposed by Yang [33], which is designed for complex data and leverages a Transformer architecture to fully utilize mDS information for target detection and parameter estimation. All the above algorithms were reproduced by us, maintaining the primary network structures. However, for consistency and comparability, task heads were modified or added as needed.
For traditional algorithms, the FAR was set to match that of MsSCIFormer, namely P f = 0.9 % , and the MTD did not account for the estimation of acceleration parameters. It is worth noting that RTD methods based on deep learning often exhibit relatively high FAR [41,42,43,44]. However, performing track association on the initial measurements has been shown to effectively eliminate false detections, and improve overall detection reliability [45]. Table 3 provides a detailed comparison of the detection performance of different methods on the dataset used in this study. The table reveals that traditional algorithms exhibit poor detection performance and especially low parameter estimation accuracy, primarily due to the significant impact of ARDU effects. Even when the SNR is high, the micromotion still causes deviation in the measurement of velocity, which accounts for the large errors in the regression of residual velocity. The algorithms proposed by Wang [27] and Jiang [28] rely solely on basic convolutional networks for feature extraction, failing to effectively leverage the mDS of the targets. This limitation results in low detection probabilities accompanied by higher FAR. In contrast, the EchoFormer [33], which incorporates both phase information and mDS, demonstrates significantly improved performance. Building upon these advancements, the proposed MsSCIFormer algorithm further enhances detection probability and parameter estimation accuracy while effectively reducing the FAR.
To evaluate the performance of the proposed algorithm under low SNR conditions, a comparative analysis was conducted between Jiang’s method, EchoFormer, and MsSCIFormer. Each method was trained and tested on three datasets with SNR ranges of 25 20 dB, 20 15 dB, and 15 10 dB, respectively. The experimental results are summarized in Table 4. The results indicate that detection performance deteriorates for all three methods as the SNR decreases to varying extents. Jiang’s method experienced the most significant decline, with the detection probability dropping to 69.68% and the FAR increasing to 15.9% on the 25 20 dB dataset. Additionally, its regression error showed a substantial increase. In comparison, EchoFormer exhibited less pronounced degradation in both classification and regression tasks. However, MsSCIFormer demonstrated superior robustness, achieving a detection probability of 89.23% on the 25 20 dB dataset while maintaining a low FAR. Its regression errors remained stable across all three low-SNR datasets. This superior performance can be attributed to the dual-attention mechanism, which enhances the extraction of both spatial and temporal features of scattering centers.

4.3. Ablation Experiments

To better understand the impact of each component in the MsSCIFormer model on overall algorithm performance, we conducted ablation experiments focusing on multi-scale subaperture coherent integration (MsSCI), Intra-SA, and Inter-SA. Table 5 lists the results of the ablation experiments.
First, a baseline model without MsSCI was constructed, employing a single-scale subaperture segmentation strategy in its workflow. This baseline model was designed to evaluate the effectiveness of the MsSCI module. Further, subaperture segmentations with scales of 16, 32, and 64 were implemented, categorized as fine, medium, and coarse subapertures, respectively, to comprehensively assess the potential impact of different subaperture scales on network performance. A comparative analysis of the single-scale model and the complete MsSCIFormer model revealed that incorporating MsSCI not only ensured regression accuracy but also significantly improved target detection probability and reduced the FAR. Performance analysis across different subaperture scales demonstrated that coarser-scale subaperture segmentation enhanced binary classification performance, while finer-scale segmentation provided significant advantages in the precise regression of range and velocity parameters.
Subsequently, the specific impact of Intra-SA and Inter-SA mechanisms on model performance was investigated in detail. To this end, three variant models were constructed: two with each attention mechanism removed and one with both attention mechanisms removed. The experimental results demonstrated that models lacking the two attention mechanisms exhibited significantly lower classification accuracy and regression precision. The model incorporating only the Intra-SA effectively enhanced the ability to capture the spatial distribution features of scattering centers, thereby improving the regression accuracy of range and velocity parameters. However, due to the lack of efficient handling of global contextual information, this model struggled to utilize long-time data effectively, resulting in a significantly lower detection probability and a higher FAR compared to the complete MsSCIFormer model. In contrast, the model incorporating only the Inter-SA significantly improved global comprehension and generalization by promoting information exchange across subapertures, leading to excellent performance in classification tasks. However, due to insufficient focus on intra-subaperture features, this model exhibited slightly reduced localization performance when dealing with targets containing multiple complex scattering centers.
Furthermore, the performance of the models was systematically evaluated under varying SNR conditions, as shown in Figure 7. Specifically, Figure 7a highlights the superior performance of the complete MsSCIFormer network, with an overall detection probability consistently above 80 % and rapidly increasing to 100 % when the SNR exceeds 11 dB . In contrast, the model employing a single-scale dual-attention Transformer exhibits a performance degradation of approximately 10 dB compared to the multi-scale structure. Notably, network models lacking attention mechanisms show a significant decline in performance. Further comparative analysis reveals that Inter-SA contributes more to performance enhancement than Intra-SA, aligning with prior findings. Figure 7b–d demonstrates the robustness of MsSCIFormer in regression accuracy across varying SNR levels, providing strong evidence of its ability to accurately detect targets.
Above all, the ablation experiments not only validated the necessity of each key component in the MsSCIFormer model but also provided a deeper understanding of how these components work synergistically to enhance the overall algorithm performance. Specifically, the MsSCI improved the model’s adaptability to complex scenarios; the Intra-SA enhanced the precision of local feature extraction, and the Inter-SA facilitated the integration and utilization of global information.

4.4. Robustness Experiments

(1) Multi-scale sets: The ablation experiments have clearly demonstrated the positive impact of the MsSCI module on the network performance. This section aims to further assess the specific effects of different multi-scale sets on the network performance. To this end, a full-scale set containing 8 subaperture sizes, denoted as D u s = 8 , 12 , 16 , 24 , 32 , 48 , 64 , 96 , was defined. First, we focused on the influence of multi-scale sets with varying sizes. The MsSCIFormer model was configured with different multi-scale sets, denoted as D i , i = 3 , , 8 , where i represents the size of the set, and underwent a training and evaluation process. To eliminate potential bias from varying subaperture sizes, a consistent selection strategy was followed when choosing scales from D u s : the smallest i values were selected to form the multi-scale set for configuring MsSCIFormer. Additionally, we evaluated the performance of multi-scale sets of the same size (in this case, i = 4 ) but with different elements, namely D 4 1 , D 4 2 , D 4 3 , and D 4 4 . The experimental results are detailed in Table 6.
When comparing the performance of MsSCIFormer with multi-scale sets of different sizes, we found that, as the size increases, the detection probability gradually increases, the FAR decreases, and the regression errors for motion parameters continue to shrink. In addition, the performance improvement begins to saturate after the size reaches 6, the detection probability increases by less than 0.1 % , and the FAR and regression errors barely decrease with further increases in the size of multi-scale sets. Given that computational complexity increases with the number of scales, the size being 5 or 6 is considered a reasonable choice, as it ensures good performance while controlling computational cost. Furthermore, we compared network performance with multi-scale sets of the same size. In these four cases, D 4 1 consisted of the smallest four subaperture values, D 4 4 consisted of the largest four, and the others were selected with intervals from the full set. The results showed that the network configured with D 4 1 exhibited the best regression performance, while the network with D 4 4 achieved the best classification performance. Networks using sets D 4 2 and D 4 3 provided a better trade-off between classification and regression tasks. Overall, the network performance showed minimal fluctuation, and MsSCIFormer demonstrated robust performance with multi-scale sets of the same size.
(2) Incomplete observations: As delineated in Section 2, the constraint of limited radar resources frequently results in incomplete observations, which impede the acquisition of comprehensive spatial distribution and temporal evolution characteristics of target scattering centers. To rigorously assess the performance of MsSCIFormer under such incomplete observation scenarios, we meticulously simulated three additional datasets with degrees of incompleteness of 1 / 4 , 1 / 2 , and 3 / 4 , respectively. Together with the original complete dataset, these constituted four experimental conditions for both training and evaluation. The experimental results, presented in Table 7, also include TFCs of the targets under different levels of completeness.
A comprehensive analysis of the results revealed a clear trend: the availability of more observational information positively correlates with enhanced detection performance. Specifically, the network achieved optimal performance under complete observations. In comparison to scenarios with 1 / 4 and 1 / 2 incompleteness, the detection probability decreased by 0.52 % and 1.65 % , respectively, while the FAR increased by 0.02 % and 0.13 % . Additionally, a slight decline in regression accuracy was observed. Notably, a significant deterioration in performance was evident when the degree of incompleteness reached 3 / 4 . Compared to complete observations, the detection probability dropped substantially by 9.52 % , the FAR rose by 1.31 % , and the estimation errors for target motion parameters increased by 208 % , 292 % and 622 % , respectively. These findings suggest that when the degree of incomplete observations is less than 1 / 2 , the decline in detection performance of the network is relatively modest. In such cases, MsSCIFormer demonstrates a certain level of robustness to the completeness of observational data. In practical applications, this implies a potential trade-off between network performance and radar resource allocation, allowing for flexible decision-making based on specific requirements and constraints.

5. Conclusions

In this paper, we proposed a Transformer-based detection network, named MsSCIFormer, which effectively utilizes the micromotion features of scattering centers. Specifically, an MsSCI module was first employed to preprocess the range-pulse data. This module not only effectively accumulates the energy of scattering centers but also preserves critical mDS. Then, a CNN module was used for feature extraction from the SRDMs. To more comprehensively capture the characteristics of scattering centers, we innovatively introduced both Intra-SA and Inter-SA mechanisms. These mechanisms focus on the spatial distribution features of scattering centers and their time-varying motion characteristics, respectively. Finally, multi-scale features were fused and input into classification and regression heads to complete detection and parameter estimation. To validate the performance of MsSCIFormer, it was evaluated on a simulation dataset based on the precise modeling of CSTs, which closely mimics real-world data scenarios. The experimental results indicate that MsSCIFormer achieved a detection probability exceeding 98 % and an FAR as low as 0.9 % . Furthermore, the regression errors for translational motion parameters were notably low: less than 1.56 m for the residual initial range, less than 0.016 m / s for the residual initial velocity, and less than 0.002 m / s 2 for the residual acceleration. These results significantly surpass those of traditional methods and existing deep-learning approaches. Additionally, the contributions of the three core modules—MsSCI, Intra-SA, and Inter-SA—were demonstrated, each enhancing the model’s classification and regression capabilities to varying degrees. The robustness of the proposed network was further evaluated under different multi-scale configurations and incomplete observation conditions, confirming its adaptability and reliability. Nevertheless, the reliance on simulated data and the relatively high computational complexity may present potential barriers to its broader application in practical scenarios. Future research could explore the application of MsSCIFormer to space targets with more diverse structures and validate its performance on real radar datasets. Overall, MsSCIFormer provides a novel and efficient solution for multi-scattering center space target detection and parameter estimation under low-SNR and complex motion conditions, with significant theoretical and practical value.

Author Contributions

Conceptualization, L.B. and T.F.; methodology, L.B. and T.F.; software, L.B.; validation, L.B. and W.C.; formal analysis, L.B. and W.C.; investigation, L.B. and W.C.; resources, L.B. and D.C.; data curation, L.B. and H.C.; writing—original draft preparation, L.B., H.C. and D.C.; writing—review and editing, T.F. and W.C.; visualization, L.B. and W.C.; supervision, T.F. and D.C.; project administration, L.B. All authors have read and agreed to the published version of the manuscript.

Funding

This research received no external funding.

Institutional Review Board Statement

Not applicable.

Informed Consent Statement

Not applicable.

Data Availability Statement

Data are contained within the article.

Conflicts of Interest

The authors declare no conflicts of interest.

Abbreviations

The following abbreviations are used in this manuscript:
ARDUAcross range-Doppler unit
CNNConvolution neural network
CPICoherent processing interval
CSTCylindrical space target
DNNDeep neural network
DSCDistributed scattering center
FARFalse alarm rate
GRFTGeneralized Radon Fourier transform
Intra-SAIntra-subaperture attention
Inter-SAInter-subaperture attention
KTKeystone transform
LOSLine-of-sight
LSCLocal scattering center
mDSmicro-Doppler signature
MsSCIMulti-scale subaperture coherent integration
MsSCIFormerMulti-scale subaperture coherent integration transformer
RFTRadon Fourier transform
RTDRadar target detection
SCIFTScaled inverse Fourier transform
SKTSecond-order Keystone transform
SNRSignal-to-noise ratio
SRTSequence-reversing Transformation
SSCSliding scattering center
SRDMSubaperture range-Doppler map
TFCTime-frequency curve
UAVUnmanned aerial vehicle

References

  1. Xi, J.; Xiang, Y.; Ersoy, O.K.; Cong, M.; Wei, X.; Gu, J. Space Debris Detection Using Feature Learning of Candidate Regions in Optical Image Sequences. IEEE Access 2020, 8, 150864–150877. [Google Scholar] [CrossRef]
  2. Kammel, C.; Ullmann, I.; Vossiek, M. Motion Parameter Estimation of Free-Floating Space Debris Objects Based on MIMO Radar. IEEE Trans. Radar Syst. 2023, 1, 681–697. [Google Scholar] [CrossRef]
  3. Tao, J.; Cao, Y.; Ding, M. SDebrisNet: A Spatial–Temporal Saliency Network for Space Debris Detection. Appl. Sci. 2023, 13, 4955. [Google Scholar] [CrossRef]
  4. Maffei, M.; Aubry, A.; De Maio, A.; Farina, A. Spaceborne Radar Sensor Architecture for Debris Detection and Tracking. IEEE Trans. Geosci. Remote Sens. 2021, 59, 6621–6636. [Google Scholar] [CrossRef]
  5. Ender, J.; Leushacke, L.; Brenner, A.; Wilden, H. Radar techniques for space situational awareness. In Proceedings of the 2011 12th International Radar Symposium (IRS), Leipzig, Germany, 7–9 September 2011; pp. 21–26. [Google Scholar]
  6. Perry, R.; DiPietro, R.; Fante, R. SAR imaging of moving targets. IEEE Trans. Aerosp. Electron. Syst. 1999, 35, 188–200. [Google Scholar] [CrossRef]
  7. Su, J.; Xing, M.; Wang, G.; Bao, Z. High-speed multi-target detection with narrowband radar. IET Radar Sonar Navig. 2010, 4, 595–603. [Google Scholar] [CrossRef]
  8. Li, X.; Cui, G.; Yi, W.; Kong, L. An Efficient Coherent Integration Method for Maneuvering Target Detection. In Proceedings of the IET International Radar Conference 2015, Hangzhou, China, 14–16 October 2015. [Google Scholar] [CrossRef]
  9. Huang, P.; Liao, G.; Yang, Z.; Xia, X.G.; Ma, J.T.; Ma, J. Long-Time Coherent Integration for Weak Maneuvering Target Detection and High-Order Motion Parameter Estimation Based on Keystone Transform. IEEE Trans. Signal Process. 2016, 64, 4013–4026. [Google Scholar] [CrossRef]
  10. Xu, J.; Yu, J.; Peng, Y.N.; Xia, X.G. Radon-Fourier Transform for Radar Target Detection (I): Generalized Doppler Filter Bank. IEEE Trans. Aerosp. Electron. Syst. 2011, 47, 1186–1202. [Google Scholar] [CrossRef]
  11. Yu, J.; Xu, J.; Peng, Y.N.; Xia, X.G. Radon-Fourier Transform for Radar Target Detection (III): Optimality and Fast Implementations. IEEE Trans. Aerosp. Electron. Syst. 2012, 48, 991–1004. [Google Scholar] [CrossRef]
  12. Xu, J.; Xia, X.G.; Peng, S.B.; Yu, J.; Peng, Y.N.; Qian, L.C. Radar Maneuvering Target Motion Estimation Based on Generalized Radon-Fourier Transform. IEEE Trans. Signal Process. 2012, 60, 6190–6201. [Google Scholar] [CrossRef]
  13. Zhu, D.; Li, Y.; Zhu, Z. A Keystone Transform Without Interpolation for SAR Ground Moving-Target Imaging. IEEE Geosci. Remote Sens. Lett. 2007, 4, 18–22. [Google Scholar] [CrossRef]
  14. Tian, J.; Cui, W.; Shen, Q.; Wei, Z.; Wu, S. High-speed maneuvering target detection approach based on joint RFT and keystone transform. Sci. China Inf. Sci. 2013, 56, 1–13. [Google Scholar] [CrossRef]
  15. Xu, J.; Zhou, X.; Qian, L.C.; Xia, X.G.; Long, T. Hybrid integration for highly maneuvering radar target detection based on generalized radon-fourier transform. IEEE Trans. Aerosp. Electron. Syst. 2016, 52, 2554–2561. [Google Scholar] [CrossRef]
  16. Tian, J.; Xia, X.G.; Cui, W.; Yang, G.; Wu, S.L. A Coherent Integration Method via Radon-NUFrFT for Random PRI Radar. IEEE Trans. Aerosp. Electron. Syst. 2017, 53, 2101–2109. [Google Scholar] [CrossRef]
  17. Li, X.; Sun, Z.; Yeo, T.S.; Zhang, T.; Yi, W.; Cui, G.; Kong, L. STGRFT for Detection of Maneuvering Weak Target With Multiple Motion Models. IEEE Trans. Signal Process. 2019, 67, 1902–1917. [Google Scholar] [CrossRef]
  18. Li, X.; Zhao, K.; Wang, M.; Cui, G.; Yeo, T.S. NU-SCGRFT-Based Coherent Integration Method for High-Speed Maneuvering Target Detection and Estimation in Bistatic PRI-Agile Radar. IEEE Trans. Aerosp. Electron. Syst. 2024, 60, 2153–2168. [Google Scholar] [CrossRef]
  19. Zheng, J.; Su, T.; Zhu, W.; He, X.; Liu, Q.H. Radar High-Speed Target Detection Based on the Scaled Inverse Fourier Transform. IEEE J. Sel. Top. Appl. Earth Obs. Remote Sens. 2015, 8, 1108–1119. [Google Scholar] [CrossRef]
  20. Niu, Z.; Zheng, J.; Su, T.; Zhang, J. Fast implementation of scaled inverse Fourier transform for high-speed radar target detection. Electron. Lett. 2017, 53, 1142–1144. [Google Scholar] [CrossRef]
  21. Li, X.; Cui, G.; Yi, W.; Kong, L. Sequence-Reversing Transform-Based Coherent Integration for High-Speed Target Detection. IEEE Trans. Aerosp. Electron. Syst. 2017, 53, 1573–1580. [Google Scholar] [CrossRef]
  22. Zhang, Y.; Xu, H.; Zhang, X.P.; Liu, H.; Deng, Z.; Fu, M. A Wideband/Narrowband Fusion-Based Motion Estimation Method for Maneuvering Target. IEEE Sens. J. 2019, 19, 8095–8106. [Google Scholar] [CrossRef]
  23. Huang, P.; Liao, G.; Yang, Z.; Xia, X.G.; Ma, J.T.; Zhang, X. A Fast SAR Imaging Method for Ground Moving Target Using a Second-Order WVD Transform. IEEE Trans. Geosci. Remote Sens. 2016, 54, 1940–1956. [Google Scholar] [CrossRef]
  24. Zhang, J.; Su, T.; Lv, Q. High-speed Maneuvering Target Detection Based onNon-searching Estimation of Motion Parameters. J. Electron. Inf. Technol. 2016, 38, 1460–1467. [Google Scholar]
  25. Li, X.; Kong, L.; Cui, G.; Yi, W. CLEAN-based coherent integration method for high-speed multi-targets detection. IET Radar Sonar Navig. 2016, 10, 1671–1682. [Google Scholar] [CrossRef]
  26. Dai, F.; Liu, J.; Tian, L.; Dong, H.; Hong, L. An End-to-End Approach for Rigid-Body Target Micro-Doppler Analysis Based on the Asymmetrical Autoencoding Network. IEEE Trans. Geosci. Remote Sens. 2023, 61, 5102519. [Google Scholar] [CrossRef]
  27. Wang, L.; Tang, J.; Liao, Q. A Study on Radar Target Detection Based on Deep Neural Networks. IEEE Sens. Lett. 2019, 3, 7000504. [Google Scholar] [CrossRef]
  28. Jiang, W.; Ren, Y.; Liu, Y.; Leng, J. A method of radar target detection based on convolutional neural network. Neural Comput. Appl. 2021, 33, 9835–9847. [Google Scholar] [CrossRef]
  29. Wang, C.; Tian, J.; Cao, J.; Wang, X. Deep Learning-Based UAV Detection in Pulse-Doppler Radar. IEEE Trans. Geosci. Remote Sens. 2022, 60, 5105612. [Google Scholar] [CrossRef]
  30. Tian, J.; Wang, C.; Cao, J.; Wang, X. Fully Convolutional Network-Based Fast UAV Detection in Pulse Doppler Radar. IEEE Trans. Geosci. Remote Sens. 2024, 62, 5103112. [Google Scholar] [CrossRef]
  31. Su, N.; Chen, X.; Guan, J.; Li, Y. Deep CNN-Based Radar Detection for Real Maritime Target Under Different Sea States and Polarizations. In International Conference on Cognitive Systems and Signal Processing; Sun, F., Liu, H., Hu, D., Eds.; Springer: Singapore, 2019; pp. 321–331. [Google Scholar]
  32. Sun, Y.; Abeywickrama, S.; Jayasinghe, L.; Yuen, C.; Chen, J.; Zhang, M. Micro-Doppler Signature-Based Detection, Classification, and Localization of Small UAV With Long Short-Term Memory Neural Network. IEEE Trans. Geosci. Remote Sens. 2021, 59, 6285–6300. [Google Scholar] [CrossRef]
  33. Yang, Y.; Yang, F.; Sun, L.; Xiang, T.; Lv, P. Echoformer: Transformer Architecture Based on Radar Echo Characteristics for UAV Detection. IEEE Sens. J. 2023, 23, 8639–8653. [Google Scholar] [CrossRef]
  34. Vaswani, A.; Shazeer, N.; Parmar, N.; Uszkoreit, J.; Jones, L.; Gomez, A.N.; Kaiser, Ł.; Polosukhin, I. Attention is all you need. In Advances in Neural Information Processing Systems 30 (NIPS 2017); Neural Information Processing Systems Foundation: San Diego CA, USA, 2017. [Google Scholar]
  35. Chen, V.; Li, F.; Ho, S.S.; Wechsler, H. Micro-Doppler effect in radar: Phenomenon, model, and simulation study. IEEE Trans. Aerosp. Electron. Syst. 2006, 42, 2–21. [Google Scholar] [CrossRef]
  36. Potter, L.; Chiang, D.M.; Carriere, R.; Gerry, M. A GTD-based parametric model for radar scattering. IEEE Trans. Antennas Propag. 1995, 43, 1058–1067. [Google Scholar] [CrossRef]
  37. Guo, K.Y.; Li, Q.F.; Sheng, X.Q.; Gashinova, M. Sliding scattering center model for extended streamlined targets. Prog. Electromagn. Res. 2013, 139, 499–516. [Google Scholar] [CrossRef]
  38. Zhou, Y.; Chen, Z.; Zhang, L.; Xiao, J. Micro-Doppler Curves Extraction and Parameters Estimation for Cone-Shaped Target With Occlusion Effect. IEEE Sens. J. 2018, 18, 2892–2902. [Google Scholar] [CrossRef]
  39. Ding, Z.; You, P.; Qian, L.; Zhou, X.; Liu, S.; Long, T. A Subspace Hybrid Integration Method for High-Speed and Maneuvering Target Detection. IEEE Trans. Aerosp. Electron. Syst. 2020, 56, 630–644. [Google Scholar] [CrossRef]
  40. Chen, P.; Zhang, Y.; Cheng, Y.; Shu, Y.; Wang, Y.; Wen, Q.; Yang, B.; Guo, C. Pathformer: Multi-scale Transformers with Adaptive Pathways for Time Series Forecasting. In Proceedings of the International Conference on Learning Representations, Vienna, Austria, 7–11 May 2024. [Google Scholar] [CrossRef]
  41. Ai, J.; Tian, R.; Luo, Q.; Jin, J.; Tang, B. Multi-Scale Rotation-Invariant Haar-Like Feature Integrated CNN-Based Ship Detection Algorithm of Multiple-Target Environment in SAR Imagery. IEEE Trans. Geosci. Remote Sens. 2019, 57, 10070–10087. [Google Scholar] [CrossRef]
  42. Chen, S.; Feng, C.; Huang, Y.; Chen, X.; Li, F. Small Target Detection in X-Band Sea Clutter Using the Visibility Graph. IEEE Trans. Geosci. Remote Sens. 2022, 60, 5115011. [Google Scholar] [CrossRef]
  43. Wan, H.; Tian, X.; Liang, J.; Shen, X. Sequence-Feature Detection of Small Targets in Sea Clutter Based on Bi-LSTM. IEEE Trans. Geosci. Remote Sens. 2022, 60, 4208811. [Google Scholar] [CrossRef]
  44. Jing, H.; Cheng, Y.; Wu, H.; Wang, H. Radar Target Detection With Multi-Task Learning in Heterogeneous Environment. IEEE Geosci. Remote Sens. Lett. 2022, 19, 4021405. [Google Scholar] [CrossRef]
  45. Gao, C.; Yan, J.; Peng, X.; Chen, B.; Liu, H. Intelligent multiframe detection aided by Doppler information and a deep neural network. Inf. Sci. 2022, 593, 432–448. [Google Scholar] [CrossRef]
  46. Skolnik, M.I. Introduction to Radar Systems; McGraw-Hill: New York, NY, USA, 1980; Volume 3. [Google Scholar]
Figure 1. The observation geometry of the CST: (a) Geometric diagram of the precession. (b) Distribution of the scattering centers. (c) Occlusion of the fixed scattering center.
Remotesensing 17 00417 g001
Figure 2. Simulation of the TFCs of the CST with precession: (a) Complete. (b) With occlusion effect. (c) With occlusion effect and incomplete observation.
Remotesensing 17 00417 g002
Figure 3. The structure of the Multi-scale Transformer block with dual attention.
Remotesensing 17 00417 g003
Figure 4. Diagram of the coherent integration in subapertures: (a) Echos before subaperture division. (b) Echos after subaperture division. (c) Coherent integration results of all the subapertures.
Remotesensing 17 00417 g004
Figure 5. Multi-scale subaperture processing.
Remotesensing 17 00417 g005
Figure 6. Coherent integration results for MTD, GRFT and SRT ( SNR = 10 dB ): (a) Pulse compression result for point−like target. (b) MTD. (c) SRT. (d) GRFT. (e) Pulse compression result for the precessional CST. (f) MTD. (g) SRT. (h) GRFT.
Remotesensing 17 00417 g006
Figure 7. Performance of the ablation experiments under different SNRs: (a) Detection probability. (b) Absolute error of Δ R 0 . (c) Absolute error of Δ v 0 . (d) Absolute error of Δ a .
Remotesensing 17 00417 g007
Table 1. Visibility conditions of the scattering centers.
Scattering centers P 1 P 2 P 3 P 4 P 5 P 6
Visibility conditions ( η ) [ π 2 , π ] [ 0 , π 2 ] s.t. r t T · n ^ 0 0 [ π 2 ε , π 2 + ε ]
Table 2. Basic experimental parameters of simulation.
Radar parametersCarrier frequency ( GHz )3
Pulse repetition frequency ( Hz )100
Bandwidth ( MHz )10
Sampling frequency ( MHz )20
CST structureCylinder length ( m )6
Cylinder base diameter ( m )3
MicromotionSpin period ( s )2
Cone period ( s )4
Precession angle ( deg )10
Residual translational motionInitial range ( m ) 75 ∼75
Initial velocity ( m / s ) 1 ∼1
Acceleration ( m / s 2 ) 0.1 ∼0.1
Table 3. Comparison results of the mentioned methods.
MethodsClassificationRegression
P d ( % ) P f ( % ) Δ R 0 err ( m ) Δ v 0 err ( m / s ) Δ a err ( m / s 2 )
MTD [46]88.410.906.38940.3557
SRT [21]90.070.904.25300.24310.0173
GRFT [10]91.250.904.73670.28780.0182
Wang et al. [27]89.284.492.80340.13050.0134
Jiang et al. [28]90.573.362.54690.11590.0205
EchoFormer [33]94.161.131.97840.07820.0089
MsSCIFormer97.890.901.56140.01610.0022
Table 4. Comparison results of the deep learning-based methods under low SNRs.
SNR (dB)MethodsClassificationRegression
P d ( % ) P f ( % ) Δ R 0 err ( m ) Δ v 0 err ( m / s ) Δ a err ( m / s 2 )
25 20 Jiang et al. [28]69.7815.94.00280.27250.0391
EchoFormer [33]78.717.842.10470.09370.0176
MsSCIFormer89.333.081.67630.02230.0047
20 15 Jiang et al. [28]82.275.982.73800.16320.0211
EchoFormer [33]87.812.231.99270.08890.0123
MsSCIFormer93.411.061.62290.01780.0035
15 10 Jiang et al. [28]94.071.822.52830.10360.0199
EchoFormer [33]97.820.081.96380.07450.0082
MsSCIFormer99.830.051.52790.01530.0020
Table 5. Ablation experiments of the MsSCIFormer.
ModulesClassificationRegression
MsSCIIntra-SAInter-SA P d ( % ) P f ( % ) Δ R 0 err ( m ) Δ v 0 err ( m / s ) Δ a err ( m / s 2 )
Fine🗸🗸91.632.491.73240.01780.0034
Middle🗸🗸92.371.951.94560.02250.0059
Coarse🗸🗸94.291.122.22320.02570.0062
🗸🗸 89.583.201.82660.02090.0118
🗸 🗸96.771.242.38930.04150.0150
🗸 84.239.875.87940.14180.0531
🗸🗸🗸97.890.901.56140.01610.0022
Table 6. MsSCIFormer performance on different multi-scale sets.
Size/NameElementsClassificationRegression
P d ( % ) P f ( % ) Δ R 0 err ( m ) Δ v 0 err ( m / s ) Δ a err ( m / s 2 )
3 / D 3 -94.771.381.65480.01720.0029
4 / D 4 1 {8, 12, 16, 24}96.571.131.61210.01610.0025
4 / D 4 2 {8, 16, 32, 64}96.761.061.62270.01630.0026
4 / D 4 3 {12, 24, 48, 96}96.871.071.62890.01640.0026
4 / D 4 4 {32, 48, 64, 96}96.991.041.63250.01690.0028
5 / D 5 -97.820.911.56220.01600.0022
6 / D 6 -98.010.901.56130.01580.0022
7 / D 7 -98.070.901.56080.01570.0020
8 / D 8 -98.120.891.55990.01570.0019
Table 7. MsSCIFormer performance on incomplete observations.
IncompletenessTFCPerformances
0Remotesensing 17 00417 i001 P d ( % ) 97.89
P f ( % ) 0.90
Δ R 0 e r r ( m ) 1.5614
Δ v 0 e r r ( m / s ) 0.0161
Δ a e r r ( m / s 2 ) 0.0022
1/4Remotesensing 17 00417 i002 P d ( % ) 97.35
P f ( % ) 0.92
Δ R 0 e r r ( m ) 1.5847
Δ v 0 e r r ( m / s ) 0.0169
Δ a e r r ( m / s 2 ) 0.0025
1/2Remotesensing 17 00417 i003 P d ( % ) 96.22
P f ( % ) 1.03
Δ R 0 e r r ( m ) 1.7688
Δ v 0 e r r ( m / s ) 0.0178
Δ a e r r ( m / s 2 ) 0.0027
3/4Remotesensing 17 00417 i004 P d ( % ) 88.35
P f ( % ) 2.21
Δ R 0 e r r ( m ) 4.8233
Δ v 0 e r r ( m / s ) 0.0632
Δ a e r r ( m / s 2 ) 0.0159
Disclaimer/Publisher’s Note: The statements, opinions and data contained in all publications are solely those of the individual author(s) and contributor(s) and not of MDPI and/or the editor(s). MDPI and/or the editor(s) disclaim responsibility for any injury to people or property resulting from any ideas, methods, instructions or products referred to in the content.

