Article

Evaluating Terrestrial Water Storage, Fluxes, and Drivers in the Pearl River Basin from Downscaled GRACE/GFO and Hydrometeorological Data

1
School of Geospatial Engineering and Science, Sun Yat-sen University, Zhuhai 519082, China
2
Key Laboratory of Comprehensive Observation of Polar Environment, Sun Yat-sen University, Ministry of Education, Zhuhai 519082, China
3
Guangdong Provincial Map Institute, Guangzhou 510288, China
*
Author to whom correspondence should be addressed.
Remote Sens. 2025, 17(23), 3816; https://doi.org/10.3390/rs17233816
Submission received: 17 October 2025 / Revised: 18 November 2025 / Accepted: 24 November 2025 / Published: 25 November 2025

Highlights

What are the main findings?
  • A joint inversion approach fuses GRACE/GFO observations with WGHM outputs to produce a high-resolution TWSA dataset for the Pearl River Basin (PRB).
  • The downscaled product outperforms WGHM, capturing seasonal and interannual variations in water storage and fluxes.
What is the implication of the main finding?
  • The downscaled TWSA enables basin-scale monitoring in the PRB, capturing seasonal accumulation, interannual shifts, and major extremes (e.g., the 2021 drought and wet-season floods) to improve risk assessment and water management.
  • Coupling the product with XGBoost–SHAP could provide quantitative attribution of drivers (precipitation, runoff, evapotranspiration, vegetation), supporting process interpretation, forecasting, and decision-making.

Abstract

The Pearl River Basin (PRB) is a humid subtropical system where frequent floods and recurrent droughts challenge water management. GRACE and GRACE Follow-On provide basin-scale constraints on terrestrial water storage anomalies (TWSA), yet their coarse native resolution limits applications at regional scales. We employ a downscaled TWSA product derived via a joint inversion that integrates GRACE/GFO observations with the high-resolution spatial patterns of WaterGap Global Hydrological Model (WGHM). Validation against GRACE/GFO shows that the downscaled product outperforms WGHM at basin and pixel scales, with consistently lower errors and higher skill, and with improved terrestrial water flux (TWF) estimates that agree more closely with water balance calculations in both magnitude and phase. The TWSA in the PRB exhibits strong seasonality, with precipitation (P) exceeding evapotranspiration (E) and runoff (R) from April to July and storage peaking in July. From 2002 to 2022, the basin alternates between multi-year declines and recoveries. On the annual scale, TWSA covaries with precipitation and runoff, and large-scale climate modes modulate these relationships, with El Niño and a warm Pacific Decadal Oscillation (PDO) favoring wetter conditions and La Niña and a cold PDO favoring drier conditions. extreme gradient boosting (XGBoost) with shapley additive explanations (SHAP) attribution identifies P as the primary driver of storage variability, followed by R and E, while vegetation and radiation variables play secondary roles. Drought and flood diagnostics based on drought severity index (DSI) and a standardized flood potential index (FPI) capture the severe 2021 drought and major wet-season floods. The results demonstrate that joint inversion downscaling enhances the spatiotemporal fidelity of satellite-informed storage estimates and provides actionable information for risk assessment and water resources management.

1. Introduction

The Pearl River Basin (PRB), located in southern China, features a west-to-east declining topography (Figure 1). It is one of China’s most economically and demographically concentrated regions, and is also highly sensitive to hydroclimatic variability. The basin supports the high-quality development of the Guangdong-Hong Kong-Macao Greater Bay Area and the Pearl River Delta, where the rational allocation of water resources is critical to ensuring socioeconomic stability. The PRB lies in the subtropical monsoon climate zone, and receives most of its annual precipitation between April and September [1]. This seasonal concentration combined with strong interannual variability driven by large-scale climate oscillations [2,3], results in frequent alternation between floods and droughts [4]. Under the influence of the monsoonal climate, the basin is characterized by coexisting and rapidly shifting hydrological extremes, with floods generally more severe than droughts [5,6]. In recent years, intensified extreme climate event, coupled with increasing agricultural water use, rapid urbanization, and intensified water infrastructure regulation, have significantly amplified the instability of the regional water cycle [7]. As a result, flood and drought risks have further escalated, posing serious challenges to food security, water resources management, and urban operations. Against this backdrop, accurately monitoring terrestrial water storage anomalies (TWSA) in the PRB is essential for improving our understanding of regional water cycle dynamics and enhancing the capacity for water resource regulation.
TWSA encompasses changes across multiple water storage components, including surface water, soil moisture, groundwater, and snow water equivalent. It serves as a key indicator of the net gain or loss of water storage within a basin. Traditionally, TWSA monitoring has relied on sparse ground-based observations, which are limited in both spatial coverage and temporal continuity. As a result, it has been difficult to capture large-scale secular variations in water storage. With the advancement of satellite gravimetry, the Gravity Recovery and Climate Experiment (GRACE) and its successor, GRACE Follow-on (GFO), have provided a valuable means of observing large-scale variations in TWSA. GRACE/GFO-based TWSA data have enabled quantitative assessments of hydrologic extremes, including droughts and floods, in regions where ground data are scarce [8]. Drought extent and severity can be mapped from interannual TWSA, and flood risk can be diagnosed with a flood potential index (FPI) that combines GRACE-based TWSA with precipitation anomalies [9,10]. At interannual scales, GRACE/GFO-derived TWSA variability also co-vary with climate teleconnections through their modulation of precipitation, evapotranspiration, and runoff. For example, across major African aquifers, TWSA links to El Niño/Southern Oscillation (ENSO), the Indian Ocean Dipole (IOD), the North Atlantic Oscillation (NAO), and the Atlantic Multidecadal Oscillation (AMO), with support from normalized difference vegetation index (NDVI) and lake altimetry [11]. In Europe, similar linkages have been identified, such as the influence of the NAO on TWSA extremes in the Iberian Peninsula [12]. Within China, GRACE observations have revealed pronounced groundwater variability in southwestern karstic regions, closely linked to monsoonal precipitation variability [13]. Moreover, prior studies have shown that ENSO and the Pacific Decadal Oscillation (PDO) jointly influence rainfall patterns and hydrologic extremes across southern China [2]. Hence, the satellite gravimetry missions have effectively addressed the long-standing lack of reliable TWSA observations at global and basin scales in the hydrological community [14,15,16]. However, the spatial resolution of monthly GRACE/GFO solutions is relatively coarse, approximately 330 km [17], which limits their applicability in small-scale basins [18,19].
Compared to GRACE/GFO, global hydrological models (e.g., WaterGap Hydrological Model, WGHM) offer much higher spatial resolution. However, their temporal variation often suffers from large uncertainties due to potentially biased input data and limited ground-based calibration [20,21]. To overcome these limitations, combining the spatial information of hydrological model with the large-scale temporal variations of GRACE/GFO has become an effective strategy for improving the spatial resolution of TWSA [22]. For example, Li et al. [23] assimilated GRACE/GFO mascon data into the Catchment Land Surface Model (CLSM) using an ensemble Kalman filter, improving groundwater estimates validated against in situ well observation. Gerdener et al. [24] incorporated GRACE/GFO error structures into a similar assimilation scheme with WGHM, producing a global 50 km product that was independently validated against vertical loading estimates from Global Navigation Satellite System (GNSS) observations. Yang et al. [25] introduced a Monte Carlo full variance-covariance error propagation framework to efficiently quantify TWSA uncertainties and demonstrated its effectiveness in GRACE/GFO assimilation. Gou and Soja [26] applied a self-supervised deep learning approach to combine WGHM’s spatial detail with GRACE/GFO measurements, effectively enhancing spatial resolution. Most recently, Xiong et al. [19] developed a joint inversion downscaling framework based on independent component analysis, fusing WGHM spatial patterns with GRACE/GFO temporal variations to reconstruct monthly TWSA at 50 km resolution. Beyond assimilation, statistical and machine learning approaches have also been widely used to improve the spatial resolution of GRACE/GFO. Vishwakarma et al. [27] used partial least squares regression to establish a statistical relationship between hydrological model outputs and observations, enabling the improving the spatial resolution while preserving large-scale consistency. Agarwal et al. [28] applied a machine-learning approach to downscale GRACE-estimated groundwater in California’s Central Valley, recovering sub-basin patterns consistent with wells.
In addition to efforts aimed at improving the spatial resolution of GRACE/GFO-based TWSA, understanding the driving mechanisms of TWSA variability is equally important. TWSA is strongly modulated by climatic and eco-hydrological factors, including precipitation, runoff, evapotranspiration, and vegetation dynamics [29,30]. In general, precipitation, evapotranspiration, and runoff act as the primary controls on monthly to interannual water storage changes at the basin scale [31,32,33]. Vegetation and surface energy constraints, proxied by NDVI, leaf area index (LAI), surface net solar radiation (SSR), and near-surface wind (WIN), regulate land–atmosphere exchange and water use, thereby influencing how inputs are partitioned among soil moisture, surface water, and groundwater [34,35,36]. Quantifying the relative contributions of these drivers is essential for interpreting storage changes across scales. Recent advances in explainable machine learning make this attribution feasible without prescribing a fixed process model [37,38]. These developments allow us to employ the extreme gradient boosting (XGBoost) algorithm together with shapley additive explanations (SHAP) to attribute TWSA variability in the PRB to climatic and ecological predictors and to capture the statistical interactions among them.
In this study, we used a downscaling TWSA product for the PRB, derived from a joint inversion downscaling method that combines GRACE/GFO satellite observations with WGHM model outputs. We evaluated the performance of the downscaled product at both basin and pixel scales, focusing on its ability to preserve high-resolution spatial detail while correcting the temporal signal of the model. Terrestrial water flux (TWF) was derived from the downscaling TWSA and compared with the water balance components to assess consistency. Interannual variations in TWSA were further analyzed in relation to precipitation and large-scale climate variability indices. Finally, we identified the dominant drivers of water storage variability using a machine learning attribution framework and examine the performance of the downscaled product in capturing typical drought and flood events in the basin.

2. Data

2.1. Downscaling GRACE/GFO-Derived TWSA

This study uses the monthly GRACE/GFO Level-2 gravity field solutions provided by the Center for Space Research (CSR), covering the period from April 2002 to December 2022. The data are expressed as fully normalized spherical harmonic coefficients up to degree and order (d/o) 60 and undergo several post-processing steps. To account for the degree-1 terms, which are not directly observed GRACE/GFO, monthly geocenter estimates from Landerer [39] were incorporated. In addition, the C20 and C30 were replaced with values derived from satellite laser ranging observations [40,41]. A mean gravity field over the period January 2004 to December 2009 was removed to derive anomalies. Glacial isostatic adjustment (GIA) was corrected using the ICE-6G model [42], and south–north stripe errors were used the DDK3 decorrelation filter [43,44]. Topographic corrections were applied following [45]. The processed spherical harmonic coefficients were then synthesized into 0.5° grids [46]. It is worth noting that although the data are gridded at 0.5° resolution, the effective spatial resolution of GRACE/GFO remains approximately 330 km due to the inherent maximum spherical harmonic d/o 60 of the Level-2 data.
While GRACE/GFO provides reliable large-scale mass change, its coarse native resolution (~330 km) limits its ability to resolve fine-scale hydrological variations. To overcome this limitation, we performed a spatial downscaling by integrating temporal signal of GRACE/GFO-derived TWSA with high-resolution spatial patterns from the WGHM model. Specifically, we first decomposed TWSA simulated from WGHM into several components using spatiotemporal decomposition approach (e.g., independent component analysis). This yielded a set of spatial patterns corresponding to their temporal evolutions. Since WGHM tends to underestimate the temporal variation of TWSA, we only retain its spatial patterns as basis functions. To ensure compatibility with GRACE/GFO, these WGHM-decomposed spatial patterns (basis functions) were truncated to the same degree/order and then smoothed using the DDK3 filter. We then used least-squares fitting to estimate adjusted temporal evolution series based on GRACE/GFO observations and the DDK3-filtered spatial patterns. This step replaces the original temporal evolution from WGHM, which typically underestimates the magnitude of storage changes, with observationally constrained signals from GRACE/GFO. The final downscaled TWSA is reconstructed by combining these adjusted temporal series with the unfiltered high-resolution spatial basis functions from WGHM. Further methodological details can be found in Xiong et al. [19].

2.2. WaterGap Global Hydrological Model Outputs

In this study, we used monthly terrestrial water storage outputs from the WaterGAP Global Hydrology Model (WGHM) version 2.2e for the period 2002–2022 [47]. WGHM simulates water flows and storage across all land areas except Antarctica, providing gridded outputs at a spatial resolution of 0.5°. Unlike most land surface models, WGHM also accounts for human water use across multiple sectors, including irrigation, livestock, manufacturing, domestic supply, and thermal power plant cooling.

2.3. Hydrometeorological Data

Monthly precipitation (P) data were obtained from the CN05.1 gridded observational dataset, which incorporates approximately 2400 meteorological stations across China and is generated using an anomaly-based interpolation approach [48]. Monthly evapotranspiration (E) data were sourced from the Global Land Evaporation Amsterdam Model (GLEAM v3.8a) at a spatial resolution of 0.25°, derived from satellite observations and based on the Priestley and Taylor equation [49]. Basin-scale monthly runoff (R) for the Pearl River Basin was extracted from the River Sediment Bulletin of China [50].

2.4. Climate Indices

As a dominant mode of interannual climate variability, the ENSO significantly influences regional hydroclimatic conditions. In this study, we used the Multivariate ENSO Index (MEI) to represent ENSO intensity, with positive (negative) values indicating warm (cold) phases. The PDO, characterized by the leading mode of North Pacific monthly sea surface temperature variability, also affects climate variability in East Asia [51]. These data were accessible for download at https://psl.noaa.gov/data/timeseries/month/, accessed on 23 November 2025.

2.5. Auxiliary Data

To support the interpretation of terrestrial water storage changes, we used four auxiliary datasets. The monthly NDVI data were derived from the MODIS/Terra MOD13C2 product (Collection 5), which provides global, cloud-free composites at 0.05° resolution (https://doi.org/10.5067/MODIS/MOD13C2.061, accessed on 23 November 2025). Monthly SSR was obtained from the ERA5-Land reanalysis dataset [52], representing the net incoming shortwave radiation at the surface. In addition, monthly WIN and LAI were also obtained from ERA5-Land, providing information on atmospheric dynamics and vegetation canopy conditions relevant to hydrological processes.

3. Methodology

3.1. Water Balance Equation

According to the water balance equation, which describes the relationship between TWSA and P, E, and R. The terrestrial water flux (TWF) is computed as:
d T W S d t = T W S A t + 1 T W S A ( t 1 ) 2 = P E R
where P, E, and R represent precipitation, evapotranspiration, and runoff (all in mm/month), respectively. The left-hand side denotes the monthly rate of TWSA derived from GRACE/GFO, approximated using centered finite differences [53]. To suppress high-frequency noise, we smoothed the P-E-R series using a (1/4, 1/2, 1/4) weighting across the previous, current, and following months [54]. Ideally, GRACE-derived TWF should match the P-E-R estimate at the basin scale.

3.2. Performance Metrics

Three commonly used evaluation metrics were employed to assess the performance of the downscaled TWSA data: Pearson’s correlation coefficient (CC), Nash-Sutcliffe efficiency (NSE), and normalized root-mean-square error (NRMSE).
N R M S E = 1 n ( y x ) 2 ( x m a x x m i n )
N S E = 1 ( y x ) 2 ( x x ¯ ) 2
C C = ( y y ¯ ) ( x x ¯ ) ( y y ¯ ) 2 ( x x ¯ ) 2
where x denotes the GRACE/GFO-derived TWSA, and y represents the predicted TWSA (e.g., downscaled products or WGHM outputs). x m a x and x m i n are the maximum and minimum values of GRACE/GFO-derived TWSA, respectively. x ¯ and y ¯ respectively indicate the average value of all the GRACE/GFO-derived and predicted TWSA.

3.3. Quantifying Drivers of TWSA

To investigate the relative importance of different driver factors in controlling TWSA, we applied the XGBoost regression model [55]. XGBoost builds an ensemble of regression trees in a stage wise manner to minimize a regularized loss function, using second order gradient information, shrinkage and feature subsampling to improve predictive performance while controlling model complexity. In this study, the model was trained with monthly P, E, R, NDVI, LAI, SSR, and WIN as input features. To interpret the model outputs and quantify the contribution of each predictor, we used SHAP, a game-theoretic approach that assigns each feature a consistent and locally accurate importance value for individual predictions [56]. The SHAP values allow us to assess both the impact of each variable on TWSA and its temporal dynamics across different months and subregions.

3.4. Drought Severity Index

Hydrological droughts in the PRB were identified using the GRACE-based drought severity index (DSI), following Zhao et al. [10]. The DSI is calculated as:
D S I = T W S A T W S A ¯ σ
where T W S A ¯ denote the climatology of the TWSA (detrended), and σ is standard deviation. Based on the computed DSI value, drought severity was classified into discrete levels as outlined in Table 1.

3.5. Flood Potential Index

The flood potential index (FPI) serves as a proxy indicator of flood risk for a given region and can be derived from monthly mean precipitation anomalies and GRACE/GFO-based TWSA [9]. In this study, we adopted the approach proposed by Reager and Famiglietti [9] to calculate the FPI for the PRB, with a standardization modification based on Xie et al. [57]. The detailed equations can be found in Reager and Famiglietti [9] and Xie et al. [57]. Based on the FPI value, we classified flood risk into three categories: low risk (FPI < 0.4), moderate risk (0.4 ≤ FPI < 0.7), and high risk (FPI ≥ 0.7).

4. Results

4.1. Performance of Downscaled TWSA

4.1.1. Basin-Averaged Comparison

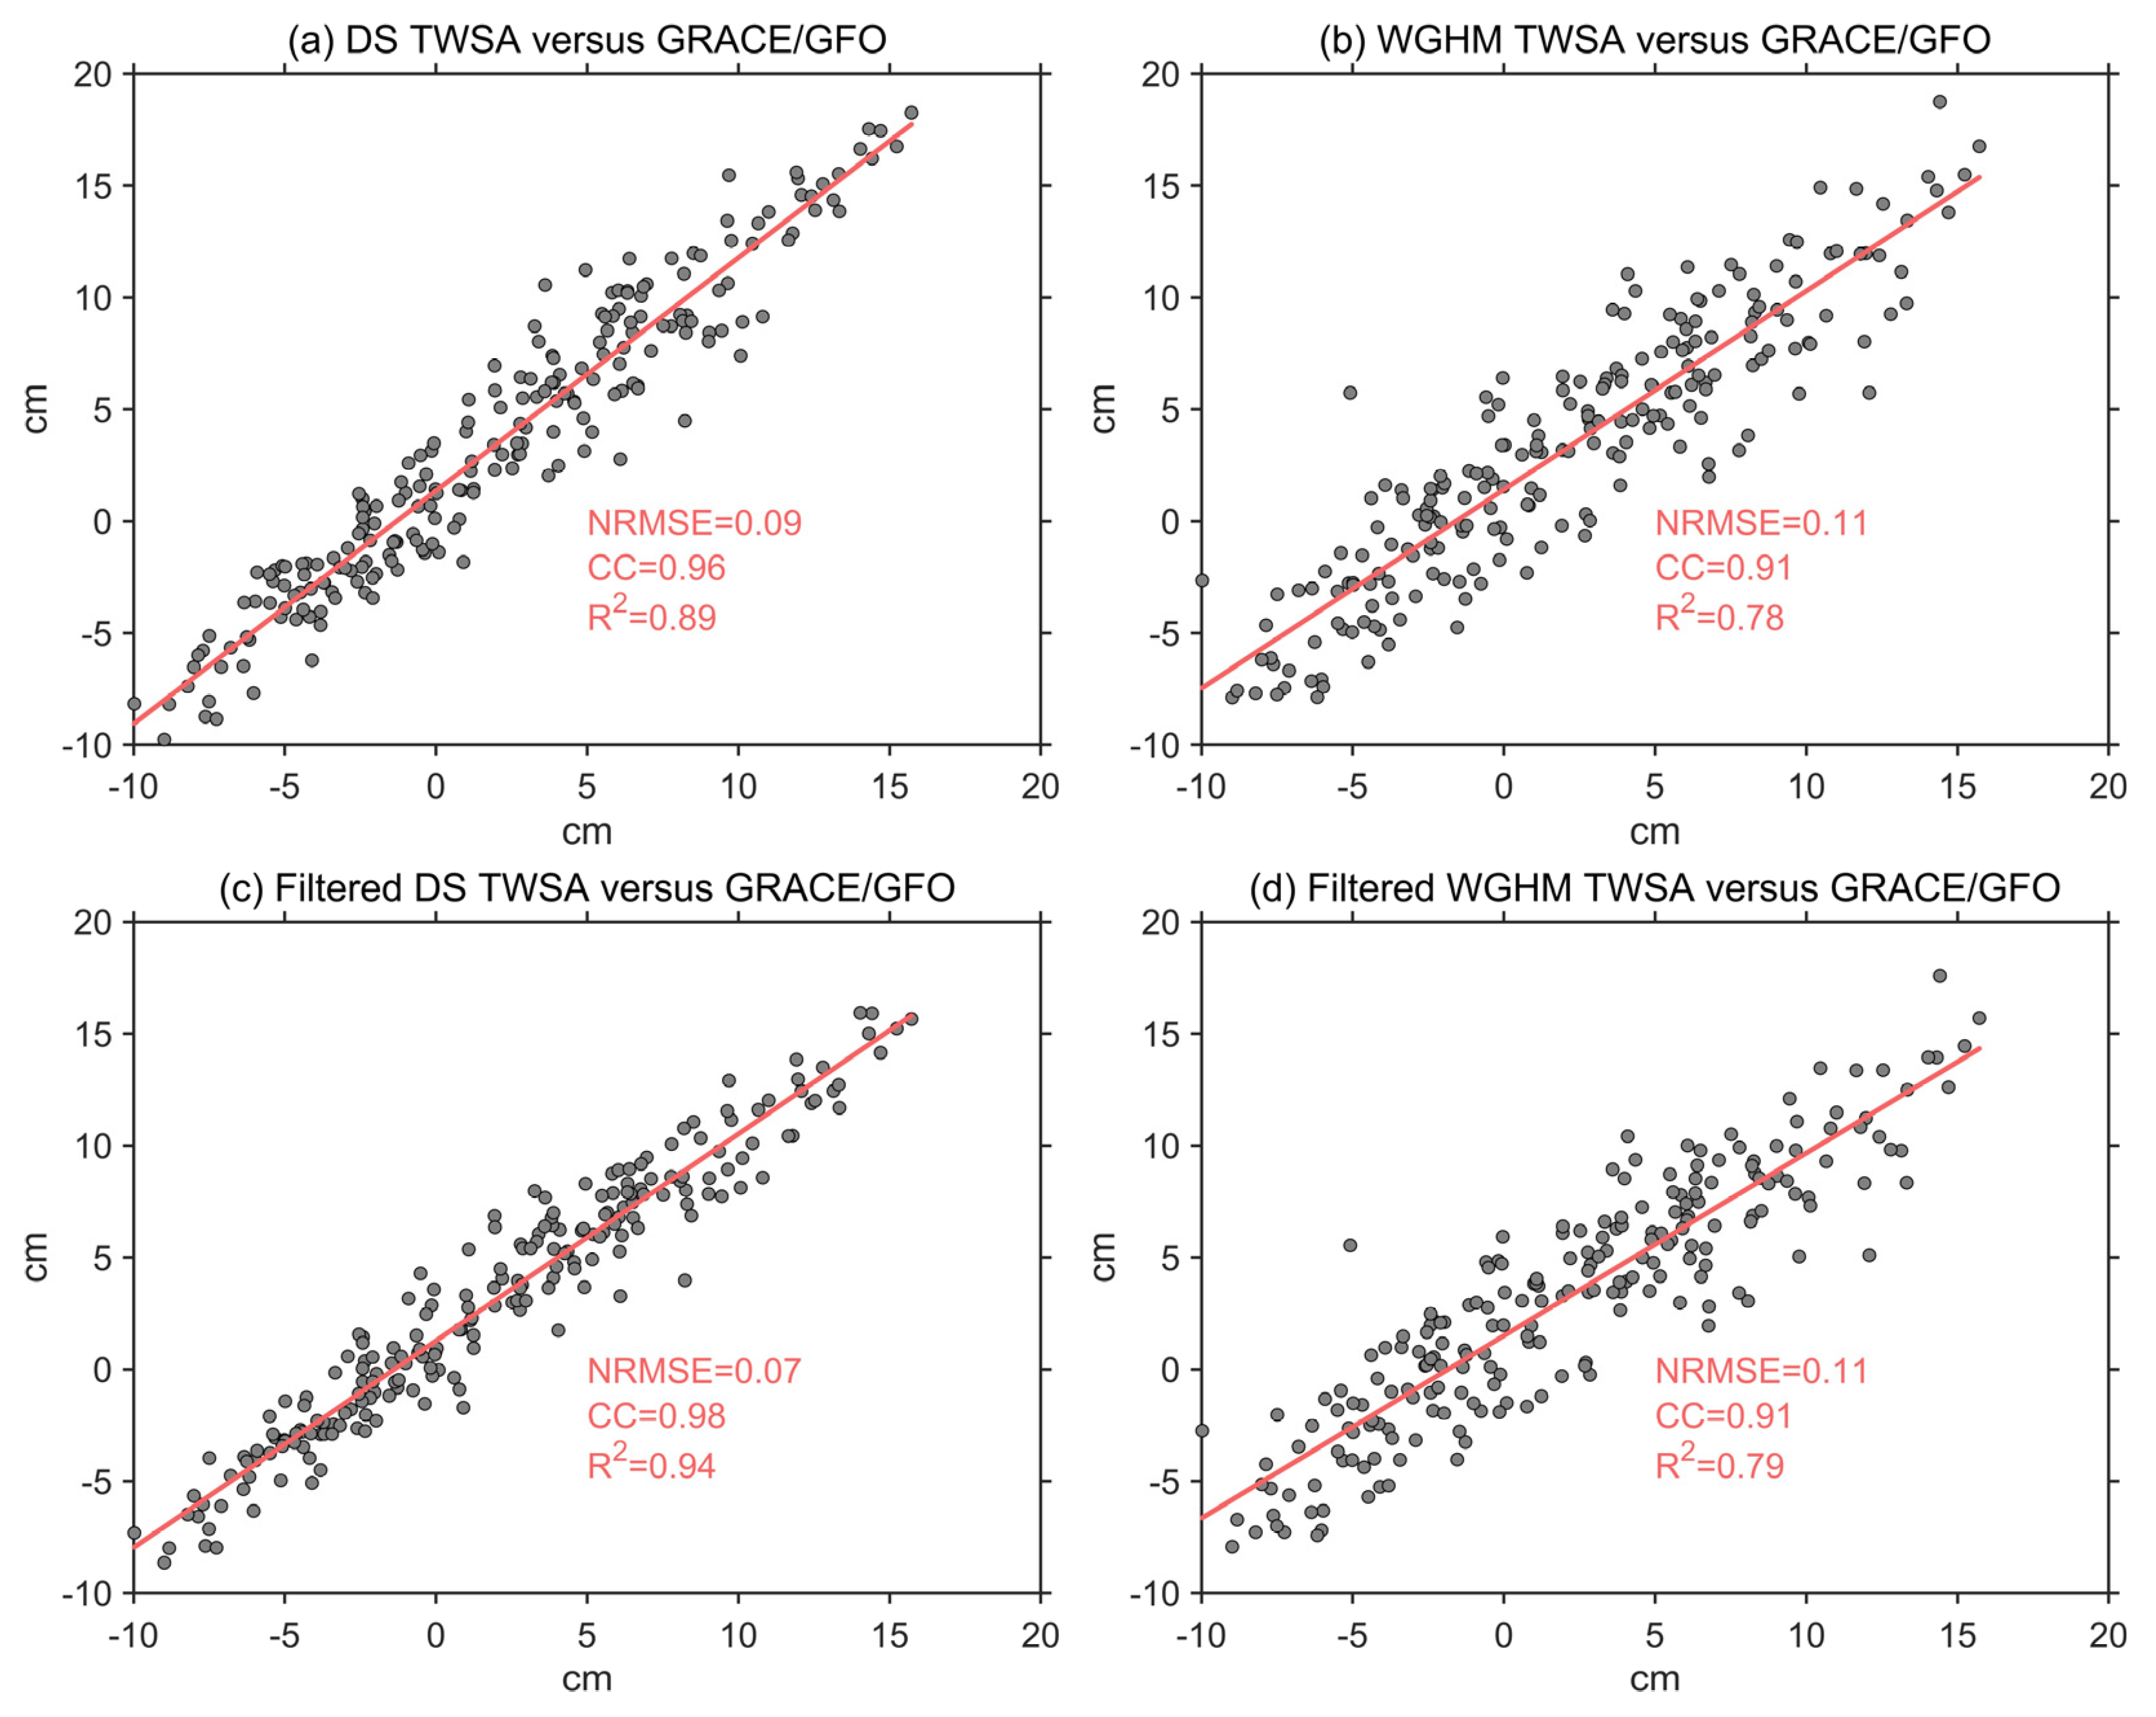
To evaluate whether the downscaled product outperforms WGHM, we compared their basin-averaged TWSA time series against GRACE/GFO observations in the PRB. Given that the PRB falls within the effective spatial resolution of GRACE/GFO [17,58], the observed basin-averaged TWSA serves as a reliable reference for validation. Figure 2a,b show that, compared to WGHM, the downscaled product aligns more closely with the raw GRACE/GFO observations, with lower NRMSE (0.09) and higher CC (0.96) and R2 (0.89) values. As the raw GRACE/GFO TWSA signals are smoothed by DDK3 filter, they contain leakage errors. To ensure a fair comparison, both the downscaled product and WGHM outputs were subjected to the same DDK3 filtering (Figure 2c,d). The results show that the downscaled product still outperforms WGHM. Moreover, filtering improves the agreement between the downscaled product and GRACE/GFO, while WGHM shows little improvement after filtering. These results confirm that the joint inversion downscaling method effectively calibrates the temporal signal of WGHM using GRACE/GFO observations, leading to improved performance.

4.1.2. Pixel-Level Comparison at GRACE/GFO Resolution

Due to the lack of independent high-resolution TWSA measurements in the PRB, direct pixel-wise validation of the downscaled estimates remains challenging. Instead, the evaluation was performed by spatially upscaling the downscaled TWSA to match the effective resolution of GRACE/GFO. Specifically, both the downscaled and WGHM products were subjected to spherical harmonic expansion truncated to the same maximum degree and order, followed by same filtering. This procedure ensures that all datasets are evaluated at a consistent spatial scale, allowing for an indirect yet comparison. A poor agreement between the filtered results and GRACE/GFO would indicate unreliability, whereas strong agreement would support its relative reliability.
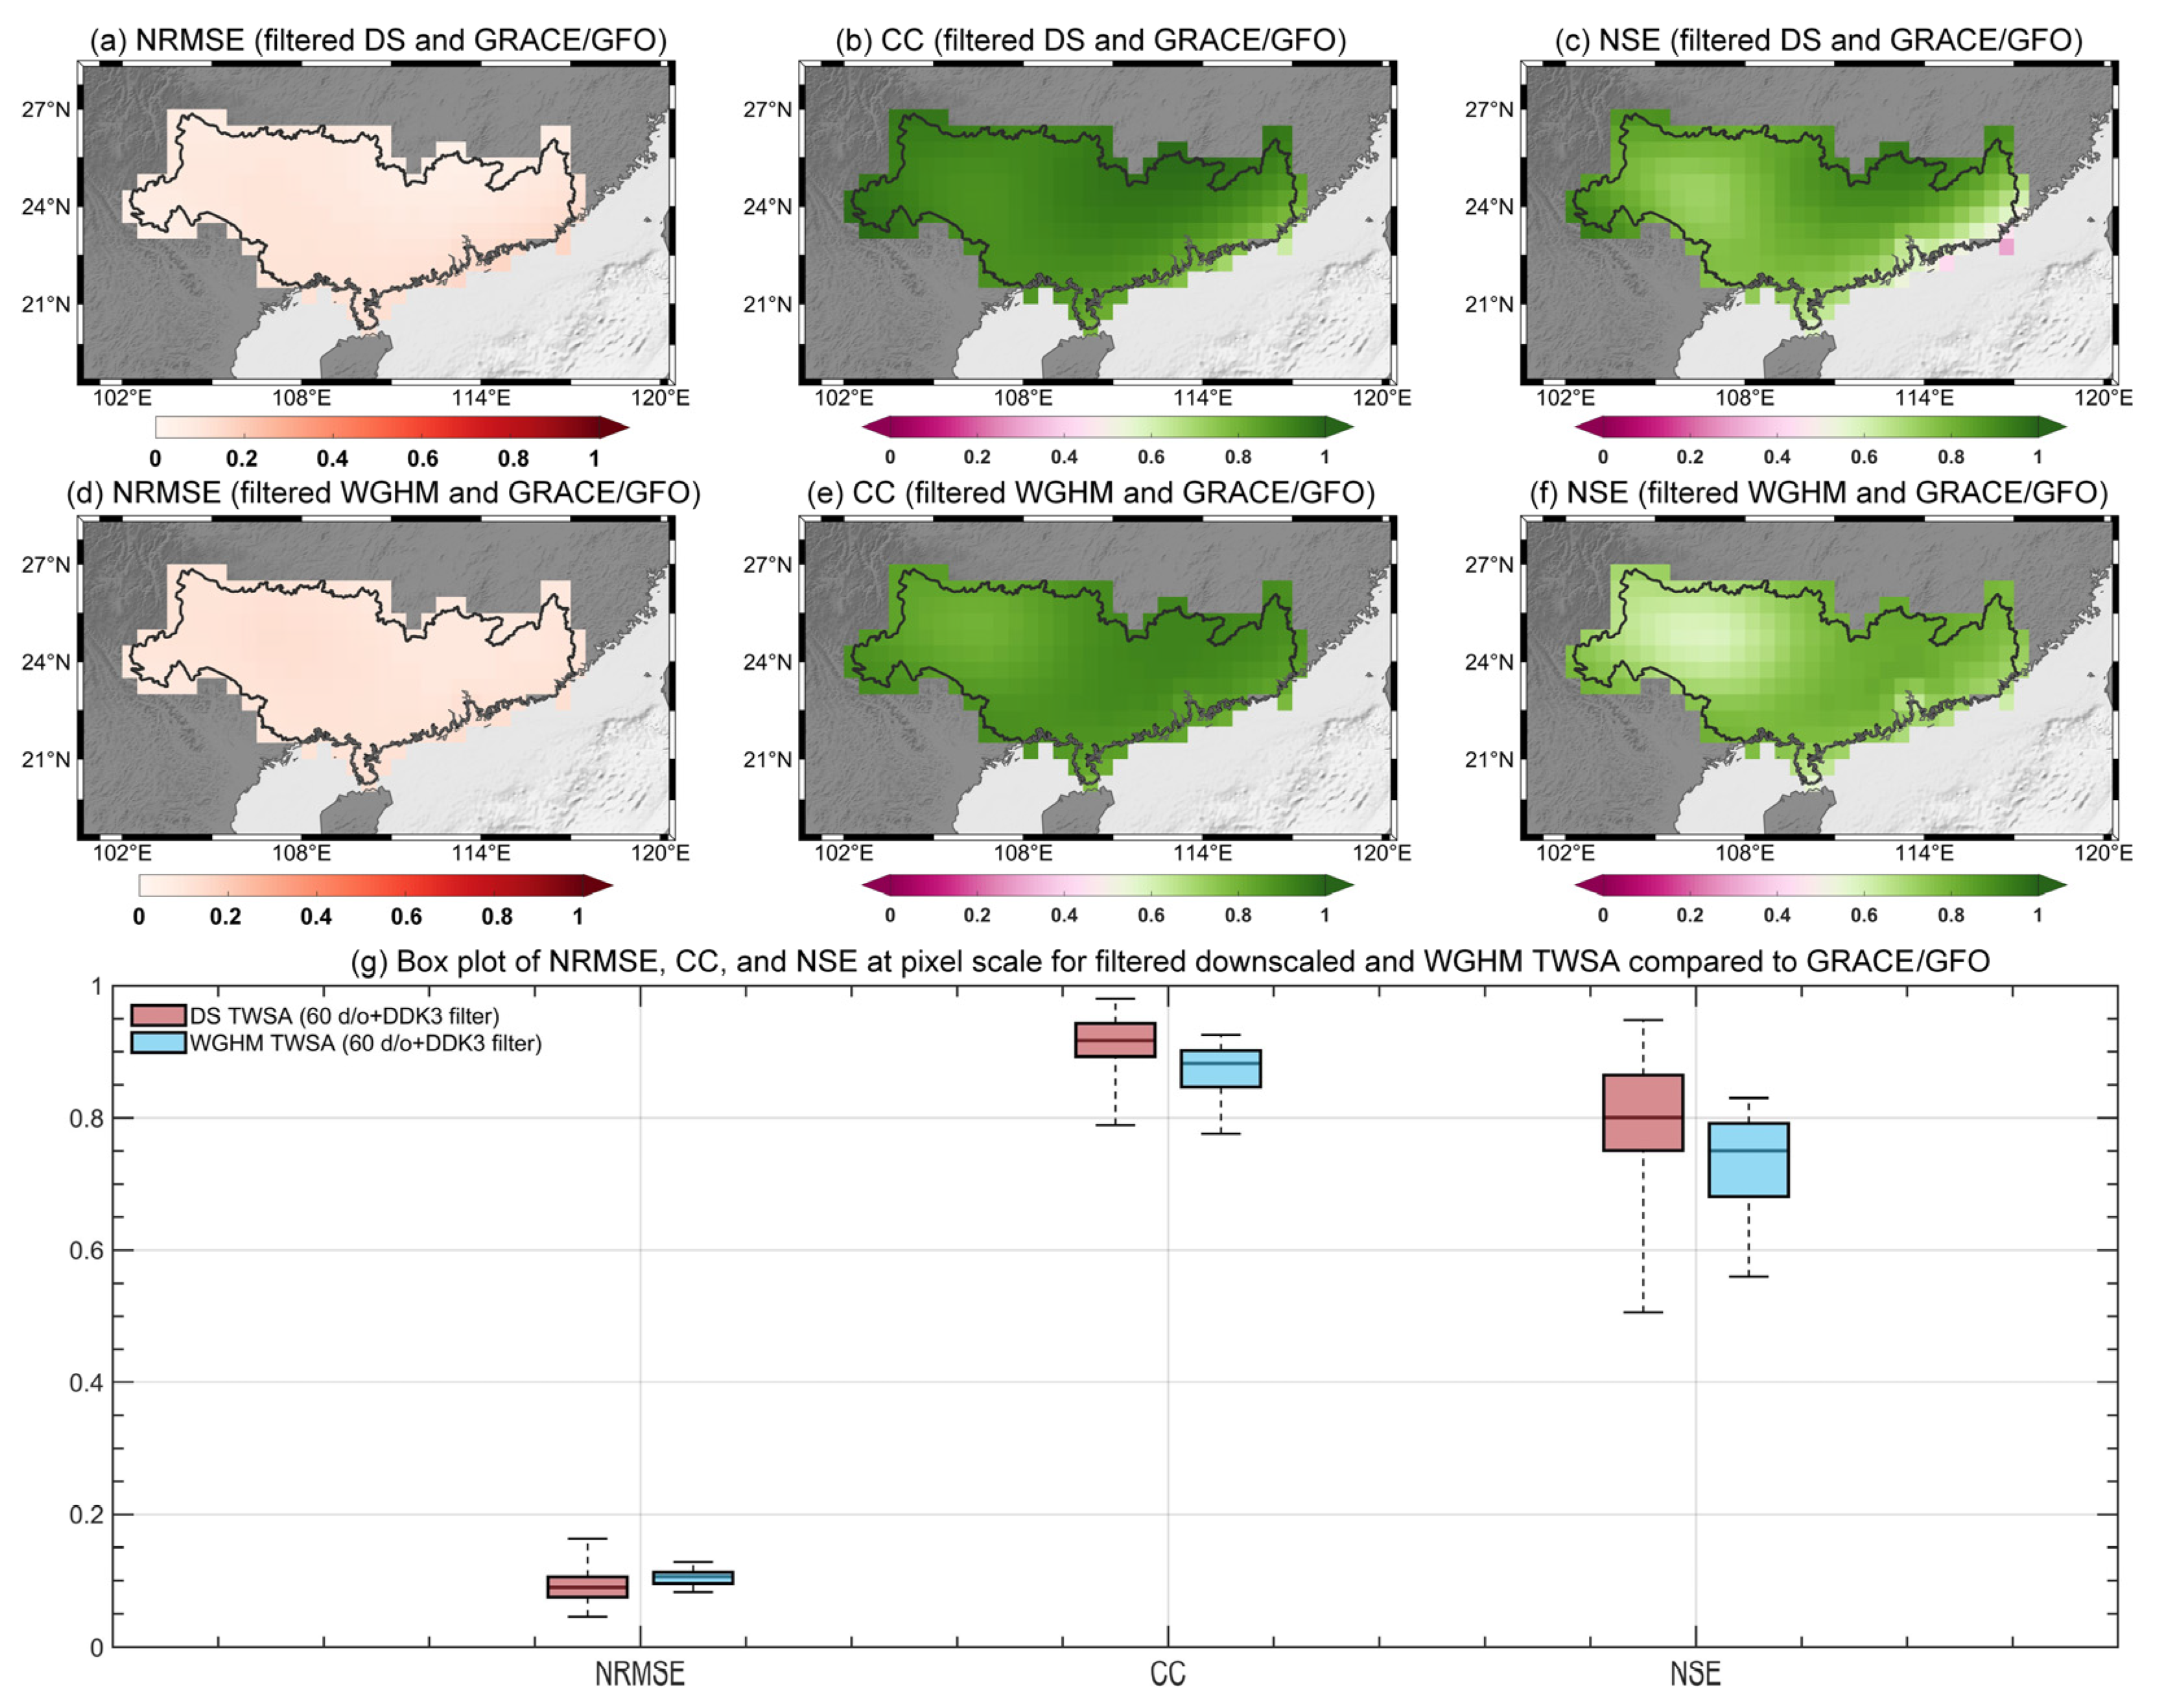
To quantify the performance, we computed three evaluation metrics (NRMSE, CC, and NSE) at each pixel by separately comparing the filtered downscaled and WGHM TWSA products with GRACE/GFO observations (Figure 3). The spatial patterns of these metrics show that the downscaled product consistently outperforms WGHM in the PRB. At pixel scale, the median values of NRMSE, CC, and NSE for the downscaled product are 0.09, 0.92, and 0.80, respectively. These results demonstrate that the downscaling approach improves the agreement with GRACE/GFO not only at basin scale but also at pixel scale, improving both temporal consistency and spatial fidelity relative to WGHM.
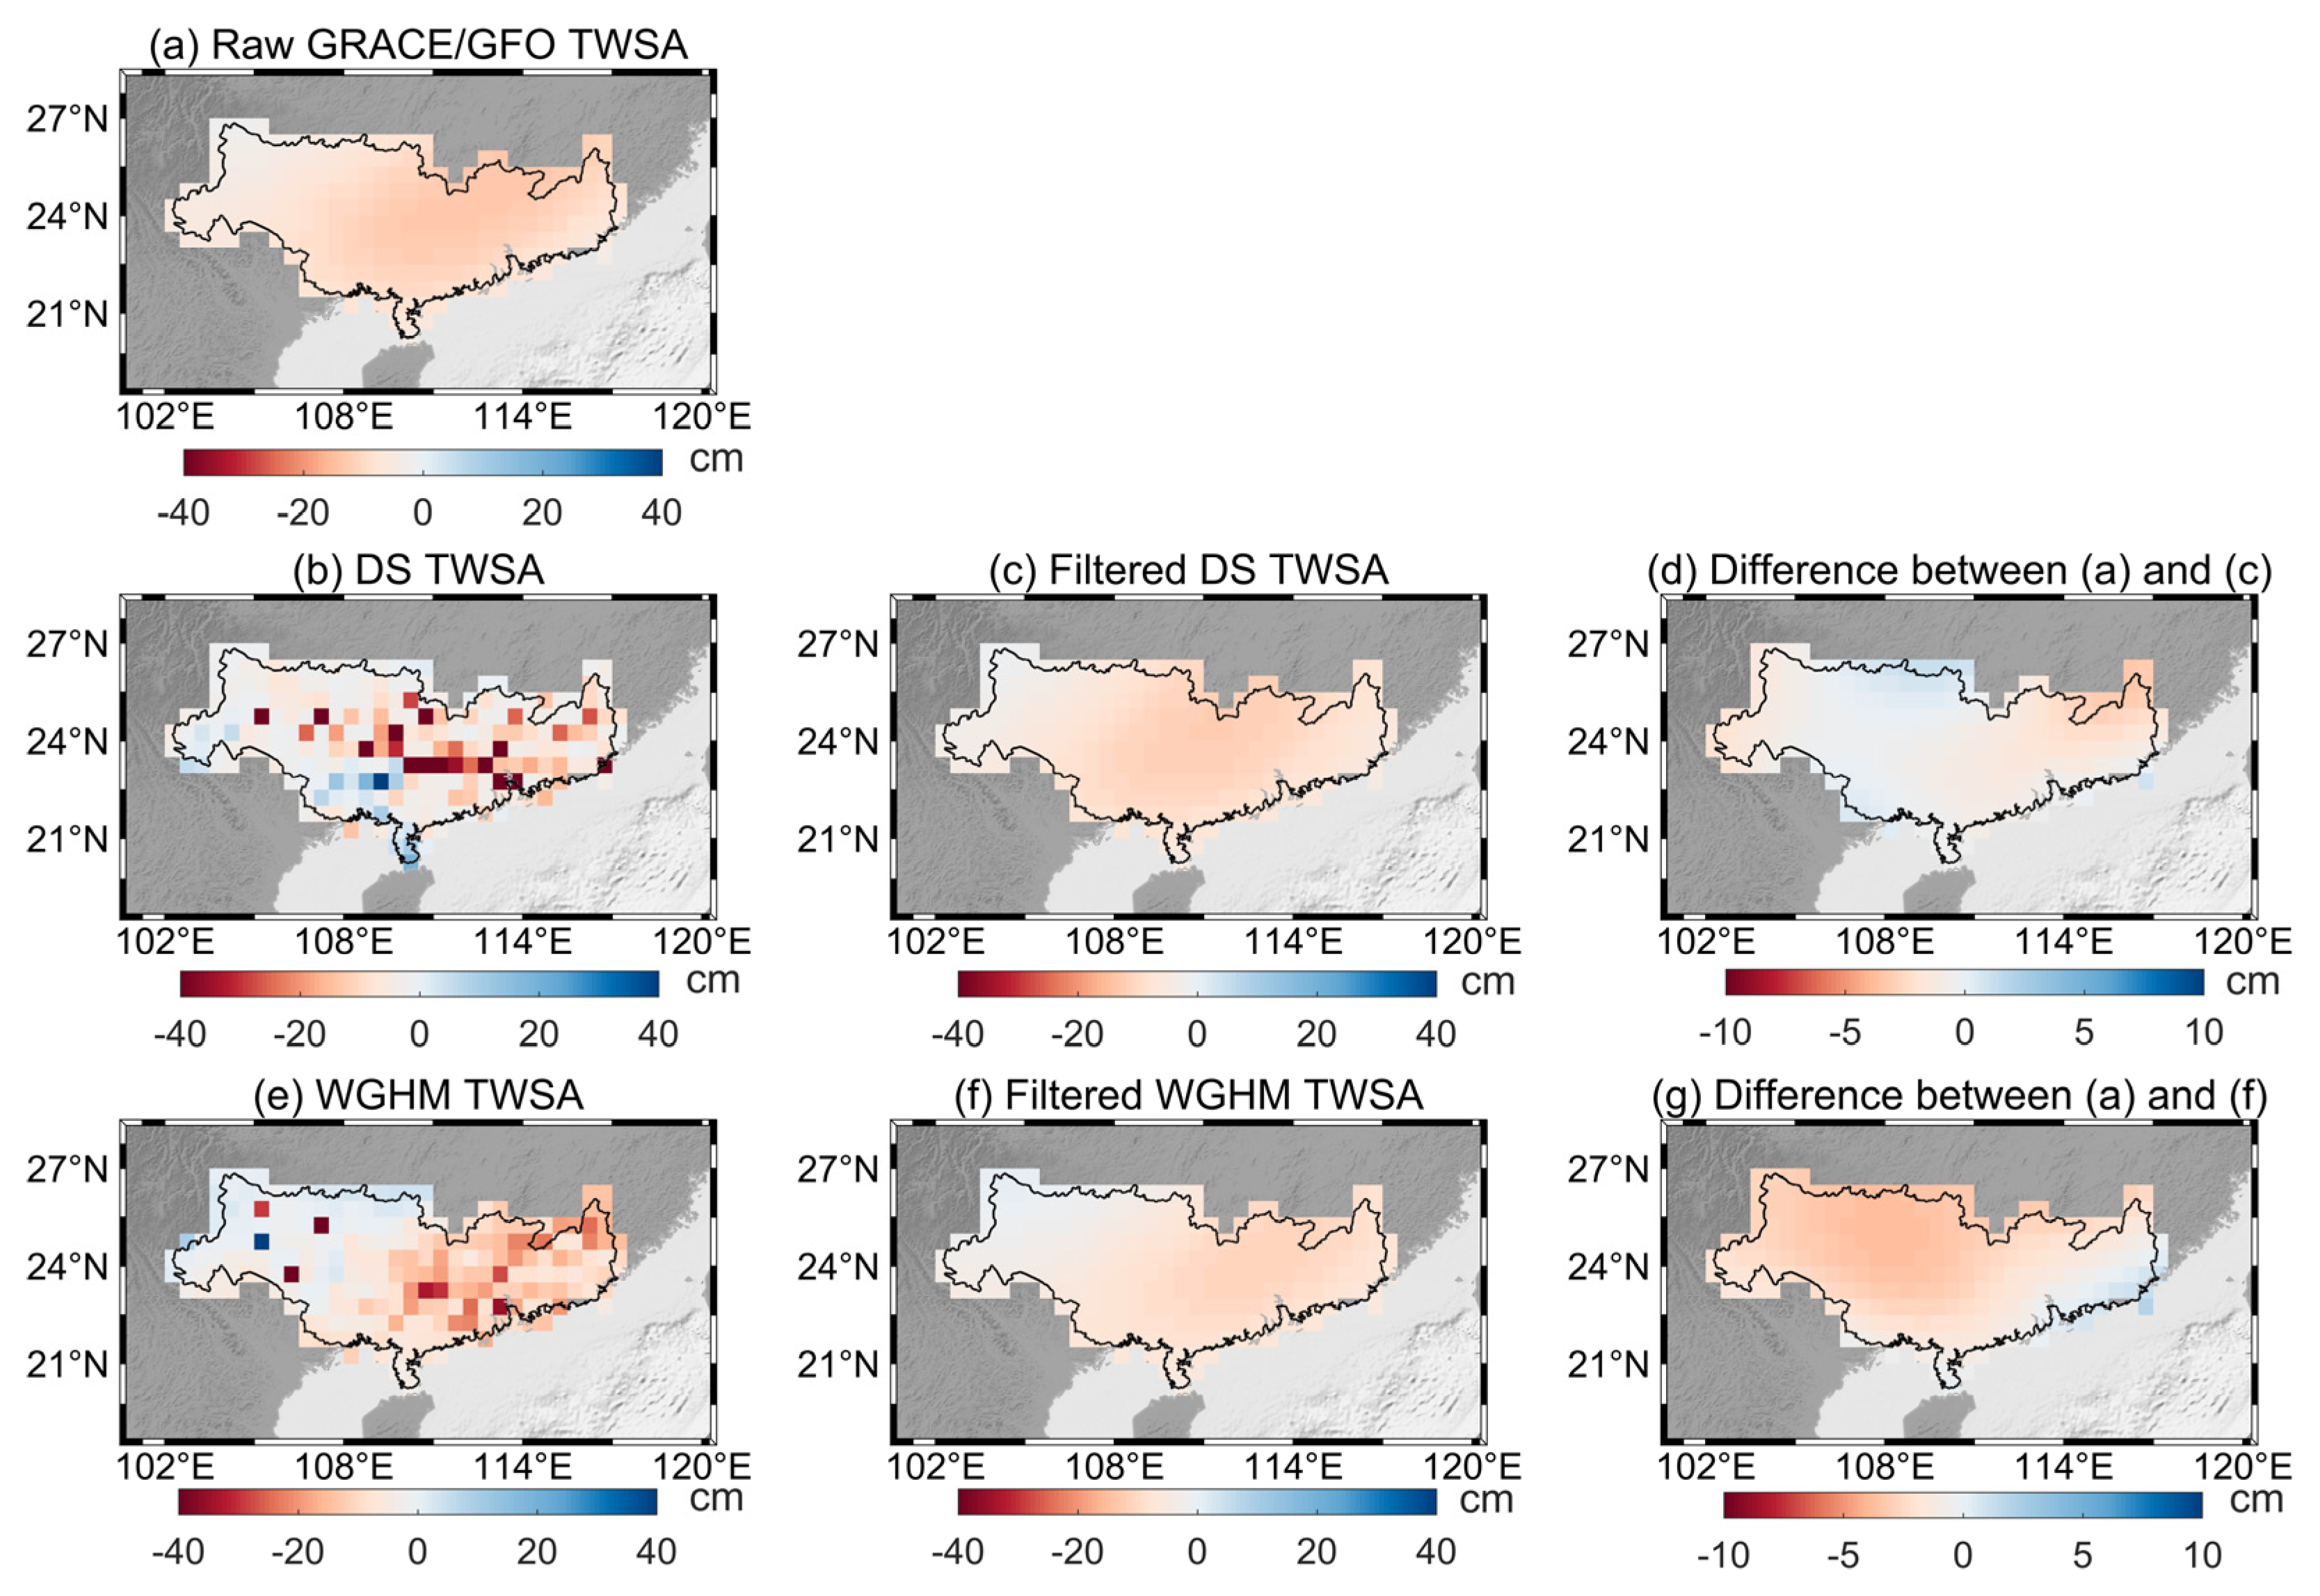
To further evaluate the pixel-level consistency at raw GRACE/GFO resolution, we analyzed the TWSA spatial patterns for January 2005 (Figure 4). The results show that downscaled product not only preserves the fine spatial resolution of WGHM (Figure 4b), but also effectively adjusts spatial details through the incorporation of GRACE/GFO-derived temporal variations. As a result, when the spatial resolution matches that of the raw GRACE/GFO, the filtered downscaled TWSA exhibits smaller residuals (~0.73 cm) with respect to GRACE/GFO, compared to the filtered WGHM product (~2.43 cm). This indicates that the filtered downscaled product shows better agreement with the raw GRACE/GFO observations. These results suggest that the integration of GRACE/GFO temporal information successfully adjusts the spatial pattern of WGHM, resulting in improved agreement with smoothed spatial patterns observed by GRACE/GFO.

4.1.3. Comparison of Water Fluxes

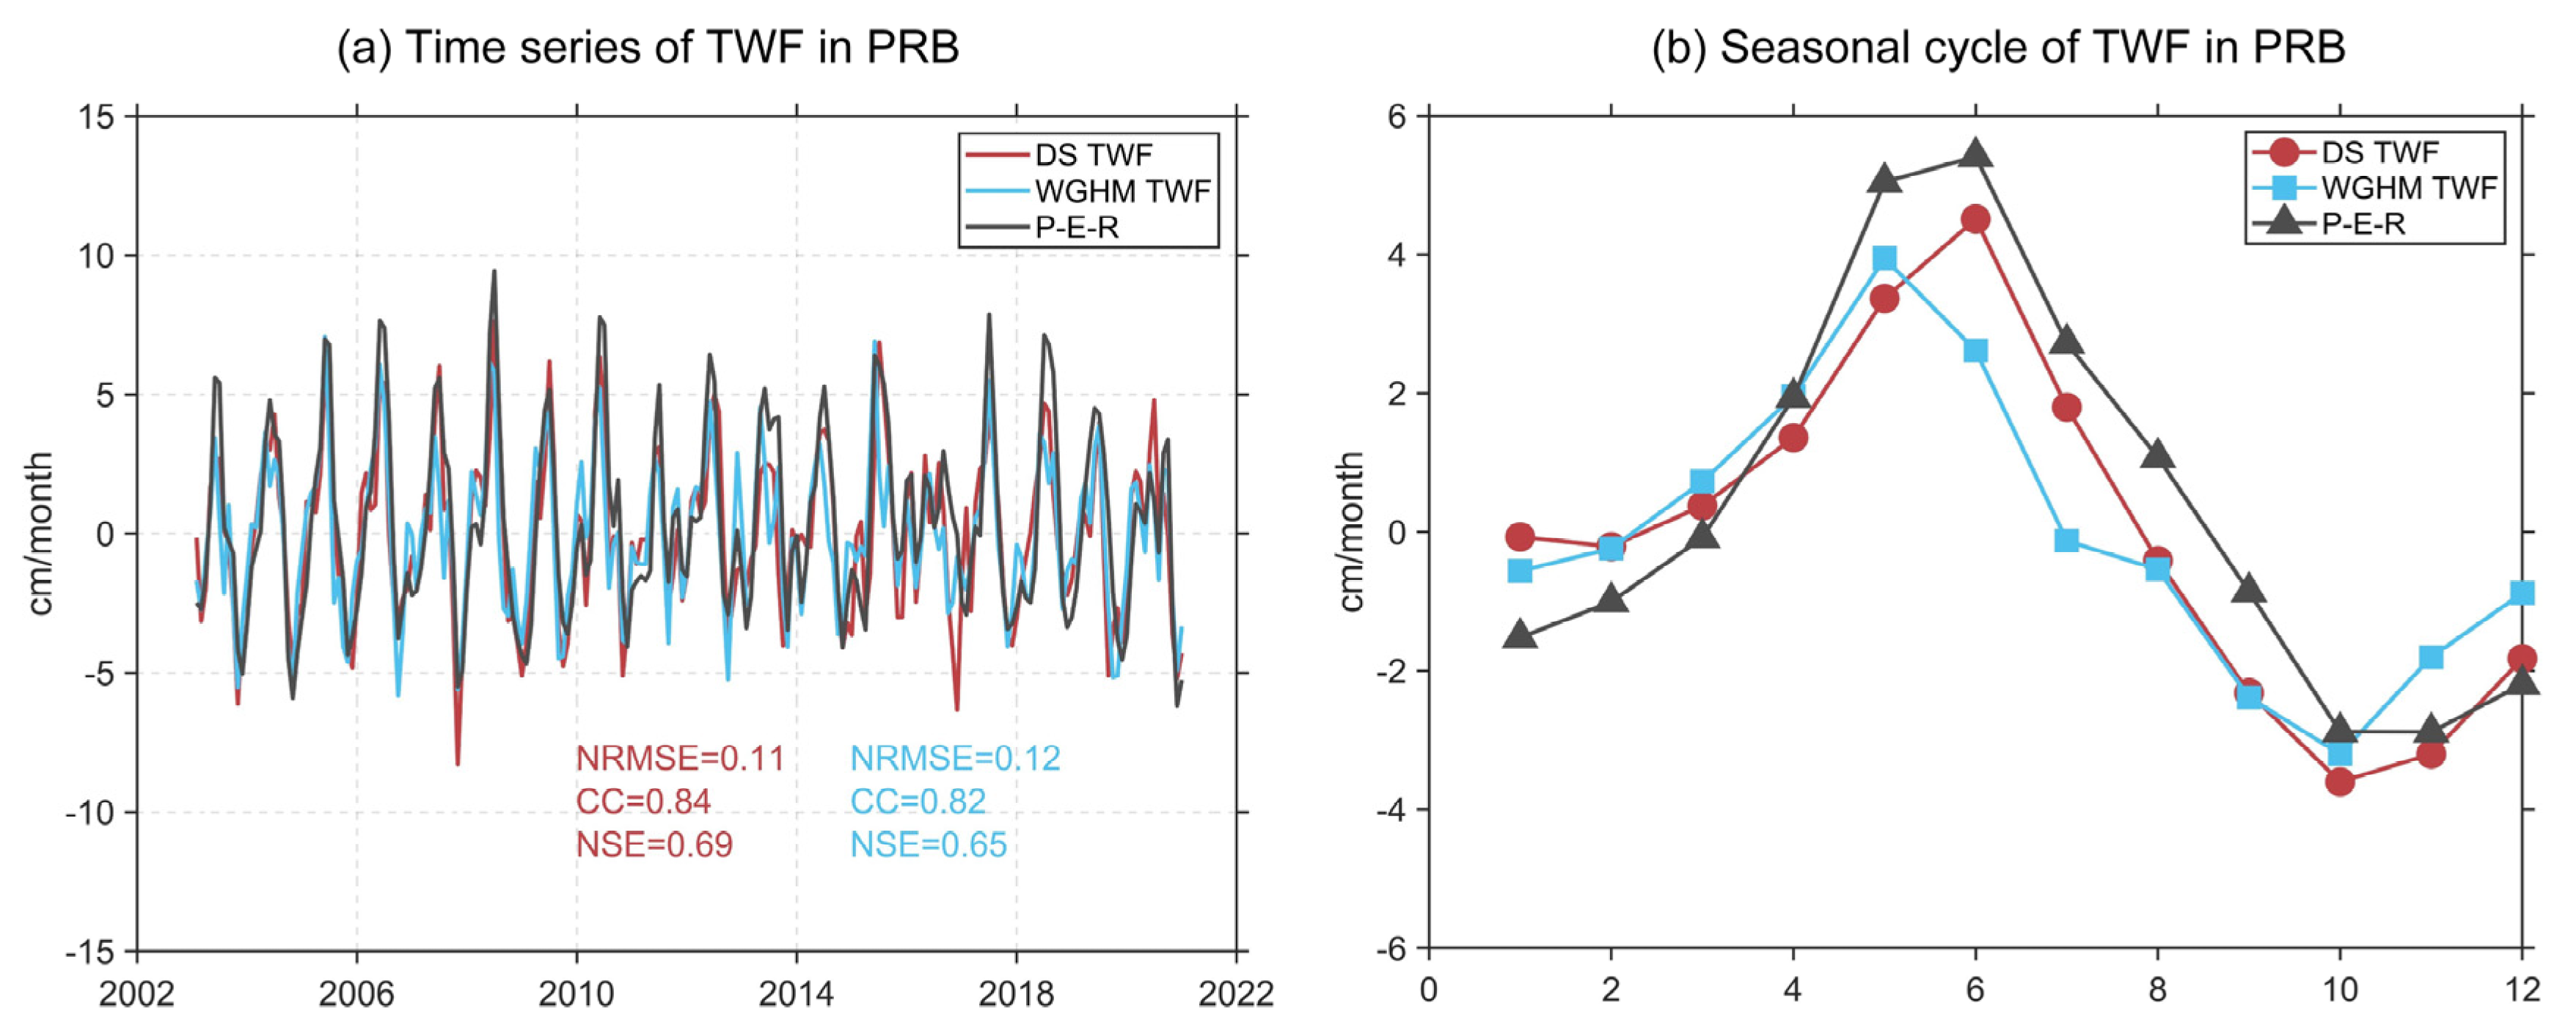
To independently evaluate the performance of the downscaled product in TWF, we compared TWF estimates derived from downscaled and WGHM products against those computed from the water balance equation. Figure 5 presents the time series of monthly TWF and the corresponding seasonal cycle in the PRB during 2003–2020. The results show that the downscaled product exhibits improved agreement with the water balance-based TWF estimates relative to WGHM, as reflected by consistent improvements in NRMSE (0.11 compared to 0.12), CC (0.84 compared to 0.82), and NSE (0.69 compared to 0.65). In addition, as shown in Figure 5b, the seasonal peak of the downscaled TWF occurs in June, aligning with the water balance-based estimate. In contrast, WGHM exhibits an early peak in May. This consistency suggests that the GRACE/GFO observations contribute significantly to adjusting the temporal variation of the model during downscaling.

4.2. TWSA and Water Balance Components in the PRB

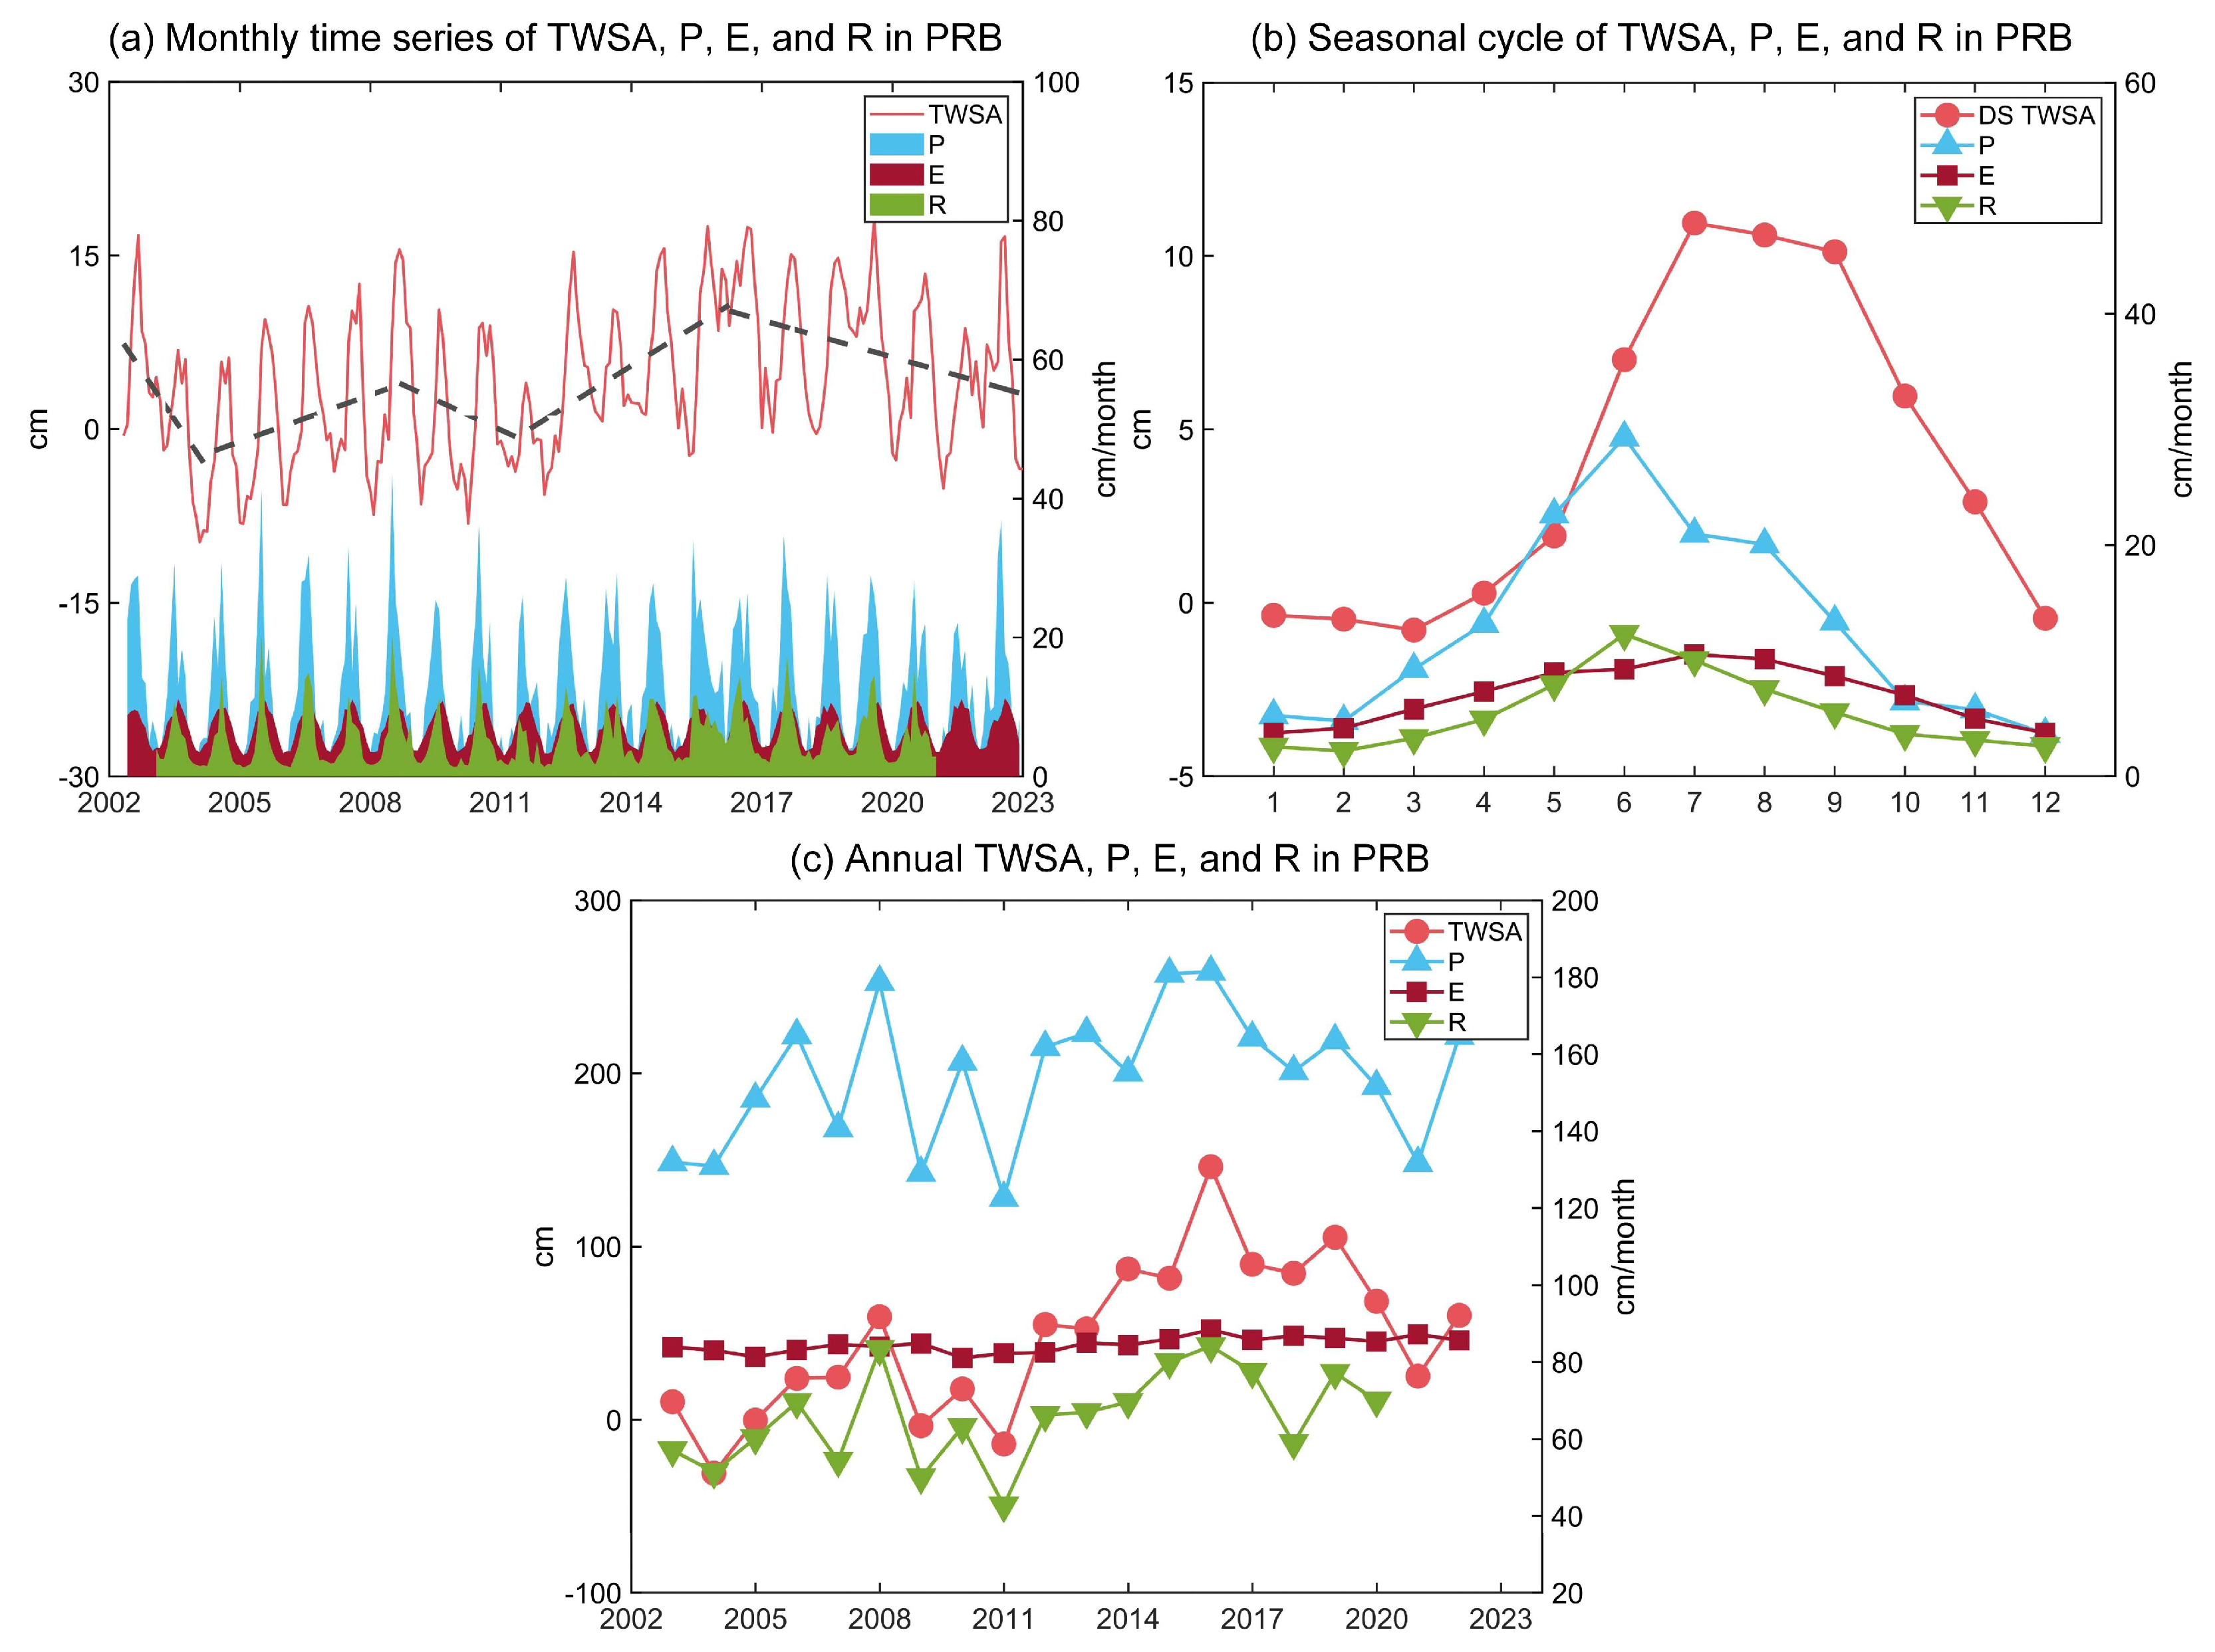
Figure 6 presents the monthly time series, seasonal cycles, and annual variations of TWSA, precipitation, evapotranspiration, and runoff in the PRB. Monthly precipitation ranges from 0.87 cm to 43.61 cm, with a mean of 13.71 cm. Evapotranspiration varies between 2.99 cm and 11.29 cm, with an average of 7.09 cm, and runoff spans from 1.32 cm to 20.39 cm, averaging 5.47 cm. Monthly TWSA time series exhibits a clear seasonal pattern with an annual amplitude of ~6 cm and a stable annual oscillation. Over the period from 2002 to 2022, the TWSA in the PRB can be separated into five distinct phases. These include a period of rapid decline with −5.59 ± 1.96 cm/yr, followed by a moderate recovery of 1.34 ± 0.49 cm/yr, a short-term renewed decline of −1.73 ± 1.29 cm/yr, a subsequent rebound of 2.33 ± 0.70 cm/yr, and a renewed decline (−1.06 ± 0.45 cm/yr). In seasonal cycle, precipitation increases substantially from April to July, exceeding both evapotranspiration and runoff, thereby contributing to water storage accumulation during this period. Notably, both precipitation and runoff peak in June, while TWSA reaches its maximum with a one-monthly delay in July. On an annual scale, Figure 6c shows that TWSA agrees with annual variations in precipitation and runoff, with CC of 0.77 and 0.82, respectively. In wet years, both TWSA and runoff show a clear increase. In dry years, they decrease accordingly. In contrast, annual evapotranspiration remains relatively stable at ~80 cm/year.
Figure 7 illustrates the time series of interannual TWSA in the PRB, along with corresponding changes in precipitation, ENSO, and PDO indices. The results show that La Niña events, particularly when coinciding with a cold phase of the PDO, are often associated with reduced precipitation and decreased water storage in the PRB. During these events, the subtropical high tends to shift northward or eastward, weakening the moisture transport to southern China and increasing the risk of drought [59]. In contrast, El Niño events accompanied by a warm PDO phase generally enhance precipitation and promote water storage accumulation. This is likely linked to the westward extension and intensification of the northwestern Pacific subtropical high, which, together with anomalous anticyclonic circulation, facilitates moisture transport toward southern China. As a result, the PRB tends to experience wetter conditions and an increase in TWSA during El Niño years.

4.3. Drivers of TWSA in the PRB

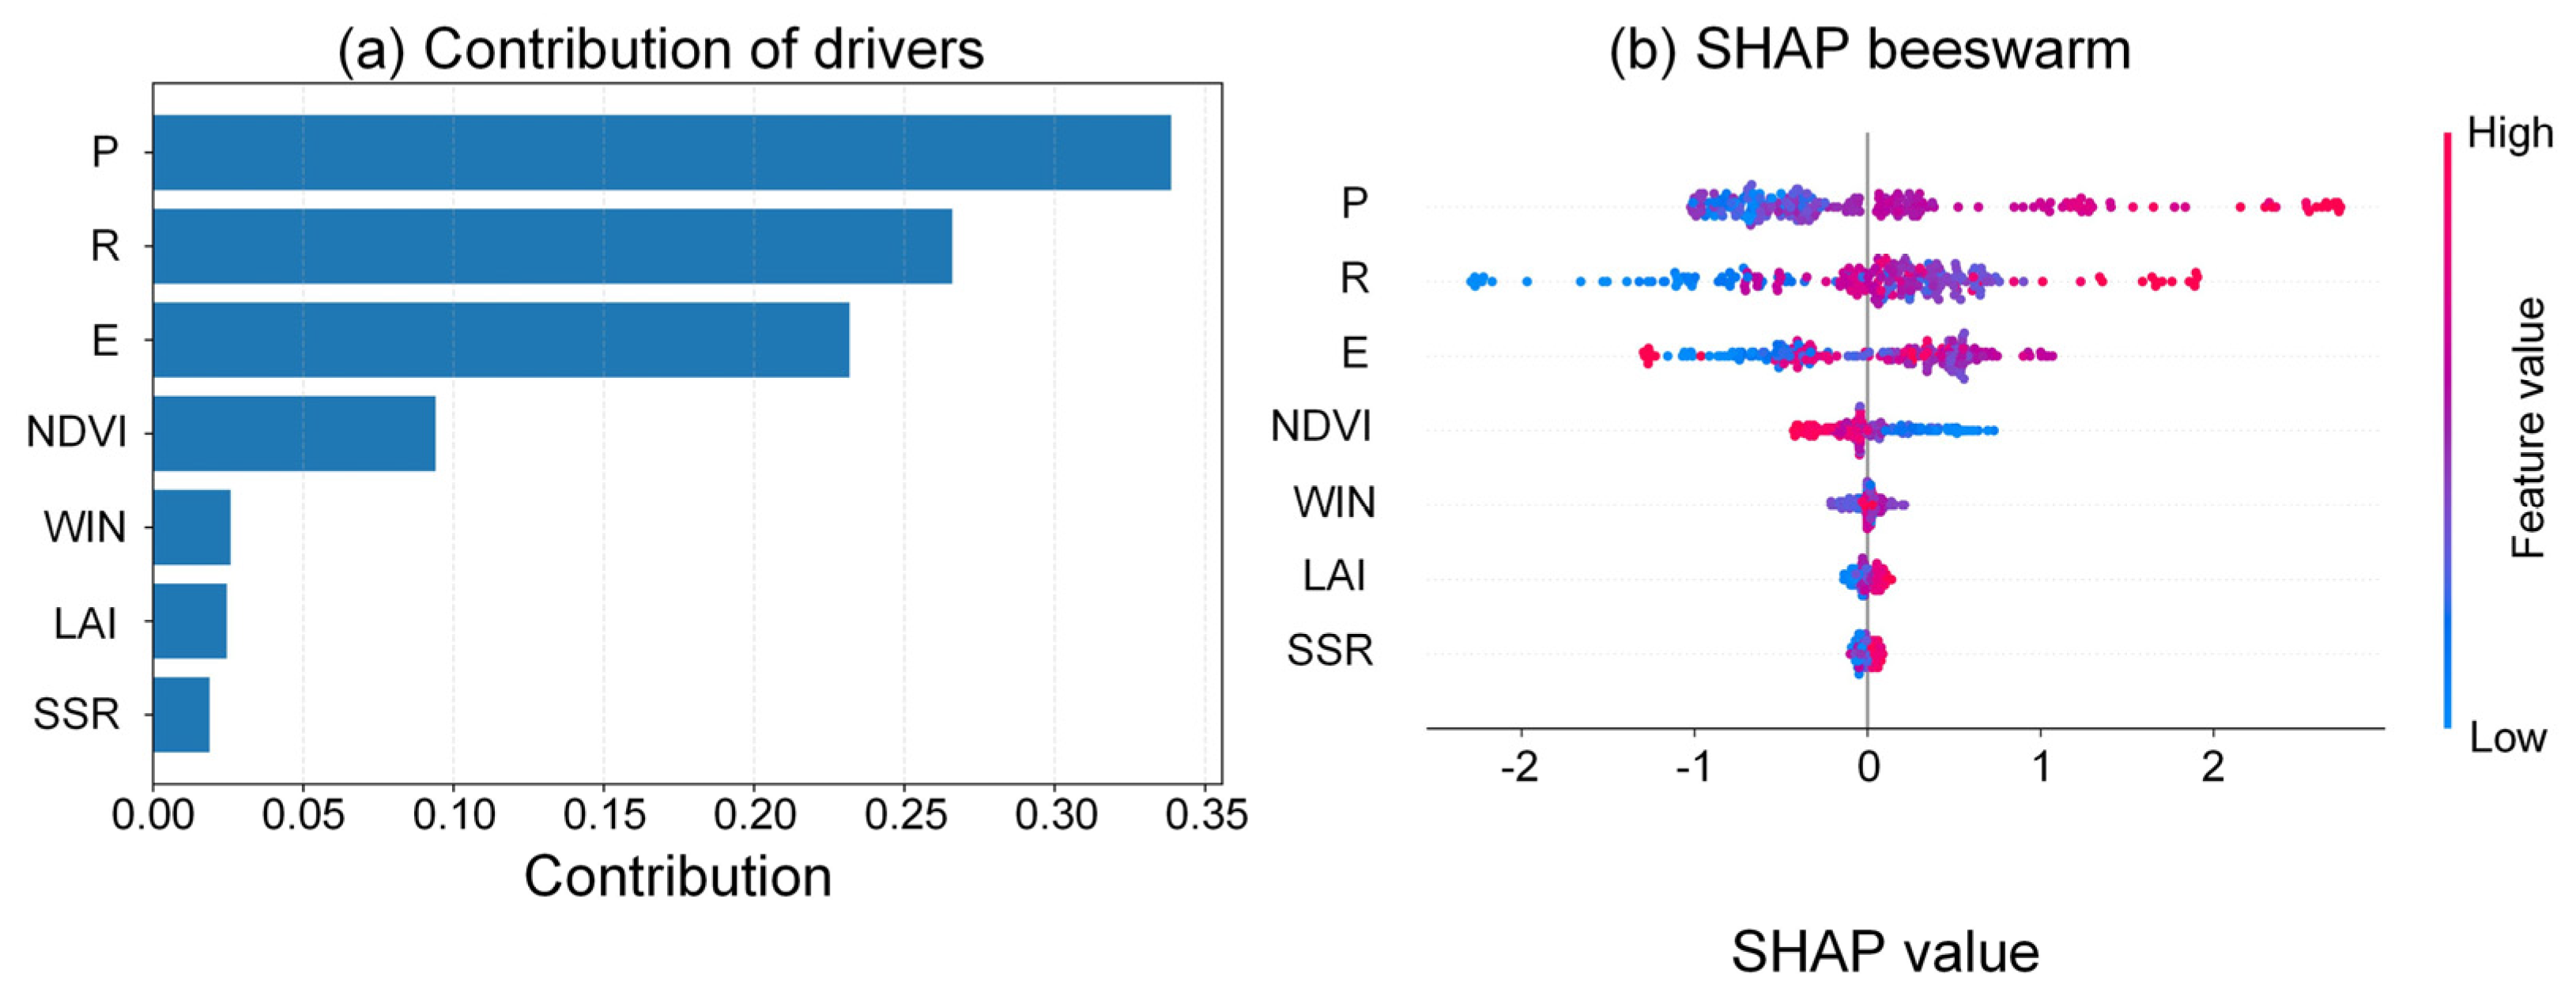
To better capture the relationship between driving factors and TWSA, we examined their interactions by constructing an XGBoost model that link the time series of each driver to that of TWSA in the PRB. We then applied the SHAP framework to quantify the relative importance of each factor. As shown in Figure 8, precipitation was the dominant driver of TWSA, contributing up to 33.88%. The positive SHAP values indicate that increased precipitation is associated with increased water storage, consistent with previous findings [60]. Runoff ranked second in importance, accounting for 26.59%. Given the strong correlation between precipitation and runoff in the PRB [61], it is likely that during periods of high precipitation, more runoff is generated, and a portion of this input is retained in the system, particularly when soil moisture and groundwater storages are not saturated, thereby increasing TWSA.
Evapotranspiration accounted for 23.18% of the TWSA variation. The positive SHAP values should be interpreted carefully, as they do not mean that ET increases water storage. In the humid PRB, heavy precipitation during the wet season supplies far more water than is lost through evapotranspiration. As a result, evapotranspiration, soil moisture, and vegetation activity all rise together when water is abundant, giving the appearance of a positive statistical link between evapotranspiration and TWSA.
Other drivers, such as NDVI, had relatively limited influence, contributing 9.4%. This negative impact is plausibly linked to increased transpiration from vegetation during summer peaks in NDVI, which may draw down soil moisture and shallow groundwater, thereby reducing TWSA [62]. Variables such as LAI, SSR, and WIN exhibited only marginal contributions, suggesting limited explanatory power in this context.

4.4. Characteristics of Hydrological Droughts and Floods in PRB

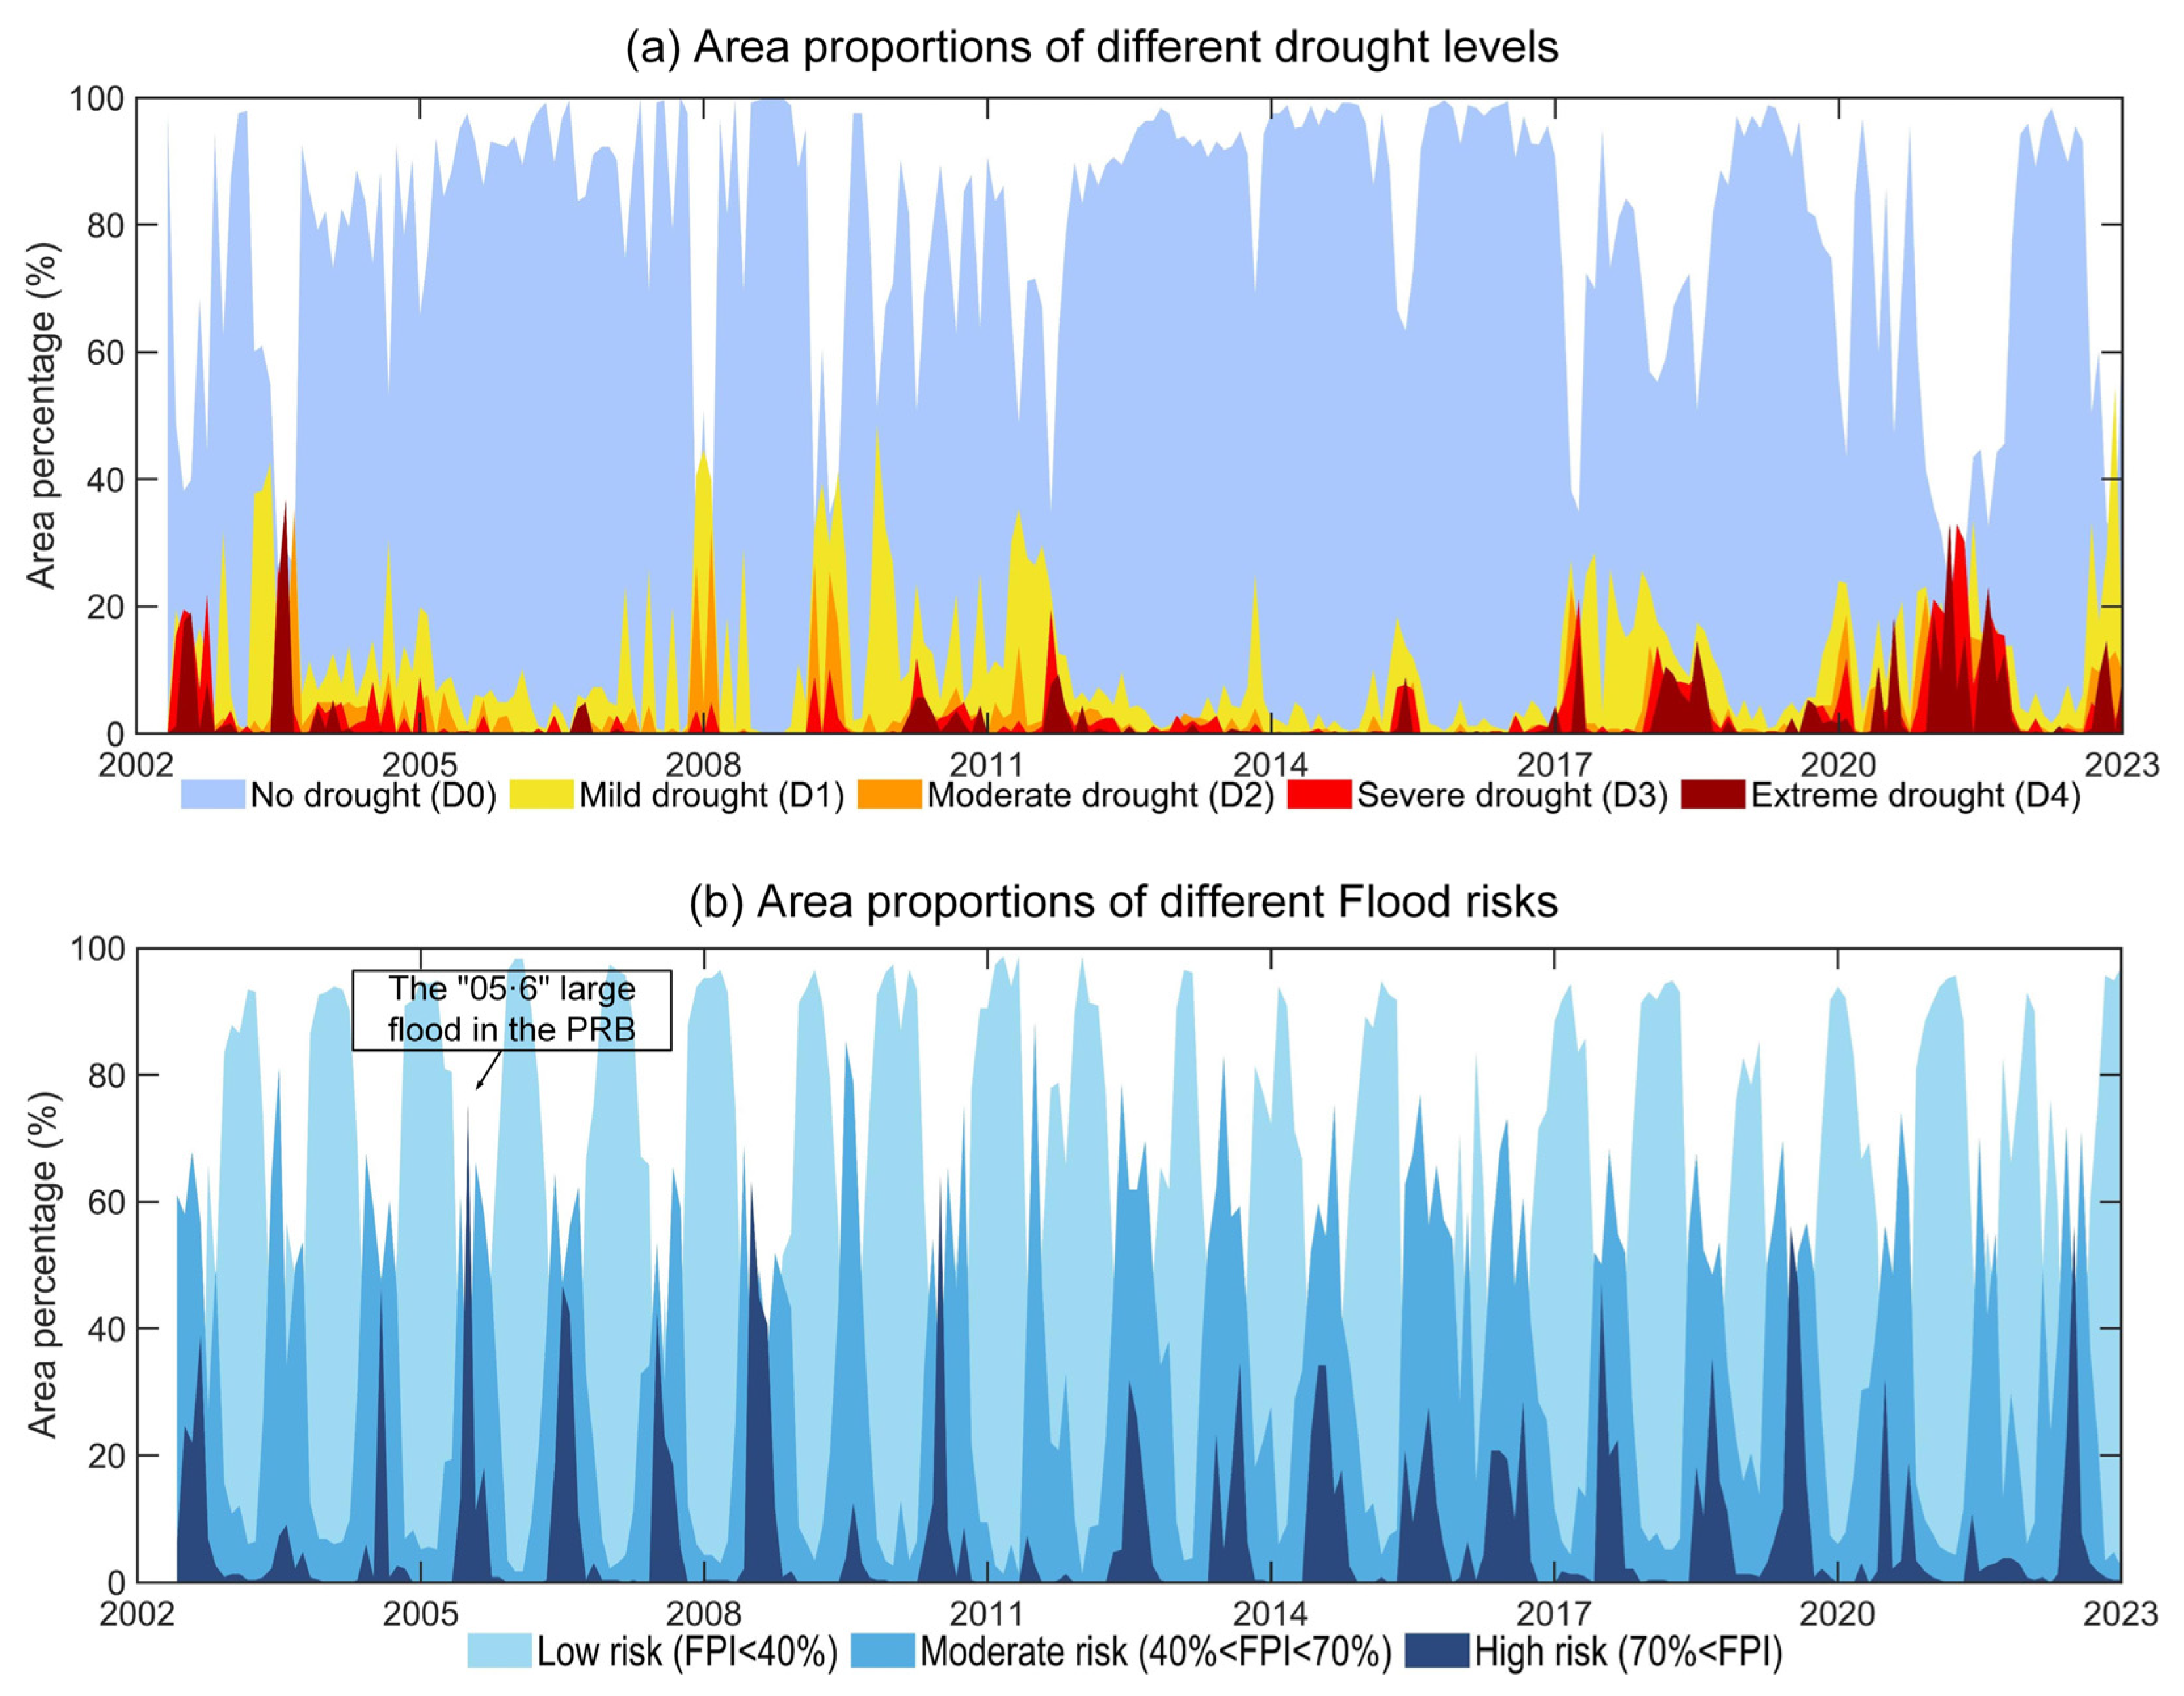
We examined the monthly area proportions of different drought and flood-risk categories in the PRB over April 2002 to December 2022, as shown in Figure 9. Distinct colors denote different drought levels and flood risk classes. The results indicate alternating occurrence of drought and flood events in the basin, with flooding occurring more frequently than drought. Droughts tend to manifest during low precipitation periods, whereas floods more often occur during high precipitation months (e.g., from June to August).
Figure 9a shows that in 2021, the PRB experienced the most severe drought during the study period, consistent with reports by the Pearl River Water Resources Commission of the Ministry. This drought was likely associated with La Niña conditions and a negative phase of the PDO, which contributed to significantly reduced precipitation across the basin. This drought persisted from December 2020 to August 2021, spanning 9 months. During this period, the area proportions of severe drought (D3) and extreme drought (D4) reached 19.65% and 14.27%, respectively. Notably, in February 2021, the drought reached its peak extent, with area proportions of 33.33% for D4, 17.89% for D3, 12.20% for moderate drought (D2), and 13.82% for mild drought (D1).
As shown in Figure 9b, the probability of flood occurrence increases during the wet season, particularly in June, when the mean FPI reached 61.31%, indicating a moderate flood risk. The PRB’s most extreme flood event occurred in June 2005, known as the “05·6” flood, when the proportion of area with FPI greater than 70% reached a peak of 75.32%, the highest across the entire study period. This confirms the effectiveness of FPI in monitoring large-scale flood events. Additionally, high flood risks were also observed in June 2008 and June 2010, with the area proportions exceeding 70% reaching 63.20% and 64.07%, respectively.

5. Discussion

The coarse native resolution of GRACE/GFO, with the need for spectral truncation and filtering, limits direct monitoring of small and medium basins. This limitation hampers the direct application of GRACE/GFO data for small regional water resource management, where finer spatial detail is often essential. To address this challenge, integrating satellite gravity observations with high-resolution hydrological models provides a feasible approach to improve the spatial resolution of TWSA estimates. Previous downscaling approaches either assimilate GRACE/GFO-derived TWSA into hydrological or land-surface models to enhance spatial resolution [22,23], statistically relate GRACE/GFO-derived TWSA to finer-resolution predictors [27,28], or impose model-based spatial patterns through scaling factors and mascon regularization [63,64,65,66,67]. Statistical and machine-learning downscaling schemes can capture complex relationships between GRACE/GFO-derived TWSA and climatic or land-surface indices, but they often rely heavily on the choice of predictors and may extrapolate poorly outside the training domain. Model-based scaling methods can improve spatial detail, yet they may retain biases from the underlying hydrological model and are sometimes restricted to simple linear relationships between large-scale and small-scale signals. In this study, the downscaled TWSA product developed via a joint inversion framework effectively inherits the fine-scale spatial heterogeneity from the WGHM model while enhancing consistency with GRACE/GFO observations. This fusion enables more accurate detection of local water storage changes and improves alignment with observed water balance components.
However, several limitations should be acknowledged. First, our downscaling assumes a stable relationship between large-scale mass change and modelled spatial patterns, so any spatial structural biases in WGHM can propagate to the downscaling product. Second, validation at the pixel scale is indirect because independent high-resolution TWSA measurements are not available. We can only spatially upscaling the downscaled TWSA by applying the same spherical harmonic truncation and filtering as for GRACE/GFO, so that both fields share a common spatial resolution and can be compared at pixel scale. Alternatively, we evaluate the product at the effective GRACE/GFO scale, that is, at basin-averaged TWSA. Third, because groundwater well observations are sparse and specific yield is poorly constrained, we use a water-balance approach to independently assess the reliability of the downscaling. However, uncertainties in precipitation, evapotranspiration, and runoff propagate into the water balance closure [68], and different strategies for deriving TWF from TWSA can also influence the inferred fluxes [53].
In addition, the SHAP analysis used in this study is statistical, not causal, and is sensitive to feature correlation and lag structure. SHAP values summarize how the predictive model uses the available features, and thus they are sensitive to feature collinearity, lag structure, and the definition of anomalies. In our application, correlations among driver variables may distribute importance across multiple predictors [69], and the lack of explicit lags may underestimate delayed responses of TWSA to meteorological forcing. Incorporating lagged predictors, group attributions for collinear variables, and anomaly-based modelling would sharpen process interpretation.
To overcome the spatiotemporal limitations of satellite gravimetry in the future, the anticipated deployment of multi-pair gravimetry missions (e.g., the Chinese gravity mission and the joint ESA/NASA Mass-change And Geosciences International Constellation mission), holds great promise for fundamentally advancing the spatial and temporal resolution of satellite gravimetry observations [70,71,72,73]. These future missions are expected to provide improvements in the native resolution of gravity-derived products without requiring reliance on external models. However, until such systems are operational, downscaling approaches that combine GRACE/GFO observations with model-based priors remain indispensable. Continued methodological advancements in this area will be crucial to unlocking the full potential of satellite gravimetry for basin-scale hydrological monitoring [19,22,23,24,26,27], especially in data-scarce or hydrologically complex regions.

6. Conclusions

In this study, we applied a downscaled TWSA product derived from a joint inversion downscaling framework to improve the spatial resolution of GRACE/GFO-derived estimates in the PRB. The downscaled product demonstrates clear advantages over WGHM simulations in capturing both the magnitude and temporal variations of TWSA at basin and pixel scales. Compared to WGHM, the downscaled TWSA product shows consistently lower NRMSE and higher CC and NSE when evaluated against GRACE/GFO observations, with performance further improved after spatial filtering to match the effective resolution of GRACE/GFO. The downscaled product also improves the estimations of water fluxes, aligning more closely with estimates from the water balance equation than WGHM, particularly in terms of seasonal dynamics.
The PRB exhibits pronounced seasonal and interannual water storage variability. Storage accumulates from April to July when precipitation exceeds evapotranspiration and runoff, and peaks in July. From April 2002 to December 2022, TWSA alternates between periods of decline and recovery. On annual timescales, TWSA agrees with annual variations in precipitation and runoff, with CC of 0.77 and 0.82, while evapotranspiration is comparatively stable. Large-scale climate modes modulate these relationships, with El Niño and a warm PDO phase favoring wetter conditions and La Niña and a cold PDO phase favoring drier conditions. XGBoost and SHAP attribution identifies precipitation as the leading driver, followed by runoff and evapotranspiration. Apparent positive contributions from evapotranspiration and vegetation indices may reflect wet-season co-variability rather than direct increases in storage.
Area proportions of DSI and FPI categories reveal alternating drought and flood conditions. The most severe drought within the study period occurred from December 2020 to August 2021, and flood risk is highest in the wet season, with June 2005 exhibiting the largest FPI value. These results show that the downscaled TWSA supports regional hydrological monitoring and risk assessment. Integrating satellite gravity with model priors through joint inversion enhances the spatiotemporal fidelity of TWSA and provides actionable information for water resources management in data-limited regions.

Author Contributions

Conceptualization, Y.X. and W.F.; Methodology, Y.X.; Validation, Y.X., J.L. and W.F.; Formal analysis, Y.X., J.L. and W.F.; Investigation, Y.X., J.L. and W.F.; Data curation, Y.X., J.L. and W.F.; Writing—original draft preparation, Y.X. and W.F.; writing—review and editing, Y.X., J.L. and W.F.; Visualization, Y.X.; Supervision, J.L.; project administration, J.L. and W.F.; funding acquisition, Y.X., J.L. and W.F. All authors have read and agreed to the published version of the manuscript.

Funding

This work is jointly supported by the National Natural Science Foundation of China (Grant No. 42574068), National Gravitation Laboratory, Huazhong University of Science and Technology (Grant No. NGL-2025-025), and the Basic Survey of Surface Water Resources, Guangdong Provincial Map Institute (Grant No. GZFDZXFW2404). This research was also supported by the International Space Science Institute (ISSI) in Bern, through ISSI International Team project #496 (Time-Variable Gravity Field Modeling and Simulation from Present and Future Gravity Satellite Missions).

Data Availability Statement

GRACE/GFO spherical harmonic solution can be found in https://icgem.gfz-potsdam.de/sl/temporal, accessed on 23 November 2025. WGHM data can be publicly obtained from Müller Schmied et al. [28]. The other auxiliary data for this research are publicly available. The downscaled TWSA and component datasets developed in this study are available at Xiong et al. [46].

Conflicts of Interest

The authors declare that they have no known competing financial interests or personal relationships that could have appeared to influence the work reported in this paper.

References

  1. Ou, H.; Cai, S.; Fan, W.; Qiu, J.; Mu, X.; Zhou, T.; Yang, X.; Picco, L. Sustaining the Pearl River: A Critical Review of Changes in Fluvial Geomorphological Processes and the Driving Forces in the Pearl River Basin. Water 2024, 16, 1001. [Google Scholar] [CrossRef]
  2. Ouyang, R.; Liu, W.; Fu, G.; Liu, C.; Hu, L.; Wang, H. Linkages between ENSO/PDO signals and precipitation, streamflow in China during the last 100 years. Hydrol. Earth Syst. Sci. 2014, 18, 3651–3661. [Google Scholar] [CrossRef]
  3. Niu, J. Precipitation in the Pearl River basin, South China: Scaling, regional patterns, and influence of large-scale climate anomalies. Stoch. Environ. Res. Risk Assess. 2013, 27, 1253–1268. [Google Scholar] [CrossRef]
  4. Huang, Z.; Jiao, J.J.; Luo, X.; Pan, Y.; Jin, T. Drought and Flood Characterization and Connection to Climate Variability in the Pearl River Basin in Southern China Using Long-Term GRACE and Reanalysis Data. J. Clim. 2021, 34, 2053–2078. [Google Scholar] [CrossRef]
  5. Zhang, Q.; Xu, C.-Y.; Zhang, Z. Observed changes of drought/wetness episodes in the Pearl River basin, China, using the standardized precipitation index and aridity index. Theor. Appl. Climatol. 2009, 98, 89–99. [Google Scholar] [CrossRef]
  6. Qiu, J.; Cao, B.; Park, E.; Yang, X.; Zhang, W.; Tarolli, P. Flood Monitoring in Rural Areas of the Pearl River Basin (China) Using Sentinel-1 SAR. Remote Sens. 2021, 13, 1384. [Google Scholar] [CrossRef]
  7. Chen, X.; Zhang, H.; Chen, W.; Huang, G. Urbanization and climate change impacts on future flood risk in the Pearl River Delta under shared socioeconomic pathways. Sci. Total Environ. 2021, 762, 143144. [Google Scholar] [CrossRef]
  8. Sun, A.Y.; Scanlon, B.R.; AghaKouchak, A.; Zhang, Z. Using GRACE Satellite Gravimetry for Assessing Large-Scale Hydrologic Extremes. Remote Sens. 2017, 9, 1287. [Google Scholar] [CrossRef]
  9. Reager, J.T.; Famiglietti, J.S. Global terrestrial water storage capacity and flood potential using GRACE. Geophys. Res. Lett. 2009, 36, L23402. [Google Scholar] [CrossRef]
  10. Zhao, M.; Geruo, A.; Velicogna, I.; Kimball, J.S. Satellite Observations of Regional Drought Severity in the Continental United States Using GRACE-Based Terrestrial Water Storage Changes. J. Clim. 2017, 30, 6297–6308. [Google Scholar] [CrossRef]
  11. Scanlon, B.R.; Rateb, A.; Anyamba, A.; Kebede, S.; MacDonald, A.M.; Shamsudduha, M.; Small, J.; Sun, A.; Taylor, R.G.; Xie, H. Linkages between GRACE water storage, hydrologic extremes, and climate teleconnections in major African aquifers. Environ. Res. Lett. 2022, 17, 014046. [Google Scholar] [CrossRef]
  12. Neves, M.C. Links Between Extremes in GRACE TWS and Climate Patterns Across Iberia. Water 2025, 17, 1108. [Google Scholar] [CrossRef]
  13. Huang, Z.; Yeh, P.J.F.; Pan, Y.; Jiao, J.J.; Gong, H.; Li, X.; Güntner, A.; Zhu, Y.; Zhang, C.; Zheng, L. Detection of large-scale groundwater storage variability over the karstic regions in Southwest China. J. Hydrol. 2019, 569, 409–422. [Google Scholar] [CrossRef]
  14. Tapley, B.D.; Watkins, M.M.; Flechtner, F.; Reigber, C.; Bettadpur, S.; Rodell, M.; Sasgen, I.; Famiglietti, J.S.; Landerer, F.W.; Chambers, D.P. Contributions of GRACE to understanding climate change. Nat. Clim. Change 2019, 9, 358–369. [Google Scholar] [CrossRef]
  15. Rodell, M.; Li, B. Changing intensity of hydroclimatic extreme events revealed by GRACE and GRACE-FO. Nat. Water 2023, 1, 241–248. [Google Scholar] [CrossRef]
  16. Xiong, Y.; Feng, W.; Chen, J.; Shen, Y.; Bai, H.; Jiang, Z.; Zhong, M. Refined GRACE/GFO-Derived Terrestrial Water Storage Anomaly in Middle East Recovered by ICA-Based Forward Modeling Approach. Water Resour. Res. 2025, 61, e2024WR039837. [Google Scholar] [CrossRef]
  17. Vishwakarma, B.D.; Devaraju, B.; Sneeuw, N. What Is the Spatial Resolution of grace Satellite Products for Hydrology? Remote Sens. 2018, 10, 852. [Google Scholar] [CrossRef]
  18. Pail, R.; Bingham, R.; Braitenberg, C.; Dobslaw, H.; Eicker, A.; Güntner, A.; Horwath, M.; Ivins, E.; Longuevergne, L.; Panet, I.; et al. Science and User Needs for Observing Global Mass Transport to Understand Global Change and to Benefit Society. Surv. Geophys. 2015, 36, 743–772. [Google Scholar] [CrossRef]
  19. Xiong, Y.; Feng, W.; Bai, H.; Chen, W.; Jiang, Z.; Zhong, M. High-Resolution Terrestrial Water Storage Anomalies and Components in China From GRACE/GFO via Joint Inversion Downscaling. Water Resour. Res. 2025, 61, e2024WR038996. [Google Scholar] [CrossRef]
  20. Scanlon, B.R.; Zhang, Z.; Save, H.; Sun, A.Y.; Müller Schmied, H.; Van Beek, L.P.; Wiese, D.N.; Wada, Y.; Long, D.; Reedy, R.C. Global models underestimate large decadal declining and rising water storage trends relative to GRACE satellite data. Proc. Natl. Acad. Sci. USA 2018, 115, E1080–E1089. [Google Scholar] [CrossRef]
  21. Scanlon, B.R.; Zhang, Z.; Rateb, A.; Sun, A.; Wiese, D.; Save, H.; Beaudoing, H.; Lo, M.H.; Müller-Schmied, H.; Döll, P.; et al. Tracking Seasonal Fluctuations in Land Water Storage Using Global Models and GRACE Satellites. Geophys. Res. Lett. 2019, 46, 5254–5264. [Google Scholar] [CrossRef]
  22. Eicker, A.; Schumacher, M.; Kusche, J.; Döll, P.; Schmied, H.M. Calibration/Data Assimilation Approach for Integrating GRACE Data into the WaterGAP Global Hydrology Model (WGHM) Using an Ensemble Kalman Filter: First Results. Surv. Geophys. 2014, 35, 1285–1309. [Google Scholar] [CrossRef]
  23. Li, B.; Rodell, M.; Kumar, S.; Beaudoing, H.K.; Getirana, A.; Zaitchik, B.F.; de Goncalves, L.G.; Cossetin, C.; Bhanja, S.; Mukherjee, A.; et al. Global GRACE Data Assimilation for Groundwater and Drought Monitoring: Advances and Challenges. Water Resour. Res. 2019, 55, 7564–7586. [Google Scholar] [CrossRef]
  24. Gerdener, H.; Kusche, J.; Schulze, K.; Döll, P.; Klos, A. The global land water storage data set release 2 (GLWS2.0) derived via assimilating GRACE and GRACE-FO data into a global hydrological model. J. Geod. 2023, 97, 73. [Google Scholar] [CrossRef]
  25. Yang, F.; Schumacher, M.; Retegui-Schiettekatte, L.; van Dijk, A.I.J.M.; Forootan, E. PyGLDA: A fine-scale Python-based Global Land Data Assimilation system for integrating satellite gravity data into hydrological models. Geosci. Model Dev. Discuss. 2024, 18, 6195–6217. [Google Scholar] [CrossRef]
  26. Gou, J.; Soja, B. Global high-resolution total water storage anomalies from self-supervised data assimilation using deep learning algorithms. Nat. Water 2024, 2, 139–150. [Google Scholar] [CrossRef]
  27. Vishwakarma, B.D.; Zhang, J.; Sneeuw, N. Downscaling GRACE total water storage change using partial least squares regression. Sci. Data 2021, 8, 95. [Google Scholar] [CrossRef]
  28. Agarwal, V.; Akyilmaz, O.; Shum, C.K.; Feng, W.; Yang, T.-Y.; Forootan, E.; Syed, T.H.; Haritashya, U.K.; Uz, M. Machine learning based downscaling of GRACE-estimated groundwater in Central Valley, California. Sci. Total Environ. 2023, 865, 161138. [Google Scholar] [CrossRef]
  29. Rodell, M.; Famiglietti, J.S.; Wiese, D.N.; Reager, J.T.; Beaudoing, H.K.; Landerer, F.W.; Lo, M.H. Emerging trends in global freshwater availability. Nature 2018, 557, 651–659. [Google Scholar] [CrossRef]
  30. Trautmann, T.; Koirala, S.; Carvalhais, N.; Güntner, A.; Jung, M. The importance of vegetation in understanding terrestrial water storage variations. Hydrol. Earth Syst. Sci. 2022, 26, 1089–1109. [Google Scholar] [CrossRef]
  31. Yi, S.; Sun, W.; Feng, W.; Chen, J. Anthropogenic and climate-driven water depletion in Asia. Geophys. Res. Lett. 2016, 43, 9061–9069. [Google Scholar] [CrossRef]
  32. Pan, Y.; Zhang, C.; Gong, H.; Yeh, P.J.-F.; Shen, Y.; Guo, Y.; Huang, Z.; Li, X. Detection of human-induced evapotranspiration using GRACE satellite observations in the Haihe River basin of China. Geophys. Res. Lett. 2017, 44, 190–199. [Google Scholar] [CrossRef]
  33. Humphrey, V.; Gudmundsson, L. GRACE-REC: A reconstruction of climate-driven water storage changes over the last century. Earth Syst. Sci. Data 2019, 11, 1153–1170. [Google Scholar] [CrossRef]
  34. Li, D.; Pan, M.; Cong, Z.; Zhang, L.; Wood, E. Vegetation control on water and energy balance within the Budyko framework. Water Resour. Res. 2013, 49, 969–976. [Google Scholar] [CrossRef]
  35. Miralles, D.G.; Holmes, T.R.H.; De Jeu, R.A.M.; Gash, J.H.; Meesters, A.G.C.A.; Dolman, A.J. Global land-surface evaporation estimated from satellite-based observations. Hydrol. Earth Syst. Sci. 2011, 15, 453–469. [Google Scholar] [CrossRef]
  36. Fan, Y.; Miguez-Macho, G.; Jobbágy, E.G.; Jackson, R.B.; Otero-Casal, C. Hydrologic regulation of plant rooting depth. Proc. Natl. Acad. Sci. USA 2017, 114, 10572–10577. [Google Scholar] [CrossRef]
  37. Fan, C.; Song, C.; Liu, K.; Ke, L.; Xue, B.; Chen, T.; Fu, C.; Cheng, J. Century-Scale Reconstruction of Water Storage Changes of the Largest Lake in the Inner Mongolia Plateau Using a Machine Learning Approach. Water Resour. Res. 2021, 57, e2020WR028831. [Google Scholar] [CrossRef]
  38. Ding, K.; Zhao, X.; Cheng, J.; Yu, Y.; Luo, Y.; Couchot, J.; Zheng, K.; Lin, Y.; Wang, Y. GRACE/ML-based analysis of the spatiotemporal variations of groundwater storage in Africa. J. Hydrol. 2025, 647, 132336. [Google Scholar] [CrossRef]
  39. Landerer, F. Monthly Estimates of Degree-1 (Geocenter) Gravity Coefficients, Generated from GRACE (04-2002–06/2017) and GRACE-FO (06/2018 onward) RL06.1 Solutions. GRACE Technical Note 13, The GRACE Project, NASA Jet Propulsion Laboratory. 2019. Available online: https://podaac.jpl.nasa.gov/gravity/grace-documentation#Level2Documentation/TN-13_GEOC_JPL_RL0601.txt (accessed on 23 November 2025).
  40. Sun, Y.; Riva, R.; Ditmar, P. Optimizing estimates of annual variations and trends in geocenter motion and J2 from a combination of GRACE data and geophysical models. J. Geophys. Res. Solid Earth 2016, 121, 8352–8370. [Google Scholar] [CrossRef]
  41. Loomis, B.D.; Rachlin, K.E.; Wiese, D.N.; Landerer, F.W.; Luthcke, S.B. Replacing GRACE/GRACE-FO With Satellite Laser Ranging: Impacts on Antarctic Ice Sheet Mass Change. Geophys. Res. Lett. 2020, 47, e2019GL085488. [Google Scholar] [CrossRef]
  42. Peltier, W.R.; Argus, D.F.; Drummond, R. Comment on “An Assessment of the ICE-6G_C (VM5a) Glacial Isostatic Adjustment Model” by Purcell et al. J. Geophys. Res. Solid Earth 2018, 123, 2019–2028. [Google Scholar] [CrossRef]
  43. Kusche, J. Approximate decorrelation and non-isotropic smoothing of time-variable GRACE-type gravity field models. J. Geod. 2007, 81, 733–749. [Google Scholar] [CrossRef]
  44. Kusche, J.; Schmidt, R.; Petrovic, S.; Rietbroek, R. Decorrelated GRACE time-variable gravity solutions by GFZ, and their validation using a hydrological model. J. Geod. 2009, 83, 903–913. [Google Scholar] [CrossRef]
  45. Yang, F.; Luo, Z.; Zhou, H.; Kusche, J. On study of the Earth topography correction for the GRACE surface mass estimation. J. Geod. 2022, 96, 95. [Google Scholar] [CrossRef]
  46. Wahr, J.; Molenaar, M.; Bryan, F. Time variability of the Earth’s gravity field: Hydrological and oceanic effects and their possible detection using GRACE. J. Geophys. Res. Solid Earth 1998, 103, 30205–30229. [Google Scholar] [CrossRef]
  47. Müller Schmied, H.; Cáceres, D.; Eisner, S.; Flörke, M.; Herbert, C.; Niemann, C.; Peiris, T.A.; Popat, E.; Portmann, F.T.; Reinecke, R. The global water resources and use model WaterGAP v2. 2d: Model description and evaluation. Geosci. Model Dev. 2021, 14, 1037–1079. [Google Scholar] [CrossRef]
  48. Wu, J.; Gao, X.; Giorgi, F.; Chen, D. Changes of effective temperature and cold/hot days in late decades over China based on a high resolution gridded observation dataset. Int. J. Climatol. 2017, 37, 788–800. [Google Scholar] [CrossRef]
  49. Martens, B.; Miralles, D.G.; Lievens, H.; van der Schalie, R.; de Jeu, R.A.M.; Fernández-Prieto, D.; Beck, H.E.; Dorigo, W.A.; Verhoest, N.E.C. GLEAM v3: Satellite-based land evaporation and root-zone soil moisture. Geosci. Model Dev. 2017, 10, 1903–1925. [Google Scholar] [CrossRef]
  50. Bai, H.; Ming, Z.; Zhong, Y.; Zhong, M.; Kong, D.; Ji, B. Evaluation of evapotranspiration for exorheic basins in China using an improved estimate of terrestrial water storage change. J. Hydrol. 2022, 610, 127885. [Google Scholar] [CrossRef]
  51. Li, S.; Wu, L.; Yang, Y.; Geng, T.; Cai, W.; Gan, B.; Chen, Z.; Jing, Z.; Wang, G.; Ma, X. The Pacific Decadal Oscillation less predictable under greenhouse warming. Nat. Clim. Change 2020, 10, 30–34. [Google Scholar] [CrossRef]
  52. Copernicus Climate Change Service. ERA5-Land Monthly Averaged Data from 1950 to Present; Copernicus Climate Change Service (C3S) Climate Data Store (CDS): Reading, UK, 2019. [Google Scholar] [CrossRef]
  53. Long, D.; Longuevergne, L.; Scanlon, B.R. Uncertainty in evapotranspiration from land surface modeling, remote sensing, and GRACE satellites. Water Resour. Res. 2014, 50, 1131–1151. [Google Scholar] [CrossRef]
  54. Landerer, F.W.; Dickey, J.O.; Güntner, A. Terrestrial water budget of the Eurasian pan-Arctic from GRACE satellite measurements during 2003–2009. J. Geophys. Res. Atmos. 2010, 115, D23115. [Google Scholar] [CrossRef]
  55. Chen, T.; Guestrin, C. XGBoost: A Scalable Tree Boosting System. In Proceedings of the 22nd ACM SIGKDD International Conference on Knowledge Discovery and Data Mining, San Francisco, CA, USA, 13–17 August 2016; pp. 785–794. [Google Scholar]
  56. Lundberg, S.M.; Lee, S.-I. A unified approach to interpreting model predictions. In Proceedings of the 31st International Conference on Neural Information Processing Systems, Long Beach, CA, USA, 4–9 December 2017; pp. 4768–4777. [Google Scholar]
  57. Xie, J.; Xu, Y.-P.; Yu, H.; Huang, Y.; Guo, Y. Monitoring the extreme flood events in the Yangtze River basin based on GRACE and GRACE-FO satellite data. Hydrol. Earth Syst. Sci. 2022, 26, 5933–5954. [Google Scholar] [CrossRef]
  58. Boergens, E.; Kvas, A.; Eicker, A.; Dobslaw, H.; Schawohl, L.; Dahle, C.; Murböck, M.; Flechtner, F. Uncertainties of GRACE-Based Terrestrial Water Storage Anomalies for Arbitrary Averaging Regions. J. Geophys. Res. Solid Earth 2022, 127, e2021JB022081. [Google Scholar] [CrossRef]
  59. Huang, Z.; Zhang, W.; Geng, X.; Jin, F.-F. Recent Shift in the State of the Western Pacific Subtropical High due to ENSO Change. J. Clim. 2020, 33, 229–241. [Google Scholar] [CrossRef]
  60. Huang, H.; Feng, G.; Cao, Y.; Feng, G.; Dai, Z.; Tian, P.; Wei, J.; Cai, X. Simulation and Driving Factor Analysis of Satellite-Observed Terrestrial Water Storage Anomaly in the Pearl River Basin Using Deep Learning. Remote Sens. 2023, 15, 3983. [Google Scholar] [CrossRef]
  61. Luo, Z.; Yao, C.; Li, Q.; Huang, Z. Terrestrial water storage changes over the Pearl River Basin from GRACE and connections with Pacific climate variability. Geod. Geodyn. 2016, 7, 171–179. [Google Scholar] [CrossRef]
  62. Liu, K.; Li, X.; Wang, S.; Zhou, G. Past and future adverse response of terrestrial water storages to increased vegetation growth in drylands. npj Clim. Atmos. Sci. 2023, 6, 113. [Google Scholar] [CrossRef]
  63. Landerer, F.W.; Swenson, S.C. Accuracy of scaled GRACE terrestrial water storage estimates. Water Resour. Res. 2012, 48, W04531. [Google Scholar] [CrossRef]
  64. Long, D.; Longuevergne, L.; Scanlon, B.R. Global analysis of approaches for deriving total water storage changes from GRACE satellites. Water Resour. Res. 2015, 51, 2574–2594. [Google Scholar] [CrossRef]
  65. Wiese, D.N.; Landerer, F.W.; Watkins, M.M. Quantifying and reducing leakage errors in the JPL RL05M GRACE mascon solution. Water Resour. Res. 2016, 52, 7490–7502. [Google Scholar] [CrossRef]
  66. Loomis, B.D.; Luthcke, S.B.; Sabaka, T.J. Regularization and error characterization of GRACE mascons. J. Geod. 2019, 93, 1381–1398. [Google Scholar] [CrossRef] [PubMed]
  67. Save, H.; Bettadpur, S.; Tapley, B.D. High-resolution CSR GRACE RL05 mascons. J. Geophys. Res. Solid Earth 2016, 121, 7547–7569. [Google Scholar] [CrossRef]
  68. Sheffield, J.; Ferguson, C.R.; Troy, T.J.; Wood, E.F.; McCabe, M.F. Closing the terrestrial water budget from satellite remote sensing. Geophys. Res. Lett. 2009, 36, L07403. [Google Scholar] [CrossRef]
  69. Aas, K.; Jullum, M.; Løland, A. Explaining individual predictions when features are dependent: More accurate approximations to Shapley values. Artif. Intell. 2021, 298, 103502. [Google Scholar] [CrossRef]
  70. Daras, I.; March, G.; Pail, R.; Hughes, C.W.; Braitenberg, C.; Güntner, A.; Eicker, A.; Wouters, B.; Heller-Kaikov, B.; Pivetta, T.; et al. Mass-change And Geosciences International Constellation (MAGIC) expected impact on science and applications. Geophys. J. Int. 2023, 236, 1288–1308. [Google Scholar] [CrossRef]
  71. Bender, P.L.; Conklin, J.W.; Wiese, D.N. Short-Period Mass Variations and the Next Generation Gravity Mission. J. Geophys. Res. Solid Earth 2025, 130, e2024JB030290. [Google Scholar] [CrossRef]
  72. Luo, J.; Ai, L.; Ai, Y.; An, Z.; Bai, W.; Bai, Y.; Bao, J.; Cao, B.; Chang, W.; Chen, C.; et al. A brief introduction to the TianQin project. Acta Sci. Nat. Univ. Sunyatseni 2023, 60, 1–19. [Google Scholar]
  73. Xiao, Y.; Yang, Y.; Pan, Z.; Liu, X.; Sun, Z. Performance and application of the Chinese satellite-to-satellite tracking gravimetry system. Chin. Sci. Bull 2023, 68, 2655–2664. [Google Scholar] [CrossRef]
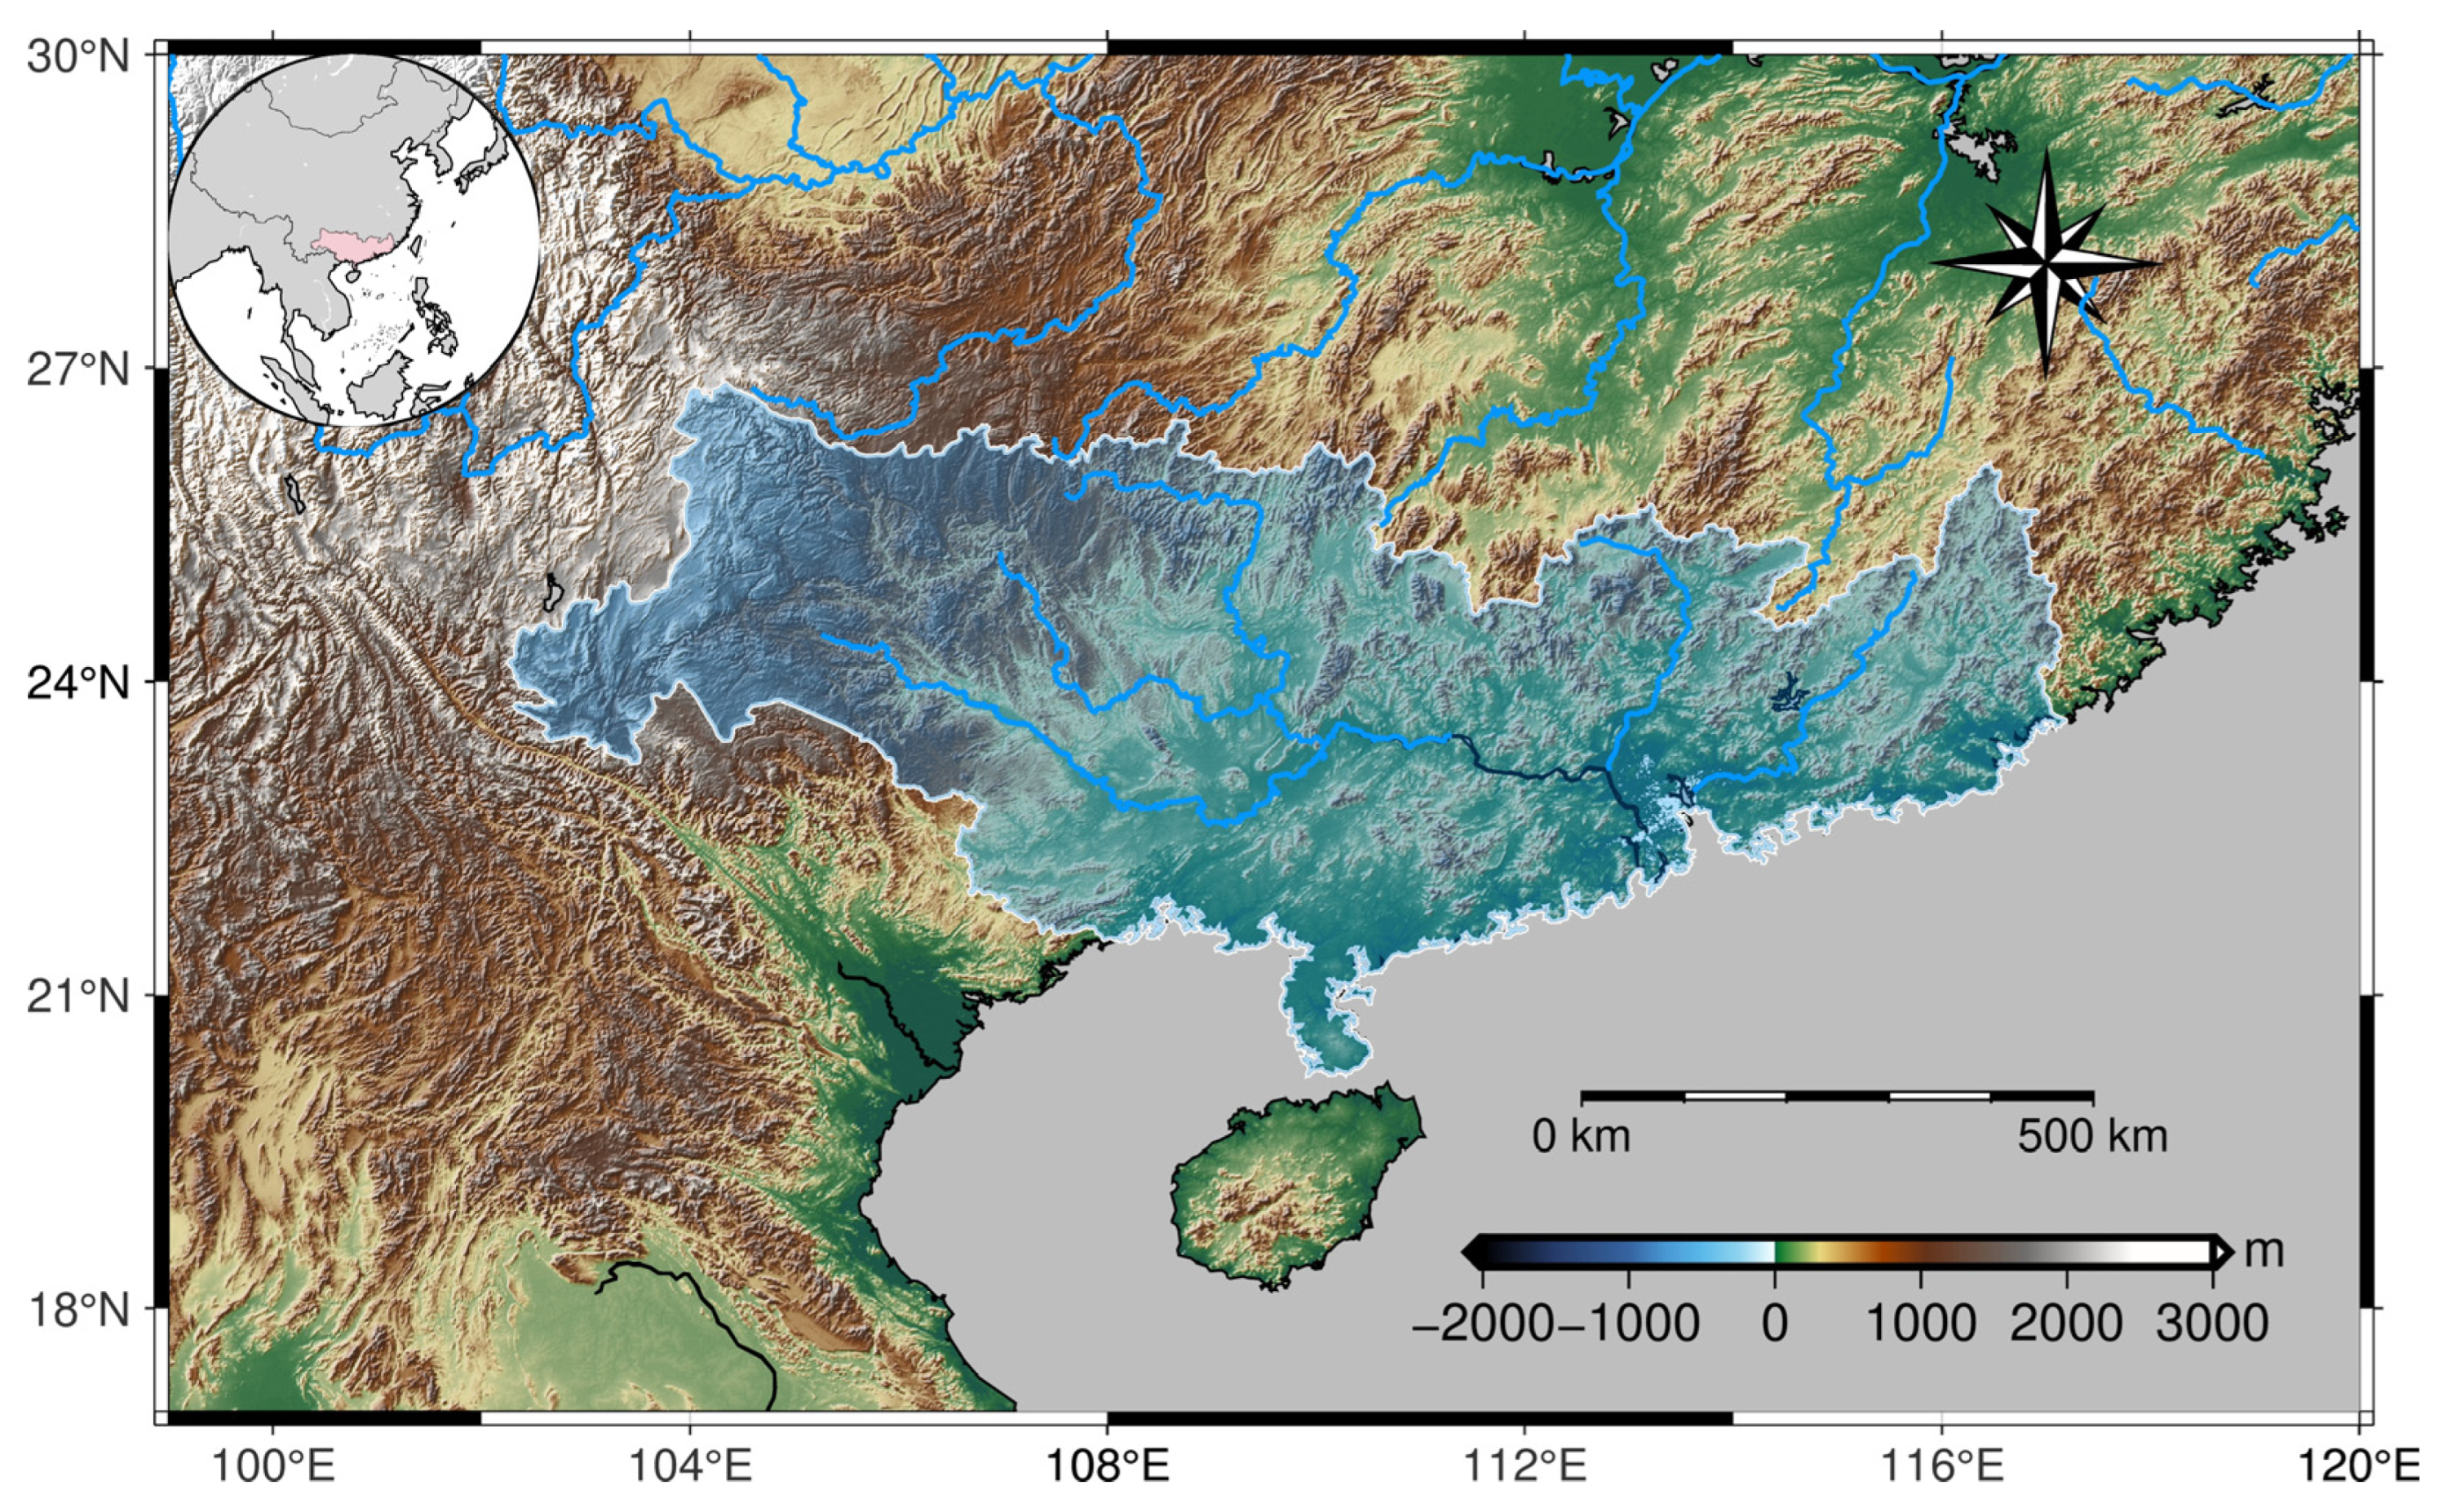
Figure 1. Topographic map of the Pearl River Basin.
Remotesensing 17 03816 g001
Figure 2. Comparison of basin-averaged TWSA in the PRB: (a) downscaled (DS), (b) WGHM-simulated, (c) DDK3-filtered DS, and (d) DDK3-filtered WGHM-simulated TWSA (Y-axis) versus GRACE/GFO observations (X-axis).
Remotesensing 17 03816 g002
Figure 3. Spatial distributions of (a) NRMSE, (b) CC, (c) NSE between the filtered DS TWSA and GRACE/GFO observations, and (df) the corresponding metrics between the filtered WGHM TWSA and GRACE/GFO observations in the PRB. Box plots in (g) summarize the pixel−wise statistics for all three metrics.
Remotesensing 17 03816 g003
Figure 4. Spatial comparison of monthly TWSA in the Pearl River Basin for January 2005. (a) Raw GRACE/GFO TWSA, (b) Downscaled TWSA, (c) Filtered downscaled TWSA, (d) Difference between (a,c), (e) WGHM TWSA, (f) Filtered WGHM TWSA, (g) Difference between (af). Differences are computed as GRACE/GFO minus filtered products.
Remotesensing 17 03816 g004
Figure 5. (a) Time series of TWF in the PRB derived from the downscaled (DS), WGHM, and independent water balance estimates (P-E-R). (b) Mean seasonal cycle of TWF over the period 2003−2020.
Remotesensing 17 03816 g005
Figure 6. (a) Monthly time series of TWSA, P, E, and R. The period is from April 2002 to December 2022 for TWSA, P, and E, and from January 2003 to December 2020 for R. (b) Seasonal cycles and (c) annual variations of the four variables. The left y-axis refers to TWSA, and the right y-axis to P, E, and R.
Remotesensing 17 03816 g006
Figure 7. Time series of interannual TWSA in the PRB, along with corresponding changes in precipitation, ENSO, and PDO indices.
Remotesensing 17 03816 g007
Figure 8. (a) Contributions of individual driving factors to TWSA and (b) corresponding SHAP values in the PRB at the basin scale.
Remotesensing 17 03816 g008
Figure 9. Area proportions of different (a) drought and (b) flood risk levels in the PRB during the study period based on the DSI and the FPI.
Remotesensing 17 03816 g009
Table 1. Drought classification scheme of DSI.
Drought CategoryDescriptionDSI Value
D0No drought≥−0.79
D1Mild drought−0.8 to −1.29
D2Moderate drought−1.3 to −1.59
D3Severe drought−1.6 to −1.99
D4Extreme drought≤−2.0
Disclaimer/Publisher’s Note: The statements, opinions and data contained in all publications are solely those of the individual author(s) and contributor(s) and not of MDPI and/or the editor(s). MDPI and/or the editor(s) disclaim responsibility for any injury to people or property resulting from any ideas, methods, instructions or products referred to in the content.