Article

Physical-Guided Transfer Deep Neural Network for High-Resolution AOD Retrieval

1
Institute of Aerospace Remote Sensing Innovations, Guangzhou University, Guangzhou, 510006, China
2
School of Geography and Remote Sensing, Guangzhou University, Guangzhou 510006, China
3
Aerospace Information Research Institute, Chinese Academy of Sciences, Beijing 100094, China
4
University of Chinese Academy of Sciences, Beijing 100049, China
*
Author to whom correspondence should be addressed.
Remote Sens. 2025, 17(21), 3606; https://doi.org/10.3390/rs17213606
Submission received: 4 August 2025 / Revised: 17 October 2025 / Accepted: 19 October 2025 / Published: 31 October 2025

Highlights

What are the main findings?
  • A physical-guided transfer deep neural network (PT-DNN) model is proposed for retrieving AOD at 30 m spatial resolution.
  • The model employs a two-stage training strategy that combines radiative transfer simulations with ground-based measurements.
What are the implications of the main findings
  • The model achieves higher accuracy than the conventional data-driven model and the existing AOD product.
  • It facilitates detailed characterization of fine-scale aerosol pollution patterns in complex urban and peri-urban environments.

Abstract

Urban-scale aerosol pollution monitoring is of critical importance for both climate regulation and public health. To overcome the limitations of conventional kilometer-scale satellite aerosol optical depth (AOD) products in resolving urban pollution heterogeneity, this study develops a physical-guided transfer deep neural network (PT-DNN) model based on high-resolution Landsat 8 data. The PT-DNN introduces a novel physics-guided training framework, in which radiative transfer simulations are integrated to physically constrain the AOD retrieval. Pre-training was conducted using multi-scenario radiative transfer simulations, with subsequent fine-tuning via ground-based AERONET measurements. The model architecture integrates convolutional neural network (CNN) with residual connection. Validation results over impervious surfaces indicate that the PT-DNN model outperforms conventional data-driven models, with the coefficient of determination (R2) increasing from 0.81 to 0.86 and root mean square error (RMSE) decreasing from 0.122 to 0.104. Moreover, the AOD distributions retrieved at a high spatial resolution of 30 m effectively reveal fine-scale pollution gradients within urban environments, especially in densely built-up and industrial areas.

1. Introduction

Atmospheric aerosols, also known as particulate matter (PM), are suspensions of liquid or solid particles in the atmosphere. Their composition includes both natural and anthropogenic components such as dust, sulfate, and black carbon [1]. As a key multiphase constituent of the Earth’s atmospheric system, aerosols play a crucial role in regulating the climate through their dynamic behavior and physicochemical interactions [2,3]. Moreover, fine particles with diameters smaller than 2.5 µm (PM2.5) pose a significant risk to human health. Due to their small size, they can be easily inhaled and deposited deep within the respiratory tract [4,5].
Aerosol optical depth (AOD) represents the vertically integrated aerosol extinction along the atmospheric column. It characterizes the attenuation of solar radiation at specific wavelengths caused by aerosols. Given its ability to comprehensively quantify the impact of aerosols on radiative transfer, AOD has become a fundamental parameter in diverse remote sensing applications. The primary applications of AOD is atmospheric correction of satellite imagery, aiming to eliminate aerosol-induced interference in surface reflectance (SR) retrieval [6]. In addition, AOD serves as an indispensable input variable for studies such as fine particulate matter concentration retrieval [7], greenhouse gas retrieval [8], aerosol radiative forcing estimation [9], and wildfire detection [10].
Satellite-derived AOD products at kilometer resolution, including Advanced Very High Resolution Radiometer (AVHRR) [11], Moderate Resolution Imaging Spectroradiometer (MODIS) [12], Multi-angle Imaging SpectroRadiometer (MISR) [13], Visible Infrared Imaging Radiometer Suite (VIIRS) [14], and Medium Resolution Spectral Imager (MRSI) [15,16], have contributed substantially to global aerosol monitoring. However, these products show limited applicability in urban-scale aerosol research [17]. First, the mixed-pixel effect prevents these products from distinguishing the heterogeneous distribution of land-cover types, such as vegetation, bare soil, and buildings, in complex urban areas [18]. Second, the lack of spatial detail limits these products in resolving emissions from local pollution sources, including industrial zones, traffic corridors, and densely populated residential areas [18]. Therefore, the retrieval of high-resolution AOD represents a necessary approach for addressing pollution issues in increasingly complex urban environments [19].
With the advancement of spatial resolution, conventional algorithms, namely the dark target algorithm [20], the deep blue algorithm [21], and multi-angle retrieval algorithm [22], may encounter challenges in both accuracy and computational efficiency [23,24]. The emergence of data-driven deep learning models marks a significant shift in the methodological paradigm of aerosol remote sensing [25]. These data-driven retrieval models rely on high-precision ground-based AOD observations and typically generate training samples through the collocation of satellite data with AOD measurements [26,27]. However, the applicability of such models is often constrained by the limited availability of training data. On the one hand, AOD monitoring stations are sparsely distributed on a global scale, with particularly limited coverage in developing countries [28]. On the other hand, many stations suffer from short observational records and temporal discontinuities, which hinder the construction of long-term AOD time series [29].
Recent advancements have focused on combining atmospheric radiative transfer models with deep learning approaches. By constructing simulated datasets that incorporate physical prior information, this hybrid approach seeks to augment training data and improve the model’s ability to capture the underlying mechanisms of aerosol remote sensing. To construct large-scale simulated datasets, several studies have randomly combined predefined aerosol properties and SR parameters, which are subsequently input into radiative transfer models [30,31]. This simulation strategy has limitations, as it may produce a considerable volume of redundant or physically implausible data that deviates from real-world atmospheric and surface conditions. To improve the physical realism, subsequent studies have incorporated aerosol and SR products from multiple satellite platforms, in conjunction with ground-based AOD observations, aiming to enhance the accuracy and applicability of the simulations [32,33]. However, most existing studies remain focused on kilometer-scale satellite data, which constrains the application in complex urban applications that require high spatial resolution and accuracy.
To overcome the limitations of existing methods that combine physical modeling and deep learning for AOD retrieval, this study introduces a physical-guided transfer deep neural network (PT-DNN). The model utilizes high-resolution Landsat 8 imagery with a spatial resolution of 30 m, enabling the capture of fine-scale aerosol heterogeneity within complex urban environments. A novel two-stage training strategy is proposed, which integrates physical constraints into the training process. In the first stage, radiative transfer simulations based on the clear-sky composite method generate multi-scene training samples, which serve as physically informed priors. Unlike previous studies that rely on random combinations of aerosol and surface reflectance parameters, this method ensures that the surface reflectance values are not arbitrarily selected but rather derived from physically realistic clear-sky observations. In the second stage, a transfer learning approach is employed to incorporate sparse ground-based measurements, refining the model’s accuracy and task-specific adaptability. This approach enhances the model’s generalization ability, allowing it to perform effectively across diverse geographical regions and varying aerosol conditions.

2. Data

2.1. AERONET Data

The ground-based AOD observations utilized in this study were acquired from the Aerosol Robotic Network (AERONET) [34], which is recognized as one of the most extensive, and accurate global aerosol monitoring networks [35]. AERONET provides AOD products at varying quality levels. In this study, Level 1.5 AOD data were employed, as Level 1.0 data are characterized by lower quality, while Level 2.0 data frequently suffer from substantial data gaps. Since AERONET does not directly provide AOD measurements at 550 nm ( τ 550 ), the values at this wavelength were estimated via interpolation using AOD observations at 440 nm ( τ 440 ) and 675 nm ( τ 675 ):
a = ln τ 440 / τ 675 ln 440 / 675
τ 550 = τ 440 550 440 a
As shown in Figure 1, this study focused on the Beijing and Xianghe County in Langfang City, covering the period from 2018 to 2023. Five AERONET sites with valid observations were identified within the study area, as illustrated in Figure 1. Among the five sites, four (Beijing, Beijing-CAMS, Beijing_PKU, and Beijing_RADI) are located in Beijing, with a relatively dense spatial arrangement in highly urbanized regions. In contrast, the XiangHe site is located in Xianghe County, a predominantly peri-urban environment characterized by agricultural land, sparsely populated residential zones, and localized industrial activity.

2.2. Landsat 8 OLI Data

The Operational Land Imager (OLI) onboard Landsat 8 served as the primary data source in this study. A total of 1010 OLI scenes were obtained over the study period. The spectral bands utilized in this study include Band 1 (443 nm), Band 2 (482 nm), Band 3 (562 nm), Band 4 (655 nm), Band 5 (865 nm), Band 6 (1610 nm), and Band 7 (2200 nm) [36], all with a spatial resolution of 30 m. All imagery was obtained from the Collection 2 Level-1 Top-of-Atmosphere (TOA) reflectance products, which provide radiometrically calibrated and geometrically corrected data. Quality assurance was implemented using the QA band to exclude pixels contaminated by clouds, cloud shadows, or snow/ice (i.e., QADilated Cloud = 0, QACirrus = 0, QACloud = 0, QACloud Shadow = 0, QASnow = 0). Given the relatively high accuracy of cloud detection provided by the QA band, no additional cloud masking algorithms were applied in this study [37].
In addition to spectral information, this study incorporated observation geometry parameters derived from satellite imagery. These parameters include the solar zenith angle (SZ), solar azimuth angle (SA), view zenith angle (VZ), and view azimuth angle (VA). Based on these angular measurements, the relative azimuth angle (RA) and the scattering angle (SCA) were further computed. The scattering angle was calculated according to the following equation:
S C A = a r c c o s c o s S Z c o s V Z s i n S Z s i n V Z c o s R A
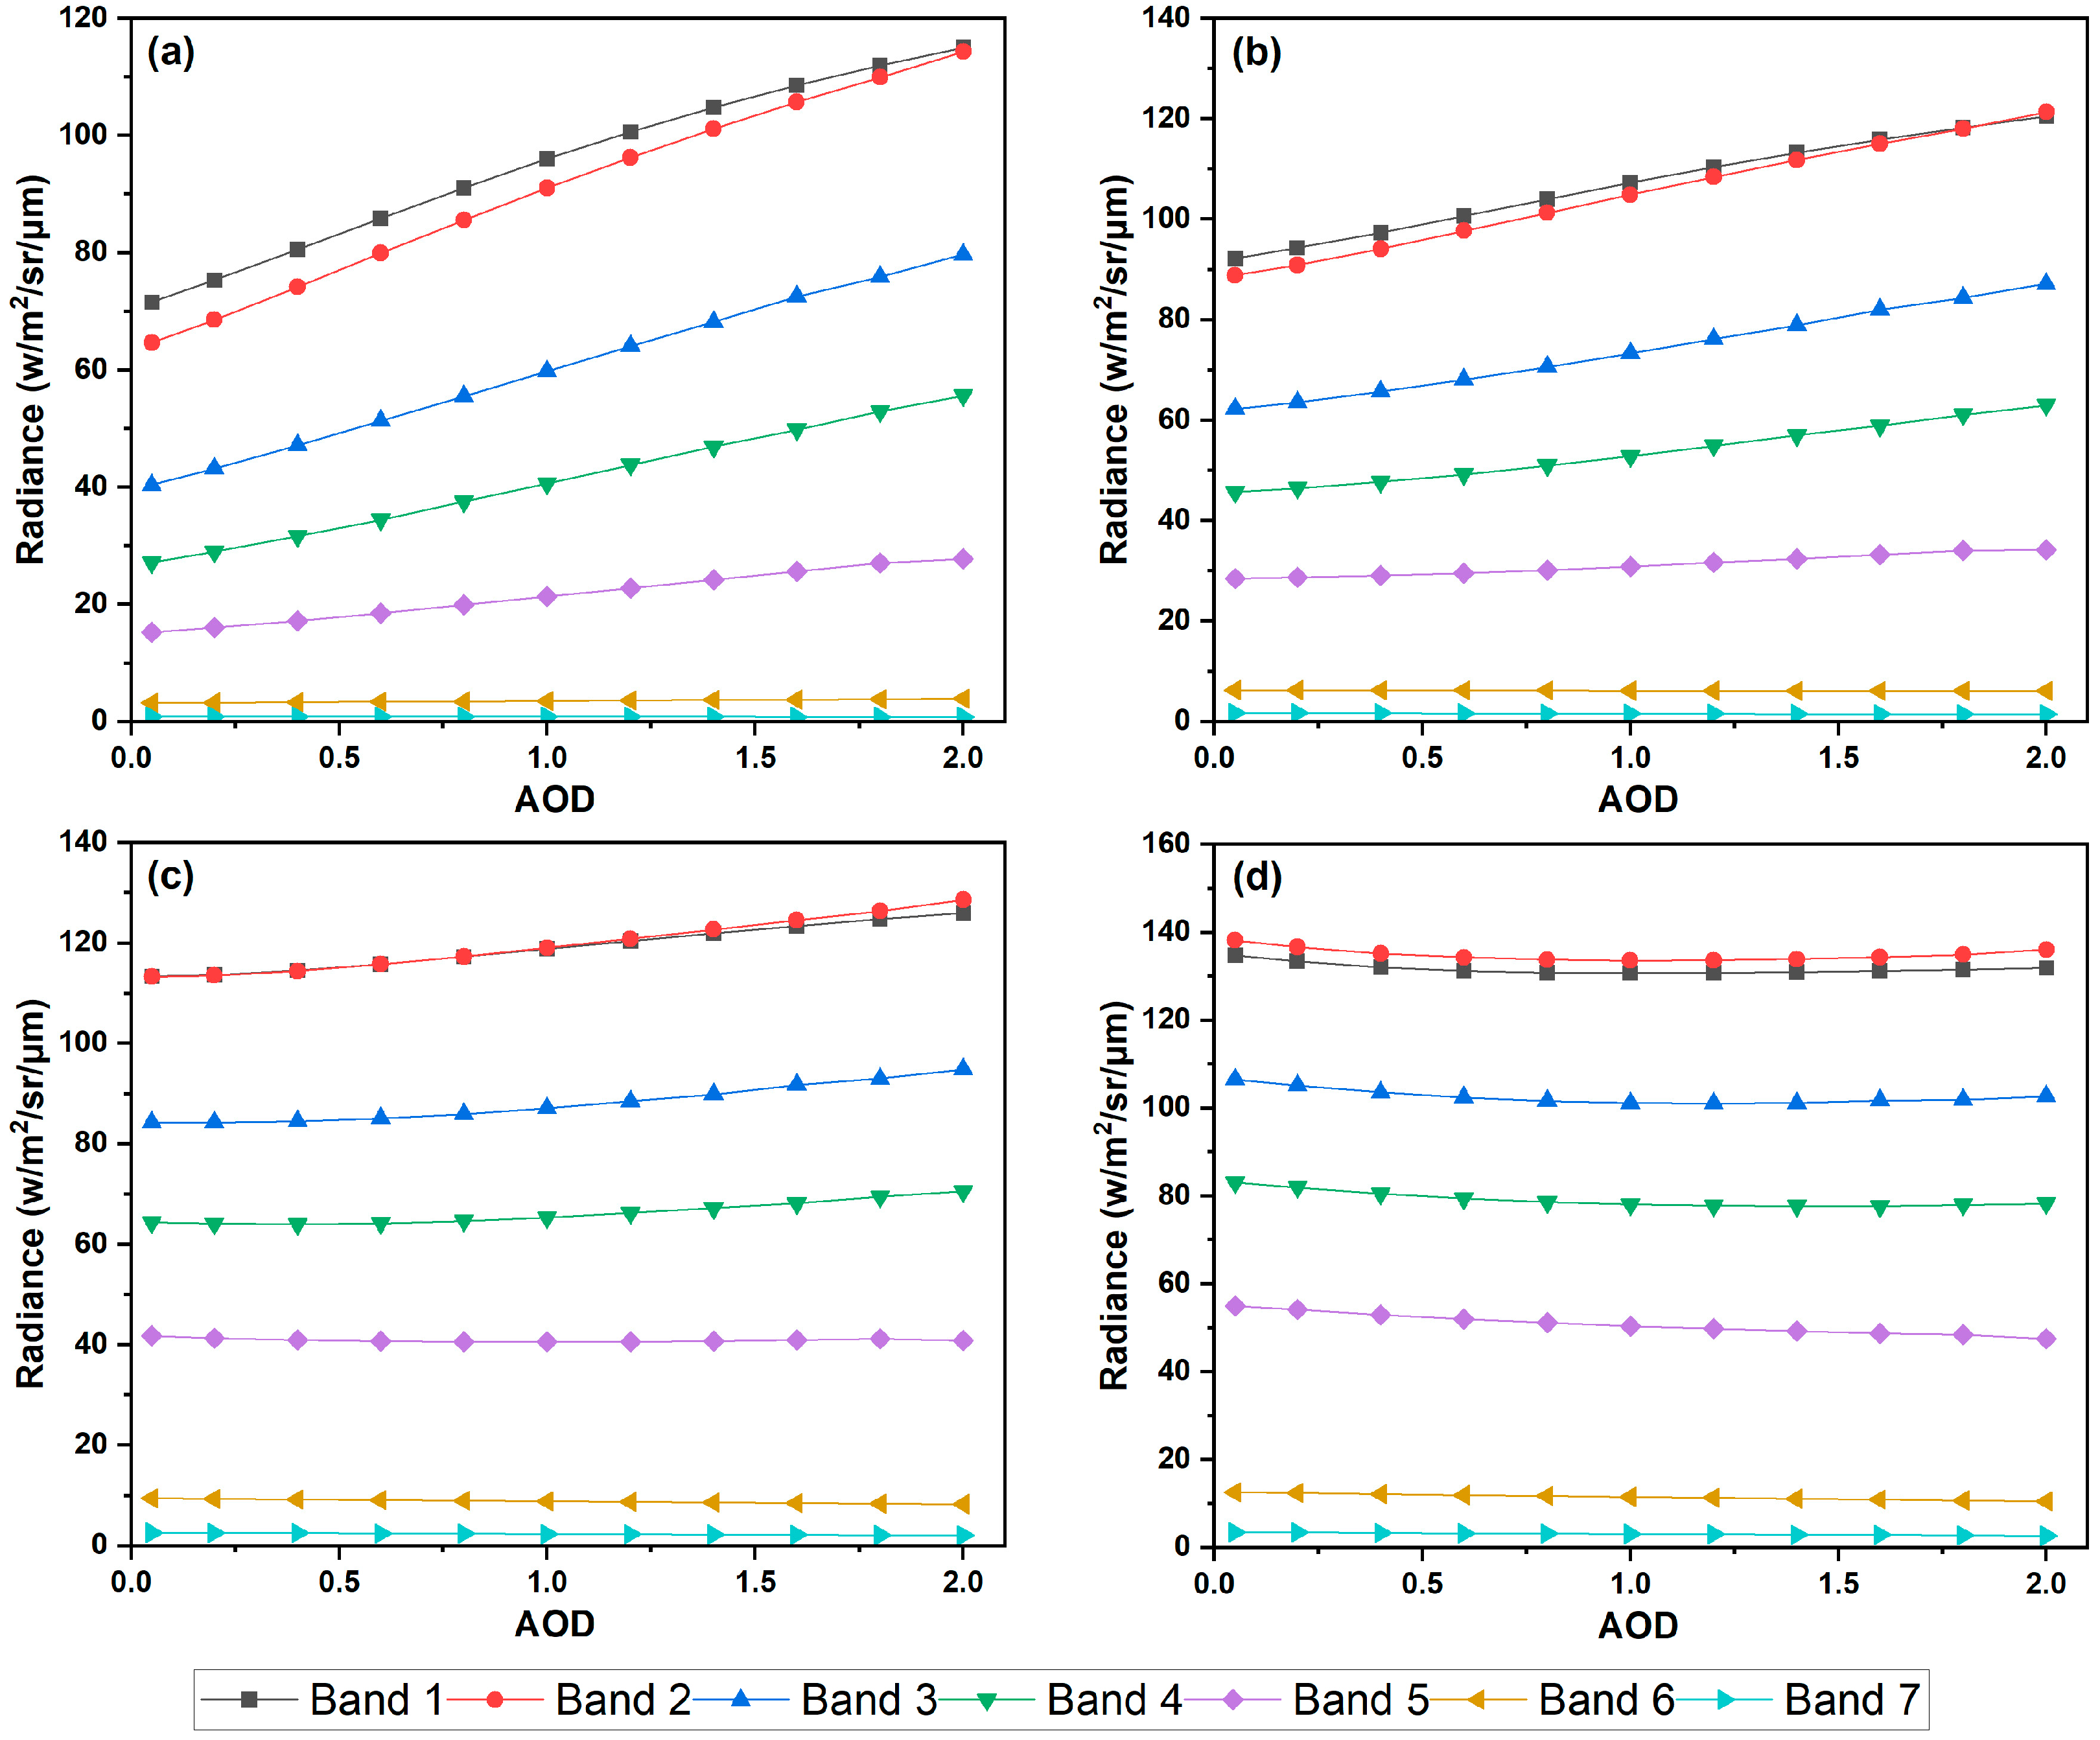
Although multispectral imagery provides abundant spectral information for AOD retrieval, the sensitivity of individual bands to AOD differs significantly [31]. Therefore, a sensitivity analysis of spectral bands is required to determine the most suitable band combinations for accurate AOD estimation. Although TOA reflectance is widely employed as input for AOD retrieval models, the radiative transfer simulations in this study were conducted at the level of TOA radiance. This approach was adopted because radiance constitutes the direct physical output of radiative transfer models and explicitly characterizes the spectral radiative intensity received by the satellite sensor. Analyzing radiance facilitates a more precise evaluation of the sensitivity of individual spectral bands to AOD variations under varying surface reflectance conditions, without the confounding effects of geometric normalization that are inherent in TOA reflectance computation. In this study, four representative SR conditions were simulated, with reflectance values set to 0.05, 0.10, 0.15, and 0.20.
As shown in Figure 2, the shortwave bands (Bands 1 to 4) exhibit high sensitivity to variations in AOD. Under low SR conditions, TOA radiance exhibits a substantial increase with increasing AOD, with the blue band demonstrating the most pronounced scattering response. As SR increases, the sensitivity of TOA radiance to AOD progressively decreases, leading to only minor radiometric variations under high-reflectance scenarios. Based on the observed spectral response characteristics, only the TOA reflectance data from Bands 1~4 was utilized for AOD retrieval. Furthermore, pairwise TOA reflectance ratios among these bands ( ρ 2 T O A / ρ 1 T O A , ρ 3 T O A / ρ 1 T O A , ρ 4 T O A / ρ 1 T O A , ρ 3 T O A / ρ 2 T O A , ρ 2 T O A / ρ 2 T O A , ρ 4 T O A / ρ 3 T O A ) were computed to emphasize the relative spectral differences while mitigating the influence of absolute reflectance values.

2.3. Auxiliary Data

As illustrated in Figure 1, the study area comprises both urban and mountainous regions, characterized by significant surface heterogeneity. To account for this complexity, two auxiliary datasets with a spatial resolution of 30 m were integrated into the retrieval process: the GLC_FCS30D land-cover type dataset [38] and the SRTM elevation dataset [39]. To mitigate uncertainties associated with fine-scale classification, the original land-cover types were reclassified into ten major surface types: cropland, forest, shrubland, grassland, tundra, wetland, impervious surface, bare areas, water body, and snow/ice. Pixels identified as water bodies or snow/ice were considered invalid and subsequently masked. The incorporation of land-use categories and surface elevation as auxiliary predictors improves the adaptability and generalization capability of the model under heterogeneous surface conditions.

3. Methods

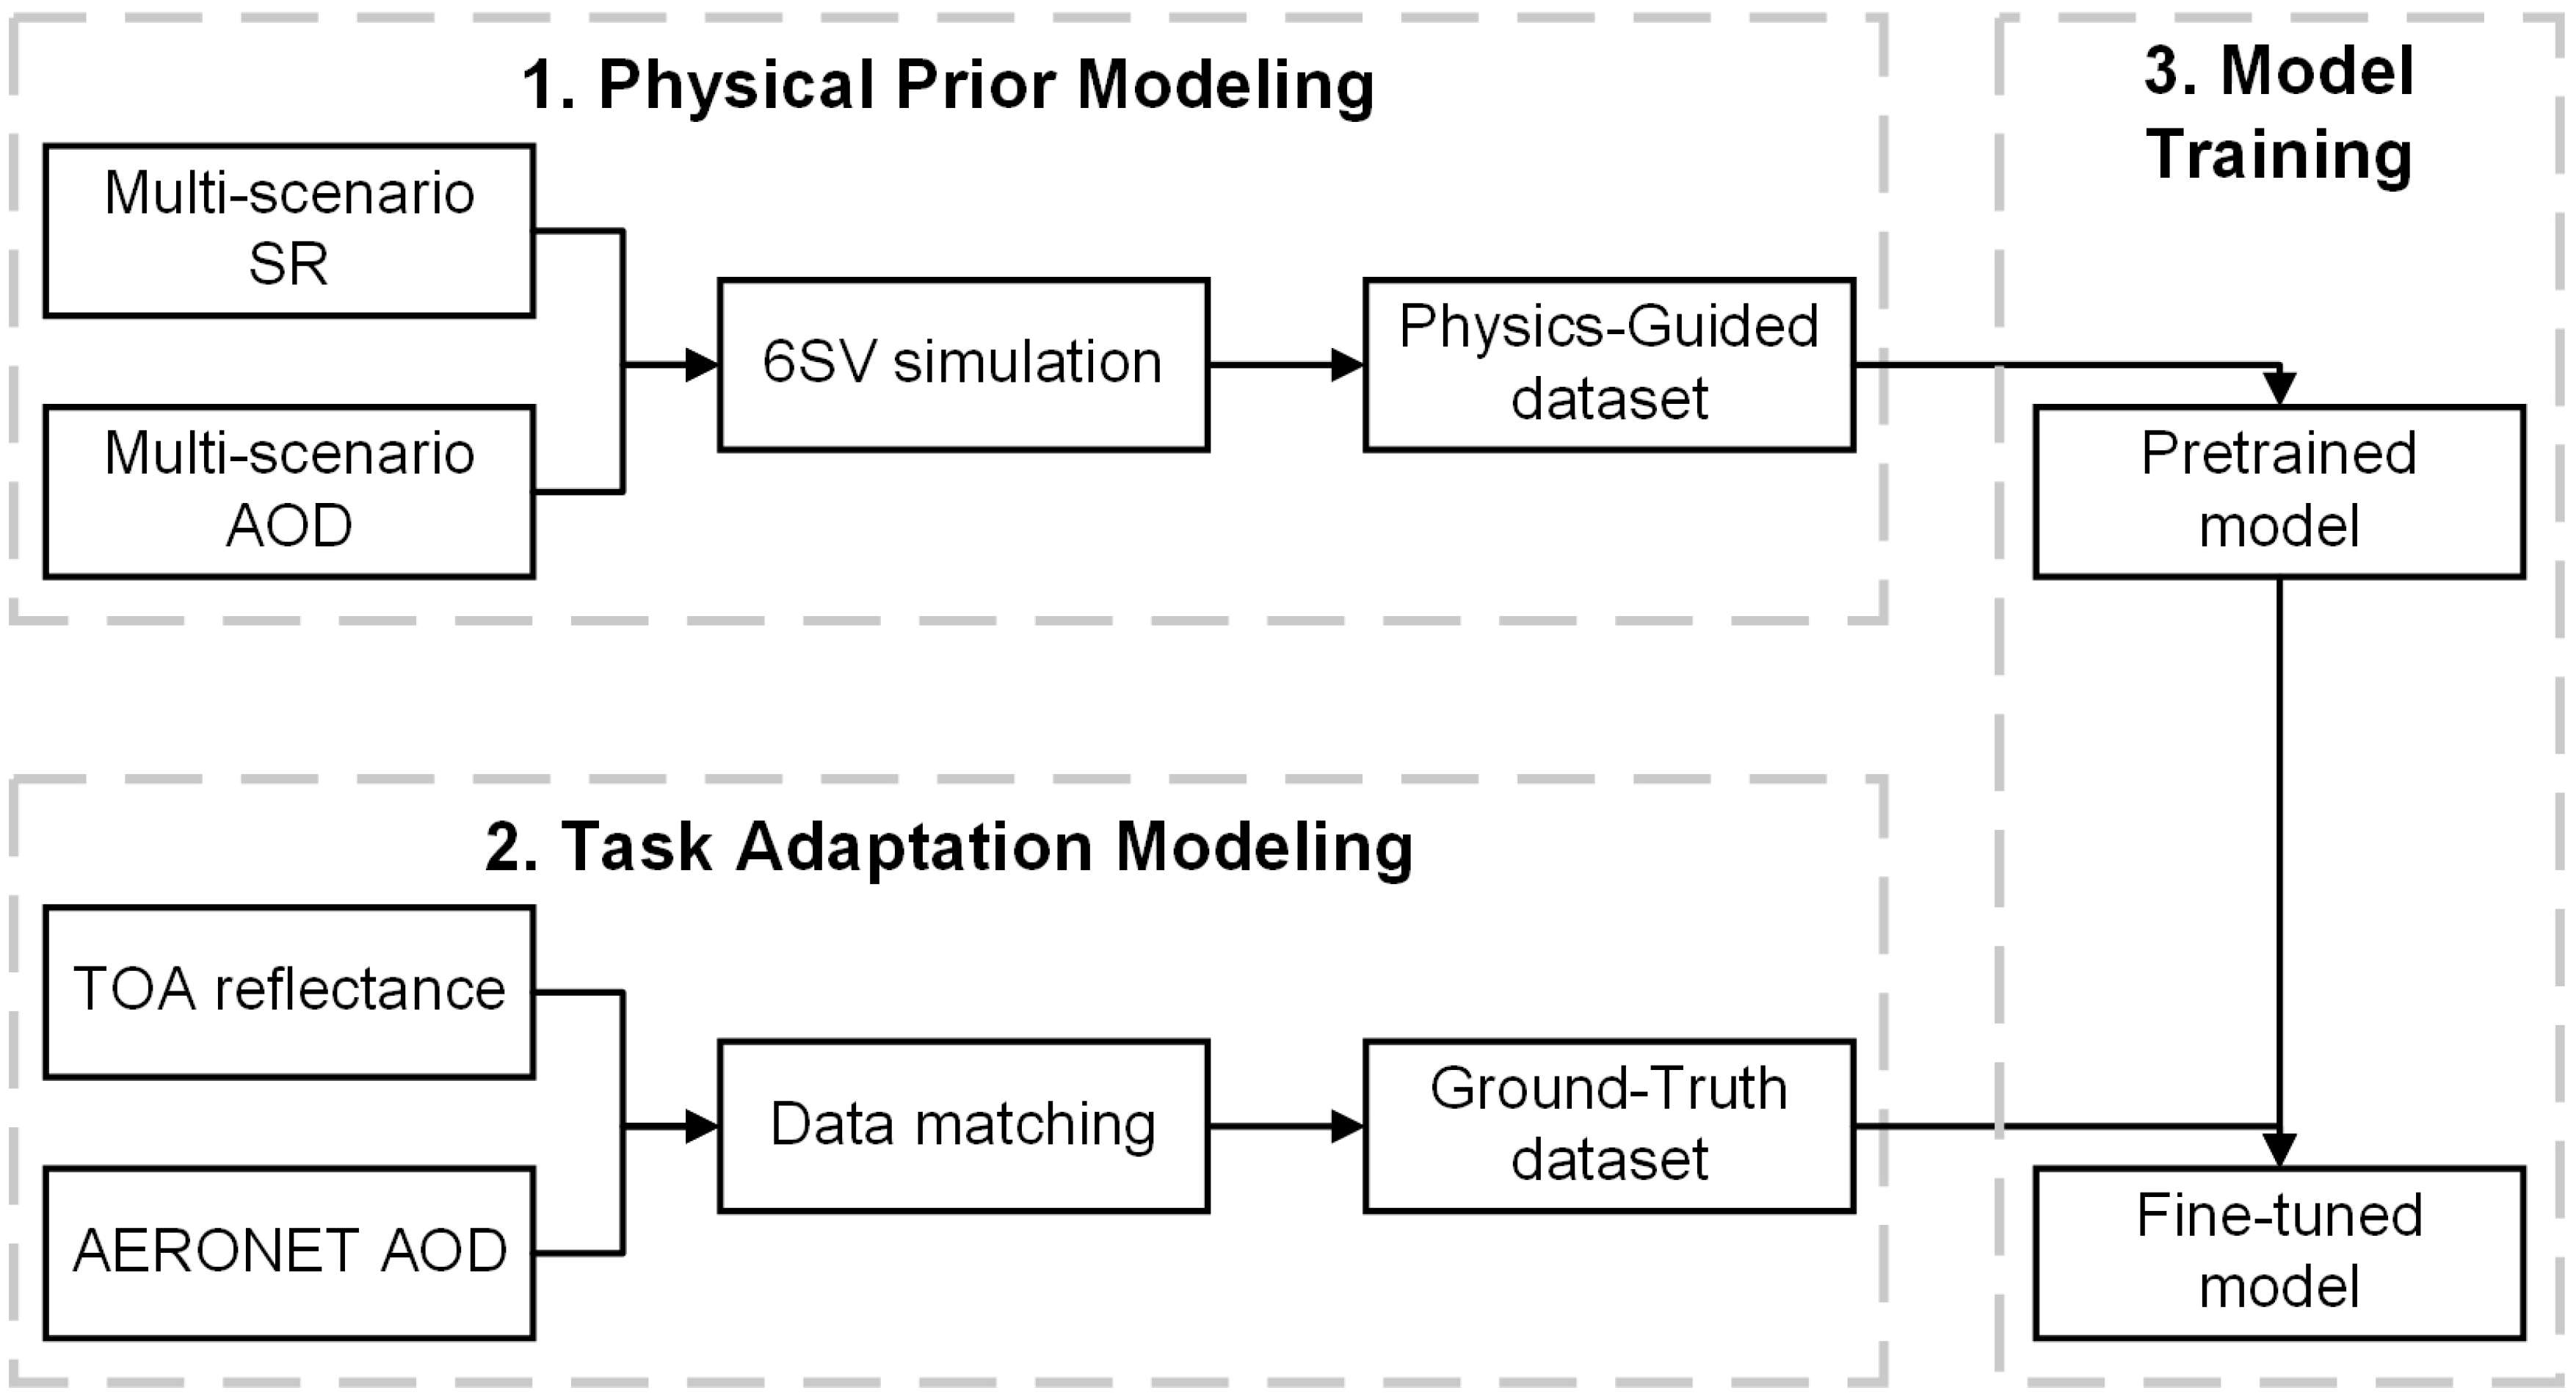
Figure 3 illustrates the workflow of the PT-DNN algorithm. In the first stage, a radiative transfer model is employed to conduct extensive simulations, generating a physics-guided dataset that encompasses a wide range of observational scenarios. In the second stage, satellite observations are temporally and spatially matched with AERONET AOD measurements to construct a ground-truth dataset. This two-stage training strategy integrates physically based modeling with data-driven learning, enabling a hybrid retrieval framework that leverages the strengths of both paradigms.

3.1. Physical Prior Modeling

In this study, a radiative transfer model was utilized to simulate TOA-AOD samples, thereby providing physically based constraints for model development. This process is herein referred to as physical prior modeling. The main procedures include: (1) constructing a radiative transfer look-up table (LUT); (2) generating a multi-scenario SR dataset; (3) extracting representative surface reflectance samples to construct the physics-guided dataset. The detailed methodology is described as follows:
(1) The 6SV 2.1 model [40] was employed for radiative transfer simulations. Given the computational intensity of pixel-by-pixel simulations, a look-up table (LUT) method was employed to improve efficiency. In this method, key parameters, including atmospheric path radiance, atmospheric transmittance, and hemispherical reflectance, were pre-calculated and stored for various spectral bands, atmospheric conditions, and observation geometries. Two types of LUTs were developed to fulfill distinct application requirements. LUT 1 was designed for atmospheric correction of clear-sky images, with the AOD restricted to 0.1 or below. LUT 2, on the other hand, was developed for forward simulations across different observation scenarios, covering a wider range of AOD values. The detailed parameter settings for both LUTs are presented in Table 1.
(2) A clear-sky composite method [41] was employed to construct a monthly clear-sky SR database. For each pixel, the TOA reflectance of Band 2 from all images within the month was evaluated, and the second-lowest value was selected to create the monthly clear-sky image [42]. Considering the relatively small study area and limited spatiotemporal variability of aerosols, the background AOD under clear-sky scenarios was treated as a constant. The monthly background AOD was determined by collecting daily mean AOD measurements from all AERONET sites and generating candidate values within the range [0.01, 0.09] at 0.01 intervals. The frequency of measurements within ±0.01 of each candidate value was then counted, and the candidate with the highest frequency was selected [43]. For periods with insufficient clear-sky pixels, such as February to March (due to snow cover) and July to August (due to cloud contamination), images from adjacent months were aggregated for statistical analysis. This approach increased the number of valid pixels and enhanced the accuracy of the composites. the estimated background AOD was employed in conjunction with LUT 1 for atmospheric correction, yielding the monthly SR database.
(3) A joint sampling method combining Normalized Difference Vegetation Index (NDVI) classification and brightness stratification is proposed to balance data representativeness and computational efficiency. NDVI was first calculated using SR from the red band (Band 4) and the near-infrared band (Band 5), as follows:
N D V I = ρ 5 S R ρ 4 S R ρ 5 S R + ρ 4 S R
Pixels were then classified into three categories based on NDVI values: low vegetation coverage (0 ≤ NDVI < 0.1), transition zone (0.1 ≤ NDVI < 0.3), and high vegetation coverage (NDVI ≥ 0.3). Within each category, pixels were further stratified according to the reflectance of the blue band (Band 2), and 10,000 samples were uniformly and randomly selected based on this stratification. Following sampling, the AOD range was defined as 0 to 2, and a uniform random assignment strategy was employed to distribute AOD values across the samples, ensuring comprehensive representation of aerosol loading conditions. These multi-scenario AOD values were then utilized in LUT 2 to conduct forward simulations, generating the physics-guided dataset. The dataset consists of 300,000 samples.
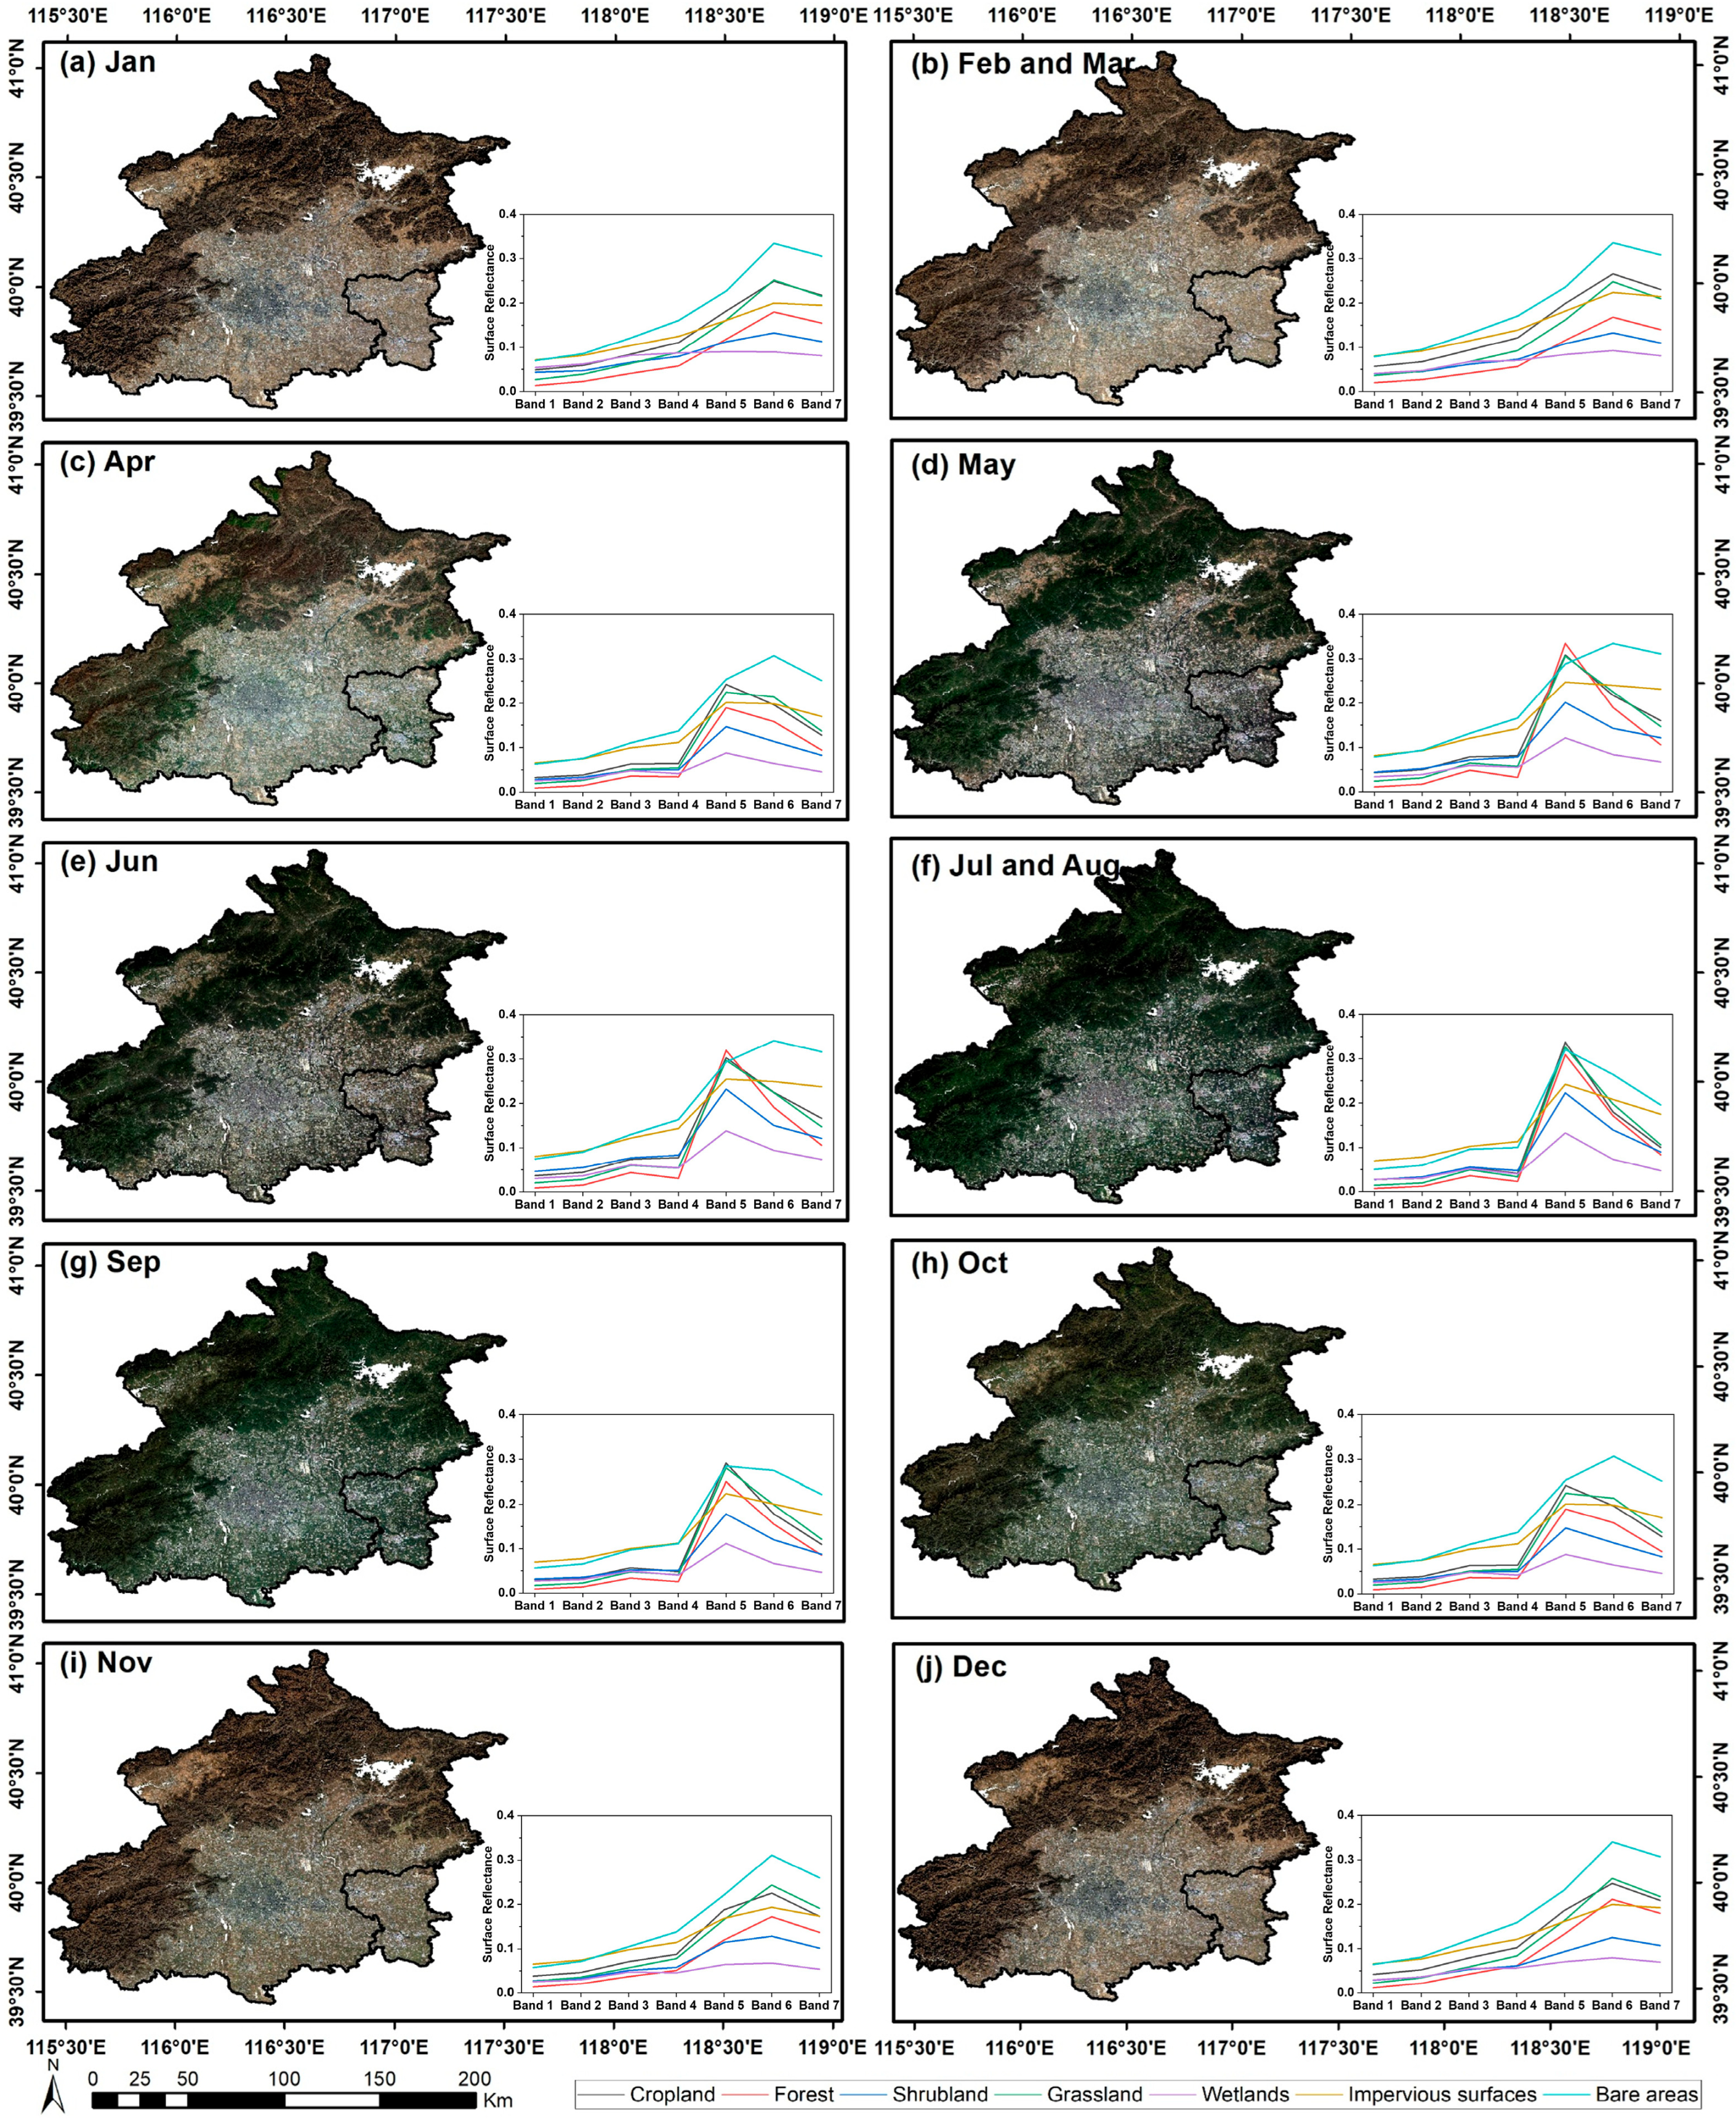
Due to the long revisit interval of Landsat 8 and the frequent interference from clouds, snow cover, and terrain shadows, clear-sky pixels are often temporally sparse and unevenly distributed in certain months. This is particularly evident during seasonal transitions, such as early spring and late summer. During these periods, cross-seasonal pixels may be introduced into the compositing process, potentially resulting in temporal mixing within the final imagery. In addition, generating spatially complete monthly composites often requires mosaicking multiple scenes acquired from different orbital paths. These scenes may differ in acquisition time, solar geometry, sensor view angle, and atmospheric conditions. As a result, radiometric discontinuities may arise, leading to visual inconsistencies in the composite image, typically manifested as localized color deviations or seamlines. The monthly surface reflectance images, derived from the composite and atmospheric correction, are shown in Figure 4.

3.2. Task Adaptation Modeling

This study incorporated measured TOA-AOD samples to correct potential biases in the simulated data and enhance the model’s adaptability to real observations in the study area. This process is herein referred to as task adaptation modeling. A dual-constraint mechanism was adopted to match Landsat 8 OLI images with AERONET AOD data. The temporal constraint employed the average AOD observations within ±30 min of the satellite overpass. The spatial constraint delineated a 7 × 7 pixel window centered on each AERONET site, from which all pixels were extracted to minimize single-pixel instability [44]. Following the matching process, the ground-truth dataset containing approximately 15,000 samples was obtained.

3.3. Model Structure

The PT-DNN model utilizes two categories of input data. The first category (Input1) is derived from data within a 5 × 5 pixel window, consisting of TOA reflectance from four spectral bands and their pairwise ratios, forming a 5 × 5 × 10 input block. This structure retains spatial neighborhood information, enabling the model to capture local spatial context. The second category (Input2) consists of six observational geometry parameters and two auxiliary variables, represented as an 8-dimensional vector.
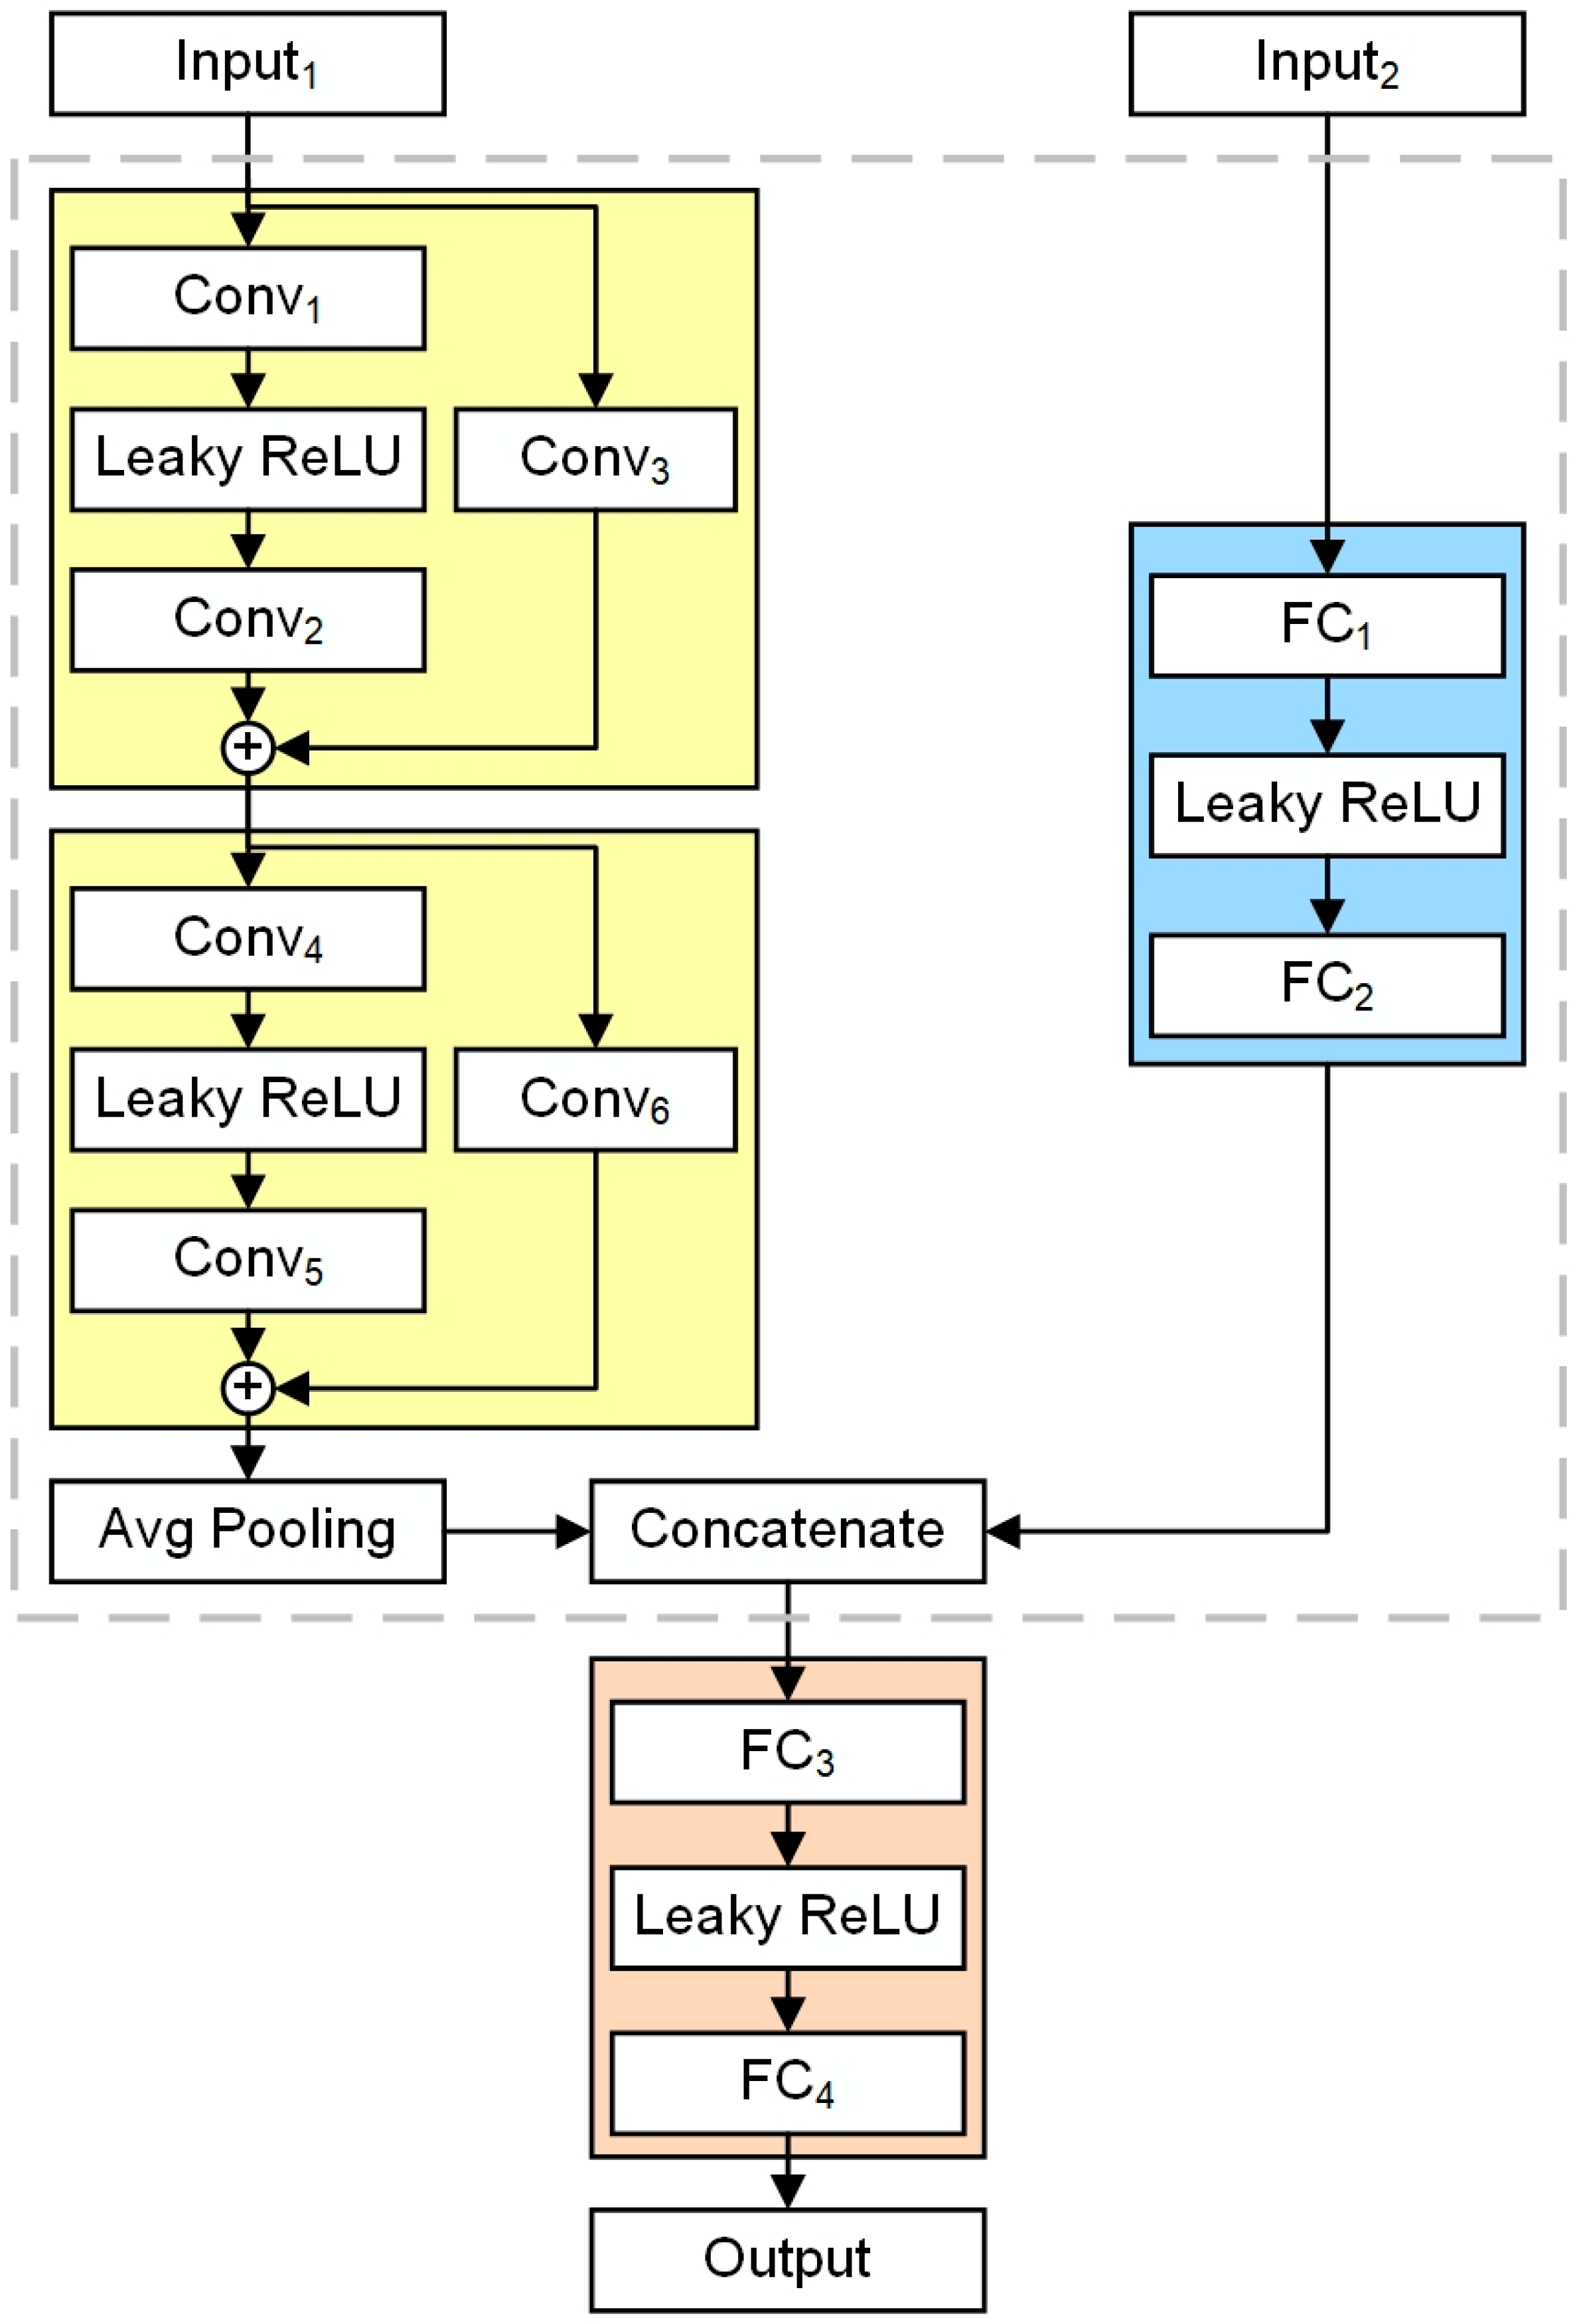
As shown in Figure 5, the overall model architecture consists of two components: a feature extraction module (indicated by the dashed box) and a regression module. The feature extraction module processes the two input types independently to derive representative feature representations, while the regression module integrates these multisource features to estimate AOD.
Within the feature extraction module, PT-DNN adopts a dual-branch neural network architecture. The convolutional neural network (CNN) branch consists of two sequential residual units (highlighted in yellow in Figure 5), each comprising two convolutional layers and a residual connection. The residual connection employs a 1 × 1 convolution to align the channel numbers and spatial dimensions between the main and residual branches, ensuring dimensional consistency. This architecture facilitates unobstructed gradient propagation, thereby alleviating the vanishing gradient problem and enhancing training stability and convergence efficiency [45]. At the end of the CNN branch, a global average pooling layer is applied. Its output is then concatenated with the features extracted by the Back Propagation Neural Network (BPNN) branch (highlighted in blue in Figure 5). The combined features are then passed to the regression module. In this module, a fully connected network performs nonlinear mapping, thereby generating the retrieved AOD value. The neural network layer configurations for each module are summarized in Table 2.

3.4. Model Training

This study employs a transfer learning strategy through a two-stage training framework. In the first stage, the entire model is pretrained on the physics-guided dataset to capture the physical principles of atmospheric radiative transfer. In the second stage, the model is fine-tuned on the ground-truth dataset to improve adaptability to real observations. During this stage, the parameters of the feature extraction module (shown as the dashed box in Figure 5) are kept fixed, while only the regression module is updated. The feature extraction module, which was trained during the first stage, captures general patterns and characteristics from the physics-guided dataset. By keeping this module fixed, the PT-DNN model maintains these learned features. Meanwhile, the regression module, which directly maps the extracted features to the final output, is adjusted to align with observed real-world data. This approach ensures the model retains general features while adapting to region-specific characteristics. Fine-tuning only the regression module prevents overfitting, allowing the model to generalize better to unseen data and improving accuracy in aerosol retrieval tasks.
Prior to training, all input features were standardized using min-max normalization. The Leaky ReLU was employed as the activation function, while mean absolute error (MAE) was selected as the loss function. MAE calculates the absolute deviation between predictions and reference values, thereby reducing sensitivity to outliers and ensuring balanced optimization across varying error magnitudes. This characteristic promotes stable error convergence during cross-dataset training [46]. The MAE is formulated as follows:
L o s s M A E = 1 N i = 0 N X i Y i
where X i denotes the predicted AOD value, Y i represents the true AOD value, and N is the total number of samples. Regarding the optimization strategy, the Adam optimizer was adopted, with the learning rate set to 0.0001 in the first stage and reduced to 0.00005 in the second stage. Furthermore, L2 regularization was applied throughout both stages to constrain model complexity. To further alleviate overfitting, a Dropout layer with a rate of 0.1 was incorporated prior to the FC3 and FC4 layers in the regression module.
A laptop equipped with an NVIDIA 4060 GPU and 16 GB of RAM was employed for model training. For storage, the method requires 300 GB of disk space for the model and dataset. The neural network was implemented using the PyTorch package (version 2.5.1). Both pre-training and fine-tuning phases were conducted for 200 epochs, with each phase taking approximately 1 h. Data preprocessing, dataset construction, model training and model predicting were all automatically implemented using Python scripts (version 3.9), ensuring ease of application and scalability for larger datasets.

4. Results

4.1. Model Validation

Because of the extremely limited number of AERONET sites, conventional cross-validation may result in training and validation samples originating from the same site. This may introduce spatial homogeneity between training and testing data and potentially overestimating the generalization capability [47]. To address this limitation, a cross-regional generalization evaluation strategy is proposed. Specifically, four urban sites (Beijing, Beijing-CAMS, Beijing_PKU, and Beijing_RADI) were designated as the training set, while one suburban site (XiangHe) was exclusively allocated for testing. This validation strategy enables assessment of the model’s performance in regions with geographic conditions that differ markedly from those of the training data. It provides a more rigorous assessment of the regional transferability of the model.
This study compares the PT-DNN model with a data-driven model trained solely on the ground-truth dataset. Both models employ identical neural network architectures to ensure consistency. The samples were derived using neighborhood sampling, i.e., the 7 × 7 pixel window sampling described previously. Therefore, multiple predictions corresponding to the same AOD measurement were averaged. Model performance was evaluated using the coefficient of determination (R2), root mean square error (RMSE), MAE, and expected error (EE).
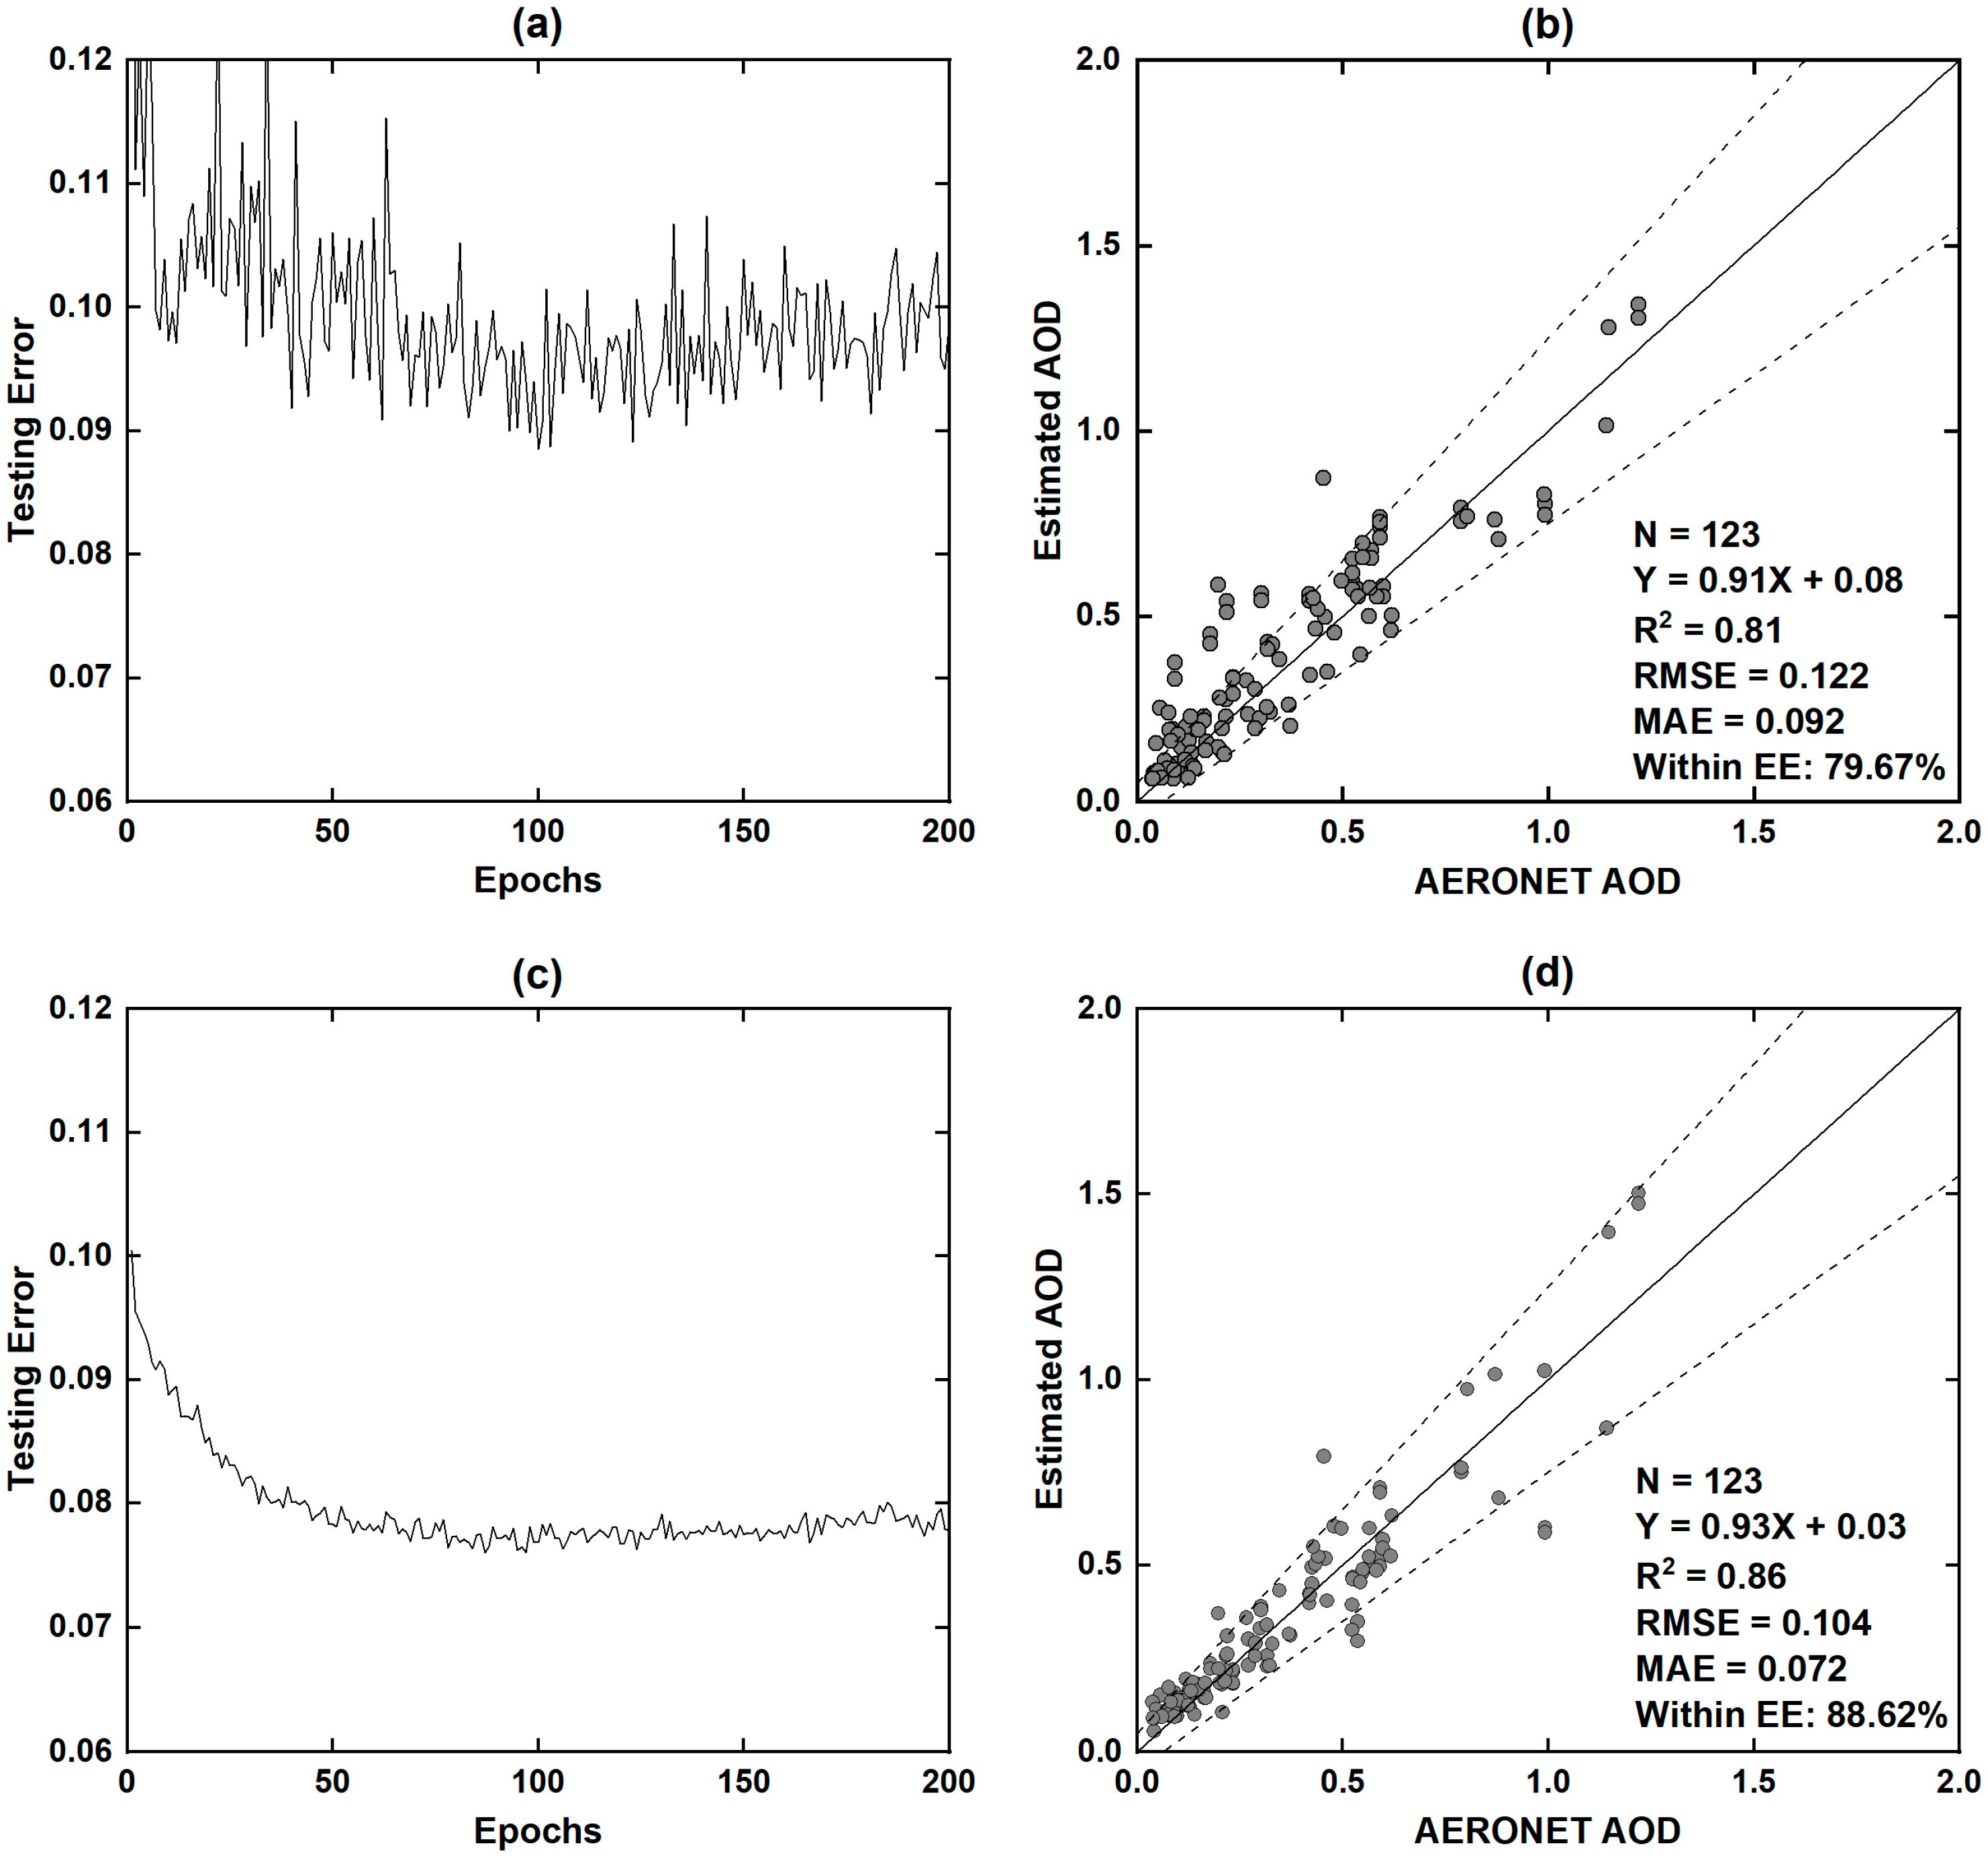
As illustrated in Figure 6, the data-driven model exhibits pronounced error fluctuations during training (Figure 6a), with values oscillating around 0.1. In contrast, the PT-DNN model demonstrates markedly lower and more stable errors (Figure 6c), ultimately converging to values below 0.08. For the data-driven model, the R2 reaches 0.81, with RMSE of 0.122, MAE of 0.092. In addition, 79.67% of samples falls within the EE envelope. The PT-DNN model achieves a higher R2 of 0.86, while RMSE and MAE decrease to 0.104 and 0.072, respectively. Notably, 88.62% of samples falls within the EE envelope. These results demonstrate that the PT-DNN model achieves higher adaptability to unseen data and enhanced cross-regional transferability.
Finally, it should be emphasized that this study aims to advance data-driven AOD retrieval through embedding physical constraints into the training process. To ensure that the effectiveness of the proposed approach is fairly evaluated, the PT-DNN model is compared only with a baseline deep neural network that shares the same architecture. In addition, physically based retrieval algorithms are not included in this comparison, as they represent a fundamentally different paradigm and are beyond the scope of this study.

4.2. Accuracy Comparison

With reference to AERONET measurements, this study compares the PT-DNN retrieval with the widely used MCD19A2 product [48]. To ensure temporal consistency with Landsat 8 overpasses, only AOD data from the Terra satellite within the MCD19A2 product were selected. The PT-DNN retrievals have a spatial resolution of 30 m, whereas the MCD19A2 product provides AOD at 1 km resolution. Given the ultra-high resolution of the PT-DNN results, the mean value of a 7 × 7 pixel window centered on each AERONET site was extracted to represent the PT-DNN retrieval.
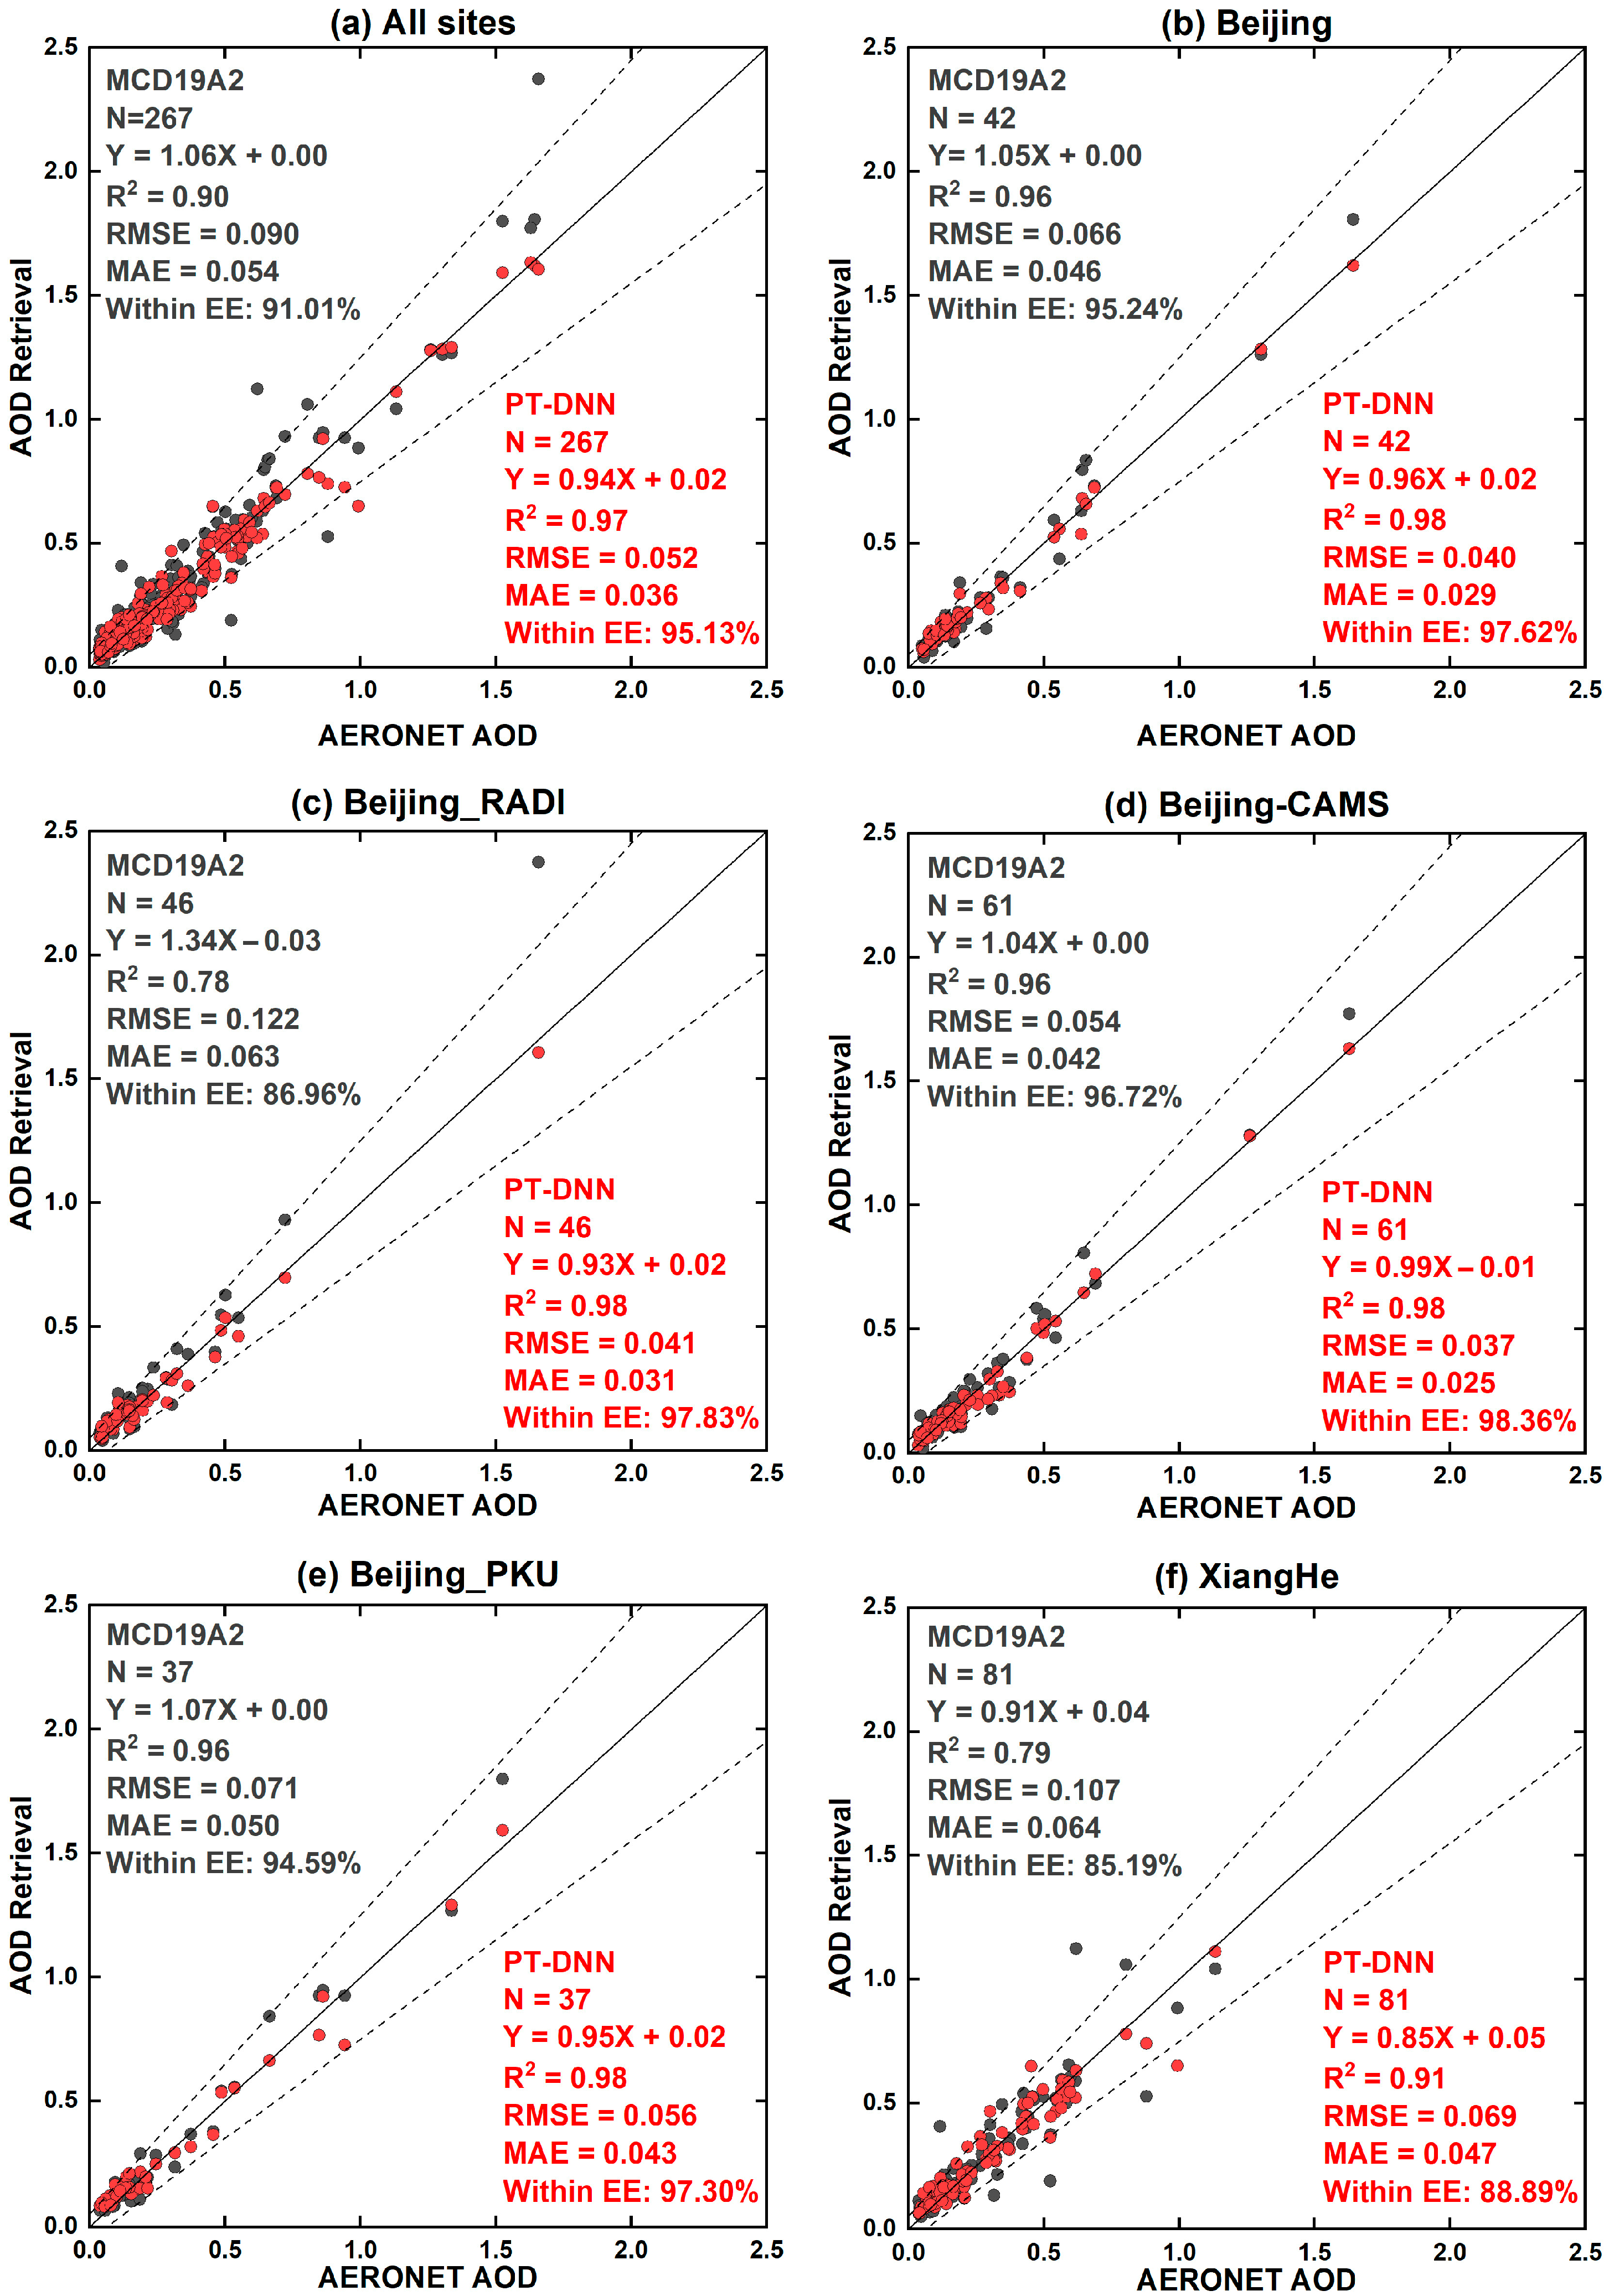
As shown in Figure 7, the PT-DNN retrieval exhibits a stronger linear correlation with ground-based measurements, achieving an R2 of 0.97, notably higher than the 0.90 reported for MCD19A2. It also yields lower errors, with an RMSE of 0.052 and an MAE of 0.036, compared to 0.090 and 0.054, respectively. Moreover, the proportion of samples within the EE envelope increases from 91.01% to 95.13%. These results indicate that the PT-DNN retrieval offers enhanced accuracy, improved agreement with in situ data, and reduced predictive uncertainty.
Site-level evaluation further confirms the superiority of the PT-DNN retrieval. At all urban sites (Beijing, Beijing-CAMS, Beijing_PKU, and Beijing_RADI), the PT-DNN retrieval demonstrates consistently high accuracy, with R2 values reaching up to 0.98 and EE fractions exceeding 97%. At XiangHe site, the PT-DNN retrieval improves the R2 from 0.79 to 0.91 and increases the EE fraction from 85.19% to 88.89%. These results confirm the robustness and generalizability of the PT-DNN retrieval across heterogeneous surface environments.
Moreover, analysis of regression slopes reveals a systematic overestimation tendency in the MCD19A2 product. In contrast, the PT-DNN model displays a slight underestimation bias while maintaining greater overall robustness in the regression fit. In addition to its superior retrieval accuracy, the PT-DNN retrieval also exhibits advantages in computational efficiency. The MCD19A2 product relies on the MAIAC algorithm [49], which necessitates multi-temporal observations for AOD retrieval. The PT-DNN retrieval is implemented within an end-to-end deep learning framework that integrates physically informed priors, thereby facilitating efficient and accurate AOD estimation from single-scene imagery.

5. Discussion

5.1. Spatial Heterogeneity of the Predicted AOD

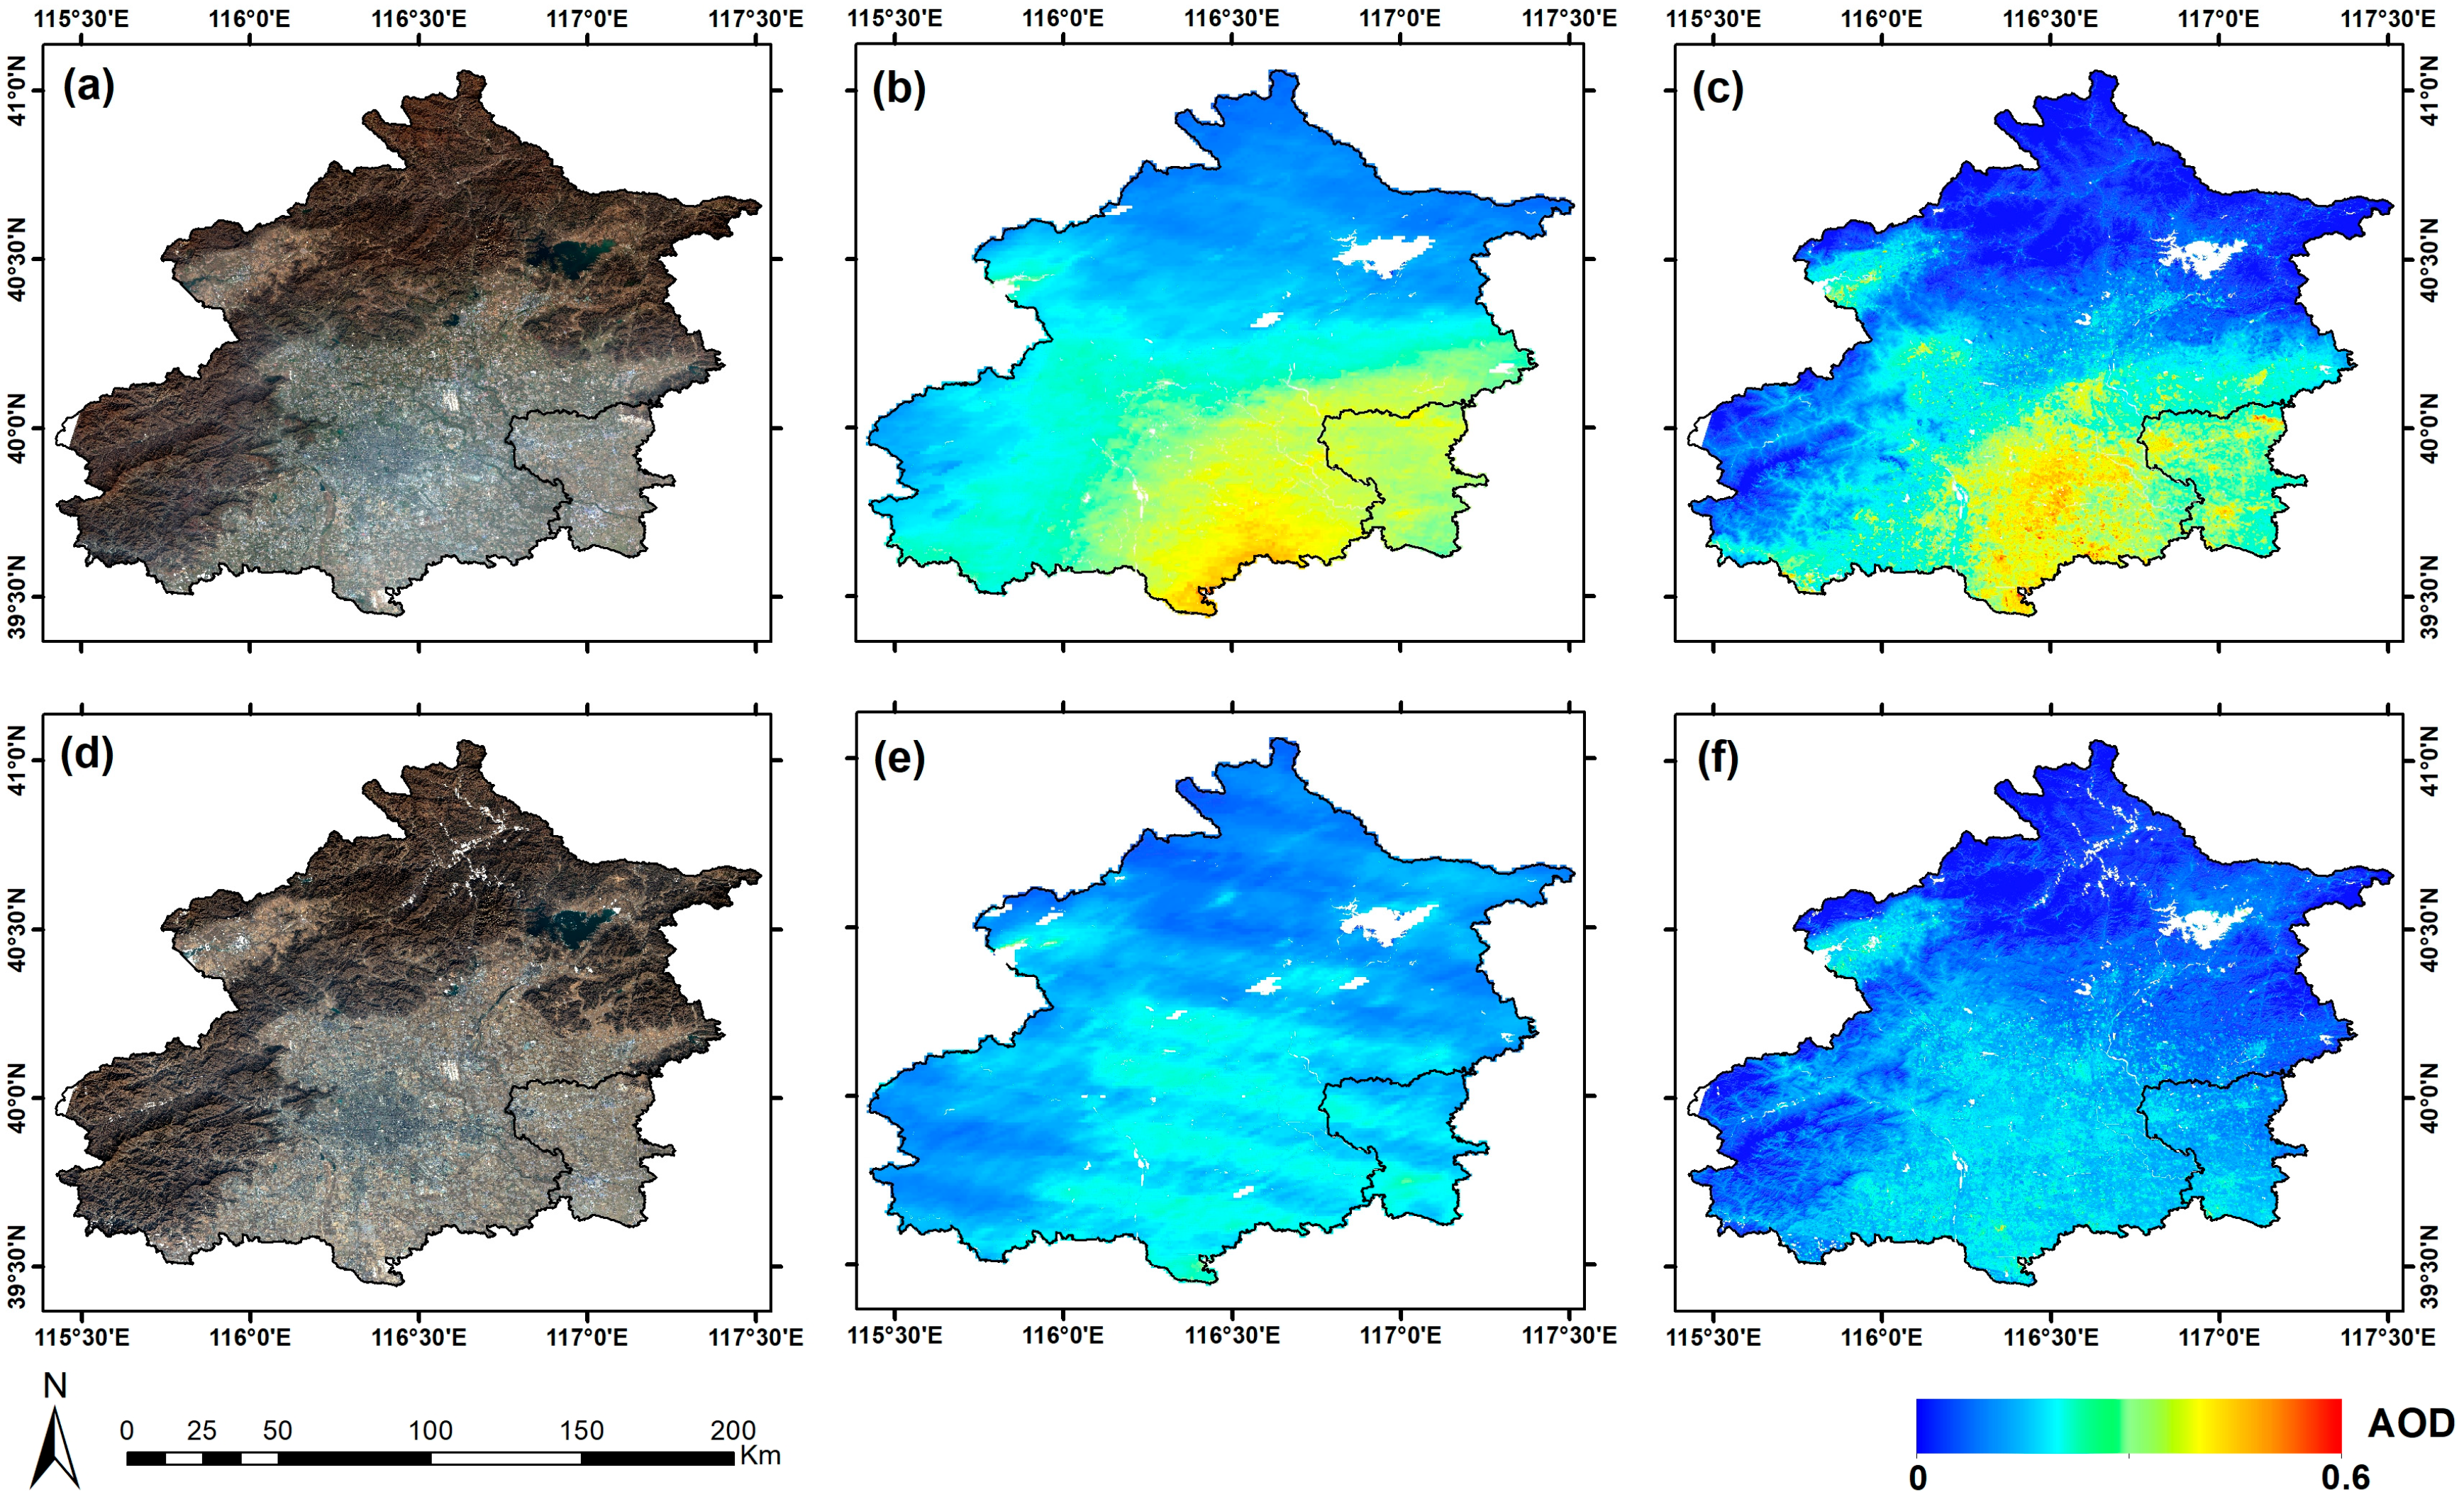
Following accuracy validation and comparative analysis, this section further examines distinct capability of the PT-DNN in characterizing aerosol pollution spatial heterogeneity. As illustrated in Figure 8, the PT-DNN retrievals distinctly resolve complex intra-urban aerosol spatial patterns. In contrast, the spatially smoothed distribution of the MCD19A2 product inadequately captures localized aerosol emission hotspots within urban areas. Moreover, on certain dates (e.g., Figure 8b), MCD19A2 spatial distributions exhibit pronounced striping artifacts that compromise spatial continuity. Overall, the high-resolution AOD retrievals demonstrate enhanced capability for localized pollution monitoring in complex urban environments compared to kilometer-scale AOD products.
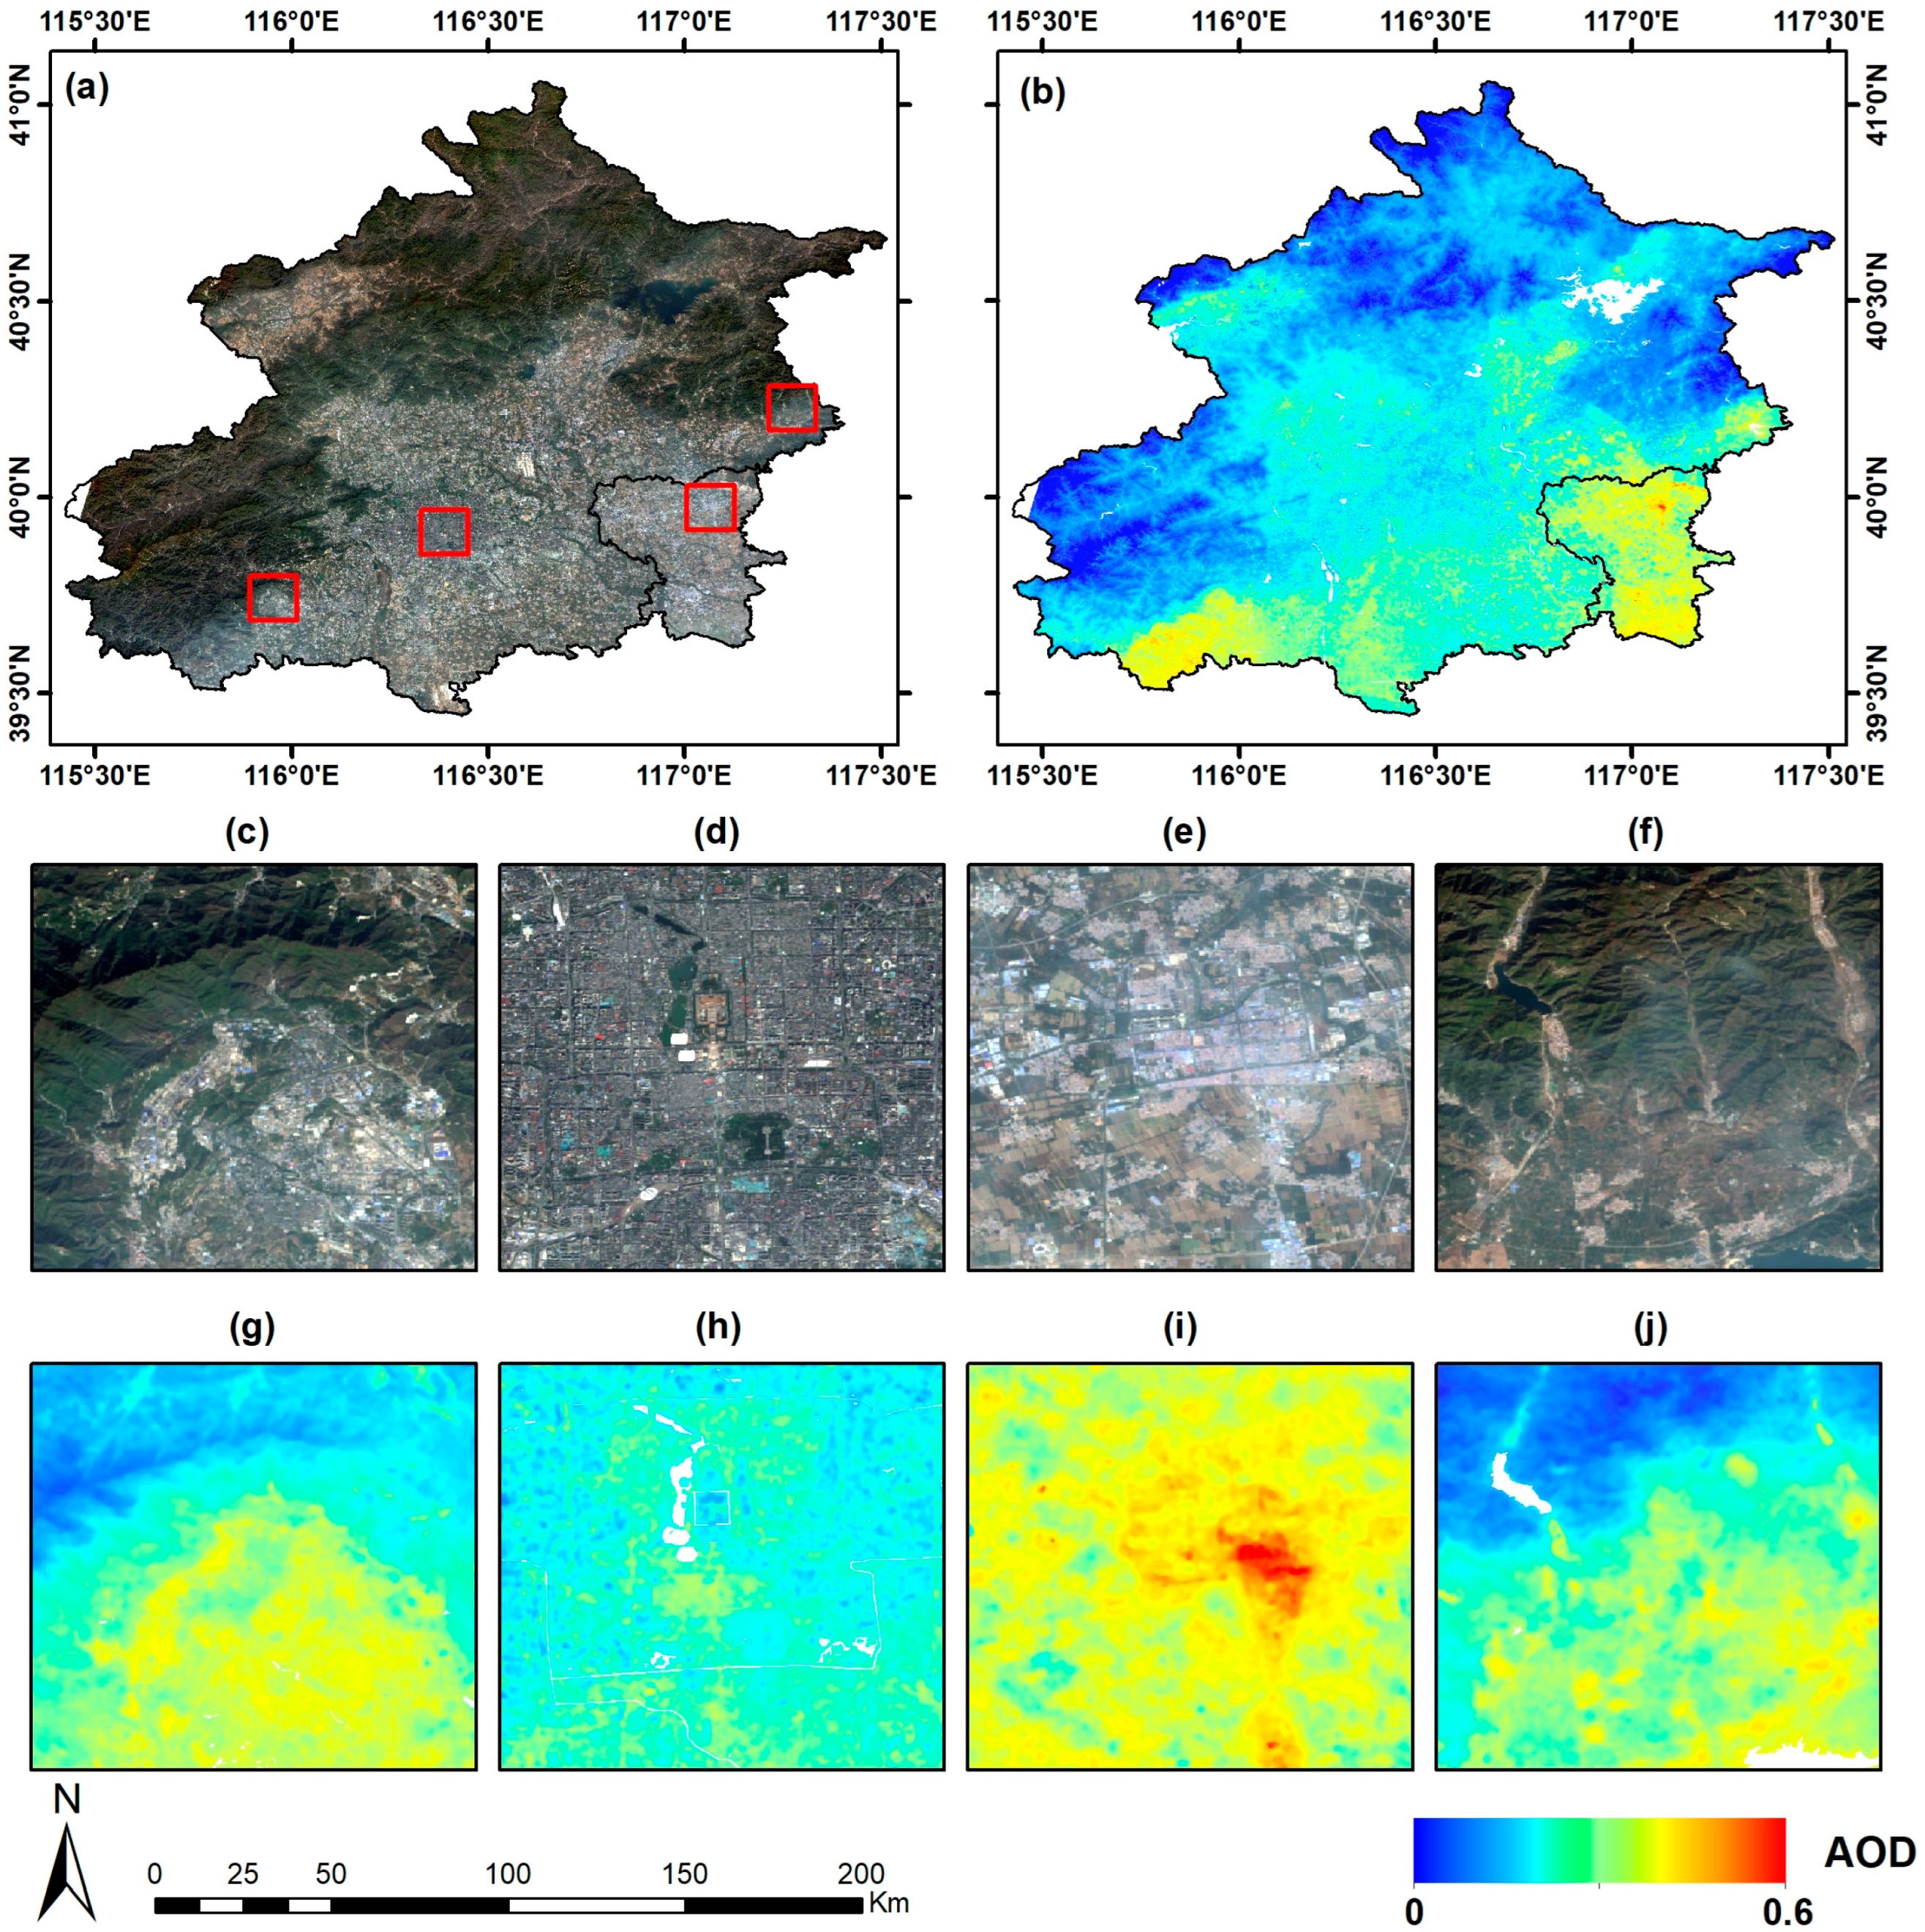
Figure 9 presents a representative case study aimed at further evaluating the capability of the PT-DNN model to resolve fine-scale spatial heterogeneity in aerosol distribution. The scene acquired on 20 October 2019 was selected due to the occurrence of a regional haze episode over the study area, under clear-sky atmospheric conditions with negligible cloud contamination. These favorable conditions ensured reliable satellite observations and facilitated accurate AOD retrieval. At the Yanshan Petrochemical Industrial Park (Figure 9c,g), the model detects significantly elevated AOD levels consistent with observed haze coverage. This spatial pattern indicates pollutant accumulation driven by orographic blocking of surrounding mountains. In the central urban area (Figure 9d,h), despite generally lower pollution levels, the model delineates elevated AOD over densely built-up zones and major roadways, contrasted with lower values over green spaces. This pattern reflects a pollution gradient dominated by anthropogenic activities. In the eastern rural region (Figure 9e,i) and the mountainous areas (Figure 9f,j), the model also identifies distinct localized haze clusters. This multi-scenario analysis demonstrates that PT-DNN achieves high-accuracy pollution mapping at 30 m resolution while establishing correlations between aerosol distributions, terrain features, land-use patterns, and episodic emission events through fine-scale spatial details.

5.2. Robustness of the Validation Strategy

An additional analysis was conducted to further evaluate the robustness of the cross-regional validation strategy. Given that all sites are situated in areas dominated by impervious surfaces, it is necessary to evaluate whether they differ in aerosol characteristics. Daily mean AOD measurements from 2018 to 2023 are used to conduct a correlation analysis. The resulting pairwise R2 values for all sites are summarized in Table 3. The four sites (Beijing, Beijing-CAMS, Beijing-PKU, and Beijing-RADI) demonstrate high mutual correlations (R2 = 0.94–0.98), indicative of consistent aerosol variability within the urban core. In contrast, the correlations between XiangHe and each urban site are significantly lower (R2 = 0.72–0.74), despite the same land-cover type and relatively short geographic distances. Therefore, selecting XiangHe as the validation site allows for a more rigorous assessment of the model’s generalization capability. This separation strategy helps mitigate the risk of evaluation bias caused by similar data distributions. It should also be noted that the current validation is restricted to impervious surfaces and future work will extend the study area to include additional AERONET sites with diverse land-cover types.

5.3. Other Discussions

The selection of aerosol models significantly influences the accuracy of 6SV simulations. To assess the performance of different aerosol models, an additional Urban Model was tested. In the cross-regional validation, the model pretrained on Continental Model showed superior performance over the Urban Model (R2 = 0.82, RMSE = 0.119, MAE = 0.088) and over the combination of Continental Model and Urban Model (R2 = 0.85, RMSE = 0.108, MAE = 0.077). Continental Model is commonly used in aerosol retrieval studies to represent common land-based aerosol properties [50,51,52]. Future work will investigate the incorporation of additional aerosol models and region-specific adaptations to further improve the accuracy and generalizability of the framework across diverse environmental conditions.
The proposed PT-DNN framework demonstrates promising potential for adaptation to various satellite platforms. Designed with a modular architecture, the model can be efficiently reconfigured to accommodate different spatial resolutions and spectral characteristics. A key advantage of the framework is its exclusive reliance on the TOA reflectance as the primary input, eliminating the need for externally retrieved aerosol or surface reflectance products from other satellites. Future extensions are envisioned toward sensors such as Sentinel-2 Multispectral Instrument (MSI) and GF-1 Wide-Feld-of-View (WFV) cameras, which provide higher spatial resolution and more frequent revisit intervals compared to Landsat 8.

6. Conclusions

In response to the increasing demand for high-resolution aerosol pollution monitoring in urban environments, this study proposes the physical-guided transfer deep neural network (PT-DNN) mode to achieve 30 m resolution AOD estimation from Landsat 8 OLI data. A physics-guided dataset was constructed using 6SV radiative transfer simulations to pretrain the PT-DNN model. Subsequently, fine-tuning was performed with ground-truth dataset derived from AERONET measurements. To assess the generalizability of the proposed approach, we conducted cross-regional validation over impervious surfaces, which confirmed that PT-DNN achieves consistently higher accuracy (R2 = 0.86, RMSE = 0.104, MAE = 0.072) than conventional data-driven models. PT-DNN provides a scalable and physically interpretable solution for enhancing satellite-based aerosol monitoring at urban scales. The model exhibits a strong capacity to capture fine-scale aerosol gradients within heterogeneous urban landscapes, highlighting its spatial sensitivity. Furthermore, the modular design and reliance on physical priors make the framework readily extensible to other satellite sensors and atmospheric variables.

Author Contributions

Conceptualization, D.C. and H.G.; methodology, D.C.; software, D.C.; validation, D.C.; formal analysis, D.C., Y.L. (Yuecheng Li) and Y.W.; investigation, D.C.; resources, D.C.; data curation, D.C.; writing—original draft preparation, D.C.; writing—review and editing, D.C. and H.G.; visualization, D.C.; supervision, H.G., X.G., J.W. and Y.L. (Yan Liu); project administration, H.G., X.G. and J.W. and Y.L. (Yan Liu); funding acquisition, H.G. and X.G. All authors have read and agreed to the published version of the manuscript.

Funding

This research was funded by the National Natural Science Foundation of China (Grant Number: 42271358, L2424330). This research was also funded by the Guangzhou Municipal Science and Technology Bureau (Grant Number: 2025A03J3171).

Data Availability Statement

The AERONET data used in this study is publicly available at https://aeronet.gsfc.nasa.gov/ (accessed on 1 August 2025). The Landsat 8 OLI data is publicly available at https://earthexplorer.usgs.gov/ (accessed on 1 August 2025). The GLC_FCS30D product is publicly available at https://doi.org/10.5281/zenodo.8239305 (accessed on 1 August 2025). The SRTM product is publicly available at https://earthexplorer.usgs.gov/ (accessed on 1 August 2025).

Acknowledgments

We would like to thank the University of Maryland for providing the 6SV model.

Conflicts of Interest

The authors declare no conflicts of interest. The funders had no role in the design of the study; in the collection, analyses, or interpretation of data; in the writing of the manuscript; or in the decision to publish the results.

References

  1. Arfin, T.; Pillai, A.M.; Mathew, N.; Tirpude, A.; Bang, R.; Mondal, P. An overview of atmospheric aerosol and their effects on human health. Environ. Sci. Pollut. Res. 2023, 30, 125347–125369. [Google Scholar] [CrossRef]
  2. Li, J.; Carlson, B.E.; Yung, Y.L.; Lv, D.; Hansen, J.; Penner, J.E.; Liao, H.; Ramaswamy, V.; Kahn, R.A.; Zhang, P. Scattering and absorbing aerosols in the climate system. Nat. Rev. Earth Environ. 2022, 3, 363–379. [Google Scholar] [CrossRef]
  3. Che, H.; Xia, X.; Zhao, H.; Li, L.; Gui, K.; Zheng, Y.; Song, J.; Qi, B.; Zhu, J.; Miao, Y. Aerosol optical and radiative properties and their environmental effects in China: A review. Earth-Sci. Rev. 2024, 248, 104634. [Google Scholar] [CrossRef]
  4. Wei, J.; Wang, J.; Li, Z.; Kondragunta, S.; Anenberg, S.; Wang, Y.; Zhang, H.; Diner, D.; Hand, J.; Lyapustin, A. Long-term mortality burden trends attributed to black carbon and PM2· 5 from wildfire emissions across the continental USA from 2000 to 2020: A deep learning modelling study. Lancet Planet. Health 2023, 7, e963–e975. [Google Scholar] [CrossRef]
  5. Tian, Y.; Ma, Y.; Wu, J.; Wu, Y.; Wu, T.; Hu, Y.; Wei, J. Ambient PM2. 5 chemical composition and cardiovascular disease hospitalizations in China. Environ. Sci. Technol. 2024, 58, 16327–16335. [Google Scholar] [CrossRef] [PubMed]
  6. Pahlevan, N.; Mangin, A.; Balasubramanian, S.V.; Smith, B.; Alikas, K.; Arai, K.; Barbosa, C.; Bélanger, S.; Binding, C.; Bresciani, M. ACIX-Aqua: A global assessment of atmospheric correction methods for Landsat-8 and Sentinel-2 over lakes, rivers, and coastal waters. Remote Sens. Environ. 2021, 258, 112366. [Google Scholar] [CrossRef]
  7. Ma, Z.; Dey, S.; Christopher, S.; Liu, R.; Bi, J.; Balyan, P.; Liu, Y. A review of statistical methods used for developing large-scale and long-term PM2. 5 models from satellite data. Remote Sens. Environ. 2022, 269, 112827. [Google Scholar] [CrossRef]
  8. Zhang, T.; Zhang, W.; Yang, R.; Liu, Y.; Jafari, M. CO2 capture and storage monitoring based on remote sensing techniques: A review. J. Clean. Prod. 2021, 281, 124409. [Google Scholar] [CrossRef]
  9. Dagan, G.; Yeheskel, N.; Williams, A.I. Radiative forcing from aerosol–cloud interactions enhanced by large-scale circulation adjustments. Nat. Geosci. 2023, 16, 1092–1098. [Google Scholar] [CrossRef]
  10. Wei, X.; Bai, K.; Chang, N.-B.; Gao, W. Multi-source hierarchical data fusion for high-resolution AOD mapping in a forest fire event. Int. J. Appl. Earth Obs. Geoinf. 2021, 102, 102366. [Google Scholar] [CrossRef]
  11. Hauser, A.; Oesch, D.; Foppa, N.; Wunderle, S. NOAA AVHRR derived aerosol optical depth over land. J. Geophys. Res. Atmos. 2005, 110. [Google Scholar] [CrossRef]
  12. Levy, R.C.; Mattoo, S.; Munchak, L.; Remer, L.; Sayer, A.; Patadia, F.; Hsu, N. The Collection 6 MODIS aerosol products over land and ocean. Atmos. Meas. Tech. 2013, 6, 2989–3034. [Google Scholar] [CrossRef]
  13. Kahn, R.A.; Nelson, D.L.; Garay, M.J.; Levy, R.C.; Bull, M.A.; Diner, D.J.; Martonchik, J.V.; Paradise, S.R.; Hansen, E.G.; Remer, L.A. MISR aerosol product attributes and statistical comparisons with MODIS. IEEE Trans. Geosci. Remote Sens. 2009, 47, 4095–4114. [Google Scholar] [CrossRef]
  14. Jackson, J.M.; Liu, H.; Laszlo, I.; Kondragunta, S.; Remer, L.A.; Huang, J.; Huang, H.C. Suomi-NPP VIIRS aerosol algorithms and data products. J. Geophys. Res. Atmos. 2013, 118, 12673–12689. [Google Scholar] [CrossRef]
  15. Yang, L.; Ji, W.; Pei, X.; Si, Y.; Liu, H.; Chen, S.; Zhang, C.; Cheng, X.; Lu, X.; Wang, H. Global evaluation of Fengyun-3 MERSI dark target aerosol retrievals over land. Int. J. Digit. Earth 2024, 17, 1–24. [Google Scholar] [CrossRef]
  16. Pei, X.; Yang, L.; Ji, W.; Chen, S.; Cheng, X.; Lu, X.; Wang, H. Applying the Dark Target Aerosol Algorithm to MERSI-II: Retrieval and Validation of Aerosol Optical Depth over the Ocean. Adv. Atmos. Sci. 2024, 41, 2446–2463. [Google Scholar] [CrossRef]
  17. Gayen, B.K.; Acharya, P.; Dutta, D.; Sreekesh, S. Estimation of high-resolution aerosol optical depth (AOD) from Landsat and Sentinel images using SEMARA model over selected locations in South Asia. Atmos. Res. 2024, 298, 107141. [Google Scholar] [CrossRef]
  18. Lin, H.; Li, S.; Xing, J.; He, T.; Yang, J.; Wang, Q. High resolution aerosol optical depth retrieval over urban areas from Landsat-8 OLI images. Atmos. Environ. 2021, 261, 118591. [Google Scholar] [CrossRef]
  19. Dong, J.; Zhang, T.; Wang, L.; Li, Z.; Wong, M.S.; Bilal, M.; Zhu, Z.; Mao, F.; Xia, X.; Han, G. First retrieval of daily 160 m aerosol optical depth over urban areas using Gaofen-1/6 synergistic observations: Algorithm development and validation. ISPRS J. Photogramm. Remote Sens. 2024, 211, 372–391. [Google Scholar] [CrossRef]
  20. Levy, R.C.; Remer, L.A.; Mattoo, S.; Vermote, E.F.; Kaufman, Y.J. Second-generation operational algorithm: Retrieval of aerosol properties over land from inversion of Moderate Resolution Imaging Spectroradiometer spectral reflectance. J. Geophys. Res. Atmos. 2007, 112. [Google Scholar] [CrossRef]
  21. Hsu, N.; Jeong, M.J.; Bettenhausen, C.; Sayer, A.M.; Hansell, R.; Seftor, C.; Huang, J.; Tsay, S.C. Enhanced Deep Blue aerosol retrieval algorithm: The second generation. J. Geophys. Res. Atmos. 2013, 118, 9296–9315. [Google Scholar] [CrossRef]
  22. Martonchik, J.V.; Kahn, R.A.; Diner, D.J. Retrieval of aerosol properties over land using MISR observations. In Satellite Aerosol Remote Sensing over Land; Springer: Berlin/Heidelberg, Germany, 2009; pp. 267–293. [Google Scholar]
  23. Taskinen, H.; Väisänen, A.; Hatakka, L.; Virtanen, T.H.; Lähivaara, T.; Arola, A.; Kolehmainen, V.; Lipponen, A. High-Resolution Post-Process Corrected Satellite AOD. Geophys. Res. Lett. 2022, 49, e2022GL099733. [Google Scholar] [CrossRef]
  24. Lipponen, A.; Reinvall, J.; Väisänen, A.; Taskinen, H.; Lähivaara, T.; Sogacheva, L.; Kolmonen, P.; Lehtinen, K.; Arola, A.; Kolehmainen, V. Deep-learning-based post-process correction of the aerosol parameters in the high-resolution Sentinel-3 Level-2 Synergy product. Atmos. Meas. Tech. 2022, 15, 895–914. [Google Scholar] [CrossRef]
  25. Remer, L.A.; Levy, R.C.; Martins, J.V. Opinion: Aerosol remote sensing over the next 20 years. Atmos. Chem. Phys. 2024, 24, 2113–2127. [Google Scholar] [CrossRef]
  26. Chen, X.; de Leeuw, G.; Arola, A.; Liu, S.; Liu, Y.; Li, Z.; Zhang, K. Joint retrieval of the aerosol fine mode fraction and optical depth using MODIS spectral reflectance over northern and eastern China: Artificial neural network method. Remote Sens. Environ. 2020, 249, 112006. [Google Scholar] [CrossRef]
  27. She, L.; Zhang, H.K.; Bu, Z.; Shi, Y.; Yang, L.; Zhao, J. A deep-neural-network-based aerosol optical depth (AOD) retrieval from Landsat-8 Top of Atmosphere Data. Remote Sens. 2022, 14, 1411. [Google Scholar] [CrossRef]
  28. Zhang, Z.; Li, J.; Che, H.; Dong, Y.; Dubovik, O.; Eck, T.; Gupta, P.; Holben, B.; Kim, J.; Lind, E. Long-term trends in aerosol properties derived from AERONET measurements. Atmos. Chem. Phys. 2025, 25, 4617–4637. [Google Scholar] [CrossRef]
  29. Liang, L.; Daniels, J.; Biancardi, M.; Zhou, Y. Reconstructing aerosol optical depth using spatiotemporal Long Short-Term Memory convolutional autoencoder. Sci. Data 2023, 10, 842. [Google Scholar] [CrossRef]
  30. Shi, C.; Hashimoto, M.; Shiomi, K.; Nakajima, T. Development of an algorithm to retrieve aerosol optical properties over water using an artificial neural network radiative transfer scheme: First result from GOSAT-2/CAI-2. IEEE Trans. Geosci. Remote Sens. 2020, 59, 9861–9872. [Google Scholar] [CrossRef]
  31. Jia, C.; Sun, L.; Chen, Y.; Liu, Q.; Yu, H.; Zhang, W. Satellite aerosol retrieval using scene simulation and deep belief network. IEEE Trans. Geosci. Remote Sens. 2021, 60, 4104516. [Google Scholar] [CrossRef]
  32. Tao, M.; Chen, J.; Xu, X.; Man, W.; Xu, L.; Wang, L.; Wang, Y.; Wang, J.; Fan, M.; Shahzad, M.I. A robust and flexible satellite aerosol retrieval algorithm for multi-angle polarimetric measurements with physics-informed deep learning method. Remote Sens. Environ. 2023, 297, 113763. [Google Scholar] [CrossRef]
  33. Man, W.; Tao, M.; Xu, L.; Xu, X.; Jiang, J.; Wang, J.; Wang, L.; Wang, Y.; Fan, M.; Chen, L. Improving aerosol retrieval from MISR with a physics-informed deep learning method. IEEE Trans. Geosci. Remote Sens. 2024, 62, 4102911. [Google Scholar] [CrossRef]
  34. Holben, B.N.; Eck, T.F.; Slutsker, I.a.; Tanre, D.; Buis, J.; Setzer, A.; Vermote, E.; Reagan, J.A.; Kaufman, Y.; Nakajima, T. AERONET—A federated instrument network and data archive for aerosol characterization. Remote Sens. Environ. 1998, 66, 1–16. [Google Scholar] [CrossRef]
  35. Chen, A.; Zhao, C.; Shen, L.; Fan, T. Influence of aerosol properties and surface albedo on radiative forcing efficiency of key aerosol types using global AERONET data. Atmos. Res. 2023, 282, 106519. [Google Scholar] [CrossRef]
  36. Wei, J.; Wang, Z.; Li, Z.; Li, Z.; Pang, S.; Xi, X.; Cribb, M.; Sun, L. Global aerosol retrieval over land from Landsat imagery integrating Transformer and Google Earth Engine. Remote Sens. Environ. 2024, 315, 114404. [Google Scholar] [CrossRef]
  37. Skakun, S.; Vermote, E.F.; Roger, J.-C.; Justice, C.O.; Masek, J.G. Validation of the LaSRC cloud detection algorithm for Landsat 8 images. IEEE J. Sel. Top. Appl. Earth Obs. Remote Sens. 2019, 12, 2439–2446. [Google Scholar] [CrossRef]
  38. Zhang, X.; Zhao, T.; Xu, H.; Liu, W.; Wang, J.; Chen, X.; Liu, L. GLC_FCS30D: The first global 30-m land-cover dynamic monitoring product with a fine classification system from 1985 to 2022 using dense time-series Landsat imagery and continuous change-detection method. Earth Syst. Sci. Data Discuss. 2023, 2023, 1–32. [Google Scholar] [CrossRef]
  39. Rodriguez, E.; Morris, C.S.; Belz, J.E. A global assessment of the SRTM performance. Photogramm. Eng. Remote Sens. 2006, 72, 249–260. [Google Scholar] [CrossRef]
  40. Kotchenova, S.Y.; Vermote, E.F.; Levy, R.; Lyapustin, A. Radiative transfer codes for atmospheric correction and aerosol retrieval: Intercomparison study. Appl. Opt. 2008, 47, 2215–2226. [Google Scholar] [CrossRef]
  41. Kim, M.; Kim, J.; Wong, M.S.; Yoon, J.; Lee, J.; Wu, D.; Chan, P.; Nichol, J.E.; Chung, C.-Y.; Ou, M.-L. Improvement of aerosol optical depth retrieval over Hong Kong from a geostationary meteorological satellite using critical reflectance with background optical depth correction. Remote Sens. Environ. 2014, 142, 176–187. [Google Scholar] [CrossRef]
  42. Wei, J.; Huang, B.; Sun, L.; Zhang, Z.; Wang, L.; Bilal, M. A simple and universal aerosol retrieval algorithm for Landsat series images over complex surfaces. J. Geophys. Res. Atmos. 2017, 122, 13338–13355. [Google Scholar] [CrossRef]
  43. Yang, Y.; Yang, K.; Chen, Y. Aerosol retrieval algorithm for Sentinel-2 images over complex urban areas. IEEE Trans. Geosci. Remote Sens. 2022, 60, 4107509. [Google Scholar] [CrossRef]
  44. Jia, C.; Sun, L.; Chen, Y.; Wang, W.; Wang, Y. Inversion of aerosol optical depth for Landsat 8 OLI data using deep belief network. Natl. Remote Sens. Bull. 2020, 24, 1180–1192. [Google Scholar]
  45. He, F.; Liu, T.; Tao, D. Why resnet works? residuals generalize. IEEE Trans. Neural Netw. Learn. Syst. 2020, 31, 5349–5362. [Google Scholar] [CrossRef]
  46. Ghosh, A.; Kumar, H.; Sastry, P.S. Robust loss functions under label noise for deep neural networks. In Proceedings of the AAAI Conference on Artificial Intelligence, San Francisco, CA, USA, 4–9 February 2017. [Google Scholar]
  47. She, L.; Zhang, H.K.; Li, Z.; de Leeuw, G.; Huang, B. Himawari-8 aerosol optical depth (AOD) retrieval using a deep neural network trained using AERONET observations. Remote Sens. 2020, 12, 4125. [Google Scholar] [CrossRef]
  48. Lyapustin, A.; Wang, Y.; Korkin, S.; Huang, D. MODIS collection 6 MAIAC algorithm. Atmos. Meas. Tech. 2018, 11, 5741–5765. [Google Scholar] [CrossRef]
  49. Lyapustin, A.; Wang, Y.; Laszlo, I.; Kahn, R.; Korkin, S.; Remer, L.; Levy, R.; Reid, J. Multiangle implementation of atmospheric correction (MAIAC): 2. Aerosol algorithm. J. Geophys. Res. Atmos. 2011, 116. [Google Scholar] [CrossRef]
  50. Si, Y.; Chen, L.; Wang, Y.; Xu, N.; Zhang, X.; Yang, L.; Hu, X.; Shi, S. An Improved Aerosol Retrieval Algorithm Based on Nonlinear Surface Model From FY-3D/MERSI-II Remote Sensing Data. IEEE Trans. Geosci. Remote Sens. 2024, 62, 4103017. [Google Scholar] [CrossRef]
  51. Zhao, D.; Feng, L.; Sun, K. Development of a practical atmospheric correction algorithm for inland and nearshore coastal waters. IEEE Trans. Geosci. Remote Sens. 2021, 60, 5402515. [Google Scholar] [CrossRef]
  52. Yang, Y.; Chen, Y.; Yang, K.; Cermak, J.; Chen, Y. High-resolution aerosol retrieval over urban areas using sentinel-2 data. Atmos. Res. 2021, 264, 105829. [Google Scholar] [CrossRef]
Figure 1. AERONET sites in Beijing and Xianghe from 2018 to 2023.
Remotesensing 17 03606 g001
Figure 2. Simulated variations in TOA radiance with AOD under different SR conditions. The aerosol type is the Continental Model. Observation geometry is fixed at SZ = 30°, VZ = 5°, and RA = 75°. SR values are: (a) 0.05, (b) 0.10, (c) 0.15, and (d) 0.20.
Remotesensing 17 03606 g002
Figure 3. Flowchart of the PT-DNN algorithm.
Remotesensing 17 03606 g003
Figure 4. Monthly SR dataset and variation in SR median values across different land cover types.
Remotesensing 17 03606 g004
Figure 5. Network architecture of the PT-DNN model.
Remotesensing 17 03606 g005
Figure 6. Error variation curves and scatterplots of prediction results on the testing set for different models. Panels (a,b) correspond to the data-driven model, while panels (c,d) correspond to the PT-DNN model. The dashed line represents the EE envelope of ±(0.05 + 20%), and the solid line denotes the 1:1 reference line.
Remotesensing 17 03606 g006
Figure 7. Scatterplots of PT-DNN retrievals (red points) and MCD19A2 products (black points) against AERONET observations.
Remotesensing 17 03606 g007
Figure 8. Landsat 8 OLI true-color images (a,d), MCD19A2 products (b,e), and PT-DNN retrievals (c,f) for 5 November 2019 and 31 December 2022, respectively.
Remotesensing 17 03606 g008
Figure 9. (a) Landsat 8 OLI true-color image and (b) AOD retrievals on 20 October 2019. Panels (cf) show magnified views of the red-boxed regions in (a), and panels (gj) present the corresponding AOD retrievals.
Remotesensing 17 03606 g009
Table 1. Parameter configuration of the LUTs.
VariablesValues
Atmosphere ModelMidlatitude Summer, Midlatitude Winter
Aerosol ModelContinental Model
Center Wavelength (nm)443, 480, 560, 655, 865, 1610, 2200
SZ (°)0, 12, 24, 36, 48, 60, 72
VZ (°)0, 1, 2, 3, 4, 5, 6, 7, 8, 9, 10
RA (°)0, 12, 24, 36, 48, 60, 72, 84, 96, 108, 120,
132, 144, 156, 168
AOD in LUT 10.001, 0.01, 0.02, 0.03, 0.04, 0.05, 0.06, 0.07,
0.08, 0.09, 0.1
AOD in LUT 20.001, 0.1, 0.2, 0.3, 0.4, 0.5, 0.6, 0.7, 0.8, 0.9, 1.0,
1.2, 1.4, 1.6, 1.8, 2.0
Table 2. Parameter configurations and output dimensions of each layer in the model. Convolutional layer parameters are denoted as (input channels, output channels, kernel size, stride, padding). Average pooling layer parameters are denoted as (input channels, output channels, pooling window size, stride, padding). Fully connected layer parameters are denoted as (input dimension, output dimension).
ModuleBranchLayerParameterOutput Size
Feature ExtractionCNNConv110, 64, 3 × 3, 1, 15 × 5, 64
Conv264, 64, 3 × 3, 1, 1
Conv310, 64, 1 × 1, 1, 1
Conv464, 128, 3 × 3, 2, 13 × 3, 128
Conv5128, 128, 3 × 3, 1, 1
Conv664, 128, 1 × 1, 2, 1
Avg Pooling128, 128, 3 × 3, 1, 1128
BPNNFC18, 1616
FC216, 3232
Regression-Concatenate-160
FC3160, 6464
FC464, 11
Table 3. R2 values for daily mean AOD measurements from five AERONET sites.
R2BeijingBeijing-CAMSBeijing_PKUBeijing_RADIXiangHe
Beijing1.000.970.960.940.73
Beijing-CAMS-1.000.980.960.74
Beijing_PKU--1.000.950.74
Beijing_RADI---1.000.72
XiangHe----1.00
Disclaimer/Publisher’s Note: The statements, opinions and data contained in all publications are solely those of the individual author(s) and contributor(s) and not of MDPI and/or the editor(s). MDPI and/or the editor(s) disclaim responsibility for any injury to people or property resulting from any ideas, methods, instructions or products referred to in the content.